A Comprehensive Guide to DNA Methylation Data Analysis from Bisulfite Sequencing
This article provides a complete workflow for analyzing DNA methylation data from bisulfite sequencing, tailored for researchers and drug development professionals.
A Comprehensive Guide to DNA Methylation Data Analysis from Bisulfite Sequencing
Abstract
This article provides a complete workflow for analyzing DNA methylation data from bisulfite sequencing, tailored for researchers and drug development professionals. It covers foundational concepts, step-by-step methodologies using established bioinformatics tools, solutions to common experimental and computational challenges, and strategies for validating results against other platforms. The guide also explores the integration of machine learning for advanced analysis and the application of these techniques in clinical and biomedical research for disease diagnostics and biomarker discovery.
Understanding Bisulfite Sequencing: Core Principles and Experimental Design
DNA methylation, the process by which methyl groups are added to cytosine bases, predominantly at CpG dinucleotides, is a fundamental epigenetic mechanism regulating gene expression, genomic imprinting, and cellular differentiation [1] [2]. Bisulfite conversion has revolutionized the field of epigenetics since its introduction by Frommer et al. in 1992, providing researchers with a powerful method to distinguish methylated from unmethylated cytosines at single-nucleotide resolution [3] [4] [5]. This technique serves as the foundational principle for a family of bisulfite-based sequencing methods that have become gold standards in DNA methylation analysis, enabling precise mapping of methylation patterns across genomes, specific regions, or single cells [6] [2] [5]. The robustness and reliability of bisulfite conversion have made it an indispensable tool for researchers investigating epigenetic mechanisms in development, disease, and drug discovery.
The Fundamental Chemical Principle of Bisulfite Conversion
Core Reaction Mechanism
The bisulfite conversion principle relies on the differential chemical reactivity of methylated versus unmethylated cytosines when treated with sodium bisulfite. This treatment induces sulfonation at the C5-C6 double bond of unmethylated cytosine, leading to the formation of a cytosine-bisulfite adduct. This intermediate then undergoes hydrolytic deamination, converting it to a uracil-bisulfite adduct. Finally, through an alkaline desulfonation step, uracil is produced [7] [4] [2]. In subsequent PCR amplification, uracil is replicated as thymine, resulting in a C→T transition in the final sequence data [4] [5].
Critically, 5-methylcytosine (5-mC) is protected from this conversion process due to the presence of the methyl group at the C5 position, which sterically hinders the sulfonation reaction [7] [4]. Consequently, methylated cytosines remain as cytosines throughout the treatment and amplification process, creating detectable sequence differences between methylated and unmethylated positions when compared to a reference genome [4] [2].
Visualizing the Bisulfite Conversion Workflow
The following diagram illustrates the complete experimental workflow for bisulfite sequencing, from sample preparation through data analysis:
Key Chemical Considerations
The efficiency of bisulfite conversion depends on several critical parameters. Reaction time, temperature, pH, and bisulfite concentration must be carefully controlled to maximize conversion while minimizing DNA degradation [7] [3]. Under optimal conditions, commercial bisulfite conversion kits can achieve >99% conversion efficiency for unmethylated cytosines while recovering >90% of input DNA [8]. However, incomplete conversion can lead to false positives (interpreting unconverted unmethylated cytosines as methylated), while excessive degradation can reduce library complexity and coverage [7] [5].
It is important to note that conventional bisulfite conversion cannot distinguish between 5-methylcytosine (5-mC) and 5-hydroxymethylcytosine (5-hmC), as both modifications protect cytosines from conversion [4] [5]. To address this limitation, specialized methods like oxidative bisulfite sequencing (oxBS-Seq) have been developed, which selectively oxidize 5-hmC to 5-formylcytosine (5-fC), which is then converted to uracil during bisulfite treatment [2] [5].
Experimental Protocols for Bisulfite Conversion
Standard Bisulfite Conversion Protocol
The following protocol, adapted from current laboratory practices and commercially available kits, provides a robust method for bisulfite conversion of genomic DNA [3] [8]:
DNA Preparation: Begin with 100-500 ng of high-quality genomic DNA in TE buffer or deionized water. DNA should be free of contaminants, and samples with degraded DNA (e.g., from FFPE tissue) may require protocol modifications [2].
Denaturation: Add 3 M NaOH to a final concentration of 0.3 M and incubate at 37°C for 15 minutes or at 99°C for 5-10 minutes. This step denatures double-stranded DNA, making cytosines accessible for bisulfite conversion [3].
Bisulfite Treatment: Add freshly prepared sodium bisulfite solution (pH 5.0) to a final concentration of 3.1-3.9 M, along with a radical scavenger such as hydroquinone (final concentration 0.5-1.0 mM). Layer mineral oil over the reaction to prevent evaporation and incubate in the dark at 50-55°C for 12-16 hours [3].
Desalting and Purification: Use commercial DNA clean-up systems (e.g., Wizard DNA Clean-Up System) to remove bisulfite salts. This typically involves binding DNA to a resin or column, washing with appropriate buffers, and eluting in water or TE buffer [3].
Desulfonation: Add NaOH to a final concentration of 0.3 M and incubate at 37°C for 15 minutes to complete the conversion of uracil-sulfonate adducts to uracil [3].
Neutralization and Precipitation: Add ammonium acetate (pH 7.0) to a final concentration of 2.5 M, along with 2-2.5 volumes of ethanol and optional isopropanol (to 20-30% final concentration). Precipitate at -20°C for 2-4 hours, then centrifuge at maximum speed for 10 minutes [3].
Wash and Resuspension: Wash the DNA pellet with 70% ethanol, air-dry for 10 minutes, and resuspend in TE buffer or deionized water. Store converted DNA at -20°C or proceed immediately to downstream applications [3].
Commercial Bisulfite Conversion Kits
Multiple commercial kits are available that streamline the bisulfite conversion process, offering improved efficiency and reduced hands-on time. The table below compares several prominent options:
Table 1: Comparison of Commercial Bisulfite Conversion Kits
| Kit Name | Denaturation Method | Conversion Temperature | Incubation Time | Special Features |
|---|---|---|---|---|
| Zymo EZ DNA Methylation Lightning Kit | Heat-based (99°C) or Alkaline-based (37°C) | 65°C | 90 minutes | Rapid protocol; >99% conversion efficiency [7] |
| EpiTect Bisulfite Kit (Qiagen) | Heat-based (99°C) | 55°C | 10 hours | Standard protocol; widely cited [7] [3] |
| EZ DNA Methylation Kit (Zymo Research) | Alkaline-based (37°C) | 50°C | 12-16 hours | Overnight protocol [7] |
| Imprint DNA Modification Kit (Sigma-Aldrich) | Proprietary | Proprietary | <2 hours | High sensitivity (works with 50 pg DNA); >99% conversion; >90% recovery [8] |
Quality Control Considerations
Rigorous quality control is essential for successful bisulfite conversion experiments. Key QC measures include:
Conversion Efficiency Testing: Assess conversion efficiency by including unmethylated control DNA (e.g., lambda phage DNA) or by testing conversion of non-CpG cytosines in the target genome, which should be nearly completely converted in mammalian DNA [2]. Conversion efficiency should exceed 99% for accurate results [8].
DNA Quality Assessment: Evaluate DNA integrity before and after conversion using agarose gel electrophoresis or bioanalyzer profiles. Significant degradation may indicate overly harsh conversion conditions [7].
Yield Quantification: Precisely quantify DNA before and after conversion using fluorometric methods. Typical recovery rates range from 50-90% depending on the specific protocol and kit used [8].
Control Reactions: Include fully methylated and fully unmethylated control DNA samples to verify that the conversion process correctly identifies each state [2].
Bisulfite Sequencing Methods and Applications
The fundamental bisulfite conversion principle has been adapted into several specialized sequencing methods tailored to different research needs and budgets. The following diagram illustrates the relationships between these main bisulfite sequencing methods:
Comparative Analysis of Bisulfite Sequencing Methods
Each bisulfite sequencing method offers distinct advantages and limitations. The table below provides a detailed comparison to guide method selection:
Table 2: Comparison of Major Bisulfite Sequencing Methods
| Method | Resolution | Coverage | Cost | Key Applications | Advantages | Limitations |
|---|---|---|---|---|---|---|
| Whole Genome Bisulfite Sequencing (WGBS) | Single-base | Genome-wide | High | Reference methylomes, novel DMR discovery [7] [5] | Comprehensive coverage; unbiased detection [7] | High cost; computational intensive [5] |
| Reduced Representation Bisulfite Sequencing (RRBS) | Single-base | CpG-rich regions (~10-15% of CpGs) [5] | Moderate | Large cohort studies, cancer methylation [2] [5] | Cost-effective; focuses on informative regions [2] | Limited to restriction enzyme sites; misses non-CpG methylation [5] |
| Targeted Bisulfite Sequencing | Single-base | Specific regions of interest | Low to Moderate | Validation studies, clinical marker screening [2] | High depth on targets; cost-effective for focused questions [2] | Requires prior knowledge; limited discovery potential |
| Single-Cell BS-Seq | Single-base | Genome-wide (with gaps) | High | Cellular heterogeneity, embryonic development [5] | Reveals cell-to-cell variation [5] | Incomplete coverage; technical noise; high cost |
| Oxidative BS-Seq | Single-base | Depends on base method | Very High | Distinguishing 5mC from 5hmC [2] [5] | Specific 5mC detection [5] | Complex protocol; requires specialized expertise |
Essential Research Reagents and Solutions
Successful bisulfite sequencing experiments require carefully selected reagents and materials. The following table outlines key solutions and their functions:
Table 3: Essential Research Reagents for Bisulfite Sequencing
| Reagent/Solution | Composition/Example | Function in Workflow | Technical Notes |
|---|---|---|---|
| Sodium Bisulfite Solution | 3-5 M sodium bisulfite (pH 5.0-5.2) | Converts unmethylated C to U | Must be freshly prepared; light-sensitive; often includes hydroquinone [3] |
| DNA Denaturation Solution | 3-5 M NaOH | Denatures dsDNA to ssDNA | Critical for complete conversion; concentration affects DNA integrity [3] |
| Desulfonation Solution | 3-5 M NaOH | Removes sulfonate group after conversion | Completes conversion to uracil [3] [8] |
| DNA Binding Buffers | High-salt binding buffers (commercial kits) | DNA purification after conversion | Specific salt concentrations optimize recovery [3] |
| Bisulfite-PCR Primers | 26-30 bp; avoid CpG sites or use degenerate bases | Amplifies converted DNA | Longer than standard primers; AT-rich designs [2] |
| High-Fidelity Hot-Start Polymerases | Specialized polymerases (e.g., EpiGrown) | Amplifies bisulfite-converted DNA | Reduced error rate; handles uracil-containing templates [2] |
| Methylated/Unmethylated Control DNA | Commercially available standards | Quality control for conversion efficiency | Verifies complete conversion and specificity [2] |
Data Analysis and Bioinformatics Considerations
Essential Bioinformatics Workflow
Following bisulfite sequencing, data analysis follows a multi-step process to extract accurate methylation information:
Quality Control and Preprocessing: Assess raw read quality using tools like FastQC, then trim adapters and low-quality bases [6] [2]. Verify bisulfite conversion efficiency by examining C→T conversion rates in non-CpG contexts (should be >99%) [2].
Alignment to Reference Genome: Map bisulfite-treated reads to a reference genome using specialized aligners (e.g., BSMAP, Bismark, or SOAP) that account for C→T conversions [7] [6]. These tools typically perform three-letter alignment to address the reduced sequence complexity after conversion [7].
Methylation Calling: Extract methylation information at each cytosine position by counting reads supporting converted (T) versus unconverted (C) bases [7] [6]. Calculate methylation percentage as: [C reads / (C reads + T reads)] × 100% [7].
Differential Methylation Analysis: Identify differentially methylated regions (DMRs) or positions (DMPs) between sample groups using statistical tools like methylKit, DSS, or BiSeq [6].
Biological Interpretation: Annotate DMRs with genomic features (promoters, enhancers, gene bodies), perform pathway enrichment analysis, and integrate with other omics data where available [7] [6].
Addressing Technical Challenges in Data Analysis
Bisulfite sequencing data presents several unique analytical challenges that researchers must address:
Reduced Sequence Complexity: The C→T conversion reduces sequence complexity, complicating alignment and potentially increasing ambiguous mappings [5]. specialized bisulfite-aware aligners that use three-letter alignments (converting all C's to T's in both reads and reference) are essential [6].
DNA Degradation Effects: Bisulfite treatment causes DNA fragmentation, leading to potential coverage biases, particularly in regions with low conversion efficiency [7]. These effects can be mitigated by including quality controls and using analysis tools that account for coverage differences [2].
Bisulfite Conversion artifacts: Incomplete conversion can lead to false methylation calls, while over-conversion can potentially damage methylated cytosines [7]. Including spike-in controls with known methylation status helps monitor and correct for these artifacts [2].
Distinguishing Genetic Variants from Epigenetic Signals: Single nucleotide polymorphisms (C/T variants) can be misinterpreted as methylation differences [5]. Integrating genetic variant information from untreated controls or matched whole-genome sequencing data helps distinguish true methylation signals [6].
Bisulfite conversion remains the gold standard principle for differentiating methylated from unmethylated cytosines in epigenetic research. Its robust chemical basis, combined with continuous methodological refinements, has enabled a family of powerful sequencing approaches that provide unprecedented insights into DNA methylation patterns across biological systems. As sequencing technologies continue to advance and analytical methods become more sophisticated, bisulfite-based methods will continue to be essential tools for understanding epigenetic regulation in development, disease, and therapeutic intervention.
DNA methylation, the process of adding a methyl group to the fifth carbon of a cytosine ring, represents one of the most crucial epigenetic mechanisms for regulating gene expression without altering the underlying DNA sequence [3] [9]. In mammals, this modification predominantly occurs at cytosine bases within cytosine-guanine (CpG) dinucleotides and plays fundamental roles in embryonic development, genomic imprinting, X-chromosome inactivation, cellular differentiation, and disease progression [3] [10] [11]. Aberrant DNA methylation patterns are frequently associated with loss of DNA homeostasis and genomic instability, leading to human diseases such as cancer [3]. The importance of DNA methylation in biological processes and disease has created an urgent demand for precise and efficient methods to map methylation patterns across genomes [3].
Bisulfite genomic sequencing, developed by Frommer and colleagues, revolutionized DNA methylation analysis by leveraging the differential reactivity of methylated and unmethylated cytosines with sodium bisulfite [3]. This treatment converts unmethylated cytosines to uracil, which are subsequently amplified as thymine during PCR, while methylated cytosines remain unchanged and are amplified as cytosines [7] [11]. This chemical conversion enables researchers to distinguish methylated from unmethylated cytosines, providing a powerful foundation for methylation analysis. Two principal high-throughput sequencing methods have emerged based on this principle: Whole-Genome Bisulfite Sequencing (WGBS) and Reduced Representation Bisulfite Sequencing (RRBS). These approaches offer complementary strengths in coverage, resolution, and cost, making them suitable for different research applications and experimental designs [12] [13].
Technical Principles and Methodologies
Whole-Genome Bisulfite Sequencing (WGBS)
WGBS is widely considered the "gold standard" for DNA methylation analysis as it provides single-base resolution methylation measurements across the entire genome [7] [14]. The method involves subjecting the entire genome to bisulfite conversion without prior enrichment or reduction, followed by high-throughput sequencing and alignment to a reference genome [12] [7]. This comprehensive approach maximizes the acquisition of full-genome methylation information, enabling detection of approximately 28 million CpG sites in humans, representing >95% of all CpGs in the genome [9].
The fundamental workflow of WGBS begins with DNA extraction from biological samples, requiring 1-5 μg of high-quality genomic DNA with optimal purity (OD260/280 of 1.8-2.0) [7]. The extracted DNA then undergoes bisulfite conversion using commercially available kits such as the Zymo EZ DNA Methylation Lightning Kit, EpiTect Bisulfite Kit (Qiagen), or EZ DNA Methylation Kit (Zymo Research), which vary in denaturation methods (heat-based or alkaline-based), conversion temperatures (50-65°C), and incubation times (90 minutes to 16 hours) [7]. Following conversion, libraries are prepared using kits such as the EpiGnome Methyl-Seq Kit (Epicentre), where bisulfite-treated single-stranded DNA is random-primed using a polymerase capable of reading uracil nucleotides, then tagged with specific sequence adapters at both ends [7]. Finally, the libraries are sequenced using platforms such as Illumina HiSeq or NovaSeq, typically employing paired-end 150 bp strategies to sequence 250-300 bp insert libraries [7].
Despite its comprehensive coverage, WGBS presents challenges including substantial DNA degradation during bisulfite treatment (up to 90% of input DNA) [14], high sequencing costs ($500-1000 per sample) [9], and large data files (10-30 GB per sample) [9]. Additionally, the method is susceptible to sequencing biases primarily triggered by bisulfite conversion itself, with PCR amplification building upon these underlying artifacts [14]. Amplification-free library preparation approaches have been identified as the least biased method for WGBS, though they require higher DNA input [14].
Reduced Representation Bisulfite Sequencing (RRBS)
RRBS is a targeted DNA methylation profiling technique that combines bisulfite treatment with enzymatic digestion to enrich for CpG-rich regions, providing a cost-effective alternative to WGBS for focused studies [12] [13]. This method employs methylation-sensitive restriction endonucleases (typically MspI) to enzymatically cleave genomic DNA at specific CpG sites, followed by size selection to enrich fragments containing promoters, CpG islands, and gene bodies [12] [9]. These fragments then undergo bisulfite conversion and sequencing, enabling focused analysis of functionally relevant genomic regions with high biological significance [13].
The RRBS workflow initiates with MspI digestion of input genomic DNA (as little as 10 ng), which cuts DNA at CCGG sites regardless of methylation status, generating fragments with CpG-rich ends [13]. Following digestion, adapter ligation is performed, and fragments are size-selected (typically targeting 40-220 bp fragments) to enrich for CpG-rich regions [9] [13]. The size-selected fragments then undergo bisulfite conversion using protocols similar to WGBS, followed by PCR amplification with indexed primers and sequencing [13]. This targeted approach covers approximately 1-4 million CpGs (5-10% of all CpGs) in the human genome, with particularly strong coverage of CpG islands (≥70%), promoters (≥70%), and gene bodies (≥70%), and around 35% of enhancers [13].
RRBS significantly reduces sequencing requirements compared to WGBS, needing only 10-20% of the sequencing reads to achieve comparable data quality for CpG-rich regions [13]. This efficiency makes RRBS substantially more cost-effective ($200-400 per sample) [9] and generates smaller data files (2-5 GB per sample) [9], facilitating larger-scale studies. However, RRBS has limitations including enzyme bias, incomplete genome coverage (approximately 15% of the entire methylome) [13], inability to distinguish between 5-methylcytosine and 5-hydroxymethylcytosine [13], and reduced effectiveness for species with low CpG density due to reliance on specific enzymatic digestion [13].
Comparative Analysis: WGBS versus RRBS
Performance Characteristics and Technical Specifications
Table 1: Direct comparison of key performance metrics between WGBS and RRBS
| Feature | WGBS | RRBS |
|---|---|---|
| Coverage | ~28 million CpGs (human) [9] | 1-4 million CpGs [9] |
| Genome Coverage | >95% of CpGs [9] | 5-10% of CpGs [9] |
| Resolution | Single-base resolution [12] [7] | Single-base resolution [12] |
| Input DNA Required | 1-5 μg [7] [9] | 10 ng - 1 μg [9] [13] |
| Cost per Sample | High ($500-1000) [9] | Medium ($200-400) [9] |
| Data Size per Sample | 10-30 GB [9] | 2-5 GB [9] |
| CpG Island Coverage | >95% [9] | ≥70% [13] |
| Promoter Coverage | >95% [9] | ≥70% [13] |
| Best Use Cases | Comprehensive methylome mapping, novel region discovery [9] | Focused studies, large-scale screening, limited samples [9] [13] |
The two methods exhibit distinct preferences for genomic regions based on CpG density, which significantly influences their application for specific research questions. WGBS provides relatively uniform coverage across all genomic regions regardless of CpG density, enabling detection of methylation patterns in CpG deserts, shores, shelves, and islands with similar efficiency [12]. Analysis of WGBS data across various species reveals detection of differentially methylated regions (DMRs) across the full spectrum of CpG densities, with subtle variations showing propensity toward higher CpG densities (2-5 CpG/100bp and >10 CpG/100bp) [12]. Regions with extremely low CpG density (1 CpG/100bp) are the least detected in WGBS datasets, though still substantially better than in RRBS [12].
In contrast, RRBS specifically enriches for CpG-dense regions, with analysis showing a distinct preference for higher CpG densities (>10 CpG/100bp) [12]. The enzymatic digestion with MspI selectively targets regions with high GC density, resulting in preferential coverage of CpG islands, promoters, and gene bodies [12] [13]. This targeted approach makes RRBS particularly powerful for studies focusing on regulatory regions known to be rich in CpG content but limits its utility for investigating methylation patterns in intergenic regions, CpG-poor promoters, or other genomic areas with low CpG density [13].
Table 2: Analysis of regional biases and preferences in WGBS and RRBS
| Genomic Region | WGBS Coverage | RRBS Coverage |
|---|---|---|
| CpG Islands | >95% [9] | ≥70% [13] |
| Promoters | >95% [9] | ≥70% [13] |
| Gene Bodies | >95% [9] | ≥70% [13] |
| Enhancers | >95% [9] | ~35% [13] |
| Low CpG Density Regions | Comprehensive coverage [12] | Minimal coverage [12] [13] |
| CpG Shores/Shelves | Comprehensive coverage [12] | Limited coverage [12] |
| Repetitive Elements | Variable coverage [14] | Limited coverage [13] |
Experimental Protocols and Workflows
WGBS Laboratory Protocol
The standard WGBS protocol involves multiple critical steps that require careful optimization to minimize biases and ensure high-quality data:
DNA Extraction and Quality Control
- Extract high-molecular-weight DNA using appropriate kits (e.g., Wizard Genomic DNA purification kit, Promega) [3]
- Quantify DNA using fluorometric methods (e.g., AccuBlue High Sensitivity dsDNA Quantitation Kit) to ensure accurate concentration measurements [11]
- Verify DNA quality and integrity through agarose gel electrophoresis or bioanalyzer analysis
- Required DNA characteristics: mass ≥5 μg, concentration ≥50 ng/μl, OD260/280 ratio of 1.8-2.0 [7]
Bisulfite Conversion
- Select appropriate bisulfite conversion kit based on DNA input and required conversion efficiency
- For standard protocols: Denature DNA using heat (99°C) or alkaline treatment, then incubate with sodium bisulfite solution (typically 3-4 M) containing hydroquinone (125 mM) at 50-55°C for 12-16 hours protected from light [3]
- Purify converted DNA using commercial clean-up systems (e.g., Wizard DNA clean-up system, Promega) [3]
- Desulfonate by adding NaOH (final concentration 0.3 M) and incubating at 37°C for 15 minutes [3]
- Precipitate with ammonium acetate and ethanol/isopropanol, wash with 70% ethanol, and resuspend in TE buffer or deionized water [3]
- Verify conversion efficiency (>99%) using spike-in controls or assessment of non-CpG methylation in organisms where non-CpG methylation is minimal [7] [15]
Library Preparation and Sequencing
- Prepare libraries using post-bisulfite adaptor tagging approaches (e.g., EpiGnome Methyl-Seq Kit, PBAT) to minimize DNA loss [7] [14]
- For pre-BS approaches: Fragment genomic DNA by sonication before bisulfite conversion, then ligate adapters [14]
- Amplify libraries using polymerases capable of reading uracil residues (e.g., KAPA HiFi Uracil+) to minimize amplification biases [14]
- Validate library quality and quantity using bioanalyzer and qPCR
- Sequence on appropriate platforms (Illumina NovaSeq 6000, MGI Tech DNBSEQ-T7) using paired-end 150 bp reads to achieve sufficient coverage [10] [7]
RRBS Laboratory Protocol
The RRBS protocol incorporates specific enzymatic digestion steps to achieve representation reduction:
DNA Digestion and Size Selection
- Digest 10-1000 ng genomic DNA with MspI restriction enzyme (recognition site: CCGG) [13]
- Clean up digested DNA using column-based purification or magnetic beads
- Perform size selection to enrich for fragments between 40-220 bp using gel electrophoresis or bead-based methods [9] [13]
- Quantify size-selected DNA to ensure adequate recovery
Adapter Ligation and Bisulfite Conversion
- Ligate pre-methylated adapters to size-selected fragments using T4 DNA ligase [13]
- Repair ends and fill in sticky ends if necessary using DNA polymerases
- Conduct bisulfite conversion using optimized kits (e.g., EpiTect Bisulfite Kit, Qiagen; MethylEdge Bisulfite Conversion System, Promega) [11] [13]
- Purify converted DNA and elute in small volume to maximize concentration
PCR Amplification and Sequencing
- Amplify libraries using bisulfite-converted DNA-compatible polymerases with a minimal number of cycles to maintain representation [13]
- Incorporate index sequences for sample multiplexing during PCR amplification
- Purify final libraries and validate using bioanalyzer or tape station
- Sequence on appropriate platforms with sufficient depth (typically 10-30 million reads per sample depending on genome size and coverage requirements) [9]
Bisulfite Sequencing Workflow Visualization
Diagram 1: Comparative workflow of WGBS and RRBS methodologies, highlighting shared and unique steps in bisulfite sequencing protocols.
Bioinformatics Analysis Pipelines
Data Preprocessing and Quality Control
The bioinformatics analysis of both WGBS and RRBS data shares a common framework with method-specific considerations [9]. Initial quality assessment begins with tools such as FastQC to evaluate sequencing quality, base composition, adapter contamination, and duplication levels [9] [15]. Particular attention should be paid to base composition, expecting reduced cytosine content due to bisulfite conversion, and adapter contamination, especially prominent in RRBS data due to size selection [9]. Following quality assessment, adapter trimming and quality filtering are performed using tools such as Trim Galore, which processes paired-end reads simultaneously to maintain proper pairing [9].
A critical quality metric for both methods is bisulfite conversion efficiency, which should exceed 99% to ensure accurate methylation calls [7]. Conversion efficiency can be assessed using spike-in controls of unmethylated DNA (e.g., lambda phage DNA) or through evaluation of methylation levels in genomic contexts known to be unmethylated in the studied organism, such as non-CpG contexts in mammals [15]. Additional quality metrics include sequencing depth (typically 10-30x for WGBS, higher for RRBS due to targeted nature), coverage uniformity, and duplicate rates (expected to be <30% for WGBS, potentially higher for RRBS due to size selection) [9].
Alignment and Methylation Calling
Bisulfite-treated sequences require specialized alignment approaches due to the dramatic reduction in sequence complexity resulting from C-to-T conversions [15] [16]. Standard alignment tools such as BWA or Bowtie are unsuitable because they cannot adequately handle the dissimilarity between bisulfite-converted reads and reference genomes [15]. Specialized bisulfite-aware aligners including Bismark, BatMeth2, BSMAP, BS-Seeker2, and BWA-meth employ strategies such as in silico conversion of reference genomes or three-letter alignment to accurately map converted reads [15] [16].
BatMeth2 deserves particular attention as it incorporates innovative "Reverse-alignment" and "Deep-scan" algorithms that enable sensitive alignment of reads containing insertions and deletions (indels), a common challenge in bisulfite sequencing data [16]. This capability is particularly valuable for cancer studies or population genetics where structural variations may be prevalent. Following alignment, PCR duplicates are typically removed to prevent erroneous inflation of coverage estimates and false positive errors in downstream analysis [15].
Methylation calling involves counting methylated (C) and unmethylated (T) reads at each cytosine position in the reference genome [9] [15]. The methylation level is calculated as the percentage of methylated reads: 100 × (number of C reads) / (number of C + T reads) [15]. To ensure statistical reliability, sites with low coverage (typically <5-10x) are filtered out, and methylation levels are adjusted for potential incomplete conversion or sequencing errors [15] [16]. The resulting data provides single-base resolution methylation levels across the covered genome, enabling both regional and site-specific analyses.
Differential Methylation and Advanced Analyses
Identification of differentially methylated regions (DMRs) represents a core analytical goal in most bisulfite sequencing studies [15]. Multiple computational approaches exist for DMR detection, employing different statistical frameworks including beta-binomial models (MethylSig, Metilene), local-likelihood smoothing (BSmooth), Fisher's exact tests (methylKit), and weighted Welch expansion (Defiant) [15]. The choice of method depends on study design, sample size, and biological question, with replication enabling more robust statistical testing.
Advanced analyses beyond DMR detection include:
- Methylome Segmentation: Identification of methylation states (low-methylated regions, fully methylated regions, unmethylated regions) using computational approaches such as MethylSeekR and MethPipe [15]
- Annotation Integration: Interpretation of DMRs in biological context by integrating with genome annotation databases using tools such as genomation or CHIPpeakAnno [15]
- Clustering Analysis: Identification of molecular subtypes or sample relationships using principal component analysis (PCA) or hierarchical clustering implemented in packages such as methylKit [15]
- Pathway Analysis: Functional interpretation through Gene Ontology (GO) enrichment analysis and KEGG pathway analysis using resources such as the DAVID web server [15]
Research Reagent Solutions and Tools
Table 3: Essential research reagents and computational tools for bisulfite sequencing studies
| Category | Specific Products/Tools | Application Notes |
|---|---|---|
| Bisulfite Conversion Kits | EpiTect Bisulfite Kit (Qiagen), EZ DNA Methylation Kit (Zymo Research), MethylEdge Bisulfite Conversion System (Promega) [3] [11] | Performance varies; MethylEdge recommended for bisulfite amplicon sequencing but all show high conversion rates [11] |
| Library Preparation Kits | EpiGnome Methyl-Seq Kit (Epicentre), TruSeq DNA Methylation Kit, Zymo-Seq RRBS Library Kit [7] [13] | Zymo-Seq RRBS Kit compatible with as low as 10 ng genomic DNA [13] |
| DNA Purification | Wizard Genomic DNA purification kit (Promega), AllPrep DNA/RNA Micro Kit (Qiagen) [3] [11] | Simultaneous DNA/RNA extraction recommended for expression correlation studies [11] |
| Quality Control | FastQC, MultiQC, AccuBlue High Sensitivity dsDNA Quantitation Kit (Biotium) [9] [11] | Fluorometric quantification essential for accurate DNA input measurement [11] |
| Alignment Tools | Bismark, BatMeth2, BSMAP, BS-Seeker2 [15] [16] | BatMeth2 particularly effective for indel-sensitive mapping [16] |
| DMR Detection | methylKit, BSmooth, MethylSig, Metilene, Defiant [15] | Choice depends on study design; methylKit user-friendly for diverse applications [15] |
| Visualization | Integrated BatMeth2 tools, genomation, MethylKit [15] [16] | BatMeth2 provides comprehensive visualization capabilities [16] |
Decision Framework and Concluding Recommendations
Choosing between WGBS and RRBS requires careful consideration of research objectives, resources, and sample characteristics. The following decision framework provides guidance for selecting the appropriate method:
Choose WGBS when:
- Comprehensive methylome mapping is required, including intergenic regions, repetitive elements, and areas with low CpG density [12] [9]
- Studying organisms with unknown or atypical methylation patterns
- Investigating genomic regions beyond promoters and CpG islands, such as enhancers or structural variants [12]
- Sufficient DNA input (≥1 μg) and sequencing budget are available [7] [9]
- Discovery of novel methylated regions is a primary objective [9]
Choose RRBS when:
- Research focuses on CpG-rich regions including promoters, CpG islands, and gene bodies [12] [13]
- Studying large sample cohorts where cost-effectiveness is essential [9] [13]
- DNA input is limited (as low as 10 ng) [13]
- Species with well-annotated CpG-rich regions are being investigated [13]
- Budget constraints preclude WGBS while maintaining genome-wide insights into regulatory regions [9]
For researchers working with limited sample material or requiring highest throughput, post-bisulfite adaptor tagging approaches with PCR amplification provide viable alternatives, though with potential amplification biases [14]. When ultimate comprehensiveness is required regardless of cost, WGBS remains the unequivocal gold standard [7] [14]. For focused studies prioritizing CpG-rich regulatory regions across many samples, RRBS offers an optimal balance between coverage, resolution, and cost [13].
As sequencing technologies continue to evolve and costs decrease, WGBS is becoming increasingly accessible for standard applications [14]. However, both methods will maintain important positions in the epigenomics toolkit, enabling researchers to address diverse biological questions through precise DNA methylation profiling at single-base resolution. By understanding the technical considerations, biases, and applications of each method, researchers can make informed decisions that optimize their experimental designs and maximize the biological insights gained from their bisulfite sequencing studies.
In bisulfite sequencing research, the integrity and quantity of the input DNA are the most critical factors determining the success of the entire experiment. DNA methylation analysis at single-base resolution has matured into a powerful discipline, with whole-genome bisulfite sequencing (WGBS) representing the current gold standard for comprehensive methylation assessment [17] [18]. The fundamental principle underlying all bisulfite sequencing methods is the selective chemical conversion of unmethylated cytosines to uracils, while methylated cytosines remain protected from this conversion [2] [5]. This process transforms epigenetic information into genetic information that can be decoded through subsequent amplification and sequencing. However, the harsh chemical treatment involved in bisulfite conversion poses significant challenges for DNA integrity, making careful preliminary assessment and preparation of DNA material not just beneficial but essential for generating reliable, reproducible results [2] [3]. This application note provides detailed protocols and guidelines for ensuring DNA quality and meeting input requirements specific to bisulfite sequencing methodologies.
DNA Quality Assessment: Essential Parameters and Protocols
Comprehensive Quality Metrics for Input DNA
Rigorous quality assessment of genomic DNA prior to bisulfite conversion is the first critical step in the workflow. The table below outlines the essential parameters that must be evaluated to ensure DNA is suitable for bisulfite sequencing.
Table 1: Essential DNA Quality Assessment Parameters for Bisulfite Sequencing
| Quality Parameter | Target Specification | Assessment Method | Impact on Downstream Applications |
|---|---|---|---|
| Quantity | Varies by protocol (see Section 3) | Fluorometric methods (Qubit) | Insufficient DNA leads to poor library complexity and coverage gaps |
| Purity | A260/A280: 1.8-2.0; A260/A230: >2.0 | Spectrophotometry (NanoDrop) | Contaminants inhibit bisulfite conversion and enzymatic steps |
| Integrity | DNA fragment size >10 kb (for WGBS) | Gel electrophoresis (pulse-field) | Fragmented DNA reduces complexity and mapping efficiency |
| Degradation Level | Clear high-molecular weight band | Agarose gel electrophoresis | Degraded DNA results in biased representation and 3' bias |
| Inhibitor Freedom | No PCR inhibition at 1:10 dilution | Spike-in PCR amplification | Inhibitors cause incomplete bisulfite conversion and failed libraries |
Detailed Experimental Protocol: DNA Quality Assessment
Purpose: To comprehensively evaluate the quality and quantity of genomic DNA prior to bisulfite conversion, ensuring suitability for bisulfite sequencing applications.
Materials and Reagents:
- Qubit dsDNA HS Assay Kit (or equivalent fluorometric quantification system)
- NanoDrop spectrophotometer (or equivalent)
- Agarose gel electrophoresis system
- Pulse-field gel electrophoresis system (for WGBS)
- PCR reagents for inhibitor testing
Procedure:
Fluorometric Quantification:
- Prepare Qubit working solution according to manufacturer's instructions
- Use 1-20 μL of DNA sample for assessment
- Perform measurements in triplicate to ensure accuracy
- Record concentration in ng/μL
Spectrophotometric Assessment:
- Blank instrument with the same buffer used for DNA storage
- Use 1-2 μL of DNA sample for measurement
- Record A260/A280 and A260/A230 ratios
- Note any irregularities in the spectral curve
Integrity Analysis:
- Prepare a 0.8-1.0% agarose gel with ethidium bromide or SYBR Safe
- Load 100-200 ng of DNA alongside appropriate molecular weight markers
- Run gel at 4-6 V/cm for 45-60 minutes
- Visualize under UV light; high-quality DNA should appear as a tight, high-molecular weight band with minimal smearing downward
Inhibitor Testing:
- Perform a control PCR reaction with a universally amplifiable sequence
- Compare amplification efficiency with and without DNA sample
- Significant inhibition is indicated by reduced amplification in spiked samples
Troubleshooting Notes:
- If A260/A280 ratio is below 1.8, consider additional purification using phenol:chloroform extraction
- If DNA shows significant degradation, optimize extraction protocol or consider alternative sample sources
- If inhibitors are present, perform additional clean-up steps such as column purification or ethanol precipitation
DNA Input Requirements Across Bisulfite Sequencing Methods
Method-Specific Input Specifications
The input DNA requirements vary significantly across different bisulfite sequencing methods, largely dependent on the library preparation strategy and sequencing scope. The table below provides a comprehensive overview of these requirements.
Table 2: DNA Input Requirements for Different Bisulfite Sequencing Methods
| Sequencing Method | Recommended Input | Minimum Input | Library Preparation Type | Key Considerations |
|---|---|---|---|---|
| Traditional WGBS (pre-bisulfite) | 1-5 μg | 500 ng | Pre-bisulfite adapter ligation | High input reduces CG bias; requires high-molecular weight DNA |
| Post-Bisulfite Adapter Tagging (PBAT) | 100 ng | 10 ng | Post-bisulfite adapter ligation | Reduced amplification bias; suitable for low biomass samples |
| Tagmentation WGBS (T-WGBS) | 20-100 ng | 10 ng | Transposase-based | Minimal DNA loss; faster protocol with fewer steps |
| Reduced Representation BS (RRBS) | 10-100 ng | 5 ng | Restriction enzyme-based | Focused on CpG-rich regions; more efficient per ng of input |
| Single-Cell BS (scBS-Seq) | 1 cell (≈6 pg) | 1 cell | Post-bisulfite random priming | Extreme low-input protocol; requires specialized expertise |
Impact of Input DNA on Data Quality
The quantity and quality of input DNA directly influence critical data quality metrics in bisulfite sequencing:
Coverage Uniformity: Insufficient input DNA leads to uneven coverage across the genome, particularly in GC-rich regions [17]. Pre-bisulfite protocols generally require microgram quantities (5μg), while post-bisulfite methods can work with nanogram amounts (100ng) due to reduced fragmentation [17].
Mapping Efficiency: Degraded or low-quality DNA results in shorter fragments after bisulfite treatment, reducing the percentage of reads that can be uniquely mapped to the reference genome [17].
CpG Representation: Different library preparation methods show varying efficiency in capturing CpG sites across different genomic contexts. SPLAT and Accel libraries demonstrate more evenly distributed genome coverage compared to TruSeq, which discards significantly more data [17].
Bisulfite Conversion Efficiency: Low-quality DNA with contaminants can lead to incomplete bisulfite conversion, resulting in overestimation of methylation levels [2]. The conversion efficiency should be checked by PCR with bisulfite-converted DNA using non-bisulfite specific primers to amplify unconverted products [2].
Special Considerations for Challenging Sample Types
Formalin-Fixed Paraffin-Embedded (FFPE) Samples
DNA extracted from FFPE tissues presents unique challenges for bisulfite sequencing due to formalin-induced cross-linking and fragmentation. Several strategies can improve results:
Modified RRBS Protocols: Specifically designed FFPE-RRBS protocols incorporate steps such as end-polishing, optimal buffer selection, and performing all enzyme reactions in the same tube to enhance efficiency [2].
Input Amount Adjustment: Sequence libraries from FFPE tissue are typically 10% lower than from fresh-frozen tissue, requiring corresponding increases in input material [2].
Quality Assessment Modifications: Standard integrity assessments may not be applicable; instead, focus on amplifiability and fragment size distribution.
Low-Cell-Number and Single-Cell Applications
For samples with limited cellular material, specialized approaches are required:
Whole-Genome Amplification: In single-cell protocols, whole-genome amplification is necessary after bisulfite conversion, but can introduce biases that must be accounted for in analysis.
Spike-In Controls: The use of completely methylated or completely unmethylated "spiked in" controls in different libraries helps assess conversion efficiency and data quality [2].
Post-Bisulfite Protocols: PBAT methods are particularly suitable for low biomass samples, including mammalian genomic samples with less than 1,000 cells [17].
The Scientist's Toolkit: Essential Research Reagents
Table 3: Essential Research Reagents for DNA Quality Assessment and Bisulfite Sequencing
| Reagent/Category | Specific Examples | Function and Application Notes |
|---|---|---|
| DNA Extraction Kits | Wizard Genomic DNA purification kit (Promega), EpiTect Bisulfite Kit (Qiagen) | Isolate high-quality DNA with minimal contamination; select kits validated for bisulfite sequencing |
| Bisulfite Conversion Kits | EpiTect Bisulfite Kit (Qiagen), Bisulfite conversion kit - whole cell | Convert unmethylated cytosines to uracils while protecting methylated cytosines; critical for defining methylation status |
| Quality Assessment Tools | Qubit dsDNA HS Assay, Agilent TapeStation, NanoDrop | Precisely quantify DNA and assess quality metrics before proceeding with valuable samples |
| Library Preparation Kits | Accel-NGS Methyl-Seq, TruSeq DNA Methylation, SPLAT | Prepare sequencing libraries with different input requirements and coverage characteristics |
| Conversion Controls | Unmethylated λ-bacteriophage DNA, fully methylated genomic DNA | Spike-in controls to monitor bisulfite conversion efficiency in each reaction |
| PCR Components | High-fidelity "hot start" polymerases, longer primers (26-30 bases) | Amplify bisulfite-converted DNA while minimizing errors and non-specific amplification |
| AzGGK | AzGGK, MF:C10H18N6O4, MW:286.292 | Chemical Reagent |
| Bullatalicin | Bullatalicin|High-Purity|For Research Use Only | Bullatalicin is an Annonaceous acetogenin for cancer research and pesticide studies. This product is for Research Use Only. Not for human or diagnostic use. |
Visual Workflow: DNA Quality Assessment and Processing
The following diagram illustrates the complete workflow for DNA quality assessment and processing for bisulfite sequencing applications:
DNA Quality Assessment and Method Selection Workflow
Comprehensive DNA quality assessment and adherence to method-specific input requirements are foundational to successful bisulfite sequencing experiments. The protocols and guidelines presented here provide a framework for researchers to consistently generate high-quality methylation data. By implementing rigorous quality control measures, selecting appropriate methods based on available input DNA, and utilizing the essential research reagents outlined, scientists can ensure the reliability and reproducibility of their DNA methylation studies. These critical first steps establish the foundation for all subsequent analysis and interpretation, ultimately supporting robust conclusions about the role of DNA methylation in gene regulation, development, and disease.
DNA methylation, the covalent addition of a methyl group to the fifth carbon of a cytosine base (5-methylcytosine or 5mC), represents a fundamental epigenetic mark involved in gene regulation, genomic imprinting, and cellular differentiation [6] [19]. In mammalian genomes, this modification occurs primarily at cytosine-guanine dinucleotides (CpG sites), with aberrant methylation patterns being implicated in various diseases, including cancer [6] [19]. Bisulfite sequencing has emerged as the gold standard method for detecting DNA methylation at single-base resolution [20] [6]. The fundamental principle relies on bisulfite conversion of DNA, which deaminates unmethylated cytosines to uracils (read as thymines during sequencing), while methylated cytosines remain protected from conversion [20]. This treatment creates sequence polymorphisms that allow for quantitative assessment of methylation levels when coupled with high-throughput sequencing.
Two primary approaches exist for genome-wide bisulfite sequencing: Whole-Genome Bisulfite Sequencing (WGBS) provides comprehensive coverage of nearly all CpG sites in the genome but requires sufficient sequencing depth and can be costly for large genomes [20]. Reduced Representation Bisulfite Sequencing (RRBS) offers a cost-effective alternative by using restriction enzymes (typically MspI) to enrich for CpG-dense regions such as promoters and CpG islands, thereby reducing sequencing requirements while still capturing functionally relevant methylation sites [20]. The computational analysis of bisulfite sequencing data presents unique challenges due to the reduced sequence complexity following conversion and requires specialized bioinformatics pipelines to accurately map reads and quantify methylation levels [6] [21].
Bioinformatics Pipeline: Core Components and Workflow
The standard bioinformatics pipeline for bisulfite sequencing data encompasses multiple stages, from raw sequence processing to biological interpretation. Each stage requires careful consideration of tools and parameters to ensure accurate results.
Raw Data Processing and Quality Control
The initial stage involves assessing the quality of raw sequencing reads and preparing them for alignment. The FastQC tool is commonly employed for quality control, providing metrics on per-base sequence quality, GC content, adapter contamination, and sequence duplication levels. Specific considerations for bisulfite sequencing data include verifying the expected C-to-T conversion rate in non-CG contexts, which serves as an indicator of successful bisulfite conversion [21]. Preprocessing steps typically include:
- Adapter Trimming: Removal of sequencing adapters using tools such as cutadapt or Trim Galore! (which incorporates Cutadapt) [22]
- Quality Trimming: Filtering of low-quality bases and reads to improve mapping accuracy
- Deduplication: Removal of PCR duplicates using tools like Picard to prevent amplification biases from affecting methylation estimates [22]
Benchmarking studies have demonstrated that read trimming significantly improves mapping efficiency in bisulfite sequencing datasets, making this a critical step in the preprocessing workflow [23].
Alignment to Reference Genome
The alignment of bisulfite-converted reads presents a significant computational challenge due to the reduced sequence complexity resulting from C-to-T conversions. Specialized bisulfite-aware aligners employ specific strategies to address this challenge, primarily using either the "wild-card" or "three-letter" alignment approach [23]. The following table summarizes the key alignment tools and their characteristics:
Table 1: Comparison of Bisulfite Sequencing Alignment Tools
| Tool | Alignment Algorithm | Strategy | Key Features |
|---|---|---|---|
| Bismark | Bowtie/Bowtie2 | Three-letter | Converts both reads and reference to three-letter alphabet, supports both WGBS and RRBS |
| BSMAP | SOAP | Wild-card | Allows C/T polymorphisms in read alignment, faster performance |
| BatMeth2 | BWA-based | Improved wild-card | Optimized for long reads, supports gapped alignment |
| BS-Seeker2 | Bowtie/Bowtie2 | Multiple | Customizable alignment parameters, supports single-end and paired-end |
| BSBolt | Multiple | Hybrid | Includes alignment and methylation calling, supports multiple genomes |
Recent benchmarking studies evaluating these tools on mammalian WGBS data have revealed that BSMAP demonstrates advantages in running time, uniquely mapped reads percentages, genomic coverage, and quantitative accuracy compared to other pipelines [23]. The selection of an appropriate aligner depends on factors such as sequencing platform, read length, and computational resources.
Methylation Calling and File Formats
Following alignment, the next critical step involves methylation calling - the process of quantifying methylation levels at individual cytosine positions. For each cytosine in the genome, methylation callers extract the number of reads supporting methylated versus unmethylated states, calculating a methylation percentage as: methylated reads / (methylated + unmethylated reads) [20]. The most common output formats for methylation data include:
- Bismark Coverage Files: Tab-delimited files containing chromosome, position, strand, methylation percentage, methylated count, and unmethylated count [20]
- ALLC Files: A standardized format storing information for each cytosine with mandatory columns for chromosome, position, strand, sequence context, methylated count, coverage, and methylation significance indicator [22]
Most alignment tools, including Bismark and BSMAP, incorporate built-in methylation calling functionality, while specialized tools like MethylDackel can extract methylation metrics from BAM files. The choice of output format often depends on the downstream analysis tools being employed.
Differential Methylation Analysis
Approaches for Identifying DMRs
Differential methylation analysis aims to identify genomic regions showing statistically significant differences in methylation patterns between experimental conditions (e.g., disease vs. normal). Two primary approaches exist for this analysis:
- Differentially Methylated Positions (DMPs): Focuses on single cytosine sites showing significant methylation differences
- Differentially Methylated Regions (DMRs): Identifies contiguous genomic regions with coordinated methylation changes, typically providing greater biological significance
Multiple statistical methods are employed for DMR detection, including beta-binomial regression, Fisher's exact tests, and t-tests, with appropriate multiple testing corrections (e.g., Benjamini-Hochberg) to control false discovery rates [20] [24]. The methylKit R package provides a comprehensive framework for both DMP and DMR analysis, offering functions for data import, quality control, normalization, and statistical testing [20]. For more complex experimental designs, tools like DSS and BSmooth offer advanced statistical modeling approaches.
Annotation and Interpretation
Following DMR identification, genomic annotation is essential for biological interpretation. DMRs are typically annotated relative to genomic features such as:
- CpG Islands: Regions of high CpG density often located at gene promoters
- Genes: Promoters, transcription start sites, gene bodies, and untranslated regions
- Enhancers and Regulatory Elements: Identified through databases such as FANTOM5 [24]
- Repetitive Elements: Including LINEs and SINEs, which are often methylated for genomic stability
Tools such as genomation and ChIPseeker facilitate this annotation process, while functional enrichment analysis using gene ontology (GO) and pathway databases (e.g., KEGG) helps identify biological processes affected by differential methylation [20] [24].
Integrated Analysis Pipelines
For users seeking streamlined analysis solutions, several integrated pipelines combine multiple processing steps into cohesive workflows:
Table 2: Integrated Pipelines for Bisulfite Sequencing Analysis
| Pipeline | Language | Key Features | Best Suited For |
|---|---|---|---|
| nf-core/methylseq | Nextflow | Comprehensive workflow, includes quality control, alignment, and methylation calling | Users seeking reproducible, containerized workflows |
| Methy-Pipe | C++/Python | Efficient alignment using BWT algorithm, sliding-window DMR detection | Large-scale WGBS studies requiring computational efficiency |
| methylpy | Python | Supports single-cell WGBS and NOMe-seq data, includes DMR calling | Advanced users needing specialized applications |
| ADMIRE | R/Web-based | Focused on methylation array data, user-friendly interface | Researchers with limited computational experience |
The nf-core/methylseq pipeline represents a particularly robust solution, incorporating best practices for quality control, alignment with either Bismark or bwa-meth, and methylation calling in a reproducible framework [20]. For large-scale studies, Methy-Pipe has demonstrated excellent performance in processing whole-genome bisulfite sequencing data efficiently while maintaining accuracy [25].
Visualization and Data Integration
Effective visualization is crucial for interpreting methylation data and communicating findings. Key visualization approaches include:
- Genome Browser Tracks: Displaying methylation levels across genomic regions using tools like the Integrative Genomics Viewer (IGV) or UCSC Genome Browser [24]
- Regional Plots: Focusing on specific genomic loci using specialized plotting functions such as plotMeth from the methylPipe package [26]
- Global Methylation Profiles: Showing distribution patterns across chromosomes or genomic features
- Correlation with Other Omics Data: Integrating methylation data with gene expression (RNA-seq) or chromatin accessibility (ATAC-seq) datasets
The plotMeth function provides particular utility for creating genome-browser like views of specific genomic regions, displaying DNA methylation data alongside other omics data or annotation tracks [26]. For publication-quality figures, tools like Gviz and ggplot2 offer extensive customization options.
The Scientist's Toolkit: Essential Research Reagents and Computational Tools
Table 3: Essential Research Reagents and Computational Tools for Bisulfite Sequencing
| Category | Item | Function/Purpose |
|---|---|---|
| Wet Lab Reagents | Sodium Bisulfite | Converts unmethylated cytosines to uracils while protecting methylated cytosines |
| EpiArt DNA Methylation Kit | Commercial kit for bisulfite conversion and library preparation | |
| FastPure DNA Isolation Kit | Extracts high-quality genomic DNA from cells or tissues | |
| VAHTS Dual UMI Adapters | Unique molecular identifiers for reducing PCR duplication biases | |
| Computational Tools | Bismark/BSMAP | Alignment of bisulfite-converted reads to reference genome |
| methylKit | Differential methylation analysis in R | |
| SAMtools/BEDTools | Manipulation and analysis of alignment files | |
| Cutadapt | Removal of adapter sequences from raw reads | |
| Picard | Removal of PCR duplicates from BAM files | |
| Pulchelloside I | Pulchelloside I|67244-49-9|Iridoid Glycoside | Pulchelloside I, a natural iridoid glycoside for plant research. High-purity, for Research Use Only. Not for human or veterinary use. |
| Eremanthin | Eremanthin, CAS:37936-58-6, MF:C15H18O2, MW:230.3 g/mol | Chemical Reagent |
Workflow Diagrams
Diagram 1: Overall bioinformatics workflow for bisulfite sequencing data analysis, showing the progression from raw data to biological interpretation.
In bisulfite sequencing research, the accurate quantification of DNA methylation relies on a foundational understanding of three key metrics: Beta values, M-values, and coverage depth. Beta values provide a biologically intuitive measure of methylation proportion, while M-values offer statistical robustness for differential analysis. Coverage depth determines the reliability of these measurements across the genome. This application note delineates these critical metrics, their appropriate usage contexts, and provides structured protocols for their application in DNA methylation data analysis, framed within the broader context of bisulfite sequencing research.
Core Metric Definitions and Mathematical Relationships
Beta Values: Biological Interpretation
The Beta-value represents the proportion of methylated cytosines at a specific CpG site across all DNA molecules in a sample, providing a direct biological interpretation of methylation status. It is calculated as the ratio of the methylated probe intensity to the overall intensity [27]:
Where y_methylated and y_unmethylated represent the intensities from methylated and unmethylated probes, respectively, and α is a constant offset (typically 100) to regularize Beta-value when both probe intensities are low [27]. Beta-values range from 0 to 1, where 0 indicates complete unmethylation and 1 represents full methylation at the interrogated CpG site.
M-Values: Statistical Properties
The M-value is defined as the base-2 logarithm of the ratio of methylated to unmethylated probe intensities [27]:
In this formula, a small offset α (typically 1) is added to prevent large fluctuations from small intensity estimation errors [27]. M-values theoretically range from -∞ to +∞, with values near 0 indicating approximately half-methylated status, positive values indicating more methylated molecules, and negative values indicating more unmethylated molecules.
Transformational Relationship
Beta-values and M-values share a deterministic logistic relationship, enabling conversion between these metrics [27]:
This transformation reveals that M-values are essentially logit-transformed Beta-values, which fundamentally alters their statistical properties while maintaining the same underlying methylation information.
Table 1: Comparative Properties of Beta-values and M-values
| Property | Beta-value | M-value |
|---|---|---|
| Range | 0 to 1 | -∞ to +∞ |
| Interpretation | Proportion/Percenage of methylation | Log2 ratio of methylated/unmethylated signals |
| Distribution | Beta distribution | Approximately normal distribution |
| Variance Properties | Severe heteroscedasticity at extremes [27] | Approximately homoscedastic [27] |
| Biological Meaning | Directly interpretable | Not directly interpretable |
| Statistical Use | Problematic for many models [28] | Suitable for parametric statistical tests |
Diagram 1: Relationship between methylation signals and metric calculation
Statistical Properties and Analysis Recommendations
Variance Characteristics and Impact on Analysis
The statistical behavior of Beta-values and M-values differs significantly, particularly regarding their variance properties. Beta-values exhibit severe heteroscedasticity, meaning their variability is not constant across their range. Specifically, the standard deviation of Beta-values is greatly compressed in both low (0-0.2) and high (0.8-1) methylation ranges [27]. This heteroscedasticity violates the assumption of homoscedasticity required by many statistical models, including linear regression and ANOVA.
In contrast, M-values demonstrate approximately homoscedastic behavior, maintaining relatively constant variance across their entire range [27]. This property makes M-values more suitable for statistical methods that assume constant variance and enables more robust detection of differentially methylated positions, particularly for highly methylated or unmethylated CpG sites.
Recommendations for Metric Selection
Based on their complementary strengths, the following analytical approach is recommended:
Use M-values for statistical testing in differential methylation analysis to leverage their superior statistical properties [28] [27]
Report Beta-values for biological interpretation to provide clinically meaningful effect sizes [28] [27]
Apply appropriate transformation methods when confounder effects exist in the data, such as the intercept method described by [28]
Exercise caution with extreme values as highly methylated or unmethylated CpG sites require special attention in interpretation regardless of the metric used [28]
For studies focused on generating p-value sorted lists of CpG sites for downstream pathway analysis, M-values are generally preferred for the detection phase. However, when effect estimates are needed to assess clinical relevance, differences in Beta-values provide more meaningful biological interpretation [28].
Coverage Depth Requirements in Bisulfite Sequencing
Defining Coverage Depth
In bisulfite sequencing, coverage depth refers to the average number of reads covering each cytosine position in the genome. This metric is crucial as it directly impacts the reliability of methylation level estimates. The methylation level (β) at each CpG site is calculated as:
Where C_methylated and C_unmethylated represent the counts of reads supporting methylated and unmethylated cytosines, respectively [20]. The precision of this estimate increases with higher coverage depths.
Empirical Coverage Recommendations
Empirical studies using high-coverage reference datasets have established practical guidelines for coverage requirements in whole-genome bisulfite sequencing (WGBS). Research indicates that true positive rate (TPR) for differentially methylated region (DMR) discovery increases sharply with coverage up to approximately 10×, with diminishing returns beyond this point [29].
Table 2: Recommended Coverage Depth for Different Experimental Scenarios
| Scenario | Recommended Coverage | Key Considerations |
|---|---|---|
| Standard WGBS (human) | 30× [30] | Provides ~90% coverage of CpGs in human genome |
| DMR Discovery (closely related cell types) | 5× - 15× [29] | Higher coverage needed for smaller methylation differences |
| DMR Discovery (divergent cell types) | 5× - 10× [29] | Lower coverage sufficient for large methylation differences |
| Organisms with genomes <100 Mb | 100× [30] | Higher coverage for smaller genomes |
| Single CpG resolution analysis | >10× [29] | Higher coverage than regional analysis |
Diagram 2: Relationship between coverage depth, detection sensitivity, and cost
Coverage Depth and Biological Replicates Trade-off
A critical consideration in experimental design is the balance between sequencing depth and the number of biological replicates. Research demonstrates that for a fixed total sequencing effort, sensitivity in DMR discovery is maximized by maintaining coverage between 5× and 10× per sample and increasing the number of biological replicates rather than further increasing coverage depth [29]. Specifically:
- At low total sequencing effort (equivalent to 10× genome coverage), sensitivity is optimized with a single replicate per group at 5× coverage
- With greater sequencing resources, maximizing biological replicates at 5×-10× coverage per sample provides better sensitivity than deeper sequencing of fewer replicates [29]
- Experiments with a single replicate per group achieve only 50-60% sensitivity even at 30× coverage, emphasizing the necessity of biological replicates [29]
Practical Protocols for Methylation Data Analysis
Differential Methylation Analysis Workflow
Protocol 1: Comprehensive Differential Methylation Analysis
This protocol outlines a standardized approach for identifying differentially methylated positions using both M-values and Beta-values.
Data Preprocessing
Statistical Analysis with M-values
- Convert Beta-values to M-values using logit transformation [27]
- Perform differential testing using linear models or specialized packages (e.g., methylKit [20])
- Adjust for multiple testing using Benjamini-Hochberg or similar methods
- Apply confounder correction when needed using the intercept method [28]
Biological Interpretation with Beta-values
- Convert significant results back to Beta-values for interpretation
- Calculate ΔBeta values for effect size estimation
- For M-value linear models, use the M-model-coef method to obtain ΔBeta: Where M0 is the baseline M-value and ΔM is the coefficient from the M-value model [32]
Result Reporting
- Report both statistical significance (p-values) and biological effect sizes (ΔBeta)
- Annotate significant CpG sites with genomic context
- Perform downstream pathway and enrichment analyses
Bisulfite Sequencing Data Processing Protocol
Protocol 2: Processing Bisulfite Sequencing Data
This protocol covers the essential steps from raw sequencing data to methylation calls.
Raw Data Quality Control
- Assess read quality using FastQC or similar tools
- Verify bisulfite conversion efficiency (>99% recommended)
Read Alignment
Methylation Calling
Data Imputation for Low-Coverage Sites
- For WGBS data with sparse coverage, consider imputation methods
- Use BoostMe or similar algorithms leveraging multiple samples and genomic features [31]
- Validate imputation accuracy through comparison with high-coverage replicates
Table 3: Research Reagent Solutions for Bisulfite Sequencing
| Reagent/Resource | Function | Example/Specifications |
|---|---|---|
| Bisulfite Conversion Kit | Converts unmethylated cytosines to uracils | EpiTect Bisulfite Kit (Qiagen) [3] |
| DNA Purification System | Purifies bisulfite-treated DNA | Wizard DNA clean-up system (Promega) [3] |
| Bisulfite-Aware Aligner | Aligns BS-treated reads to reference genome | BatMeth2 [16], Bismark [20], BWA-meth |
| Methylation Analysis Package | Differential methylation and DMR detection | methylKit [20], BSDMR [33] |
| Visualization Tool | Visualizes methylation patterns and DMRs | Integrated visualization in BatMeth2 [16] |
The rigorous analysis of DNA methylation data from bisulfite sequencing requires thoughtful application of Beta-values, M-values, and appropriate coverage depth considerations. Beta-values provide the biological interpretability essential for translating findings into mechanistic insights, while M-values offer the statistical robustness needed for reliable differential detection. Coverage depth fundamentally determines measurement precision and must be balanced against the number of biological replicates in experimental design. By implementing the structured protocols and recommendations outlined in this application note, researchers can optimize their bisulfite sequencing analyses to produce both statistically sound and biologically meaningful results that advance our understanding of epigenetic regulation in development and disease.
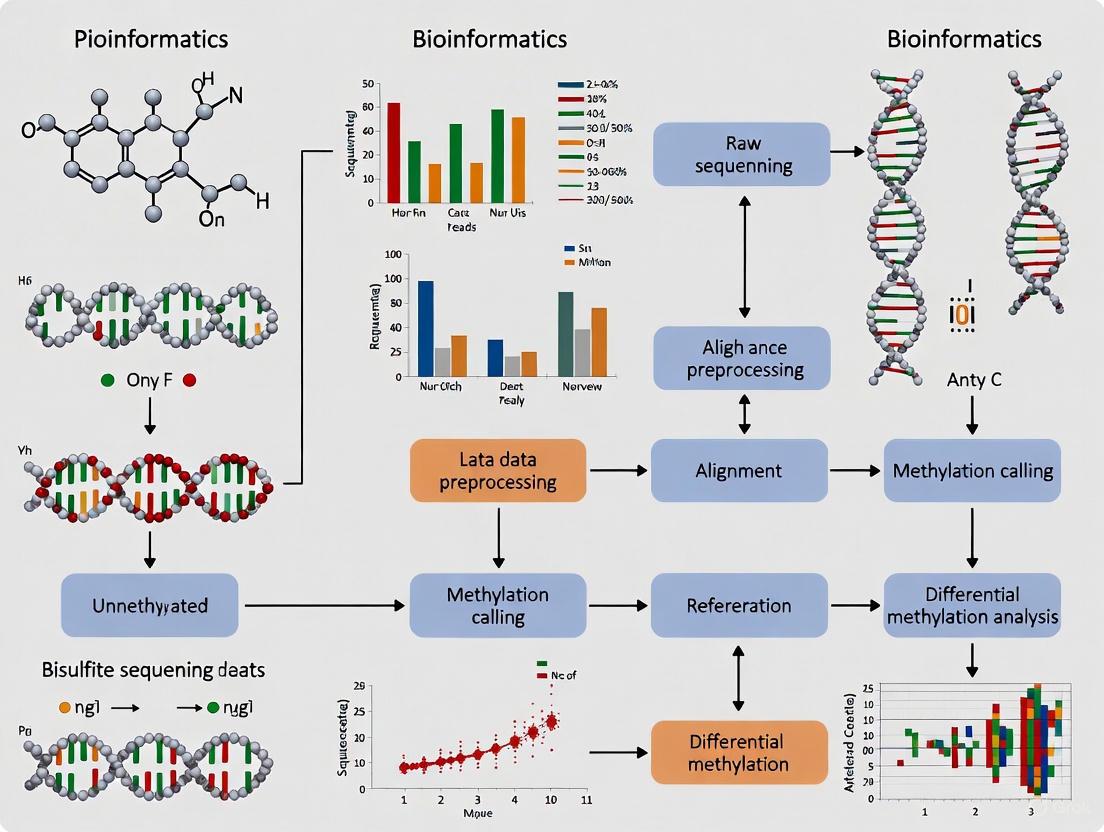
A Step-by-Step Bioinformatics Workflow: From FASTQ to Differential Methylation
In bisulfite sequencing research, the integrity of downstream DNA methylation analysis is entirely dependent on the quality of the initial raw sequence data. Bisulfite conversion treatment, a key step in this process, reduces genomic complexity by converting unmethylated cytosines to uracils, which are then read as thymines in subsequent sequencing. This reduction in sequence complexity, combined with potential issues from library preparation and the sequencing process itself, makes rigorous quality control (QC) and data trimming not merely a preliminary step, but a critical foundation for reliable results [20] [3]. This Application Note details a robust protocol for assessing and preparing bisulfite sequencing data using two complementary tools: Falco and FastQC.
Background
The Bisulfite Sequencing Workflow and its QC Challenges
The core principle of bisulfite sequencing involves treating DNA with sodium bisulfite, which deaminates unmethylated cytosine to uracil, while methylated cytosine remains unchanged. After PCR amplification and sequencing, uracils are read as thymines, allowing for the quantification of methylation at single-base resolution by comparing the ratio of cytosines (representing methylated bases) to thymines (representing unmethylated bases) at each cytosine position in the genome [20] [3]. This process, however, introduces specific challenges that QC must address:
- Reduced Sequence Complexity: The widespread C-to-T conversions drastically lower sequence diversity, which can complicate sequencing and alignment.
- Adapter Contamination: Fragments shorter than the read length can lead to sequence adapters being read, contaminating the data.
- Quality Degradation: The bisulfite treatment itself can cause DNA degradation, leading to lower quality scores towards the ends of reads.
- Biased Sequence Composition: The expected increase in thymine content after conversion creates a strong sequence composition bias, which must be distinguished from technical biases.
Failure to identify and correct these issues can lead to erroneous alignment, inaccurate methylation calling, and ultimately, incorrect biological conclusions.
FastQC is the established industry standard for initial quality assessment of high-throughput sequence data. It provides a modular set of analyses, generating an HTML report that gives a quick impression of data quality and highlights potential problem areas across multiple metrics [34] [35]. Its functions include providing summary graphs and tables for per-base sequence quality, sequence content, GC content, adapter contamination, overrepresented sequences, and more.
Falco is a tool used for QC assessment that can be integrated into analysis workflows. It is cited alongside other tools for evaluating sequencing data on quality and quantity as part of a larger workflow for bacterial isolate sequencing [36].
Table 1: Core Functions of FastQC and Falco
| Tool | Primary Function | Input | Key Output | Typical Use Case |
|---|---|---|---|---|
| FastQC | Quality Assessment & Reporting | FASTQ, BAM, or SAM files | HTML report with graphs, tables, and a summary of pass/warn/fail status [34] [35] | Initial, standalone quality evaluation of raw sequencing data. |
| Falco | Quality Assessment & Workflow Integration | FASTQ files | QC metrics and results, integrated into a larger analytical workflow [36] | Automated QC as a step within a larger pipeline (e.g., in Galaxy workflows). |
The following workflow diagram illustrates the logical sequence of steps from raw data to trimmed, quality-controlled data, and how Falco and FastQC integrate into this process.
Experimental Protocol
Data Preparation and Initial Quality Control
This protocol begins with the raw sequencing data output from the Illumina platform, typically in the form of paired-end FASTQ files (often gzip-compressed).
Hands-On: Prepare Galaxy and Data [36]
- Create a New History: Within your Galaxy analysis platform, create a new history and assign an informative name (e.g., "BSSeqQC").
- Import Datasets: Import the forward (
_1or_R1) and reverse (_2or_R2) FASTQ files. Data can be imported via:- Direct URL: Provide the file URLs from a data repository like Zenodo.
- Shared Data Library: If the data is available in a Galaxy shared library.
- Rename and Tag Datasets: Rename the datasets to clear, identifiable names (e.g.,
SampleA_1,SampleA_2). Tag the datasets with#unfilteredto facilitate tracking through the analysis.
Hands-On: Run Initial QC with Falco/FastQC [36] [35]
This step can be performed using either Falco or FastQC. The following commands and steps are adaptable for use in a Galaxy workflow, a local command-line interface, or an R environment.
Option A: Using Falco in a Workflow Falco is often run as part of a pre-configured workflow. In the Galaxy platform, you would import and execute a workflow that includes the "Assess the reads quality before preprocessing it using Falco" step [36].
Option B: Using FastQC via Command Line or R
- Command Line: After ensuring Java is installed, run FastQC on your files.
- From R: Use the
fastqcrR package to run and aggregate results.
- Generate Report: The tool will produce an HTML report for each sample (and each pair of files). Examine these reports closely to identify potential issues.
Interpreting QC Reports and Key Metrics for Bisulfite Data
The HTML reports from Falco or FastQC contain multiple modules. For bisulfite sequencing data, particular attention should be paid to the following metrics, summarized in the table below.
Table 2: Key FastQC/Falco Metrics and Interpretation for Bisulfite-Seq Data
| QC Module | What It Measures | What to Look For in Bisulfite-Seq | Common Problems & Meaning |
|---|---|---|---|
| Per-base Sequence Quality | Average quality scores (Phred) at each position across all reads [34] [35]. | High quality across the entire read length. | Quality drops at the 3' end of reads. Indicates degradation or sequencing errors. Requires trimming. |
| Per-base Sequence Content | Percentage of A, T, C, G bases at each position [34] [35]. | A shift towards high T content and lower C content due to bisulfite conversion. This is expected. | Uneven nucleotide distribution in the first ~10 bases can indicate random hexamer priming bias. Otherwise, may indicate contamination. |
| Adapter Content | The proportion of sequences that contain adapter sequences [34]. | Little to no adapter content. | A high percentage of adapter sequence indicates fragments shorter than read length. Requires more aggressive trimming. |
| Overrepresented Sequences | Sequences that appear disproportionately often in the library [34] [35]. | A few specific sequences related to the bisulfite conversion protocol may be present. | A long list of overrepresented sequences can indicate significant contamination or PCR bias. |
| Per-sequence GC Content | The distribution of GC content in each read compared to a theoretical normal distribution [34]. | A bimodal distribution is expected in WGBS due to the presence of methylated and unmethylated regions. | A shifted or abnormal distribution can indicate general contamination or poor library quality. |
After interpreting the initial QC report, problematic reads must be trimmed and filtered.
Trimming and Filtering with Fastp
Fastp is a widely used tool for all-in-one trimming and filtering, capable of processing paired-end reads efficiently.
Hands-On: Trimming and Filtering [36]
- Run Fastp: Execute
fastpwith parameters tailored to the issues identified in the QC report. - Key Parameters:
--detect_adapter_for_pe: Automatically detects and trims adapters for paired-end reads.--cut_front,--cut_tail: Perform quality trimming from the 5' and 3' ends.--qualified_quality_phred 20: Trims bases with a Phred score <20 at the 3' end.--length_required 36: Discards reads shorter than 36 bp after trimming.
Post-Trim Quality Control
It is essential to repeat the quality control assessment on the trimmed data to verify the effectiveness of the trimming process and to ensure the data now meets quality standards.
Hands-On: Run Post-Trim QC [36]
- Re-run Falco/FastQC: Execute the same QC tool (Falco or FastQC) used in Section 3.1 on the new, trimmed FASTQ files (
SampleA_1_trimmed.fastq.gzandSampleA_2_trimmed.fastq.gz). - Compare Reports: Compare the pre-trim and post-trim reports. A successful trimming step will show:
- Improved per-base sequence quality, especially at the 3' end.
- Drastically reduced or eliminated adapter content.
- A more normalized per-base sequence content plot (though the T-bias from bisulfite conversion will remain).
The Scientist's Toolkit: Essential Research Reagents and Software
A successful bisulfite sequencing QC analysis relies on a combination of specialized software and robust computational resources.
Table 3: Essential Research Reagent Solutions for QC and Trimming
| Category | Item / Software | Function / Purpose | Key Features / Notes |
|---|---|---|---|
| QC Analysis Tools | Falco | Quality control assessment of sequencing data, integrated into workflows [36]. | Used for automated QC within larger pipelines like those on the Galaxy platform. |
| FastQC | Comprehensive quality control check of raw sequencing data, generating an HTML report [34] [35]. | Provides a modular set of analyses; the industry standard for initial QC. | |
| Trimming Tools | Fastp | All-in-one tool for fast trimming, filtering, and quality control of FASTQ files [36]. | Corrects adapter contamination, quality trimming, and polyG tail trimming. Very fast due to multithreading. |
| Downstream Analysis | Bismark | Alignment and methylation caller for bisulfite sequence data. | Alreads reads to a reference genome and performs methylation extraction. A core tool post-QC. |
| methylKit (R package) | Downstream analysis of methylation data for differential methylation, annotation, and visualization [20]. | Used for statistical analysis and interpretation of methylation patterns after alignment. | |
| Workflow Platforms | Galaxy | Web-based platform for accessible, reproducible data analysis [36]. | Provides user-friendly interfaces for tools like Falco, FastQC, and Fastp without command-line requirements. |
| Aggregation & Reporting | fastqcr (R package) | Parses, aggregates, and analyzes multiple FastQC reports for large numbers of samples [35]. | Enables batch analysis and generation of multi-QC reports, simplifying the review process for large studies. |
| Reserpic acid | Reserpic Acid|CAS 83-60-3|Research Chemical | Reserpic acid is a key alkaloid core for neuropharmacology research. This product is for research use only (RUO). Not for human or veterinary use. | Bench Chemicals |
| Phenyl vinyl ether | Phenyl Vinyl Ether|CAS 766-94-9|For Research | Phenyl vinyl ether is a high-value reagent for polymer and organic synthesis research. This product is For Research Use Only (RUO). Not for human or personal use. | Bench Chemicals |
Rigorous quality control and trimming with Falco and FastQC are non-negotiable first steps in the analysis of bisulfite sequencing data. This protocol provides a detailed roadmap for researchers to assess data quality, identify common issues introduced by the bisulfite conversion process and sequencing technology, and apply corrective trimming and filtering. By establishing a robust QC workflow, researchers can ensure that the foundational data for their DNA methylation analysis is sound, thereby safeguarding the validity and biological relevance of all subsequent findings in their research.
Bisulfite sequencing has revolutionized the field of epigenetics by enabling genome-wide detection of DNA methylation at single-base resolution. This technology relies on the chemical treatment of DNA with sodium bisulfite, which converts unmethylated cytosines to uracils (and subsequently to thymines during PCR amplification), while methylated cytosines remain unchanged [3]. The resulting sequencing reads contain C-to-T conversions that must be accurately mapped back to a reference genome to determine methylation states. This process presents unique computational challenges because standard DNA sequence aligners are not designed to handle these systematic base changes [6] [37].
Bisulfite-aware mappers have been developed specifically to address these challenges using two primary strategies: three-letter alignment and wild-card alignment. Three-letter aligners like Bismark and BS-Seeker2 perform in silico conversion of all Cs to Ts in both the reads and reference genome prior to mapping, effectively reducing the complexity of the alignment problem [38] [39]. Wild-card aligners such as BSMAP replace cytosines in sequenced reads with wild-card nucleotides that can match either cytosine or thymine in the reference [37]. The choice of alignment strategy significantly impacts mapping efficiency, accuracy, and computational requirements, making selection of the appropriate tool critical for generating reliable DNA methylation data.
Key Alignment Tools and Their Features
Table 1: Comparison of Bisulfite-Aware Mapping Tools
| Tool | Alignment Strategy | Supported Library Types | Key Features | Supported Aligners |
|---|---|---|---|---|
| Bismark | Three-letter | WGBS, RRBS | High mapping efficiency, methylation caller, supports both single-end and paired-end reads | Bowtie, Bowtie2 |
| BS-Seeker2 | Three-letter | WGBS, RRBS | Local/gapped alignment, reduced index for RRBS, filters reads with incomplete bisulfite conversion | Bowtie, Bowtie2, SOAP |
| BSMAP | Wild-card | WGBS, RRBS | Hash-table based, handles one continuous gap up to 3 nucleotides | Standalone |
| BRAT-BW | Three-letter | WGBS | FM-index based, memory-efficient | Standalone |
| VAliBS | Three-letter | WGBS | Visual interface, combines BWA and Bowtie2 | BWA, Bowtie2 |
Performance Considerations
Evaluations of bisulfite short read mapping tools have revealed important performance characteristics. A comprehensive assessment of five bisulfite short read mapping tools (BSMAP, Bismark, BS-Seeker, BiSS, and BRAT-BW) found that Bismark demonstrated the highest mapping efficiency on real data, followed by BiSS, BSMAP, and finally BRAT-BW and BS-Seeker with similar performance [40]. However, the study noted that if CPU time is not a constraint, Bismark represents an optimal choice for mapping bisulfite-treated short reads.
BS-Seeker2 shows particular advantages for specific applications. By employing local alignment, BS-Seeker2 can map approximately 11% more total reads compared to traditional alignment methods, with 3.3% of total reads mapped through gapped alignment and 9.4% salvaged through local alignment features [38] [39]. For RRBS data specifically, BS-Seeker2's approach of mapping to a reduced representation genome provides approximately 3-fold faster mapping speed and higher accuracy (99.33% vs 97.92%) compared to mapping to the whole genome [39].
Detailed Methodologies and Protocols
Three-Sequence Alignment Strategy
The three-letter alignment approach implemented in tools like Bismark and BS-Seeker2 involves specific processing steps to handle bisulfite-converted sequences.
Three-Letter Alignment Workflow
The diagram above illustrates the core three-letter alignment strategy used by Bismark and BS-Seeker2. The process involves:
In silico conversion of reads: Each original read is converted into two versions: a C-to-T converted read and a G-to-A converted read (representing the reverse complement strand) [37].
In silico conversion of reference genome: The reference genome is similarly converted into two versions: C-to-T and G-to-A.
Parallel alignment: Each converted read is aligned against both converted reference genomes using traditional aligners like Bowtie or Bowtie2.
Methylation calling: The alignment results are combined to determine cytosine methylation states by identifying positions where cytosines in the original read align to cytosines in the reference genome, indicating methylation protection from bisulfite conversion.
BS-Seeker2 RRBS-Specific Protocol
BS-Seeker2 implements a specialized protocol for Reduced Representation Bisulfite Sequencing (RRBS) that enhances efficiency and accuracy through genome reduction.
RRBS Reduced Representation Mapping
The reduced representation approach for RRBS data involves:
Genome reduction based on restriction sites: BS-Seeker2 identifies all potential restriction enzyme cutting sites (e.g., C'CGG for MspI) in the reference genome [38] [39].
Fragment size selection: Based on the experimental parameters (default 40-220 bp), the pipeline identifies genomic regions that would fall within the selected fragment size range after restriction digestion.
Genome masking: Regions not falling within the size-selected RRBS fragments are masked, creating a reduced representation genome that typically represents less than 5% of the entire genome [39].
Index building and mapping: Special indexes are built from the reduced representation genome, resulting in significantly smaller index files (~0.3 GB vs ~12 GB for mouse mm9) and faster mapping times (approximately 3× faster) compared to whole genome mapping [39].
Quality Control and Preprocessing
Effective bisulfite sequencing analysis requires careful quality control to ensure accurate methylation calling:
Filtering reads with incomplete bisulfite conversion: BS-Seeker2 provides functionality to identify and remove reads with dense clusters of unconverted cytosines at non-CpG sites, which may indicate incomplete bisulfite conversion. This helps minimize overestimation of DNA methylation levels [38] [39].
Adapter trimming and quality filtering: Most bisulfite mappers require pre-trimming of adapter sequences, though BS-Seeker2 can perform local alignment to handle reads with 3' adapter contamination [38].
Handling PCR duplicates: Tools like BS-Seeker2's FilterReads.py module can identify and remove extremely amplified reads, though this is not recommended for RRBS libraries where reads from the same restriction fragment naturally have identical starting positions [41].
The Scientist's Toolkit
Table 2: Essential Research Reagents and Computational Tools
| Category | Item | Specification/Function | Examples/Alternatives |
|---|---|---|---|
| Wet Lab Reagents | Bisulfite Conversion Kit | Converts unmethylated C to U | EpiTect Bisulfite Kit (Qiagen) |
| Restriction Enzymes | Digestion for RRBS libraries | MspI (for RRBS) | |
| DNA Size Selection System | Fragment isolation | Gel extraction, AMPure beads | |
| Computational Tools | Bisulfite Mappers | Alignment of BS-seq reads | Bismark, BS-Seeker2, BSMAP |
| Reference Genomes | Alignment reference | hg38, mm10, etc. | |
| Alignment Engines | Core mapping algorithms | Bowtie2, BWA, SOAP | |
| Quality Control | Bisulfite Conversion Controls | Measure conversion efficiency | Phage DNA spikes |
| Adapter Trimming Tools | Remove adapter sequences | Cutadapt, Trimmomatic | |
| Duplicate Marking | Identify PCR duplicates | Samtools rmdup | |
| Triiron carbide | Triiron carbide, CAS:12011-67-5, MF:CH4Fe3, MW:183.58 g/mol | Chemical Reagent | Bench Chemicals |
| Rhombifoline | Rhombifoline, MF:C15H20N2O, MW:244.33 g/mol | Chemical Reagent | Bench Chemicals |
Advanced Applications and Considerations
Differential Methylation Analysis
Following read alignment and methylation calling, downstream analysis typically involves identifying differentially methylated positions (DMPs) or regions (DMRs). The methylKit R package provides comprehensive functionality for this purpose, supporting loading of Bismark coverage files, sample quality visualization, clustering, and statistical testing for differential methylation [20]. This package is particularly valuable for researchers comparing methylation patterns between different conditions, such as disease states versus normal tissues.
Specialized Sequencing Protocols
Different bisulfite sequencing protocols require specific computational considerations:
Whole Genome Bisulfite Sequencing (WGBS): Provides comprehensive genome-wide coverage but requires substantial sequencing depth. Tools like Bismark and BSMAP are well-suited for WGBS data, with Bismark showing particularly high mapping efficiency for real WGBS datasets [40] [6].
Reduced Representation Bisulfite Sequencing (RRBS): Offers cost-effective methylation profiling of CpG-rich regions. BS-Seeker2's reduced representation indexing provides significant advantages for RRBS data in terms of speed and accuracy [38] [39].
Single-cell BS-seq: Presents additional challenges due to limited starting material and increased technical noise. Emerging tools are addressing these challenges with enhanced error correction and mapping strategies [37].
Bisulfite-aware mapping tools are essential components of the DNA methylation analysis workflow, each with distinct strengths and optimal applications. Bismark demonstrates excellent mapping efficiency for WGBS data, while BS-Seeker2 offers specialized advantages for RRBS through its reduced representation indexing and local alignment capabilities. The choice of tool should consider factors such as sequencing protocol, data quality, computational resources, and specific research questions. As bisulfite sequencing technologies continue to evolve, particularly in single-cell and clinical applications, alignment strategies will likewise advance to address new challenges in epigenomic research.
Whole-genome bisulfite sequencing (WGBS) has emerged as the gold standard for detecting DNA methylation at single-nucleotide resolution across the entire genome [18] [6]. The fundamental principle relies on bisulfite conversion of DNA, where unmethylated cytosines are converted to uracils (and subsequently read as thymines during sequencing), while methylated cytosines remain protected from this conversion [18] [20]. The subsequent computational challenge involves accurately quantifying methylation levels by counting the proportion of cytosines that resisted conversion at each genomic position, a process known as methylation calling [6]. This step is crucial as it transforms raw sequencing alignments into quantitative methylation measurements that drive all downstream biological interpretations. However, this process is susceptible to various technical artifacts, with methylation bias being a particularly insidious issue that can compromise data integrity if not properly addressed [42].
The Essential Toolkit for Methylation Analysis
MethylDackel: A Universal Methylation Extractor
MethylDackel is a highly efficient tool designed to extract methylation metrics from bisulfite sequencing alignments. This tool processes coordinate-sorted and indexed BAM or CRAM files containing BS-seq alignments along with an indexed reference genome to generate per-base methylation metrics [43]. A key strength of MethylDackel is its sophisticated handling of overlapping reads in paired-end sequencing data, which prevents double-counting and ensures accurate methylation quantification [43]. The tool categorizes all cytosines into three primary sequence contexts: CpG, CHG, and CHH (where H represents any nucleotide except G), each with distinct biological significance in epigenetic regulation [43].
MethylDackel's core functionality includes:
- Methylation metric extraction producing standard bedGraph files with methylation percentages
- M-bias analysis generating diagnostic SVG images to visualize position-dependent methylation bias
- Per-CpG/CHG metrics through its
mergeContextoption that combines metrics from individual cytosines - Flexible filtering options based on mapping quality, base quality, and minimum coverage thresholds [43] [42]
Comprehensive Tool Ecosystem
While MethylDackel excels at methylation extraction, complete bisulfite sequencing analysis requires a suite of tools handling different analytical stages:
Table 1: Essential Tools for Bisulfite Sequencing Analysis
| Tool Category | Representative Tools | Primary Function | Key Advantages |
|---|---|---|---|
| Read Alignment | Bismark, bwa-meth, BWAmeth | Align bisulfite-converted reads to reference genome | Three-letter alignment approach avoiding methylation-specific bias [44] [42] |
| Methylation Extraction | MethylDackel, Bismark methylation extractor | Generate methylation calls from aligned reads | Handles overlapping reads, provides multiple output formats [43] [44] |
| Differential Methylation | methylKit, DSS | Identify statistically significant methylation changes between conditions | Specialized statistical methods for proportion data, region-based analysis [20] |
| Quality Control | FastQC, Qualimap, MultiQC | Assess data quality throughout analysis pipeline | Comprehensive QC metrics aggregation [44] |
| Imputation | BoostMe | Predict missing methylation values | Uses XGBoost algorithm, leverages multi-sample information [31] |
| Pivalylbenzhydrazine | Pivalylbenzhydrazine, CAS:306-19-4, MF:C12H18N2O, MW:206.28 g/mol | Chemical Reagent | Bench Chemicals |
| Rhombifoline | Rhombifoline, MF:C15H20N2O, MW:244.33 g/mol | Chemical Reagent | Bench Chemicals |
Understanding and Correcting Methylation Bias
The Nature of Methylation Bias
Methylation bias refers to systematic errors in methylation measurements that correlate with read position, typically manifesting as elevated or depressed methylation levels at the beginning or end of sequencing reads [42]. This artifact can originate from various sources in the experimental workflow, including incomplete bisulfite conversion, library preparation artifacts, or asymmetric degradation of DNA fragments during bisulfite treatment. If uncorrected, this bias can lead to false conclusions in downstream analyses, particularly for studies focusing on subtle methylation differences.
The nf-core/methylseq pipeline, a widely adopted analysis workflow, explicitly includes methylation bias assessment using MethylDackel's mbias function as a standard quality control step [44]. This generates diagnostic plots that visualize methylation percentages across read positions, allowing researchers to identify problematic bias patterns and make informed decisions about potential read trimming [42].
Practical Detection and Mitigation
In practice, methylation bias analysis involves running MethylDackel with the mbias command on a subset of aligned data:
This generates position-dependent methylation plots for each read strand and segment (original top, original bottom, etc.). Interpretation of these plots focuses on identifying substantial deviations (>10-15%) in methylation levels at read termini [42]. When significant bias is detected, researchers can either trim affected read regions using tools like Trim Galore! or apply positional filters during methylation extraction. The decision to trim should balance bias reduction against the loss of informative sequencing data, with typical trimming removing 5-10 base pairs from read ends [42].
Integrated Analysis Workflows
End-to-End Pipeline Implementation
Modern bisulfite sequencing analysis typically employs integrated pipelines that chain multiple tools into coherent workflows. The nf-core/methylseq pipeline represents a robust, community-supported framework that encompasses all analysis stages from raw read processing to methylation calling [44]. This pipeline supports both Bismark and bwa-meth aligners, with MethylDackel available for methylation extraction in the bwa-meth workflow [44].
Table 2: Key Steps in a Standard Methylation Analysis Workflow
| Step | Tools | Output | Quality Metrics |
|---|---|---|---|
| Quality Control | FastQC, Falco | Quality reports | Per-base quality scores, adapter contamination [44] [42] |
| Adapter Trimming | Trim Galore! (Cutadapt) | Trimmed FASTQ | Percentage of bases removed [44] |
| Alignment | Bismark, bwa-meth | Aligned BAM | Alignment rate, unique vs. duplicate alignments [44] [42] |
| Deduplication | Bismark deduplicate, picard MarkDuplicates | Deduplicated BAM | Percentage of duplicates removed [44] |
| Methylation Extraction | MethylDackel, Bismark extractor | bedGraph, coverage files | M-bias plots, CpG context distribution [43] [44] |
| Differential Analysis | methylKit | DMPs/DMRs | Statistical significance, methylation differences [20] |
The following workflow diagram illustrates the relationship between these steps:
Downstream Analysis with methylKit
Following methylation extraction with MethylDackel, the resulting bedGraph or coverage files typically undergo downstream statistical analysis in R using packages like methylKit [20]. This package provides comprehensive functionality for comparative methylation studies, including:
- Data loading and filtering based on coverage and quality thresholds
- Sample correlation and clustering to identify potential outliers or batch effects
- Differential methylation analysis using statistical tests appropriate for proportional data
- Genomic region annotation to associate differential methylation with functional genomic elements
A typical methylKit analysis begins by reading MethylDackel output files into a methylRaw or methylRawList object, followed by filtering to remove low-coverage bases and normalization to enable valid sample comparisons [20].
Experimental Protocol: Methylation Extraction and Bias Assessment
Materials and Reagents
Table 3: Essential Research Reagents and Computational Resources
| Item | Specification | Purpose |
|---|---|---|
| Alignment Files | Coordinate-sorted BAM/CRAM format | Input containing aligned bisulfite sequencing reads [43] |
| Reference Genome | Indexed FASTA format | Genomic reference for position context and methylation calling [43] |
| MethylDackel Software | Version 0.5.2 or higher | Primary tool for methylation extraction and bias analysis [42] |
| Computational Resources | 8+ GB RAM, multi-core processor | Handle memory-intensive processing of sequencing data [43] |
| Bioinformatics Pipeline | nf-core/methylseq 2.4.0+ | Integrated workflow for end-to-end analysis [44] |
Step-by-Step Methodology
Input Preparation: Ensure aligned reads are in coordinate-sorted BAM format with corresponding index files. Verify reference genome matches that used for alignment.
Methylation Bias Assessment:
This generates SVG images visualizing methylation percentage by read position for each strand [42].
Interpret Bias Plots: Examine generated plots for systematic deviations at read ends. Decide whether read trimming is necessary based on bias severity.
Methylation Extraction with Filtering:
This command extracts methylation calls with a minimum coverage threshold of 10 reads and merges cytosine contexts [43].
Output Generation: MethylDackel produces:
- CpG context methylation in bedGraph format
- Per-base methylation metrics with read counts
- Coverage files summarizing methylation values [43]
Quality Verification: Check splitting reports for conversion rates and coverage distribution across genomic contexts.
Advanced Applications and Future Directions
Recent methodological advances have expanded the possibilities for methylation analysis beyond standard approaches. The BoostMe algorithm exemplifies innovation in addressing coverage limitations in WGBS data through imputation of missing methylation values using a gradient boosting framework (XGBoost) [31]. This method leverages information from multiple samples within the same tissue type to improve accuracy at low-coverage sites, significantly enhancing concordance between WGBS and microarray platforms [31].
For specialized applications, global methylation analysis using mass spectrometry techniques like Orbitrap MS provides complementary approaches that quantify overall methylation levels without sequence context, particularly useful for highly methylated genomes or non-model organisms [45]. This method employs acid hydrolysis followed by UHPLC-HRMS to directly measure methylated nucleobases, offering advantages in speed and accuracy for global methylome assessment [45].
The field continues to evolve with emerging capabilities in single-cell bisulfite sequencing, long-read nanopore sequencing for direct methylation detection, and multi-omics integration that combines methylation data with transcriptomic and chromatin profiling to build comprehensive epigenetic regulatory networks [18] [6]. These technological advances, coupled with robust computational tools like MethylDackel, are progressively enhancing our ability to decipher the complex epigenetic codes governing gene expression and cellular identity.
DNA methylation, the covalent addition of a methyl group to cytosine bases, represents a fundamental epigenetic mark associated with transcriptional repression during development, maintenance of homeostasis, and disease [18]. In animal cells, DNA methylation occurs predominantly at cytosine-phospho-guanine (CpG) dinucleotides, with approximately 60-80% of CpG cytosines being methylated depending on cell type and physiological state [18]. Bisulfite sequencing has emerged as the gold standard method for analyzing DNA methylation due to its potential for whole-genome coverage and single-base resolution [20] [18]. This technique leverages the chemical conversion of unmethylated cytosines to uracils (which are read as thymines in sequencing), while methylated cytosines remain protected from this conversion [20] [18].
The analysis of bisulfite sequencing data presents unique computational challenges that require specialized tools. methylKit is an R package specifically designed for DNA methylation analysis and annotation from high-throughput bisulfite sequencing experiments [46]. It can process data from various methodologies including Whole-Genome Bisulfite Sequencing (WGBS), Reduced Representation Bisulfite Sequencing (RRBS), and target-capture methods such as Agilent SureSelect methyl-seq [20] [46]. This protocol focuses on the critical initial phase of the analysis workflow: loading bisulfite sequencing data into R and performing essential quality control and filtering steps to ensure robust downstream results.
Experimental Setup and Data Preparation
Installation and Package Loading
Before beginning the analysis, ensure that the required packages are installed and loaded. The methylKit package provides the core functionality for methylation analysis, while genomation and GenomicRanges support annotation and genomic interval operations [20].
Input Data Formats
methylKit accepts several input file types generated from common bisulfite sequencing alignment tools. The primary supported formats are:
- Bismark coverage files: The standard output from Bismark aligner containing methylation information per base
- Generic methylation files: Tab-separated files with methylation ratio information from other aligners like BSMAP
- SAM files: Direct processing of sorted SAM files from Bismark using
read.bismark()function [46]
A typical Bismark coverage file contains the following columns: chrBase, chr, base, strand, coverage, freqC, and freqT [20]. The freqC column represents the percentage of reads indicating methylation at a cytosine position, while freqT indicates the converse [20].
The following diagram illustrates the complete workflow for loading and filtering bisulfite sequencing data using methylKit, from initial data preparation through to generating a quality-filtered methylation object ready for downstream analysis.
Detailed Experimental Protocols
Loading Bisulfite Sequencing Data
The first analytical step involves reading methylation data into R using the methRead() function. This function requires a list of file paths, sample identifiers, assembly information, and a treatment vector indicating sample groups [20].
Critical Parameters:
sample.id: Unique identifiers for each sampleassembly: Genome assembly used for alignment (e.g., "hg38", "mm10")treatment: Numerical vector defining experimental groups (0=control, 1=treatment)context: Methylation context to analyze ("CpG", "CHG", or "CHH")mincov: Minimum read coverage required for inclusion of a base
Initial Quality Assessment
After loading the data, perform initial quality assessment to evaluate sample quality and identify potential issues. methylKit provides functions to generate basic statistics and visualizations for this purpose [20] [46].
Data Filtering
Filtering is a critical step to remove low-quality data and ensure robust downstream analysis. The two primary filtering approaches in methylKit are coverage-based filtering and outlier removal.
Filtering Parameters:
lo.count: Minimum read count required to include a baselo.perc: Minimum percentile for coverage (alternative to lo.count)hi.count: Maximum read count threshold to exclude extremely high coverage siteshi.perc: Maximum percentile for coverage to remove PCR artifacts
Normalizing Coverage
To mitigate technical biases resulting from varying read depths across samples, methylKit provides a coverage normalization function.
Research Reagent Solutions
The following table details essential reagents, tools, and software required for conducting bisulfite sequencing data analysis with methylKit.
Table 1: Essential Research Reagents and Computational Tools for Methylation Analysis
| Item Name | Function/Application | Specifications |
|---|---|---|
| Bismark | Alignment tool for bisulfite sequencing data | Maps BS-seq reads to reference genome and performs methylation calling [20] [42] |
| methylKit R Package | Downstream analysis of DNA methylation data | Provides functions for QC, filtering, differential methylation, and annotation [46] |
| Genomation Package | Annotation of genomic intervals | Facilitates annotation of DMRs with genomic features [20] |
| FastQC/Falco | Quality control of raw sequencing data | Assesses read quality, GC content, and potential biases [42] |
| Trim Galore | Adapter and quality trimming | Removes adapters and low-quality bases from raw reads [47] |
| BSgenome Package | Reference genome access | Provides reference genome sequences for annotation [46] |
| UCSC Table Browser | Source of annotation files | Provides gene models, CpG islands, and other genomic features [46] |
Quality Control Metrics and Filtering Thresholds
Proper quality control is essential for generating reliable methylation data. The following table summarizes key quality metrics and recommended thresholds for filtering bisulfite sequencing data prior to downstream analysis.
Table 2: Quality Control Metrics and Recommended Filtering Thresholds for Bisulfite Sequencing Data
| Quality Metric | Calculation Method | Recommended Threshold | Purpose |
|---|---|---|---|
| Read Coverage | Number of reads covering a cytosine site | Minimum: 10X [20]; Maximum: 99.9th percentile [20] | Ensure statistical reliability while removing PCR artifacts |
| Bisulfite Conversion Efficiency | Percentage of non-CpG cytosines converted | >99% [18] | Verify complete bisulfite conversion |
| Sample Correlation | Pearson correlation of methylation values | >0.8 between biological replicates [20] | Assess replicate consistency |
| Methylation Distribution | Distribution of methylation percentages | Check for expected bimodal distribution [46] | Identify technical artifacts |
| CpG Coverage Distribution | Distribution of read depths across CpG sites | Median coverage >20X for WGBS [20] | Assess overall data quality |
Troubleshooting Common Issues
Several common issues may arise during the loading and filtering of bisulfite sequencing data:
- Low coverage sites: Increase the
lo.countparameter or uselo.percto include more sites while maintaining minimum quality standards - Memory limitations: For large WGBS datasets, process chromosomes individually or increase available memory
- Sample outliers: Use the
rm.outlier()function with the "iqr" method to remove clear outliers that may affect downstream analysis - Incomplete annotation: Ensure annotation files match the genome assembly used for alignment by downloading appropriate files from UCSC Table Browser [46]
Proper loading and filtering of bisulfite sequencing data establishes the foundation for all subsequent methylation analyses. The methylKit package provides a comprehensive toolkit for these critical initial steps, enabling researchers to transform raw methylation data into a high-quality, analysis-ready dataset. By following the protocols outlined in this document—including careful data loading, rigorous quality control, and appropriate filtering—researchers can ensure the reliability of their downstream differential methylation and annotation results. The robust preprocessing of DNA methylation data ultimately supports more accurate biological insights into epigenetic regulation in development, homeostasis, and disease.
Identifying Differentially Methylated Regions (DMRs) with DMRcate and HOME
DNA methylation, the addition of a methyl group to the C5 position of cytosine within CpG dinucleotides, represents a fundamental epigenetic mechanism regulating gene expression, genomic imprinting, and cellular differentiation [3]. In the context of a broader thesis on bisulfite sequencing research, understanding regional methylation patterns is crucial as promoter methylation typically associates with transcriptional repression, while gene body methylation may correlate with expression [48]. Bisulfite sequencing approaches provide quantitative cytosine methylation levels at single-base resolution by exploiting the differential sensitivity of methylated and unmethylated cytosines to bisulfite conversion [16]. During this process, unmethylated cytosines convert to uracils (read as thymines in sequencing), while methylated cytosines remain unchanged, allowing precise methylation mapping [3].
The identification of Differentially Methylated Regions (DMRs)—genomic intervals showing statistically significant methylation differences between biological conditions—provides more biologically meaningful insights than analyzing individual CpG sites, as epigenetic regulation typically involves coordinated changes across multiple adjacent CpGs [49]. Within this framework, DMRcate has emerged as a powerful statistical method that identifies DMRs through tunable kernel smoothing of differential methylation signals, demonstrating superior performance compared to alternative approaches like Bumphunter and Probe Lasso in both simulated and real datasets [49]. This protocol details the implementation of DMRcate within comprehensive DMR analysis workflows for both array and sequencing-based bisulfite methylation data, framed within the context of advancing bisulfite sequencing research methodologies.
Theoretical Foundation and Algorithmic Approach
The DMRcate Statistical Framework
DMRcate operates on a robust statistical foundation that combines site-specific differential methylation testing with spatial smoothing to identify genomic regions showing consistent methylation changes. The method first computes differential methylation statistics for each individual CpG site using limma's moderated t-tests, which borrow information across probes to provide more stable variance estimates, particularly beneficial for studies with small sample sizes [49] [50]. The algorithm then squares these moderated t-statistics to capture magnitude of difference regardless of direction, and applies a Gaussian kernel smoother across the genome to aggregate signals from neighboring CpGs [49] [51].
The smoothing process generates a continuous differential methylation profile across genomic coordinates, with the kernel bandwidth (typically 1000 bp for 450K arrays and 2000 bp for WGBS data) determining the spatial scale of analysis. DMRcate accounts for the uneven distribution of CpG sites across the genome by deriving an expected value of the smoothed estimate under the null hypothesis of no differential methylation [49]. Candidate DMRs are identified where the smoothed signal exceeds a threshold defined by the product of the kernel standard deviation and a scaling parameter (C), with recommended values of C=2 for array data and C=20 for sequencing data [52] [49]. Each candidate DMR undergoes significance testing against the null model, with false discovery rate (FDR) correction applied to control for multiple testing.
Comparative Advantages in Bisulfite Sequencing Research
DMRcate offers several advantages specifically valuable in bisulfite sequencing research contexts. Unlike annotation-dependent methods that restrict analysis to predefined genomic features, DMRcate's annotation-agnostic approach enables de novo DMR discovery across the entire genome, including intergenic regions that may contain unannotated regulatory elements [49]. The method effectively handles the sparse and irregular CpG spacing characteristic of reduced representation bisulfite sequencing (RRBS) data through its density-aware smoothing algorithm. Furthermore, DMRcate accommodates both hypermethylation and hypomethylation within the same region, capturing complex methylation patterns that can occur in biological systems [49].
Validation studies using whole-genome bisulfite sequencing data as benchmark have demonstrated DMRcate's superior sensitivity and specificity compared to other region-calling methods, with particularly strong performance in detecting DMRs in promoter-associated regions and CpG islands [49]. The method maintains robust performance across varying sample sizes and methylation effect sizes, making it suitable for both large epigenome-wide association studies and smaller focused investigations.
Experimental Design and Data Preparation
Research Reagent Solutions and Essential Materials
Table 1: Key Research Reagents and Materials for DMR Analysis
| Item | Function | Implementation in Analysis |
|---|---|---|
| Bisulfite Conversion Kit (e.g., EpiTect Bisulfite Kit) | Converts unmethylated cytosines to uracils while preserving methylated cytosines | Creates the fundamental methylation-dependent sequence variation detected in downstream analysis [3] |
| Illumina Methylation Arrays (450K/EPIC) or Sequencing Library Prep Kits | Provides platform for methylation assessment at specific CpG sites or across entire genome | Determines coverage and genomic regions accessible for DMR analysis [53] [48] |
| DNA Extraction & Purification System (e.g., Wizard Genomic DNA purification) | Obtains high-quality, intact genomic DNA free of contaminants | Ensures reliable bisulfite conversion and minimizes technical artifacts in methylation calling [3] |
| Alignment Software (BatMeth2, Bismark, BSMAP) | Maps bisulfite-converted reads to reference genome while accounting for C-T conversions | Provides input data (methylation calls) for DMR identification [16] |
| Quality Control Tools (minfi, MePyLome) | Assesses data quality, detects outliers, and evaluates bisulfite conversion efficiency | Identifies problematic samples or probes requiring exclusion before DMR analysis [48] [54] |
| Annotation Packages (IlluminaHumanMethylation450kanno.ilmn12.hg19) | Provides genomic context for CpG sites (chromosomal location, relation to genes) | Enables biological interpretation of identified DMRs [52] [53] |
Sample Size Considerations and Experimental Design
Proper experimental design is critical for successful DMR identification. For array-based studies, a minimum of 12 samples per group is recommended to achieve reasonable statistical power, though larger sample sizes (20+ per group) are preferable for detecting subtle methylation differences (<10% Δβ) [49]. When designing sequencing-based studies, consider both sample size and sequencing depth—typically 10-20X coverage for WGBS and 5-10 million reads per sample for RRBS—to ensure sufficient power for DMR detection while maintaining cost efficiency.
Incorporate appropriate blocking factors for known technical covariates (e.g., processing batch, array position, sequencing lane) and biological covariates (e.g., age, sex, cell type composition) in the experimental design. For heterogeneous tissue samples, implement cell type composition estimation either through reference-based deconvolution algorithms or measurement of cell-type-specific markers to avoid confounding in differential methylation analysis [48]. When analyzing paired samples (e.g., pre- and post-treatment), utilize the paired nature of samples in the statistical model to increase power to detect true biological differences.
Computational Implementation and Workflow
Data Preprocessing and Quality Control
The initial preprocessing phase establishes data quality and prepares methylation values for differential analysis. For array-based data, begin by reading raw intensity data from IDAT files using the minfi or meplome packages [48] [54]:
For sequencing data, process begins with alignment of bisulfite-converted reads using specialized tools such as BatMeth2, which provides indel-sensitive mapping crucial for accurate methylation calling in polymorphic regions [16]. Following alignment, extract methylation counts using the processBismarkAln function in the DSS package or similar tools.
Quality control represents a critical step in both array and sequencing workflows. For array data, remove poorly performing probes with detection p-values > 0.01 in more than 10% of samples, and exclude samples with >5% failed probes [48]. Implement additional filtering to eliminate probes containing common SNPs, cross-reactive probes that map to multiple genomic locations, and probes on sex chromosomes when analyzing autosomal patterns only [52] [48]:
For sequencing data, filter low-coverage positions (<10X coverage) and remove samples with exceptional bisulfite conversion rates (<95%) or unusual methylation distributions. Apply appropriate normalization methods—BMIQ (Beta-Mixture Quantile) for array data to address probe-type biases, and global scaling or functional normalization for sequencing data to correct for technical variability [48].
Differential Methylation and DMR Workflow
The core DMR identification workflow progresses through systematic stages from individual CpG analysis to regional identification, as illustrated in the following computational workflow:
Figure 1: Computational workflow for DMR identification from bisulfite methylation data, highlighting key stages from raw data processing through DMRcate analysis to biological interpretation.
Following quality control, conduct probe-wise differential methylation analysis using an appropriate statistical framework. For array data, employ limma with M-values (log2 ratios of methylated to unmethylated intensities) due to their improved statistical properties for differential testing [53] [50]:
For sequencing data with multiple replicates per group, utilize beta-binomial regression implemented in packages such as DSS or methylSig to account for biological variability and coverage differences. The resulting per-CpG statistics (t-statistics for arrays, Z-statistics for sequencing) serve as input for DMRcate.
DMRcate Implementation and Parameter Optimization
The core DMR identification with DMRcate involves preparing annotation objects and executing the regional analysis with appropriate parameters:
For sequencing data, adjust parameters to accommodate different data structures:
Table 2: Key DMRcate Parameters and Recommended Settings
| Parameter | Array Data | Sequencing Data | Function |
|---|---|---|---|
| lambda | 1000 bp | 2000 bp | Gaussian kernel smoothing bandwidth |
| C | 2 | 20 | Scaling parameter for DMR threshold |
| min.cpgs | 3 | 3 | Minimum number of CpGs to define a DMR |
| pcutoff | "fdr" | "fdr" | P-value adjustment method |
| fdr | 0.05 | 0.05 | False discovery rate threshold |
Parameter selection significantly impacts DMR detection sensitivity and specificity. The lambda parameter (smoothing bandwidth) should reflect the expected scale of coordinated methylation—shorter values (500-1000 bp) for focused promoter DMRs, longer values (2000-5000 bp) for broad genomic domains. The C parameter controls stringency, with higher values reducing false positives but potentially missing subtle DMRs. For discovery analyses, use less stringent parameters (C=2 for arrays, C=20 for sequencing), then apply more stringent thresholds for validation stages.
Results Interpretation and Biological Validation
Annotation and Functional Interpretation
Following DMR identification, extract genomic annotations to facilitate biological interpretation. The extractRanges function generates a GenomicRanges object containing DMR coordinates, statistical metrics, and constituent CpG information:
Prioritize DMRs based on statistical significance (FDR-adjusted p-values), magnitude of methylation difference (mean Δβ > 10% for arrays, >20% for sequencing), and genomic context. DMRs overlapping promoter regions, enhancer elements, or known regulatory domains typically hold greater biological interest than those in intergenic regions. Functional enrichment analysis using tools like GREAT or LOLA can identify biological processes and pathways enriched among DMR-associated genes.
Visualization and Results Communication
Effective visualization enhances interpretation and communication of DMR findings. Create regional methylation plots to display DMRs in their genomic context:
For study-level overview, generate Manhattan plots displaying DMR significance across chromosomes, and heatmaps visualizing methylation patterns across samples for top DMRs. These visualizations help identify global methylation patterns and sample clustering based on DMR profiles.
Validation Strategies and Technical Confirmation
Biological validation strengthens DMR findings through orthogonal methods. Pyrosequencing provides quantitative confirmation for array- or sequencing-identified DMRs, typically targeting 3-5 CpGs within top DMRs across all samples. For functional validation, correlate DMR methylation with gene expression data (RNA-seq) from the same samples, expecting promoter DMR hypermethylation to associate with reduced expression and vice versa.
Technical validation should address potential confounders, including SNP effects, cross-hybridization artifacts (for arrays), and mapping errors (for sequencing). Verify that identified DMRs do not disproportionately overlap with known genomic variants by cross-referencing with databases like dbSNP. For cell type-specific DMRs, confirm findings in purified cell populations when possible, or utilize reference-based computational deconvolution to estimate cell-type contributions.
Troubleshooting and Methodological Considerations
Common Challenges and Solutions
Table 3: Troubleshooting Guide for DMR Analysis
| Problem | Potential Causes | Solutions |
|---|---|---|
| No significant DMRs detected | Overly stringent parameters, insufficient sample size, weak biological effect | Adjust C parameter (reduce stringency), increase lambda value, verify statistical power in experimental design |
| Excessively many DMRs | Inadequate multiple testing correction, confounding factors, batch effects | Apply more stringent FDR threshold, include relevant covariates in design matrix, check for and correct batch effects |
| DMRs disproportionately in specific genomic regions | Probe selection bias (arrays), coverage unevenness (sequencing), biological truth | Compare against expected genomic distribution, verify uniform coverage in sequencing data, consider platform-specific biases |
| Poor replication in validation | Technical artifacts in discovery phase, population heterogeneity, insufficient validation sample size | Verify quality control metrics, ensure consistent processing, increase validation sample size, use orthogonal validation method |
| Inconsistent direction of methylation change within DMRs | True biological phenomenon, misaligned CpG effects, statistical noise | Check strand specificity, examine individual CpG tracks, consider biological plausibility of complex patterns |
Advanced Applications in Bisulfite Sequencing Research
DMRcate facilitates specialized analyses particularly relevant to bisulfite sequencing research. For longitudinal studies, incorporate time-series designs by including time-point indicators in the model matrix and testing appropriate contrasts. For multi-group comparisons, implement ANOVA-like F-tests followed by post-hoc pairwise DMR identification. In cancer epigenetics, identify variably methylated regions (VMRs) by modifying the analysis type parameter to "variability" instead of "differential," detecting regions with increased methylation variability between samples.
Integration with complementary epigenetic marks enhances biological interpretation. Correlate DMRs with chromatin accessibility (ATAC-seq) or histone modification (ChIP-seq) data from the same samples to identify regions with coordinated epigenetic regulation. These integrated analyses provide stronger evidence for functional regulatory elements than methylation analysis alone.
The DMRcate methodology provides a robust, statistically principled framework for identifying differentially methylated regions from diverse bisulfite-based methylation data types. Its annotation-agnostic approach enables comprehensive genome-wide DMR discovery, while its tunable parameters accommodate varying study designs and biological questions. Proper implementation requires careful attention to data quality, appropriate parameter selection, and thorough biological validation.
When applied within a well-designed bisulfite sequencing research framework, DMRcate facilitates the transition from individual CpG statistics to biologically meaningful regional methylation patterns, advancing our understanding of epigenetic regulation in development, disease, and environmental response. The continued refinement of DMR detection methods, including enhanced integration with multi-omics approaches and single-cell methylation profiling, will further expand the utility of DMR analysis in epigenetic research.
DNA methylation is a fundamental epigenetic mark involving the addition of a methyl group to the cytosine base in DNA, typically occurring at cytosine-phospho-guanine (CpG) dinucleotides. This modification plays a crucial role in gene regulation, genomic imprinting, and repression of transposable elements without altering the underlying DNA sequence [1]. In eukaryotic cells, DNA methylation patterns are cell-type-specific and provide a window into cellular identity and developmental processes [55].
Bisulfite sequencing has emerged as the gold standard technique for assessing DNA methylation at single-nucleotide resolution. The fundamental principle relies on the differential sensitivity of methylated and unmethylated cytosines to bisulfite conversion. When genomic DNA is treated with sodium bisulfite, unmethylated cytosines are converted to uracils, which are then amplified as thymines during PCR. In contrast, methylated cytosines are protected from this conversion and remain as cytosines [18]. This chemical treatment effectively transforms epigenetic information into genetic information that can be detected through sequencing.
Two primary approaches exist for genome-wide methylation analysis: Whole-Genome Bisulfite Sequencing (WGBS) provides comprehensive coverage of all methylated cytosines throughout the genome, while Reduced Representation Bisulfite Sequencing (RRBS) uses restriction enzymes to capture a representative subset of the genome, particularly CpG-rich regions like promoters and CpG islands, offering a cost-effective alternative [20]. The resulting data requires specialized bioinformatics pipelines for alignment, methylation calling, and visualization to enable biological interpretation.
Key Tools and Software for Methylation Data Analysis
Bioinformatics Pipelines for Data Processing
Processing bisulfite sequencing data requires specialized tools that account for the reduced sequence complexity following bisulfite conversion. The table below summarizes the essential tools for key processing steps:
Table 1: Essential Bioinformatics Tools for Bisulfite Sequencing Data Analysis
| Tool Name | Primary Function | Key Features | Input | Output |
|---|---|---|---|---|
| Bismark [56] | Read alignment & methylation calling | Aligns BS-seq reads to reference genome; identifies methylated cytosines | FASTQ files | SAM/BAM files with methylation tags |
| Bismark Methylation Extractor [57] | Methylation data extraction | Extracts methylation calls from Bismark output; generates coverage files | Bismark BAM/SAM files | Context-specific methylation files |
| methylKit [20] | Differential methylation analysis | R package for methylation analysis, QC, and DMR identification | Bismark coverage files | Differential methylation statistics |
| ViewBS [58] | Methylation visualization | Toolkit for various methylation plots; minimal programming required | Genome-wide cytosine reports | Multiple plot types (heatmaps, profiles) |
| Gviz [59] | Genomic track visualization | R package for creating publication-quality genomic tracks | Various genomic data formats | Integrated genomic track plots |
Installation and Setup
For Bismark, installation requires Perl and alignment tools (Bowtie2 or HISAT2). The latest version can be downloaded from the Babraham Bioinformatics website [56]. For R-based tools like methylKit and Gviz, installation is performed within the R environment:
ViewBS can be installed via conda for simplified dependency management [58]:
Experimental Workflow: From Raw Data to Methylation Profiles
The following diagram illustrates the complete workflow for bisulfite sequencing data analysis, from raw sequencing reads to final visualization:
Workflow Overview: From Raw Data to Visualization
Data Preprocessing and Alignment
The initial processing of bisulfite sequencing data requires careful quality control and specialized alignment strategies. First, perform quality assessment of raw sequencing reads using tools like FastQC, followed by adapter trimming and quality trimming with tools like Trim Galore or Trimmomatic. The critical alignment step is performed using Bismark, which aligns bisulfite-converted reads to a reference genome [56]:
Methylation Calling and File Preparation
Following alignment, extract methylation information using Bismark's methylation extractor utility. This step generates files containing methylation percentages and counts for each cytosine position [57]:
The resulting cytosine report follows this essential format [58]:
<chromosome> <position> <strand> <count methylated> <count unmethylated> <C-context> <trinucleotide context>
This file serves as the primary input for downstream visualization and analysis tools.
Creating Methylation Profile Plots
Average Methylation Profiles Across Genomic Features
Methylation profiles display average methylation levels across genomic features like genes or promoters, revealing patterns such as the characteristic dip in methylation around transcription start sites. The ViewBS toolkit provides efficient methods for generating these profiles [58]:
In R, the methylKit package enables similar functionality with custom genomic annotations:
Global Methylation Patterns and Statistics
ViewBS provides multiple commands for visualizing global methylation patterns. The MethCoverage command generates reverse cumulative plots showing coverage distribution, while GlobalMethLev creates visualizations of global methylation levels across different sequence contexts [58]:
These visualizations help researchers assess data quality and identify overall methylation patterns, such as the expected high methylation in heterochromatic regions and low methylation in promoter regions.
Constructing Integrated Genomic Tracks
Building Custom Tracks with Gviz
The Gviz package in R provides a structured framework for creating publication-quality genomic track visualizations. It allows integration of multiple data types, including methylation data, gene annotations, and genomic coordinates [59]. The following example demonstrates creating a multi-track methylation visualization:
Advanced Track Customization
Gviz provides extensive customization options to enhance visual clarity and information density. These adjustments are particularly important when preparing figures for publication:
This multi-track visualization approach enables researchers to correlate methylation patterns with genomic context, revealing biologically significant relationships between methylation, gene expression, and regulatory elements.
Table 2: Essential Research Reagents and Computational Tools for Methylation Analysis
| Category | Item/Reagent | Function/Application | Example/Specification |
|---|---|---|---|
| Wet Lab Reagents | Sodium Bisulfite | Converts unmethylated cytosines to uracils | ≥97% purity for complete conversion |
| DNA Isolation Kits | High-quality genomic DNA extraction | Column-based methods for intact DNA | |
| Library Prep Kits | BS-seq library construction | Compatible with bisulfite-converted DNA | |
| Methylated Control DNA | Bisulfite conversion efficiency monitoring | Lambda phage DNA spiked into samples | |
| Bioinformatics Tools | Bismark Suite [56] | Read alignment & methylation calling | v0.23.0 with Bowtie2 support |
| methylKit [20] | Differential methylation analysis | R/Bioconductor package | |
| Gviz [59] | Genomic track visualization | R/Bioconductor package | |
| ViewBS [58] | Methylation visualization toolkit | Python/Perl based toolkit | |
| Reference Data | Reference Genome | Alignment and annotation | hg38, mm10, or relevant model system |
| Annotation Files | Genomic feature coordinates | GTF/GFF3 files from ENSEMBL/UCSC | |
| Methylation Atlas [55] | Normal cell type comparison | Human methylome atlas of 39 cell types |
Troubleshooting and Quality Control
Assessing Bisulfite Conversion Efficiency
Proper quality control is essential for reliable methylation analysis. A key metric is bisulfite conversion efficiency, which should exceed 99% [18]. This can be measured by spiking unmethylated λ-bacteriophage DNA into each sample and calculating the conversion rate of non-CpG cytosines:
Addressing Common Data Issues
M-bias plots generated by Bismark's methylation extractor help identify position-specific biases in methylation data, such as the 3'-end-repair bias common in paired-end sequencing [57]. If biases are detected in initial base positions, trim these positions using the --ignore option:
Additional quality metrics include assessing coverage distribution (minimum 10X recommended for most applications), checking for batch effects across samples, and verifying expected global methylation patterns (e.g., high CpG methylation in mammalian somatic cells).
Application in Research Context
The integration of methylation profiling with genomic track visualization enables diverse research applications. For example, the Human Methylation Atlas project utilized these approaches to identify cell-type-specific methylation markers across 39 normal human cell types [55]. Their analysis revealed that methylation patterns are extremely robust across individuals, with less than 0.5% of genomic blocks showing significant interindividual variation compared to 4.9% variation between different cell types.
In practice, these visualization techniques can help identify differentially methylated regions (DMRs) between experimental conditions, characterize epigenetic signatures in development and disease, and annotate novel regulatory elements based on their methylation status. The ability to visualize methylation data in genomic context remains crucial for generating biologically meaningful hypotheses from bisulfite sequencing experiments.
Solving Common Challenges in Bisulfite Sequencing Experiments and Analysis
Optimizing Bisulfite Conversion Efficiency and Preventing DNA Degradation
Bisulfite sequencing remains the gold standard for DNA methylation analysis, providing single-base resolution maps of 5-methylcytosine (5mC) distribution across the genome. The fundamental principle relies on the differential reactivity of bisulfite with cytosine versus 5-methylcytosine: unmethylated cytosines are converted to uracils (which read as thymines after PCR amplification), while methylated cytosines remain unchanged. However, this process presents two significant challenges that researchers must carefully balance – achieving complete conversion while minimizing DNA degradation. The harsh chemical conditions required for efficient deamination inevitably cause DNA fragmentation, strand breakage, and subsequent sample loss, particularly problematic with limited or degraded starting materials such as cell-free DNA or archival FFPE samples. This application note provides detailed protocols and data-driven recommendations for optimizing this critical step in epigenetic research.
The Critical Balance: Conversion Efficiency versus DNA Integrity
The bisulfite conversion process involves a series of chemical reactions that create inherent tension between conversion efficiency and DNA preservation. Under acidic conditions, cytosine undergoes sulfonation at the C5-C6 double bond, followed by hydrolytic deamination to yield a uracil-sulfonate intermediate, and finally alkaline desulfonation to produce uracil. Competing with this desired pathway is the depyrimidination reaction, which leads to DNA backbone cleavage and fragmentation [60].
The degree of DNA degradation during conventional bisulfite treatment is substantial. Historical data indicates that 84-96% of DNA is degraded under standard conversion conditions, with fragmentation producing fragments averaging only 600 base pairs [61]. For cell-free DNA, which already has an average size of 180 base pairs, this degradation presents particularly serious challenges for downstream analysis [62].
Table 1: Comparative Performance of DNA Conversion Methods
| Parameter | Bisulfite Conversion | Enzymatic Conversion |
|---|---|---|
| Conversion Principle | Chemical deamination | TET oxidation + APOBEC deamination |
| DNA Input Range | 500 pg - 2 μg | 10 - 200 ng |
| Typical Conversion Efficiency | >99% | >99% |
| DNA Recovery | 130% (overestimated) | 40% |
| Fragmentation Index | 14.4 ± 1.2 (high) | 3.3 ± 0.4 (low-medium) |
| Protocol Duration | ~16 hours (including incubation) | ~4.5 hours |
| Degraded DNA Compatibility | Limited | High |
Recent technological advances have introduced enzymatic conversion methods as an alternative to chemical bisulfite treatment. As shown in Table 1, while both methods achieve similar conversion efficiencies (>99%), they differ significantly in their impact on DNA integrity. Bisulfite conversion demonstrates higher DNA recovery but causes extensive fragmentation, whereas enzymatic conversion preserves DNA integrity better but has lower recovery rates [63]. This makes enzymatic conversion particularly suitable for analyzing degraded DNA such as forensic samples or cell-free DNA.
Optimized Bisulfite Conversion Protocols
Rapid High-Temperature Bisulfite Conversion
The relationship between conversion time and temperature has been systematically investigated, revealing that elevated temperatures can dramatically reduce required incubation periods while maintaining high conversion efficiency.
Table 2: Time-Temperature Optimization for Bisulfite Conversion
| Temperature | Time for Complete Conversion | Conversion Efficiency | DNA Recovery |
|---|---|---|---|
| 55°C | 4-18 hours | >99% | Low (high degradation) |
| 70°C | 30 minutes | >99% | 65% (cfDNA) |
| 90°C | 10 minutes | >99% | Moderate |
| 98°C | 3-10 minutes | >99% | Moderate to high |
Protocol: Ultrafast Bisulfite Conversion for Cell-Free DNA
Sample Preparation: Extract cell-free DNA from 3 mL plasma using a specialized circulating DNA kit. Elute in 20 μL of elution buffer [62].
Reaction Setup:
- Add 130 μL of 10 M ammonium bisulfite-sodium bisulfite solution to 20 μL of cfDNA sample
- For ammonium salt-based recipes: use 10:1 (vol/vol) ratio of 70% and 50% ammonium bisulfite [60]
Incubation:
- Option A: 70°C for 30 minutes
- Option B: 90°C for 10 minutes
- Perform in a thermal cycler with heated lid to prevent evaporation
Purification:
- Use silica column-based purification (Zymo-Spin IC Columns)
- Bind converted DNA to column matrix
- Wash with appropriate buffers
- Perform on-column desulfonation with alkaline solution
- Elute in 20 μL of elution buffer [62]
Quality Control:
- Assess conversion efficiency using droplet digital PCR with conversion-specific primers
- Verify DNA recovery and fragmentation index
This optimized protocol achieves complete cytosine conversion in just 30 minutes at 70°C or 10 minutes at 90°C, with approximately 65% recovery of bisulfite-treated cell-free DNA – significantly higher than conventional methods [62].
Commercial Kit Modifications for Enhanced Performance
Several commercial kits offer optimized chemistries for balancing conversion efficiency with DNA preservation:
EpiTect Fast Bisulfite Kit Protocol:
- Utilize integrated DNA Protect Buffer to minimize fragmentation
- Process samples through streamlined spin-column procedure
- Complete entire conversion and purification process in 30-40 minutes
- Achieve conversion rates exceeding 99% even with challenging samples like X-chromosome DNA [64]
UBS-seq Method for Maximum Efficiency:
- Employ highly concentrated ammonium bisulfite/sulfite recipes (up to 10 M)
- Perform conversion at 98°C for 3-10 minutes
- Use rapid desulfonation conditions
- This approach reduces DNA damage by ~13-fold compared to conventional BS-seq while maintaining complete conversion [60]
Quality Control and Assessment Methods
Rigorous quality control is essential for reliable methylation analysis. The qBiCo (quantitative Bisulfite Conversion) assay provides a multiplex qPCR approach to assess multiple conversion parameters simultaneously [63]:
Conversion Efficiency Assessment:
- Target multi-copy LINE-1 repetitive elements with both genomic and converted sequence assays
- Calculate efficiency based on ratio of converted to unconverted signals
- Acceptable threshold: >99% conversion
DNA Recovery Quantification:
- Target converted version of single-copy hTERT gene
- Compare to non-converted control samples
- Account for potential overestimation in bisulfite conversion (approximately 130% reported)
Fragmentation Analysis:
- Employ both short (hTERT) and long (TPT1) amplicon assays
- Calculate fragmentation index based on ratio of long to short amplicon recovery
- Lower values indicate more severe fragmentation
For droplet digital PCR-based quality assessment:
Design three primer sets targeting the same genomic region:
- MLH1 UF/MLH1 R: Detects DNA regardless of deamination status
- MLH1 DF/MLH1 R: Specific for deaminated DNA
- MLH1 UDF/MLH1 R: Specific for undeaminated DNA
Perform absolute quantification using ddPCR systems
Calculate conversion efficiency = (deaminated DNA concentration / total DNA concentration) × 100% [62]
Computational Considerations for Downstream Analysis
The impact of conversion efficiency and DNA degradation extends to computational analysis of bisulfite sequencing data. Incomplete conversion manifests as increased cytosines in expectedly non-methylated contexts, while excessive fragmentation reduces coverage and creates mapping challenges.
Recommended bioinformatics approaches include:
Alignment: BatMeth2 algorithm provides indel-sensitive mapping specifically designed for bisulfite-converted reads, improving alignment accuracy in regions with structural variations [16]
Differential Methylation Analysis: DSS package employing beta-binomial models accounts for biological variation and provides robust differential methylation calling, particularly important with limited replicates [65]
Quality Filtering: Implement stringent thresholds based on conversion efficiency metrics, excluding sites with evidence of incomplete conversion
The Scientist's Toolkit: Essential Research Reagents
Table 3: Key Reagents for Optimized Bisulfite Conversion
| Reagent / Kit | Primary Function | Application Notes |
|---|---|---|
| Ammonium Bisulfite Salts | High-concentration conversion reagent | Enables ultrafast protocols at elevated temperatures |
| DNA Protect Buffer | Minimizes DNA fragmentation | Proprietary formulation in EpiTect kits preserves DNA integrity |
| Silica-based Columns | Purification of converted DNA | Efficient binding of single-stranded converted DNA |
| Carrier RNA | Improves recovery of low-input samples | Added during purification to minimize sample loss |
| Droplet Digital PCR Assays | Quality control assessment | Provides absolute quantification of conversion efficiency |
| NEBNext Enzymatic Conversion Module | Enzyme-based conversion alternative | Reduces DNA fragmentation for sensitive samples |
| Calcium adipate | Calcium Adipate|CAS 7486-40-0|For Research | |
| (+)-Eremophilene | (+)-Eremophilene, MF:C15H24, MW:204.35 g/mol | Chemical Reagent |
Successful bisulfite sequencing requires careful optimization of the conversion step to balance the competing demands of complete cytosine deamination and DNA integrity preservation. The protocols presented here demonstrate that through optimized reagent formulations, temperature modulation, and appropriate quality control measures, researchers can significantly improve conversion outcomes. For the most demanding applications involving limited or degraded DNA samples, enzymatic conversion methods provide a valuable alternative that minimizes DNA damage while maintaining high conversion efficiency. By implementing these optimized approaches and rigorous quality assessment, researchers can generate more reliable DNA methylation data for basic research and drug development applications.
Addressing PCR Amplification Issues with Bisulfite-Converted DNA
The analysis of DNA methylation patterns via bisulfite sequencing is a cornerstone of epigenetics research, pivotal for understanding gene regulation, cellular differentiation, and disease mechanisms such as cancer [2] [3]. The process relies on the treatment of DNA with sodium bisulfite, which selectively deaminates unmethylated cytosines to uracils, while methylated cytosines remain protected and unconverted [5] [4]. Subsequent PCR amplification and sequencing then reveal the methylation status at single-nucleotide resolution.
However, the bisulfite conversion process itself introduces significant technical challenges for subsequent PCR amplification. The chemical treatment is harsh, leading to substantial DNA fragmentation and degradation—in some cases, DNA degradation can reach up to 90% [66] [5]. Furthermore, the conversion of most cytosines to uracils (which are amplified as thymines) results in a dramatic reduction of sequence complexity, creating a DNA template that is AT-rich and no longer resembles native DNA [2] [66] [5]. This loss of complexity complicates primer design, increases the potential for non-specific amplification, and generally reduces PCR efficiency and reliability. This application note details the primary challenges and provides optimized protocols to ensure robust and accurate amplification of bisulfite-converted DNA, a critical step for generating high-quality DNA methylation data.
Troubleshooting Common PCR Issues
The following table summarizes the primary challenges encountered during PCR of bisulfite-converted DNA and their respective underlying causes.
Table 1: Common PCR Challenges with Bisulfite-Converted DNA and Their Causes
| Common Challenge | Primary Cause |
|---|---|
| Low or No Amplification | DNA degradation during bisulfite treatment; inefficient primer binding due to low template complexity [66] [5]. |
| Non-specific Amplification & Primer Dimers | AT-rich nature of converted DNA reduces primer specificity; use of non-optimized polymerases [66] [67]. |
| Biased Amplification | Suboptimal annealing temperatures; primers that favor either methylated or unmethylated templates [66] [68]. |
| Inconsistent Results | Variable quality of bisulfite-converted DNA template; insufficient optimization of PCR conditions [69]. |
Optimized Primer Design
The design of primers for bisulfite-converted DNA is arguably the most critical factor for success. Because the converted template is AT-rich and the two DNA strands are no longer complementary, standard primer design rules do not apply [66].
Key Guidelines for Bisulfite PCR Primer Design:
- Primer Length: Design longer primers, typically 26–35 bases, to compensate for the reduced sequence complexity and to achieve a higher melting temperature (Tm) [2] [66] [67].
- CpG Site Consideration: Primers should ideally avoid CpG sites altogether to ensure unbiased amplification of both methylated and unmethylated sequences. If a CpG must be included, it should be positioned near the 5'-end of the primer, and a mixed base (e.g., Y for C/T or R for A/G) should be used to accommodate both possibilities [66] [67].
- Sequence Conversion for Design: When designing primers, it is essential to in silico convert the original genomic sequence by changing all non-CpG cytosines to thymines (for the top strand) or guanines to adenines (for the bottom strand). The primer sequence should then be derived from this converted sequence [66] [67].
- Melting Temperature (Tm): Target a primer Tm of ≥55–60°C. The longer primer length helps achieve this, and incorporating as many guanines as possible can further increase the Tm [66] [67].
Methylation-Specific PCR (MSP) Primer Design: For MSP, which aims to amplify only fully methylated or fully unmethylated sequences, the design principles differ. The CpG sites of interest must be included at the 3'-end of the primer to confer specificity. Two separate primer sets are required: one with cytosines at the CpG sites to detect methylated alleles, and another with thymines to detect unmethylated alleles [4].
PCR Components and Conditions
Selecting the right enzymatic components and optimizing thermal cycling parameters are crucial for overcoming the inherent difficulties of amplifying bisulfite-converted DNA.
Polymerase Selection:
- Hot-Start Polymerase: A hot-start high-fidelity polymerase is strongly recommended. This technology minimizes non-specific amplification and primer-dimer formation by preventing polymerase activity until the first high-temperature denaturation step [66] [69] [67].
- Note on Proof-Reading Polymerases: Standard proof-reading polymerases are not recommended as they may not efficiently read through uracil residues present in the converted DNA template [69].
Amplicon Size: Due to the fragmentation caused by bisulfite treatment, target smaller amplicon sizes. A range of 150–300 bp is widely recommended for optimal efficiency, though with optimized protocols, amplicons up to 500 bp can be achieved [66] [69] [67].
PCR Cycle Conditions:
- Annealing Temperature: This is a key parameter for success. Begin with an annealing temperature 5°C above the calculated Tm of your primers and perform a temperature gradient PCR (e.g., from 55°C to 65°C) to empirically determine the optimal temperature that provides specific amplification [66] [67].
- Cycle Number: A higher number of PCR cycles (e.g., 35–40 cycles) is often necessary to generate sufficient product from the fragmented and damaged template [2] [66].
The following workflow diagram summarizes the key decision points and optimization strategies for a successful bisulfite PCR experiment.
Detailed Experimental Protocol
Optimized Bisulfite PCR Amplification Protocol
This protocol is designed for the amplification of a specific locus from bisulfite-converted genomic DNA.
Materials & Reagents:
- Template DNA: Bisulfite-converted DNA, purified and eluted in water or TE buffer. Input 2–4 µL per PCR reaction (total DNA < 500 ng) [69].
- Primers: Forward and reverse primers, designed according to Section 2.1, resuspended in nuclease-free water.
- PCR Master Mix: A reliable hot-start polymerase master mix (e.g., Platinum Taq, ZymoTaq).
- Nuclease-Free Water.
Procedure:
- Prepare Reaction Mix: On ice, assemble the following components in a PCR tube:
- Nuclease-Free Water: to a final volume of 25 µL
- 5x Hot-Start Polymerase Master Mix: 5 µL
- Forward Primer (10 µM): 0.5 µL
- Reverse Primer (10 µM): 0.5 µL
- Bisulfite-Converted DNA Template: 2–4 µL
- Thermal Cycling: Place the tubes in a thermal cycler and run the following program:
- Initial Denaturation: 95°C for 2–5 minutes (activates hot-start polymerase).
- Amplification (35–40 cycles):
- Denaturation: 95°C for 15–30 seconds.
- Annealing: Use a gradient from 55°C to 65°C for 30–45 seconds. The optimal temperature must be determined empirically.
- Extension: 72°C for 20–30 seconds (adjust based on amplicon size; ~1 minute/kb).
- Final Extension: 72°C for 5–10 minutes.
- Hold: 4°C ∞.
- Analysis: Analyze 5 µL of the PCR product by agarose gel electrophoresis to verify specific amplification of the desired product.
Advanced Method: COLD-MS-PCR for Enrichment of Rare Alleles
For applications requiring the detection of rare unmethylated alleles in a background of predominantly methylated DNA (or vice versa), such as in cancer biomarker discovery, Co-amplification at Lower Denaturation temperature PCR (COLD-PCR) can be employed [68].
Principle: This method exploits the slight difference in melting temperature (Tm) between sequences derived from methylated (higher GC content, higher Tm) and unmethylated (lower GC content, lower Tm) alleles after bisulfite conversion. By performing the PCR denaturation step at a critical temperature (Tc) below the actual melting temperature, it preferentially denatures and amplifies the unmethylated (lower Tm) alleles [68].
Procedure:
- Primary PCR: Perform an initial standard PCR to amplify the region of interest from bisulfite-converted DNA.
- Nested COLD-MS-PCR:
- Use a nested primer set to improve specificity.
- The thermal cycling protocol involves:
- 5 cycles of conventional PCR (with denaturation at ~95°C).
- 35 cycles of COLD-PCR, where the denaturation step is performed at the predetermined critical denaturation temperature (Tc), typically ~2–5°C below the Tm of the unmethylated allele. This step enriches the unmethylated sequences [68].
- The resulting product can be analyzed by sequencing or high-resolution melt analysis.
The Scientist's Toolkit: Essential Reagents
The following table lists key reagents and their critical functions for successful PCR amplification of bisulfite-converted DNA.
Table 2: Essential Research Reagent Solutions for Bisulfite PCR
| Reagent / Material | Function & Importance | Recommendations |
|---|---|---|
| Hot-Start DNA Polymerase | Critical for specificity. Remains inactive until high temperature is reached, minimizing non-specific priming and primer-dimer formation. | Platinum Taq, AccuPrime Taq, or polymerases specifically optimized for bisulfite templates (e.g., ZymoTaq) [69] [67]. |
| Bisulfite Conversion Kit | Ensures efficient and complete conversion of unmethylated cytosines while minimizing DNA degradation. | Kits with optimized, pre-mixed reagents (e.g., EZ DNA Methylation-Lightning Kit) are recommended for consistency and ease of use [66]. |
| Optimized Primer Pairs | Specifically designed to bind the converted, complexity-reduced DNA sequence with high specificity and without bias. | Follow guidelines in Section 2.1. Use tools like MethPrimer for in silico design and validation [67]. |
| Template DNA | High-quality bisulfite-converted DNA is the starting point. Purity and concentration impact PCR success. | Ensure DNA is free of contaminants. Use 2-4 µL of eluted DNA per 25 µL PCR reaction. Avoid overloading template (<500 ng) [69]. |
Managing Low-Coverage Regions and Interpreting Missing Data
Whole-genome bisulfite sequencing (WGBS) has emerged as the gold standard for base-pair resolution quantification of DNA methylation, providing critical insights into gene regulation, cell differentiation, and disease mechanisms [20] [70]. However, a significant challenge in WGBS analysis is the prevalence of low-coverage regions and missing data, which arises from technical and biological variability. Even in deeply sequenced genomes, a substantial proportion of cytosines may have insufficient read coverage for reliable methylation quantification. For example, in the comprehensively sequenced GM12878 and H1-hESC cell lines from the ENCODE database, approximately 4% of CpG sites have coverages ≤3, making their methylation levels statistically unreliable [71]. This problem becomes exponentially worse when comparing multiple samples, as in population studies, where over 90% of cytosines may have missing data in at least one sample when examining 100 accessions [72]. The fundamental issue stems from the proportional nature of methylation measurement: at low coverage, the possible methylation values are severely constrained. A site covered by only four reads can only take one of five possible values (0.00, 0.25, 0.50, 0.75, or 1.00), fundamentally limiting detection of small but biologically relevant methylation differences [73]. This application note provides a comprehensive framework for managing these limitations through computational imputation, strategic filtering, and appropriate interpretation of missing data patterns.
Understanding Coverage Distribution and Its Impact on Statistical Power
The distribution of read depth across cytosine sites follows a negative binomial distribution, with substantial variability in coverage across the genome [73]. This distribution creates inherent challenges for detecting differentially methylated regions (DMRs), as power is strongly influenced by both experimental parameters (read depth, missing data, sample size) and biological factors (mean methylation level, effect size between groups). The relationship between read depth and detection power is not linear; there are diminishing returns beyond certain coverage thresholds, and the optimal balance depends on the specific biological question.
Table 1: Impact of Read Depth on Methylation Measurement Precision
| Read Depth | Possible Methylation Values | Minimum Detectable Difference | Typical Use Case |
|---|---|---|---|
| 1-4 reads | 0, 0.25, 0.5, 0.75, 1.0 | >25% | Filtered out in most analyses |
| 5-10 reads | 11 possible values | ~10-20% | Minimum threshold for inclusion |
| 10-20 reads | 21 possible values | ~5-10% | Cost-effective for large studies |
| 20-30 reads | 31 possible values | ~3-5% | Recommended for differential methylation |
| >30 reads | Continuous approximation | <3% | Gold standard for precise quantification |
The appropriate minimum read depth threshold depends heavily on the expected methylation differences and sample size. For studies aiming to detect small differences (<5%), which are common in complex phenotypes, higher read depths (>20X) are essential [73]. Conversely, for large-effect differences, lower thresholds may be sufficient. This relationship underscores the importance of power calculations in study design, rather than relying on arbitrary coverage thresholds.
Computational Imputation Methods for Missing Methylation Data
Imputation methods provide a powerful strategy for addressing missing data by leveraging patterns from observed methylation values and genomic context. These methods can be broadly categorized into three classes: Hidden Markov Model (HMM)-based approaches that model methylation states along the genome, deep learning methods that leverage both sequence context and neighboring methylation patterns, and statistical imputation techniques adapted from other genomics domains. The performance of each method varies depending on the mechanism of missingness, methylation context (CpG, CHG, CHH), and the specific genomic region.
Table 2: Comparison of Methylation Imputation Methods
| Method | Algorithm Type | Input Requirements | Strengths | Limitations |
|---|---|---|---|---|
| METHimpute [72] | Hidden Markov Model | Methylated/unmethylated read counts | Provides complete methylomes, works with low coverage (≥6X), extensive validation in plants | May require genome annotation for optimal performance |
| RcWGBS [71] | Convolutional Neural Network (CNN) | Methylation levels of adjacent sites (100bp window) and DNA sequence (101bp) | High accuracy at 12X coverage, incorporates sequence features, does not require other omics data | Computationally intensive, requires sufficient training data |
| methyLImp [74] | Regression-based | Methylation β-values from multiple samples | Specifically designed for methylation data, handles multiple missingness mechanisms | Performance depends on sample size and correlation structure |
| missForest [74] | Random Forest | Methylation β-values or M-values | Non-parametric, handles complex interactions | Computationally intensive for large datasets |
| softImpute [74] | Matrix Completion | Methylation matrix with missing values | Scalable to large datasets, efficient implementation | Assumes low-rank matrix structure |
Performance Under Different Missing Data Mechanisms
The effectiveness of imputation methods depends critically on the nature of the missing data, which falls into three categories: Missing Completely at Random (MCAR), where missingness is independent of observed or unobserved data; Missing at Random (MAR), where missingness may depend on observed variables but not the missing values themselves; and Missing Not at Random (MNAR), where missingness depends on the unobserved methylation values themselves [74]. Empirical evaluations demonstrate that β-values generally enable better imputation performance than M-values, contrary to theoretical expectations based on homoscedasticity [74]. Additionally, mid-range β-values (0.4-0.6) are consistently harder to impute accurately than values at the extremes (0-0.2 or 0.8-1.0), with regression-based methods typically outperforming other approaches across missingness mechanisms.
Experimental Protocols for Managing Low-Coverage Data
Quality Control and Filtering Protocol
A standardized quality control protocol is essential for managing technical variability while preserving biological signal. The following step-by-step protocol ensures reproducible processing of bisulfite sequencing data:
Initial Alignment and Methylation Calling: Process raw FASTQ files using a bisulfite-aware aligner such as Bismark [20] [75] with default parameters. Generate per-sample coverage files containing methylated and unmethylated read counts for each cytosine.
Bisulfite Conversion Efficiency Assessment: Calculate the non-conversion rate using reads mapping to the chloroplast genome (plants) or synthetic spike-ins. Accept samples with conversion rates ≥99% [76] [77].
Coverage Distribution Analysis: Use tools like MethCoverage from ViewBS [76] to assess read coverage distribution across cytosine contexts. Generate cumulative distribution plots to visualize the proportion of cytosines at different coverage thresholds.
Sample-level Filtering: Remove samples with inadequate sequencing depth (typically <10X average genome-wide coverage) or extreme outlier values in quality metrics (bisulfite conversion rate, alignment rate, coverage distribution).
Cytosine-level Filtering: Apply minimum read depth thresholds informed by power calculations. The POWEREDBiSeq tool [73] can determine study-specific optimal thresholds, but general guidelines suggest:
- 5X minimum for exploratory analyses
- 10X minimum for differential methylation screening
- 15-20X minimum for precise quantification of small effects
Site-level Filtering: Retain only cytosines with coverage above threshold in a minimum proportion of samples (e.g., 80%) to ensure sufficient observations for comparative analyses.
Imputation Implementation Protocol
For studies where filtering would unacceptably reduce genomic coverage, implement imputation using the following protocol:
Data Preparation: Convert methylation data to appropriate format (β-values recommended [74]). For RcWGBS, extract methylation levels in 100bp windows centered on each CpG and encode DNA sequences using 2-mer representation [71].
Method Selection: Choose imputation method based on data characteristics:
Model Training: For supervised methods (RcWGBS), train models on high-coverage sites, using 80% of data for training and 20% for validation. Ensure training data represents all genomic contexts (promoters, gene bodies, intergenic).
Application and Validation: Apply trained models to impute missing values. Validate imputation accuracy by comparing imputed values with held-out high-coverage sites or through downsampling experiments.
Sensitivity Analysis: Conduct downstream analyses with and without imputed data to assess robustness of findings to imputation method.
Decision Framework for Managing Low-Coverage BS-seq Data
The Scientist's Toolkit: Essential Research Reagents and Computational Tools
Successful management of low-coverage regions requires both experimental reagents and computational resources. The following toolkit outlines essential components for a robust bisulfite sequencing study design:
Table 3: Research Reagent and Computational Solutions
| Tool/Reagent | Type | Function | Application Context |
|---|---|---|---|
| Bismark [20] [75] | Software | Bisulfite-read aligner and methylation caller | All BS-seq protocols, base-resolution methylation quantification |
| ViewBS [76] | Software | Visualization and quality control toolkit | Data exploration, quality assessment, publication-ready figures |
| METHimpute [72] | R/Bioconductor Package | Hidden Markov Model for methylation imputation | Plant methylomes, low-coverage WGBS data (≥6X) |
| RcWGBS [71] | R Package | CNN-based methylation imputation | Mammalian methylomes, incorporation of sequence context |
| POWEREDBiSeq [73] | Software Tool | Power calculation for BS-seq studies | Study design, optimal read depth determination |
| scmeth [75] | R/Bioconductor Package | Quality control for large methylation datasets | Single-cell BS-seq, large sample sets |
| CpG Methylation Spike-ins | Experimental Reagent | Bisulfite conversion efficiency control | All BS-seq protocols, quality assurance |
| Size-selected Libraries | Experimental Preparation | Reduced representation approaches | RRBS, cost-effective targeted methylation analysis |
Managing low-coverage regions and interpreting missing data requires a holistic approach that begins with experimental design and continues through computational analysis. The strategic integration of appropriate filtering thresholds, informed by power considerations rather than arbitrary cutoffs, combined with selective application of imputation methods tailored to the specific missingness patterns in the data, enables researchers to maximize the biological insights gained from bisulfite sequencing experiments. As sequencing costs continue to decrease and computational methods advance, the field is moving toward standardized practices that explicitly account for coverage limitations while maintaining statistical rigor. By implementing the protocols and decision frameworks outlined in this application note, researchers can navigate the challenges of incomplete methylomes while producing robust, reproducible results that advance our understanding of epigenetic regulation in health and disease.
Correcting for Position-Specific Methylation Bias in Sequencing Reads
Position-specific bias in bisulfite sequencing data refers to the non-uniform representation of nucleotide sequences caused by technical artefacts rather than biological truth. These biases can lead to inaccurate methylation calling, significantly affecting downstream analysis and interpretation. In whole-genome bisulfite sequencing (WGBS), bisulfite conversion itself is the primary trigger of pronounced sequencing biases, with PCR amplification building upon these underlying artefacts [14]. The majority of standard library preparation methods yield significantly biased sequence output and overestimate global methylation levels, with both absolute and relative methylation levels at specific genomic regions varying substantially between methods [14]. Similar biases affect other bisulfite sequencing approaches, including Reduced Representation Bisulfite Sequencing (RRBS), where specific protocol steps can introduce systematic errors [78].
Understanding and correcting these biases is crucial for researchers, scientists, and drug development professionals working with DNA methylation data, as uncorrected biases can lead to false positives in differential methylation analysis and erroneous biological conclusions.
The table below summarizes the primary sources of position-specific biases in bisulfite sequencing methodologies:
Table 1: Major Sources of Position-Specific Bias in Bisulfite Sequencing
| Bias Source | Sequencing Method | Key Characteristics | Impact on Data |
|---|---|---|---|
| BS-Induced DNA Degradation [14] | Primarily WGBS | Selective, context-specific DNA fragmentation; greater loss of cytosine-rich fragments | Skewed genomic representation; overestimation of absolute 5mC values |
| PCR Amplification [14] | All BS-seq methods | Builds upon biases introduced by BS conversion; polymerase sequence preferences | Exacerbates underlying sequence representation artefacts |
| End-Repair Cytosines [78] | RRBS | Non-trimmed cytosines added during end-repair step at 3' ends | False positive DMS calls; inaccurate methylation quantification |
| Library Preparation Strategy [14] | WGBS | Varies between pre-BS and post-BS protocols; differences in DNA denaturation methods | Pronounced differences in sequence coverage and methylation output |
Bisulfite Conversion as a Primary Bias Source
BS-induced DNA fragmentation was initially attributed to purine loss but is now known to result from random base loss at unmethylated cytidines, causing backbone breakage upon exposure to heat and alkali [14]. This cytosine-specific effect creates two key biases: (1) depletion of cytosine-rich DNA from the total sequence pool, resulting in skewed genomic sequence representation; and (2) depletion of unmethylated fragments, leading to overestimation of absolute 5mC values [14].
Experimental evidence using synthetic DNA fragments of low (15%, 'C-poor') or high (30%, 'C-rich') cytosine content revealed that fragment recovery was significantly biased, with twofold higher recovery of C-poor fragments compared to C-rich fragments when using heat-based BS treatment [14]. This bias was reduced but not eliminated with milder alkaline denaturation protocols.
RRBS-Specific Trimming Biases
In RRBS, a specific bias occurs during library preparation when MspI-digested DNA undergoes end-repair that adds a cytosine to the 3' end of fragments. While specialized trimming tools (e.g., Trim Galore with '—rrbs' option) aim to remove these bases, they frequently fail to do so when adapter sequences are not detected, particularly when the 3' end of the read aligns exactly with the MspI site [78]. These non-trimmed cytosines, which are unmethylated by design, are then considered in methylation calling, artificially decreasing observed methylation levels at affected CpG sites and leading to erroneous identification of differentially methylated sites (DMS) [78].
Detection and Diagnostic Methods
Sequence Coverage Analysis
A robust approach for detecting BS-induced biases involves analyzing sequence coverage in genomic regions with substantial differences in cytosine content between strands. Analysis of amplification-free PBAT datasets (to exclude PCR interference) at mouse major satellites and mitochondrial DNA revealed significantly higher coverage of C-poor strands (12-14% cytosine) compared to C-rich strands (23-24% cytosine) [14]. This strand asymmetry provides clear evidence of sequence-specific bias introduced during library preparation.
K-mer Frequency Analysis
Position-specific nucleotide biases can be characterized by computing the frequency of every k-mer (motifs of length k) in non-overlapping k-nucleotide windows across read positions. This approach calculates the relative frequency of a k-mer at specific offsets from the aligned read location, creating a feature space that can be analyzed using principal component analysis (PCA) [79]. Studies applying this method have found that the first two principal components often explain over 92% of variation, with clustering by assay type rather than biological variables, confirming the technical nature of these biases [79].
Integrated Bias Detection Tools
To aid with quality assessment of existing WGBS datasets, a bias diagnostic tool has been integrated into the Bismark package [14]. This implementation provides researchers with standardized methods for identifying position-specific biases without requiring custom bioinformatics pipelines.
Correction Methodologies and Protocols
Improve-RRBS: A Specialized Correction Tool
The improve-RRBS python package specifically addresses 3' end-repair cytosine bias in RRBS data. The tool can be seamlessly implemented in existing RRBS analysis pipelines and processes aligned BAM files to identify and mask problematic cytosines from methylation calling [78].
Table 2: Improve-RRBS Implementation Protocol
| Step | Tool/Action | Key Parameters | Output |
|---|---|---|---|
| Quality Control & Trimming | Trim Galore (v0.6.10+) | —rrbs option enabled |
Trimmed FASTQ files |
| Alignment | Bismark (v0.24.2+) | Default parameters | Aligned BAM files |
| Bias Correction | improve-RRBS | Input: sorted BAM file; Requires chrom.sizes and genome file | Corrected BAM file |
| Methylation Calling | methylKit (v1.28.0+) | Minimum 10x coverage per CpG; CpG context only | Methylation status per cytosine |
The improve-RRBS algorithm identifies whether reads are single-end (SE) or paired-end (PE), with only R1 reads processed for PE data since R2 reads are typically properly trimmed when the '—rrbs' option is used. The tool extracts genomic sequences around unique mapping locations and identifies reads where the 3' end overlaps with a genomic MspI site (CCGG). For these reads, it modifies the XM tag in the BAM file to mask the methylation status of the affected nucleotides, effectively preventing them from influencing methylation level calculations [78].
Read Weighting Approaches
For general nucleotide-specific bias correction across multiple sequencing assays, a read weighting method can be applied. This approach:
- Calculates position-specific k-mer frequencies across all reads [79]
- Establishes expected baseline frequencies by random sampling from within all reads and a 50-bp margin around each read [79]
- Identifies significantly biased tiles where variance exceeds the 95% confidence threshold of baseline variance [79]
- Computes pairwise covariance between k-mer frequencies of all biased tiles [79]
- Generates read-specific weights that adjust for over- or underrepresentation of specific k-mers [79]
This method implicitly corrects for multiple sources of bias without requiring specific knowledge of their origin, making it applicable to various HTS assays including DNase-seq, ChIP-seq, FAIRE-seq, and ATAC-seq [79].
Library Preparation Optimization
Fundamental corrections can be achieved through optimized experimental protocols:
- Amplification-free approaches: PBAT (Post-Bisulfite Adaptor Tagging) methods minimize PCR-induced biases that build upon BS-conversion artefacts [14]
- BS conversion condition selection: Alkaline denaturation protocols show higher recovery and reduced bias across cytosine contents compared to heat-based denaturation [14]
- Polymerase selection: Using low-bias polymerases like KAPA HiFi Uracil+ instead of standard Pfu Turbo Cx polymerase reduces amplification biases [14]
Experimental Workflow for Bias Correction
The following workflow provides a comprehensive approach for identifying and correcting position-specific methylation biases:
Research Reagent Solutions
Table 3: Essential Research Reagents for Bias-Aware Bisulfite Sequencing
| Reagent/Category | Specific Examples | Function/Role in Bias Correction |
|---|---|---|
| Bisulfite Conversion Kits | Various commercial kits with alkaline denaturation | Reduce cytosine-specific degradation; improve recovery of C-rich fragments [14] |
| High-Fidelity Polymerases | KAPA HiFi Uracil+ [14] | Minimize amplification biases building on BS-conversion artefacts; reduce sequence preferences |
| Specialized Trimming Tools | Trim Galore (with --rrbs option) [78] | Remove end-repair cytosines in RRBS data; require complementary tools for complete correction |
| Bias Correction Software | improve-RRBS python package [78] | Identify and mask non-trimmed 3' end-repair cytosines in RRBS data |
| Alignment Tools | Bismark, bwa-meth [20] | Specific handling of bisulfite-converted reads; accurate mapping of C→T conversions |
| Methylation Calling Packages | methylKit [20] [78] | Differential methylation analysis with statistical controls; supports coverage filters |
| Spiked-In Controls | Completely methylated/unmethylated DNA [2] | Assess conversion efficiency; provide internal standards for normalization |
| Quality Control Tools | FastQC [2] | Initial assessment of read quality; identify adapter contamination and position-specific quality issues |
Validation and Quality Control
Pre- and Post-Correction Metrics
Effective bias correction requires rigorous validation through specific quality metrics:
- Conversion efficiency: Assess the proportion of unmethylated cytosines converted to uracils using spiked-in controls or native genomic regions known to be unmethylated [2]. Efficiency should exceed 99% for accurate methylation analysis.
- Strand balance: Calculate the ratio of coverage between C-poor and C-rich strands in reference regions like major satellites or mitochondrial DNA. This asymmetry should decrease following successful correction [14].
- False positive reduction: In RRBS, monitor the reduction of apparently differentially methylated sites (DMS) at fixed intervals (e.g., 50 nucleotides apart) that characterize end-repair artefacts [78].
Differential Methylation Analysis Considerations
When performing differential methylation analysis post-correction:
- Apply minimum coverage thresholds (typically ≥10 reads per CpG) to ensure statistical reliability [78]
- Use over-dispersion correction in statistical models to account for remaining technical variability [78]
- For regional analysis, implement tiling window approaches (e.g., 1000bp windows with 200bp steps) requiring minimum CpG density (e.g., 5 CpGs per window) [78]
Position-specific biases represent a significant challenge in bisulfite sequencing data analysis, potentially compromising the accuracy of methylation quantification and leading to erroneous biological conclusions. The integration of computational corrections like improve-RRBS for specific protocol artefacts, coupled with optimized experimental designs such as amplification-free library preparation and careful selection of bisulfite conversion conditions, provides researchers with a comprehensive toolkit for mitigating these biases. As bisulfite sequencing continues to be widely adopted in both basic research and clinical applications, rigorous attention to position-specific biases remains essential for generating reliable, reproducible DNA methylation data.
Batch Effect Correction and Normalization Strategies for Robust Data
The integration of genomics data is routinely hindered by unwanted technical variations known as batch effects [80]. In DNA methylation studies, particularly those utilizing bisulfite sequencing technologies, these non-biological variations can arise from differences in bisulfite conversion efficiency, reagent lots, laboratory conditions, experiment timing, personnel, or sequencing platforms [80] [81]. Failure to address batch effects can obscure true biological signals, impeding the accuracy and reproducibility of downstream analyses [80]. This application note provides detailed protocols for identifying, correcting, and normalizing batch effects in DNA methylation data derived from bisulfite sequencing research, framed within the context of a robust analytical workflow essential for researchers, scientists, and drug development professionals.
The fundamental challenge stems from the unique nature of DNA methylation data. Data from platforms like the Illumina Infinium HumanMethylation450 BeadChip or whole-genome bisulfite sequencing (WGBS) consist of methylation percentages (β-values) representing the proportion of methylated alleles at specific genomic loci [80] [82]. These β-values are constrained within the 0-1 range, and their underlying distribution often deviates from Gaussian distribution, exhibiting skewness and over-dispersion [80]. Furthermore, batch effects can affect different probes in varying ways, making specialized correction techniques necessary beyond routine normalization [81].
Origins of Batch Effects in Bisulfite Sequencing
The bisulfite sequencing workflow involves multiple steps where technical variability can be introduced. Bisulfite conversion itself is a critical step where unmethylated cytosines are converted to uracils, while methylated cytosines remain protected [3] [4]. Variations in the efficiency of this cytosine-to-thymine conversion across experimental batches can introduce systematic biases [80] [20]. Factors such as differences in bisulfite treatment conditions, DNA degradation (especially in FFPE samples), DNA input quality, and technical inconsistencies in the bisulfite conversion reaction can all lead to batch effects [80] [2].
Recent methodological advancements have introduced alternative approaches to traditional bisulfite conversion, including enzymatic conversion techniques (TET-assisted pyridine borane sequencing, APOBEC-coupled sequencing) and nanopore sequencing, which enables direct detection of DNA methylation without chemical conversion [80]. Although these newer methods reduce some biases associated with bisulfite conversion, batch effects can still arise due to variations in DNA input quality, enzymatic reaction conditions, or sequencing platform differences [80]. Consequently, batch correction remains a critical step in ensuring data reliability across all methylation profiling techniques.
Impact on Downstream Analyses
The profound impact of batch effects on methylation data is evidenced by studies where 50-66% of CpG sites showed significant association with batch variables in datasets with obvious batch effects [81]. These technical artifacts can lead to false positives in differential methylation analysis, reduce statistical power, and potentially invalidate conclusions if left uncorrected [81]. In cancer research, where DNA methylation biomarkers are increasingly used for early detection and classification, batch effects can compromise the identification of clinically relevant epigenetic signatures [83] [82].
Table 1: Common Sources of Batch Effects in DNA Methylation Studies
| Source Type | Specific Examples | Impact on Data |
|---|---|---|
| Wet-lab Procedures | Bisulfite conversion efficiency, DNA extraction method, reagent lots, personnel differences | Systematic shifts in β-value distributions, reduced reproducibility |
| Instrumentation | Different sequencing platforms, array chips, scanner differences | Probe-specific effects, intensity drifts |
| Experimental Design | Processing samples across multiple batches, days, or facilities | Structured technical variation confounding biological signals |
| Sample Quality | Varying DNA quality (e.g., FFPE vs. fresh frozen), input amounts | Coverage biases, missing data patterns |
Normalization Approaches for Methylation Data
Preprocessing and Quality Control
Rigorous quality control (QC) is essential before normalization and batch correction. For bisulfite sequencing data, this includes assessing conversion efficiency by checking the proportion of unmethylated cytosines converted to uracils, evaluating read quality using tools like FastQC, ensuring sufficient coverage of target regions, and performing quality checks of raw FASTQ files before and after trimming [2]. The inclusion of completely methylated or completely unmethylated "spiked-in" controls in different libraries helps assess data quality [2].
For array-based methylation data, initial quality assessment should include inspection of embedded control probes (staining, hybridization, bisulfite conversion, etc.), evaluation of total detected CpGs, average detection p-values across all CpG sites, and examination of the distribution of average β-values for all CpGs [81]. Samples failing these basic quality assessments should be excluded from subsequent analyses.
Normalization Methods
Multiple normalization strategies have been developed specifically for methylation data, particularly for the Illumina Infinium platforms:
- Quantile Normalization at Average β-value (QNβ): Applies quantile normalization directly to the β-value matrix, forcing the distribution of β-values to be identical across samples [81].
- Two-step Quantile Normalization (lumi): Implemented in the "lumi" R package, this approach performs separate background correction and color bias adjustment on the methylated and unmethylated signal intensities before applying quantile normalization to the pooled signals [81].
- Separate Channel Normalization (ABnorm): Applies quantile normalization independently to the methylated (A) and unmethylated (B) signal intensities before calculating β-values [81].
- Beta Mixture Quantile Normalization (BMIQ): Specifically designed to account for the different distributions of Type I and Type II probes on Illumina Infinium arrays [83].
The performance of these normalization methods varies depending on the severity of batch effects in a dataset. For datasets with minor batch effects, normalization alone may be adequate, with the "lumi" method generally showing superior performance [81]. However, in datasets with pronounced batch effects, normalization alone typically removes only a portion of the technical artifacts.
Table 2: Comparison of Normalization Methods for Illumina Methylation Arrays
| Method | Approach | Advantages | Limitations |
|---|---|---|---|
| QNβ | Direct quantile normalization of β-values | Simple, fast implementation | Does not address probe-type biases |
| lumi | Two-step normalization at signal level | Addresses color bias and probe design issues | More complex implementation |
| ABnorm | Separate normalization of A and B signals | Accounts for channel-specific artifacts | May not fully correct probe-type biases |
| BMIQ | Model-based correction for probe types | Specifically handles Type I/II probe differences | Computational more intensive |
Batch Effect Correction Methodologies
Established Correction Algorithms
Several batch correction methods have been adapted or specifically developed for DNA methylation data:
- ComBat-met: A recently developed beta regression framework specifically designed for adjusting batch effects in DNA methylation studies [80]. Unlike traditional methods, ComBat-met fits beta regression models to β-values, calculates batch-free distributions, and maps quantiles of estimated distributions to their batch-free counterparts. This approach accounts for the constrained nature of β-values (0-1 range) and their typically non-Gaussian distribution [80].
- Empirical Bayes (EB) Correction: Originally developed for gene expression data, EB methods use an empirical Bayes framework to shrink batch effect parameters toward the overall mean, improving stability particularly for small sample sizes [81]. This approach can be applied after normalization to remove residual batch effects.
- Surrogate Variable Analysis (SVA): Identifies and adjusts for unknown sources of variation (surrogate variables) that may represent batch effects or other unmodeled confounders [80] [84].
- Remove Unwanted Variation (RUV): Leverages control features (e.g., negative control probes or invariant CpGs) to estimate and adjust for unwanted technical variation [80]. The RUVm variant is specifically adapted for methylation data [80].
The ComBat-met Protocol
ComBat-met represents a significant advancement for batch correction in DNA methylation studies. The following protocol provides detailed methodology for implementation:
Beta Regression Model: Let ( y{ijm} ) denote the β-value of feature ( m ) in sample ( j ) from batch ( i ). The model assumes ( y{ijm} ) follows a beta distribution with mean ( μ{ijm} ) and precision ( φ{ijm} ). The beta regression model is defined as: [ \text{logit}(μ{ijm}) = αm + Xj^T βm + γ{im} ] [ \log(φ{ijm}) = δm + Zj^T ηm + λ{im} ] where ( αm ) represents the common cross-batch average M-value, ( Xj ) denotes the covariate vector with corresponding regression coefficients ( βm ), and ( γ{im} ) represents the batch-associated additive effect [80]. To ensure identifiability, the sum of ( γ_{im} ) weighted by sample size in each batch is constrained to zero [80].
Parameter Estimation: Model parameters are estimated via maximum likelihood estimation using the betareg() function in the betareg R package [80]. Since the model is applied independently to each feature, the fitting process is highly parallelizable. Implement parallelization using the parLapply() function from the parallel package to improve computational efficiency for large datasets [80].
Adjustment Procedure: The adjustment employs a quantile-matching approach similar to ComBat-seq [80]. Once the regression model is fitted, parameters for the batch-free distributions (( μ{jm}^* ) and ( φ{jm}^* )) are calculated as: [ \text{logit}(μ{jm}^*) = \hat{α}m + Xj^T \hat{β}m ] [ \log(φ{jm}^*) = \hat{δ}m + Zj^T \hat{η}m ] where ( \hat{α}m ), ( \hat{β}m ), ( \hat{δ}m ), and ( \hat{η}m ) represent the maximum likelihood estimates [80]. The adjusted data are then calculated by matching the quantile of the original data on the estimated distribution to its quantile counterpart on the batch-free distribution.
Reference-based Adjustment: For studies requiring alignment to a specific reference standard, ComBat-met allows adjustment of β-values to a reference batch where all batches are adjusted to the mean and precision of the designated reference [80].
Validation: Simulation studies demonstrate that ComBat-met followed by differential methylation analysis achieves superior statistical power compared to traditional approaches while correctly controlling Type I error rates in nearly all cases [80].
Figure 1: ComBat-met Batch Correction Workflow. The process involves fitting beta regression models to β-values, estimating batch-free distributions, and performing quantile matching to generate corrected values.
Integrated Normalization-Correction Workflow
For comprehensive batch effect management, a two-step procedure combining normalization and specialized batch correction is recommended:
- Apply appropriate normalization (e.g., "lumi" method for Illumina array data) to address technical artifacts and probe-design biases [81].
- Implement batch correction (e.g., ComBat-met for sequencing data, EB for array data) to remove residual batch effects [80] [81].
This integrated approach has been shown to almost triple the number of CpG sites associated with biological outcomes of interest in datasets with pronounced batch effects [81].
Figure 2: Comprehensive Batch Management Workflow. The process integrates quality control, normalization, and batch correction, with validation using technical replicates and control samples.
Experimental Design for Batch Effect Minimization
Proactive Batch Management
While statistical correction methods are powerful, proactive experimental design remains the most effective strategy for managing batch effects:
- Randomization: Distribute biological groups of interest (e.g., case/control) randomly across batches and processing times [81].
- Balancing: Ensure each batch contains similar proportions of different biological conditions, sample types, and confounding factors [81].
- Replication: Include technical replicates across different batches to assess and quantify batch effects [81].
- Blocking: Process all samples from a matched set (e.g., paired tumor-normal samples) within the same batch [81].
- Documentation: Meticulously record all processing details including reagent lots, instrument IDs, personnel, and processing dates to facilitate later batch modeling.
Studies with carefully controlled designs, such as Dataset 1 described in the literature where samples were randomly allocated to chips and processed simultaneously, exhibit only minor batch effects that are more easily corrected [81].
Performance Validation Metrics
After applying batch correction methods, several validation approaches should be employed:
- Technical Replicate Concordance: Assess the similarity between technical replicates processed in different batches, with improved concordance after correction indicating successful batch removal [81].
- Principal Components Analysis (PCA): Visualize the first few principal components colored by batch and biological group before and after correction. Successful correction should show batches interspersed while biological separation remains [81].
- Unsupervised Clustering: Examine hierarchical clustering patterns; batches should not form distinct clusters after successful correction [81].
- Batch Association Testing: Apply statistical tests (e.g., ANOVA) to assess the proportion of CpG sites significantly associated with batch variables before and after correction [81].
- Biological Signal Preservation: Confirm that known biological differences (e.g., tumor vs. normal) remain detectable after batch correction [80] [83].
Table 3: Key Research Reagent Solutions for DNA Methylation Analysis
| Reagent/Resource | Function | Application Notes |
|---|---|---|
| Sodium Bisulfite | Converts unmethylated cytosine to uracil | Critical for BS-seq; conversion efficiency must be monitored [3] [2] |
| EpiTect Bisulfite Kit (Qiagen) | Standardized bisulfite conversion | Provides consistent results; reduces protocol variability [3] |
| High-Fidelity Hot-Start Polymerases | Amplification of bisulfite-converted DNA | Reduces error rate in PCR; essential for AT-rich converted DNA [2] |
| Methylated/Unmethylated Control DNA | Process controls | Spiked-in controls assess conversion efficiency and data quality [2] |
| Infinium HumanMethylation BeadChip | Array-based methylation profiling | Genome-wide CpG coverage; compatible with formalin-fixed samples [82] [81] |
| Bismark/BWA-meth Aligners | Alignment of bisulfite sequencing reads | Specialized tools for mapping converted sequences [20] |
| methylKit R Package | Differential methylation analysis | Provides clustering, quality visualization, and statistical testing [20] |
| ComBat-met Algorithm | Batch effect correction | Specifically designed for β-value distributions [80] |
| FastQC | Sequencing data quality control | Identifies issues with read length, base quality, adapter contamination [2] |
Effective batch effect correction and normalization are indispensable for robust DNA methylation analysis in bisulfite sequencing research. The integrated approach combining appropriate normalization methods with specialized batch correction algorithms like ComBat-met provides a powerful framework for mitigating technical artifacts while preserving biological signals. Implementation of these strategies, coupled with thoughtful experimental design and rigorous validation, ensures the reliability and reproducibility of methylation studies essential for both basic research and drug development applications. As methylation profiling continues to evolve with emerging technologies such as enzymatic conversion and nanopore sequencing, adaptation and validation of these correction methods will remain critical for extracting meaningful biological insights from epigenetic data.
Troubleshooting Alignment Problems Due to Reduced Sequence Complexity
In bisulfite sequencing research, a fundamental challenge during computational analysis is the alignment of sequenced reads back to a reference genome. This process is complicated by the treatment of DNA with sodium bisulfite, which converts unmethylated cytosines to uracils (read as thymines in subsequent sequencing) [3] [5]. This conversion results in a significant reduction in sequence complexity, as a large proportion of cytosines in the genome are transformed into thymines, thereby increasing sequence ambiguity and confounding standard alignment algorithms that assume a balanced nucleotide composition [6] [5]. This application note provides a structured approach to diagnosing and resolving these alignment problems within the context of a comprehensive DNA methylation analysis workflow.
Core Challenge: How Bisulfite Treatment Reduces Sequence Complexity
The core of the alignment problem lies in the drastic change to the information content of the DNA sequence.
- The Bisulfite Conversion Process: Sodium bisulfite treatment selectively deaminates unmethylated cytosines to uracils, while methylated cytosines (5-methylcytosine, or 5mC) are protected and remain as cytosines [3] [5]. During subsequent PCR amplification and sequencing, uracils are replicated as thymines.
- Impact on Sequence Content: This process effectively reduces the four-letter DNA alphabet (A, C, G, T) to just three letters (A, G, T) for all unconverted genomic contexts, with the original cytosine information retained only at sites of methylation [5].
- Consequence for Aligners: Standard DNA alignment tools, which are designed to match sequences using the full four-letter alphabet, struggle with the resulting T-rich sequences. The high number of apparent C-to-T "substitutions" from the reference genome leads to a loss of uniqueness, making it difficult to find the correct genomic origin for a read, especially in repetitive regions [6].
Recommended Aligners and Key Metrics for Bisulfite Data
To overcome this challenge, specialized alignment tools are essential. These aligners are specifically designed to handle the unique nature of bisulfite-converted sequences.
Table 1: Specialized Aligners for Bisulfite Sequencing Data
| Tool Name | Core Methodology | Suitability |
|---|---|---|
| Bismark [20] | In silico bisulfite conversion of the reference genome to generate all possible C-to-T and G-to-A permutations, then aligns reads against these converted references. | A widely used and comprehensive tool for both WGBS and RRBS data. |
| bwa-meth [20] | A modification of the standard BWA aligner that uses a probabilistic model to account for the expected C-to-T conversions in the read data. | Known for its speed and efficiency. |
| nf-core/methylseq [20] | A complete, ready-to-run bioinformatics pipeline that incorporates either Bismark or bwa-meth, standardizing the entire process from raw reads to methylation calls. | Ideal for ensuring a reproducible and best-practices analysis workflow. |
When evaluating the success of an alignment, researchers should monitor the following key metrics:
Table 2: Essential Alignment Quality Metrics
| Metric | Target/Explanation |
|---|---|
| Alignment Rate | The percentage of input reads that successfully map to the reference genome. A low rate (<70-80%) may indicate issues with conversion, adapter contamination, or poor-quality data [6]. |
| Bisulfite Conversion Rate | The calculated rate at which non-CpG cytosines (assumed to be unmethylated in most somatic tissues) have been converted to thymines. A rate of >99% is typically expected, indicating a successful and complete bisulfite reaction [77] [3]. |
| CpG Coverage | The number of unique CpG sites in the genome with sufficient read depth (e.g., 10x) to confidently call a methylation status. Inadequate coverage can lead to false negatives in differential methylation analysis [20]. |
A Systematic Workflow for Troubleshooting Alignment Issues
The following diagram outlines a logical, step-by-step procedure for diagnosing and correcting common alignment problems in bisulfite sequencing data.
Detailed Experimental Protocol for Bisulfite Sequencing Analysis
This protocol outlines the key steps for processing bisulfite sequencing data, from raw reads to aligned methylation calls, with integrated troubleshooting.
Pre-Alignment Quality Control and Trimming
Procedure:
1. Assess raw read quality using FastQC to identify issues with per-base sequence quality, adapter contamination, and overrepresented sequences.
2. Perform quality and adapter trimming using a tool like Trim Galore! (which wraps Cutadapt), which is aware of bisulfite-converted sequences. Use parameters to aggressively remove low-quality bases (--quality 20) and adapters (--adapter AGATCGGAAGAGC).
3. Rerun FastQC on the trimmed reads to confirm successful cleaning.
Troubleshooting: If the alignment rate remains low, increase the stringency of trimming or use a --max_length parameter to remove very short fragments resulting from over-trimming.
Alignment with a Bisulfite-Specific Tool
Procedure (using Bismark as an example):
1. Prepare the reference genome by generating bisulfite-converted versions using bismark_genome_preparation.
2. Align trimmed reads to the prepared genome using the bismark aligner. Specify the alignment mode (e.g., --non_directional for single-cell or post-bisulfite adapter tagging libraries).
3. Deduplicate aligned reads using deduplicate_bismark to remove potential PCR duplicates that can bias methylation calling.
Troubleshooting: If alignment is slow, consider using bwa-meth as a faster alternative. If paired-end alignments are poor, check the library insert size distribution and adjust the --maxins parameter accordingly.
Post-Alignment QC and Methylation Calling
Procedure:
1. Extract the Methylation Calls: Use bismark_methylation_extractor to generate a report detailing the methylation status of every cytosine in the genome. The output includes context-specific files (CpG, CHG, CHH).
2. Calculate the Bisulfite Conversion Rate: This is a critical QC step. The conversion rate can be inferred from the methylation extractor's report by examining the methylation percentage in non-CpG contexts (e.g., mitochondrial DNA or lambda phage DNA spiked into the reaction), which should be very close to 0% (indicating complete conversion of unmethylated Cs) [77] [3]. A rate below 99% suggests an incomplete bisulfite reaction and warrants investigation into the wet-lab protocol [77].
3. Generate Alignment Reports: Bismark produces an HTML report summarizing alignment efficiency, including the overall alignment rate and strand-specific alignment information. Scrutinize this report for any anomalies.
The Scientist's Toolkit: Essential Research Reagents and Tools
Table 3: Key Research Reagent Solutions for Bisulfite Sequencing Analysis
| Item / Reagent | Function / Explanation |
|---|---|
| Sodium Bisulfite | The core chemical responsible for deaminating unmethylated cytosines, enabling the discrimination of methylated and unmethylated bases [3]. |
| EpiTect Bisulfite Kit (Qiagen) | A commercial kit that provides a standardized and optimized protocol for the bisulfite conversion reaction, ensuring high conversion rates and minimal DNA degradation [3]. |
| MspI Restriction Enzyme | For Reduced Representation Bisulfite Sequencing (RRBS); used to digest genomic DNA, enriching for CpG-dense regions and thereby reducing sequencing costs [20]. |
| Bismark / bwa-meth | Specialized software aligners that are fundamental to accurately mapping the T-rich, bisulfite-converted sequences back to the reference genome [20]. |
| nf-core/methylseq Pipeline | A standardized, containerized computational workflow that automates the entire analysis from raw FASTQ files to methylation calls, ensuring reproducibility and best practices [20]. |
| methylKit R Package | A primary tool for downstream differential methylation analysis, allowing for the identification of differentially methylated positions (DMPs) and regions (DMRs) after alignment and methylation calling are complete [20]. |
Ensuring Accuracy: Benchmarking, Cross-Platform Validation, and Advanced Applications
Comparing Bisulfite Sequencing with Methylation Arrays (EPIC) and Enzymatic Methods (EM-seq)
The accurate assessment of genome-wide DNA methylation patterns is essential for understanding its role in gene regulation, cellular differentiation, and disease mechanisms [85]. While DNA methylation predominantly occurs at cytosine-phosphate-guanine (CpG) dinucleotide sites, it also extends to non-CpG contexts, exerting distinct effects on gene structure and function [86]. The impact of DNA methylation on gene expression varies significantly depending on genomic location, with promoter methylation typically suppressing gene expression, while gene body methylation involves more complex regulatory mechanisms [86]. Among the currently available technologies for methylation profiling, three principal methods have emerged as prominent tools: bisulfite sequencing, methylation microarrays, and enzymatic conversion approaches.
Whole-genome bisulfite sequencing (WGBS) has long been considered the gold standard for comprehensive methylation analysis due to its single-base resolution [87]. The Infinium MethylationEPIC (EPIC) microarray offers a cost-effective alternative for profiling targeted CpG sites across large sample sets [88]. More recently, enzymatic methyl-sequencing (EM-seq) has been developed to overcome the limitations of bisulfite conversion [89]. This application note provides a detailed comparison of these technologies, focusing on their practical implementation, performance characteristics, and suitability for different research scenarios within the framework of DNA methylation data analysis.
Technology Comparison and Performance Metrics
Method Principles and Technical Specifications
Bisulfite Sequencing (WGBS) operates on the principle that treatment of DNA with sodium bisulfite converts unmethylated cytosines to uracil, while methylated cytosines remain unaffected [87]. After PCR amplification and sequencing, the former unmethylated cytosines appear as thymines, allowing for discrimination between methylated and unmethylated positions [90]. This method provides single-base resolution and covers CpG and non-CpG contexts throughout the genome, including dense, less dense, and repeat regions [90]. However, the harsh chemical treatment causes substantial DNA fragmentation and degradation, with DNA loss potentially reaching 90% in some protocols [90]. The reduction in sequence complexity also complicates alignment, and the method cannot distinguish between 5-methylcytosine (5mC) and 5-hydroxymethylcytosine (5hmC) [90].
MethylationEPIC Microarray utilizes Illumina's beadchip technology to interrogate over 935,000 CpG sites primarily distributed in gene promoters, coding regions, and other functional areas [89]. The platform detects methylation levels through fluorescence signals without requiring PCR [89]. Methylation values are reported as β-values, representing the ratio of the methylated probe intensity to the sum of the methylated and unmethylated probe intensities, ranging from 0 (completely unmethylated) to 1 (fully methylated) [86]. While offering limited coverage of the entire methylome (approximately 30%), its standardized workflow, low cost, and straightforward data processing make it suitable for large-scale epigenome-wide association studies (EWAS) [85] [88].
Enzymatic Methyl-Sequencing (EM-seq) employs a two-step enzymatic conversion process that avoids the damaging effects of bisulfite treatment [89]. First, the TET2 enzyme oxidizes 5-methylcytosine (5mC) to derivatives such as 5-carboxylcytosine (5caC), while T4 β-glucosyltransferase (T4-BGT) glucosylates any 5-hydroxymethylcytosine (5hmC) to protect it from further modification [86]. The APOBEC enzyme then deaminates unmodified cytosines to uracil, while all modified cytosines remain protected [86]. This approach preserves DNA integrity, reduces sequencing bias, and improves CpG detection, particularly in GC-rich regions [89].
Comprehensive Performance Comparison
Table 1: Technical Specifications and Performance Metrics of DNA Methylation Profiling Methods
| Parameter | WGBS | EPIC Array | EM-seq | Oxford Nanopore (ONT) |
|---|---|---|---|---|
| Resolution | Single-base | Single-CpG site | Single-base | Single-base |
| Coverage | ~28 million CpGs (∼80% of all CpGs) [88] | ~935,000 CpG sites [89] | Comparable to WGBS [85] | Genome-wide with long reads |
| DNA Input | High (100ng+) [89] | 500ng [86] | Low (10-200ng) [91] | Very high (~1μg) [86] |
| Conversion Principle | Chemical bisulfite [87] | Chemical bisulfite [86] | Enzymatic conversion [89] | Direct detection [85] |
| DNA Fragmentation | Extensive (90% degradation) [90] | Not applicable | Minimal [91] | Not applicable |
| Cost | Moderate to high [85] | Low [89] | Higher than WGBS [89] | High [89] |
| Protocol Duration | 12-16 hours incubation [91] | Standardized, relatively fast | 6 hours incubation [91] | Real-time data output [89] |
| GC-Rich Region Performance | Poor coverage due to bias [89] | Probe cross-hybridization issues [89] | Excellent, uniform coverage [85] | Excellent, no GC bias [89] |
| 5mC/5hmC Discrimination | No [90] | No | Limited (protects 5hmC) [86] | Yes [86] |
| Best Applications | Comprehensive methylome mapping, discovery research [85] | Large cohort studies, EWAS [88] | Low-input samples, degraded DNA, clinical samples [92] | Complex genomic regions, haplotype phasing [85] |
Table 2: Quantitative Performance Comparison Across Platforms
| Performance Metric | WGBS | EPIC Array | EM-seq |
|---|---|---|---|
| Reproducibility (Correlation Coefficient) | Reference standard | High for targeted sites [88] | High concordance with WGBS (r > 0.96) [85] |
| CpG Sites Detected per Sample | Varies by sequencing depth | ~846,464 [88] | ~3.7 million with high input [88] |
| Detection of Unique CpGs | Comprehensive but with gaps | Limited to predefined sites | Identifies unique CpGs missed by other methods [85] |
| Sensitivity in Low Input (10ng) | Poor (high degradation) [89] | Not recommended | High (32% more sites detected vs WGBS) [89] |
| Methylation Concordance with WGBS | Reference | High for overlapping sites [88] | Very high (r: 0.98-0.99) [88] |
| Library Complexity | Reduced due to fragmentation | Not applicable | Higher than WGBS [92] |
Recent comparative studies demonstrate that EM-seq shows the highest concordance with WGBS, indicating strong reliability due to their similar sequencing chemistry [85]. When comparing methylation measurements for 472,540 CpG sites captured by both MC-seq (a capture-based variant of bisulfite sequencing) and EPIC arrays, the majority showed high correlation (r: 0.98-0.99) in the same sample, though a small proportion of CpGs (N = 235) exhibited significant differences with beta value discrepancies greater than 0.5 [88]. In terms of genomic coverage distribution, MC-seq detected more CpGs in coding regions and CpG islands compared to the EPIC array [88].
Detailed Experimental Protocols
Whole-Genome Bisulfite Sequencing Protocol
Sample Requirements and Quality Control: Input DNA should be of high quality and quantity, with recommended inputs of 100ng or more [89]. DNA purity should be assessed via spectrophotometry (A260/A280 ratios) and quantified by fluorometry to ensure accurate measurements [86]. DNA integrity and fragment size distribution should be confirmed using microfluidic capillary electrophoresis systems [88].
Bisulfite Conversion Procedure:
- DNA Denaturation: Incubate DNA in 0.1-0.3M NaOH at 37°C for 15 minutes to denature double-stranded DNA [87].
- Sulfonation: Add freshly prepared sodium bisulfite solution (pH 5.0) to a final concentration of 2.5-3.0M and incubate at 50-60°C for 12-16 hours in the dark [91]. This step converts unmethylated cytosines to uracil.
- Desalting: Remove excess bisulfite using DNA clean-up columns or magnetic beads [86].
- Desulfonation: Treat with 0.1-0.3M NaOH at room temperature for 15 minutes to convert uracil-sulfonate complexes to uracil [87].
- Neutralization and Purification: Neutralize the reaction and purify converted DNA using commercially available kits [86].
Library Preparation and Sequencing:
- Library Construction: Use commercial kits specifically designed for bisulfite-converted DNA. The process typically includes end-repair, A-tailing, adapter ligation, and size selection [88].
- PCR Amplification: Amplify libraries using polymerases capable of reading uracil-containing templates with 5-12 cycles depending on input DNA [88].
- Quality Control: Assess library quality using bioanalyzer or tape station systems and quantify by qPCR [88].
- Sequencing: Perform sequencing on Illumina platforms with recommended read lengths of 100-150bp paired-end to ensure adequate alignment of converted sequences [88].
MethylationEPIC Array Protocol
Sample Preparation:
- DNA Quantification: Precisely quantify DNA using fluorometric methods to ensure accurate loading of 500ng per sample [86].
- Bisulfite Conversion: Convert DNA using the EZ DNA Methylation Kit or equivalent, following manufacturer's recommendations for Infinium assays [86].
Array Processing:
- Whole-Genome Amplification: Amplify bisulfite-converted DNA overnight (20-24 hours) using isothermal amplification at 37°C [86].
- Enzymatic Fragmentation: Fragment amplified DNA enzymatically to segments of approximately 300bp [86].
- Precipitation and Resuspension: Precipitate fragmented DNA with 2-propanol and resuspend in hybridization buffer [86].
- Array Hybridization: Apply resuspended DNA to EPIC BeadChips and incubate for 16-24 hours at 48°C [86].
- Single-Base Extension and Staining: Perform single-base extension with labeled nucleotides, followed by staining process [86].
- Imaging: Scan arrays using Illumina iScan or equivalent system [86].
Data Processing:
- Quality Control: Assess sample quality using metrics such as detection p-values, bisulfite conversion efficiency, and intensity values [86].
- Normalization: Apply normalization methods such as beta-mixture quantile normalization (BMIQ) or subset quantile normalization (SWAN) to correct for technical variation [86].
- β-value Calculation: Compute β-values using the ratio of methylated signal intensity to total signal intensity (methylated + unmethylated) [86].
Enzymatic Methyl-Sequencing Protocol
Sample Requirements: EM-seq is suitable for a wide range of DNA inputs (10-200ng), including degraded DNA samples such as FFPE tissue and cell-free DNA [91] [92]. The gentle enzymatic treatment preserves DNA integrity, making it particularly suitable for challenging sample types.
Enzymatic Conversion Procedure:
- Oxidation and Protection: Incubate DNA with TET2 enzyme and T4-BGT in reaction buffer at 37°C for 1 hour to oxidize 5mC and protect 5hmC [91].
- Deamination: Add APOBEC enzyme and incubate at 37°C for 2 hours to deaminate unmodified cytosines to uracil [91].
- Purification: Clean up reactions using bead-based purification methods [91]. Note that the bead-based cleanup steps are critical and may require optimization to improve recovery [91].
Library Preparation:
- Fragmentation (Optional): For WGMS applications, fragment DNA to 150-200bp using acoustic shearing. For already degraded samples, this step may be omitted [92].
- End Repair and A-Tailing: Repair DNA ends and add 'A' overhangs using standard molecular biology enzymes [88].
- Adapter Ligation: Ligate methylated adapters using T4 DNA ligase [88].
- Library Amplification: Amplify libraries with 4-8 cycles of PCR using primers compatible with Illumina sequencing platforms [88].
- Quality Control: Assess library quality and quantity as described for WGBS [88].
Workflow Comparison of Three Methylation Profiling Methods
Research Reagent Solutions and Essential Materials
Core Reagents and Kits
Table 3: Essential Research Reagents for DNA Methylation Analysis
| Category | Specific Product/Kit | Application | Key Features |
|---|---|---|---|
| Bisulfite Conversion Kits | EZ DNA Methylation Kit (Zymo Research) [91] | WGBS, EPIC array | Popular for Illumina Infinium assays, 0.5-2000ng input range [86] |
| Enzymatic Conversion Kits | NEBNext Enzymatic Methyl-seq Conversion Module (NEB) [91] | EM-seq | Only commercially available EC kit, 10-200ng input range [91] |
| Library Prep Kits | SureSelectXT Methyl-Seq (Agilent) [88] | Methylation capture sequencing | Target enrichment approach, broader methylome coverage than arrays |
| Array Platforms | Infinium MethylationEPIC v2.0 BeadChip (Illumina) [89] | Large-scale methylation screening | ~935,000 CpG sites, cost-effective for sample batches [89] |
| DNA Quality Assessment | Bioanalyzer/TapeStation (Agilent) [88] | All methods | Microfluidic analysis of DNA integrity and fragment size |
| Quantification | Qubit fluorometer (Thermo Fisher) [86] | All methods | Accurate DNA quantification using dsDNA-specific dyes |
Quality Control and Validation Tools
Effective DNA methylation analysis requires rigorous quality control throughout the experimental workflow. For bisulfite-based methods, conversion efficiency should be monitored using control sequences or spike-in DNA such as lambda phage DNA, with efficiencies >99% considered acceptable [92]. For sequencing-based approaches, tools such as FastQC (version 0.11.8) should be used for sequence quality assessment, followed by specialized alignment software such as Bismark (version 0.22.1) for mapping bisulfite-converted reads [88]. For microarray data, packages such as minfi (version 1.48.0) in R provide comprehensive quality control metrics including detection p-values, bisulfite intensity metrics, and sample-independent quality measures [86].
Method Selection Guide Based on Experimental Requirements
Data Analysis Considerations and Integration
Analytical Approaches for Different Data Types
The analysis of DNA methylation data requires method-specific computational approaches that account for the distinct characteristics of each technology. For WGBS and EM-seq data, the initial processing typically involves quality trimming of raw reads using tools such as Trim Galore (version 0.6.3), followed by alignment to a bisulfite-converted reference genome using specialized aligners such as Bismark [88]. Methylation extraction is then performed to determine the proportion of reads supporting methylation at each cytosine position, with a minimum coverage of 10x recommended for confident methylation calling [88]. For differential methylation analysis, statistical methods must account for the binomial distribution of methylation counts, with tools such as MethylKit and DSS specifically designed for this purpose.
EPIC array data analysis involves preprocessing steps including background correction, normalization, and probe-type bias correction [86]. β-values provide a continuous measure of methylation levels but exhibit heteroscedasticity; thus, M-values (logit transformation of β-values) are often preferred for statistical testing [86]. Careful attention must be paid to probe filtering, removing probes with detection p-values > 0.01, those containing single nucleotide polymorphisms, and those aligning to multiple genomic locations [86].
Method Selection Guidelines
Choosing the appropriate methylation profiling method requires careful consideration of research objectives, sample characteristics, and available resources:
Select WGBS when: Comprehensive genome-wide methylation mapping is required, including non-CpG contexts and repetitive regions; sample quantity and quality are sufficient; and budget allows for deeper sequencing [85].
Choose EPIC arrays when: Studying large sample cohorts (>100 samples); budget constraints preclude deep sequencing; infrastructure for array processing is available; and targeted analysis of known functional CpG sites is sufficient [88].
Opt for EM-seq when: Working with limited or degraded DNA samples (e.g., FFPE, cfDNA, forensic samples); analyzing GC-rich regions; seeking to minimize DNA damage while maintaining single-base resolution; and higher reagent costs are acceptable [89] [92].
Consider Oxford Nanopore Technologies when: Long-range methylation phasing is needed; direct detection of modified bases without conversion is preferred; and infrastructure for third-generation sequencing is available [85].
Recent advancements in enzymatic conversion methods position EM-seq as a robust alternative to WGBS, particularly for clinical samples where DNA integrity is often compromised [92]. The technology demonstrates significantly higher estimated counts of unique reads, reduced DNA fragmentation, and higher library yields than bisulfite conversion, enabling the development of robust clinical sample pipelines including targeted sequencing in cell-free DNA [92]. As the field moves toward more sensitive and preservation-oriented methods, enzymatic approaches are likely to see increased adoption in both basic research and clinical applications.
In bisulfite sequencing research, technical validation is paramount for distinguishing true biological signal from experimental noise. Technical validation through spike-in controls and technical replicates provides a robust framework to quantify and correct for this technical variability, ensuring that observed differences in DNA methylation are biologically meaningful and not artifacts of the experimental process. This is especially critical in studies involving precious clinical samples or those aiming to detect subtle epigenetic changes, such as in biomarker discovery or drug development. The core sources of technical variation in bisulfite sequencing include inefficient bisulfite conversion, library preparation biases, sequencing depth fluctuations, and batch effects [93] [94]. Without proper controls, these factors can lead to both false positive and false negative findings, compromising the integrity of the study.
Spike-in controls function as an internal reference standard, added to the sample at the start of the experimental workflow.å› ä¸ºä»–ä»¬å«æœ‰å·²çŸ¥ methylation levels, they enable researchers to calibrate measurements, monitor the efficiency of key steps like bisulfite conversion, and correct for technical biases during data normalization [95] [96]. Technical replicates—multiple library preparations from the same biological sample—provide a direct measure of experimental reproducibility. By accounting for library-to-library variation, they increase the statistical power and accuracy of methylation estimates, allowing even data from libraries with suboptimal bisulfite conversion rates to be salvaged and used meaningfully [93]. Together, these methods form a complementary strategy for achieving reliable and reproducible DNA methylation data.
The Critical Role of Spike-in Controls
Principles and Applications
Spike-in controls are synthetic DNA fragments of known sequence and methylation status that are added to a sample in a defined amount prior to processing. They act as an internal standard throughout the experimental workflow, allowing for direct monitoring of technical performance. Their primary function is to move data normalization from an assumption-based model (e.g., that most CpGs are not differentially methylated) to an absolute, quantitative scale. This is particularly vital in clinical and biomarker settings where detecting absolute changes in methylation is necessary [96].
Key applications of spike-in controls include:
- Calculating Bisulfite Conversion Efficiency: By including fully unmethylated control fragments, researchers can directly calculate the bisulfite conversion rate by assessing the percentage of unconverted cytosines at non-CpG sites in these controls post-sequencing. This provides a sample-specific quality metric that is more reliable than in silico estimation [95].
- Absolute Quantification: Adding a known molar amount of spike-ins enables the calculation of the absolute molar quantity of methylated DNA in the original sample, moving beyond arbitrary read counts [96].
- Correcting for Technical Biases: Advanced spike-in sets are designed with variations in fragment length, G+C content, and CpG density. This allows for the creation of normalization models that account for how these biophysical properties affect enrichment in methods like MeDIP-seq or conversion in BS-seq, leading to more accurate quantification [96].
- Mitigating Batch Effects: When used across multiple batches or laboratories, spike-in controls provide a common reference to remove unwanted technical variation, dramatically improving cross-study reproducibility [96].
Commercially Available and Custom Spike-in Kits
Researchers can choose from several commercial spike-in solutions or develop custom controls tailored to their specific needs. The table below summarizes key examples:
Table 1: Key Research Reagent Solutions for Spike-in Controls
| Product / Method | Source | Key Features | Methylation Levels | Primary Function |
|---|---|---|---|---|
| Zymo-Seq Methyl Spike-in Control [95] | Double-stranded synthetic amplicons derived from E. coli | Six unique amplicons (180-200 bp); compatible with various species and BS-seq methods. | 0%, 10%, 25%, 50%, 75%, 100% | Creates a standard curve for robust normalization and bisulfite conversion efficiency calculation. |
| Synthetic cfMeDIP-seq Spike-in [96] | 54 custom-designed double-stranded DNA fragments | Varies methylation status, length (80, 160, 320 bp), G+C content (35%, 50%, 65%), and CpG fraction. | Methylated & Unmethylated | Enables a GLM to correct for multiple technical biases and achieve absolute quantification in immunoprecipitation-based methods. |
| Arabidopsis thaliana DNA | Natural genomic DNA | Often used as a methylated and unmethylated control in MeDIP-seq protocols. | Defined by source | Assesses immunoprecipitation and binding efficiency to methylated DNA. |
Protocol for Using Spike-in Controls in Bisulfite Sequencing Experiments
The following workflow details the integration of spike-in controls into a standard bisulfite sequencing library preparation protocol.
Diagram: Experimental workflow for incorporating spike-in controls into a bisulfite sequencing study.
Step-by-Step Procedure:
Sample and Spike-in Preparation:
- Extract and quantify genomic DNA from your sample (e.g., using a Nanodrop or Qubit system). Ensure high DNA quality [7].
- Critical Step: Based on the sample DNA input amount, add the recommended quantity of spike-in control. For example, the Zymo-Seq kit recommends 60 pg for 100-500 ng of sample DNA, 30 pg for 50-99 ng, and 10 pg for 20-49 ng [95]. Dilute the spike-in to an appropriate concentration in TE buffer for accurate pipetting.
Combined Bisulfite Conversion:
- Combine the sample DNA and spike-in control mixture and subject it to bisulfite conversion using a standardized protocol or commercial kit (e.g., Zymo Research EZ DNA Methylation-Gold Kit or Qiagen EpiTect Fast Kit) [97] [98].
- Typical conversion conditions involve denaturation (e.g., 99 °C for a few minutes) followed by incubation with a saturated sodium bisulfite solution (pH ~5.0) containing hydroquinone for several hours at 50-55 °C [99] [97]. This is followed by desalting, desulfonation (at high pH), and final purification.
Library Preparation and Sequencing:
Bioinformatic Analysis and Normalization:
- Alignment and Demultiplexing: Separate reads by sample barcodes and align them to a combined reference genome that includes the spike-in sequences.
- Calculate Bisulfite Conversion Efficiency: For the unmethylated spike-in controls, determine the percentage of cytosines (at non-CpG sites) that were successfully converted to thymines. Efficiency should typically be >99% [7]. The formula is:
Conversion Efficiency = (1 - (Number of C reads / Total reads at unconverted C sites)) * 100%. - Normalize Data: Use the known methylation levels and input amounts of the spike-in controls to calibrate the sample data. This can range from a simple linear scaling based on a standard curve (for kits like Zymo-Seq) [95] to a sophisticated generalized linear model (GLM) that corrects for fragment length, G+C content, and CpG density [96].
The Power of Technical Replicates
Enhancing Accuracy and Reproducibility
Technical replicates—multiple library preparations from the same biological sample—are essential for assessing and improving the reproducibility of bisulfite sequencing data. A key source of variation between technical replicates is the bisulfite conversion efficiency (BS eff), which can vary significantly between libraries, even those derived from the same original DNA [93]. Standard practice often excludes libraries with low conversion rates (<99%), leading to wasted resources and reduced statistical power. However, advanced computational methods like LuxRep have been developed to integrate data from all technical replicates, regardless of their individual conversion efficiencies, resulting in more accurate and powerful analyses [93].
The primary benefits of using technical replicates include:
- Improved Methylation Estimation: By pooling data from multiple libraries, coverage at each cytosine site is increased, leading to more precise methylation level estimates [93].
- Accountment for Technical Parameters: Probabilistic models can explicitly incorporate library-specific technical parameters (bisulfite conversion rate, sequencing error) into the estimation of the biological parameter (methylation level), thereby correcting for systematic biases [93].
- Enhanced Detection of Differential Methylation: The use of replicates in a generalized linear model (GLM) framework increases the statistical power to detect true differentially methylated sites (DMS) or regions (DMRs) by providing a better estimate of within-group variability [93].
- Quality Control: Discrepancies between technical replicates can flag issues with a specific library prep, allowing for its exclusion or targeted troubleshooting.
Protocol for Designing and Analyzing Studies with Technical Replicates
This protocol outlines how to incorporate technical replicates into a bisulfite sequencing study design and analyze the data using a replicate-aware tool like LuxRep.
Diagram: Logical workflow for the design and analysis of experiments with technical replicates.
Step-by-Step Procedure:
Experimental Design:
- For each biological sample in your study (e.g., each patient or cell line), plan to create at least two independent bisulfite-converted DNA libraries. This is a critical step to capture library-to-library variation [93].
- Process these technical replicates through the entire workflow independently, including separate bisulfite conversions, library preparations, and sequencing runs, if possible. This provides the most comprehensive assessment of technical variability.
Wet-Lab Protocol for Technical Replicate Library Preparation:
- DNA Digestion (Optional for Targeted Sequencing): For focused studies, digest 250 ng – 2 µg of genomic DNA with restriction enzymes that cut outside the region of interest in a 100 µL volume. Purify the DNA using phenol:chloroform extraction and ethanol precipitation [99].
- Bisulfite Conversion: Resuspend the DNA in water. Denature the DNA (e.g., 97°C for 1 minute) and immediately place on ice. Add NaOH to a final concentration of ~0.3M and incubate at 39°C for 30 minutes to ensure denaturation. Add a freshly prepared, pH-adjusted bisulfite solution containing hydroquinone. Incubate at 55°C for 12-16 hours [99] [97].
- Post-Conversion Clean-Up: Desalt the samples using a commercial purification column (e.g., Qiagen PCR purification). Desulfonate by adding NaOH to 0.3M and incubating at 37°C. Precipitate the DNA with ammonium acetate and ethanol, wash, and resuspend in TE buffer or water [99].
- Library Preparation: Use a portion of each purified, bisulfite-converted technical replicate for independent library construction. For targeted sequencing, this involves a first-round PCR with target-specific bisulfite primers, followed by a second-round PCR to add barcodes and Illumina adapters [98].
Computational Analysis with LuxRep:
- Alignment and Count Data Generation: Map the sequencing reads from each technical replicate to a reference genome and generate a count of methylated and total reads for each cytosine site.
- Parameter Estimation: The LuxRep software first estimates the experimental parameters (bisulfite conversion rate
BS_eff, sequencing errorseq_err) for each technical replicate library from control data or the sequence data itself [93]. - Joint Inference: The model then uses a variational inference approach to simultaneously analyze all technical replicates from a biological sample. It estimates the true underlying methylation level (θ) by weighting the data from each replicate by its technical quality, effectively down-weighting contributions from libraries with poor conversion rates [93].
- Differential Methylation Analysis: Finally, a general linear model is used to detect differentially methylated sites between biological conditions, using the refined methylation estimates and their variances derived from the joint analysis of technical replicates [93].
Integrating Spike-ins and Replicates for Robust Validation
The most rigorous approach to technical validation involves the combined use of spike-in controls and technical replicates. This integrated strategy provides a complete quality control and normalization pipeline. Spike-in controls offer an absolute, sample-specific standard for correcting biases and calculating efficiency, while technical replicates capture the random and systematic variability introduced during library preparation. When analyzed with a replicate-aware model, this design maximizes data utility, allowing researchers to confidently extract biological insights from even the most challenging samples.
This is especially powerful in a drug development context, where detecting subtle, consistent methylation changes in response to a compound is critical. The integration allows for the calibration of measurements across different batches, labs, and time points, ensuring that observed effects are reliable and reproducible. By adopting this comprehensive framework, researchers and drug developers can significantly enhance the credibility and translational potential of their bisulfite sequencing findings.
In the field of epigenomics, DNA methylation is a crucial regulatory mechanism, and its analysis via bisulfite sequencing has become the gold standard for achieving single-base resolution maps of this modification across the genome [20] [2]. A primary goal of such research is to understand the functional consequences of DNA methylation patterns on transcriptional activity. While a traditional understanding posits that promoter methylation represses gene expression, contemporary pan-cancer analyses and large-scale sequencing studies reveal a more complex relationship, including instances of substantial positive correlation and contradictory effects at neighboring CpG sites [100] [101]. This application note provides detailed protocols and frameworks for the robust biological validation of DNA methylation findings through correlation with gene expression data, enabling researchers to move from association to mechanistic insight.
Core Concepts and Quantitative Relationships
The correlation between CpG methylation and gene expression is not uniform and is highly dependent on genomic context. The following table summarizes the primary patterns identified through large-scale analyses, such as those conducted in The Cancer Genome Atlas (TCGA) and other cohort studies [100].
Table 1: Correlation Patterns Between CpG Methylation and Gene Expression
| Genomic Context | Typical Correlation with Expression | Notes and Exceptions |
|---|---|---|
| Promoter Regions / CpG Islands | Predominantly Negative | Methylation prevents transcription factor binding, leading to gene silencing. However, a substantial number of positive correlations have been observed, contradicting the simple model [100]. |
| Gene Body | Variable (Often Positive) | Function is not fully understood; may be related to transcriptional elongation or splicing. Contradictory effects can be seen at neighboring CpG sites [100]. |
| Enhancer Elements | Predominantly Negative | Methylation is associated with inactive enhancer states. |
| Intergenic Regions | Context-Dependent | May have tissue-specific or developmentally-specific regulatory roles. |
A critical advancement in this field is the understanding that a significant portion of the observed correlation is not necessarily causal but is driven by underlying genetic variation. These allele-specific methylation quantitative trait loci (ASM-QTLs) are sequence variants that influence both local CpG methylation levels and gene expression, thereby driving the correlation [101]. In fact, one recent nanopore sequencing study of whole-blood genomes found that 41% of methylation-depleted sequences associated with cis-acting sequence variants, and this ASM-QTL activity was shown to drive most of the correlation between gene expression and CpG methylation [101].
Experimental Protocols
Generating Methylation Data from Bisulfite Sequencing
The following protocol is adapted from best practices for bisulfite sequencing analysis [20] [2].
Principle: Sodium bisulfite converts unmethylated cytosine to uracil, which is then amplified and sequenced as thymine. Methylated cytosines are protected from conversion and are read as cytosines [2] [102]. Quantification of methylation is done by calculating the proportion of reads reporting a C versus a T at each cytosine position in the genome [20].
Workflow: The end-to-end process for generating methylation data suitable for correlation studies is visualized below.
Detailed Methodology:
- Sample Preparation and DNA Extraction: Isolate high-quality DNA from biological samples (e.g., tissues, cells). Ensure DNA is free of contaminants, as this impacts conversion efficiency. Note that DNA from formalin-fixed, paraffin-embedded (FFPE) tissues may be degraded and require specialized protocols [2].
- Bisulfite Conversion: Treat DNA with sodium bisulfite using a commercial kit. This step deaminates unmethylated cytosines to uracils while leaving methylated cytosines unchanged. This process can cause DNA fragmentation, so sufficient input DNA is critical [2] [102].
- Library Preparation and Sequencing: Prepare sequencing libraries from the bisulfite-converted DNA. For comprehensive analysis, Whole-Genome Bisulfite Sequencing (WGBS) is used. For cost-effective focused analysis, Reduced Representation Bisulfite Sequencing (RRBS) enriches for CpG-rich regions using restriction enzymes (e.g., MspI) [20] [2]. Perform sequencing on an appropriate NGS platform.
- Data Processing and Alignment:
- Quality Control: Use tools like FastQC to assess read quality. Check bisulfite conversion efficiency (e.g., using spiked-in controls or by analyzing the conversion rate in non-CpG contexts) to ensure high conversion (>99%) and avoid false positives [2].
- Alignment and Methylation Calling: Map bisulfite-treated reads to a reference genome using aligners like Bismark or bwa-meth, which are designed to handle C-to-T conversions [20]. The output is typically a coverage file listing, for each CpG, the number of reads showing methylation and non-methylation.
- Differential Methylation Analysis: Using an R package like
methylKit, load the coverage files, filter based on coverage (e.g., ≥10x), and normalize data [20]. Identify differentially methylated CpGs (DMCs) or regions (DMRs) between sample groups (e.g., disease vs. control).
Correlating Methylation with Expression Data
Principle: Statistical correlation is performed between methylation levels (e.g., from methylKit) and gene expression levels (e.g., FPKM/TPM from RNA-Seq) from matched samples.
Workflow: The logical flow for integrating and interpreting multi-omic data is outlined below.
Detailed Methodology:
- Data Integration: For each gene, combine its promoter or gene body methylation data (average beta value or read counts across CpGs) with its normalized expression value (e.g., TPM from RNA-Seq) from the same biological sample.
- Statistical Correlation: Perform non-parametric correlation tests (e.g., Spearman's rank correlation) for each gene-methylation pair across all samples. A significant negative correlation for a promoter-associated CpG supports a model of transcriptional repression.
- Account for Genetic Confounding: To determine if a correlation is driven by an underlying genetic variant, perform Allele-Specific Methylation QTL (ASM-QTL) analysis [101]. This involves testing for associations between local sequence variants and methylation levels. If the same variant also associates with expression changes (an eQTL), it indicates the correlation is likely driven by the genotype.
- Functional Validation: Correlations, even after genetic fine-mapping, are associations. Direct functional validation requires experimental follow-up such as:
- CRISPR-based Methylation Editing: Use targeted DNA methylation editors (e.g., dCas9-DNMT3A or dCas9-TET1) to manipulate methylation at specific sites and measure the consequent change in gene expression.
- Luciferase Reporter Assays: Clone the genomic region of interest (promoter/enhancer) into a reporter vector, treat it in vitro with methylases, and transfer into cells to measure the direct impact of methylation on transcriptional activity.
The Scientist's Toolkit
Table 2: Essential Research Reagents and Solutions
| Item | Function/Description |
|---|---|
| Sodium Bisulfite | The core chemical for converting unmethylated cytosine to uracil. Commercial kits are recommended for reliability [2] [102]. |
| High-Fidelity "Hot Start" Polymerase | Essential for accurate PCR amplification of bisulfite-converted DNA, which is AT-rich and prone to non-specific amplification [2]. |
| Bismark or bwa-meth | Specialized software aligners for mapping bisulfite-treated sequencing reads to a reference genome [20]. |
| methylKit R Package | A comprehensive tool for the downstream analysis of methylation data, including quality control, filtering, clustering, and differential methylation analysis [20]. |
| Nanopolish | A software tool for detecting base modifications, including 5mC, from nanopore sequencing data, enabling haplotype-aware methylation analysis [101]. |
| Flow-Sorted Methylation Controls | Completely methylated and unmethylated DNA controls spiked into samples to empirically assess bisulfite conversion efficiency and data quality [2]. |
Leveraging Machine Learning for Methylation-Based Classifiers and Disease Prediction
DNA methylation, the covalent addition of a methyl group to cytosine nucleotides primarily within CpG dinucleotides, represents a fundamental epigenetic mechanism for regulating gene expression without altering the underlying DNA sequence [6]. This stable epigenetic mark plays crucial roles in numerous biological processes, including embryonic development, genomic imprinting, X-chromosome inactivation, and maintaining chromatin structure [6] [103]. Importantly, aberrant DNA methylation patterns are strongly associated with various disease states, particularly cancer, where hypermethylation of tumor suppressor gene promoters can lead to their silencing, while global hypomethylation may contribute to genomic instability [104].
The emergence of high-throughput sequencing technologies has revolutionized the field of epigenetics, enabling genome-wide profiling of DNA methylation patterns at single-base resolution [6]. Whole-genome bisulfite sequencing (WGBS) is widely regarded as the gold standard for comprehensive DNA methylation analysis, providing coverage of approximately 28 million CpGs in the human genome [20] [103]. However, WGBS remains cost-prohibitive for large sample sizes, leading to the development of alternative approaches including reduced representation bisulfite sequencing (RRBS), which focuses on CpG-rich regions, and enzymatic methyl sequencing (EM-seq), which offers a less damaging alternative to bisulfite conversion [20] [105] [106].
The integration of machine learning with DNA methylation data has opened new frontiers in predictive disease modeling and classification. By leveraging the highly tissue-specific nature of DNA methylation patterns, researchers can develop classifiers capable of determining tissue of origin from complex samples like cell-free DNA (cfDNA), distinguishing disease subtypes with prognostic significance, and predicting treatment response [107] [108] [109]. This application note provides detailed protocols and methodologies for implementing machine learning approaches to DNA methylation data, with particular emphasis on bisulfite sequencing workflows and their clinical and research applications.
Experimental Design and Data Generation Protocols
DNA Methylation Profiling Technologies
Multiple experimental approaches are available for generating DNA methylation data, each with distinct advantages and limitations. The selection of an appropriate profiling technology depends on factors including required resolution, genome coverage, sample throughput, and budget constraints.
Bisulfite Sequencing Methods rely on the differential sensitivity of cytosine and 5-methylcytosine to bisulfite conversion, where unmethylated cytosines are deaminated to uracil while methylated cytosines remain unchanged [20] [6]. The primary bisulfite-based methods include:
Whole-Genome Bisulfite Sequencing (WGBS): This method provides the most comprehensive coverage of methylation patterns across the entire genome, enabling identification of non-CG methylation, partially methylated domains, and methylation valleys [20]. A typical WGBS protocol involves shearing genomic DNA, end-repair, adapter ligation, bisulfite conversion, PCR amplification, and sequencing [110]. Despite its advantages, WGBS remains expensive for large sample sizes and requires substantial sequencing depth for reliable methylation calling.
Reduced Representation Bisulfite Sequencing (RRBS): This cost-effective alternative utilizes restriction enzymes (typically MspI) to digest genomic DNA, enriching for CpG-rich regions including promoters and CpG islands [20]. RRBS covers approximately 2-3 million CpGs in the human genome, significantly reducing sequencing costs while maintaining focus on functionally relevant genomic regions [103].
Enzymatic Methyl Sequencing (EM-seq) represents an emerging alternative that avoids DNA damage associated with bisulfite treatment. This method utilizes TET2 and T4-BGT enzymes to protect modified cytosines through oxidation and glucosylation, followed by APOBEC-mediated deamination of unmodified cytosines to uracil [105] [106]. EM-seq benefits from reduced DNA degradation, lower duplication rates, more uniform genomic coverage, and minimal sequence-specific artifacts compared to bisulfite-based methods [106].
Methylation Arrays, particularly the Illumina Infinium platforms, provide a cost-effective solution for profiling large sample cohorts at predetermined CpG sites [6] [104]. The GoldenGate assay adaptation for methylation detection exemplifies this approach, where bisulfite-converted DNA is genotyped for C/T polymorphisms representing methylated/unmethylated states [104]. While arrays offer limited genome coverage compared to sequencing methods, they provide excellent reproducibility and sensitivity for targeted methylation analysis [6].
Quality Control and Preprocessing
Robust quality control measures are essential for generating reliable methylation data. For bisulfite-based methods, conversion efficiency must exceed 99% to minimize false positives, which can be monitored using spiked-in control DNAs [104]. Additional quality metrics include sequencing depth distribution, bisulfite conversion rates, and nucleotide frequency analysis to identify potential biases [20].
Data preprocessing typically involves:
- Adapter Trimming: Removal of sequencing adapters from raw reads
- Quality Filtering: Discarding low-quality reads based on Phred scores
- Alignment: Mapping bisulfite-treated reads to a reference genome using specialized aligners such as Bismark or bwa-meth [20]
- Methylation Calling: Quantifying methylation levels at each cytosine as the ratio of methylated reads to total coverage [20]
Table 1: Comparison of DNA Methylation Profiling Technologies
| Technology | Resolution | Coverage | Relative Cost | Best Applications |
|---|---|---|---|---|
| WGBS | Single-base | ~28M CpGs | High | Discovery studies, non-CG methylation |
| RRBS | Single-base | 2-3M CpGs | Medium | Targeted profiling, large cohorts |
| EM-seq | Single-base | Comparable to WGBS | Medium | Degradation-sensitive samples |
| Methylation Arrays | Predetermined | 0.5-1M CpGs | Low | Clinical screening, large epidemiology studies |
Computational Analysis Workflows
Data Processing and Alignment
The initial computational analysis of bisulfite sequencing data involves processing raw sequencing files to generate methylation calls for individual CpG sites. The nf-core methylseq pipeline provides a standardized workflow for this process, incorporating either Bismark or bwa-meth as alignment tools [20].
A typical processing workflow includes:
- Quality Control: FastQC for assessing read quality
- Adapter Trimming: Trim Galore for removing adapter sequences
- Alignment: Bismark for mapping bisulfite-treated reads to a reference genome
- Deduplication: Removal of PCR duplicates
- Methylation Extraction: Generating coverage files containing methylated and unmethylated read counts per CpG
The resulting coverage files serve as the input for downstream differential methylation analysis and machine learning applications [20]. These files typically contain chromosome coordinates, CpG positions, and counts of methylated and unmethylated reads.
Differential Methylation Analysis
Identifying differentially methylated regions (DMRs) between sample groups represents a core objective in many epigenetic studies. Multiple computational tools are available for DMR detection, including:
- methylKit: An R package providing comprehensive functionality for bisulfite sequencing data analysis, including sample clustering, quality control, and differential methylation analysis at both CpG and regional levels [20]
- dmrseq: A Bioconductor package utilizing a permutation-based framework to identify DMRs while controlling for false discovery rates [105]
- RnBeads: A comprehensive analysis tool that supports multiple DNA methylation assays and provides extensive functionality for data visualization, quality control, and differential methylation analysis [103]
These tools enable the identification of statistically significant DMRs that can serve as features for machine learning classifiers, linking epigenetic alterations to phenotypic outcomes such as disease status or treatment response [103].
Machine Learning Implementation for Methylation-Based Classification
Feature Selection and Engineering
The high-dimensional nature of DNA methylation data presents challenges for machine learning applications, necessitating careful feature selection to avoid overfitting and enhance model interpretability. Effective strategies include:
- Variance-Based Filtering: Removing CpG sites with minimal variability across samples
- Recursive Feature Elimination (RFE): Iteratively removing the least important features based on model performance [108]
- Domain Knowledge Integration: Prioritizing CpG sites in functionally relevant genomic regions such as promoters, enhancers, or CpG islands [6]
In studies predicting antidepressant treatment response, RFE with random forest (RFE-RF) successfully identified informative TPH2 CpG sites and clinical features that optimized prediction accuracy [108]. Similarly, tissue-specific methylation signatures were leveraged for cfDNA classification through careful feature selection [107].
Classifier Training and Validation
Multiple machine learning algorithms have demonstrated utility in methylation-based classification tasks. The selection of an appropriate algorithm depends on the specific research question, dataset size, and feature characteristics.
Table 2: Performance Comparison of Machine Learning Algorithms in Methylation Classification
| Application | Best Performing Algorithm | Key Features | Performance Metrics |
|---|---|---|---|
| Tissue of Origin Classification [107] | Random Forest | Genome-wide methylation patterns | Testing accuracy: 82% |
| Early Antidepressant Response [108] | Random Forest with RFE | TPH2 CpG sites + clinical features | AUC: 72.9% (95% CI: 71.8-74.0%) |
| JMML Methylation Subgroup Prediction [109] | Decision Tree | Age, HbF, PTPN11 mutation status | Concordance: 82.3% |
| Disease Detection in Arthritis [107] | Random Forest | Synovial vs. PBMC methylation profiles | ROC AUC: 1.0 |
Random Forest algorithms have consistently demonstrated strong performance across multiple methylation classification tasks, effectively handling high-dimensional data while providing measures of feature importance [107] [108]. The ensemble approach of random forests reduces overfitting risk, making them particularly suitable for methylation datasets where features often outnumber samples.
Support Vector Machines (SVM) represent another powerful approach, particularly effective when data separation requires complex decision boundaries [109]. In JMML methylation subgroup prediction, SVM achieved 83.6% concordance with array-based methylation classification [109].
Decision Trees offer high interpretability, making them valuable for clinical applications where understanding feature relationships is essential. In JMML classification, decision trees utilizing age, hemoglobin F levels, and mutation status achieved 82.8% concordance with molecular subtyping [109].
Proper validation represents a critical component of classifier development. k-fold cross-validation (typically 5- or 10-fold) provides robust performance estimation while maximizing data utility [107] [108]. External validation using completely independent cohorts represents the gold standard for assessing generalizability, as demonstrated in the JMML classification study where models trained on one cohort (n=128) maintained predictive accuracy in an independent cohort (n=72) [109].
Application Case Studies
Tissue of Origin Determination from Cell-Free DNA
Liquid biopsy approaches utilizing cfDNA have emerged as powerful non-invasive diagnostic tools, with accurate tissue of origin determination representing a critical challenge. A recent study addressed this by developing a random forest classifier leveraging tissue-specific methylation signatures across multiple sequencing platforms [107].
The methodology included:
- Reference Atlas Development: Integration of 223 cell type methylation profiles from diverse human organs
- Data Harmonization: Application of K-nearest neighbor (KNN) imputation to address platform-specific variability and sparsity
- Dimensionality Reduction: Uniform Manifold Approximation and Projection (UMAP) confirmed distinct clustering by tissue type
- Model Validation: In silico mixture experiments demonstrated strong correlation between predicted probabilities and true tissue proportions
This approach achieved classification accuracies of 75-80% across testing sets and platforms, successfully distinguishing clinically relevant tissues such as inflamed synovium and peripheral blood mononuclear cells (PBMCs) in arthritis patients [107]. The model's ability to deconvolute synthetic cfDNA mixtures highlights its potential for real-world liquid biopsy applications.
Predictive Biomarkers for Antidepressant Treatment Response
Major depressive disorder exhibits significant heterogeneity in treatment response, creating an urgent need for predictive biomarkers. A machine learning approach integrating clinical and epigenetic features addressed this challenge by predicting early antidepressant response after a 2-week treatment period [108].
Key methodological aspects included:
- Feature Set Integration: Combining demographic information, environmental stress factors, and methylation levels of 38 CpG sites in the TPH2 gene
- Missing Data Handling: Application of mean imputation for missing methylation values after excluding sites with >45% missingness
- Algorithm Comparison: Evaluation of five classification approaches (logistic regression, classification and regression trees, SVM, logitboost, and random forests)
- Performance Validation: 5-fold cross-validation with 10 repeats to ensure reproducibility
The random forest model with recursive feature elimination demonstrated superior performance (AUC=72.9%), outperforming models based solely on clinical (AUC=61.2%) or methylation (AUC=66.6%) features [108]. This integrated approach highlights the potential of combining epigenetic and clinical data for enhanced treatment prediction.
Molecular Subtyping in Juvenile Myelomonocytic Leukemia
DNA methylation profiling has identified clinically relevant subgroups in JMML with distinct prognostic implications. To overcome the cost and turnaround time limitations of genome-wide methylation analysis, researchers developed machine learning models using routinely available clinical parameters to predict methylation subgroups [109].
The implementation included:
- International Cohort: Aggregated data from 128 patients across multiple institutions
- Multiple Algorithms: Comparison of decision tree, SVM, and naïve Bayes models
- Binary and Ternary Classification: Dichotomized (high/intermediate vs. low methylation) and trichotomized (high, intermediate, low) subgroup prediction
- Survival Validation: Assessment of prognostic significance in independent cohorts (n=72)
Decision tree models achieved 82.3% and 82.8% concordance with array-based methylation classification for dichotomized and trichotomized subgroups, respectively [109]. Most importantly, the machine learning-predicted subgroups maintained significant prognostic stratification for overall and transplantation-free survival, enabling risk stratification without requiring specialized methylation arrays.
Successful implementation of methylation-based machine learning classifiers requires both wet-lab and computational resources. The following table summarizes key reagents and tools referenced in the application studies.
Table 3: Essential Research Reagents and Computational Tools for Methylation-Based Classification
| Resource Category | Specific Tools/Reagents | Application Purpose | Key Features |
|---|---|---|---|
| Wet-Lab Protocols | Whole-Genome Bisulfite Sequencing | Comprehensive methylation profiling | Single-base resolution, genome-wide coverage [20] [110] |
| Reduced Representation Bisulfite Sequencing (RRBS) | Targeted methylation profiling | Cost-effective, CpG island coverage [20] [103] | |
| Enzymatic Methyl Sequencing (EM-seq) | Degradation-free methylation profiling | TET2/APOBEC conversion, minimal bias [105] [106] | |
| Data Processing Tools | Bismark | Read alignment & methylation extraction | Handles bisulfite-converted reads [20] |
| nf-core/methylseq | End-to-end processing pipeline | Standardized workflow, multiple aligners [20] | |
| methylKit | Differential methylation analysis | R package, quality control, DMR detection [20] | |
| Machine Learning Environments | R/caret | Unified ML framework | Multiple algorithms, hyperparameter tuning [108] |
| Python/scikit-learn | General ML implementation | Comprehensive algorithm collection [107] | |
| RnBeads | Comprehensive methylation analysis | Quality control, visualization, DMR detection [103] | |
| Specialized Packages | NanoMethViz | Long-read methylation visualization | modBAM file support, single-read resolution [105] |
| dmrseq | DMR detection | Permutation-based approach, FDR control [105] |
The integration of machine learning with DNA methylation data represents a powerful paradigm for disease classification, prognosis prediction, and treatment response forecasting. The case studies presented demonstrate consistent success across diverse clinical contexts, from oncology to psychiatry, highlighting the generalizability of these approaches.
Key success factors emerging from these studies include:
- Multi-Feature Integration: Combining epigenetic markers with clinical parameters consistently outperforms single-data-type models [108] [109]
- Appropriate Algorithm Selection: Random forest algorithms demonstrate particular strength for high-dimensional methylation data [107] [108]
- Rigorous Validation: Independent cohort validation remains essential for assessing clinical utility [109]
Future developments will likely focus on standardized preprocessing pipelines to enhance cross-study reproducibility, multi-omics integration combining methylation with genetic and transcriptomic data, and automated model deployment in clinical settings. As methylation profiling technologies continue to evolve toward higher throughput and lower costs, methylation-based machine learning classifiers will play an increasingly prominent role in precision medicine approaches across diverse therapeutic areas.
Utilizing Public Databases (MethAgingDB) for Benchmarking and Context
In the field of epigenetics, particularly in DNA methylation research, the emergence of comprehensive public databases has revolutionized our approach to data analysis and interpretation. MethAgingDB stands out as a specialized resource that directly addresses the critical need for organized, accessible DNA methylation data within the context of aging biology. This database provides preprocessed DNA methylation data in a consistent matrix format, along with tissue-specific differentially methylated sites (DMSs) and regions (DMRs), gene-centric aging insights, and an extensive collection of epigenetic clocks [111] [112]. For researchers analyzing bisulfite sequencing data, MethAgingDB offers an invaluable benchmarking tool and biological context that significantly enhances the interpretation of findings. The integration of such databases into analytical workflows is particularly crucial for aging studies, where understanding the pace of biological aging requires comparison against well-established normative methylation patterns [113].
MethAgingDB represents a significant advancement in the field of aging epigenetics by systematically addressing previous challenges in data accessibility and standardization. The current version includes 93 datasets, comprising 11,474 profiles from 13 distinct human tissues and 1,361 profiles from 9 distinct mouse tissues [111] [112]. This expansive collection covers a wide spectrum of age groups, from childhood to old age, providing researchers with an unprecedented resource for comparative analysis.
Table 1: MethAgingDB Data Composition
| Category | Human Data | Mouse Data |
|---|---|---|
| Total Profiles | 11,474 | 1,361 |
| Tissues Covered | 13 distinct tissues | 9 distinct tissues |
| Age Groups (Human) | Under 20, 20-40, 40-60, 60-80, over 80 years | N/A |
| Data Formats | Preprocessed matrices (beta values), DMSs, DMRs | Preprocessed matrices (beta values), DMSs, DMRs |
| Primary Applications | Age-associated epigenetic signatures, cross-species comparisons, feature selection for aging models | Age-associated epigenetic signatures, cross-species comparisons |
The database encompasses data generated from multiple profiling platforms, including Illumina Infinium HumanMethylation450 BeadChip (450K), MethylationEPIC BeadChip array (EPIC), and whole-genome bisulfite sequencing (WGBS) [111]. This technological diversity enables researchers to select appropriate reference data based on their own experimental methods. All datasets have been uniformly preprocessed and are available in consistent matrix formats, eliminating the traditional bottlenecks associated with data cleaning and normalization [111]. The inclusion of tissue-specific DMSs and DMRs, identified using established computational tools and linked to their closest associated genes, further enhances the utility of MethAgingDB for mechanistic studies of aging [111].
Benchmarking Performance of DNA Methylation Analysis Methods
Comprehensive benchmarking of analytical methods is essential for generating robust, reproducible DNA methylation data. Recent large-scale evaluations have assessed 16 deconvolution algorithms, examining their performance across multiple variables including cell abundance, cell type similarity, reference panel size, profiling methodology (array or sequencing), and technical variation [114]. These benchmarking efforts reveal that algorithm performance varies significantly depending on these factors, emphasizing the need for tailored selection of deconvolution approaches.
Table 2: Performance Metrics for DNA Methylation Deconvolution Methods
| Method Category | Representative Algorithms | Optimal Use Case | Key Performance Considerations |
|---|---|---|---|
| Linear Methods | BVLS, NNLS, OLS, FARDEEP | Well-separated cell types with high-specificity markers | Computational efficiency, interpretability, performance depends on marker specificity |
| Regularized Regression | Elastic Net, Lasso, Ridge Regression | Complex mixtures with correlated cell types | Handles multicollinearity, automatic feature selection, requires parameter tuning |
| Machine Learning/EM | EMeth variants, ICeDT, MethylResolver | Cases with technical noise or missing data | Can model technical artifacts, may have higher computational demands |
| Reference-Based | EpiDISH, Minfi, Meth Atlas | When high-quality reference data available | Performance depends heavily on reference quality and completeness |
The complexity of the cellular reference, marker selection method, number of marker loci, and for sequencing-based assays, sequencing depth have been identified as factors with marked influence on deconvolution performance [114]. Benchmarking studies typically evaluate algorithms using metrics such as root mean square error (RMSE), Spearman's R², and Jensen-Shannon divergence (JSD), which collectively provide insights into both absolute error and correlation between predicted and actual cell proportions [114]. When applying these benchmarks to bisulfite sequencing data, researchers should note that the evenness of sequencing coverage and depth particularly impact accuracy, with deeper sequencing generally enabling more precise deconvolution [114].
Experimental Protocols
Core Bisulfite Sequencing Wet-Lab Protocol
Bisulfite sequencing remains the gold standard for DNA methylation analysis, providing single-base resolution mapping of 5-methylcytosine positions [3] [21] [2]. The following protocol, adapted from current methodologies with proven reliability, describes the essential steps for bisulfite conversion and library preparation:
Genomic DNA Preparation and Bisulfite Conversion
- DNA Extraction and Quality Control: Isolate high-quality genomic DNA using commercial kits (e.g., Wizard Genomic DNA purification kit). Ensure DNA is free from contaminants, with recommended quantities of 1-10 μg for conventional protocols, though lower inputs are possible with modified protocols. Assess DNA quality by spectrophotometry and gel electrophoresis [3] [2].
- Bisulfite Treatment: Denature DNA by boiling in a water bath for 20 minutes, then immediately place on ice. Add freshly prepared 3M NaOH (final concentration 0.3M) and incubate at 42°C for 20 minutes. Add 5M sodium bisulfite solution (pH 5.0) containing 125mM hydroquinone. Layer mineral oil over the reaction to prevent evaporation and incubate in the dark at 50°C for 12-16 hours [3].
- Purification and Desulfonation: Purify bisulfite-treated DNA using commercial clean-up kits (e.g., Wizard DNA clean-up system). Add NaOH to a final concentration of 0.3M and incubate at 37°C for 15 minutes to desulfonate the DNA. Precipitate with ammonium acetate, ethanol, and isopropanol at -20°C for 2-4 hours. Wash with 70% ethanol, dry the pellet, and resuspend in TE buffer or deionized water [3] [2].
Library Preparation and Sequencing
- PCR Amplification: Design bisulfite-specific primers (26-30 bases) that avoid CpG sites when possible. If CpG sites must be included, position them at the 5'-end with a mixed base at the cytosine position. Use high-fidelity "hot start" polymerases and perform 35-40 cycles with annealing temperatures between 55-60°C, optimizing with temperature gradients for new primer sets [3] [2].
- Library Preparation for NGS: For whole-genome bisulfite sequencing, use library preparation kits specifically validated for bisulfite-converted DNA. Incorporate steps to address the AT-rich nature of converted DNA, which may require optimization of adapter ligation and amplification conditions. For targeted approaches, consider hybrid capture or amplicon-based strategies focusing on regions of interest [2] [115].
- Sequencing: Utilize appropriate sequencing platforms based on project scope. For WGBS, Illumina platforms provide the necessary depth and coverage. Ensure sufficient sequencing depth—typically 20-30x for WGBS—to confidently call methylation status at individual CpG sites [2] [115].
Computational Analysis Pipeline for Bisulfite Sequencing Data
The computational analysis of bisulfite sequencing data requires specialized approaches to address the unique characteristics of bisulfite-converted DNA. The following workflow provides a robust framework for processing sequencing data, from quality control to differential methylation analysis:
Diagram: Computational workflow for bisulfite sequencing data analysis with MethAgingDB integration
Quality Control and Preprocessing
- Assessing Conversion Efficiency: Calculate bisulfite conversion efficiency by examining methylation levels in non-CpG contexts or using spiked-in unmethylated controls. Conversion rates should exceed 98% for high-quality data [2] [115]. The presence of high methylation in CHH contexts may indicate incomplete conversion.
- Read Quality Assessment: Use FastQC to evaluate read quality, GC content, adapter contamination, and sequence length distribution. Trim low-quality bases and adapter sequences using tools such as Trim Galore! or Trimmomatic, with particular attention to the specific adapters used in your library preparation [115].
Alignment and Methylation Calling
- Reference-Based Alignment: Select an appropriate aligner designed for bisulfite-converted reads. Bismark and BS-Seeker2 are widely used three-letter aligners that provide high mapping accuracy, though with slightly lower coverage than wild-card aligners like BSMAP [115]. Align to an appropriate reference genome (e.g., hg19 for human, mm10 for mouse).
- Methylation Extraction: Extract methylation calls for individual cytosines using the alignment outputs. The resulting files (typically in CGmap format) should contain information on chromosome, position, strand, sequence context (CG, CHG, CHH), and methylation percentage based on supporting reads [115].
Differential Methylation Analysis and Database Integration
- DMR Identification: Identify differentially methylated regions using tools such as HOME, MethylC-analyzer, or Bicycle that account for the statistical challenges of methylation data, including coverage variability and spatial correlation [115]. Apply appropriate multiple testing corrections (e.g., Benjamini-Hochberg) to control false discovery rates.
- MethAgingDB Contextualization: Compare identified DMRs against age-associated methylation patterns in MethAgingDB to determine whether observed changes align with accelerated or decelerated aging patterns [111] [112]. This integration provides immediate biological context for novel findings and helps prioritize regions for further investigation.
Protocol for Database-Driven Benchmarking Using MethAgingDB
Integrating MethAgingDB into the analytical workflow enables robust benchmarking of experimental findings against established aging methylation patterns:
Reference Dataset Selection and Alignment
- Identify appropriate reference datasets within MethAgingDB based on tissue type, age range, and technology platform matching your experimental data [111].
- Apply consistent preprocessing and normalization methods to both experimental and reference datasets to ensure comparability. For array-based data, use the preprocessed beta matrices provided by MethAgingDB [111].
- Perform cross-dataset normalization if combining multiple reference datasets, using methods such as quantile normalization or reference-based harmonization approaches.
Age Acceleration Analysis
- Calculate epigenetic age using relevant clocks available through MethAgingDB, such as those designed for specific tissues or the pan-tissue clock [111] [112].
- Compute age acceleration residuals by regressing epigenetic age on chronological age for both reference and experimental samples.
- Compare the magnitude and direction of age acceleration in experimental samples relative to appropriate reference populations from MethAgingDB.
Differential Methylation Benchmarking
- Identify DMRs in your experimental data using standardized thresholds (e.g., minimum methylation difference of 10%, adjusted p-value < 0.05).
- Overlap experimental DMRs with age-associated DMRs cataloged in MethAgingDB, calculating enrichment statistics using hypergeometric tests.
- Annotate shared DMRs with gene associations and functional annotations provided by MethAgingDB to identify biological processes potentially affected by observed methylation changes.
The Scientist's Toolkit: Essential Research Reagents and Computational Tools
Successful execution of bisulfite sequencing experiments and subsequent analysis requires specific reagents, kits, and computational resources. The following table details essential components for implementing the protocols described in this application note:
Table 3: Essential Research Reagents and Computational Tools for DNA Methylation Analysis
| Category | Item | Specification/Purpose | Example Products/Alternatives |
|---|---|---|---|
| Wet-Lab Reagents | DNA Extraction Kit | High-quality genomic DNA isolation | Wizard Genomic DNA Purification Kit, QIAamp DNA Mini Kit |
| Bisulfite Conversion Kit | Efficient conversion of unmethylated cytosines | EpiTect Bisulfite Kit, EZ DNA Methylation-Lightning Kit | |
| High-Fidelity PCR Polymerase | Accurate amplification of bisulfite-converted DNA | Hot Start Taq Polymerases, Pfu Turbo Cx | |
| Library Preparation Kit | NGS library construction from converted DNA | KAPA HyperPrep Kit, Illumina DNA Prep | |
| Computational Tools | Quality Control | Assessing read quality and conversion efficiency | FastQC, MultiQC |
| Bisulfite-Aware Aligner | Mapping converted reads to reference genome | Bismark, BS-Seeker2, BSMAP | |
| DMR Caller | Identifying differentially methylated regions | HOME, MethylC-analyzer, Bicycle | |
| Visualization | Exploring methylation patterns and results | IGV, methylKit, custom R/Python scripts | |
| Reference Databases | Methylation Database | Contextualizing findings within aging biology | MethAgingDB, MethBank |
| Annotation Resources | Functional interpretation of DMRs | ENSEMBL, UCSC Genome Browser, GO |
Analysis and Interpretation of Integrated Data
The integration of experimental bisulfite sequencing data with MethAgingDB enables sophisticated interpretation of methylation patterns within the context of biological aging. This analytical approach facilitates distinguishing between methylation changes that represent accelerated aging versus those that reflect normal age-associated patterns [111] [112] [113]. When DMRs identified in experimental data significantly overlap with age-associated DMRs cataloged in MethAgingDB, researchers can infer potential connections to aging processes. Furthermore, by calculating epigenetic age using clocks available through MethAgingDB, investigators can quantify whether experimental conditions or interventions are associated with decelerated or accelerated epigenetic aging [112] [113].
The application of benchmarking data from method comparison studies further strengthens these analyses by ensuring that methodological artifacts are minimized and results are biologically meaningful [114]. For instance, understanding that deconvolution performance varies with cell type complexity and marker selection informs the interpretation of cellular mixture analyses in age-associated tissues [114]. This multidimensional approach to data analysis and interpretation, combining rigorous computational analysis with comprehensive database contextualization, represents the current state-of-the-art in DNA methylation research, particularly in the field of aging biology.
DNA methylation, the covalent addition of a methyl group to a cytosine base, typically at CpG dinucleotides, is a fundamental epigenetic mark that regulates gene transcription, cellular differentiation, and genomic stability [2] [18]. In cancer and other diseases, specific DNA methylation patterns undergo dramatic alterations, often occurring early during carcinogenesis, making them exceptionally promising biomarkers for early detection, diagnosis, and monitoring [116] [117]. Bisulfite sequencing has emerged as the gold standard technique for detecting these methylation changes due to its single-base resolution and quantitative capabilities [20] [18]. The core principle involves treating DNA with sodium bisulfite, which converts unmethylated cytosines to uracils (read as thymines after PCR amplification), while methylated cytosines remain protected and are still read as cytosines [2]. This process effectively translates epigenetic information into sequence information that can be decoded by sequencing technologies.
The clinical application of these biomarkers, particularly through liquid biopsy—the analysis of cell-free DNA (cfDNA) in blood—represents a transformative approach to non-invasive cancer diagnostics [118] [117]. Liquid biopsy of methylation biomarkers enables early cancer detection, monitoring for minimal residual disease, predicting treatment response, and tracing the tissue origin of cancers [117]. This application note details the complete workflow from initial biomarker discovery through analytical validation and clinical application, providing researchers with structured protocols, performance data, and essential methodological considerations for implementing bisulfite sequencing in clinical translation studies.
Biomarker Discovery and Analytical Validation
Discovery Platforms and Workflow
The initial discovery of clinically relevant DNA methylation biomarkers typically employs comprehensive, genome-scale profiling methods. Whole-genome bisulfite sequencing (WGBS) represents the most extensive approach, providing single-nucleotide resolution methylation data across the entire genome, including non-CpG contexts and repetitive regions [18]. However, WGBS remains costly for large sample sizes. As a cost-effective alternative, Reduced Representation Bisulfite Sequencing (RRBS) uses restriction enzymes (e.g., MspI) to selectively enrich for CpG-rich regions of the genome, such as promoters and CpG islands, thereby reducing sequencing costs while still capturing biologically informative methylation sites [20] [2]. For biomarker discovery, these unbiased approaches are applied to case-control sample sets to identify Differentially Methylated Regions (DMRs) that consistently distinguish disease states from healthy conditions.
The subsequent validation phase requires transitioning from discovery platforms to targeted assays suitable for clinical implementation. As detailed in Table 1, multiplex bisulfite PCR sequencing (MBPS) has emerged as a powerful validation technology that combines high sensitivity with the ability to interrogate multiple genomic regions simultaneously in limited clinical material [119]. This targeted approach is particularly suited for analyzing formalin-fixed paraffin-embedded (FFPE) tissue and circulating cell-free DNA (cfDNA), where DNA quantity and quality are major constraints [119].
Table 1: Key Analytical Techniques for DNA Methylation Biomarker Development
| Technique | Resolution | Advantages | Disadvantages | Best Application Stage |
|---|---|---|---|---|
| Whole-Genome Bisulfite Sequencing (WGBS) | Single-base | Comprehensive genome coverage; detects non-CpG methylation | High cost; computationally intensive | Initial biomarker discovery |
| Reduced Representation Bisulfite Sequencing (RRBS) | Single-base | Cost-effective; focuses on CpG-rich regions | Limited to enzyme-cut regions; misses some regulatory elements | Biomarker discovery and refinement |
| Methylation-Sensitive Restriction Enzyme Sequencing (MRE-Seq) | Region-based | Less DNA degradation; no bisulfite conversion artifacts | Limited by enzyme recognition sites; lower resolution | Liquid biopsy applications [118] |
| Multiplex Bisulfite PCR Sequencing (MBPS) | Single-base | High sensitivity; low input requirements; multiplexing capability | Requires prior knowledge of target regions; optimization intensive | Clinical validation & liquid biopsy [119] |
Analytical Validation of Methylation Biomarkers
Robust analytical validation is crucial for translating methylation biomarkers into clinical applications. Key performance parameters include sensitivity, specificity, and reproducibility across multiple sample batches. As demonstrated in a study on colorectal cancer, the TriMeth test—which assesses three DNA methylation markers (C9orf50, KCNQ5, and CLIP4)—achieved an average sensitivity of 85% across stages I-IV colorectal cancer at 99% specificity in two independent plasma cohorts [116]. Stage-specific sensitivities were particularly informative: 80% for stage I, 85% for stage II, 89% for stage III, and 88% for stage IV, demonstrating consistent performance across disease stages [116].
For liquid biopsy applications, the ability to detect cancer signals in early disease stages is paramount. A recent study utilizing methylation-sensitive restriction enzyme sequencing (MRE-Seq) with deep neural network analysis reported a sensitivity of 78.1% for colorectal cancer and 66.3% for lung cancer at a specificity of 99.2% [118]. For colorectal cancer, sensitivities ranged from 76.2% to 83.3% across stages I-IV, while for lung cancer, sensitivities ranged from 44.4% to 78.9%, with the lower sensitivity in early-stage lung cancer highlighting the need for further biomarker refinement [118].
Table 2: Performance Characteristics of Validated Methylation Biomarker Panels in Liquid Biopsy
| Biomarker Panel | Cancer Type | Sensitivity by Stage | Overall Sensitivity | Specificity | AUC |
|---|---|---|---|---|---|
| TriMeth (C9orf50, KCNQ5, CLIP4) [116] | Colorectal | Stage I: 80%Stage II: 85%Stage III: 89%Stage IV: 88% | 85% | 99% | 0.86-0.91 (individual markers) |
| MRE-Seq with DNN [118] | Colorectal | Stages I-IV: 76.2-83.3% | 78.1% | 99.2% | 0.978 |
| MRE-Seq with DNN [118] | Lung | Stages I-IV: 44.4-78.9% | 66.3% | 99.2% | 0.956 |
Experimental Protocols
Multiplex Bisulfite PCR Sequencing (MBPS) Protocol
MBPS is a highly sensitive targeted approach for validating methylation biomarkers in clinical samples with limited material [119]. The following protocol outlines the key steps and critical optimization parameters:
Step 1: Primer Design and Panel Construction
- Design primers targeting validated DMRs using multiplex-specific software (e.g., PrimerSuite [119]).
- Design primers to avoid CpG sites where possible; if unavoidable, position mixed bases at the 5'-end.
- Aim for amplicons between 150-300 bp to accommodate degraded clinical DNA.
- Include unique molecular identifiers (UMIs) to enable duplicate removal and improve quantification accuracy.
Step 2: Bisulfite Conversion
- Extract DNA from clinical samples (FFPE tissue, plasma cfDNA, etc.).
- Treat 5-50 ng DNA with sodium bisulfite using commercial bisulfite conversion kits.
- Validate conversion efficiency using spiked-in unmethylated controls (e.g., λ-bacteriophage DNA); aim for >99% conversion efficiency [18].
- Elute converted DNA in low TE buffer or nuclease-free water.
Step 3: Pre-sequencing PCR Optimization
- Perform singleplex PCR with each primer pair to verify specificity and minimize primer-dimer formation.
- Optimize annealing temperature using a gradient PCR (typically 55-65°C).
- Determine optimal primer concentration for multiplexing (typically 1-20 μM per primer); 10 μM often works well [119].
- Titrate DNA input (0.625-10 ng) to determine minimum requirements while maintaining coverage.
Step 4: Multiplex Bisulfite PCR
- Pool optimized primers into multiplex panels.
- Perform multiplex PCR with optimized conditions:
- Initial denaturation: 95°C for 5-10 minutes
- 35-40 cycles of: 95°C for 30s, optimized Tm for 30s, 72°C for 30-60s
- Final extension: 72°C for 5-7 minutes
- Use high-fidelity "hot start" polymerases to reduce non-specific amplification [2].
Step 5: Library Preparation and Sequencing
- Purify PCR products and quantify using fluorometric methods.
- Prepare sequencing libraries with dual indexing to enable sample multiplexing.
- Sequence on appropriate NGS platforms to achieve sufficient coverage (>1000x per amplicon recommended) [119].
Step 6: Post-sequencing Quality Control and Optimization
- Assess sequencing coverage uniformity across amplicons.
- For amplicons with low coverage (<100x), consider:
- Re-optimizing primer concentration (increase low-coverage primers, decrease high-coverage competitors)
- Creating sub-panels for problematic primers
- Redesigning inefficient primers
- Use bioinformatic pipelines (e.g., MethPanel [119]) for read alignment, methylation calling, and quality control.
Liquid Biopsy-Specific MRE-Seq Protocol
Methylation-Sensitive Restriction Enzyme Sequencing (MRE-Seq) offers an alternative to bisulfite-based methods for liquid biopsy applications, with potential advantages for cfDNA analysis [118]:
Step 1: Plasma Collection and cfDNA Extraction
- Collect blood in specialized cfDNA collection tubes (e.g., NICE cfDNA tube) [118].
- Centrifuge at 1900×g for 10 minutes followed by 13,000×g for 5 minutes for plasma separation.
- Extract cfDNA from 3.5-4 mL plasma using optimized kits (e.g., chemagic cfNA 5k Kit).
- Assess cfDNA quality and quantity using fluorometry and fragment analyzers.
Step 2: Methylation-Sensitive Restriction Enzyme Digestion
- Digest cfDNA with methylation-sensitive restriction enzymes (e.g., SacII [118]).
- Set up digestion reactions with appropriate buffers and enzyme units.
- Incubate at optimal temperature for the specific enzyme (typically 2-4 hours).
- Include control reactions without enzyme to assess background.
Step 3: Library Preparation and Sequencing
- Prepare sequencing libraries from digested DNA using NGS library preparation kits.
- Incorporate adapters with unique barcodes for sample multiplexing.
- Amplify libraries with limited cycle PCR to maintain representation.
- Sequence on appropriate NGS platforms to sufficient depth.
Step 4: Data Analysis and Deep Neural Network Processing
- Process raw sequencing data through quality control and alignment pipelines.
- Extract demethylation patterns from 63,266 CpG sites (as used in [118]).
- Apply deep neural network (DNN) models for cancer detection and cancer signal origin (CSO) classification.
- Validate model performance on independent test sets.
Visualization of Workflows and Methodologies
DNA Methylation Analysis Clinical Translation Workflow
Multiplex Bisulfite PCR Sequencing Protocol
The Scientist's Toolkit: Essential Research Reagents and Materials
Successful implementation of DNA methylation biomarker studies requires careful selection of reagents and materials optimized for bisulfite-based methodologies. Table 3 details essential components for establishing robust methylation analysis workflows in clinical research settings.
Table 3: Essential Research Reagent Solutions for Bisulfite Sequencing Studies
| Reagent/Material | Function | Key Considerations | Example Applications |
|---|---|---|---|
| Bisulfite Conversion Kits | Chemical conversion of unmethylated cytosines to uracils | Conversion efficiency (>99%); DNA fragmentation minimization; compatibility with low-input samples | All bisulfite sequencing methods [2] [18] |
| Methylation-Sensitive Restriction Enzymes (e.g., SacII) | Selective digestion of unmethylated recognition sites | Enzyme specificity; star activity; compatibility with cfDNA | MRE-Seq for liquid biopsy [118] |
| High-Fidelity Hot-Start Polymerases | Amplification of bisulfite-converted DNA | Reduced error rate; minimized non-specific amplification; AT-rich template compatibility | MBPS, targeted bisulfite sequencing [2] [119] |
| Methylated/Unmethylated Control DNA | Process controls for conversion efficiency and assay performance | Defined methylation status; compatibility with study organism; stability | Quality control across all methods [2] [18] |
| cfDNA Extraction Kits | Isolation of cell-free DNA from plasma | High recovery efficiency; removal of PCR inhibitors; compatibility with downstream applications | Liquid biopsy studies [118] [117] |
| Unique Molecular Identifiers (UMIs) | Tagging individual molecules to correct PCR duplicates | Compatibility with library prep; minimal sequence bias; cost-effectiveness | MBPS, targeted sequencing [119] |
| Multiplex-Specific Primer Design Software | Designing primers for simultaneous amplification of multiple targets | Avoidance of primer-dimers; CpG-aware design; amplicon size optimization | MBPS panel development [119] |
The translation of DNA methylation biomarkers from discovery to clinical liquid biopsy applications represents a rapidly advancing frontier in molecular diagnostics. Bisulfite sequencing methodologies, particularly targeted approaches like MBPS and alternative methods like MRE-Seq, provide the analytical foundation for developing clinically viable tests with demonstrated sensitivity and specificity for early cancer detection [116] [118] [119]. The successful implementation of these technologies requires rigorous analytical validation, careful optimization for specific sample types (especially FFPE tissue and cfDNA), and appropriate bioinformatic analysis pipelines. As these technologies continue to mature and validation studies expand, DNA methylation analysis in liquid biopsies holds tremendous promise for transforming cancer screening, diagnosis, and monitoring through minimally invasive approaches. The protocols and analytical frameworks presented herein provide researchers with practical guidance for advancing DNA methylation biomarkers through the development pipeline toward clinical utility.
Conclusion
The analysis of DNA methylation data from bisulfite sequencing is a powerful but multi-faceted process. A successful outcome relies on a solid understanding of the underlying biochemistry, a robust and well-executed bioinformatics workflow, proactive troubleshooting, and rigorous validation. As the field advances, the integration of machine learning and the development of comprehensive public databases are set to further enhance the precision and clinical applicability of methylation-based biomarkers. Future directions will likely focus on standardizing analysis pipelines across platforms, improving the sensitivity for detecting methylation in low-input samples like liquid biopsies, and translating these intricate molecular profiles into actionable diagnostics and targeted therapies for complex diseases like cancer and age-related disorders.
References
- 1. DNA methylation - Wikipedia [https://en.wikipedia.org/wiki/DNA_methylation]
- 2. in Bisulfite | Abcam sequencing DNA methylation analysis [https://www.abcam.com/en-us/knowledge-center/dna-and-rna/bisulfite-sequencing]
- 3. detection: DNA genomic methylation ... Bisulfite sequencing analysis [https://pmc.ncbi.nlm.nih.gov/articles/PMC3233226/]
- 4. Bisulfite sequencing - Wikipedia [https://en.wikipedia.org/wiki/Bisulfite_sequencing]
- 5. Sequencing (BS-Seq)/WGBS Bisulfite [https://emea.illumina.com/techniques/sequencing/methylation-sequencing/bisulfite-sequencing.html]
- 6. DNA methylation data by sequencing: experimental approaches and recommendations for tools and pipelines for data analysis | Clinical Epigenetics | Full Text [https://clinicalepigeneticsjournal.biomedcentral.com/articles/10.1186/s13148-019-0795-x]
- 7. and Workflow of Whole Genome Principles ... - CD Genomics Bisulfite [https://www.cd-genomics.com/principles-and-workflow-of-whole-genome-bisulfite-sequencing.html]
- 8. DNA Methylation & Bisulfite Conversion [https://www.sigmaaldrich.com/US/en/technical-documents/technical-article/genomics/epigenetics/dna-methylation-bisulfite-conversion]
- 9. How To Analyze DNA Methylation Data For Absolute Beginners Part 2: From Raw Data to Methylation Calls with WGBS and RRBS - NGS Learning Hub [https://ngs101.com/how-to-analyze-dna-methylation-data-for-absolute-beginners-part-2-from-raw-data-to-methylation-calls-with-wgbs-and-rrbs/]
- 10. Beyond the base pairs: comparative genome-wide DNA methylation... [https://pubmed.ncbi.nlm.nih.gov/39256199/]
- 11. Bisulfite Sequencing for DNA Methylation Analysis of Primary Muscle Stem Cells - PMC [https://pmc.ncbi.nlm.nih.gov/articles/PMC6433475/]
- 12. MeDIP-seq vs. RRBS vs. WGBS - CD Genomics [https://www.cd-genomics.com/resource-medip-seq-vs-rrbs-vs-wgbs.html]
- 13. What is RRBS ? | ZYMO RESEARCH [https://www.zymoresearch.de/blogs/blog/what-is-rrbs]
- 14. of whole-genome Comparison library... bisulfite sequencing [https://genomebiology.biomedcentral.com/articles/10.1186/s13059-018-1408-2]
- 15. Whole Genome Bisulfite Sequencing (WGBS) Data Analysis Pipeline - CD Genomics [https://www.cd-genomics.com/whole-genome-bisulfite-sequencing-wgbs-data-analysis-pipeline.html]
- 16. An integrated package for bisulfite DNA methylation data analysis with Indel-sensitive mapping | BMC Bioinformatics | Full Text [https://bmcbioinformatics.biomedcentral.com/articles/10.1186/s12859-018-2593-4]
- 17. Analysis and performance assessment of the whole genome bisulfite ... [https://pmc.ncbi.nlm.nih.gov/articles/PMC8963483/]
- 18. A Practical Guide to the Measurement and Analysis of DNA Methylation - PMC [https://pmc.ncbi.nlm.nih.gov/articles/PMC6775954/]
- 19. DNA Methyltransferase Inhibitors and Their Emerging Role in Epigenetic Therapy of Cancer | Anticancer Research [https://ar.iiarjournals.org/content/33/8/2989]
- 20. : DNA Workflow — Epigenomics... Methylation Bisulfite Sequencing [https://nbis-workshop-epigenomics.readthedocs.io/en/latest/content/tutorials/methylationSeq/Seq_Tutorial.html]
- 21. A Practical Guide to the Measurement and Analysis of DNA Methylation [https://pubmed.ncbi.nlm.nih.gov/31264905/]
- 22. GitHub - yupenghe/methylpy: WGBS/NOMe-seq Data Processing & Differential Methylation Analysis [https://github.com/yupenghe/methylpy]
- 23. Systematic and benchmarking studies of pipelines for mammal WGBS ... [https://bmcbioinformatics.biomedcentral.com/articles/10.1186/s12859-023-05163-w]
- 24. ADMIRE: analysis and visualization of differential methylation in... [https://epigeneticsandchromatin.biomedcentral.com/articles/10.1186/s13072-015-0045-1]
- 25. Methy- Pipe : an integrated bioinformatics for whole genome... pipeline [https://pubmed.ncbi.nlm.nih.gov/24945300/]
- 26. plotMeth: Plot DNA methylation together with other omics, or annotation... in methylPipe: Base resolution DNA methylation data analysis [https://rdrr.io/bioc/methylPipe/man/plotMeth.html]
- 27. Comparison of Beta-value and M-value methods for ... [https://bmcbioinformatics.biomedcentral.com/articles/10.1186/1471-2105-11-587]
- 28. Estimands in epigenome-wide association studies - PMC [https://pmc.ncbi.nlm.nih.gov/articles/PMC8086103/]
- 29. Coverage recommendations for methylation analysis by ... [https://pmc.ncbi.nlm.nih.gov/articles/PMC4344394/]
- 30. Whole Genome Bisulfite Frequently Asked Questions [https://web.genewiz.com/faqs/whole-genome-bisulfite-sequencing]
- 31. BoostMe accurately predicts DNA methylation values in whole ... [https://bmcgenomics.biomedcentral.com/articles/10.1186/s12864-018-4766-y]
- 32. Differential methylation values in differential ... [https://pmc.ncbi.nlm.nih.gov/articles/PMC6449748/]
- 33. Detect differentially methylated regions using non- ... [https://www.sciencedirect.com/science/article/pii/S1046202320302048]
- 34. Babraham Bioinformatics - FastQC A Quality tool for High... Control [https://www.bioinformatics.babraham.ac.uk/projects/fastqc/]
- 35. fastqcr: An R Package Facilitating Quality of... - STHDA Controls [https://www.sthda.com/english/wiki/fastqcr-an-r-package-facilitating-quality-controls-of-sequencing-data-for-large-numbers-of-samples]
- 36. Hands-on: Quality and contamination control in bacterial isolate using... [https://training.galaxyproject.org/training-material/topics/sequence-analysis/tutorials/quality-contamination-control/tutorial.html]
- 37. VAliBS: a visual aligner for bisulfite sequences | BMC Bioinformatics [https://bmcbioinformatics.biomedcentral.com/articles/10.1186/s12859-017-1827-1]
- 38. - BS : a versatile Seeker pipeline for bisulfite sequencing data 2 aligning [https://bmcgenomics.biomedcentral.com/articles/10.1186/1471-2164-14-774]
- 39. BS-Seeker2: a versatile aligning pipeline for bisulfite sequencing data - PMC [https://pmc.ncbi.nlm.nih.gov/articles/PMC3840619/]
- 40. Objective and comprehensive evaluation of bisulfite short read... [https://pubmed.ncbi.nlm.nih.gov/24839440/]
- 41. GitHub - BSSeeker/BSseeker2: A versatile aligning pipeline for... [https://github.com/BSSeeker/BSseeker2]
- 42. Hands-on: DNA Methylation data analysis / DNA Methylation data analysis / Epigenetics [https://training.galaxyproject.org/training-material/topics/epigenetics/tutorials/methylation-seq/tutorial.html]
- 43. GitHub - dpryan79/MethylDackel: A (mostly) universal methylation extractor for BS-seq experiments. [https://github.com/dpryan79/MethylDackel]
- 44. Methylation ( Bisulfite - Sequencing ) analysis pipeline using Bismark or... [https://nf-co.re/methylseq/2.4.0/docs/output]
- 45. Frontiers | Global DNA - methylation in quantitative epigenetics... [https://www.frontiersin.org/journals/molecular-biosciences/articles/10.3389/fmolb.2025.1681568/full]
- 46. GitHub - al2na/ methylKit : R package for DNA methylation analysis [https://github.com/al2na/methylKit]
- 47. GitHub - AbhiAgriDataScience/BisulfiteSeq- Analysis ... [https://github.com/AbhiAgriDataScience/BisulfiteSeq-Analysis]
- 48. Detecting Differentially Methylated Promoters in Genes Related to... [https://pmc.ncbi.nlm.nih.gov/articles/PMC8250346/]
- 49. De novo identification of differentially methylated regions in the human genome | Epigenetics & Chromatin | Full Text [https://epigeneticsandchromatin.biomedcentral.com/articles/10.1186/1756-8935-8-6]
- 50. in R - Part 1 Methylation Analysis Tutorial [https://www.biostars.org/p/465230/]
- 51. : DMRcate array and sequencing spatial Methylation ... analysis [https://rdrr.io/bioc/DMRcate/]
- 52. GitHub - hamidghaedi/ Methylation _ Analysis : Comprehensive tutorial ... [https://github.com/hamidghaedi/Methylation_Analysis]
- 53. : Array Workflow — Epigenomics Workshop 2025... DNA Methylation [https://nbis-workshop-epigenomics.readthedocs.io/en/latest/content/tutorials/methylationArray/Array_Tutorial.html]
- 54. (library) — mepylome 0.1.1 documentation Tutorial [https://mepylome.readthedocs.io/en/latest/tutorial.html]
- 55. A DNA methylation atlas of normal human cell types | Nature [https://www.nature.com/articles/s41586-022-05580-6]
- 56. Babraham Bioinformatics - Bismark Bisulfite Read Mapper and Methylation Caller [https://www.bioinformatics.babraham.ac.uk/projects/bismark/]
- 57. Methylation extraction - Bismark [https://felixkrueger.github.io/Bismark/bismark/methylation_extraction/]
- 58. GitHub - xie186/ViewBS: ViewBS - a powerful toolkit for visualization ... [https://github.com/xie186/ViewBS]
- 59. Gviz - Visualize genomic data - Easy Guides - Wiki - STHDA [https://www.sthda.com/english/wiki/gviz-visualize-genomic-data]
- 60. Ultrafast bisulfite sequencing detection of 5-methylcytosine in DNA and RNA | Nature Biotechnology [https://www.nature.com/articles/s41587-023-02034-w]
- 61. Bisulfite genomic sequencing: systematic investigation of critical experimental parameters - PMC [https://pmc.ncbi.nlm.nih.gov/articles/PMC55789/]
- 62. An optimized rapid bisulfite conversion method with high recovery of cell-free DNA | BMC Molecular Biology | Full Text [https://bmcmolbiol.biomedcentral.com/articles/10.1186/s12867-017-0101-4]
- 63. Comparative performance evaluation of bisulfite - and enzyme-based... [https://clinicalepigeneticsjournal.biomedcentral.com/articles/10.1186/s13148-025-01855-7]
- 64. EpiTect Fast Bisulfite Kits Conversion [https://www.qiagen.com/us/products/discovery-and-translational-research/epigenetics/dna-methylation/bisulfite-conversion-assays/epitect-fast-bisulfite-conversion-kit]
- 65. Differential methylation for analysis using DSS... bisulfite sequencing [https://pmc.ncbi.nlm.nih.gov/articles/PMC8171293/]
- 66. Zymo Bisulfite Converted DNA Amplification Guide [https://epigenie.com/guide-bisulfite-converted-dna-amplification/]
- 67. Bisulfite Conversion PCR Optimization [https://epigenie.com/getting-amped-on-bisulfite-conversion/]
- 68. COLD-PCR Amplification of Bisulfite-Converted DNA Allows the Enrichment and Sequencing of Rare Un-Methylated Genomic Regions | PLOS One [https://journals.plos.org/plosone/article?id=10.1371/journal.pone.0094103]
- 69. Methylation Analysis Support— DNA Troubleshooting [https://www.thermofisher.com/ru/en/home/technical-resources/technical-reference-library/epigenetics-support-center/dna-methylation-analysis-support/dna-methylation-analysis-support-troubleshooting.html?open=nr676]
- 70. Approaches for the Analysis and Interpretation of Whole Genome... [https://pubmed.ncbi.nlm.nih.gov/29524143/]
- 71. Recall DNA levels at methylation sites using a CNN... low coverage [https://pmc.ncbi.nlm.nih.gov/articles/PMC10266633/]
- 72. METHimpute: imputation-guided construction of complete methylomes from WGBS data | BMC Genomics | Full Text [https://bmcgenomics.biomedcentral.com/articles/10.1186/s12864-018-4641-x]
- 73. Characterizing the properties of bisulfite ... sequencing data [https://bmcgenomics.biomedcentral.com/articles/10.1186/s12864-021-07721-z]
- 74. Methylation data imputation performances under different representations and missingness patterns | BMC Bioinformatics | Full Text [https://bmcbioinformatics.biomedcentral.com/articles/10.1186/s12859-020-03592-5]
- 75. A (fire) cloud-based DNA preprocessing and methylation ... data quality [https://bmcbioinformatics.biomedcentral.com/articles/10.1186/s12859-019-2750-4]
- 76. ViewBS: a powerful toolkit for visualization of high-throughput bisulfite sequencing data - PMC [https://pmc.ncbi.nlm.nih.gov/articles/PMC5860610/]
- 77. Reduced representation bisulfite for comparative... sequencing [https://pubmed.ncbi.nlm.nih.gov/16224102/]
- 78. Improve-RRBS: a novel tool to correct the 3′ trimming of reduced... [https://pmc.ncbi.nlm.nih.gov/articles/PMC11154647/]
- 79. nucleotide- Correcting in high-throughput specific ... biases sequencing [https://bmcbioinformatics.biomedcentral.com/articles/10.1186/s12859-017-1766-x]
- 80. ComBat-met: adjusting batch in effects data - PMC DNA methylation [https://pmc.ncbi.nlm.nih.gov/articles/PMC12086544/]
- 81. for genome-wide Batch data with... effect correction methylation [https://bmcmedgenomics.biomedcentral.com/articles/10.1186/1755-8794-4-84]
- 82. DNA methylation data analysis and its application to cancer research - PMC [https://pmc.ncbi.nlm.nih.gov/articles/PMC4525706/]
- 83. Frontiers | DNA methylation biomarker analysis from low-survival-rate cancers based on genetic functional approaches [https://www.frontiersin.org/journals/bioinformatics/articles/10.3389/fbinf.2025.1523524/full]
- 84. of batch data using sva · Issue... effect correction DNA methylation [https://github.com/jtleek/svaseq/issues/5]
- 85. of current methods for genome-wide DNA Comparison ... methylation [https://pubmed.ncbi.nlm.nih.gov/40855329/]
- 86. Comparison of current methods for genome-wide DNA methylation profiling - PMC [https://pmc.ncbi.nlm.nih.gov/articles/PMC12376410/]
- 87. sciencedirect.com/topics/biochemistry-genetics-and-molecular-biology... [https://www.sciencedirect.com/topics/biochemistry-genetics-and-molecular-biology/bisulfite-sequencing]
- 88. Comparison of methylation capture sequencing and Infinium MethylationEPIC array in peripheral blood mononuclear cells | Epigenetics & Chromatin | Full Text [https://epigeneticsandchromatin.biomedcentral.com/articles/10.1186/s13072-020-00372-6]
- 89. Practical Case Studies for Comparison Between EM - seq and Other... [https://www.cd-genomics.com/resource-em-seq-comparison-wgbs-pbat-case.html]
- 90. (BS-Seq)/WGBS Bisulfite Sequencing [https://www.illumina.com/techniques/sequencing/methylation-sequencing/bisulfite-sequencing.html]
- 91. performance evaluation of Comparative - and enzyme-based... bisulfite [https://pmc.ncbi.nlm.nih.gov/articles/PMC11969950/]
- 92. Comprehensive comparison of enzymatic and bisulfite DNA... [https://clinicalepigeneticsjournal.biomedcentral.com/articles/10.1186/s13148-025-01959-0]
- 93. LuxRep: a technical replicate-aware method for bisulfite ... [https://bmcbioinformatics.biomedcentral.com/articles/10.1186/s12859-021-04546-1]
- 94. Considerations for Normalization of DNA Methylation Data by ... [https://pmc.ncbi.nlm.nih.gov/articles/PMC6242262/]
- 95. Zymo-Seq Methyl Spike-in Control [https://www.zymoresearch.com/products/zymo-seq-methyl-spike-in-control?srsltid=AfmBOorQJA-Cby7XFiLu97K0zLOIbKLuicLa00FbiR_H4bvrorAptgsM]
- 96. Sensitive and reproducible cell-free methylome ... [https://pmc.ncbi.nlm.nih.gov/articles/PMC9499995/]
- 97. Bisulfite Sequencing of DNA - PMC [https://pmc.ncbi.nlm.nih.gov/articles/PMC3214597/]
- 98. Medium throughput bisulfite sequencing for accurate ... [https://pmc.ncbi.nlm.nih.gov/articles/PMC5242011/]
- 99. Bisulfite Protocol [https://stuparlab.cfans.umn.edu/protocols/bisulfite-protocol]
- 100. Patterns Between Correlation and DNA ... Methylation Gene [https://pubmed.ncbi.nlm.nih.gov/30792573/]
- 101. The correlation between CpG methylation and gene is... expression [https://www.nature.com/articles/s41588-024-01851-2?error=cookies_not_supported&code=30589ed1-9422-4595-bf0a-89debe8d1b27]
- 102. Detection: DNA Genomic Methylation Bisulfite Sequencing Analysis [https://link.springer.com/protocol/10.1007/978-1-61779-316-5_2]
- 103. Comprehensive Analysis of DNA Methylation Data with RnBeads - PMC [https://pmc.ncbi.nlm.nih.gov/articles/PMC4216143/]
- 104. High-throughput DNA methylation profiling using universal bead arrays - PMC [https://pmc.ncbi.nlm.nih.gov/articles/PMC1415217/]
- 105. A streamlined workflow for long-read DNA methylation analysis with NanoMethViz and Bioconductor - PMC [https://pmc.ncbi.nlm.nih.gov/articles/PMC11907187/]
- 106. Whole Genome Methylation via Enzymatic Conversion... Sequencing [https://www.research.ed.ac.uk/en/publications/whole-genome-methylation-sequencing-via-enzymatic-conversion-em-s]
- 107. A DNA Classification Model Methylation Organ and Predicts ... Disease [https://arxiv.org/html/2506.00146v1]
- 108. Early antidepressant treatment response prediction in major... [https://bmcpsychiatry.biomedcentral.com/articles/10.1186/s12888-023-04791-z]
- 109. Clinical parameter-based prediction of DNA classification... methylation [https://www.nature.com/articles/s41598-022-18733-4?error=cookies_not_supported&code=b0bfdf2f-1450-4d2e-9cbb-7e2b0023a94b]
- 110. Detection of DNA by Whole-Genome Methylation Bisulfite Sequencing [https://link.springer.com/protocol/10.1007/978-1-4939-7315-6_11]
- 111. : a comprehensive MethAgingDB database for aging... DNA methylation [https://www.nature.com/articles/s41597-025-05538-z?error=cookies_not_supported&code=43e6a369-b572-4ee1-8efe-63db35b28499]
- 112. : a comprehensive MethAgingDB database for aging... DNA methylation [https://pubmed.ncbi.nlm.nih.gov/40659676/]
- 113. Quantification of the pace of biological aging in humans through... [https://elifesciences.org/articles/54870]
- 114. of methods for Benchmarking ... | Nature Communications DNA [https://www.nature.com/articles/s41467-024-48466-z?error=cookies_not_supported&code=9e400a45-9642-4963-9e87-00c809892d16]
- 115. Computational Workflow for Genome-Wide DNA Profiling... Methylation [https://bio-protocol.org/en/bpdetail?id=5506&type=0]
- 116. Novel DNA show high sensitivity and... methylation biomarkers [https://pubmed.ncbi.nlm.nih.gov/31727158/]
- 117. Liquid Biopsy of Methylation Biomarkers in Cell-Free DNA - PubMed [https://pubmed.ncbi.nlm.nih.gov/33500194/]
- 118. Advances in methylation analysis of liquid biopsy in early cancer detection of colorectal and lung cancer | Scientific Reports [https://www.nature.com/articles/s41598-023-40611-w]
- 119. Comprehensive evaluation of targeted multiplex bisulphite PCR... [https://link.springer.com/article/10.1186/s13148-020-00880-y]