A Comprehensive Guide to Histone ChIP-seq: From Foundational Principles to Advanced Applications in Biomedical Research
This article provides a definitive, step-by-step guide to Chromatin Immunoprecipitation followed by sequencing (ChIP-seq) for mapping histone modifications.
A Comprehensive Guide to Histone ChIP-seq: From Foundational Principles to Advanced Applications in Biomedical Research
Abstract
This article provides a definitive, step-by-step guide to Chromatin Immunoprecipitation followed by sequencing (ChIP-seq) for mapping histone modifications. Tailored for researchers, scientists, and drug development professionals, it covers the entire workflow from foundational epigenetics concepts and optimized wet-lab protocols to advanced bioinformatic analysis and data interpretation. We integrate current best practices, including ENCODE standards and automated pipelines like H3NGST, alongside robust troubleshooting strategies and a comparative analysis of emerging techniques such as CUT&Tag. This resource is designed to empower scientists to generate high-quality, reproducible histone modification data to drive discoveries in gene regulation and epigenetic drug development.
Understanding Histone Modifications and ChIP-seq Fundamentals
Histone post-translational modifications (PTMs) are covalent, reversible epigenetic modifications to histone proteins that fundamentally regulate gene expression without altering the underlying DNA sequence [1] [2]. These modifications occur primarily on the N-terminal tails of core histones (H2A, H2B, H3, H4) that protrude from the nucleosome core particle [3]. The combination of different modification types—including methylation, acetylation, phosphorylation, ubiquitination, and newer discoveries like lactylation and crotonylation—creates a complex "histone code" that can be interpreted by the cellular machinery to dictate transcriptional outcomes [1] [2].
These PTMs serve as crucial epigenetic markers that influence chromatin structure and function through two primary mechanisms: by altering the physical properties of chromatin, changing the electrostatic charge between histones and DNA to make chromatin more open or closed, and by creating docking sites for "reader" proteins that recognize specific modifications and recruit additional effector complexes to execute downstream functions [2] [3]. This sophisticated regulatory system plays essential roles in DNA replication, gene expression, DNA damage repair, and chromatin organization, with dysregulation increasingly linked to human diseases, particularly cancer [1] [3].
Major Types of Histone PTMs and Their Biological Functions
Classical Histone Modifications
Table 1: Major Histone PTMs and Their Biological Functions
| Modification Type | Common Sites | General Function | Catalyzing Enzymes | Removing Enzymes |
|---|---|---|---|---|
| Methylation | H3K4, H3K9, H3K27, H3K36, H3K79, H4K20 [3] | Transcriptional activation or repression depending on site [3] | Histone Methyltransferases (HMTs): SET domain proteins, DOT1L, PRMTs [1] | Histone Demethylases (HDMs): LSD, JMJC families [1] |
| Acetylation | H3K9, H3K14, H3K18, H3K27, H4K5, H4K8, H4K12, H4K16 [1] | Transcriptional activation, chromatin relaxation [1] [3] | Histone Acetyltransferases (HATs): p300/CBP, HBO1 [1] | Histone Deacetylases (HDACs) [1] |
| Phosphorylation | H3S10, H3S28, H2BS14 [1] | Mitosis, DNA damage response, transcriptional activation [1] | Kinases | Phosphatases |
| Ubiquitination | H2AK119, H2BK120 [1] [4] | Transcriptional regulation, DNA repair [1] [4] | E3 Ubiquitin Ligases | Deubiquitinating Enzymes |
| Newer Acylations | Various lysine residues [1] [2] | Metabolic sensing, gene regulation [2] | Acyltransferases | Deacylases |
Histone methylation represents one of the most stable epigenetic marks and can either activate or repress transcription depending on the specific residue modified and the degree of methylation (mono-, di-, or tri-methylation) [1] [3]. For example, H3K4me3 is strongly associated with active promoters and enhances transcription by recruiting proteins with PHD fingers that recognize this mark [3]. In contrast, H3K27me3 is a repressive mark instrumental in gene silencing, particularly during development and cell differentiation [3].
Histone acetylation, one of the first discovered and most extensively studied PTMs, generally promotes transcriptional activation by neutralizing the positive charge on lysine residues, thereby reducing histone-DNA affinity and facilitating chromatin opening [1] [3]. The dynamic balance between acetylation and deacetylation is maintained by histone acetyltransferases (HATs) and deacetylases (HDACs), with enzymes like HBO1 responsible for acetylating H3K9/14 and H4K5/8/12 [1].
More recently discovered acylations (including propionylation, butyrylation, crotonylation, and lactylation) have expanded our understanding of how cellular metabolism interfaces with epigenetics, as many of these modifications are derived from metabolic intermediates [1] [2]. For instance, histone lactylation directly links metabolic state to gene regulation by utilizing lactate as a substrate [2].
Advanced PTM Concepts and Cross-Talk
The histone code hypothesis extends beyond individual modifications to encompass the concept of PTM cross-talk, where one modification influences the establishment, removal, or interpretation of another [1] [4]. This cross-talk can occur between different modification types on the same histone residue, between modifications on different residues, or even between histones and other epigenetic regulators. For example, H2B ubiquitination at K120 stimulates H3K79 methylation by Dot1L through inducing nucleosome distortion [4], while acetylation of H3K14 can influence the demethylase activity of LSD1 on H3K4 [4].
Diagram 1: Histone PTM Regulatory Network. This diagram illustrates how different histone PTMs interact with each other and with cellular metabolic states to ultimately regulate chromatin structure and gene expression through complex cross-talk mechanisms.
Histone PTM Dysregulation in Human Disease
The precise regulation of histone PTMs is crucial for maintaining cellular homeostasis, and dysregulation of these modifications is increasingly recognized as a contributing factor in human diseases, particularly cancer [1] [3]. Abnormal expression patterns of histone-modifying enzymes and their corresponding modification marks have been documented across various cancer types, where they can drive tumorigenesis by altering the expression of oncogenes and tumor suppressor genes [3].
For example, the repressive mark H3K9me3 plays a dual role in cancer—it can contribute to the abnormal silencing of tumor suppressor genes in colorectal cancer, yet higher levels are associated with improved survival in non-small cell lung cancer, possibly by repressing oncogenic repetitive elements [3]. Similarly, H3K4me3, typically associated with active transcription, is significantly upregulated at specific oncogenic loci in gastric cancer, promoting cancer cell survival [3]. The histone methyltransferase EZH2, which catalyzes the repressive H3K27me3 mark, is frequently overexpressed in various cancers and has emerged as a promising therapeutic target [1] [3].
These disease associations have made histone-modifying enzymes attractive targets for drug development. Histone deacetylase inhibitors (HDACis) represent the most advanced class of epigenetic drugs, while inhibitors targeting HATs, HMTs, and HDMs are in various stages of clinical and preclinical development [1]. The reversible nature of histone modifications makes them particularly amenable to pharmacological intervention, opening new avenues for epigenetic therapy across a spectrum of human diseases.
Analyzing Histone PTMs: ChIP-seq Methodology
Chromatin Immunoprecipitation followed by sequencing (ChIP-seq) has emerged as the gold standard technique for genome-wide mapping of histone modifications and chromatin-associated proteins [5] [6]. This powerful method combines immunoprecipitation with next-generation sequencing to capture a snapshot of protein-DNA interactions throughout the genome [7] [6].
ChIP-seq Experimental Workflow
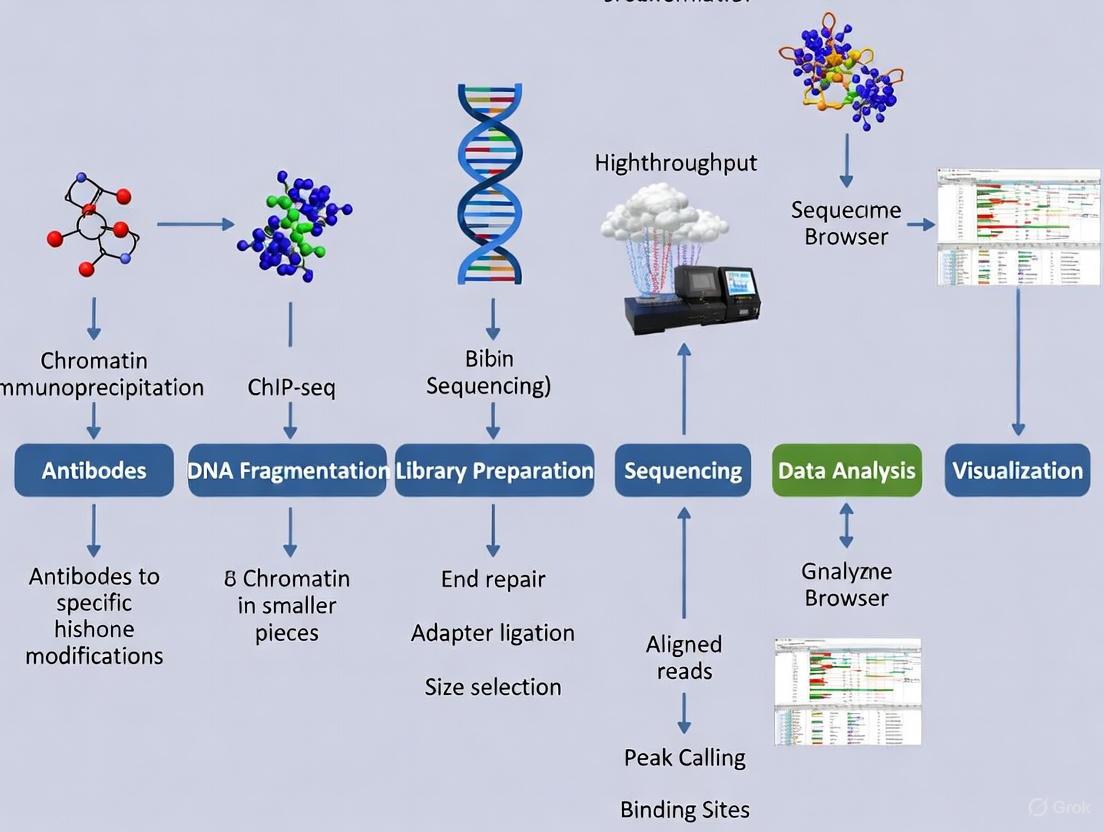
Diagram 2: ChIP-seq Workflow for Histone PTM Analysis. This diagram outlines the key steps in a standard ChIP-seq experiment, from cell harvesting through computational analysis, used to map histone modifications genome-wide.
The ChIP-seq workflow begins with cell harvesting and cross-linking using formaldehyde to stabilize protein-DNA interactions [6]. The chromatin is then fragmented to mononucleosome-sized pieces (150-300 bp) either by sonication or enzymatic digestion with micrococcal nuclease (MNase) [6]. This is followed by immunoprecipitation with a highly specific antibody against the histone modification of interest, after which the cross-links are reversed and the enriched DNA is purified [5] [6]. The immunoprecipitated DNA then undergoes library preparation with barcoding for multiplexing and is sequenced on an appropriate next-generation sequencing platform [6].
Critical optimization parameters include using sufficient starting material (typically 500,000 to millions of cells per ChIP), including appropriate controls (input DNA and IgG controls), performing biological replicates (minimum of three recommended), and most importantly, selecting highly specific antibodies validated for ChIP applications [6]. For histone modifications specifically, antibodies with minimal cross-reactivity to similar PTMs are essential for generating reliable data [6].
Computational Analysis of ChIP-seq Data
The computational analysis of ChIP-seq data involves multiple quality control and processing steps [5] [7] [8]. After sequencing, quality assessment of raw reads is performed using tools like FastQC to evaluate sequence quality, GC content, and adapter contamination [5] [7]. Reads are then aligned to a reference genome using aligners such as BWA or Bowtie [5] [7]. Peak calling to identify significantly enriched regions is performed using algorithms like MACS2, with specific consideration for histone modifications that may form broad domains (e.g., H3K27me3) versus punctate marks (e.g., H3K4me3) [7] [8]. The ENCODE consortium has established standardized pipelines for histone ChIP-seq analysis, recommending different sequencing depths based on the specific histone mark being studied [8].
For broad histone marks like H3K27me3 and H3K36me3, the ENCODE standards recommend 45 million usable fragments per replicate, while for narrow marks like H3K4me3 and H3K27ac, 20 million fragments per replicate are sufficient [8]. The exception is H3K9me3, which is enriched in repetitive regions and requires special consideration with 45 million total mapped reads per replicate for tissues and primary cells [8].
Essential Research Tools for Histone PTM Analysis
Table 2: Research Reagent Solutions for Histone PTM Studies
| Reagent/Tool Category | Specific Examples | Function and Importance |
|---|---|---|
| Antibodies | Histone PTM-specific antibodies (e.g., anti-H3K4me3, anti-H3K27ac) [6] | Critical for specific immunoprecipitation in ChIP; must be validated for ChIP applications with minimal cross-reactivity [6] |
| Spike-in Controls | SNAP-ChIP Spike-in reagents [6] | Normalization controls using DNA-barcoded nucleosomes to assess antibody performance directly in ChIP experiments [6] |
| Chromatin Shearing Reagents | Micrococcal nuclease (MNase), sonication reagents [6] | Enzymatic or mechanical fragmentation of chromatin to mononucleosome size (150-300 bp) for high-resolution mapping [6] |
| Analysis Software | HOMER, MACS2, ENCODE Pipelines [5] [8] | Peak calling, motif discovery, annotation, and visualization of ChIP-seq data [5] [7] |
| Quality Control Tools | FastQC, Picard, SNAP-ChIP Quality Control [7] [6] | Assessment of sequencing quality, library complexity, and antibody performance [7] [6] |
| Mass Spectrometry Tools | PTMViz, Epiprofile2.0, Skyline [9] | Downstream differential abundance analysis and visualization of histone PTMs from mass spectrometry data [9] |
The selection of appropriate research tools is critical for successful histone PTM analysis. Antibody specificity remains one of the most important considerations, as cross-reactivity can lead to misleading biological conclusions [6]. Technologies like SNAP-ChIP spike-in controls address this challenge by using DNA-barcoded designer nucleosomes to assess antibody performance directly in ChIP experiments [6]. For computational analysis, integrated platforms like PTMViz provide interactive visualization of histone PTM data from mass spectrometry experiments, enabling rapid identification of differentially modified sites across experimental conditions [9].
The field continues to advance with new methodologies like CUT&RUN and CUT&Tag offering potential improvements over traditional ChIP-seq, though ChIP-seq remains the well-validated gold standard for histone modification mapping [6]. As single-cell epigenomics matures, new approaches are emerging to elucidate cellular heterogeneity in histone modification patterns within complex tissues and cancers [10].
Core Principle of Chromatin Immunoprecipitation Followed by Sequencing (ChIP-seq)
Chromatin Immunoprecipitation followed by sequencing (ChIP-seq) stands as a cornerstone technique in contemporary genomics and epigenetics, enabling researchers to precisely map protein-DNA interactions across the entire genome. This method combines the specificity of chromatin immunoprecipitation (ChIP) with the robust, high-throughput capabilities of next-generation sequencing (NGS). For researchers and drug development professionals investigating histone modifications, ChIP-seq provides an indispensable tool for generating genome-wide maps of histone marks, thereby revealing the epigenetic landscape that governs gene expression, cellular identity, and disease mechanisms [11].
The fundamental principle underlying ChIP-seq is the capture of a snapshot of dynamic protein-DNA interactions within the native chromatin context of living cells. By targeting histone modifications—chemical alterations to histone proteins that influence chromatin structure and gene accessibility—ChIP-seq allows scientists to decipher the epigenetic code that regulates transcriptional programs without altering the underlying DNA sequence. This technical guide explores the core principles, detailed methodologies, and advanced applications of ChIP-seq within the context of histone modification research, providing a comprehensive framework for implementing this powerful technology in both basic and translational research settings [11] [7].
Core Biochemical Principle
The biochemical foundation of ChIP-seq rests on capturing in vivo protein-DNA interactions through cross-linking, followed by targeted immunoprecipitation and high-throughput sequencing. For histone modification studies, this process enables the mapping of post-translational modifications such as methylation, acetylation, and phosphorylation across the genome, providing critical insights into the epigenetic regulatory mechanisms that control gene expression patterns in development, cellular differentiation, and disease states [11].
The principle can be understood as a series of molecular capture and amplification steps: initially, formaldehyde-mediated cross-linking creates covalent bonds between histones and their bound DNA, effectively freezing these interactions in their native chromatin context. Subsequent chromatin fragmentation, either through sonication or enzymatic treatment, generates smaller DNA fragments suitable for processing. The key specificity step involves antibody-mediated immunoprecipitation using antibodies highly specific to particular histone modifications (e.g., H3K27ac for active enhancers, H3K4me3 for active promoters, or H3K27me3 for polycomb-repressed regions). Following immunoprecipitation, reverse cross-linking releases the enriched DNA fragments, which are then converted into a sequencing library and subjected to high-throughput sequencing [11] [7].
The resulting sequence data, when aligned to a reference genome, generates a genome-wide binding profile that reveals the precise genomic locations enriched for the specific histone modification under investigation. The resolution and specificity of this mapping approach have made ChIP-seq the gold standard for epigenomic profiling, supplanting earlier array-based methods (ChIP-chip) due to its superior resolution, dynamic range, and coverage [11].
Experimental Workflow
The standard ChIP-seq workflow for histone modification analysis comprises multiple critical stages, each requiring optimization for robust and reproducible results. The following diagram illustrates the complete experimental and computational workflow:
ChIP-seq Workflow for Histone Modification Analysis
Sample Preparation and Cross-linking
The workflow begins with preparation of biological samples, ensuring appropriate cell numbers (typically 1-10 million cells per immunoprecipitation) and preservation of native chromatin structure. Formaldehyde cross-linking is performed to stabilize histone-DNA interactions, using typically 1% formaldehyde for 5-15 minutes at room temperature. The cross-linking reaction is then quenched with glycine. For certain histone modifications, particularly those that are highly stable, native ChIP (without cross-linking) may be employed to avoid potential epitope masking or cross-linking artifacts that could impact antibody recognition [11] [12].
Chromatin Fragmentation and Immunoprecipitation
Cross-linked chromatin is fragmented to sizes ranging from 200-600 base pairs, typically using sonication (acoustic shearing) or enzymatic digestion with micrococcal nuclease (MNase). The fragmentation efficiency critically impacts resolution and signal-to-noise ratio, with optimal fragment size distribution being verified by agarose gel electrophoresis. The immunoprecipitation step then employs antibodies specific to the histone modification of interest (e.g., anti-H3K27ac, anti-H3K4me3, anti-H3K27me3). Antibody quality is paramount, requiring validation for ChIP-seq applications through knock-down controls or use of validated commercial antibodies. The antibody-bound complexes are recovered using protein A/G magnetic beads, followed by extensive washing to remove non-specifically bound chromatin [11] [7].
Library Preparation and Sequencing
Following immunoprecipitation and reverse cross-linking, the enriched DNA fragments are purified and converted into a sequencing library. This process involves end repair, adapter ligation, and PCR amplification—though amplification cycles should be minimized to prevent bias. For histone modifications, which often exhibit broad enrichment domains (e.g., H3K27me3) or sharp peaks (e.g., H3K4me3), appropriate sequencing depth is critical. The table below outlines recommended sequencing parameters for different histone modification types:
Table 1: Sequencing Requirements for Histone Modification ChIP-seq
| Modification Type | Examples | Recommended Read Depth | Sequencing Type | Key Considerations |
|---|---|---|---|---|
| Broad Domains | H3K27me3, H3K36me3 | 40-60 million reads | Paired-end recommended | Broader enrichment domains require deeper sequencing for accurate resolution |
| Sharp Peaks | H3K4me3, H3K27ac | 40-60 million reads | Single-end or Paired-end | Characterized by focused enrichment at promoters/enhancers |
| Other Marks | H3K9me3, H3K4me1 | 40-60 million reads | Dependent on expected pattern | Variable patterns requiring adaptive experimental design |
Recent advances in library preparation include the use of hyper-stable Tn5 transposase for tagmentation-based approaches, which streamline the process and reduce input requirements. Quality assessment of the final libraries using bioanalyzer/tapestation is essential before sequencing to ensure appropriate fragment size distribution and absence of adapter dimers [12] [13].
Data Analysis Pipeline
The computational analysis of ChIP-seq data transforms raw sequencing reads into biologically interpretable genome-wide binding patterns. The analysis workflow involves multiple quality control steps, processing stages, and specialized algorithms tailored to the distinct characteristics of different histone modifications.
Quality Control and Read Alignment
Initial quality assessment of raw sequencing data is performed using tools like FastQC to evaluate base quality scores, GC content, adapter contamination, and sequence duplication rates. Poor-quality bases or adapters are trimmed using tools such as Trim Galore. Subsequently, quality-filtered reads are aligned to a reference genome (e.g., hg38 for human) using aligners such as Bowtie2 or BWA, with optimal parameters for ChIP-seq data. The alignment step typically yields BAM files containing mapped reads, with post-alignment processing including removal of PCR duplicates using Picard or samtools to prevent artificial inflation of signal in downstream analyses [5] [14].
For histone modification ChIP-seq, specific quality metrics are particularly important, including strand cross-correlation analysis, which assesses the periodicity of forward and reverse strand tags around binding sites. High-quality datasets exhibit strong cross-correlation, with normalized strand coefficient (NSC) values >1.05 and relative strand correlation (RSC) values >0.8 generally indicating successful experiments [14].
Peak Calling and Signal Normalization
Peak calling identifies genomic regions with statistically significant enrichment of sequencing reads, using algorithms specifically designed for different histone modification patterns. For sharp marks like H3K4me3, MACS2 is widely used, while broad domains like H3K27me3 benefit from tools such as SICER2 or JAMM. The choice of algorithm significantly impacts result accuracy, as demonstrated by comprehensive benchmarking studies [15].
A critical consideration in comparative ChIP-seq analyses is appropriate signal normalization. The recently developed siQ-ChIP method provides a mathematically rigorous approach for absolute quantification of immunoprecipitation efficiency without relying on spike-in controls, explicitly accounting for factors such as antibody behavior, chromatin fragmentation, and input quantification. For relative comparisons between samples, normalized coverage approaches are recommended [12].
Table 2: Quality Metrics for ChIP-seq Data Assessment
| Quality Metric | Assessment Tool | Target Values | Interpretation |
|---|---|---|---|
| Read Alignment Rate | Bowtie2/BWA reports | >70-80% | Percentage of reads successfully mapped to reference genome |
| Non-Redundant Fraction (NRF) | Picard MarkDuplicates | >0.8 | Fraction of unique mapped reads; indicates library complexity |
| Strand Cross-Correlation (NSC) | phantompeakqualtools | >1.05 | Measures signal-to-noise ratio; higher values indicate stronger enrichment |
| Strand Cross-Correlation (RSC) | phantompeakqualtools | >0.8 | Normalized measure of enrichment; values >1 indicate good enrichment |
| Fraction of Reads in Peaks (FRiP) | featureCounts | >1% (TFs), >10-30% (histones) | Measures signal enrichment in called peaks; histone marks typically show higher FRiP |
Downstream Analysis and Integration
Following peak calling, downstream analyses include peak annotation to associate enriched regions with genomic features (promoters, enhancers, gene bodies), motif analysis to identify enriched transcription factor binding sites within histone-marked regions, and differential binding analysis to compare histone modification patterns across conditions. Integration with complementary datasets such as ATAC-seq (for chromatin accessibility) and RNA-seq (for gene expression) enables construction of comprehensive regulatory networks and mechanistic insights into gene regulation [7] [13].
Advanced analytical approaches include chromatin state annotation using hidden Markov models (e.g., ChromHMM) to segment the genome into functional states based on combinatorial histone modification patterns, and machine learning applications for predicting gene expression from histone modification profiles or imputating missing data tracks [10].
The Scientist's Toolkit
Successful implementation of ChIP-seq for histone modification studies requires careful selection of reagents, controls, and computational tools. The following table outlines essential components of the ChIP-seq toolkit:
Table 3: Essential Research Reagents and Tools for ChIP-seq
| Tool/Reagent | Function | Examples/Alternatives |
|---|---|---|
| Specific Antibodies | Recognition and enrichment of specific histone modifications | Validated antibodies from Diagenode, Abcam, Cell Signaling Technology |
| Magnetic Beads | Immunoprecipitation of antibody-bound complexes | Protein A/G magnetic beads from Thermo Fisher, Millipore |
| Cross-linking Reagent | Stabilization of protein-DNA interactions | Formaldehyde (1% final concentration) |
| Chromatin Shearing Platform | Fragmentation of chromatin | Sonication (Covaris, Bioruptor), enzymatic (MNase) |
| Library Preparation Kit | Preparation of sequencing libraries | Illumina TruSeq ChIP Library Preparation Kit, NEB Next Ultra II DNA Library Prep |
| Quality Control Instruments | Assessment of DNA quality and quantity | Bioanalyzer, Tapestation, Qubit |
| Alignment Software | Mapping sequences to reference genome | Bowtie2, BWA, STAR |
| Peak Callers | Identification of enriched genomic regions | MACS2 (sharp marks), SICER2 (broad domains) |
| Quality Assessment Tools | Evaluation of data quality | FastQC, phantompeakqualtools, ChIPQC |
| Visualization Software | Exploration of genomic data | IGV, deepTools, UCSC Genome Browser |
| Einecs 300-803-9 | Einecs 300-803-9|High-Purity Chemical for Research | Research-grade Einecs 300-803-9 for lab use. Explore its specific applications and value. This product is for Research Use Only (RUO). Not for human use. |
| Enoxolone aluminate | Enoxolone Aluminate|C90H135AlO12|RUO |
Advanced Applications and Future Directions
ChIP-seq for histone modifications continues to evolve with emerging technologies that address current limitations and expand applications. Single-cell ChIP-seq methodologies are overcoming the historical challenge of analyzing histone modifications at single-cell resolution, enabling delineation of cellular heterogeneity within complex tissues and cancers. These approaches reveal how histone modification patterns vary between individual cells, providing unprecedented insights into epigenetic heterogeneity in development and disease [10].
In translational research, ChIP-seq is increasingly applied to biomarker discovery and drug target identification. Specific histone modification patterns can distinguish disease subtypes and predict clinical outcomes, particularly in oncology. For example, H3K27ac super-enhancer profiles have been used to identify key oncogenic drivers in various cancers, while H3K4me3 patterns at promoters show potential as diagnostic markers. Pharmaceutical companies utilize ChIP-seq to validate epigenetic drug targets and monitor pharmacodynamic responses to histone-modifying enzyme inhibitors [16].
The integration of ChIP-seq with other omics technologies in multi-omics frameworks represents another advancing frontier. Combined analysis of histone modifications, chromatin accessibility, DNA methylation, and transcriptome data provides systems-level understanding of gene regulatory mechanisms. Machine learning approaches are being increasingly employed to predict gene expression from histone modification profiles, impute missing ChIP-seq datasets, and identify novel chromatin states from combinatorial modification patterns [10].
Despite these advances, challenges remain in achieving comprehensive coverage of all biologically relevant histone modification states across diverse cell types and conditions. Systematic assessment of available computational tools indicates that performance is strongly dependent on peak characteristics and biological context, necessicious careful algorithm selection for specific experimental scenarios [15]. As the field progresses, standardization of protocols, enhanced normalization methods, and reduced input requirements will further solidify ChIP-seq's central role in deciphering the epigenetic regulation of gene expression in health and disease.
The regulation of gene expression is a complex process pivotal to cellular function, development, and disease. Beyond the DNA sequence itself, dynamic chromatin modifications serve as a critical regulatory layer, influencing chromatin architecture and transcriptional accessibility. Chromatin Immunoprecipitation followed by sequencing (ChIP-seq) has emerged as an instrumental technique for mapping these epigenetic marks and transcription factor binding sites genome-wide. This guide details how ChIP-seq is applied to delineate regulatory landscapes—the genomic coordinates of regulatory elements and their activity states—in both physiological and pathological contexts. By providing a snapshot of the epigenome, ChIP-seq enables researchers to identify dysregulated pathways in diseases like cancer, developmental disorders, and degenerative conditions, thereby uncovering potential therapeutic targets [17] [18].
Core Principles: Histone Modifications as Regulatory Signals
The Language of Histone Modifications
In eukaryotic cells, DNA is wrapped around histone proteins to form chromatin. The N-terminal tails of histones are vulnerable to a variety of enzyme-mediated, post-translational modifications (PTMs) that constitute a major component of the epigenetic code. These modifications do not alter the underlying DNA sequence but can have profound, heritable effects on gene expression [19]. The two best-studied categories of PTMs are lysine methylation and lysine acetylation, though others include phosphorylation, ubiquitination, SUMOylation, ribosylation, and citrullination [20] [19]. The combinatorial nature of these marks allows for a sophisticated regulatory system that controls DNA-templated processes.
Functional Consequences of Key Modifications
Specific histone modifications are associated with distinct chromatin states and transcriptional outcomes. The functional effect of a modification depends on the specific histone residue affected, the degree of modification (e.g., mono-, di-, or tri-methylation), and the interplay with other marks in the chromatin environment [18].
Table 1: Key Histone Modifications and Their Functions
| Modification | General Function | Associated Process |
|---|---|---|
| H3K27me3 | Facultative heterochromatin; Transcriptional repression | Polycomb group protein-mediated silencing, cell fate regulation [18] |
| H3K4me3 | Active transcription; Associated with promoters | RNA polymerase II promoter-proximal pause-release [18] |
| H3K9me3 | Constitutive heterochromatin; Transcriptional repression | Maintenance of genome stability, gene silencing [18] |
| H3K36me3 | Active transcription; Associated with gene bodies | Prevention of spurious transcription initiation [18] |
| H3K27ac | Active enhancers and promoters | Distinguishes active from poised regulatory elements [21] |
| H3K9ac | Active transcription | Chromatin relaxation, gene activation [19] |
It is crucial to note that these functions are not absolute. While broadly categorized as "repressive" or "activating," their biological impact is highly context-dependent. For instance, while H3K27me3 and H3K9me3 are both repressive marks, they are not functionally redundant. Recent studies demonstrate that H3K9me3 cannot fully substitute for the unique repressive functions of H3K27me3 at developmental genes, highlighting that the functional effects of individual PTMs depend on the existing chromatin context [18].
Technical Guide: ChIP-seq Workflow for Histone Modifications
The following diagram illustrates the major stages of the ChIP-seq workflow, from sample preparation to data analysis.
Sample Preparation and Cross-Linking (Basic Protocol 1)
Working with tissues presents considerable challenges, including cellular heterogeneity, dense matrices, and low input material. The following steps are critical for success [17]:
- Tissue Preparation: Retrieve frozen tissue (e.g., -80°C) and maintain on ice. In a biosafety cabinet, mince the tissue finely with sterile scalpel blades on a Petri dish placed on ice. This step is vital for increasing surface area for subsequent processing.
- Homogenization: Two common methods are employed:
- Dounce Homogenization: Transfer minced tissue to a 7ml Dounce grinder on ice. Add cold PBS with protease inhibitors and shear with 8-10 even strokes of the pestle. Expect some debris from connective tissue.
- GentleMACS Dissociator: Transfer tissue to a C-tube with cold PBS. Tap the tube to ensure contact with blades and run a pre-defined program (e.g.,
h_tumor_03.01).
- Cross-Linking: Use formaldehyde to fix protein-DNA interactions. For challenging targets that do not bind DNA directly, a double-crosslinking protocol (dxChIP-seq) with a second crosslinker can significantly improve results [23].
Chromatin Immunoprecipitation (Basic Protocol 2)
This core protocol isolates DNA fragments bound by specific histone modifications [17].
- Cell Lysis and Chromatin Shearing: Lyse cells to extract chromatin. Shear the cross-linked chromatin to fragments of 200-500 bp using focused ultrasonication. The shearing efficiency must be checked by gel electrophoresis.
- Immunoprecipitation: Incubate the sheared chromatin with a specific, high-quality antibody against the histone modification of interest (e.g., H3K27me3, H3K4me3). Antibody-bound complexes are then captured using protein A/G magnetic beads.
- Washing and Elution: Wash the beads with a series of buffers of increasing stringency to remove non-specifically bound chromatin. Elute the immunoprecipitated DNA from the beads and reverse the cross-links.
- Purification: Purify the DNA to remove proteins and RNA. The purified ChIP DNA is now ready for library construction.
Library Construction and Sequencing (Basic Protocol 3 & 4)
- Library Prep: The ChIP DNA undergoes end-repair, A-tailing, and ligation to platform-specific sequencing adaptors. This is followed by limited-cycle PCR to amplify the library. For platforms like DNBSEQ-G99RS, this includes preparing DNA nanoballs (DNBs) [17].
- Quality Control and Sequencing: The final library is quantified and its quality assessed (e.g., via Bioanalyzer). Libraries are then sequenced on an appropriate platform to generate sufficient reads for robust analysis.
Advanced Methodologies and Analysis
Quantitative and High-Throughput ChIP-seq
Traditional ChIP-seq can be laborious and semi-quantitative. Recent advances address these limitations:
- Multiplexed ChIP-seq (MINUTE-ChIP): This protocol allows multiple samples to be barcoded, pooled, and profiled against multiple epitopes in a single immunoprecipitation reaction. This dramatically increases throughput, reduces experimental variation, and enables accurate quantitative comparisons across conditions and replicates [24].
- Spike-in Normalization: For quantitative comparisons, exogenous chromatin (e.g., from Drosophila) can be spiked into samples as a normalization control. Alternatively, computational methods like siQ-ChIP provide mathematically rigorous quantification of absolute IP efficiency without physical spike-ins [25].
Computational Analysis of ChIP-seq Data
The analysis of raw sequencing data is a multi-step process. Automated platforms like H3NGST have been developed to lower the bioinformatics barrier [22]. The standard workflow includes:
- Raw Data Retrieval & QC: Retrieve data from public repositories (e.g., SRA) and assess quality with FastQC.
- Pre-processing & Alignment: Trim adapters (e.g., with Trimmomatic) and align reads to a reference genome (e.g., using BWA-MEM).
- Peak Calling: Identify significant regions of enrichment ("peaks") using algorithms like HOMER or MACS2. The choice of algorithm depends on the mark; broad marks (H3K27me3) require different methods than narrow marks (H3K4me3) [22].
- Downstream Analysis: Annotate peaks with genomic features (promoters, enhancers), perform motif analysis, and integrate with other omics datasets (e.g., RNA-seq) for biological interpretation.
The Scientist's Toolkit: Essential Research Reagents
Table 2: Key Reagents for ChIP-seq Experiments
| Reagent / Tool | Function / Description | Example / Note |
|---|---|---|
| High-Quality Antibodies | Specific immunoprecipitation of target epitope | Critical for success; validate for ChIP-seq [24] |
| Protease Inhibitors | Preserve protein integrity during tissue processing | Added to PBS during homogenization [17] |
| Crosslinking Agents | Fix protein-DNA interactions | Formaldehyde; double-crosslinkers for indirect binders [23] |
| Magnetic Beads | Capture antibody-bound complexes | Protein A/G magnetic beads |
| Chromatin Shearing Kit | Fragment chromatin to desired size | Focused ultrasonication for efficiency [17] |
| Library Prep Kit | Prepare DNA for sequencing | Platform-specific (e.g., MGI, Illumina) [17] |
| Analysis Software/Pipelines | Process raw data into interpretable results | H3NGST, HOMER, MACS2 [22] |
| Indolaprilat | Indolaprilat|ACE Inhibitor | Indolaprilat (CAS 83601-86-9) is a potent angiotensin-converting enzyme (ACE) inhibitor for research use. This product is For Research Use Only and is not intended for diagnostic or therapeutic applications. |
| Einecs 269-968-1 | Einecs 269-968-1, CAS:68392-94-9, MF:C32H42N3O7S4-, MW:709.0 g/mol | Chemical Reagent |
Applications in Disease Research
ChIP-seq has been pivotal in uncovering the role of epigenetic dysregulation in human disease. The following diagram conceptualizes how distinct histone modification patterns define regulatory landscapes that become disrupted in disease states.
- Cancer: In colorectal cancer, refined ChIP-seq protocols on tumor tissues have revealed profound alterations in histone modification landscapes, driving oncogenic gene expression programs [17]. Similarly, attempts to substitute H3K27me3 with H3K36me3 at Polycomb target genes fail to fully restore repression, underscoring the unique and non-redundant role of H3K27me3 in controlling cell identity genes, the dysregulation of which is a hallmark of cancer [18].
- Degenerative Skeletal Diseases: In osteoporosis, histone modifications regulate the differentiation of osteoblasts (bone-forming cells) and osteoclasts (bone-resorbing cells), disrupting bone homeostasis. In osteoarthritis, changes in histone acetylation and methylation drive the expression of matrix-degrading enzymes in chondrocytes, leading to cartilage destruction [21].
- Assisted Reproductive Technologies (ART): Studies on placental tissues and cord blood from IVF/ICSI conceptions show altered levels of histone modifications like H3K4me2 and H3K9me2 at imprinted gene regions. These changes indicate a more permissive chromatin configuration, which may be linked to long-term health outcomes [19].
- Developmental Disorders: As histone modifications are crucial for normal animal development, mutations in the enzymes that write, read, or erase these marks can lead to severe developmental syndromes, often characterized by widespread transcriptional dysregulation [20].
For researchers investigating histone modifications, Chromatin Immunoprecipitation followed by sequencing (ChIP-seq) has emerged as the gold standard technique for generating genome-wide maps of protein-DNA interactions. The experimental design phase represents the most critical determinant of success in ChIP-seq studies, establishing the framework upon which all subsequent analysis and interpretation depend. Properly defining research goals, implementing appropriate controls, and incorporating sufficient replication constitutes the essential triad of a scientifically valid ChIP-seq experiment. The Encyclopedia of DNA Elements (ENCODE) Consortium has systematically developed and refined experimental standards that serve as benchmarks for the field, ensuring data quality, reproducibility, and comparability across studies [26] [8]. Within the context of a comprehensive thesis on ChIP-seq workflows for histone modifications, this technical guide provides an in-depth examination of experimental design principles grounded in ENCODE standards, empowering researchers to generate publication-quality data that withstands rigorous scientific scrutiny.
The fundamental goal of histone modification ChIP-seq is to identify regions of the genome associated with specific epigenetic marks, such as H3K27ac (marking active enhancers and promoters) or H3K27me3 (associated with facultative heterochromatin) [27]. Unlike transcription factor ChIP-seq that typically reveals punctate binding sites, histone modifications often exhibit broader enrichment patterns across genomic domains, necessitating specialized analytical approaches and distinct experimental considerations [8]. A well-designed experiment must account for these biological characteristics while implementing technical safeguards against artifacts and confounding factors.
Defining Experimental Goals and Scope
Strategic Objective Setting
The initial phase of ChIP-seq experimental design requires precise articulation of research objectives, which directly inform technical parameters including sequencing depth, replicate number, and control strategies. Histone modification studies generally pursue one of several common goals: (1) comprehensive epigenomic profiling to characterize chromatin states across the genome; (2) comparative analysis between biological conditions (e.g., disease vs. healthy, treated vs. untreated); (3) identification of regulatory elements marked by specific histone modifications; or (4) integration with complementary datasets such as RNA-seq or ATAC-seq to establish functional correlations [7] [10]. Each objective carries distinct implications for experimental design. For instance, comparative studies demand strict consistency in processing across all samples to ensure that observed differences reflect biological variation rather than technical artifacts.
Histone Modification Characteristics
Different classes of histone modifications present unique experimental challenges that must be addressed during the design phase. Narrow marks, such as H3K4me3 and H3K27ac, are typically localized to specific genomic features like promoters and enhancers, producing sharp, well-defined peak profiles [8]. In contrast, broad marks, including H3K27me3 and H3K36me3, spread across extensive genomic domains encompassing entire gene bodies or large repressed regions, generating wider enrichment patterns that complicate peak detection and require modified analytical approaches [8]. The repetitive region enrichment observed with marks like H3K9me3 presents additional challenges for mapping and interpretation, as a significant portion of reads may align to multiple genomic locations [8]. Recognition of these characteristics enables researchers to tailor experimental parameters to their specific targets of interest.
Experimental Replicates: Biological Foundations and Technical Implementation
Replication Strategies and ENCODE Standards
The ENCODE Consortium mandates the inclusion of at least two biological replicates for all ChIP-seq experiments, with additional replicates strongly recommended to enhance statistical power and reliability [8]. Biological replicates represent independently processed samples derived from distinct biological sources (e.g., different cell cultures, separate animal subjects, or multiple patient specimens), capturing the natural variation inherent in biological systems [28] [29]. Technical replicates (repeated processing of the same biological sample) cannot substitute for biological replication, as they primarily assess procedural consistency rather than biological variability [6]. The fundamental purpose of replication extends beyond mere validation; it enables rigorous statistical assessment of result reproducibility and provides protection against spurious findings arising from technical artifacts or outlier samples.
Table: ENCODE Replicate Standards and Recommendations
| Replicate Type | Minimum Requirement | Optimal Recommendation | Purpose |
|---|---|---|---|
| Biological Replicates | 2 | 3-4 | Capture biological variation and ensure reproducibility |
| Technical Replicates | Not required | Optional for protocol optimization | Assess technical variability in library prep and sequencing |
| Pseudoreplicates | Used when biological replication is impossible | Not a substitute for biological replicates | Created by partitioning reads from a single replicate |
Sample Size Considerations and Power Analysis
Determining the appropriate number of replicates represents a critical balance between statistical rigor and practical constraints. While ENCODE specifies minimum requirements, studies seeking to detect subtle differences between conditions (e.g., modest histone modification changes in response to weak stimuli) may require additional replicates to achieve sufficient statistical power [29]. Power analysis conducted during the experimental design phase provides a principled approach to sample size determination, reducing the risk of underpowered studies that cannot detect true biological effects or overpowered experiments that waste resources [29]. The specific number of biological replicates should account for anticipated effect sizes, technical variability inherent in ChIP-seq protocols, and biological variability of the system under investigation. For particularly heterogeneous samples (e.g., primary tissues with mixed cell populations), increased replication may be necessary to distinguish true biological signals from variability introduced by sample complexity.
Control Strategies: Ensuring Specificity and Signal Validation
Control Experiment Design
The inclusion of appropriate controls constitutes a non-negotiable element of properly controlled ChIP-seq experiments, enabling discrimination of specific enrichment from background noise and technical artifacts. ENCODE standards require each ChIP-seq experiment to be accompanied by a matched input control with identical replicate structure, read length, and processing methods [8]. This input DNA (sometimes referred to as "sonicated input") consists of fragmented chromatin that has undergone crosslinking and shearing but bypasses the immunoprecipitation step, capturing baseline patterns of chromatin accessibility, sequencing bias, and background noise [7] [8]. The matched input control enables normalization during peak calling and helps distinguish genuine enrichment from artifacts resulting from open chromatin regions or technical biases.
In addition to essential input controls, strategic incorporation of negative and positive controls strengthens experimental interpretation. Negative control antibodies (e.g., non-specific IgG) assess background signal resulting from non-specific antibody binding or bead capture, particularly important when evaluating new antibody lots or established antibodies in novel cell types [6]. Positive control antibodies targeting well-characterized histone modifications (e.g., H3K4me3 in mammalian cells) verify overall experimental success and procedural competence, especially valuable when establishing ChIP-seq protocols or troubleshooting problematic experiments [6]. For comparative studies spanning multiple conditions or time points, the input control requirement may be adjusted; while ideal practice involves collecting matched inputs for every condition, practical constraints may permit using a single input control across conditions when the chromatin state remains consistent between them [28].
Control Applications in Data Analysis
Properly implemented controls serve multiple critical functions during data analysis. During peak calling, input controls allow algorithms like MACS2 to model background distribution and calculate statistically significant enrichment [7]. For quality assessment, the Fraction of Reads in Peaks (FRiP) score quantifies the proportion of reads falling within called peaks relative to the input, with higher FRiP scores indicating better signal-to-noise ratios [8]. In comparative analyses, input-normalized bigWig files enable direct visualization and quantitative comparison of enrichment levels across different conditions or histone marks [8]. The strategic use of spike-in controls derived from distantly related organisms (e.g., Drosophila chromatin in human samples) provides an external reference for normalizing between samples, particularly valuable when global histone occupancy may vary between conditions [28].
Technical Specifications and Quality Metrics
Sequencing Depth Guidelines
Establishing appropriate sequencing depth represents a critical consideration in experimental design, balancing cost constraints against data quality requirements. Insufficient sequencing results in sparse coverage that fails to detect genuine binding sites, particularly for diffuse histone marks or transcription factors with weak binding, while excessive sequencing provides diminishing returns and inefficient resource utilization. ENCODE provides specific guidelines based on the category of histone mark being investigated, with broad marks requiring significantly greater sequencing depth due to their distribution across extended genomic regions [8].
Table: ENCODE Sequencing Depth Standards for Histone Modifications
| Histone Mark Category | Examples | Minimum Reads per Replicate | Optimal Reads per Replicate |
|---|---|---|---|
| Narrow Marks | H3K4me3, H3K27ac, H3K9ac | 20 million | 25-30 million |
| Broad Marks | H3K27me3, H3K36me3, H3K9me2 | 45 million | 50-60 million |
| Exception (H3K9me3) | H3K9me3 (enriched in repetitive regions) | 45 million | 50-60 million |
These recommendations assume standard Illumina sequencing with read lengths of at least 50bp, though longer read lengths (75-100bp) are encouraged when possible to improve mapping efficiency, particularly in complex genomic regions [8]. For experiments investigating multiple histone modifications from the same biological sample, researchers may consider applying lower sequencing depth to abundant marks (e.g., H3K4me3) while allocating greater resources to less abundant targets that require deeper sequencing for comprehensive detection.
Quality Assessment Metrics
Systematic quality assessment using standardized metrics represents a cornerstone of the ENCODE approach, enabling objective evaluation of data quality and facilitating cross-experiment comparisons. Key quality metrics must be monitored throughout the experimental process to identify potential issues and ensure compliance with established standards.
Table: Essential ChIP-seq Quality Metrics and Target Values
| Quality Metric | Calculation Method | Target Values | Interpretation |
|---|---|---|---|
| FRiP Score | Fraction of Reads in Peaks | >1% (TF), >5% (histone) | Higher values indicate better signal-to-noise ratio |
| NRF | Non-Redundant Fraction | >0.9 | Measures library complexity; higher values preferred |
| PBC1 | PCR Bottlenecking Coefficient 1 | >0.9 | Assesses library complexity based on duplicate reads |
| PBC2 | PCR Bottlenecking Coefficient 2 | >3 | Complementary measure of library complexity |
| Cross-Correlation | Strand cross-correlation | >0.8 | Evaluates read clustering quality |
Library complexity metrics warrant particular attention during quality assessment. The Non-Redundant Fraction (NRF) calculates the proportion of distinct mapped locations relative to total mapped reads, with values exceeding 0.9 indicating high-complexity libraries [8]. The PCR Bottlenecking Coefficients (PBC1 and PBC2) provide complementary assessments of library complexity, with optimal values of PBC1 > 0.9 and PBC2 > 3 indicating minimal PCR amplification bias [8]. The FRiP score (Fraction of Reads in Peaks) quantifies the proportion of reads falling within identified peaks relative to the input control, with higher values (typically >5% for histone marks) indicating better signal-to-noise ratios [8]. Systematic monitoring of these metrics throughout the experimental process enables rapid identification of potential issues and ensures consistent data quality across replicates and experimental conditions.
The Scientist's Toolkit: Research Reagent Solutions
Successful ChIP-seq experiments depend on the quality and appropriate selection of key reagents, each fulfilling specific functions within the experimental workflow.
Table: Essential Research Reagents for Histone ChIP-seq Experiments
| Reagent Category | Specific Examples | Function | Selection Criteria |
|---|---|---|---|
| Antibodies | H3K27ac (Abcam-ab4729), H3K27me3 (Cell Signaling Technology-9733) | Specific immunoprecipitation of target histone modification | ENCODE-validated; high specificity in peptide arrays; low cross-reactivity |
| Chromatin Shearing Enzymes | Micrococcal Nuclease (MNase) | Chromatin fragmentation for native ChIP | Efficient digestion to mononucleosomes; minimal digestion bias |
| Library Preparation Kits | Illumina TruSeq ChIP Library Preparation Kit | Sequencing library construction from immunoprecipitated DNA | High efficiency with low input DNA; minimal bias in adapter ligation |
| Spike-in Controls | SNAP-ChIP Spike-in nucleosomes | Normalization between samples | Distinct barcodes for quantification; compatibility with species |
| Magnetic Beads | Protein A/G magnetic beads | Antibody-chromatin complex precipitation | High binding capacity; low non-specific background |
| Depreton | Depreton | Depreton is a high-purity research compound for laboratory use. For Research Use Only. Not for human or veterinary diagnostic or therapeutic use. | Bench Chemicals |
| Carbinoxamine maleate, (R)- | Carbinoxamine maleate, (R)-, CAS:1078131-58-4, MF:C20H23ClN2O5, MW:406.9 g/mol | Chemical Reagent | Bench Chemicals |
Antibody selection represents perhaps the most critical reagent choice in ChIP-seq experimental design. Antibodies must demonstrate high specificity for the target epitope with minimal cross-reactivity to related histone modifications [6]. Whenever possible, researchers should prioritize antibodies previously validated by ENCODE or other systematic benchmarking efforts [28] [27]. For novel targets without established validation records, preliminary testing using alternative methods (e.g., immunoblotting or immunofluorescence) provides essential verification of antibody performance before committing to large-scale ChIP-seq experiments [28]. Companies including EpiCypher now offer SNAP-ChIP Certified Antibodies that have undergone rigorous specificity testing using defined nucleosome spike-ins, providing enhanced confidence in antibody performance [6].
Workflow Visualization and Experimental Integration
The following diagram illustrates the complete ChIP-seq experimental design workflow, integrating the key concepts discussed throughout this guide:
Well-designed ChIP-seq experiments for histone modification studies rest on three foundational pillars: clearly articulated research goals that inform technical parameters, robust replication strategies that capture biological variation, and comprehensive control approaches that distinguish specific signal from background noise. Adherence to ENCODE standards provides a validated framework for generating high-quality, reproducible data that enables meaningful biological insights and facilitates cross-study comparisons. By implementing the principles and practices outlined in this technical guide, researchers can design ChIP-seq experiments that withstand rigorous peer review and make substantive contributions to our understanding of epigenomic regulation. The systematic approach to experimental design detailed herein—encompassing goal definition, replicate strategy, control implementation, and quality assessment—establishes the essential foundation for successful execution of all subsequent steps in the ChIP-seq workflow for histone modifications.
A Step-by-Step Histone ChIP-seq Protocol: From Cells to Sequencing
The initial stage of sample preparation and cross-linking is a critical determinant of success in Chromatin Immunoprecipitation followed by sequencing (ChIP-seq) workflows, particularly for mapping histone modifications. This foundational step aims to capture and stabilize protein-DNA interactions as they exist in vivo, creating a snapshot of the chromatin landscape [30]. Inadequate stabilization can compromise the entire experiment, leading to weak signals, high background noise, and failure to detect biologically relevant binding events. The fundamental goal of this phase is to covalently link histone proteins to their bound DNA sequences using crosslinking reagents, thereby creating stable complexes that can survive subsequent purification and processing steps [23]. The unique attributes of different biological materials—from cultured mammalian cells to complex plant tissues—demand specific adaptations to standard protocols to ensure optimal outcomes [31]. This technical guide provides detailed methodologies and optimized protocols for cross-linking diverse sample types, with a specific focus on applications for histone modification studies in drug development and basic research contexts.
Core Principles of Cross-Linking
Cross-Linking Chemistry and Reagent Selection
Cross-linking reagents create covalent bonds between histone proteins and DNA, stabilizing these interactions for subsequent analysis. Formaldehyde remains the most widely used cross-linker for standard ChIP-seq experiments due to its ability to penetrate cells rapidly and create reversible protein-DNA and protein-protein cross-links [30]. As a "zero-length" cross-linker, formaldehyde directly connects interacting molecules without adding additional atoms, making it ideal for capturing direct protein-DNA interactions [30].
For more challenging targets, particularly large multi-protein complexes or factors that do not bind DNA directly, double-crosslinking strategies have been developed to enhance stabilization [23]. These protocols typically employ a combination of formaldehyde with longer cross-linkers such as EGS (ethylene glycol bis(succinimidyl succinate), 16.1 Ã…) or DSG (disuccinimidyl glutarate, 7.7 Ã…) [30]. The extended spacer arms of these reagents enable them to trap complex quaternary structures and higher-order interactions that might be missed by formaldehyde alone [23]. The resulting dxChIP-seq protocol demonstrates improved mapping of chromatin factors and enhanced signal-to-noise ratio compared to single cross-linking methods [23].
Table 1: Cross-Linking Reagents for ChIP-seq
| Reagent | Spacer Arm Length | Primary Applications | Key Advantages | Limitations |
|---|---|---|---|---|
| Formaldehyde | Zero-length | Standard histone modifications, direct DNA binders | Rapid penetration, reversible crosslinks, established protocols | Limited for large complexes |
| DSG (Disuccinimidyl glutarate) | 7.7 Ã… | Multi-protein complexes, indirect DNA binders | Stabilizes protein-protein interactions, compatible with formaldehyde | Requires optimization of concentration |
| EGS (Ethylene glycol bis(succinimidyl succinate)) | 16.1 Ã… | Higher-order chromatin structures, challenging targets | Long spacer for complex structures, enhanced signal-to-noise | May require specialized quenching |
Sample-Specific Optimization Considerations
The source of biological material significantly impacts cross-linking strategy. Cultured mammalian cells typically present the most straightforward use case, with optimization primarily focused on cross-linking duration and reagent concentration [30]. In contrast, plant tissues contain unique attributes that complicate standard protocols, including rigid cell walls, vacuoles, and diverse secondary metabolites that can interfere with cross-linking efficiency [31]. Efficient in-house coupling of sample and library preparation for ChIP-seq of histone modifications in complex plant tissues requires specific adaptations to overcome these challenges, with time identified as a critical parameter for success [31].
For all sample types, cross-linking duration represents a crucial balancing act. Insufficient cross-linking fails to stabilize transient interactions, while excessive cross-linking can compromise chromatin integrity, impede cell lysis, and reduce chromatin shearing efficiency [30]. The optimal duration varies by cell type and must be determined empirically for each experimental system.
Experimental Protocols
Standard Formaldehyde Cross-Linking Protocol for Cultured Cells
This protocol is optimized for adherent mammalian cell lines and can be adapted for suspension cells with minor modifications.
Reagents and Solutions Required:
- 37% Formaldehyde solution (molecular biology grade)
- 2.5M Glycine (prepared in distilled water)
- Phosphate-Buffered Saline (PBS), ice-cold
- Protease inhibitor cocktail
- Cell scraping tool (for adherent cells)
Procedure:
- Cell Preparation: Grow cells to approximately 70-80% confluence. For suspension cells, ensure they are in log-phase growth.
- Cross-Linking: Add formaldehyde directly to culture medium to a final concentration of 1% (e.g., 270 μL of 37% formaldehyde per 10 mL medium). Incubate at room temperature for 8-12 minutes with gentle agitation [30].
- Quenching: Add glycine to a final concentration of 0.125M (e.g., 500 μL of 2.5M glycine per 10 mL medium) to stop the cross-linking reaction. Incubate for 5 minutes at room temperature with gentle agitation [30].
- Cell Harvesting: For adherent cells, scrape cells in their medium and transfer to conical tubes. For suspension cells, proceed directly to centrifugation.
- Washing: Centrifuge at 800 × g for 5 minutes at 4°C. Discard supernatant and resuspend cell pellet in 10 mL ice-cold PBS containing protease inhibitors. Repeat centrifugation and washing step once more.
- Storage: Flash-freeze cell pellet in liquid nitrogen and store at -80°C until use. Properly cross-linked samples can be stored for several months under these conditions [30].
Critical Optimization Parameters:
- Cross-linking duration: Test times between 5-15 minutes for new cell lines. Over-cross-linking manifests as difficulty in sonication and low DNA yield after immunoprecipitation.
- Cell number: Use approximately 2 × 10^6 cells per immunoprecipitation reaction as a starting point, though recent publications have successfully performed ChIP-seq with far fewer cells [30].
Double-Crosslinking Protocol for Challenging Targets
This advanced protocol is specifically designed for mapping chromatin factors that do not bind DNA directly, employing sequential cross-linking with DSG and formaldehyde [23].
Reagents and Solutions Required:
- DSG (Disuccinimidyl glutarate) stock solution: 25 mM in DMSO
- 37% Formaldehyde solution
- 2.5M Glycine
- PBS, ice-cold
- Protease inhibitor cocktail
Procedure:
- Primary Cross-linking: Prepare DSG working solution in PBS at a final concentration of 2 mM. Incubate cells with DSG solution for 45 minutes at room temperature with gentle agitation [23].
- Secondary Cross-linking: Add formaldehyde directly to the DSG-containing solution to a final concentration of 1%. Incubate for an additional 10 minutes at room temperature [23].
- Quenching and Harvesting: Add glycine to a final concentration of 0.125M and incubate for 5 minutes. Centrifuge at 800 × g for 5 minutes at 4°C.
- Washing: Wash cell pellet twice with 10 mL ice-cold PBS containing protease inhibitors.
- Storage: Flash-freeze cell pellet and store at -80°C.
Technical Notes:
- DSG stock solutions should be prepared fresh or aliquoted and stored at -20°C to prevent hydrolysis.
- Double-crosslinking typically requires more vigorous sonication conditions to achieve optimal chromatin fragmentation.
- This method is particularly valuable for studying transcription co-factors, chromatin remodelers, and other proteins that interact with DNA through intermediary factors [23].
Cross-Linking Protocol for Complex Plant Tissues
Plant material presents unique challenges due to cell walls, vacuoles, and secondary metabolites that can impair cross-linking efficiency. This protocol addresses these challenges through specific adaptations.
Reagents and Solutions Required:
- 37% Formaldehyde solution
- 2.5M Glycine
- Nuclei isolation buffer
- Vacuum desiccator
- Liquid nitrogen
Procedure:
- Tissue Preparation: Harvest plant tissue and quickly chop into small pieces (approximately 0.5 cm^2) to maximize surface area for cross-linking.
- Vacuum Infiltration: Submerge tissue in cross-linking solution (1% formaldehyde in PBS) and apply vacuum for 15-20 minutes. Release vacuum slowly and repeat once. This step ensures proper penetration of cross-linker through rigid plant cell walls [31].
- Quenching: Add glycine to 0.125M final concentration and incubate for 5 minutes with vacuum infiltration.
- Rinsing: Rinse tissue thoroughly with distilled water to remove residual cross-linking reagents.
- Flash-Freezing: Pat tissue dry and flash-freeze in liquid nitrogen. Store at -80°C until use.
Key Adaptations for Plant Material:
- The coupling of sample and library preparation is particularly critical for plant tissues, with time optimization identified as a essential parameter for generating robust NGS libraries [31].
- Nuclei extraction often requires additional steps such as density gradient centrifugation to remove contaminants that interfere with downstream processing.
The Scientist's Toolkit: Research Reagent Solutions
Table 2: Essential Research Reagents for ChIP-seq Sample Preparation
| Reagent/Material | Function | Application Notes | Recommended Storage |
|---|---|---|---|
| Formaldehyde (37%) | Primary cross-linking | Molecular biology grade; concentration typically 1% final | Room temperature, dark |
| DSG (Disuccinimidyl glutarate) | Extended-length cross-linking | Prepare fresh in DMSO; used at 2 mM final concentration | -20°C, desiccated |
| Protease Inhibitor Cocktail | Preserve protein integrity | Add fresh to all lysis and wash buffers | -20°C (aliquots) |
| Glycine | Quench cross-linking reaction | 2.5M stock solution in water | Room temperature |
| Micrococcal Nuclease (MNase) | Chromatin digestion | Alternative to sonication; more reproducible fragmentation | -20°C |
| Pierce Chromatin Prep Module | Nuclear fraction isolation | Reduces background signal from cytosolic proteins | 4°C |
| Ibezapolstat hydrochloride | Ibezapolstat hydrochloride, CAS:1275582-98-3, MF:C18H21Cl3N6O2, MW:459.8 g/mol | Chemical Reagent | Bench Chemicals |
| Aleuritic acid methyl ester | Aleuritic Acid Methyl Ester Supplier|For Research Use | High-purity Aleuritic Acid Methyl Ester for industrial and pharmaceutical research. A key intermediate for perfumes and polymers. For Research Use Only (RUO). | Bench Chemicals |
Workflow Visualization
ChIP-seq Sample Preparation and Cross-Linking Workflow
Quality Control and Troubleshooting
Quality Assessment Metrics
Successful cross-linking and chromatin preparation should meet specific quality benchmarks before proceeding to immunoprecipitation:
- Cross-linking Efficiency: Assessed by comparing the ratio of signals at known positive and negative control regions via qPCR after chromatin shearing and DNA purification [30]. A minimum 10-fold enrichment at positive control regions indicates adequate cross-linking.
- Chromatin Fragmentation Size: Ideal fragment sizes range from 200-700 bp, with a peak around 300-500 bp optimal for most histone modifications [30]. Analyze fragment size distribution using bioanalyzer or agarose gel electrophoresis.
- Microscopic Verification: After cell lysis, examine a 10 μL sample under a microscope to confirm efficient nuclear release while maintaining nuclear integrity [30].
Troubleshooting Common Issues
Table 3: Troubleshooting Cross-Linking and Sample Preparation
| Problem | Potential Causes | Solutions |
|---|---|---|
| Low DNA yield after IP | Over-cross-linking | Reduce formaldehyde concentration (0.5-1%) or duration (5-8 min) |
| High background noise | Incomplete quenching | Increase glycine concentration or incubation time |
| Poor chromatin fragmentation | Inefficient sonication | Optimize sonication conditions; ensure proper cell lysis |
| Inconsistent results between replicates | Variable cross-linking times | Strictly standardize cross-linking duration and quenching |
| Failure in plant tissues | Impermeable cell walls | Implement vacuum infiltration; extend cross-linking time [31] |
Proper execution of the sample preparation and cross-linking stage establishes the foundation for successful ChIP-seq experiments targeting histone modifications. The selection of appropriate cross-linking strategies—whether standard formaldehyde for direct DNA binders, double-crosslinking for challenging multi-protein complexes, or vacuum-assisted infiltration for plant tissues—directly impacts data quality and biological validity [23] [31]. By adhering to the optimized protocols detailed in this guide and implementing rigorous quality control measures, researchers can ensure that their ChIP-seq workflows capture authentic protein-DNA interactions representative of in vivo chromatin states. The subsequent stages of chromatin immunoprecipitation and sequencing build upon this carefully prepared foundation to generate genome-wide maps of histone modifications that advance our understanding of epigenetic regulation in development, disease, and drug response.
Within the Chromatin Immunoprecipitation followed by sequencing (ChIP-seq) workflow, chromatin shearing represents the most sensitive and critical technical juncture for generating high-quality, reproducible data [32]. The fundamental objective of this stage is to fragment cross-linked chromatin into a population of appropriately sized pieces without destroying the protein-DNA interactions of interest. For research focused on histone modifications—a cornerstone of epigenetic studies in drug development and disease modeling—optimal shearing is not merely a technical step but a prerequisite for biological discovery. Successfully sheared chromatin should yield fragments within a defined size range, typically 250-600 base pairs (bp) for comprehensive histone mark profiling, allowing for precise mapping of enrichment sites across the genome [32] [33].
The quality of shearing directly dictates the success of all downstream processes, including immunoprecipitation efficiency, sequencing library complexity, and ultimately, the resolution and accuracy of peak calling [33]. Suboptimal fragmentation is a primary contributor to experimental erraticism and a major factor behind the variable quality observed in public ChIP-seq datasets [32] [33]. Under-sonication, which produces fragments that are too long, can lead to increased background noise, poor antibody accessibility, and a loss of specific binding sites, particularly for factors in open chromatin regions [33]. Conversely, over-sonication can damage protein epitopes and DNA ends, reduce library yield, and consistently diminish overall data quality [33]. Therefore, a meticulously optimized and quality-controlled shearing protocol is non-negotiable for researchers and scientists aiming to produce publication-grade data that reliably informs mechanistic understanding and therapeutic target identification.
Sonication Methodologies and Optimization Strategies
Key Sonication Parameters
The process of chromatin fragmentation via sonication involves several controllable physical parameters. Systematic optimization of these variables is required to achieve the desired fragment size distribution for a specific cell type or tissue.
Table 1: Key Parameters for Sonicator Optimization
| Parameter | Description | Optimized Value (Example for Kasumi-1 Cell Line) |
|---|---|---|
| Peak Incident Power | The intensity of the sonic energy delivered. | 150 W [32] |
| Duty Factor | The percentage of time energy is delivered during a cycle. | 7.0% [32] |
| Cycles per Burst | The number of energy pulses per sonication event. | 200 [32] |
| Sonication Time | The total duration of the shearing process. | 7 minutes [32] |
| Sample Volume | Affects energy transfer and cavitation efficiency; controlled via water fill level in a water-bath sonicator. | Water fill level 8 [32] |
Buffer Composition for Optimal Shearing
The chemical environment during sonication is crucial for protecting chromatin integrity and maintaining protein-DNA interactions. An optimized sonication buffer provides the necessary ionic strength and detergent conditions for effective shearing.
Table 2: Optimized Sonication Buffer Components
| Component | Function | Optimized Concentration |
|---|---|---|
| SDS (Sodium Dodecyl Sulfate) | Denaturing detergent that helps solubilize chromatin and disrupt membranes. | 0.15% [32] |
| DOC (Sodium Deoxycholate) | Ionic detergent that aids in protein solubilization and lysis. | 0.05% [32] |
Workflow for Systematic Sonication Optimization
The following diagram outlines a logical pathway for developing and validating an optimized chromatin shearing protocol.
Quality Control for Sheared Chromatin
Rigorous quality control (QC) after sonication is essential before proceeding to immunoprecipitation. The primary QC metric is the size distribution of the sheared DNA fragments.
Procedure for Fragment Size Analysis:
- DNA Purification: Reverse the cross-links in a small aliquot (e.g., 50 µL) of sheared chromatin by incubating with 5M NaCl and Proteinase K at 65°C for several hours or overnight [33].
- DNA Recovery: Purify the DNA using a standard phenol-chloroform extraction and ethanol precipitation protocol or a commercial PCR purification kit.
- Analysis: Analyze the purified DNA using a high-sensitivity DNA assay, such as the Agilent Bioanalyzer or TapeStation. This provides an electrophoretogram and a gel image, allowing for precise quantification of the fragment size distribution.
Interpretation of Results:
- Optimal: A smooth, unimodal distribution centered in the 250-600 bp range indicates successful and homogeneous shearing [32] [33].
- Suboptimal (Under-sonication): A broad smear or a peak at a size >1000 bp indicates insufficient fragmentation. This requires increased sonication time or intensity.
- Suboptimal (Over-sonication): A very low molecular weight smear (<150 bp) indicates excessive fragmentation, which can damage epitopes and should be remedied by reducing sonication time.
Advanced Considerations for Complex Samples
The standardized protocol may require adjustments for challenging biological materials.
- Solid Tissues: The dense and heterogeneous nature of solid tissues, such as colorectal cancer samples, presents unique challenges. An optimized protocol recommends thorough mincing of frozen tissue on ice followed by mechanical homogenization using a Dounce grinder or a gentleMACS Dissociator before proceeding to sonication [17]. This ensures a uniform cell suspension from which chromatin can be effectively extracted and sheared.
- Difficult-to-Bind Proteins: For chromatin-binding proteins that interact indirectly with DNA, a dual-crosslinking approach using a combination of formaldehyde and a longer-range crosslinker like DSG (disuccinimidyl glutarate) can better preserve these interactions during the rigorous sonication process [34].
The Scientist's Toolkit: Essential Reagents and Materials
Table 3: Key Research Reagent Solutions for Chromatin Shearing
| Item | Function/Description | Example Use Case |
|---|---|---|
| Covaris S220 | Focused-ultrasonicator for reproducible, high-throughput shearing. | Standard for generating consistent fragment sizes in suspension cell lines [32]. |
| Bioruptor Pico | Water-bath ultrasonicator; a cost-effective alternative for many labs. | Suitable for shearing multiple samples in parallel with cooling integrated. |
| SDS (Sodium Dodecyl Sulfate) | Ionic detergent used in sonication buffer to solubilize chromatin. | Used at 0.15% in optimized shearing buffer [32]. |
| DOC (Sodium Deoxycholate) | Ionic detergent used in sonication buffer to aid in lysis. | Used at 0.05% in optimized shearing buffer [32]. |
| Protease Inhibitor Cocktail | Prevents proteolytic degradation of proteins during chromatin preparation. | Essential for all steps from cell lysis to sonication [17]. |
| Dounce Homogenizer | Glass homogenizer with tight-fitting pestle for mechanical tissue disruption. | Used for manual homogenization of minced frozen tissues prior to sonication [17]. |
| gentleMACS Dissociator | Semi-automated instrument for standardized tissue dissociation. | Alternative to Dounce for more reproducible tissue homogenization [17]. |
| Agilent Bioanalyzer 2100 | Microfluidics-based platform for automated analysis of DNA fragment size. | Gold-standard QC for evaluating sheared chromatin size distribution. |
| Fpmpg | Fpmpg, CAS:135484-48-9, MF:C9H13FN5O5P, MW:321.20 g/mol | Chemical Reagent |
| Einecs 304-904-9 | Einecs 304-904-9, CAS:94291-78-8, MF:C30H20F46NO6P, MW:1395.4 g/mol | Chemical Reagent |
Impact on Downstream ChIP-seq Analysis
The quality of chromatin shearing has a profound and lasting impact on the final ChIP-seq data. Well-sheared chromatin with a tight size distribution directly enhances key quality metrics used by the ENCODE consortium and other authoritative bodies [35] [33].
- Fraction of Reads in Peaks (FRiP): This critical metric measures the signal-to-noise ratio in the experiment. Optimal shearing maximizes specific antibody enrichment, leading to a higher FRiP score, which is a strong indicator of a successful ChIP [35].
- Strand Cross-Correlation: This analysis assesses the clustering of sequence tags on forward and reverse strands. A high-quality sonication produces a clear peak in the cross-correlation plot corresponding to the average fragment length, which is a hallmark of a strong experiment [14].
- Peak Resolution and Identification: Under-sonication can lead to a loss of specific binding sites, particularly for factors with weaker or indirect binding, while over-sonication reduces the overall quality of the dataset, making it harder to distinguish true signal from background [33].
In conclusion, investing the time to rigorously optimize and quality-control the chromatin shearing stage is not a mere technical formality but a foundational step that ensures the entire ChIP-seq workflow for histone modifications builds upon reliable, high-integrity data. This is indispensable for researchers and drug development professionals seeking to draw meaningful biological conclusions about epigenetic mechanisms in health and disease.
The immunoprecipitation (IP) stage is the core of the Chromatin Immunoprecipitation followed by sequencing (ChIP-seq) workflow, where the specific protein-DNA complexes of interest are selectively isolated from the vast complexity of the cellular chromatin. For studies focusing on histone modifications, this step determines the specificity and efficiency of the entire experiment. The process relies on two critical components: a high-quality antibody that specifically recognizes the target histone post-translational modification (PTM) and an optimized bead-based system to capture the antibody-bound complexes [36]. The success of this stage is foundational to all downstream analyses, including the genome-wide mapping of histone marks such as H3K4me3 at active promoters or H3K27me3 within Polycomb-repressed domains [10] [37]. This guide details the practical and theoretical considerations for executing this pivotal stage.
Antibody Selection: The Foundation of Specificity
The choice of antibody is the single most important factor in a ChIP-seq experiment, as it directly defines the specificity of the enrichment and the reliability of the resulting data.
Key Criteria for Selection
- Specificity and Validation: The antibody must be highly specific for the target histone PTM (e.g., H3K27ac, H3K4me3). It should be validated for ChIP-seq applications, preferably with data available in peer-reviewed literature or from the manufacturer. Antibodies should be tested for cross-reactivity with similar epitopes [36] [38].
- Affinity: The antibody's binding strength (affinity) for its epitope influences the efficiency of the immunoprecipitation and the signal-to-noise ratio of the final data [38].
- Immunogen: The immunogen used to generate the antibody should be documented. Antibodies raised against a modified histone peptide that includes the specific PTM are often preferred.
- Host Species and Clonality: The host species (e.g., rabbit, mouse) should be compatible with the chosen protein A/G beads. Monoclonal antibodies offer high batch-to-batch consistency, whereas polyclonal sera can have higher avidity but may be less specific and vary between lots.
- Titration is Critical: Recent studies underscore that antibody concentration significantly impacts the outcome of ChIP-seq. Titrating the antibody is essential to establish a binding isotherm, ensuring the reaction operates within a quantitative range and helps distinguish high-affinity (on-target) from low-affinity (off-target) interactions [38].
Characterizing Antibody Binding Spectrum
Antibodies can exhibit a spectrum of binding behaviors, which can be characterized by sequencing points along a titration isotherm in a method like siQ-ChIP (sans spike-in quantitative ChIP-seq) [38].
Table: Characteristics of Antibody Binding Spectra
| Spectrum Type | Binding Characteristics | Impact on ChIP-seq Data |
|---|---|---|
| Narrow Spectrum | Exhibits a single, observable binding constant; interacts with a single epitope or multiple epitopes with identical affinity. | Ideal scenario; yields highly specific and interpretable data. |
| Broad Spectrum | Binds most strongly to the intended target but also exhibits weaker, lower-affinity interactions with other epitopes. | Can introduce off-target peaks; data interpretation requires caution. |
Bead-Based Capture: Optimization and Execution
Following antibody incubation, the immune complexes are captured using beads coated with Protein A, Protein G, or a recombinant Protein A/G mixture, which have high affinity for the Fc region of antibodies.
Bead Selection and Handling
- Protein A/G Beads: The choice between Protein A and Protein G depends on the host species and isotope of the primary antibody. Recombinant Protein A/G beads, which combine the binding profiles of both, are a versatile and common choice for maximum coverage across antibody types [36].
- Blocking and Pre-clearing: Many protocols include bead blocking and chromatin pre-clearing steps to reduce non-specific background. However, an optimized siQ-ChIP protocol demonstrates that with careful control of chromatin concentration, non-specific bead capture can be consistently maintained below 1.5% of input DNA, making pre-clearing and blocking unnecessary and simplifying the protocol [38].
- Chromatin Input Concentration: The amount of chromatin used is a critical parameter. Excessive chromatin input can lead to increased non-specific capture by the beads, thereby reducing the signal-to-noise ratio. The input should be optimized to stay within the linear range of the bead's capacity [38].
Critical Controls and Quantitative Assessment
Incorporating the right controls is mandatory for validating the IP stage.
- Bead-Only Control: A sample containing chromatin and beads but no antibody is essential to quantify and account for non-specific binding to the bead surface. A capture of more than ~1.5% of input DNA is considered a disqualifying level of non-specific interaction [38].
- Binding Isotherm: Titrating the antibody and measuring the mass of immunoprecipitated DNA creates a binding isotherm. A well-formed isotherm, where DNA capture increases with antibody concentration until saturation, confirms that the IP is functioning as a quantitative binding reaction [38].
- Input DNA: A sample of the sonicated or MNase-digested chromatin prior to IP must be saved. This "input" DNA serves as a reference for downstream bioinformatic normalization and peak calling, accounting for variations in chromatin accessibility and sequencing efficiency [37].
Table: Quantitative Benchmarks for Bead-Based Capture
| Parameter | Optimal Value / Range | Purpose and Rationale |
|---|---|---|
| Bead-Only DNA Capture | < 1.5% of input DNA | Threshold for acceptable non-specific background; higher values disqualify the sample. |
| MNase Digestion | Mononucleosome-sized fragments (~147 bp) | Provides superior resolution and quantification accuracy compared to sonication. |
| Crosslinking Quenching | 750 mM Tris | Recommended over glycine for more effective and reproducible termination of crosslinking. |
Integrated Experimental Protocol
The following is a detailed step-by-step protocol for the immunoprecipitation and bead-based capture stage, incorporating best practices for histone modification studies [36] [38].
Step 1: Prepare Chromatin
- Use chromatin fragmented to mononucleosomes via MNase digestion [38]. Determine DNA concentration accurately.
- Dilute chromatin to the optimal working concentration in IP buffer (e.g., RIPA buffer).
Step 2: Pre-clear Beads (Optional)
- If necessary, pre-clear the chromatin by incubating with a small volume of bare beads for 1 hour at 4°C with rotation. Pellet beads and collect supernatant.
Step 3: Antibody Incubation
- Add the predetermined, titrated amount of specific antibody or isotype control antibody to the chromatin.
- Incubate for 4 hours to overnight at 4°C with rotation.
Step 4: Bead Capture
- Wash protein A/G beads thoroughly with IP buffer.
- Add the washed beads to the antibody-chromatin mixture.
- Incubate for 2 hours at 4°C with rotation.
Step 5: Washes
- Pellet beads gently and carefully remove the supernatant.
- Wash the bead-antibody-chromatin complex with a series of cold wash buffers of increasing stringency (e.g., Low Salt Wash Buffer, High Salt Wash Buffer, LiCl Wash Buffer, and finally TE Buffer) to remove non-specifically bound material.
Step 6: Elution and Reverse Crosslinking
- Elute the immunoprecipitated complexes from the beads using a freshly prepared elution buffer (e.g., 1% SDS, 0.1 M NaHCO3).
- Reverse the crosslinks by adding NaCl to a final concentration of 200 mM and incubating at 65°C for several hours or overnight.
- Treat with Proteinase K and RNase A to digest proteins and RNA.
- Purify the DNA using a commercial PCR purification kit. The purified DNA is now ready for library construction and sequencing.
Below is a workflow diagram summarizing the key stages of the Chromatin Immunoprecipitation process.
The Scientist's Toolkit: Research Reagent Solutions
Table: Essential Reagents for Immunoprecipitation and Capture
| Reagent / Material | Function and Importance |
|---|---|
| Specific Histone PTM Antibody | The primary reagent that confers specificity; must be validated for ChIP-seq and titrated for optimal performance [36] [38]. |
| Protein A, G, or A/G Magnetic Beads | Solid-phase support for capturing antibody-target complexes; magnetic beads facilitate easy washing and buffer changes [36]. |
| MNase Enzyme | Preferred method for chromatin fragmentation; yields mononucleosome-sized fragments for high-resolution mapping and superior quantification [38]. |
| Crosslinking Reagent (Formaldehyde) | Stabilizes transient protein-DNA interactions in situ, preserving the native chromatin state for analysis [36]. |
| Quenching Reagent (Tris Buffer) | Effectively terminates the formaldehyde crosslinking reaction, ensuring consistency and reproducibility [38]. |
| Stringent Wash Buffers | A series of buffers with varying salt concentrations and detergents to remove weakly and non-specifically bound chromatin, reducing background noise. |
| Elution Buffer (e.g., with SDS) | Disrupts antibody-antigen and bead-antibody interactions, releasing the captured immunoprecipitated DNA for purification. |
Following chromatin immunoprecipitation, the purified DNA fragments must be converted into a sequenceable library. This stage is critical for generating high-quality data from your ChIP-seq experiment, particularly for histone modification studies. Library preparation involves a series of molecular biology steps that attach platform-specific adapters to the immunoprecipitated DNA fragments, enabling amplification and sequencing on next-generation sequencing (NGS) platforms. The success of this process directly impacts data quality, complexity, and ultimate biological interpretation [31] [6].
For histone modifications, which typically produce enriched regions rather than punctate binding sites, library quality requirements are particularly stringent. The protocol must efficiently handle fragmented chromatin, preserve diversity of representation, and minimize biases that could distort enrichment patterns. Recent advances have led to optimized, cost-effective strategies that couple sample and library preparation, especially for complex materials like plant or mammalian tissues [31] [17]. This section provides a comprehensive technical guide to library preparation methodologies and sequencing platform considerations for histone modification ChIP-seq studies.
Core Library Preparation Workflow
The fundamental workflow for ChIP-seq library construction involves specific enzymatic steps that prepare DNA fragments for the sequencing process. While commercial kits are widely available, understanding the core principles is essential for troubleshooting and optimizing protocols for specific sample types, including challenging solid tissues [17].
Table: Core Steps in ChIP-seq Library Preparation
| Step | Key Function | Critical Parameters |
|---|---|---|
| End Repair | Creates blunt ends from sheared DNA | Enzyme efficiency, incubation time/temperature |
| A-tailing | Adds single 'A' nucleotide to 3' ends | Prevents adapter concatemerization; facilitates T-overhang ligation |
| Adapter Ligation | Attaches platform-specific sequencing adapters | Adapter concentration, ligation time, avoiding fragment size bias |
| Size Selection | Removes unligated adapters and incorrect fragment sizes | Method choice (SPRI beads/gel), target range (150-300 bp for histones) |
| PCR Amplification | Enriches for adapter-ligated fragments | Cycle number (minimize!), polymerase fidelity, primer design |
| Quality Control | Verifies library quality and quantity | Fragment analyzer, qPCR/ddPCR for accurate quantification |
Detailed Methodological Protocols
Standard Library Construction
For most histone modification ChIP-seq projects, the library construction process follows a standardized enzymatic pathway. After ChIP DNA purification, the fragmented DNA undergoes end-repair and A-tailing to create 3'A-overhangs compatible with T-overhang ligation chemistry [6]. This is followed by ligation of platform-specific adapters containing unique molecular identifiers (barcodes) that enable sample multiplexing. A critical subsequent step is library amplification via PCR, which must be carefully optimized since excessive amplification cycles can introduce duplicates and skew representation. The ENCODE consortium recommends tracking library complexity using metrics like the Non-Redundant Fraction (NRF > 0.9) and PCR Bottlenecking Coefficients (PBC1 > 0.9, PBC2 > 10) [39].
Refined Protocol for Complex Tissues
Working with solid tissues presents unique challenges including cellular heterogeneity and complex matrices. A refined 2025 protocol addresses these challenges through optimized procedures for tissue preparation, chromatin extraction, and library construction [17]. Key adaptations include:
- Enhanced chromatin extraction from dense tissue matrices using optimized lysis buffers
- Improved immunoprecipitation with refined washing steps to minimize background noise
- Library construction compatible with multiple sequencing platforms, including DNBSEQ-G99RS This protocol emphasizes multi-stage quality checkpoints throughout the process to ensure the preservation of tissue-specific chromatin features and enhance output data quality, making it particularly suitable for disease-relevant chromatin state analysis in vivo [17].
Sequencing Platform Selection
Choosing the appropriate sequencing platform represents a critical decision point that affects data quality, experimental cost, and analytical approaches. The 2025 sequencing landscape offers numerous options, each with distinct advantages for particular applications [40].
Platform Technologies and Specifications
As of 2025, the market features diverse sequencing technologies across multiple providers. For histone modification studies, key considerations include read length, throughput, accuracy profiles, and cost per sample. Short-read sequencing platforms (e.g., Illumina) remain the dominant choice for most histone mark ChIP-seq applications due to their high accuracy and throughput. However, long-read technologies (e.g., PacBio, Oxford Nanopore) are emerging for specialized applications requiring haplotype resolution or complex region analysis [40].
Table: Sequencing Platform Comparison for ChIP-seq (2025)
| Platform/Technology | Read Length | Accuracy | Throughput Range | Best Suited For |
|---|---|---|---|---|
| Illumina SBS | Short-read (50-300 bp) | Very high (>Q30) | Up to 16 Tb/run (NovaSeq X) | Standard histone marks; high-throughput studies |
| PacBio HiFi | Long-read (10-25 kb) | Very high (>Q30) | 60-360 Gb/run (Revio) | Complex genomic regions; haplotype phasing |
| ONT Q20+ Duplex | Long-read (varies) | High (>Q20 simplex, >Q30 duplex) | Portable to high-throughput | Epigenetic modifications including native histones |
| MGI/DNBSEQ | Short-read (50-400 bp) | High (>Q30) | Medium to high | Cost-effective large cohort studies |
Platform Selection by Experimental Scenario
The optimal sequencing platform choice depends heavily on specific research goals and constraints:
- High-throughput histone mapping: Illumina platforms remain the gold standard for projects requiring massive throughput and proven accuracy, with the NovaSeq X series offering up to 16 terabases per run [40].
- Cost-sensitive large cohorts: BGI's DNBSEQ platforms offer competitive pricing without substantial quality sacrifice, making them suitable for epidemiological studies or large-scale drug screening [41] [40].
- Complex region analysis: For histones marks in repetitive regions or requiring haplotype resolution, PacBio's HiFi sequencing provides long reads with high accuracy (>99.9%) through circular consensus sequencing [40].
- Native modification detection: Oxford Nanopore's Q20+ chemistry enables direct detection of histone modifications without immunoprecipitation, though this application remains emerging for ChIP-seq equivalents [40].
Quality Control and Standards
Rigorous quality control throughout library preparation and sequencing is essential for generating biologically interpretable data. The ENCODE consortium has established comprehensive guidelines and metrics for assessing ChIP-seq library and data quality [39] [35].
Pre-sequencing Quality Control
Before proceeding to sequencing, prepared libraries must undergo stringent QC:
- Fragment size distribution analysis using capillary electrophoresis (e.g., Agilent Bioanalyzer/TapeStation) confirms the expected size profile (typically 200-600 bp including adapters) [6].
- Quantification via qPCR or digital PCR provides accurate molarity for pooling and loading calculations, superior to spectrophotometric methods [6].
- Library complexity assessment using Pre-sequencing QC metrics (NRF > 0.9 recommended) helps predict data quality [39].
Post-sequencing Quality Metrics
After sequencing, specific quality metrics determine experiment success:
- Fraction of Reads in Peaks (FRiP): For histone modifications, a FRiP score >0.3 is generally indicative of a successful experiment, with higher values (up to 0.8 for marks like H3K4me3) expected for strongly enriched marks [39] [35].
- Strand Cross-Correlation: Analysis of the cross-correlation profile should show a clear peak at the fragment length, with a normalized strand coefficient (NSC) >1.05 and relative strand coefficient (RSC) >1.0 [14].
- Library Complexity: Post-alignment, PCR bottlenecking coefficients (PBC1 >0.9, PBC2 >10) measure library complexity and duplication levels [39].
- Read Depth: The ENCODE consortium recommends a minimum of 20 million usable fragments per replicate for transcription factors, with histone modifications often requiring greater depth depending on mark specificity and genome size [39].
The Scientist's Toolkit: Essential Research Reagents
Successful ChIP-seq library preparation requires specific reagents and materials carefully selected for their intended applications. The following toolkit highlights essential components for robust library construction.
Table: Essential Research Reagents for ChIP-seq Library Preparation
| Reagent/Material | Function | Selection Considerations |
|---|---|---|
| Library Preparation Kit | Provides enzymes/buffers for end repair, A-tailing, ligation | Platform compatibility; efficiency for low-input samples |
| Platform-Specific Adapters | Enable binding to flow cell and sample multiplexing | Unique dual indexes to avoid index hopping; validation for platform |
| Size Selection Beads | Cleanup after steps; size selection | SPRI/AMPure beads most common; ratio determines size cutoff |
| High-Fidelity Polymerase | PCR amplification of adapter-ligated fragments | Low error rate; minimal bias; efficiency with GC-rich regions |
| DNA Quantitation Assays | Pre-sequencing library quantification | Fluorometric (Qubit) for concentration; qPCR for functional titer |
| Fragment Analyzer | Size distribution assessment | Agilent Bioanalyzer/TapeStation; capillary electrophoresis |
| Magnetic Stand | Bead separation in multiwell plates | Compatible with plate format; strong magnet for complete clearance |
Emerging Methods and Future Directions
Library preparation and sequencing technologies continue to evolve, with several emerging trends particularly relevant for histone modification studies. The integration of multi-omic approaches is becoming increasingly important, with methods like CoTACIT enabling simultaneous profiling of multiple histone modifications in the same single cell [42]. Automation and miniaturization of library preparation processes are improving reproducibility while reducing costs and hands-on time. Additionally, new sequencing chemistries like PacBio's SPRQ are being developed to extract both DNA sequence and regulatory information from the same molecule, potentially opening new avenues for integrated epigenomic profiling [40]. These advances promise to enhance our understanding of chromatin dynamics in development and disease, providing increasingly sophisticated tools for researchers and drug development professionals studying epigenetic mechanisms.
Chromatin Immunoprecipitation followed by sequencing (ChIP-seq) has become an indispensable technique for mapping genome-wide protein-DNA interactions and histone modifications, providing critical insights into gene regulatory mechanisms and epigenetic landscapes [22] [43]. Despite its widespread adoption in epigenomic research, the analysis of ChIP-seq data presents significant computational challenges that often require specialized bioinformatics expertise, creating barriers for many experimental researchers [22] [44]. The typical ChIP-seq workflow encompasses multiple complex stages, including raw data acquisition, quality control, adapter trimming, reference genome alignment, peak calling, and functional annotation of results [22]. Each of these stages demands careful parameter optimization and quality assessment to ensure biologically meaningful results.
In response to these challenges, fully automated web-based platforms have emerged to streamline the entire analytical process. H3NGST (Hybrid, High-throughput, and High-resolution NGS Toolkit) represents a significant advancement in this domain, offering researchers an end-to-end solution that eliminates the need for local software installations, programming skills, or manual file uploads [22] [44]. By simply providing a public BioProject accession number, researchers can initiate a comprehensive analysis pipeline that delivers reproducible, high-resolution results for both transcription factor binding studies and histone modification profiling [45]. This automated approach is particularly valuable for drug development professionals and researchers seeking to accelerate their epigenomic investigations without investing extensive time in computational method development.
The H3NGST Architecture and Workflow
H3NGST is engineered as a fully automated, web-based platform specifically designed to address the technical barriers associated with conventional ChIP-seq analysis pipelines [22]. The system operates entirely server-side, requiring no local installation or file uploads from users, with all data transmissions protected through SSL/TLS encryption to ensure security and data integrity [44]. A key innovation of H3NGST is its upload-free design; instead of requiring users to upload large sequencing files, the platform directly retrieves raw data from public repositories like the Sequence Read Archive (SRA) using accessible identifiers such as BioProject (PRJNA), SRA experiment (SRX), GEO sample (GSM), or GEO series (GSE) accessions [22] [44]. The platform features an intuitive, mobile-accessible web interface that guides users through a simple four-step process: entering a BioProject ID, assigning a nickname for job tracking, configuring minimal analysis parameters, and submitting the job for processing [22].
The workflow automation in H3NGST intelligently adapts to dataset characteristics, automatically detecting library layout (single-end or paired-end) from SRA metadata and dynamically adjusting all downstream parameters for trimming, alignment, and peak calling accordingly [22] [44]. This intelligent automation extends to the selection of reference genomes and peak-calling specifications, allowing users to customize their analysis for either narrow peaks (typical for transcription factors) or broad peaks (characteristic of histone modifications) while maintaining optimized default parameters for each analysis type [22].
Comprehensive Analytical Workflow
The H3NGST pipeline executes a sophisticated multi-stage analytical process that transforms raw sequencing data into biologically interpretable results. The workflow progresses through four major phases, each comprising several critical analytical steps, as visualized below.
Figure 1: The H3NGST automated analysis workflow encompasses four major phases from data retrieval to comprehensive annotation, utilizing established bioinformatics tools at each stage.
The initial data acquisition phase begins with user submission of a BioProject ID, which the system resolves to specific SRA run identifiers using the NCBI Entrez system [22] [44]. The platform then downloads the corresponding SRA files using the prefetch utility and converts them to FASTQ format using fasterq-dump. A critical automated step involves detecting the library layout from SRA RunInfo metadata, enabling appropriate parameter adjustment throughout subsequent analysis stages [22].
Quality control and preprocessing constitute the second major phase, where raw FASTQ files undergo rigorous quality assessment using FastQC to identify adapter contamination and low-quality sequences [22]. Adapter trimming and quality-based read filtering are performed using Trimmomatic with a sliding window approach, followed by a second FastQC run to verify the quality of processed reads [44]. This two-stage quality assessment ensures that only high-quality reads proceed to alignment, reducing artifacts in downstream analyses.
The sequence alignment phase utilizes BWA-MEM for reference genome alignment, generating SAM files that are subsequently sorted and converted to BAM format using Samtools [22] [44]. The pipeline then employs Bedtools for BAM to BED format conversion and DeepTools for generating BigWig signal tracks suitable for genome browser visualization [22]. This phase produces the fundamental data structures necessary for peak detection and visualization.
The final phase encompasses peak calling, motif discovery, and genomic annotation. H3NGST utilizes HOMER for peak calling, with specific configurations for either narrow or broad peak profiles appropriate for different histone modifications [22]. The platform performs motif enrichment analysis to identify potential transcriptional regulators and annotates peaks with genomic features including gene associations, proximity to transcription start sites, and functional categories [22] [44]. This comprehensive annotation provides crucial biological context for interpreting the identified enrichment regions.
Methodologies and Technical Specifications
Computational Tools and Parameters
The H3NGST platform integrates a carefully selected suite of established bioinformatics tools, each optimized for specific analytical tasks within the ChIP-seq workflow. The table below details the key software components, their specific functions, and user-configurable parameters that enable customization for different experimental needs.
Table 1: Computational Tools and Configurable Parameters in the H3NGST Pipeline
| Tool | Function | User-Defined Parameters | Default Settings |
|---|---|---|---|
| prefetch & fasterq-dump | SRA data retrieval & FASTQ conversion | None | Default [44] |
| FastQC | Quality control assessment | None | Default [44] |
| Trimmomatic | Adapter trimming & quality filtering | None | ILLUMINACLIP:adapters.fa:2:30:10 SLIDINGWINDOW:4:10 MINLEN:20 [44] |
| BWA-MEM | Reference genome alignment | Reference genome (e.g., hg38, mm10) | Default [44] |
| Samtools | SAM/BAM conversion, sorting & indexing | None | Default [44] |
| Bedtools | BAM to BED conversion | None | Default [44] |
| DeepTools | BigWig signal track generation | None | --extendReads 200 --binSize 5 --normalizeUsing None [44] |
| HOMER findPeaks | Peak detection | Peak style (narrow/broad), FDR threshold | -style STYLE -o auto -fdr FDR [44] |
| HOMER findMotifsGenome | De novo motif discovery | Reference genome | -size 200 -len 8,10,12 [44] |
| HOMER annotatePeaks | Genomic annotation | Reference genome, Promoter region | Default [44] |
The platform employs a balanced approach between automation and flexibility, maintaining robust default parameters while allowing researchers to specify critical analysis parameters such as reference genome, peak type, and statistical thresholds [22]. This design ensures analytical consistency while accommodating diverse experimental requirements. For histone modification studies, researchers can select broad peak calling to appropriately capture the extended enrichment domains characteristic of marks such as H3K27me3 or H3K36me3 [8].
Quality Control Standards and Metrics
H3NGST incorporates comprehensive quality assessment throughout the analytical workflow, with particular emphasis on preprocessing and alignment steps. The platform provides detailed quality metrics that enable researchers to evaluate data quality and analytical outcomes.
Table 2: Key Quality Metrics and Standards for ChIP-seq Analysis
| Quality Metric | Description | Preferred Values | Assessment Tool |
|---|---|---|---|
| Read Survival Rate | Percentage of reads retained after trimming | Varies by dataset | Trimmomatic summary [22] |
| Library Complexity | Uniquely mapped reads assessment | NRF>0.9, PBC1>0.9, PBC2>10 [8] | ENCODE standards [8] |
| FRiP Score | Fraction of reads in peaks | >1% for broad marks, >0.3% for TFs [8] | ENCODE standards [8] |
| Peak Number | Total significant peaks identified | Varies by mark and sequencing depth | HOMER findPeaks [22] |
| Alignment Rate | Percentage of reads mapped to reference | >70-80% | BWA-MEM [22] |
| Sequence Depth | Total mapped reads per replicate | 45M for broad marks, 20M for narrow marks [8] | ENCODE standards [8] |
For histone modification studies, the ENCODE consortium has established specific standards that inform H3NGST's quality assessment [8]. Broad histone marks such as H3K27me3, H3K36me3, and H3K4me1 require approximately 45 million usable fragments per replicate, while narrow marks including H3K27ac, H3K4me2, and H3K4me3 require 20 million fragments [8]. The platform evaluates library complexity using Non-Redundant Fraction (NRF) and PCR Bottlenecking Coefficients (PBC1 and PBC2), with preferred values of NRF>0.9, PBC1>0.9, and PBC2>3 [8]. These stringent quality metrics ensure that downstream analyses are based on robust, high-quality data.
Comparative Analysis with Existing Platforms
Feature Comparison with Alternative Solutions
When evaluated against other web-based platforms for ChIP-seq analysis, H3NGST demonstrates distinct advantages in accessibility, automation, and user experience. The table below provides a systematic comparison of H3NGST with other commonly used platforms.
Table 3: Comparison of H3NGST with Existing Web-Based ChIP-seq Analysis Platforms
| Platform Name | Currently Usable | Free of Charge | Usable Without Login | Usable Without File Upload | Fully Automated | Reference |
|---|---|---|---|---|---|---|
| H3NGST | Yes | Yes | Yes | Yes | Yes | [22] [46] |
| Galaxy | Yes | Yes | No | Yes | No | [46] |
| Basepair | Yes | Paid | No | No | Yes | [46] |
| GenePattern | Yes | Yes | Guest mode | No | No | [46] |
| Cistrome Galaxy | Yes | Yes | No | No | No | [46] |
| CSA | No | Yes | No | No | Yes | [46] |
H3NGST's unique combination of features positions it as a particularly accessible solution for researchers with limited bioinformatics support. Unlike Galaxy and GenePattern, which require user registration and manual file uploads, H3NGST enables completely anonymous analysis initiation without the need to transfer large sequencing files [46]. The platform's direct integration with public data repositories distinguishes it from commercial services like Basepair, which require payment and maintain more restrictive access policies [46]. This comprehensive automation and accessibility make H3NGST particularly valuable for researchers prioritizing efficiency and ease of use.
Advantages for Histone Modification Studies
For researchers investigating histone modifications, H3NGST offers several specialized benefits. The platform automatically handles the characteristically broad enrichment patterns of marks such as H3K27me3 and H3K36me3 through its configurable peak calling settings, which can be optimized for either narrow or broad peak profiles [22] [8]. The integrated motif discovery functionality helps identify transcription factor binding sites associated with specific chromatin states, potentially revealing cooperative relationships between histone modifications and transcription factor binding [22] [47].
The annotation capabilities provide crucial functional context by categorizing peaks based on genomic regions (promoters, enhancers, gene bodies), enabling researchers to link histone modifications to regulatory elements and potential target genes [22]. This comprehensive functional annotation is particularly valuable for interpreting the biological significance of histone modification patterns in the context of gene regulation and epigenetic mechanisms.
Research Reagent Solutions and Experimental Considerations
Successful ChIP-seq experiments depend on carefully selected reagents and appropriate experimental design. The table below outlines essential research reagents and their functions in histone modification studies.
Table 4: Essential Research Reagents for ChIP-seq Experiments
| Reagent Category | Specific Examples | Function in Experiment | Considerations |
|---|---|---|---|
| Histone Modification Antibodies | H3K27ac, H3K4me3, H3K27me3, H3K36me3 | Target-specific immunoprecipitation | Must be ChIP-grade validated; check ENCODE certification [8] [6] |
| Cell Fixation Reagents | Formaldehyde, DSG, Glutaraldehyde | Crosslink proteins to DNA | Concentration and time optimization required [6] |
| Chromatin Shearing Reagents | Micrococcal Nuclease (MNase), Sonication reagents | Fragment chromatin to appropriate size | MNase preferred for nucleosome-level resolution [8] [6] |
| Immunoprecipitation Beads | Protein A/G magnetic beads | Antibody capture and complex isolation | Compatibility with antibody isotype [6] |
| Library Preparation Kits | Illumina-compatible kits | Sequencing library construction | Size selection critical for resolution [6] |
| Quality Control Assays | Bioanalyzer, Qubit, qPCR reagents | Assessment of DNA quality and quantity | Essential for evaluating IP success [6] |
Antibody validation remains particularly critical for histone modification studies. Researchers should prioritize antibodies with demonstrated specificity in ChIP assays, preferably those validated by the ENCODE consortium or similar initiatives [8] [6]. The emergence of spike-in technologies, such as SNAP-ChIP, provides additional quality control by assessing antibody performance directly in experimental contexts [6]. Appropriate control experiments, including input DNA and negative control immunoprecipitations, are essential for distinguishing specific enrichment from background signal [8] [6].
H3NGST represents a significant advancement in making sophisticated ChIP-seq analysis accessible to researchers across computational skill levels. By automating the entire workflow from raw data retrieval to biological interpretation, the platform substantially reduces the technical barriers associated with histone modification mapping [22] [44]. The integration of established bioinformatics tools within a user-friendly web interface enables researchers to focus on biological interpretation rather than computational technicalities.
For the epigenetics and drug discovery communities, automated platforms like H3NGST offer the scalability needed for large-scale comparative studies across multiple cell types or experimental conditions [22] [27]. As single-cell epigenomic methods continue to develop, the principles of automated, accessible analysis embodied by H3NGST will become increasingly important for unraveling cellular heterogeneity in complex tissues and disease models [10] [27]. The platform's ability to deliver reproducible, high-resolution results positions it as a valuable resource for advancing our understanding of epigenetic mechanisms in development, disease, and therapeutic intervention.
Solving Common ChIP-seq Challenges: A Troubleshooting and Optimization Guide
Addressing Low Signal and Poor Peak Enrichment
A Chromatin Immunoprecipitation followed by sequencing (ChIP-seq) experiment provides a genome-wide snapshot of protein-DNA interactions, enabling researchers to understand fundamental gene regulatory mechanisms. However, a significant challenge faced by many researchers is obtaining sufficient signal-to-noise ratio and robust peak enrichment, particularly for histone modifications. Low signal and poor peak enrichment not only compromise data quality but can lead to erroneous biological conclusions if not properly addressed. This technical guide examines the root causes of these issues and presents a comprehensive framework for troubleshooting, spanning experimental optimization, computational quality control, and advanced analytical techniques. Within the broader context of a complete ChIP-seq workflow, addressing these enrichment challenges is paramount for generating publication-quality data that accurately reflects the underlying biology of histone modifications.
The fundamental issue stems from the nature of ChIP-seq itself, where "around 90% of all DNA fragments in a ChIP experiment represent the genomic background" [14]. Distinguishing true biological signal from this background requires careful optimization at every step. For histone modifications, which may exhibit broad enrichment domains rather than sharp peaks, this challenge is further compounded. This guide synthesizes current best practices from established consortia like ENCODE and recent methodological advances to provide researchers with a systematic approach to diagnosing and resolving enrichment issues.
Experimental Origins of Poor Enrichment
Many enrichment problems originate during sample preparation, where subtle variations in protocol execution can dramatically impact final outcomes. Understanding these experimental variables provides the foundation for effective troubleshooting.
Critical Experimental Parameters
Cell Number and Antibody Ratio: Consistency in the antibody-to-cell-number ratio is crucial for reproducible results. Recent findings from automated ChIP-seq systems indicate that "weaker genomic localization signals are sensitive to changing the antibody to cell-number ratio, whereas the stronger signals remain unaffected" [48]. This underscores the importance of maintaining consistent ratios across comparative studies, especially when investigating subtle changes in histone modification patterns in response to treatments or across genetic backgrounds.
Crosslinking and Chromatin Solubilization: For non-histone proteins or challenging histone marks, standard formaldehyde crosslinking may be insufficient. Double crosslinking with agents like disuccinimidyl glutarate (DSG) followed by formaldehyde "can form crosslinks of approximately 7.7 Ã…," enabling better capture of protein complexes and resulting in "high signal-to-noise ratios" [48]. Effective chromatin solubilization is equally critical, as it "directly influences the immunoprecipitation performance, sonication efficiency, and experiment reproducibility" [48]. Different lysis buffer formulations containing various detergents can significantly impact nuclear disruption and chromatin release while preserving protein-DNA interactions.
Enzyme-Based Alternatives: When traditional ChIP-seq consistently yields poor enrichment despite optimization, considering alternative methods like CUT&Tag may be beneficial. This approach "uses permeabilized nuclei to allow antibodies to bind chromatin-associated proteins, which enables the tethering of protein A-Tn5 transposase fusion protein (pA-Tn5)" and has been reported to provide "superior chromatin mapping capabilities as compared to ChIP-seq at approximately 200-fold reduced cellular input and 10-fold reduced sequencing depth requirements" [27]. However, thorough benchmarking against established ChIP-seq datasets is recommended, as one study found CUT&Tag recovers approximately 54% of known ENCODE peaks for histone modifications H3K27ac and H3K27me3 [27].
Antibody Validation and Selection
Antibody quality represents perhaps the most critical factor in successful ChIP-seq experiments. The ENCODE consortium has established rigorous standards for antibody characterization, requiring demonstration of specificity and efficiency through independent validation [8]. When troubleshooting poor enrichment, verifying antibody performance through:
- Western blot analysis to confirm recognition of the correct antigen
- Comparison with published datasets using the same antibody
- Peptide competition assays to demonstrate binding specificity
- Use of positive and negative control cell lines with known expression patterns
Systematic testing of multiple antibodies for the same target can reveal significant variations in performance. For H3K27ac CUT&Tag, different ChIP-grade antibodies showed varying enrichment efficiencies when benchmarked against ENCODE datasets [27]. Similar variations likely affect traditional ChIP-seq experiments, emphasizing the value of antibody screening when establishing new protocols.
Computational Assessment of Data Quality
Before proceeding with biological interpretation, rigorous quality assessment is essential to identify enrichment issues and guide appropriate analytical approaches.
Essential Quality Metrics
Computational quality control provides objective measures to evaluate enrichment success and identify potential technical issues. The ENCODE consortium has established standardized metrics and thresholds for ChIP-seq data quality assessment [8].
Table 1: Key Quality Control Metrics for ChIP-seq Data
| Metric | Description | Preferred Threshold | Interpretation |
|---|---|---|---|
| FRiP (Fraction of Reads in Peaks) | Proportion of all mapped reads falling into peak regions | >0.01 (TF), >0.01-0.02 (histone) [8] | Measures enrichment efficiency; low values indicate poor signal |
| NSC (Normalized Strand Cross-correlation) | Ratio of maximal cross-correlation to background cross-correlation | >1.05 [14] | Measures signal-to-noise ratio; higher values indicate stronger enrichment |
| RSC (Relative Strand Cross-correlation) | Ratio of fragment-length cross-correlation to read-length cross-correlation | >0.8 [14] [8] | Indicates library quality; values <0.5 suggest poor quality |
| NRF (Non-Redundant Fraction) | Fraction of unique mapping positions in the library | >0.9 [8] | Measures library complexity; low values indicate over-amplification |
| PBC (PCR Bottlenecking Coefficient) | Measures library complexity based on duplicate reads | PBC1 >0.9, PBC2 >3 [8] | Indicates amplification bias; low values suggest insufficient starting material |
Strand Cross-Correlation Analysis: This metric is particularly valuable for assessing enrichment as it "is based on the fact that a high-quality ChIP-seq experiment produces significant clustering of enriched DNA sequence tags at locations bound by the protein of interest" [14]. The cross-correlation profile typically produces two peaks: "a peak of enrichment corresponding to the predominant fragment length and a peak corresponding to the read length ('phantom' peak)" [14]. The ratio between these peaks (RSC) and their absolute values (NSC) provide quantitative measures of enrichment strength.
Library Complexity Metrics: Low library complexity, indicated by poor NRF and PBC scores, often stems from insufficient starting material or over-amplification during library preparation. This can artificially inflate apparent sequencing depth while providing little additional biological information. The ENCODE consortium recommends specific thresholds for these metrics, with NRF>0.9 and PBC1>0.9 representing high-quality libraries [8].
Quality-Centered Analytical Pipelines
Automated computational pipelines can streamline quality assessment and ensure consistent application of metrics. Platforms like H3NGST (Hybrid, High-throughput, and High-resolution NGS Toolkit) provide "fully automated ChIP-seq analysis from start to finish" by retrieving data from public repositories, performing quality control, adapter trimming, genome alignment, peak calling, and genomic annotation [44]. Such pipelines integrate multiple quality checks, including:
- Pre-alignment quality control with FastQC to assess read quality and adapter contamination
- Post-alignment metrics including mapping statistics and duplicate rates
- Enrollment-specific metrics like FRiP scores and strand cross-correlation
- Comparative analysis between replicates to assess reproducibility
For specialized applications like repeat element analysis, tools like RepEnTools address specific computational challenges by using "HISAT2, a graph aligner capable of handling SNPs and small InDels" and the complete T2T (telomere-to-telomere) human genome assembly "chm13v2.0," enabling more comprehensive analysis of repetitive genomic regions that are often problematic in standard ChIP-seq workflows [49].
Strategic Experimental Design for Optimal Enrichment
Beyond troubleshooting existing problems, proactive experimental design can prevent many enrichment issues before they occur.
Sequencing Depth and Replicate Strategy
Appropriate sequencing depth is critical for detecting enriched regions, particularly for broad histone marks. The ENCODE consortium provides target-specific standards based on extensive empirical testing [8].
Table 2: ENCODE Standards for ChIP-seq Experimental Design
| Target Type | Minimum Usable Fragments per Replicate | Recommended Sequencing Depth | Notes |
|---|---|---|---|
| Transcription Factors | 20 million [8] | 20-30 million reads [5] | Narrow peaks; lower depth may suffice for high-affinity factors |
| Narrow Histone Marks (H3K4me3, H3K27ac) | 20 million [8] | 40-60 million reads [5] | Sharp, punctate peaks near regulatory elements |
| Broad Histone Marks (H3K27me3, H3K36me3) | 45 million [8] | 40-60 million reads [5] | Broad domains requiring greater depth for full resolution |
| H3K9me3 | 45 million total mapped reads [8] | Higher depth often beneficial | Exception among broad marks due to enrichment in repetitive regions |
Biological Replicates: The ENCODE standards mandate "two or more biological replicates, isogenic or anisogenic" for rigorous interpretation [8]. Replicates are essential for distinguishing technical artifacts from biological variation and provide statistical power for reliable peak calling. For histone modifications, which can exhibit cell-to-cell heterogeneity, biological replicates are particularly crucial.
Control Experiments: Appropriate controls are fundamental for distinguishing specific enrichment from background. "Each ChIP-seq experiment should have a corresponding input control experiment with matching run type, read length, and replicate structure" [8]. Input DNA controls help account for technical biases introduced by chromatin fragmentation, sequencing, and mapping, enabling more accurate identification of truly enriched regions.
Advanced Normalization Strategies
For quantitative comparisons between conditions, traditional ChIP-seq approaches face limitations due to variability in cell counts, immunoprecipitation efficiency, and sequencing depth. Spike-in normalization strategies address these challenges by adding "well-defined cellular spike-in ratios of orthologous species' chromatin" to enable "highly quantitative comparisons of chromatin sequencing across experimental conditions" [50]. This approach, implemented in methods like PerCell, provides internal reference standards that account for technical variability, particularly important when comparing samples with global changes in histone modification levels.
Integrated Troubleshooting Workflow
Addressing low signal and poor peak enrichment requires a systematic approach that integrates both experimental and computational diagnostics.
Diagram 1: Integrated troubleshooting workflow for addressing ChIP-seq enrichment problems. This systematic approach combines computational quality assessment with experimental optimization to resolve common issues.
The workflow begins with parallel experimental and computational assessment to identify potential root causes. Key decision points include:
- If FRiP scores are low (<0.01): Focus on antibody validation and specificity testing
- If cross-correlation metrics are suboptimal (NSC<1.05, RSC<0.8): Evaluate chromatin preparation and fragmentation efficiency
- If library complexity is low (NRF<0.9): Increase input material and optimize amplification conditions
Systematic testing of individual parameters using automated platforms can accelerate optimization. The spa-ChIP-seq approach enables "systematic evaluation of multiple parameters including shearing and crosslinking conditions, buffer compositions, and the ratio of antibody to cell-number" in a high-throughput format [48]. This allows for empirical determination of optimal conditions for challenging targets.
Successful ChIP-seq experiments require careful selection of reagents and computational resources. The following toolkit summarizes key components for optimizing enrichment and signal quality.
Table 3: Research Reagent Solutions for ChIP-seq Optimization
| Reagent/Resource | Function | Considerations for Optimization |
|---|---|---|
| Validated Antibodies | Specific recognition of target epitope | Use ENCODE-validated antibodies when available; verify specificity through peptide competition or knockout validation |
| Crosslinking Agents | Stabilize protein-DNA interactions | Consider double crosslinking with DSG+FA for indirect binders; optimize concentration and duration |
| Chromatin Shearing | Fragment DNA to appropriate size | Sonication settings (intensity, duration, cycles) require empirical optimization for each cell type |
| Size Selection Kits | Remove extreme fragment sizes | Improve signal by selecting optimal fragment range (100-300bp for most applications) |
| Spike-in Chromatin | Normalization between samples | Use orthologous chromatin (e.g., Drosophila for human) for quantitative comparisons |
| Automated Platforms | Improve reproducibility | Systems like spa-ChIP-seq enable "scalable processing of 8 to 96 ChIP-seq samples" with consistent results [48] |
| Quality Control Tools | Assess data quality | Integrate tools for cross-correlation (phantompeakqualtools), library complexity (picard), and enrichment (FRiP) analysis |
This toolkit provides the foundation for robust ChIP-seq experiments. When selecting antibodies, prioritize those with established validation data in applications similar to your experimental context. For crosslinking optimization, balance between sufficient stabilization of interactions and over-crosslinking that can mask epitopes or reduce antibody accessibility. Automated platforms significantly enhance reproducibility, especially for large-scale studies, by minimizing manual processing variability.
Addressing low signal and poor peak enrichment in ChIP-seq requires a comprehensive approach spanning experimental and computational domains. By implementing systematic quality control metrics, optimizing critical experimental parameters, and employing appropriate normalization strategies, researchers can significantly improve data quality and biological interpretability. The framework presented here emphasizes proactive quality assessment throughout the experimental workflow, from initial design to final analysis, enabling early detection and correction of potential issues.
As chromatin profiling technologies continue to evolve, methods like CUT&Tag and automated ChIP-seq platforms offer promising alternatives for challenging applications. However, regardless of the specific methodology employed, the fundamental principles of rigorous validation, appropriate controls, and comprehensive quality assessment remain essential for generating scientifically valid results. By adopting these practices, researchers can overcome the challenge of poor enrichment and unlock the full potential of ChIP-seq for illuminating gene regulatory mechanisms in health and disease.
Reducing Background Noise and Improving Signal-to-Noise Ratio
In the context of a ChIP-seq workflow for histone modifications, achieving a high signal-to-noise ratio is paramount for generating biologically meaningful data. Background noise, stemming from non-specific antibody binding, inadequate chromatin fragmentation, and sequencing artifacts, can obscure true histone modification signals, leading to erroneous biological interpretations. This guide synthesizes current methodologies and standards to empower researchers in systematically minimizing noise, thereby enhancing the reliability and reproducibility of their epigenomic studies. The following sections provide a detailed, step-by-step framework covering experimental design, wet-lab techniques, and computational analysis to optimize every stage of the ChIP-seq pipeline.
Experimental Design and Quality Controls
A robust ChIP-seq experiment begins with a design that incorporates rigorous controls and quality checkpoints to mitigate noise at the source.
Biological Replicates and Controls: The ENCODE consortium mandates at least two biological replicates to ensure reproducibility and provide a basis for statistical validation of identified peaks [8]. Furthermore, every ChIP-seq experiment requires a matched input control—a sample of sheared chromatin that undergoes library preparation without immunoprecipitation [8]. This control accounts for background noise arising from sequencing biases and open chromatin structure, enabling its computational subtraction during analysis.
Quality Control Metrics: Key quantitative metrics must be assessed after sequencing to gauge library quality. Library complexity, measured by the Non-Redundant Fraction (NRF) and PCR Bottlenecking Coefficients (PBC1 and PBC2), indicates the proportion of unique DNA fragments in the library. Preferred values are NRF > 0.9, PBC1 > 0.9, and PBC2 > 10 [8]. The FRiP (Fraction of Reads in Peaks) score measures enrichment by calculating the proportion of reads that fall within called peak regions. The ENCODE project provides target-specific sequencing depth standards, recommending 20 million usable fragments per replicate for narrow histone marks (e.g., H3K4me3, H3K9ac) and 45 million for broad marks (e.g., H3K27me3, H3K36me3) [8].
Table 1: Key Quality Control Metrics and Standards for ChIP-seq
| Metric | Description | Preferred Value/Standard |
|---|---|---|
| Biological Replicates | Independent experiments to ensure reproducibility | Minimum of two [8] |
| Input Control | Control sample for background subtraction | Required; must match replicate structure [8] |
| NRF (Non-Redundant Fraction) | Measures library complexity | > 0.9 [8] |
| PBC1 & PBC2 | PCR Bottlenecking Coefficients | PBC1 > 0.9; PBC2 > 10 [8] |
| Sequencing Depth (Narrow Marks) | Usable fragments per replicate for marks like H3K4me3 | 20 million [8] |
| Sequencing Depth (Broad Marks) | Usable fragments per replicate for marks like H3K27me3 | 45 million [8] |
Wet-Lab Optimization Strategies
The initial and most critical phase of noise reduction occurs in the laboratory through optimized sample preparation and immunoprecipitation.
Crosslinking and Chromatin Preparation
Standard ChIP-seq uses a single formaldehyde (FA) crosslink, but this can be insufficient for capturing complex or indirect protein-DNA interactions. Double-crosslinking with disuccinimidyl glutarate (DSG), a longer-range crosslinker, prior to FA treatment, stabilizes these interactions and significantly improves the signal-to-noise ratio for challenging chromatin targets [23] [48] [51]. DSG can form crosslinks of approximately 7.7 Ã…, effectively capturing protein complexes that FA alone might miss [48].
Following crosslinking, chromatin must be sheared to an optimal size. Focused ultrasonication using modern sonication systems ensures uniform fragmentation, which is critical for resolution and background reduction. Inconsistent shearing can lead to uneven immunoprecipitation and increased noise. Automated platforms help standardize this process, enhancing reproducibility across samples [48].
Immunoprecipitation and Library Construction
The immunoprecipitation step is a major source of background noise from non-specific antibody binding. Using ChIP-grade antibodies that have been rigorously validated for specificity and efficacy is non-negotiable [8] [52]. Furthermore, maintaining a consistent and optimal antibody-to-cell-number ratio is crucial; a suboptimal ratio can lead to either inefficient enrichment or increased non-specific binding, directly impacting signal-to-noise [48]. Automated protocols like spa-ChIP-seq (single-pot automated ChIP-seq) help minimize human error and variability in these sensitive steps, leading to more consistent and reproducible results with a high signal-to-noise ratio [48].
Table 2: Key Research Reagent Solutions for Low-Noise ChIP-seq
| Reagent / Solution | Function | Considerations for Noise Reduction |
|---|---|---|
| Double-Crosslinkers (DSG + FA) | Stabilize protein-DNA and protein-protein interactions | Enhances detection of indirect binders; reduces loss of weak interactions [23] [48]. |
| ChIP-Grade Antibodies | Specific immunoprecipitation of target epitope | Must be validated per ENCODE standards to minimize off-target binding [8] [52]. |
| Protein A/G Magnetic Beads | Capture antibody-target complexes | High purity beads reduce non-specific sticking of chromatin [52]. |
| Lysis Buffers with Detergents | Solubilize crosslinked chromatin | Effective nuclear disruption balances complete lysis with preservation of interactions [48]. |
| Automated Platform (e.g., spa-ChIP-seq) | Standardizes liquid handling | Minimizes pipetting errors and cross-contamination; improves replicate consistency [48]. |
Computational Processing and Noise Filtering
After sequencing, computational methods are essential for distinguishing true biological signal from technical background noise.
Standardized Processing Pipelines: The ENCODE consortium provides a uniform processing pipeline specifically for histone ChIP-seq data [8]. This pipeline generates critical outputs, including nucleotide-resolution signal tracks that express enrichment as a fold-change over the control and a signal p-value to statistically reject the null hypothesis that a signal is present in the control [8]. For peak calling, the pipeline uses a strategy of relaxed thresholding followed by statistical comparison between biological replicates (or pseudoreplicates) to generate a final, high-confidence set of replicated peaks [8].
The Greenscreen Method: A significant source of artifactual peaks can be identified and removed using the greenscreen method. This user-friendly tool creates a species-specific filter by using control input samples to identify genomic regions that are consistently prone to generating artifactual signals, such as those with high amplifiability or specific sequence contexts [53]. Peaks that overlap with these "greenscreen" regions are subsequently filtered out, which has been shown to improve the detection of true positives, enhance replicate concordance, and facilitate more accurate biological comparisons [53].
Comparison of Profiling Methods
While optimizing standard ChIP-seq is vital, researchers should be aware of emerging techniques that offer inherent advantages in signal-to-noise ratio, especially for limited samples.
CUT&RUN and CUT&Tag are in situ chromatin profiling methods that have gained prominence as alternatives to ChIP-seq. Unlike ChIP-seq, which requires crosslinking, sonication, and elution, these techniques use antibody-targeted enzymatic cleavage (MNase for CUT&RUN; Tn5 transposase for CUT&Tag) to release specific protein-DNA fragments directly from intact nuclei. This fundamental difference results in a dramatically lower background [54] [55]. CUT&Tag, in particular, is noted for its extremely high signal-to-noise ratio and ability to produce usable data from as few as 10^3–10^4 cells [54]. A systematic benchmark study confirmed that while all three methods reliably detect histone modifications, CUT&Tag stands out for its higher signal-to-noise ratio and ability to identify novel binding sites, such as additional CTCF peaks [55].
Table 3: Comparative Analysis of Chromatin Profiling Techniques
| Method | Typical Cell Input | Key Principle | Signal-to-Noise Ratio | Best Suited For |
|---|---|---|---|---|
| ChIP-seq | 10^6 - 10^7 cells [54] | Crosslinking, sonication, IP | Relatively high background [54] | Gold-standard, wide target range, mature protocols [54] |
| CUT&RUN | 10^3 - 10^5 cells [54] | In-situ antibody-guided MNase cleavage | Very low [54] [55] | Low-input samples, transcription factors [54] |
| CUT&Tag | 10^3 - 10^4 cells [54] | In-situ antibody-guided tagmentation (Tn5) | Extremely low [54] [55] | Very low-input samples, histone modifications [54] |
Reducing background noise in ChIP-seq for histone modifications is an end-to-end endeavor requiring meticulous optimization at every stage. This guide has outlined a comprehensive strategy, from implementing double-crosslinking and rigorous antibody validation in the wet-lab to employing standardized computational pipelines and specialized noise-filtering tools like Greenscreen during analysis. Adherence to established quality metrics and a clear understanding of the trade-offs between traditional ChIP-seq and newer methods like CUT&Tag empower researchers to design robust, high-quality epigenomic studies. By systematically applying these principles, scientists can significantly enhance the signal-to-noise ratio in their data, leading to more precise and reliable biological insights into the histone code.
Optimizing Cross-Linking and Chromatin Shearing for Complex Tissues
Within the framework of a comprehensive ChIP-seq workflow for histone modification research, the initial steps of cross-linking and chromatin shearing are fundamentally critical, especially when working with complex solid tissues. Unlike homogeneous cell cultures, tissues present a unique physiological environment that preserves native cellular heterogeneity and spatial organization, providing unparalleled insights into gene regulatory mechanisms in health and disease [17]. However, this biological complexity introduces significant technical challenges. The dense extracellular matrix, varied cell types, and high nuclease activity in tissues can compromise chromatin integrity during preparation, leading to suboptimal fragmentation and high background noise in subsequent sequencing [17] [56]. This technical guide provides detailed methodologies and optimization strategies for cross-linking and chromatin shearing specifically tailored for complex tissues, enabling highly reproducible and sensitive chromatin profiling for epigenomic studies.
Tissue-Specific Challenges in Chromatin Preparation
Preparing high-quality chromatin from tissues requires overcoming several inherent obstacles. Tissue heterogeneity complicates standardized processing, as different cell types within the same sample may exhibit varying resistance to lysis and fragmentation [17]. The density of tissue matrices can physically impede chromatin extraction and shearing, often resulting in incomplete fragmentation or excessive chromatin degradation [17] [56]. Furthermore, solid tissues frequently contain abundant endogenous nucleases and proteases that become activated during processing, potentially degrading protein-DNA complexes before they can be stabilized [56]. These factors collectively contribute to common issues including low chromatin yield, variable fragment size distributions, poor immunoprecipitation efficiency, and ultimately, reduced signal-to-noise ratios in ChIP-seq data [17] [6]. Recognizing these challenges is essential for implementing the appropriate countermeasures detailed in the following protocols.
Optimized Cross-Linking Strategies for Complex Tissues
Standard Formaldehyde Cross-Linking
Formaldehyde remains the primary cross-linking agent for ChIP experiments, effectively stabilizing protein-DNA and protein-protein interactions by forming methylol derivatives that create covalent bridges between macromolecules in close proximity [56]. For tissue samples, cross-linking must be carefully optimized to balance sufficient stabilization against over-cross-linking, which can mask antibody epitopes and impede chromatin shearing [6] [56].
Protocol: Standard Formaldehyde Cross-Linking for Tissues
- Tissue Preparation: Begin with fresh or properly thawed frozen tissue on ice. Using two sterile scalpels or razor blades, mince the tissue into small fragments (1-3 mm³) in a Petri dish placed on an ice block or dry ice to maintain cold conditions [17] [56].
- Cross-Linking Solution: Prepare a 1.5% formaldehyde solution in PBS in a fume hood. Use approximately 10 mL of solution per gram of tissue [56].
- Cross-Linking Reaction: Transfer the minced tissue to a conical tube containing the formaldehyde solution. Rotate the tube at room temperature for precisely 15 minutes [56].
- Reaction Quenching: Add glycine to a final concentration of 0.125 M to quench the cross-linking reaction. Continue rotating for 5 minutes at room temperature [56].
- Washing: Centrifuge the tissue at 100 × g for 5 minutes at 4°C. Aspirate the supernatant and wash the tissue with 10 mL of ice-cold PBS. Repeat the centrifugation and aspirate the wash buffer [56].
Table 1: Optimization Parameters for Formaldehyde Cross-Linking in Different Tissues
| Tissue Type | Recommended Formaldehyde Concentration | Incubation Time | Key Considerations |
|---|---|---|---|
| Liver | 1.5% | 15 minutes | High metabolic activity; prone to degradation [57] [58] |
| Colorectal Tissue | 1.5% | 15 minutes | Heterogeneous cellularity; dense stroma [17] |
| Brain | 1.5% | 10-12 minutes | Lipid-rich; sensitive to over-cross-linking [56] |
| Adipose Tissue | 1-1.5% | 10 minutes | High lipid content; difficult to homogenize [56] |
Double-Crosslinking (dxChIP-seq) for Challenging Targets
For transcription factors or chromatin-associated proteins that do not directly bind DNA, a double-crosslinking approach significantly improves recovery by stabilizing both direct and indirect protein-DNA interactions [23]. This method utilizes a primary crosslinker with an extended spacer arm (such as DSG) followed by standard formaldehyde cross-linking.
Protocol: Double-Crosslinking for Enhanced Stabilization
- Primary Crosslinking: Prepare a 2 mM disuccinimidyl glutarate (DSG) solution in DMSO and dilute in PBS to a final concentration suitable for your tissue type. Incubate minced tissue with the DSG solution for 45 minutes at room temperature with rotation [23].
- Secondary Crosslinking: Without washing, add formaldehyde directly to the sample to a final concentration of 1% and incubate for an additional 10 minutes at room temperature [23].
- Quenching and Washing: Add glycine to a final concentration of 0.125 M to quench the reaction. Incubate for 5 minutes, then proceed with washing steps as described in the standard protocol [23].
Tissue Homogenization and Chromatin Extraction
Effective tissue dissociation is a prerequisite for successful chromatin shearing. The choice of homogenization method depends on tissue type, available equipment, and required throughput.
Protocol: Tissue Homogenization Methods
- Dounce Homogenization:
- Transfer minced tissue to a 7 mL Dounce homogenizer placed on ice [17].
- Add 1 mL of cold PBS supplemented with protease inhibitors [17].
- Shear the tissue with even strokes using pestle A (8-10 times) [17].
- Carefully avoid splashing or excessive speed to prevent warming and maintain chromatin integrity [17].
- Rinse the homogenizer with 2-3 mL of cold PBS and transfer the homogenate to a 50 mL conical tube [17].
GentleMACS Dissociator:
- Transfer minced tissue to a gentleMACS C-tube containing 1 mL of cold PBS with protease inhibitors [17].
- Tap the upside-down C-tube on the bench to ensure material contacts the blade [17].
- Run the preconfigured "htumor03.01" program [17].
- Add 2-3 mL of cold PBS to the C-tube and transfer the homogenate to a 50 mL conical tube [17].
Medimachine System:
Chromatin Shearing: Methods and Optimization
Chromatin shearing is arguably the most critical and challenging step in tissue ChIP-seq workflows. The goal is to generate mononucleosome-sized fragments (150-300 bp) while preserving protein-DNA interactions [6].
Sonication-Based Shearing
Covaris Adaptive Focused Acoustics (AFA) technology offers a controlled, isothermal method for chromatin fragmentation that minimizes sample degradation and maintains epitope integrity [59]. This approach is particularly beneficial for complex tissues as it standardizes shearing across different sample types.
Protocol: AFA-Based Sonication Shearing
- Cell Lysis: Resuspend the homogenized tissue pellet in FA lysis buffer (750 μL per 1×10ⷠcells) [56]. For Covaris protocols, use the truChIP Chromatin Shearing Tissue Kit optimized for 20-120 mg of tissue [59].
- Sonication Parameters: The following parameters are recommended for tissue samples:
- Peak Incident Power: 175 W
- Duty Factor: 20%
- Cycles per Burst: 200
- Treatment Time: 180-300 seconds (optimize for specific tissue) [59]
- Temperature Control: Maintain samples at 4°C throughout sonication using a cooled water bath or integrated cooling system [59].
- Shearing Validation: Analyze 100-200 ng of sheared chromatin by capillary electrophoresis (Bioanalyzer or TapeStation) to verify fragment size distribution [6].
Table 2: Optimized Shearing Conditions for Different Tissue Types
| Tissue Type | Recommended Method | Optimal Fragment Size | Processing Considerations |
|---|---|---|---|
| Liver | Focused ultrasonication [57] [59] | 200-500 bp | Dense parenchyma; requires extended sonication |
| Colorectal Cancer | Focused ultrasonication [17] | 150-300 bp | Heterogeneous cellularity; optimize for each sample |
| Brain | Focused ultrasonication or enzymatic [56] | 150-250 bp | Lipid-rich; may require additional cleaning steps |
| Fibrous Tissues | Extended sonication + enzymatic [56] | 200-400 bp | Tough matrices; combination approaches often needed |
Enzymatic Shearing with Micrococcal Nuclease (MNase)
MNase digestion offers an alternative shearing method that cleaves chromatin preferentially at nucleosome-linker regions, producing primarily mononucleosomal fragments.
Protocol: MNase Digestion for Tissue Chromatin
- Nuclear Preparation: Isolate nuclei from homogenized tissue using a sucrose density gradient (250 mM sucrose, 50 mM Tris-HCl pH 7.4, 5 mM MgClâ‚‚) [58].
- MNase Digestion: Resuspend nuclei in digestion buffer containing 1-5 units of MNase per μg DNA. Incubate at 37°C for 5-15 minutes with periodic mixing [6].
- Reaction Termination: Stop digestion by adding EGTA to a final concentration of 5 mM [6].
- Quality Assessment: Analyze digestion efficiency by capillary electrophoresis and adjust enzyme concentration or incubation time accordingly [6].
Quality Control and Troubleshooting
Rigorous quality control at each step is essential for successful tissue ChIP-seq experiments. The following checkpoints should be implemented:
Chromatin Integrity and Fragment Size: Analyze sheared chromatin using capillary electrophoresis (Bioanalyzer or TapeStation) to confirm the presence of mononucleosome-sized fragments (150-300 bp) with minimal debris or high-molecular-weight contamination [6]. The optimal size distribution should show a peak between 150-300 bp with a narrow size distribution [6] [59].
Chromatin Concentration: Quantify sheared chromatin using fluorometric methods (Qubit) for accurate DNA measurement [6]. For transcription factor ChIP, aim for 30 μg of DNA per immunoprecipitation reaction, while histone modifications may require less input material [58].
Troubleshooting Common Issues:
- Large Fragment Size: Increase sonication time or power; optimize MNase concentration; verify cross-linking duration [6] [59].
- Over-fragmentation: Reduce sonication time or power; decrease MNase incubation time [6].
- Low Yield: Increase starting material; verify homogenization efficiency; check protease inhibition [17] [56].
- High Background: Optimize wash stringency; include additional control IgG; verify antibody specificity [6].
The Scientist's Toolkit: Essential Research Reagents
Table 3: Key Reagents for Tissue Cross-Linking and Chromatin Shearing
| Reagent/Category | Specific Examples | Function & Application Notes |
|---|---|---|
| Cross-linking Agents | Formaldehyde (1.5%), DSG (2 mM) [23] [56] | Stabilize protein-DNA interactions; dual-crosslinking enhances indirect binding capture [23] |
| Protease Inhibitors | PMSF (100 μM), Aprotinin (1 μL/mL), Leupeptin (1 μL/mL) [56] | Prevent protein degradation during tissue processing; essential for nuclease-rich tissues |
| Homogenization Systems | Dounce homogenizer, gentleMACS Dissociator, Medimachine [17] [56] | Tissue dissociation; method selection depends on tissue toughness and throughput needs |
| Shearing Platforms | Covaris AFA-focused ultrasonicator, Bioruptor Pico sonicator [58] [59] | Chromatin fragmentation; AFA provides reproducible, isothermal shearing [59] |
| Shearing Kits | truChIP Chromatin Shearing Tissue Kit (Covaris) [59] | Optimized buffers for tissue chromatin shearing; improve reproducibility |
| Quality Control Tools | Agilent Bioanalyzer, TapeStation, Qubit fluorometer [6] | Fragment size analysis and quantification; critical for shearing optimization |
Workflow Visualization
The following diagram illustrates the complete optimized workflow for tissue processing, cross-linking, and chromatin shearing:
Workflow Overview: This diagram outlines the key decision points in tissue processing for ChIP-seq, highlighting optimized methods for cross-linking, homogenization, and chromatin shearing based on tissue type and experimental goals.
Optimizing cross-linking and chromatin shearing for complex tissues is an essential prerequisite for robust and reproducible ChIP-seq data. The protocols and strategies presented here address the unique challenges posed by tissue architecture, cellular heterogeneity, and macromolecular complexity. By implementing tissue-specific cross-linking conditions, appropriate homogenization methods, and controlled shearing parameters, researchers can overcome the technical barriers that often compromise chromatin preparation from solid tissues. These optimized approaches ensure the preservation of biologically relevant protein-DNA interactions while generating high-quality sequencing libraries that accurately reflect the in vivo chromatin landscape, ultimately supporting valid biological conclusions in histone modification research and epigenomic studies.
Chromatin Immunoprecipitation followed by sequencing (ChIP-seq) has become the method of choice for genome-wide mapping of histone modifications, transcription factor binding sites, and other protein-DNA interactions. For researchers investigating epigenetic mechanisms in drug development and basic research, ensuring data quality is paramount to generating biologically meaningful results. Quality control (QC) metrics serve as critical checkpoints throughout the ChIP-seq workflow, providing objective measures to assess data reliability and identify potential technical artifacts. Within a comprehensive ChIP-seq workflow for studying histone modifications, three metrics stand out as fundamental: the Fraction of Reads in Peaks (FRiP), library complexity, and replicate reproducibility. These metrics collectively inform researchers about enrichment efficiency, sequencing depth adequacy, and result reliability, forming a triad of quality assessments that support robust scientific conclusions in epigenetic research and therapeutic development.
Core Quality Control Metrics
Fraction of Reads in Peaks (FRiP)
The Fraction of Reads in Peaks (FRiP) is a fundamental metric that quantifies the signal-to-noise ratio in a ChIP-seq experiment. Calculated as the number of reads falling within significant peak regions divided by the total number of mapped reads, FRiP provides a direct measure of enrichment efficiency [60] [61]. A high FRiP score indicates that a substantial proportion of sequenced fragments represent genuine protein-DNA interactions rather than background noise, which is particularly crucial when studying histone modifications that may exhibit broad enrichment patterns across genomic domains.
FRiP score interpretation is context-dependent, varying significantly based on the target of interest. For transcription factors with punctate binding patterns, acceptable FRiP values may be lower than for histone marks with broad domains, as the latter naturally encompass a larger fraction of the genome [60] [39]. The ENCODE consortium has established FRiP as a standard quality metric, though it provides thresholds primarily for transcription factor experiments [39]. Researchers should note that FRiP scores positively correlate with the number of called regions, and comparing FRiP values is only valid when using identical peak-calling tools and parameters [61].
Table 1: Interpreting FRiP Scores for Different Targets
| ChIP Target Type | Typical FRiP Range | Interpretation Guidance |
|---|---|---|
| Transcription Factors | 1% - 5% | Lower but focused enrichment; indicates specific binding |
| Histone Marks (Sharp peaks - H3K4me3) | 10% - 30% | Strong promoter enrichment; expected higher background |
| Histone Marks (Broad domains - H3K27me3) | 15% - 40% | Widespread enrichment; covers large genomic regions |
| Low Enrichment Factors | < 1% | May indicate antibody or experimental issues |
Library Complexity
Library complexity measures the diversity of unique DNA fragments in a sequencing library, reflecting the efficiency of the immunoprecipitation and library preparation steps. Low-complexity libraries contain excessive PCR duplicates, where multiple reads represent the same original DNA fragment, thereby reducing effective sequencing depth and potentially introducing amplification biases [61] [62]. The ENCODE consortium recommends three primary metrics for assessing library complexity: Non-Redundant Fraction (NRF), PCR Bottlenecking Coefficient 1 (PBC1), and PCR Bottlenecking Coefficient 2 (PBC2) [39].
The PBC metrics are particularly informative for understanding duplication levels. PBC1 is calculated as the number of genomic locations with exactly one unique read divided by the number of genomic locations with at least one unique read. PBC2 is the number of genomic locations with exactly one unique read divided by the number of genomic locations with exactly two unique reads [39]. Preferred values for high-quality libraries are NRF > 0.9, PBC1 > 0.9, and PBC2 > 10, indicating minimal bottlenecking and high complexity [39]. Library complexity becomes increasingly crucial for low-input ChIP-seq protocols, where amplification bias can significantly impact data quality [63] [62].
Table 2: Library Complexity Metrics and Interpretation
| Metric | Calculation | Preferred Value | Quality Interpretation |
|---|---|---|---|
| Non-Redundant Fraction (NRF) | Unique mapped reads / Total mapped reads | > 0.9 | High complexity; minimal duplicates |
| PBC1 | Single-read locations / Distinct locations | > 0.9 | Minimal bottlenecking |
| PBC2 | Single-read locations / Two-read locations | > 10 | Low amplification bias |
| PBC1 < 0.5 | N/A | Unacceptable | Severe bottlenecking |
Replicate Reproducibility
Biological replication and reproducibility assessment form the foundation of robust ChIP-seq experimental design, particularly in drug development contexts where conclusions may inform therapeutic strategies. The Irreproducible Discovery Rate (IDR) framework has emerged as the gold standard for evaluating reproducibility between biological replicates in ChIP-seq experiments [64] [39]. Unlike simple overlap calculations, IDR is a statistical method that compares ranked lists of peaks from replicates and identifies those with consistent enrichment patterns, effectively separating reproducible signals from noise [64].
The IDR method operates on the principle that if two replicates measure the same underlying biology, the most significant peaks should show high consistency between replicates, while less significant peaks are more likely to represent noise [64]. The method outputs an IDR value for each peak, with lower values indicating higher reproducibility. The ENCODE consortium recommends using an IDR threshold of 0.05 (5%) to define reproducible peaks, meaning there's a 5% chance that a peak is an irreproducible discovery [64] [39]. For experiments without true biological replicates, the IDR framework can be applied to pseudoreplicates created by randomly splitting reads from a single sample, though this approach only accounts for technical variability rather than biological variation [39].
Reproducibility Assessment with IDR
Experimental Protocols for QC Assessment
Measuring FRiP Scores
Calculating FRiP scores requires two inputs: a filtered BAM file containing aligned reads and a BED file specifying genomic coordinates of significant peaks. The ENCODE pipeline provides standardized methods for this calculation, ensuring consistency across experiments [39]. The basic workflow involves counting reads that overlap with peak regions using tools like bedtools intersect, then dividing this count by the total number of mapped reads in the BAM file [60] [61]. For histone modification studies with broad domains, it's crucial to use peak callers appropriate for these patterns and to interpret FRiP scores in the context of the mark's expected genomic distribution.
When planning experiments, researchers should note that FRiP scores can guide decisions about sequencing depth. Samples with low FRiP scores may require deeper sequencing to capture sufficient signal for robust peak calling, particularly for histone marks with diffuse enrichment patterns. The ENCODE standards recommend a minimum of 20 million usable fragments per replicate for transcription factor ChIP-seq, with higher depths often necessary for complex histone modifications [39].
Assessing Library Complexity
Library complexity metrics are typically calculated from aligned BAM files after removing PCR duplicates using tools like Picard MarkDuplicates or samtools rmdup [7]. The Preseq package offers sophisticated projection of library complexity at higher sequencing depths, helping researchers determine whether additional sequencing would yield novel fragments or mainly duplicates [62]. This is particularly valuable for cost-effective experimental design, especially when working with precious clinical samples or rare cell populations.
Experimental factors significantly impact library complexity, including cross-linking efficiency, chromatin fragmentation, immunoprecipitation specificity, and the number of PCR amplification cycles [63] [62]. For low-input protocols, methods like Accel-NGS 2S and ThruPLEX have demonstrated superior complexity preservation in comparative studies [62]. Monitoring complexity metrics throughout the processing pipeline allows researchers to identify potential bottlenecks and optimize protocols for specific histone modifications and sample types.
Implementing IDR Analysis
The IDR pipeline requires biological replicates and begins with liberal peak calling using relaxed thresholds (e.g., MACS2 with p-value cutoff of 1e-3) to capture both signal and noise distributions [64]. Peaks are then sorted by significance (typically by -log10(p-value)), and the IDR algorithm is applied to compare the ranked lists. The standard implementation involves three main steps: evaluating consistency between true replicates, assessing pooled pseudoreplicates, and measuring self-consistency for each replicate [64].
To execute IDR analysis, researchers can use the following workflow after installing the IDR package:
The output includes a file with all peaks and their IDR values, with column 5 containing scaled IDR scores (higher scores indicate better reproducibility) [64]. Peaks with IDR < 0.05 are typically considered reproducible, corresponding to a scaled score of ≥540 [64]. For experiments without biological replicates, pseudoreplicates can be created by randomly splitting reads, though conclusions are necessarily limited to technical rather than biological reproducibility.
Research Reagent Solutions
Selecting appropriate reagents and kits is critical for achieving optimal QC metrics in histone modification ChIP-seq studies. Commercial library preparation kits perform differently depending on the specific histone mark being investigated, making targeted selection essential for success.
Table 3: Research Reagent Solutions for Histone Modification ChIP-seq
| Reagent/Kits | Specific Application | Performance Notes |
|---|---|---|
| NEB NEBNext Ultra II | Sharp histone marks (H3K4me3) | Consistently high performance across input levels [63] |
| Bioo NEXTflex | Broad histone marks (H3K27me3) | Superior for broad domains, though not optimal for very low DNA inputs [63] |
| Diagenode MicroPlex | Low-input protocols | Designed for limited starting material; ideal for rare cell populations [63] |
| Accel-NGS 2S | Low-input H3K4me3 studies | Highest unique read proportion in comparative studies [62] |
| ThruPLEX | Low-input applications | Second-best performance in sensitivity/specificity metrics [62] |
Integration in ChIP-seq Workflow
Quality control metrics should be evaluated at multiple stages throughout the ChIP-seq workflow rather than as a final assessment. The diagram below illustrates how FRiP, library complexity, and reproducibility metrics integrate into a comprehensive quality assurance framework for histone modification studies:
QC Metrics in ChIP-seq Workflow
This integrated approach enables researchers to identify potential issues early, make informed decisions about procedural adjustments, and allocate resources efficiently. For drug development applications, where consistency and reproducibility are paramount, establishing laboratory-specific benchmarks for these QC metrics based on initial validation experiments provides valuable reference points for assessing future experimental batches.
FRiP scores, library complexity metrics, and reproducibility assessments form an essential triad of quality control measures for robust ChIP-seq studies of histone modifications. When properly implemented and interpreted within the context of specific experimental goals and biological systems, these metrics provide objective standards for data quality assurance. For research scientists and drug development professionals, mastering these QC metrics enables not only technical validation of experimental results but also enhanced comparability across studies and datasets, ultimately supporting more reliable biological conclusions and accelerating epigenetic drug discovery.
Ensuring Data Rigor: Validation, Standards, and Emerging Techniques
The Encyclopedia of DNA Elements (ENCODE) Consortium has established comprehensive guidelines and quality control metrics for chromatin immunoprecipitation followed by sequencing (ChIP-seq), creating gold standards that enable rigorous benchmarking of histone modification studies. These standards provide a framework for experimental design, data processing, and quality assessment that ensures the production of high-quality, reproducible data across laboratories and platforms. For researchers investigating histone modifications, adherence to ENCODE guidelines is critical for generating biologically meaningful results that can be compared with public datasets and relied upon in downstream analyses. The consortium has developed specialized analysis pipelines for different classes of protein-chromatin interactions, with the histone ChIP-seq pipeline specifically designed to resolve both punctate binding and longer chromatin domains typical of histone marks [8] [65]. This technical guide outlines the current ENCODE standards and quality metrics specifically applied to histone ChIP-seq, providing researchers with a comprehensive framework for experimental design and quality assessment.
Experimental Design and Sequencing Standards
Fundamental Experimental Requirements
ENCODE standards mandate specific experimental design considerations that form the foundation of quality histone ChIP-seq data. These requirements address key aspects of experimental reproducibility and technical validity:
Biological Replicates: Experiments must include two or more biological replicates (isogenic or anisogenic), with limited exemptions for samples with material limitations (e.g., EN-TEx samples) [8] [65].
Antibody Validation: Antibodies must be rigorously characterized according to ENCODE standards, with specific guidelines for histone modifications established in October 2016 [8] [65]. Characterization includes both primary and secondary validation methods to ensure specificity and minimize cross-reactivity.
Control Experiments: Each ChIP-seq experiment requires a corresponding input control experiment with matching run type, read length, and replicate structure [8] [66] [65]. This controls for technical artifacts and sequencing biases.
Library Complexity: Library quality is assessed using the Non-Redundant Fraction (NRF) and PCR Bottlenecking Coefficients (PBC1 and PBC2). Preferred values are NRF > 0.9, PBC1 > 0.9, and PBC2 > 10 [8] [65].
Sequencing Depth Specifications
ENCODE provides specific sequencing depth requirements based on the type of histone mark being investigated, with differentiated standards for narrow and broad peaks:
Table 1: ENCODE Sequencing Depth Standards for Histone ChIP-seq
| Histone Mark Type | Minimum Usable Fragments per Replicate | Recommended Fragments per Replicate | Examples |
|---|---|---|---|
| Narrow Marks | 20 million | >20 million | H3K27ac, H3K4me3, H3K9ac [8] [65] |
| Broad Marks | 45 million | >45 million | H3K27me3, H3K36me3, H3K9me2 [8] [65] |
| Exception (H3K9me3) | 45 million | >45 million | Special case due to enrichment in repetitive regions [8] [65] |
These requirements have evolved from earlier ENCODE2 standards, which specified 10 million fragments for narrow marks and 20 million for broad marks, reflecting the increased understanding of sequencing depth requirements for robust peak detection [8] [65].
Technical Sequencing Parameters
ENCODE standards also address technical aspects of sequencing that impact data quality:
Read Length: Minimum read length of 50 base pairs, though longer reads are encouraged. The pipeline can process read lengths as low as 25 base pairs [8] [65].
Sequencing Platform: The platform must be documented, and replicates should match in terms of read length and run type. Different platforms (e.g., HiSeq2000 vs. HiSeq4000) are not considered comparable [65].
Genome Assembly: Pipeline files are mapped to either the GRCh38 (human) or mm10 (mouse) reference sequences [8] [65].
Quality Control Metrics and Interpretation
Library Complexity Assessment
Library complexity measures the diversity of unique DNA fragments in a sequencing library and is critical for evaluating PCR over-amplification and the effectiveness of the immunoprecipitation:
Non-Redundant Fraction (NRF): Calculated as the ratio of unique mapped reads to total mapped reads. An NRF > 0.9 indicates high complexity, while values below 0.8 suggest potential over-amplification [8] [65] [7].
PCR Bottlenecking Coefficients (PBC): PBC1 measures the fraction of genomic locations with exactly one unique read versus those with at least one. PBC2 measures the fraction of locations with exactly one unique read versus those with at least two. Preferred values are PBC1 > 0.9 and PBC2 > 10 [8] [65].
Enrichment and Signal-to-Noise Metrics
Fraction of Reads in Peaks (FRiP): The proportion of all mapped reads that fall within peak regions relative to the total read count. FRiP scores provide a measure of enrichment efficiency and signal-to-noise ratio. Higher FRiP scores (typically >1%) indicate successful immunoprecipitation [35] [65].
Strand Cross-Correlation: This metric evaluates the periodicity of sequencing tags on forward and reverse strands, which should peak at a distance corresponding to the average fragment length. High cross-correlation values indicate strong enrichment and good library quality [14] [67].
Replicate Concordance
- Irreproducible Discovery Rate (IDR): ENCODE uses IDR analysis to assess reproducibility between replicates. Processed IDR-thresholded peaks files should have both rescue ratio and self-consistency ratio values < 2, though having only one of the ratio values < 2 is acceptable [65].
The following workflow diagram illustrates the comprehensive quality assessment process for histone ChIP-seq data:
Benchmarking Against ENCODE Data
Performance Comparison with Reference Datasets
ENCODE provides extensive reference datasets that enable direct benchmarking of experimental results against gold standards. Recent methodologies like CUT&Tag have been systematically evaluated against ENCODE ChIP-seq profiles, with studies showing an average recall of 54% of known ENCODE peaks for histone modifications including H3K27ac and H3K27me3 in K562 cells [27]. This benchmarking approach ensures that new methodologies maintain compatibility with existing data while potentially offering improvements in sensitivity or efficiency.
Differential Analysis Considerations
For comparative ChIP-seq studies investigating differences between biological conditions, tool selection significantly impacts results. Performance varies based on peak characteristics and biological context:
Transcription Factor vs. Histone Marks: Tools optimized for transcription factors (punctate peaks) may perform poorly with broad histone marks and vice versa [15].
Biological Scenarios: Performance differs between scenarios with balanced changes (50:50 ratio of increasing/decreasing peaks) versus global changes (100:0 ratio) as seen in knockout studies [15].
Peak Caller Selection: MACS2, SICER2, and JAMM provide different strengths for detecting various peak shapes from multiple replicates [15].
Table 2: Recommended Analysis Tools for Histone Modifications
| Analysis Type | Recommended Tools | Key Considerations |
|---|---|---|
| Differential Analysis (Broad Marks) | bdgdiff, MEDIPS, PePr | Performance depends on regulation scenario [15] |
| Peak Calling (Sharp Marks) | MACS2 | Default for punctate signals [27] [7] |
| Peak Calling (Broad Marks) | SICER2, SEACR | Better for diffuse domains [15] |
| Quality Assessment | phantompeakqualtools, CHANCE | Strand cross-correlation analysis [14] [67] |
The Scientist's Toolkit: Essential Research Reagents and Materials
Table 3: Essential Research Reagents and Solutions for Histone ChIP-seq
| Reagent/Solution | Function | Specifications |
|---|---|---|
| Validated Antibodies | Target-specific immunoprecipitation | Must meet ENCODE characterization standards; lot-specific validation required [8] [66] |
| Formaldehyde | DNA-protein cross-linking | Typically 1% final concentration; cross-linking time optimization needed [66] |
| Protein A/G Magnetic Beads | Antibody complex capture | Efficient retrieval of antibody-target complexes [27] |
| Sonication Reagents | Chromatin shearing | Target fragment size 100-300 bp; optimized for cell type [66] |
| Library Preparation Kits | Sequencing library construction | Compatible with low-input protocols if needed [27] |
| HDAC Inhibitors | Preservation of acetyl marks | Optional for stabilizing dynamic modifications (e.g., H3K27ac) [27] |
| Size Selection Beads | Fragment size selection | Critical for removing primer dimers and optimizing insert size [7] |
Analysis Workflow and Data Processing
The ENCODE histone ChIP-seq pipeline involves standardized processing steps that ensure consistency across datasets. The following diagram illustrates the complete workflow from experimental design to downstream analysis:
Pipeline Specifications
The ENCODE histone pipeline generates standardized outputs that facilitate data sharing and comparative analysis:
Coverage Tracks: bigWig files containing fold-change over control and signal p-value tracks [8] [65].
Peak Calls: BED and bigBed (narrowPeak) files containing relaxed peak calls for individual replicates and pooled replicates [8] [65].
Replicated Peaks: For experiments with replicates, consensus peaks identified through overlap analysis or IDR thresholding [8] [65].
Quality Metrics: Comprehensive reports including library complexity, read depth, FRiP scores, and reproducibility measures [8] [65].
The ENCODE guidelines and QC metrics provide an essential framework for generating high-quality, reproducible histone ChIP-seq data. As technologies evolve, with emerging methods like CUT&Tag offering potential advantages in sensitivity and input requirements, maintaining alignment with established standards ensures data compatibility and biological relevance. The systematic benchmarking approaches outlined in this guide enable researchers to validate their methodologies against gold standards while advancing the field through methodological improvements. By adhering to these comprehensive standards, researchers can produce histone modification data that robustly supports downstream functional analyses and integrative genomic studies, ultimately accelerating discoveries in epigenetics and gene regulation.
The genome-wide mapping of protein-DNA interactions is a cornerstone of modern epigenetics and gene regulation research. For decades, Chromatin Immunoprecipitation followed by sequencing (ChIP-seq) has been the established methodology for identifying binding sites of transcription factors and histone modifications across the genome. However, recent technological advances have introduced powerful alternatives that address many limitations of traditional ChIP-seq. Cleavage Under Targets and Release Using Nuclease (CUT&RUN) and Cleavage Under Targets and Tagmentation (CUT&Tag) represent transformative approaches that offer significant improvements in sensitivity, resolution, and efficiency [68] [69]. These techniques have rapidly gained adoption in both basic research and drug development contexts, particularly for studying histone modifications that define cellular states and disease mechanisms.
Understanding the comparative advantages, limitations, and appropriate applications of each method is crucial for researchers designing epigenomic studies. This technical guide provides an in-depth analysis of ChIP-seq, CUT&RUN, and CUT&Tag methodologies, with particular emphasis on their application for mapping histone modifications. We examine the fundamental principles underlying each technology, provide detailed experimental protocols, and offer practical guidance for technology selection based on specific research requirements. For researchers working within the framework of ChIP-seq workflows for histone modification analysis, this comparison illuminates how newer methods can enhance or replace traditional approaches to overcome sample limitation challenges, reduce background noise, and streamline experimental timelines while generating high-quality genome-wide binding profiles.
Fundamental Principles and Methodologies
ChIP-seq: The Established Standard
Chromatin Immunoprecipitation followed by sequencing (ChIP-seq) begins with cross-linking proteins to DNA in living cells using formaldehyde, which stabilizes the protein-DNA interactions. Cells are then lysed, and chromatin is fragmented by sonication to generate DNA fragments typically ranging from 200-600 base pairs. An antibody specific to the target protein or histone modification is used to immunoprecipitate the protein-DNA complexes, which are then enriched using Protein A/G magnetic beads. After reversing the cross-links, the purified DNA fragments are processed for next-generation sequencing through library preparation steps that include end repair, adapter ligation, and PCR amplification [69] [7]. The sequenced fragments are mapped to a reference genome to identify enriched regions representing protein-binding sites or histone modifications.
The key advantages of ChIP-seq include its maturity as a technology, with well-established protocols and extensive published data for comparison. However, it suffers from several significant limitations: it requires millions of cells, involves multiple technically challenging steps that introduce variability, takes approximately one week to complete, generates high background noise, and demands substantial sequencing depth (typically 20-40 million reads per library) [68]. The technique's reliance on cross-linking and sonication contributes to its inherent noise and variability, while the large cell number requirements prevent application to rare cell types or precious clinical samples.
CUT&RUN: A Targeted Enzymatic Approach
CUT&RUN (Cleavage Under Targets and Release Using Nuclease) represents a fundamental departure from ChIP-seq methodology. This technique utilizes a target-specific antibody and micrococcal nuclease fused to Protein A/G (pA-MNase) to cleave DNA near protein-binding sites inside intact nuclei. The workflow begins with immobilization of unfixed cells or nuclei onto magnetic beads, followed by incubation with a primary antibody targeting the protein of interest. The pA-MNase enzyme is then added, binding to the antibody via the Protein A domain. Upon activation with calcium ions (Ca²âº), MNase cleaves the DNA surrounding the antibody-bound targets, releasing specific protein-DNA fragments into the solution [68] [69].
This targeted cleavage approach eliminates several problematic steps of ChIP-seq, including cross-linking, chromatin fragmentation, and immunoprecipitation. As a result, CUT&RUN requires far fewer cells (as few as 1,000-5,000 cells), can be completed in 1-2 days, generates exceptionally low background noise, and requires minimal sequencing depth (only 3-8 million reads) for high-quality profiles [68]. The technique works well for diverse targets including histone post-translational modifications, transcription factors, and chromatin-associated proteins, making it suitable as an "all-purpose" chromatin mapping assay.
CUT&Tag: In Situ Tagmentation Technology
CUT&Tag (Cleavage Under Targets & Tagmentation) builds upon the principles of CUT&RUN but employs a different enzymatic strategy. This method uses a primary antibody to target the protein of interest, followed by a secondary antibody to amplify signal strength. The key innovation is the use of a protein A-Tn5 transposase fusion (pA-Tn5) preloaded with sequencing adapters. When magnesium ions (Mg²âº) are added, the tethered Tn5 transposase simultaneously cleaves DNA and inserts sequencing adapters at the antibody-bound sites [70] [69].
This approach enables a dramatically streamlined workflow where much of the library preparation occurs in situ. Unlike CUT&RUN, which requires separate end repair and adapter ligation steps after DNA purification, CUT&Tag skips these processes entirely, allowing researchers to proceed directly to PCR amplification of the tagmented DNA [70]. The protocol can be completed in 1-2 days with extremely low cell input requirements (as few as 100,000 cells, with single-cell applications possible). However, the high-salt conditions used in CUT&Tag may interfere with some transcription factor-DNA interactions, making it particularly well-suited for histone modifications while being less reliable for certain chromatin-associated proteins [70].
Table 1: Comparative Overview of Chromatin Profiling Technologies
| Feature | ChIP-seq | CUT&RUN | CUT&Tag |
|---|---|---|---|
| Starting Cell Requirements | Millions of cells [68] | 1,000-100,000 cells [68] [69] | As few as 100,000 cells (single-cell possible) [70] |
| Protocol Duration | ~7 days [68] [69] | 1-2 days [68] [69] | 1-2 days [70] |
| Key Steps | Cross-linking, sonication, IP, library prep [69] | In situ antibody binding, MNase cleavage [69] | In situ antibody binding, Tn5 tagmentation [70] |
| Background Noise | High [68] | Very low [68] | Extremely low [69] |
| Sequencing Depth | 20-40 million reads [68] | 3-8 million reads [68] | ~2 million reads [70] |
| Compatibility with Histones | Excellent [69] | Excellent [68] | Excellent [70] |
| Compatibility with Transcription Factors | Good [69] | Good [68] | Variable/Depends on target [70] |
| Single-cell Compatibility | No | Limited | Yes [70] |
Technical Comparison and Performance Metrics
Resolution, Sensitivity, and Data Quality
The resolution and sensitivity of chromatin profiling technologies significantly impact their ability to precisely map histone modifications and protein-DNA interactions. Traditional ChIP-seq typically achieves resolution in the range of tens to hundreds of base pairs, limited by the size distribution of sonicated chromatin fragments [69]. In contrast, both CUT&RUN and CUT&Tag offer substantially higher resolution, with CUT&RUN achieving precise MNase cleavage down to single-digit base pair resolution and CUT&Tag providing similarly high resolution through targeted Tn5 insertion [69]. This enhanced resolution enables more precise mapping of histone modification boundaries and transcription factor binding sites.
Regarding sensitivity, ChIP-seq requires substantial sequencing depth (20-40 million reads for transcription factors, 40-60 million for broad histone marks like H3K27me3) to distinguish signal from background noise [68] [5]. CUT&RUN dramatically reduces this requirement to just 3-8 million reads, while CUT&Tag requires only approximately 2 million high-quality reads thanks to its extremely low background [68] [70]. This reduction in sequencing requirements translates to significant cost savings and enables higher multiplexing of samples. The exceptional signal-to-noise ratio of CUT&Tag stems from the fact that sequencing adapters are inserted directly at target sites, minimizing background sequences [69].
Data quality comparisons consistently show that CUT&RUN and CUT&Tag generate profiles with much lower background and higher reproducibility compared to ChIP-seq [68]. For histone modification mapping, all three techniques can generate high-quality data, but the newer methods achieve this with far fewer cells and less sequencing. Importantly, despite protocol differences, the raw sequencing data from these methods are similar and can be processed using the same bioinformatic tools, facilitating comparison with existing ChIP-seq datasets [68].
Practical Implementation Considerations
From a practical standpoint, researchers must consider multiple factors when selecting a chromatin profiling technology. ChIP-seq demands extensive optimization of cross-linking conditions, sonication parameters, and immunoprecipitation efficiency, requiring significant time and expertise [68]. CUT&RUN requires less optimization and is generally easier to implement, with EpiCypher noting it is "easier to learn and troubleshoot compared to CUT&Tag" [68]. CUT&Tag, while offering the most streamlined workflow, may require more technical expertise to achieve consistent results, particularly for low-abundance targets.
For researchers studying histone modifications, all three methods are compatible, but important distinctions exist. CUT&RUN demonstrates robust performance across diverse histone marks, including both sharp peaks (e.g., H3K4me3) and broad domains (e.g., H3K27me3) [68]. CUT&Tag also performs excellently for histone modifications but may be less stable than CUT&RUN for certain transcription factors or cofactors due to the high-salt conditions that can interfere with target protein-DNA interactions [70] [69]. ChIP-seq remains the most established method but suffers from higher background that can complicate detection of weaker histone modification signals.
Table 2: Performance Metrics for Histone Modification Studies
| Performance Metric | ChIP-seq | CUT&RUN | CUT&Tag |
|---|---|---|---|
| Resolution | Tens-hundreds of bp [69] | Single-digit bp [69] | Single-digit bp [69] |
| Recommended Sequencing Depth | 40-60M reads for histone marks [5] | 3-8M reads [68] | ~2M reads [70] |
| Signal-to-Noise Ratio | Moderate to low [68] | High [68] | Very high [69] |
| Broad Domain Detection (e.g., H3K27me3) | Good (with sufficient depth) [5] | Excellent [68] | Excellent [70] |
| Sharp Peak Detection (e.g., H3K4me3) | Good | Excellent [68] | Excellent [70] |
| Data Reproducibility | Variable, protocol-dependent | High [68] | High [70] |
| Protocol Optimization Requirements | Extensive | Moderate [68] | Higher, especially for new targets [68] |
Antibody Considerations and Controls
Antibody quality remains a critical factor across all chromatin profiling technologies, with EpiCypher reporting that "over 70% of antibodies to histone lysine methylation and acylation PTMs display unacceptable cross-reactivity and/or target efficiency" [68]. This includes highly cited antibodies for common marks like H3K4me3, H3K9me3, H3K27ac, and H3K27me3. Researchers should prioritize antibodies validated specifically for their chosen application, with vendors increasingly providing antibodies specifically validated for CUT&RUN and CUT&Tag [68] [70].
Control strategies differ significantly between traditional and newer methods. For ChIP-seq, the ENCODE Consortium recommends sequencing either whole cell extract (WCE, often called "input") or a mock ChIP reaction using non-specific IgG [71]. For histone modification studies, some researchers have explored using Histone H3 pull-down as a control to account for underlying nucleosome distribution, though studies show WCE and H3 controls have negligible impact on standard analysis quality [71]. For CUT&RUN and CUT&Tag, where input DNA is not applicable, negative control reactions using non-specific IgG antibodies serve as appropriate controls for monitoring background and nonspecific signal [68].
Peak calling for CUT&RUN and CUT&Tag can be performed using tools developed for ChIP-seq, such as MACS2, with specialized options like SEACR or CUT&RUNTools 2.0 also available [68]. The high signal-to-noise ratio of these newer methods simplifies peak calling compared to ChIP-seq, where distinguishing true signals from background remains challenging.
Experimental Design and Protocol Details
Sample Preparation and Quality Control
Successful chromatin profiling experiments begin with appropriate sample preparation. For ChIP-seq, cells are typically cross-linked with formaldehyde, quenched, and then either processed immediately or frozen for later use. Cell lysis is followed by chromatin shearing, which must be optimized for each cell type and sonicator to achieve fragment sizes of 200-600 bp [7]. For CUT&RUN and CUT&Tag, cells are harvested and permeabilized but not cross-linked, maintaining native chromatin structure. Nuclei are immobilized on concanavalin A-coated magnetic beads to facilitate reagent exchanges during the protocol [68] [70].
Quality control measures vary by technology. For ChIP-seq, assessing chromatin fragmentation size distribution following sonication is critical, typically using agarose gel electrophoresis or bioanalyzer traces. For CUT&RUN and CUT&Tag, cell viability and counting are particularly important due to the lower cell inputs. Additionally, antibody validation using known positive and negative control regions via qPCR (for CUT&RUN) or through comparison to existing datasets helps ensure reagent quality [70].
All three methods require careful titration of antibodies to achieve optimal signal-to-noise ratios. However, CUT&RUN and CUT&Tag are generally more robust to antibody concentration variations compared to ChIP-seq. For CUT&Tag specifically, the addition of a secondary antibody incubation step provides signal amplification that can enhance performance with suboptimal primary antibodies [70].
Library Preparation and Sequencing Considerations
Library preparation represents a major point of differentiation between these technologies. Traditional ChIP-seq requires standard Illumina library preparation involving end repair, A-tailing, adapter ligation, and PCR amplification - a process typically requiring 1-2 days [7]. CUT&RUN follows a similar library preparation workflow after DNA purification, though the higher molecular weight background DNA must be removed during size selection [68].
CUT&Tag features the most streamlined library preparation, as the Tn5 transposase simultaneously fragments DNA and inserts sequencing adapters in situ. This enables a "Direct-to-PCR" approach where purified DNA can be directly amplified with indexing primers, bypassing separate end repair and adapter ligation steps [70]. This streamlined process reduces hands-on time and cumulative time savings become particularly significant when processing multiple samples.
Sequencing configuration recommendations differ based on the technology and application. For most transcription factor ChIP-seq experiments, single-end sequencing at 20-30 million reads is adequate, while histone modifications, particularly broad marks like H3K27me3, benefit from paired-end sequencing at 40-60 million reads [5]. For CUT&RUN, single-end sequencing at 3-8 million reads typically suffices, while CUT&Tag requires only ~2 million reads due to its exceptional signal-to-noise ratio [68] [70]. For all methods, including appropriate controls (IgG for CUT&RUN/CUT&Tag, input for ChIP-seq) sequenced to similar depth as experimental samples is essential for accurate peak calling.
The Scientist's Toolkit: Essential Reagents and Materials
Table 3: Essential Research Reagents for Chromatin Profiling Technologies
| Reagent Category | Specific Examples | Function | Technology Compatibility |
|---|---|---|---|
| Enzymes | pA-MNase [68], pA-Tn5 [70] | Targeted chromatin cleavage/tagmentation | CUT&RUN (MNase), CUT&Tag (Tn5) |
| Magnetic Beads | Protein A/G beads [7], Concanavalin A beads [70] | Immobilization of cells/nuclei or antibody complexes | All (type varies by method) |
| Antibodies | Histone modification-specific antibodies [68] | Target recognition and enrichment | All |
| Library Prep Kits | CUT&Tag Dual Index Primers and PCR Master Mix [70] | Sequencing library preparation | Method-specific |
| Permeabilization Reagents | Digitonin [70] | Cell membrane permeabilization | CUT&RUN, CUT&Tag |
| Purification Systems | DNA Cleanup Columns [70] | DNA purification after cleavage/tagmentation | All |
| Control Reagents | Normal Rabbit IgG, Normal Mouse IgG [70] | Negative control for background assessment | All |
Applications and Technology Selection Guide
Recommended Applications for Each Technology
The selection of an appropriate chromatin profiling technology depends heavily on the specific research goals, sample availability, and target characteristics. ChIP-seq remains recommended for researchers requiring direct comparability with existing large datasets, such as those from ENCODE or related consortia, or when studying transient protein-DNA interactions that may require cross-linking stabilization [68]. Its maturity as a technology means established protocols and analysis pipelines are widely available, making it suitable for laboratories new to epigenomic profiling.
CUT&RUN serves as an excellent "all-purpose" chromatin mapping assay, particularly suitable for studies with limited sample material or when profiling multiple target classes [68]. It demonstrates robust performance for transcription factors, chromatin-associated proteins, and histone modifications across diverse cell types, including primary cells, FACS-sorted populations, and clinical samples [68]. The technique's balance of sensitivity, robustness, and relatively straightforward protocol makes it ideal for most epigenomic mapping experiments, especially when studying rare cell populations or precious samples where cell numbers are limiting.
CUT&Tag excels in applications requiring the lowest possible input or maximum throughput, with single-cell compatibility enabling unprecedented resolution of cellular heterogeneity [70]. It is particularly well-suited for high-resolution mapping of histone modifications in contexts where the high-salt conditions are unlikely to disrupt target interactions. The dramatically reduced sequencing requirements make CUT&Tag ideal for large-scale studies where sequencing costs are a significant consideration. However, researchers targeting certain transcription factors or cofactors should validate performance compared to CUT&RUN, as the method may be less stable for some targets [70] [69].
Integration with Broader Research Objectives
For researchers operating within a broader thesis on ChIP-seq workflows for histone modifications, understanding how these technologies complement each other is essential. While CUT&RUN and CUT&Tag can potentially replace ChIP-seq for many applications, there remains value in understanding all three approaches. Method selection should align with overall research objectives: foundational discovery projects with abundant sample may benefit from ChIP-seq's well-established nature, while translational studies with clinical samples typically require the sensitivity of CUT&RUN or CUT&Tag.
The evolution of these technologies reflects a broader trend in epigenomics toward methods that provide higher information content from smaller samples with reduced technical artifacts. As the field advances, the integration of chromatin mapping data with other genomic assays - including gene expression profiling, chromatin accessibility measurements, and 3D genome architecture - becomes increasingly important [72]. Regardless of the specific technology chosen, rigorous experimental design including appropriate controls, replicates, and antibody validation remains essential for generating biologically meaningful data that advances our understanding of gene regulatory mechanisms in health and disease.
Chromatin Immunoprecipitation followed by sequencing (ChIP-seq) has revolutionized our ability to study protein-DNA interactions and histone modifications on a genomic scale. However, traditional ChIP-seq methods face significant limitations in quantitative accuracy, as they are prone to experimental variation and do not enable direct quantitative comparisons between samples without implementing spike-in controls [24]. This quantitative shortfall is particularly problematic when investigating global epigenetic changes, such as those occurring during cellular differentiation, in disease states, or in response to pharmacological inhibitors.
MINUTE-ChIP (Multiplexed Quantitative Chromatin Immunoprecipitation Sequencing) addresses these limitations by enabling multiple samples to be profiled against multiple epitopes in a single workflow [24]. This advanced approach not only dramatically increases throughput—allowing profiling of 12 samples against multiple histone modifications or DNA-binding proteins in a single experiment—but also facilitates accurate quantitative comparisons across conditions [24] [73]. By embedding quantification directly into the experimental design, MINUTE-ChIP empowers researchers to perform statistically robust experiments with appropriate replicates and controls, delivering more biologically meaningful results in the study of histone modifications.
Fundamental Principles of MINUTE-ChIP Technology
Core Technological Innovations
MINUTE-ChIP builds upon traditional ChIP-seq methodology through several key innovations that transform it from a qualitative to a quantitative technique. The core advance lies in a sample barcoding strategy that allows multiple chromatin samples to be pooled before immunoprecipitation, thereby eliminating inter-experimental variability that plagues traditional parallel ChIP-seq experiments [24] [74].
The quantitative nature of MINUTE-ChIP stems from its ability to measure true differences in histone modification abundance by normalizing to input read counts within a defined scaling group [73]. In this system, a reference sample is normalized to 1x genome coverage, and all other samples' values become directly comparable to this reference and to each other [73]. This approach accurately reproduces true quantities from sequencing read counts, as validated by quantitative western blot against artificial gradients of histone modifications [74].
The Quantitative Advantage: A Sea Change in Interpretation
Traditional ChIP-seq normalization assumes a constant technical and biological background, making it "blind to global alterations in histone modification levels" [74]. This limitation can be understood through an analogy: comparing traditional ChIP to observing a volcanic peak from a boat on changing sea levels. As sea level rises, the apparent volcano height decreases, even if the actual peak remains unchanged. Without knowledge of the sea level change, the observer cannot distinguish between actual peak diminishment versus apparent diminishment due to rising background [74].
MINUTE-ChIP solves this problem by measuring both the "peak height" (specific enrichment) and "sea level" (global background) simultaneously through its quantitative scaling, providing a proportional measurement of true quantities that reflects biological reality rather than technical artifacts [74].
Table 1: Key Advantages of MINUTE-ChIP Over Traditional ChIP-seq
| Feature | Traditional ChIP-seq | MINUTE-ChIP |
|---|---|---|
| Throughput | Limited samples per experiment | Up to 12 samples multiplexed in single workflow [24] |
| Quantitative Accuracy | Relative comparisons only | Accurate quantitative comparisons over large linear range [75] |
| Experimental Variation | High between parallel experiments | Minimal due to pooled processing [24] |
| Background Assessment | Assumed constant | Directly measured and accounted for [74] |
| Dynamic Range | Limited | Large linear dynamic range for accurate quantification [75] |
MINUTE-ChIP Workflow: From Sample Preparation to Data Analysis
Figure 1: MINUTE-ChIP Experimental Workflow. The process involves sample preparation, barcoding, pooling, parallel immunoprecipitation, and quantitative data analysis [24] [73].
Sample Preparation and Barcoding
The MINUTE-ChIP protocol begins with standard chromatin preparation from either native or formaldehyde-fixed material, followed by chromatin fragmentation using either enzymatic digestion (MNase) or sonication [24] [76]. The critical innovation comes in the barcoding step, where individual chromatin samples are tagged with unique molecular barcodes before pooling [24] [73]. In the original implementation, barcoding is achieved through a 6nt UMI (Unique Molecular Identifier) followed by an 8nt sample barcode that identifies the sample of origin [73].
This barcoding strategy enables the precise demultiplexing of sequenced reads back to their original samples after sequencing, which is essential for accurate quantification and comparison across conditions. The use of UMIs also facilitates accurate deduplication of PCR artifacts, improving quantitative accuracy [73].
Pooling, Immunoprecipitation, and Sequencing
Once barcoded, all chromatin samples are pooled together and split into aliquots for parallel immunoprecipitation reactions with different antibodies targeting specific histone modifications or chromatin factors [24]. This pooling strategy ensures that each antibody is exposed to exactly the same mixture of barcoded chromatin samples, eliminating variability that would occur if immunoprecipitations were performed separately.
After immunoprecipitation, sequencing libraries are prepared from both input chromatin and immunoprecipitated DNA following standard protocols [24] [73]. The resulting libraries are then sequenced using standard next-generation sequencing platforms, with the barcode and UMI information incorporated into the read structure to enable downstream demultiplexing and quantification.
Data Analysis Pipeline and Quantitative Scaling
Primary Analysis Workflow
Figure 2: MINUTE-ChIP Data Analysis Pipeline. The dedicated analysis pipeline processes multiplexed FASTQ files into quantitatively scaled bigWig files [73].
The MINUTE-ChIP data analysis pipeline employs a dedicated bioinformatics workflow that processes multiplexed FASTQ files into quantitatively scaled bigWig files suitable for direct comparison across conditions [73]. The pipeline executes several critical steps:
- Demultiplexing: Reads are assigned to their original samples based on barcode sequences [73]
- Genome Mapping: Processed reads are aligned to a reference genome using Bowtie2 [73]
- Deduplication: UMIs are used to identify and remove PCR duplicates, improving quantitative accuracy [73]
- Region Filtering: Artifact-prone regions (e.g., repeats) are removed using BEDTools before scaling [73]
- Scaling Factor Calculation: Factors are computed based on mapped read counts and matching input conditions [73]
- Track Generation: Scaled bigWig files are created using deepTools, with the reference sample normalized to 1x genome coverage [73]
Configuration and Scaling Parameters
Successful MINUTE-ChIP analysis requires three key configuration files that define the experimental design and scaling approach [73]:
- libraries.tsv: Specifies how samples are demultiplexed, linking barcodes to sample identifiers
- groups.tsv: Defines scaling groups and specifies which input samples correspond to which IP samples
- minute.yaml: Contains reference genome information, UMI length, fragment size, and other processing parameters
The scaling approach implemented in MINUTE-ChIP generates tracks where the reference sample is normalized to 1x genome coverage, and all other samples' values are directly comparable to this reference and across themselves [73]. This enables true quantitative comparisons not possible with traditional ChIP-seq.
Research Reagent Solutions for MINUTE-ChIP
Table 2: Essential Research Reagents for MINUTE-ChIP Experiments
| Reagent/Category | Function in MINUTE-ChIP | Implementation Details |
|---|---|---|
| Chromatin Fragmentation | Fragment chromatin to appropriate size | MNase digestion or sonication; 150-1000bp fragments optimal [76] |
| Barcoding Oligos | Sample multiplexing | 6nt UMI + 8nt sample barcode ligated to chromatin fragments [73] |
| Antibodies | Target-specific immunoprecipitation | High-quality antibodies against histone modifications (H3K27me3, H3K4me3, etc.) [24] [75] |
| Library Prep Kit | Sequencing library construction | Standard NGS library prep with dual indexing [24] [73] |
| Reference Genomes | Read mapping and quantification | Species-specific reference (hg38, mm10) with artifact-prone region annotations [73] |
Applications in Biological Research and Drug Development
Characterizing Pluripotency Epigenomics
MINUTE-ChIP has demonstrated particular utility in characterizing the subtle epigenomic changes that define cellular states. A landmark application revealed global alterations in histone modification patterns that shape promoter bivalency in ground state embryonic stem cells (ESCs) [75]. Using MINUTE-ChIP to compare mouse ESCs grown in 2i versus serum conditions, researchers discovered compelling evidence for broad H3K27me3 hypermethylation across the genome in the naive pluripotent ground state, while bivalent promoters stably retained high H3K27me3 levels [75].
This study simultaneously revealed H3K4me3 hypomethylation at bivalent promoters as a characteristic of the 2i ground state, demonstrating MINUTE-ChIP's ability to quantify opposing changes in different histone modifications within the same biological system [75]. The quantitative precision of MINUTE-ChIP enabled the discovery that serum stimulates H3K4me3 independent of GSK-3β and ERK signaling, suggesting that low H3K4me3 and high H3K27me3 levels at bivalent promoters are products of two independent mechanisms that safeguard naive pluripotency [75].
Pharmacological Applications and Epigenetic Drug Discovery
The quantitative capabilities of MINUTE-ChIP make it particularly valuable for drug development, especially in the context of epigenetic therapies. The technology enables precise quantification of how epigenetic inhibitors alter global histone modification landscapes, providing crucial insights into their mechanisms of action and cellular responses [75] [77].
In practice, researchers have applied MINUTE-ChIP to quantify changes in hematopoietic stem cell chromatin landscapes and measure specific alterations in leukemia cells treated with epigenetic inhibitors [77]. The method's precision in quantifying global changes following EZH2 inhibition demonstrates its utility for evaluating the efficacy and specificity of epigenetic drugs [75] [73]. By enabling accurate measurement of histone modification changes in response to pharmacological perturbation, MINUTE-ChIP provides valuable data for pharmacodynamic assessment and dose optimization in epigenetic drug development.
Comparative Analysis with Alternative Quantitative Approaches
Table 3: Comparison of Quantitative ChIP-seq Methodologies
| Method | Quantification Principle | Throughput | Key Advantages | Limitations |
|---|---|---|---|---|
| MINUTE-ChIP | Sample multiplexing with barcoding before IP [24] | High (12 samples) | Eliminates inter-IP variability; true quantitative comparisons [24] [74] | Requires specialized barcoding; complex analysis pipeline [73] |
| siQ-ChIP | Physical quantitative scale from sequencing measurements [78] | Standard | No spike-ins required; absolute quantification scale [78] | Theoretical complexity; newer method with limited adoption |
| Spike-in ChIP | External chromatin references added before IP [24] | Low to moderate | Established methodology; compatible with existing protocols | Spike-in efficiency variability; additional reagents needed [24] |
| Mint-ChIP | Normalization to total histone H3 [77] | Moderate | Optimized for low-input samples; quantitative for histone modifications [77] | Limited to histone modifications; H3 normalization assumption |
Implementation Considerations and Best Practices
Experimental Design Guidelines
Successful implementation of MINUTE-ChIP requires careful experimental planning. Researchers should consider the following key aspects:
- Replication Strategy: While MINUTE-ChIP reduces technical variability, biological replicates remain essential for robust statistical conclusions [24]
- Scaling Group Design: Thoughtful grouping of samples in the groups.tsv file is critical for appropriate quantitative comparisons [73]
- Control Conditions: Including appropriate controls (e.g., EZH2 inhibitor treatment for H3K27me3 studies) provides essential baselines for interpretation [73]
- Antibody Validation: Antibody specificity remains paramount, as multiplexing cannot correct for poor antibody performance [24]
Technical Optimization Points
Several technical aspects require particular attention during MINUTE-ChIP implementation:
- Chromatin Quality: Optimal chromatin fragmentation and appropriate fragment size distribution (200-1000bp) are fundamental to success [76]
- Barcoding Efficiency: Ensuring efficient barcode ligation is essential for accurate demultiplexing and quantification [73]
- Sequencing Depth: Sufficient sequencing depth must be maintained across all multiplexed samples to ensure statistical power [24] [73]
- Reference Annotations: Comprehensive exclusion lists (e.g., ENCODE blacklist regions) are necessary for proper scaling and artifact removal [73]
The entire MINUTE-ChIP workflow, from sample preparation to data analysis, requires basic knowledge in molecular biology and bioinformatics and can typically be completed within one week [24]. While the method demands careful attention to technical details, the substantial benefits in quantitative accuracy and experimental throughput make it an invaluable approach for advanced epigenomic research investigating global changes in histone modifications.
Chromatin Immunoprecipitation followed by sequencing (ChIP-seq) has revolutionized epigenomic research by enabling genome-wide mapping of protein-DNA interactions and histone modifications. While peak calling identifies putative enriched regions, the subsequent interpretation phase transforms these computational predictions into meaningful biological insights. For researchers investigating histone modifications, this journey from peak calls to biological understanding involves specialized approaches that differ significantly from transcription factor binding analysis. Histone marks exhibit diverse genomic distributions—from sharp peaks of promoter-associated modifications like H3K4me3 to broad domains of repressive marks like H3K27me3—requiring tailored analytical strategies for each mark type [22] [66]. This technical guide outlines a systematic framework for interpreting ChIP-seq data within the context of histone modification studies, providing researchers with practical methodologies to extract biological meaning from peak files and advance our understanding of chromatin dynamics in development, disease, and drug discovery.
Peak Calling Methodologies for Histone Modifications
Strategic Selection of Peak Calling Algorithms
The initial critical step in ChIP-seq analysis involves selecting appropriate peak calling algorithms matched to the specific characteristics of your histone mark. Unlike transcription factors that typically produce narrow, focused peaks, histone modifications manifest in diverse patterns across the genome, necessitating mark-specific analytical approaches [66].
Benchmarking studies comparing peak callers for histone modifications reveal substantial variability in performance across tools. A recent comprehensive evaluation of four prominent peak calling tools—MACS2, SEACR, GoPeaks, and LanceOtron—demonstrated that each method exhibits distinct strengths in sensitivity, precision, and applicability depending on the specific histone mark being investigated [79]. This benchmarking utilized in-house data for three functionally distinct histone marks (H3K4me3, H3K27ac, and H3K27me3) from mouse brain tissue, supplemented with samples from the 4D Nucleome database, providing a robust assessment framework.
Table 1: Peak Caller Performance Characteristics for Histone Modifications
| Peak Caller | Optimal Histone Mark Type | Key Strengths | Considerations |
|---|---|---|---|
| MACS2 | Point-source marks (H3K4me3, H3K27ac) | High sensitivity for sharp peaks; widely used with extensive documentation | May fragment broad domains; requires parameter tuning for broad marks |
| SEACR | Broad domains (H3K27me3, H3K9me3) | Superior for extended enrichment regions; minimal parameterization | May oversimplify complex peak architectures |
| HOMER | Mixed profiles (point and broad source) | Integrated workflow with motif discovery and annotation | Less specialized for extremely broad domains |
| LanceOtron | Various marks via deep learning | Adaptive to different peak shapes; reduced manual parameterization | Computational intensity; newer method with less community validation |
For point-source factors and certain chromatin modifications including promoter-associated histone marks like H3K4me3 and enhancer-associated marks like H3K27ac, algorithms optimized for narrow peaks typically yield optimal results. In contrast, broad-source factors including repressive histone marks such as H3K27me3 and H3K9me3 require specialized peak callers capable of identifying extended enrichment domains [66]. A third category of mixed-source factors may exhibit both focused and broad binding patterns, necessitating flexible approaches [66].
Experimental Protocol: Peak Calling with HOMER
HOMER provides a comprehensive solution for histone modification analysis, integrating peak calling with downstream annotation and motif discovery. The following protocol outlines the standard workflow:
Input Requirements: Processed BAM files from aligned reads and corresponding input control BAM file.
Basic Command Structure:
Critical Parameters:
-style histone: Activates histone-specific peak calling mode-size: Region size for analysis (adjust based on mark)-i inputDirectory: Essential for normalization against background-broad: Enables broad domain detection for appropriate marks-FDR: Set false discovery rate threshold (default: 0.001)
Output Interpretation: Successful execution generates several output files including peak locations (.txt), genome browser-compatible tracks (.bed), and peak summit information. The resulting peaks represent genomic regions with statistically significant enrichment over background, ready for subsequent biological interpretation [22] [5].
Quality Assessment and Validation
Comprehensive Quality Metrics for Histone ChIP-seq
Rigorous quality assessment is fundamental before proceeding to biological interpretation, as the reliability of conclusions directly depends on data quality. The ENCODE consortium has established comprehensive guidelines for ChIP-seq quality evaluation, with specific considerations for histone modification studies [66].
Table 2: Essential Quality Metrics for Histone Modification ChIP-seq
| Quality Metric | Target Value | Assessment Method | Biological Significance |
|---|---|---|---|
| Sequencing Depth | 40-60 million reads | FastQC, alignment statistics | Sufficient coverage for genome-wide assessment |
| Strand Cross-Correlation | NSC ≥1.05, RSC ≥0.8 | phantompeakqualtools | Measures signal-to-noise ratio and enrichment |
| Fraction of Reads in Peaks (FRiP) | >1% (histone marks) | plotFingerprint (DeepTools) | Indicates enrichment efficiency |
| Library Complexity | >0.8 | preseq | Assesses potential PCR amplification bias |
| Peak Number Distribution | Consistent across replicates | IDR analysis | Evaluates reproducibility between replicates |
Strand Cross-Correlation analysis deserves particular emphasis for histone modification studies. This metric computes the Pearson's linear correlation between tag density on forward and reverse strands after shifting the reverse strand by k base pairs. High-quality ChIP-seq experiments produce significant clustering of enriched DNA sequence tags at locations marked by histone modifications, generating characteristic cross-correlation profiles with two peaks: a peak of enrichment corresponding to the predominant fragment length and a "phantom" peak corresponding to the read length [14]. The Normalized Strand Cross-correlation coefficient (NSC) and Relative Strand Cross-correlation (RSC) provide quantitative measures of signal-to-noise ratio, with higher values indicating stronger enrichment [14].
Advanced Quantitative Approaches
For studies requiring precise comparison of histone modification levels across experimental conditions, recent methodological advances enable highly quantitative assessments. Multiplexed quantitative chromatin immunoprecipitation-sequencing (MINUTE-ChIP) allows multiple samples to be profiled against multiple epitopes in a single workflow, dramatically increasing throughput while enabling accurate quantitative comparisons [24]. This approach eliminates experimental variation between samples through barcoding and pooling strategies prior to immunoprecipitation.
Similarly, PerCell chromatin sequencing integrates cell-based chromatin spike-ins with a flexible bioinformatic pipeline to facilitate highly quantitative comparisons across experimental conditions and cellular contexts [50]. This methodology uses well-defined cellular spike-in ratios of orthologous species' chromatin, enabling cross-species comparative epigenomics and promoting uniformity of data analyses across laboratories.
Genomic Annotation and Contextualization
Strategic Annotation of Peak Regions
Once high-confidence peaks are identified and validated, the crucial process of biological contextualization begins. Genomic annotation establishes the potential functional relationships between histone modifications and genomic elements, forming the bridge between enrichment regions and biological meaning.
Comprehensive Annotation Workflow:
- Promoter-Proximal Annotation: Identify peaks within promoter regions (typically ±3 kb from transcription start sites)
- Gene Body Mapping: Associate peaks with exonic, intronic, and intergenic regions
- Enhancer Identification: Correlate H3K27ac marks with known enhancer databases
- Chromatin State Integration: Incorporate chromatin segmentation data (e.g., from ChromHMM/Segway)
- Evolutionary Conservation: Assess sequence conservation in peak regions
H3NGST, a fully automated web-based platform for ChIP-seq analysis, exemplifies this approach by systematically categorizing peaks by genomic region and providing genomic annotation alongside motif discovery [22]. The platform streamlines the entire analysis workflow, including raw data retrieval via BioProject ID, quality control, adapter trimming, reference genome alignment, peak calling, and genomic annotation, with specific attention to promoter regions [22].
Experimental Protocol: Functional Annotation with HOMER
HOMER's annotatePeaks.pl utility provides a powerful solution for connecting peak locations to genomic contexts:
Basic Command Structure:
Advanced Annotation Options:
Output Interpretation: The annotation report provides comprehensive information including genomic coordinates, nearest genes, distance to transcription start sites (TSS), genomic region classification (promoter, exon, intron, intergenic), and conservation metrics. This structured output enables researchers to quickly assess the genomic distribution of their histone modifications and prioritize regions for further investigation [22] [5].
Functional Enrichment and Pathway Analysis
From Genomic Location to Biological Meaning
Functional enrichment analysis transforms annotated peak lists into biological insights by identifying statistically overrepresented pathways, biological processes, and molecular functions associated with the marked genes. This step contextualizes histone modifications within established biological knowledge frameworks.
Integrated Analysis Workflow:
- Gene Set Generation: Compile genes associated with peaks based on genomic annotation
- Background Definition: Establish appropriate background gene set for statistical comparison
- Enrichment Calculation: Perform statistical tests for overrepresentation across multiple databases
- Multi-dimensional Integration: Correlate histone modification patterns with complementary data types
Advanced platforms like ROSALIND exemplify this approach by providing interactive environments for exploring relationships between genes and pathways, enabling researchers to identify significant pathways sorted by statistical significance and review the number of genes in each term [80]. These platforms facilitate deep interpretation of top pathways, gene ontology, diseases, and drug interactions through rich interactive visualizations.
Experimental Protocol: Pathway Enrichment Analysis
Database Selection Strategy:
- Gene Ontology (GO): Biological Process, Molecular Function, Cellular Component
- KEGG Pathways: Curated pathway representations
- MSigDB Collections: Hallmark gene sets, regulatory target sets
- Disease Databases: DisGeNET, OMIM
- Drug Databases: DrugBank, DGIdb
Implementation with HOMER:
Statistical Interpretation: Functional enrichment typically employs hypergeometric testing or Fisher's exact test, with multiple testing correction (Benjamini-Hochberg FDR < 0.05 considered significant). The resulting enriched terms reveal the biological processes and pathways most strongly associated with the genomic regions marked by your histone modification of interest.
Advanced Integration and Visualization
Multi-dimensional Data Integration
Advanced interpretation of histone modification data increasingly requires integration with complementary genomic datasets to develop comprehensive models of transcriptional regulation. This integrated approach moves beyond isolated peak analysis toward systems-level understanding of chromatin dynamics.
Key Integration Strategies:
- Chromatin State Mapping: Combine multiple histone marks to define chromatin states
- Transcriptome Correlation: Integrate with RNA-seq data to connect marks to expression changes
- Accessibility Data: Incorporate ATAC-seq or DNase-seq to assess chromatin accessibility
- 3D Genome Architecture: Consider Hi-C data for spatial organization context
- Variant Interpretation: Overlap with GWAS hits for disease relevance assessment
The MINUTE-ChIP protocol enables particularly powerful integrative approaches by facilitating the parallel profiling of multiple histone modifications across experimental conditions in a quantitatively comparable framework [24]. This multi-dimensional profiling generates quantitatively scaled ChIP-seq tracks for downstream analysis and visualization, supporting increasingly sophisticated integrative analyses.
Advanced Visualization Techniques
Effective visualization is essential for interpreting complex histone modification patterns and communicating findings. The following approaches provide complementary perspectives on ChIP-seq data:
Genome Browser Tracks: Visualization in UCSC Genome Browser or IGV provides locus-specific inspection of enrichment patterns. Platforms like H3NGST automatically generate BigWig files compatible with these browsers, enabling direct visualization of signal tracks [22]. For quantitative comparisons, tools like DeepTools facilitate the creation of normalized coverage profiles that accurately represent enrichment levels [22].
Metagene Profiling: Aggregate plots of signal across gene bodies or specific genomic features reveal systematic patterns in histone modification distribution.
Heatmap Visualization: Sort regions by signal intensity to identify patterns and subgroups within peak sets.
Diagram 1: ChIP-seq Analysis Workflow for Histone Modifications
Research Reagent Solutions
Successful ChIP-seq experiments for histone modifications depend on carefully selected reagents and resources. The following table outlines essential materials and their functions in histone modification studies.
Table 3: Essential Research Reagents for Histone Modification ChIP-seq
| Reagent Category | Specific Examples | Function & Importance | Quality Considerations |
|---|---|---|---|
| Antibodies | Anti-H3K4me3, Anti-H3K27ac, Anti-H3K27me3 | Target-specific enrichment; determines experiment success | Validate by immunoblot (≥50% signal in main band); check cross-reactivity [66] |
| Spike-in Controls | D. melanogaster chromatin, S. pombe chromatin | Normalization for quantitative comparisons between conditions | Use orthologous species with distinct genome; consistent input ratios [50] |
| Library Prep Kits | Illumina TruSeq, NEB Next Ultra II | Convert immunoprecipitated DNA to sequencing libraries | Consider insert size distribution, complexity preservation, compatibility |
| Validation Tools | CRISPR/Cas9, siRNA knockdown | Confirm functional relevance of identified regions | Independent experimental validation essential for high-impact findings |
| Analysis Platforms | H3NGST, ROSALIND, Galaxy | Streamlined processing and interpretation | Web-based vs. local installation; mobile accessibility; automation level [22] [80] |
The journey from peak calling to biological insight in histone modification studies represents a critical phase in epigenomic research, transforming computational predictions into mechanistic understanding. This systematic approach—encompassing appropriate peak caller selection, rigorous quality assessment, comprehensive genomic annotation, functional enrichment analysis, and multi-dimensional data integration—enables researchers to extract maximum biological meaning from ChIP-seq datasets. As methodologies continue to advance, particularly in quantitative comparisons and single-cell resolution, the framework outlined in this guide provides a foundation for interpreting histone modification data in diverse biological contexts. By applying these principles and practices, researchers can effectively connect chromatin patterns to biological mechanisms, advancing our understanding of gene regulation in development, disease, and therapeutic intervention.
Conclusion
A successful histone ChIP-seq experiment hinges on a meticulously optimized wet-lab protocol, a rigorous bioinformatic pipeline, and adherence to established quality standards. This guide has synthesized the critical steps, from foundational knowledge and methodological execution to troubleshooting and validation. The future of chromatin profiling is moving toward higher-throughput, more quantitative multiplexed methods and lower-input techniques, enabling more powerful comparative studies in disease models and drug screening. For biomedical researchers, mastering this workflow is paramount for unraveling the epigenetic mechanisms of disease and advancing the development of targeted epigenetic therapies.
References
- 1. Postâ€translational modifications of histones: Mechanisms ... [https://pmc.ncbi.nlm.nih.gov/articles/PMC10200003/]
- 2. Recent progress in histone post-translational modifications ... [https://www.sciencedirect.com/science/article/abs/pii/S0141813025085216]
- 3. The role of histone post-translational modifications in ... [https://www.frontiersin.org/journals/immunology/articles/10.3389/fimmu.2024.1495221/full]
- 4. Histone post-translational modifications [https://www.nature.com/subjects/histone-post-translational-modifications/nchembio]
- 5. How To Analyze ChIP-seq Data For Absolute Beginners Part 1 [https://ngs101.com/how-to-analyze-chip-seq-data-for-absolute-beginners-part-1-from-fastq-to-peaks-with-homer/]
- 6. Chromatin Mapping Basics: ChIP-seq [https://www.epicypher.com/resources/blog/chromatin-mapping-basics-chip-seq/]
- 7. ChIP-Seq Analysis Tutorial [https://www.basepairtech.com/knowledge-center/chip-seq-analysis-tutorial/]
- 8. Histone ChIP-seq Data Standards and Processing Pipeline [https://www.encodeproject.org/chip-seq/histone/]
- 9. PTMViz: a tool for analyzing and visualizing histone post ... [https://bmcbioinformatics.biomedcentral.com/articles/10.1186/s12859-021-04166-9]
- 10. Methods for ChIP-seq analysis: A practical workflow and ... [https://www.sciencedirect.com/science/article/pii/S1046202320300591]
- 11. Introduction of ChIP-Seq: Principle, Process,Advantages [https://www.cd-genomics.com/epigenetics/resource-introduction-of-chip-seq.html]
- 12. ChIP-seq Data Processing and Relative and Quantitative ... [https://pmc.ncbi.nlm.nih.gov/articles/PMC12067309/]
- 13. Reconstructing the maize leaf regulatory network using ... [https://www.nature.com/articles/s41467-020-18832-8]
- 14. ChIP-seq data processing tutorial [https://nbis-workshop-epigenomics.readthedocs.io/en/latest/content/tutorials/chipseqProc/lab-chipseq-processing.html]
- 15. Comprehensive assessment of differential ChIP-seq tools ... [https://genomebiology.biomedcentral.com/articles/10.1186/s13059-022-02686-y]
- 16. ChIP Sequencing in the Real World: 5 Uses You'll Actually ... [https://www.linkedin.com/pulse/chip-sequencing-real-world-5-uses-youll-actually-dojqc/]
- 17. Refined ChIPâ€Seq Protocol for Highâ€Quality Chromatin ... [https://pmc.ncbi.nlm.nih.gov/articles/PMC12628287/]
- 18. Addressing the specific roles of histone modifications in ... [https://www.nature.com/articles/s41467-025-66426-z]
- 19. A comprehensive review of histone modifications during ... [https://pmc.ncbi.nlm.nih.gov/articles/PMC12206194/]
- 20. Histone modifications in development [https://pubmed.ncbi.nlm.nih.gov/40514762/]
- 21. Histone modifications: Unveiling the epigenetic enigma of ... [https://www.sciencedirect.com/science/article/pii/S2214031X25001433]
- 22. H3NGST: a fully automated, web-based platform for end-to ... [https://bmcbioinformatics.biomedcentral.com/articles/10.1186/s12859-025-06247-5]
- 23. Protocol for double-crosslinking ChIP-seq to improve data ... [https://www.sciencedirect.com/science/article/pii/S2666166725005775]
- 24. Multiplexed chromatin immunoprecipitation sequencing for ... [https://pubmed.ncbi.nlm.nih.gov/39363107/]
- 25. ChIP-seq Data Processing and Relative and Quantitative ... [https://pubmed.ncbi.nlm.nih.gov/40364978/]
- 26. Data standards [https://www.encodeproject.org/data-standards/]
- 27. CUT&Tag recovers up to half of ENCODE ChIP-seq ... [https://www.nature.com/articles/s41467-025-58137-2]
- 28. Experimental Design: Best Practices - Bioinformatics [https://bioinformatics.ccr.cancer.gov/ccbr/project-support/experimental-design-best-practices/]
- 29. How thoughtful experimental design can empower biologists ... [https://pmc.ncbi.nlm.nih.gov/articles/PMC12328601/]
- 30. A Step-by-Step Guide to Successful Chromatin ... [https://www.thermofisher.com/us/en/home/life-science/antibodies/antibodies-learning-center/antibodies-resource-library/antibody-application-notes/step-by-step-guide-successful-chip-assays.html]
- 31. Efficient In-house Coupling of Sample and Library ... [https://pubmed.ncbi.nlm.nih.gov/40257563/]
- 32. Chromatin Shearing in Suspension Cell Line: A Guide for ... [https://pubmed.ncbi.nlm.nih.gov/40321026/]
- 33. Effects of sheared chromatin length on ChIP-seq quality ... [https://pmc.ncbi.nlm.nih.gov/articles/PMC8495733/]
- 34. Protocol for chromatin immunoprecipitation of ... [https://www.sciencedirect.com/science/article/pii/S2666166725001017]
- 35. Guidelines to Analyze ChIP-Seq Data: Journey Through ... [https://pubmed.ncbi.nlm.nih.gov/39745614/]
- 36. Chromatin Immunoprecipitation (ChIP): The Complete Guide [https://www.antibodies.com/applications/chromatin-immunoprecipitation]
- 37. Deciphering histone mark-specific fine-scale chromatin ... [https://www.nature.com/articles/s41467-025-64350-w]
- 38. Analysis of histone antibody specificity directly in ... [https://pmc.ncbi.nlm.nih.gov/articles/PMC10028865/]
- 39. Transcription Factor ChIP-seq Data Standards and ... [https://www.encodeproject.org/chip-seq/transcription_factor/]
- 40. A Primer on NGS Technologies and Their Specs (2025) [https://blog.latch.bio/p/a-primer-on-ngs-technologies-and]
- 41. Top Genome Chip Companies & How to Compare Them ... [https://www.linkedin.com/pulse/top-genome-chip-companies-how-compare-them-2025-lmiwe/]
- 42. Genome-coverage single-cell histone modifications for ... [https://www.nature.com/articles/s41586-025-08656-1]
- 43. ChIP-Seq: advantages and challenges of a maturing ... [https://pmc.ncbi.nlm.nih.gov/articles/PMC3191340/]
- 44. a fully automated, web-based platform for end-to-end ChIP- ... [https://pmc.ncbi.nlm.nih.gov/articles/PMC12512806/]
- 45. H>3>NGST: a fully automated, web-based platform for end-to- ... [https://sejong.elsevierpure.com/en/publications/hsup3supngst-a-fully-automated-web-based-platform-for-end-to-end-/]
- 46. H3NGST: a fully automated, web-based platform for end-to-end ... [https://bmcbioinformatics.biomedcentral.com/articles/10.1186/s12859-025-06247-5/tables/3]
- 47. A survey of motif finding Web tools for detecting binding site ... [https://www.semanticscholar.org/paper/1934d102a4c9e028b672f373708374b17d3b3c17]
- 48. Automated chromatin profiling with spa-ChIP seq uncovers ... [https://pmc.ncbi.nlm.nih.gov/articles/PMC12393402/]
- 49. an automated repeat enrichment analysis package for ChIP ... [https://mobilednajournal.biomedcentral.com/articles/10.1186/s13100-024-00315-y]
- 50. Highly quantitative measurement of differential protein ... [https://www.sciencedirect.com/science/article/pii/S2667237525000888]
- 51. Chromatin Immunoprecipitation Sequencing (ChIP-seq) for Detecting Histone Modifications and Modifiers - PubMed [https://pubmed.ncbi.nlm.nih.gov/36173565/]
- 52. Using ChIP-Seq Technology to Generate High-Resolution Profiles of Histone Modifications - PMC [https://pmc.ncbi.nlm.nih.gov/articles/PMC4151291/]
- 53. Getting rid of noise in sequencing data - Plantae [https://plantae.org/getting-rid-of-noise-in-sequencing-data/]
- 54. ChIP-qPCR, ChIP-seq, CUT&RUN, CUT&Tag, and More [https://www.bosterbio.com/blog/post/a-comprehensive-guide-to-epigenomic-profiling-chip-qpcr-chip-seq-cut-and-run-cut-and-tag-and-more?srsltid=AfmBOop87V3X1IN0aE5g78ISgMBWqbjsS_C6e5CBOmDLT3ss66cnD7Pe]
- 55. Benchmark of chromatin-protein interaction methods in ... [https://pubmed.ncbi.nlm.nih.gov/40433546/]
- 56. Chromatin preparation from tissues for ChIP [https://www.abcam.com/en-us/technical-resources/protocols/chromatin-preparation-from-tissues]
- 57. Protocol for in vivo chromatin immunoprecipitation on ... [https://www.sciencedirect.com/science/article/pii/S266616672500022X]
- 58. Protocol for in vivo chromatin immunoprecipitation on ... [https://pmc.ncbi.nlm.nih.gov/articles/PMC11835655/]
- 59. Chromatin Shearing Workflow [https://www.covaris.com/chromatin/]
- 60. Understanding Fraction and Reads in Peaks: A G... [https://pluto.bio/resources/Learning%20Series/understanding-fraction-and-reads-in-peaks]
- 61. Terms and Definitions [https://www.encodeproject.org/data-standards/terms/]
- 62. A comparative study of ChIP-seq sequencing library ... [https://bmcgenomics.biomedcentral.com/articles/10.1186/s12864-016-3135-y]
- 63. Commercial ChIP-Seq Library Preparation Kits Performed ... [https://pmc.ncbi.nlm.nih.gov/articles/PMC10001930/]
- 64. Handling replicates with IDR | Introduction to ChIP-Seq using ... [https://hbctraining.github.io/Intro-to-ChIPseq/lessons/07_handling-replicates-idr.html]
- 65. Histone ChIP-seq Data Standards and Processing Pipeline ... [https://www.encodeproject.org/chip-seq/histone-encode4/]
- 66. ChIP-seq guidelines and practices of the ENCODE and ... [https://pmc.ncbi.nlm.nih.gov/articles/PMC3431496/]
- 67. Practical Guidelines for the Comprehensive Analysis of ChIP ... [https://journals.plos.org/ploscompbiol/article?id=10.1371/journal.pcbi.1003326]
- 68. ChIP-seq vs. CUT&RUN vs. CUT&Tag: Which should you use? - EpiCypher [https://www.epicypher.com/resources/blog/chip-seq-vs-cutrun-vs-cuttag-which-should-you-use/]
- 69. A Comprehensive Guide to Epigenomic Profiling: ChIP-qPCR, ChIP-seq, CUT&RUN, CUT&Tag, and More [https://www.bosterbio.com/blog/post/a-comprehensive-guide-to-epigenomic-profiling-chip-qpcr-chip-seq-cut-and-run-cut-and-tag-and-more]
- 70. CUT&Tag Overview: Profile Chromatin Faster | Cell Signaling Technology [https://www.cellsignal.com/applications/cut-tag-overview]
- 71. A comparison of control samples for ChIP-seq of histone ... [https://pmc.ncbi.nlm.nih.gov/articles/PMC4174756/]
- 72. Computational methodology for ChIP-seq analysis - PMC [https://pmc.ncbi.nlm.nih.gov/articles/PMC4346130/]
- 73. MINUTE-ChIP — Epigenomics Workshop 2025 1 documentation [https://nbis-workshop-epigenomics.readthedocs.io/en/latest/content/tutorials/quantitativeChip/minute-lab.html]
- 74. Quantitative multiplexed ChIP - The Elsässer Lab [https://elsaesserlab.wordpress.com/2019/07/04/minute-chip/]
- 75. Quantitative Multiplexed ChIP Reveals Global Alterations ... [https://www.sciencedirect.com/science/article/pii/S2211124719310940]
- 76. Overview of Chromatin Immunoprecipitation (ChIP) [https://www.cellsignal.com/applications/chip-and-chip-seq/regulation-expression-in-cell-and-tissue?srsltid=AfmBOorG4V0xLAe4gdGLzhJOuwGuh_UaYAAER738l0M05_HolminUhdW]
- 77. Quantitative multiplex ChIP-seq is here | Bernstein Lab at ... [https://labs.dana-farber.org/bernsteinlab/news/quantitative-multiplex-chip-seq-here]
- 78. Streamlined quantitative analysis of histone modification ... [https://www.nature.com/articles/s41598-023-34430-2]
- 79. Benchmarking peak calling methods for CUT&RUN [https://pubmed.ncbi.nlm.nih.gov/40569178/]
- 80. Histone Mark & Transcription Factor Analysis [https://www.rosalind.bio/chip-seq-analysis]