Beyond RMSD: The Global Distance Test as an Essential Tool for Protein Model Evaluation in Drug Discovery
This article provides a comprehensive overview of the Global Distance Test (GDT), a critical metric for evaluating protein structure predictions. Tailored for researchers, scientists, and drug development professionals, we explore GDT's foundational principles, its methodological application in community-wide assessments like CASP, strategies to overcome its computational challenges and limitations, and a comparative analysis with other metrics such as RMSD and TM-score. The article also examines GDT's pivotal role in validating breakthrough AI tools like AlphaFold, underscoring its growing importance in accelerating structure-based drug design and biomedical research.
Beyond RMSD: The Global Distance Test as an Essential Tool for Protein Model Evaluation in Drug Discovery
Abstract
This article provides a comprehensive overview of the Global Distance Test (GDT), a critical metric for evaluating protein structure predictions. Tailored for researchers, scientists, and drug development professionals, we explore GDT's foundational principles, its methodological application in community-wide assessments like CASP, strategies to overcome its computational challenges and limitations, and a comparative analysis with other metrics such as RMSD and TM-score. The article also examines GDT's pivotal role in validating breakthrough AI tools like AlphaFold, underscoring its growing importance in accelerating structure-based drug design and biomedical research.
What is the Global Distance Test? Understanding the Core Metric of Protein Structure Assessment
The Global Distance Test (GDT) is a fundamental metric for quantifying the similarity between two protein three-dimensional structures. In the field of computational biology, it serves a critical role in assessing the quality of predicted protein models by comparing them to experimentally determined reference structures, such as those solved by X-ray crystallography or cryo-electron microscopy [1]. The GDT was developed to address limitations of earlier metrics like Root Mean Square Deviation (RMSD), which is highly sensitive to small, outlier regions that are poorly modeled and can therefore underestimate the quality of a prediction that is largely accurate [1] [2]. The most common version of the metric, the GDT_TS (Total Score), is reported as a percentage, where a higher score indicates a closer match between the model and the reference structure [1].
Within the ecosystem of structural bioinformatics, GDTTS is not just an academic metric; it is a major assessment criterion in the Critical Assessment of protein Structure Prediction (CASP) experiments [1] [3]. These blind community-wide experiments are the gold standard for evaluating the state of the art in protein structure prediction. The central role of GDTTS in CASP, and its adoption in continuous benchmarks like CAMEO, underscores its importance in driving methodological progress and validating new approaches, including the latest deep learning-based predictors like AlphaFold [1] [4] [5].
Core Concept and Calculation of GDT
The Fundamental Principle
At its core, the GDT algorithm aims to find the largest set of amino acid residues (specifically, their Cα atoms) in a model structure that can be superimposed onto the corresponding residues in a reference structure within a defined distance cutoff [1]. The process involves iteratively superimposing the two structures to maximize this set of matched residues. The underlying computational challenge is formalized as the Largest Well-predicted Subset (LWPS) problem, which seeks the optimal rigid transformation (rotation and translation) that maximizes the number of residue pairs under a given bottleneck distance, d [2]. Although this problem was once conjectured to be NP-hard, it has been shown to be solvable in polynomial time, albeit with algorithms that can be computationally intensive for practical use [2].
The GDT_TS Calculation Protocol
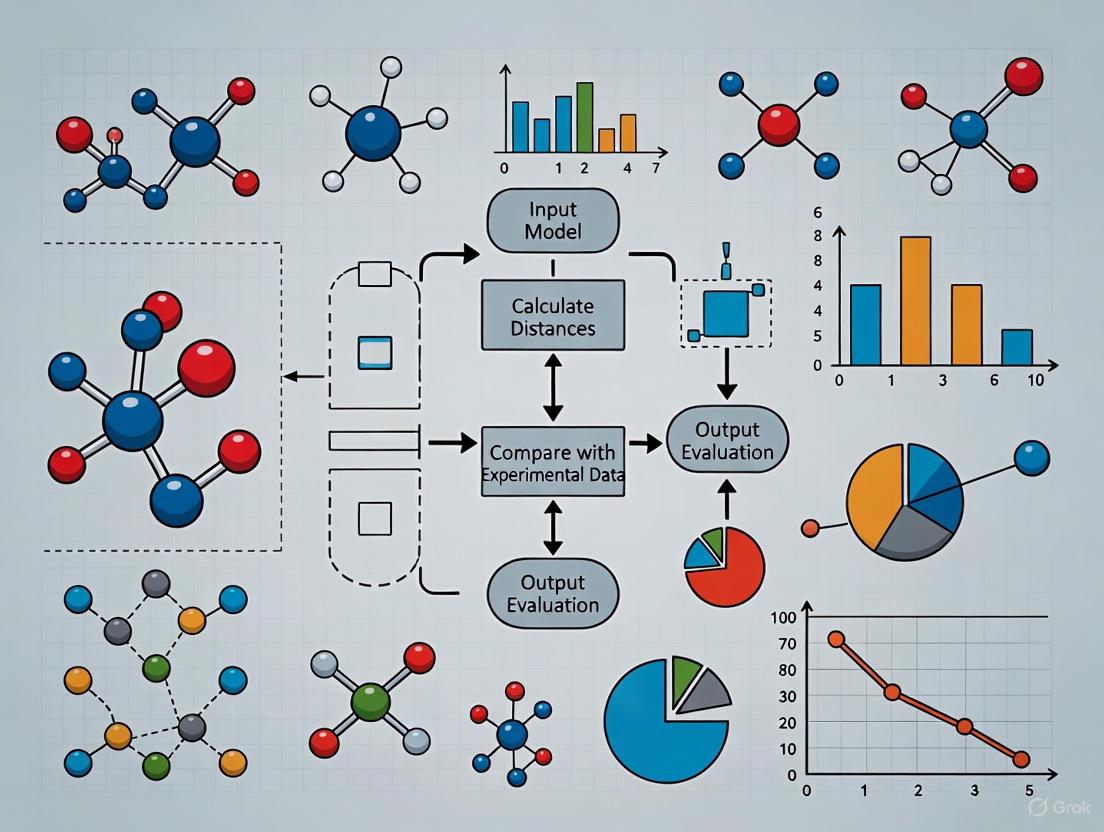
The conventional GDT_TS score is not based on a single distance cutoff but is an aggregate measure designed to provide a balanced view of a model's accuracy at different spatial scales. The calculation proceeds through a well-defined protocol, illustrated in the workflow below.
The standard GDT_TS score is the average of the percentages of matched Cα atoms under four specific distance cutoffs: 1, 2, 4, and 8 Ångströms [1]. This multi-threshold approach ensures that the score reflects both high-accuracy local fits (captured by the 1Å and 2Å cutoffs) and the overall global fold similarity (captured by the 4Å and 8Å cutoffs). The original GDT algorithm calculates scores for 20 consecutive distance cutoffs from 0.5Å to 10.0Å, providing a detailed profile, but the average of the four key cutoffs has been standardized for CASP reporting [1].
Table: Key Distance Cutoffs in GDT_TS Calculation
| Distance Cutoff (Ã…) | Structural Feature Assessed | Role in GDT_TS |
|---|---|---|
| 1 Ã… | Very high local atomic-level accuracy | Assesses near-experimental precision |
| 2 Ã… | High local backbone accuracy | Captures well-predicted core regions |
| 4 Ã… | Correct global fold topology | Evaluates overall structural fold |
| 8 Ã… | General tertiary structure similarity | Ensures correct domain packing |
GDT in Experimental and Evaluation Protocols
Standardized Assessment in CASP and CAMEO
The GDTTS metric is embedded within the experimental protocols of major international benchmarks. In CASP, predictors submit blind models for recently solved but unpublished protein structures. The organizers then use GDTTS as one of the primary metrics to rank the performance of different methods [1] [3]. Similarly, the CAMEO platform performs continuous, automated evaluation of prediction servers using weekly releases of new structures, also relying on GDTTS for quality assessment [4] [6]. The use of GDTTS in these independent, blind tests provides a rigorous and unbiased evaluation of a prediction method's real-world performance.
A Practical Toolkit for Researchers
To effectively work with and evaluate protein structures using GDT, researchers utilize a suite of software tools and resources.
Table: Essential Research Reagents and Tools for GDT Analysis
| Tool/Resource Name | Type | Primary Function in GDT Context |
|---|---|---|
| LGA (Local-Global Alignment) [1] | Software Program | The original and reference method for calculating GDT scores via structural superposition. |
| OpenStructure [4] | Software Library | Used by tools like ModFOLDdock2 to compute underlying scores (e.g., lDDT, CAD) for quality assessment. |
| OptGDT [2] | Software Tool | An algorithm designed to find nearly optimal GDT scores with theoretical accuracy guarantees, addressing heuristic limitations. |
| CASP/ CAMEO Datasets [6] | Benchmark Data | Standardized sets of target structures and predictions for validating and comparing new MQA methods. |
| AlphaFold2/3 [4] [5] | Prediction Method | High-accuracy structure prediction systems whose outputs are routinely evaluated using GDT_TS in benchmarks. |
| Arabidopyl alcohol | Arabidopyl Alcohol|RUO | Arabidopyl alcohol is a natural product from Betula pendula bark for research use. For Research Use Only. Not for human or diagnostic use. |
| N1-Propargylpseudouridine | N1-Propargylpseudouridine|High-Purity | N1-Propargylpseudouridine is a modified nucleotide for RNA research. This product is For Research Use Only. Not for human or therapeutic use. |
Variations and Advanced Extensions of GDT
The success of the core GDT_TS metric has led to the development of several specialized variants to address specific assessment needs. The relationships between these different GDT-related metrics are illustrated below.
- GDTHA (High Accuracy): This variant uses smaller distance cutoffs (typically half the size of those used in GDTTS) to more stringently assess models that are expected to be of very high quality. It was introduced in CASP7 to better differentiate between top-performing predictions [1].
- GDC (Global Distance Calculation) Extensions: To move beyond the Cα backbone, the GDCsc score uses a predefined "characteristic atom" near the end of each residue's side chain for evaluation. The GDCall variant represents the most comprehensive assessment, incorporating full-model information by considering all atoms [1] [7]. These extensions are crucial for evaluating the accuracy of side chain packing, which is vital for understanding protein function and for applications like drug design.
- Algorithmic Improvements: Tools like OptGDT have been developed to compute GDT scores with theoretically guaranteed accuracies, overcoming potential underestimation from heuristic methods used by earlier programs. In tests on CASP8 data, OptGDT improved GDT scores for 87.3% of models, with some improvements exceeding 10% more matched residues [2].
The Evolving Role of GDT in the Age of Deep Learning
The advent of highly accurate structure prediction tools like AlphaFold2 and AlphaFold3 has transformed the field, with many predicted models now reaching near-experimental accuracy [4] [5]. This shift has not made GDT obsolete but has refined its role. As the performance ceiling has been raised, the ability of GDT_TS to discriminate between the very best models has become increasingly important. Furthermore, the focus of the field is expanding from monomeric tertiary structures to protein quaternary structures (complexes) [4]. In this context, integrated assessment servers like ModFOLDdock2 use hybrid consensus approaches that incorporate GDT-like metrics, such as Oligo-GDTJury, to evaluate the global and local interface quality of predicted complexes [4].
While GDTTS remains a cornerstone for global structural comparison, it is often used in conjunction with other metrics to provide a more complete picture. The local Distance Difference Test (lDDT), for example, is a more recent local stability measure that does not require superposition and is increasingly used alongside GDTTS in benchmarks [4] [6]. The continued evolution of the GDT metric family ensures it will remain an indispensable component of the model quality assessment toolkit, providing critical, quantitative insights for researchers in computational biology, structural bioinformatics, and drug development.
In the fields of structural biology and computational drug discovery, the accurate evaluation of protein structure models is as crucial as their prediction. For decades, the root mean square deviation (RMSD) served as the predominant metric for quantifying structural similarity. However, as protein structure prediction has been revolutionized by deep learning approaches like AlphaFold2, the limitations of RMSD have become increasingly apparent, necessitating more sophisticated evaluation frameworks [8]. The Global Distance Test (GDT) was developed specifically to address these limitations, providing a more robust and biologically meaningful assessment of structural quality [1]. This technical guide examines the fundamental shortcomings of RMSD and demonstrates how GDT provides a superior framework for model evaluation within the broader context of structural bioinformatics research.
RMSD: Historical Context and Inherent Limitations
The RMSD Calculation and Its Sensitivities
Root mean square deviation calculates the square root of the average squared distances between corresponding atoms in two superimposed protein structures. For two structures A and B, each containing N atoms, the RMSD is mathematically defined as:
$$ \text{RMSD} = \sqrt{\frac{1}{N}\sum{i=1}^{N}\mathbf{r}i^2} $$
where $\mathbf{r}i = \mathbf{a}i - \mathbf{b}_i$ represents the displacement vector between corresponding atoms [9].
Despite its widespread adoption, RMSD suffers from significant limitations that impact its reliability for comprehensive structure evaluation:
Sensitivity to Outliers: RMSD is dominated by the largest errors in a structure, meaning that a small number of poorly predicted regions can disproportionately inflate the score, even when the remainder of the structure is accurately modeled [10] [1].
Length Dependency: The interpretation of RMSD values varies significantly with protein size. For example, an RMSD of 3Ã… represents a poor model for a small protein of 10 residues but may indicate reasonable accuracy for a large protein of 100 residues [2].
Global vs. Local Accuracy: RMSD provides a single global measure that fails to distinguish between structures with widespread small errors and those with excellent local accuracy but a few severe errors [10].
Table 1: Interpreting RMSD Values in Protein Structure Comparison
| RMSD Value | Interpretation | Structural Implications |
|---|---|---|
| <2Ã… | High accuracy | Structures are highly similar or nearly identical |
| 2-4Ã… | Medium accuracy | Moderate similarity; acceptable depending on resolution requirements |
| >4Ã… | Low accuracy | Structures differ significantly; only global elements may be comparable |
Case Study: RMSD Limitations in Conformational Change Analysis
The practical implications of RMSD's limitations become evident when comparing protein conformational states. For example, active and inactive conformations of estrogen receptor α differ primarily by the movement of a single helix (H12). Despite this localized change, global backbone RMSD values can be virtually indistinguishable from pairs of albumin structures exhibiting multiple smaller-scale rearrangements [10]. This demonstrates how RMSD fails to distinguish between different types of structural variations, potentially masking biologically relevant conformational changes.
The Global Distance Test: A Robust Alternative
GDT Fundamentals and Calculation
The Global Distance Test was developed specifically to overcome RMSD's limitations. Rather than providing a single average distance measure, GDT identifies the largest set of amino acid residues (typically Cα atoms) in a model structure that fall within defined distance cutoffs of their positions in a reference structure after optimal superposition [1].
The conventional GDT_TS (Total Score) calculates the percentage of residues within four distance thresholds (1Ã…, 2Ã…, 4Ã…, and 8Ã…) and reports the average:
$$ \text{GDT_TS} = \frac{\text{GDT}{1Ã…} + \text{GDT}{2Ã…} + \text{GDT}{4Ã…} + \text{GDT}{8Ã…}}{4} $$
This multi-threshold approach provides a more nuanced view of structural accuracy across different spatial scales [1].
GDT Score Interpretation and Variants
GDT scores range from 0-100%, with higher values indicating greater structural similarity. The protein structure prediction community has established general interpretation guidelines for GDT scores:
Table 2: Interpretation of GDT Scores in Model Quality Assessment
| GDT Score Range | Interpretation | Model Quality |
|---|---|---|
| >90% | High accuracy | Model closely matches reference structure |
| 50-90% | Medium accuracy | Acceptable depending on research focus |
| <50% | Low accuracy | Model likely contains significant inaccuracies |
Several GDT variants have been developed for specific assessment scenarios:
GDTHA (High Accuracy): Uses stricter distance cutoffs (typically half those of GDTTS) to more stringently evaluate high-quality models [1].
GDC_SC (Global Distance Calculation for Sidechains): Extends the assessment to side chain atoms using characteristic atoms for each residue type [1].
GDC_ALL (Global Distance Calculation for All Atoms): Incorporates full atomic representation for comprehensive evaluation [1].
Comparative Analysis: RMSD vs. GDT in Practical Applications
Performance in Community-Wide Assessments
The Critical Assessment of Protein Structure Prediction (CASP) has adopted GDT as a primary evaluation metric since CASP3, reflecting its superior performance in assessing model quality [1]. Traditional RMSD-based methods employ heuristic strategies that often result in underestimated similarity scores. Research has demonstrated that optimal GDT score calculation can improve the number of matched residue pairs by at least 10% compared to traditional methods for over 87% of predicted models [2].
The fundamental difference lies in their approach to structural alignment: while RMSD minimization seeks the transformation that minimizes average atomic displacements, GDT optimization seeks the transformation that maximizes the number of residues within a defined distance threshold, making it less sensitive to outlier regions [2].
Application in Experimental Structure Validation
GDT's robustness extends beyond computational prediction to experimental structure validation. In nuclear magnetic resonance (NMR) spectroscopy, where proteins exhibit inherent flexibility, GDT provides a more meaningful measure of agreement with experimental data than RMSD. Studies have shown that structural models with lower GDT scores to an NMR reference structure may sometimes be better fits to the underlying experimental data than those with higher scores, highlighting the importance of considering protein flexibility in assessment [1].
Implementation and Integration in Modern Structural Biology
GDT in the Deep Learning Era
With the advent of deep learning-based structure prediction tools like AlphaFold2, accurate model evaluation has become increasingly important. While these tools regularly produce high-quality predictions, assessment metrics like GDT remain essential for identifying subtle errors, particularly in multi-domain proteins and flexible regions [11] [8].
Recent advancements, such as Distance-AF, which incorporates distance constraints to improve AlphaFold2 predictions, demonstrate how GDT-like principles are now being integrated directly into structure prediction pipelines [11] [12]. This approach reduced RMSD to native structures by an average of 11.75Ã… compared to standard AlphaFold2 models on challenging targets, highlighting the continued relevance of distance-based assessment in guiding model refinement [12].
Complementary Metrics for Comprehensive Evaluation
While GDT addresses many RMSD limitations, a comprehensive structural assessment typically employs multiple complementary metrics:
TM-score: A normalized measure that accounts for protein size, with values between 0-1 where scores >0.5 indicate the same fold [13].
LDDT (Local Distance Difference Test): Assesses local accuracy independent of global superposition, making it particularly valuable for evaluating structures with domain movements [13].
Table 3: Protein Structure Comparison Metrics and Their Applications
| Metric | Type | Key Characteristics | Best Applications |
|---|---|---|---|
| RMSD | Global | Simple calculation; sensitive to outliers | Quick comparisons of highly similar structures |
| GDT | Global | Multiple distance thresholds; robust to outliers | Overall model quality assessment; CASP evaluations |
| TM-score | Global | Size-normalized; fold-level assessment | Detecting structural relationships |
| LDDT | Local | Superposition-independent; per-residue scores | Local quality assessment; residue-level accuracy |
Research Reagent Solutions for Structural Evaluation
Table 4: Essential Tools for Protein Structure Evaluation and Analysis
| Tool/Resource | Type | Primary Function | Application Context |
|---|---|---|---|
| LGA (Local-Global Alignment) | Software | Calculates GDT scores and performs structure alignment | Primary tool for GDT computation in CASP |
| PSVS (Protein Structure Validation Suite) | Software Suite | Comprehensive validation using multiple quality scores | Integrated structure validation for NMR and computational models |
| OptGDT | Algorithm | Computes GDT scores with theoretically guaranteed accuracy | High-precision assessment for benchmarking studies |
| FoldSeek | Software | Fast structural comparison and alignment | Large-scale structural database searches |
| spyrmsd | Python Library | Symmetry-corrected RMSD calculations | Ligand docking evaluation and conformer comparison |
The development and adoption of the Global Distance Test represents a significant advancement in protein structure evaluation methodology. By addressing the critical limitations of RMSD—particularly its sensitivity to outlier regions and inability to distinguish between local and global accuracy—GDT has established itself as an essential component of structural bioinformatics research. Its multi-threshold approach provides a more nuanced and biologically relevant assessment of model quality, which has been instrumental in driving progress in protein structure prediction, particularly through community-wide initiatives like CASP. As the field continues to evolve with new deep learning approaches and increasingly complex structural challenges, GDT and its variants remain foundational tools for rigorous, informative model evaluation that effectively bridges computational predictions and biological insights.
In the field of computational structural biology, the quantitative assessment of protein models is paramount. The Global Distance Test (GDT), particularly its GDT_TS variant, employs a set of standardized distance cutoffs—1, 2, 4, and 8 Ångstroms—to measure the similarity between a predicted protein structure and an experimentally determined reference. This technical guide delves into the fundamental role these specific thresholds play in model evaluation research. We explore the biophysical and practical rationales behind this graduated scale, which collectively balances the need for high-accuracy detection with the pragmatic acceptance of local structural deviations. The application of these cutoffs in major community-wide experiments like CASP (Critical Assessment of Structure Prediction) has standardized the field, enabling robust comparisons between modeling methodologies. Furthermore, the principles of using distance thresholds to quantify spatial relationships extend beyond model assessment into experimental techniques such as Double Electron-Electron Resonance (DEER) spectroscopy and the analysis of ion-pair interactions in proteins. This review provides an in-depth analysis of these thresholds, summarizes relevant quantitative data, and details experimental protocols that leverage distance constraints, framing it all within the critical context of evaluating protein structural models.
The Global Distance Test (GDT) is a cornerstone metric for quantifying the similarity between two protein three-dimensional structures, most commonly used to compare computational models against experimentally-solved reference structures [1]. Unlike the Root-Mean-Square Deviation (RMSD), which can be disproportionately skewed by a small number of outlier residues, the GDT metric was specifically designed to provide a more robust and global measure of structural accuracy [1]. The most common implementation, known as GDT_TS (Total Score), is calculated as the average of the largest sets of amino acid Cα atoms from the model that can be superimposed onto the reference structure under four defined distance cutoffs: 1, 2, 4, and 8 Ångstroms [1].
The selection of this specific set of thresholds is not arbitrary; it represents a carefully considered gradient of spatial precision that captures different aspects of model quality. The stricter cutoffs (1 Ã… and 2 Ã…) identify regions of very high local accuracy, where the model is virtually indistinguishable from the target. The more lenient cutoffs (4 Ã… and 8 Ã…) capture the broader, global topology of the fold, even in regions that may have undergone shifts, rotations, or contain flexible loops that are difficult to model with atomic precision. This multi-scale approach allows GDT_TS to present a single, comprehensive score that reflects both the local and global quality of a structural model. Its adoption as a primary assessment criterion in the Critical Assessment of Structure Prediction (CASP) experiments has cemented its role in driving progress in the field of protein structure prediction [1].
The utility of distance thresholds in structural biology is not confined to GDT-based model evaluation. For instance, in DEER (Double Electron-Electron Resonance) spectroscopy, a powerful technique for probing conformational heterogeneity, distance distributions between spin labels in the 15-80 Ã… range are measured to resolve unique protein conformations [14]. Similarly, in the analysis of protein stability and design, the geometry of ion pairs (salt bridges) is classified based on distances between charged atoms, with interactions often categorized as salt bridges, nitrogen-oxygen (NO) bridges, or longer-range ion pairs based on 4 Ã… distance criteria [15] [16]. Thus, the GDT_TS cutoffs exist within a broader landscape where specific distance thresholds are used to define, classify, and quantify structural features and interactions.
The Biophysical and Practical Rationale for Standard Cutoffs
The graduated scale of the GDT_TS cutoffs is designed to capture a complete picture of a model's accuracy, from atom-level precision to the correct overall fold. Each threshold provides unique insight, and together they offer a balanced assessment that penalizes both global topological errors and local structural inaccuracies.
1 Ångstrom Cutoff: This is an extremely stringent threshold, demanding near-atomic precision. A Cα atom fitting under this cutoff indicates that the local backbone conformation is modeled with exceptional accuracy. This level of precision is crucial for applications where detailed atomic interactions are important, such as in computational drug discovery or enzymatic mechanism studies. However, requiring this level of accuracy across an entire protein is often unrealistic due to the inherent flexibility of proteins and limitations in current modeling techniques.
2 Ã…ngstrom Cutoff: This threshold remains a marker of high accuracy. It allows for minor deviations in atomic positions while still signifying a correctly modeled local structure. Regions fitting under this cutoff are considered highly reliable. In practice, the 1 Ã… and 2 Ã… cutoffs are often analyzed together to evaluate the high-accuracy core of a protein model.
4 Ångstrom Cutoff: This is a structurally significant cutoff. A Cα atom within 4 Å of its true position typically indicates that the local secondary structure (e.g., alpha-helix, beta-sheet) is correctly placed. This threshold begins to capture the global fold of the protein, forgiving small shifts or rotations of rigid elements while ensuring the overall topology is correct.
8 Ã…ngstrom Cutoff: This lenient threshold captures the overall topological similarity. It identifies residues that are in approximately the correct region of the protein fold, even if their local geometry has significant errors. A model with a high score at 8 Ã… but low scores at stricter cutoffs likely has the correct overall fold but poor local accuracy. This is critical for determining if a model, even if imperfect, can be used for functional inference or to identify distant evolutionary relationships.
The following table summarizes the structural interpretation and significance of each standard cutoff in GDT_TS analysis.
Table 1: Structural Significance of GDT_TS Ã…ngstrom Cutoffs
| Cutoff (Ã…) | Structural Interpretation | Primary Evaluation Focus |
|---|---|---|
| 1 Ã… | Near-atomic precision; local backbone is exceptionally accurate. | Ultra-high local accuracy |
| 2 Ã… | High local accuracy; minor deviations allowed, structure is highly reliable. | High local accuracy |
| 4 Ã… | Correct placement of secondary structure elements; global topology is captured. | Local structure & global topology |
| 8 Ã… | Overall fold is correct; residues are in the approximate correct region. | Global topological similarity |
The power of using this combination of thresholds lies in its ability to provide a nuanced view. For example, a model may have a high 8 Å score, indicating the correct fold, but a low 1 Å score, revealing a lack of atomic-level detail. This guides researchers on the model's suitability for different tasks—whether for understanding broad functional categories or for detailed mechanistic studies. The GDTHA (High Accuracy) metric, which uses smaller cutoffs (typically 0.5, 1, 2, and 4 Å), was developed for CASP to more heavily penalize larger deviations and distinguish between top-performing models where standard GDTTS saturates [1].
Quantitative Data and Application in Model Evaluation
In practice, GDTTS scores are reported as a percentage from 0 to 100, where a higher score indicates a better match to the reference structure. The calculation involves an iterative process of superimposing the model onto the target and finding the largest set of Cα atoms that fall within each distance cutoff. The final GDTTS is the average of these four percentages.
The interpretation of GDTTS scores is well-established in the community. Generally, a GDTTS score above 50 is considered to indicate that the two structures share the same fold, with scores above 90 typically reserved for highly accurate models with only very minor deviations [17]. The performance of modern protein structure prediction tools like AlphaFold2 is often demonstrated by their high GDT_TS scores across a wide range of targets.
The critical role of these thresholds is highlighted by their use in evaluating next-generation structural alignment tools. For instance, a 2024 study on GTalign, a novel algorithm for rapid protein structure alignment and superposition, used the standard GDT cutoffs as a primary benchmark. The study demonstrated that GTalign could identify a larger number of structurally similar protein pairs (i.e., with TM-score ≥ 0.5, a related metric) compared to other aligners like TM-align, by more accurately determining the optimal spatial superposition as measured under these standard distance thresholds [17].
Table 2: Example GDT Score Interpretation Guide (as used in community assessments like CASP)
| GDT_TS Score Range | Qualitative Interpretation | Typical CASP Model Category |
|---|---|---|
| 90 - 100 | Very high accuracy; near-experimental quality. | High Accuracy |
| 70 - 90 | Good overall accuracy; correct fold with some local errors. | Competitive |
| 50 - 70 | Medium accuracy; correct global fold but significant local errors. | Same Fold (Correct) |
| 30 - 50 | Low accuracy; incorrect or significantly distorted fold. | Incorrect Fold |
| 0 - 30 | Very low similarity to the target structure. | Incorrect Fold |
The TM-score, another widely used metric for structural similarity, is closely related to GDT. It is designed to be a length-independent measure, and like GDT, it relies on calculating the fraction of residues under a distance cutoff after optimal superposition, though it uses a variable threshold [17]. The continued development and benchmarking of structural bioinformatics tools against these established distance-based metrics underscore their foundational importance.
Experimental Protocols Leveraging Distance Constraints
Protocol 1: GDT_TS Calculation with LGA
The following protocol outlines the standard method for calculating GDT_TS scores between a predicted model and an experimental reference structure using the Local-Global Alignment (LGA) program, the original and most commonly used software for this purpose [1].
Primary Research Reagent Solutions:
- Software: LGA program package.
- Input Data: Two protein structure files in PDB format: one for the computational model and one for the reference structure.
- System: Unix/Linux command-line environment.
Procedure:
- Data Preparation: Ensure both the model and reference structure files are in the correct PDB format. The sequences should be aligned, meaning the residue correspondences are known (typically, the sequences are identical in CASP-like assessments).
- Software Execution: Run the LGA program from the command line. A typical command for GDTTS calculation is:
The
-d:4.0flag sets one of the distance cutoffs for analysis, but the standard GDTTS calculation is an integral part of LGA's output. - Output Analysis: The LGA output provides a detailed report. The key line for GDTTS is typically labeled "GDTpercent" and lists the percentages of residues under the 1, 2, 4, and 8 Ã… cutoffs, followed by the average of these four values, which is the GDT_TS.
- Interpretation: Analyze the four individual cutoff percentages alongside the total GDT_TS score to understand the distribution of accuracy across the model, from high-precision regions to the broadly correct fold.
The workflow for this structure comparison process is summarized in the diagram below.
Diagram 1: Workflow for GDT_TS Calculation via LGA.
Protocol 2: DEER Spectroscopy for Distance Distributions
DEER spectroscopy provides experimental distance restraints that can be used to validate and refine computational models, creating a direct link to the distance-based philosophy of GDT.
Primary Research Reagent Solutions:
- Spin Label: (1-oxyl-2,2,5,5-tetramethyl-Δ3-pyrroline-3-methyl) methanethiosulfonate (commonly known as MTSL).
- Buffer: Suitable protein buffer, often deuterated and with a cryoprotectant like glycerol-d8 for low-temperature measurements.
- Equipment: Pulsed EPR spectrometer (e.g., Q-band).
Procedure:
- Sample Preparation: a. Site-Directed Mutagenesis: Introduce cysteine residues at two specific sites in the protein of interest. b. Protein Expression and Purification: Express and purify the mutant protein. c. Spin Labeling: Incubate the protein with MTSL to covalently attach the spin label to the cysteine thiol groups. d. Sample Preparation for EPR: Concentrate the labeled protein and transfer into a quartz EPR tube.
- DEER Data Collection: a. Perform the four-pulse DEER experiment at cryogenic temperatures (typically 50-80 K) to measure the dipolar coupling between the two spin labels. b. The recorded signal is a dipolar evolution time trace.
- Data Analysis: a. Process the time trace to extract the dipolar coupling function. b. Use model-free analysis methods like Tikhonov regularization to generate a probability distribution of distances between the two spin labels. c. The output is a distance distribution plot spanning approximately 15 to 80 Ã…, which can reveal multiple peaks corresponding to different conformational states of the protein [14].
- Integration with Computational Modeling: a. The experimental distance distributions are used as restraints in modeling frameworks like ProGuide [14]. b. ProGuide uses iterative biased molecular dynamics simulations, comparing the simulated distance distribution (generated using a rotamer library for the spin label) against the experimental DEER target. c. This process drives backbone rearrangements in the protein model until the simulated ensemble recapitulates the experimental distance data.
The logical flow of using DEER-derived distances for computational refinement is illustrated below.
Diagram 2: Integrating DEER Distance Restraints into Model Refinement.
The Scientist's Toolkit: Essential Materials and Reagents
Table 3: Key Research Reagent Solutions for Distance-Based Structural Analysis
| Tool / Reagent | Function / Application | Relevant Context |
|---|---|---|
| LGA (Local-Global Alignment) Software | Standard software for calculating GDT scores between two protein structures. | GDT_TS Calculation [1] |
| MTSL Spin Label | A thiol-reactive nitroxide radical used for site-directed spin labeling in EPR spectroscopy. | DEER Spectroscopy [14] |
| di-4-ANEPPDHQ Dye | A solvatochromic membrane probe used in spectrally-resolved single-molecule localization microscopy to map membrane lipid order based on its environment. | Mapping Membrane Nano-domains [18] |
| chiLife Rotamer Library | A computational tool for modeling the conformational heterogeneity of spin label side chains attached to a protein. | Interpreting DEER Data in ProGuide [14] |
| ProGuide Modeling Framework | A computational framework that uses DEER distance distributions to guide and generate accurate structural models of proteins. | Integrative Modeling [14] |
| WRN inhibitor 4 | WRN inhibitor 4, MF:C16H14N2O5S, MW:346.4 g/mol | Chemical Reagent |
| (R)-(-)-Ibuprofen-d3 | (R)-(-)-Ibuprofen-d3, MF:C13H18O2, MW:209.30 g/mol | Chemical Reagent |
The 1, 2, 4, and 8 Ã…ngstrom cutoffs employed by the Global Distance Test are more than just arbitrary numbers; they are a sophisticated, multi-scale ruler that has become the lingua franca for evaluating protein structural models. Their strength lies in their ability to provide a composite yet interpretable measure of model quality, from atomic-level details to the overall fold. As structural biology continues to be transformed by computational advances, particularly in deep learning-based prediction, the role of robust, standardized evaluation metrics like GDT_TS becomes ever more critical. Furthermore, the parallel use of distance thresholds in experimental biophysics, as exemplified by DEER spectroscopy and ion-pair analysis, demonstrates a unifying principle in structural biology: spatial distance is a fundamental and powerful parameter for understanding, validating, and refining the architecture of biological macromolecules. The continued development of tools that integrate these experimental distance restraints with computational modeling promises to further enhance the accuracy and reliability of protein structures, with profound implications for basic research and drug development.
The Global Distance Test (GDT) represents a cornerstone metric in structural bioinformatics, specifically developed to address critical limitations in existing protein structure comparison methods. Originally conceived by Adam Zemla at Lawrence Livermore National Laboratory, GDT was introduced to provide a more robust evaluation of protein structure prediction models against experimentally determined reference structures [1]. Its adoption as a primary assessment criterion in the Critical Assessment of Structure Prediction (CASP) experiments, starting with CASP3 in 1998, has established it as the gold standard for quantifying progress in the protein folding field [1] [19]. This technical guide examines GDT's development, algorithmic foundation, and transformative role in enabling the objective, blind testing that culminated in recent breakthroughs such as AlphaFold2 [19] [5].
Prior to GDT's development, Root Mean Square Deviation (RMSD) served as the predominant metric for comparing protein structures. However, RMSD suffers from significant limitations that hampered its effectiveness for assessing protein structure predictions, particularly for partially correct models. RMSD is highly sensitive to outlier regions—sections of the model that are poorly predicted and deviate substantially from the reference structure [1] [2]. A single incorrectly modeled loop region could disproportionately inflate the RMSD, thereby underestimating the quality of the remainder of the model. Furthermore, the interpretation of RMSD values is length-dependent, making cross-target comparisons challenging [2].
The establishment of CASP as a community-wide blind experiment created an urgent need for more nuanced evaluation metrics that could fairly assess model quality across diverse prediction scenarios. This need catalyzed the development of GDT, which was specifically designed to measure the largest set of residues that could be superimposed within a defined distance cutoff, thus providing a more forgiving and informative measure of model accuracy, especially for correct topological folds with local errors [1].
Algorithmic Foundation and Calculation Methodology
Core Mathematical Definition
The fundamental problem GDT addresses is the Largest Well-predicted Subset (LWPS) problem. Given a protein structure A (the experimental target), a model B, and a distance threshold d, the objective is to identify the maximum-sized match set of residue pairs and a corresponding rigid transformation (rotation and translation) that minimizes the distance between corresponding Cα atoms [2]. Formally, for a threshold d, GDT identifies a rigid transformation T that maximizes the number of residues i for which the distance |T(B_i) - A_i| ≤ d [2].
The conventional GDT_TS (Total Score) is computed as the average of the percentages of residues (Cα atoms) that can be superimposed under four distance cutoffs after iterative structural alignment:
GDTTS = (GDTP1 + GDTP2 + GDTP4 + GDT_P8) / 4 [1] [20]
Where GDT_Pn denotes the percentage of residues under distance cutoff ≤ n Ångströms.
Computational Implementation and the LGA Program
The original GDT algorithm is implemented within the Local-Global Alignment (LGA) program [1]. The calculation involves an iterative process of structural superposition and residue matching:
- Initialization: Select starting residue pairs as initial correspondence points.
- Superposition: Calculate the optimal rigid transformation that minimizes the RMSD between the selected residue pairs.
- Transformation Application: Apply the transformation to the entire model structure.
- Matching: Identify all residue pairs within the specified distance cutoff.
- Iteration: Use the matched pairs as new starting points and repeat until convergence.
- Multiple Start Points: The process is repeated from various initial alignments, and the transformation yielding the maximum number of matched residues is selected [2].
For comprehensive assessment, the original GDT algorithm calculates scores for 20 consecutive distance cutoffs from 0.5 Ã… to 10.0 Ã… in 0.5 Ã… increments [1]. The GDT_TS score specifically utilizes the 1, 2, 4, and 8 Ã… cutoffs for its average, providing a balanced measure across multiple precision levels.
Table 1: Standard GDT Score Variants and Their Calculation Parameters
| Score Name | Distance Cutoffs Used (Ã…) | Calculation Formula | Primary Application |
|---|---|---|---|
| GDT_TS (Total Score) | 1, 2, 4, 8 | Average of percentages at 4 cutoffs | Standard model accuracy assessment in CASP [1] [20] |
| GDT_HA (High Accuracy) | 0.5, 1, 2, 4 | Average of percentages at 4 cutoffs | High-accuracy category in CASP; more stringent [1] [20] |
| GDC_SC (Side Chains) | 0.5, 1.0, ..., 5.0 | Weighted average: ( \frac{2 \sum{k=1}^{10} (11-k) \cdot GDC_P{0.5k}}{10 \cdot 11} ) | Side chain accuracy evaluation [20] |
| GDC_ALL (All Atoms) | 0.5, 1.0, ..., 5.0 | Weighted average: ( \frac{2 \sum{k=1}^{10} (11-k) \cdot GDC_P{0.5k}}{10 \cdot 11} ) | Full-atom model evaluation [20] |
Figure 1: Computational workflow for GDT score calculation, illustrating the iterative superposition and matching process implemented in the LGA program.
Integration with CASP and Historical Evolution
Adoption as a Primary Assessment Metric
GDT was first introduced as an evaluation standard in CASP3 (1998), following its development to address RMSD's limitations in handling partially correct models [1] [2]. The metric quickly became established as a principal assessment criterion due to its ability to provide a more comprehensive and forgiving measure of model quality, which was particularly valuable for evaluating the emerging template-based and free-modeling methodologies of the time.
The CASP experiment provided the ideal testing ground for GDT validation, with its rigorous blind testing protocol and independent assessment structure [21]. The Protein Structure Prediction Center serves as the central repository for CASP results, employing GDT_TS as a primary ranking metric in publicly accessible results tables [22] [20].
Algorithmic Refinements and Response to Community Needs
Throughout successive CASP experiments, the GDT metric has evolved through several variants designed to address specific assessment challenges:
- GDT_HA (High Accuracy): Introduced for CASP7, this variant uses stricter distance cutoffs (0.5, 1, 2, and 4 Ã…) to differentiate between high-quality models in the more accurate template-based modeling category [1] [23].
- GDCSC and GDCALL: These extensions were developed to evaluate side-chain and full-atom accuracy, moving beyond the Cα-only focus of traditional GDT [1] [20].
- TR Score: Introduced in CASP8, this modification subtracted penalties for steric clashes to prevent gaming of the GDT measure through artificially compact models [1].
Table 2: Evolution of GDT Metrics Through CASP Experiments
| CASP Edition | Year | Key GDT-Related Developments | Impact on Assessment |
|---|---|---|---|
| CASP3 | 1998 | Introduction of GDT_TS as standard metric [1] | Provided more robust model evaluation than RMSD |
| CASP7 | 2006 | Introduction of GDT_HA for high-accuracy assessment [1] | Enabled differentiation of top-performing models |
| CASP8 | 2008 | Development of TR score and GDC variants [1] | Addressed potential gaming; expanded to side-chain evaluation |
| CASP12-14 | 2016-2020 | Extensive use in documenting deep learning revolution [19] | Quantified extraordinary accuracy improvements (e.g., AlphaFold2) |
Technical Advances and Computational Complexity
Computational Complexity and Optimization
The computation of the optimal GDT score was initially conjectured to be NP-hard, leading to the development of heuristic approaches in the original LGA implementation [2]. However, contrary to this conjecture, research demonstrated that the Largest Well-predicted Subset problem can be solved exactly in polynomial time, albeit with high computational cost (O(nâ·)) that limits practical utility [2].
To address this challenge, approximation algorithms like OptGDT were developed, providing theoretically guaranteed accuracies with more efficient runtime. OptGDT guarantees that for a given threshold d, it finds at least as many matched residue pairs as the optimal solution for a slightly relaxed threshold d/(1+ε), with improved time complexity of O(n³ log n/εâµ) for general proteins and O(n log² n) for globular proteins [2]. Application of OptGDT to CASP8 data demonstrated improved GDT scores for 87.3% of predicted models, with some cases showing improvements of at least 10% in the number of matched residue pairs [2].
Uncertainty Estimation in GDT Scoring
Recent research has addressed the important question of GDTTS uncertainty estimation, recognizing that protein flexibility contributes inherent uncertainty to atomic positions. Studies have quantified GDTTS uncertainty by analyzing structural ensembles from NMR data or generated through time-averaged refinement of X-ray structures [24] [23].
The standard deviation of GDTTS scores increases with decreasing score quality, reaching maximum values of approximately 0.3 for X-ray structures and 1.23 for the more flexible NMR structures [24]. This quantification enables more meaningful comparisons between models with similar GDTTS scores and helps establish statistically significant differences in model quality.
GDT's Role in Documenting the Deep Learning Revolution
The GDTTS metric provided the crucial quantitative framework for measuring the extraordinary progress in protein structure prediction achieved through deep learning approaches. CASP14 (2020) marked a watershed moment, with AlphaFold2 achieving median GDTTS scores that were competitive with experimental structures for a majority of targets [19] [5].
The trend line for CASP14 best models started at a GDTTS of approximately 95 for easy targets and finished at about 85 for the most difficult free-modeling targets, dramatically exceeding performance in previous CASPs and demonstrating that computational predictions could reliably reach experimental accuracy [19]. For approximately two-thirds of CASP14 targets, the best models achieved GDTTS scores above 90, a threshold considered competitive with experimental determination for backbone accuracy [19].
Figure 2: Progression of protein structure prediction accuracy across CASP experiments as quantified by GDT_TS scores, showing the transformative impact of deep learning methodologies.
Table 3: Key Software Tools and Resources for GDT-Based Structure Analysis
| Tool/Resource | Type | Primary Function | Access/Reference |
|---|---|---|---|
| LGA (Local-Global Alignment) | Software Program | Reference implementation for GDT calculation; structural alignment | [1] |
| Protein Structure Prediction Center | Online Database | Repository of CASP results with GDT-based evaluations | predictioncenter.org [22] |
| OptGDT | Software Tool | Computes GDT scores with theoretically guaranteed accuracies | [2] |
| SEnCS Web Server | Online Tool | Estimates GDT_TS uncertainties using structural ensembles | [24] |
| GDTTS, GDTHA, GDC_SC | Assessment Metrics | Standardized scores for backbone, high-accuracy, and side-chain evaluation | [1] [20] |
The development of the Global Distance Test for the Critical Assessment of Structure Prediction represents a seminal advancement in structural bioinformatics. Created specifically to address the limitations of RMSD in evaluating protein structure predictions, GDT has evolved through close integration with the CASP experiment into a sophisticated family of assessment metrics. Its algorithmic development, computational optimization, and uncertainty quantification have provided the rigorous quantitative framework necessary to document one of the most significant achievements in computational biology—the solution of the protein structure prediction problem. As the field progresses toward more challenging targets like multimeric complexes and conformational ensembles, GDT-based metrics continue to provide essential benchmarks for measuring progress in computational structural biology.
From Theory to Practice: Applying GDT in Modern Structural Biology and Drug Discovery
The Critical Assessment of protein Structure Prediction (CASP) is a community-wide, biennial experiment that has objectively tested protein structure prediction methods since 1994 [21]. This blind assessment serves as the definitive benchmark for establishing the state of the art in modeling protein three-dimensional structure from amino acid sequence [22] [21]. CASP functions as a "world championship" in this scientific field, with more than 100 research groups worldwide routinely suspending other research to focus on the competition [21]. The experiment's profound importance was highlighted when Google DeepMind's AlphaFold system, widely considered to have solved the protein structure prediction problem, depended on CASP as the "gold-standard assessment" for the field [25].
Central to CASP's evaluation methodology is the Global Distance Test (GDT), a quantitative measure that compares predicted model α-carbon positions with those in experimentally determined target structures [21]. The GDT score provides an objective, numerical assessment that enables direct comparison of methods across different targets and CASP editions. As Director of the White House Office of Science and Technology Policy Michael Kratsios observed, "What we target is what we measure, and what we measure is what we get more of" [25]. In the context of CASP, the GDT metric has become what the field targets, measures, and consequently improves upon, driving remarkable progress in structural biology over three decades.
The CASP Experimental Framework
The Double-Blind Assessment Protocol
CASP employs a rigorous double-blind protocol to ensure no predictor has prior information about target protein structures [21]. Targets are either structures soon-to-be solved by X-ray crystallography or NMR spectroscopy, or structures recently solved by structural genomics centers and kept on hold by the Protein Data Bank [21]. During each CASP round, organizers post sequences of unknown protein structures on their website, and participating research groups worldwide submit their models within specified deadlines [26]. In the latest CASP15 experiment, approximately 100 groups submitted more than 53,000 models on 127 modeling targets across multiple prediction categories [26].
The CASP organizing committee, including founder and chair John Moult and colleagues from the University of California, Davis, and other institutions, oversees target selection and experimental design [26]. Independent assessors in each prediction category then evaluate the submitted models as experimental coordinates become available, bringing independent insight to the assessment process [26]. This careful separation between prediction and evaluation ensures the objectivity and scientific rigor for which CASP is renowned.
Evolution of CASP Assessment Categories
CASP has continuously adapted its assessment categories to reflect methodological developments and community needs. Table 1 summarizes the core categories in recent CASP experiments.
Table 1: Key CASP Assessment Categories and Their Evolution
| Category | Description | Evolution in CASP |
|---|---|---|
| Single Protein/Domain Modeling | Assesses accuracy of single proteins and domains using established metrics like GDT [26] | Eliminated distinction between template-based and template-free modeling in CASP15; increased emphasis on fine-grained accuracy [26] |
| Assembly | Evaluates modeling of domain-domain, subunit-subunit, and protein-protein interactions [22] [26] | Close collaboration with CAPRI partners; substantial progress expected with deep learning methods [26] |
| Accuracy Estimation | Assesses quality estimation methods for multimeric complexes and inter-subunit interfaces [26] | No longer includes single protein model estimation; increased emphasis on atomic-level self-reported estimates [26] |
| RNA Structures & Complexes | Pilot experiment for RNA models and protein-RNA complexes [26] | Assessment collaboration with RNA-Puzzles and Marta Szachniuk's group [26] |
| Protein-Ligand Complexes | Pilot experiment for ligand binding prediction [26] | High interest due to relevance to drug design; tested on difficult cases with realistic drug-like ligands [27] |
| Contact Prediction | Predicts 3D contacts between residue pairs [22] | Not included in CASP15 despite notable progress in CASP12-13 [22] [26] |
| Refinement | Assesses ability to refine available models toward experimental structure [22] | Dropped in CASP15 [26] |
Recent CASP editions have witnessed a significant evolution in categories, with older categories like refinement and contact prediction being dropped, while new categories for RNA structures, protein-ligand complexes, and protein conformational ensembles have been added [26]. These changes respond to the transformed landscape following the breakthrough success of deep learning methods, particularly AlphaFold2 in CASP14 [26].
The Global Distance Test (GDT): A Technical Examination
Fundamental Principles and Calculation
The Global Distance Test is the primary method for evaluating protein structure predictions in CASP [21]. The GDT score measures the percentage of well-modeled residues in a predicted structure compared to the experimental reference structure. The calculation involves structurally superposing the model onto the target and determining the fraction of Cα atoms (representing residue positions) that fall within a defined distance cutoff of their true positions [21].
The most commonly used variant is GDT-TS (Total Score), which represents the average of four specific distance thresholds: 1Ã…, 2Ã…, 4Ã…, and 8Ã… [21]. This multi-threshold approach provides a balanced assessment that captures both high-precision accuracy (through the tighter thresholds) and overall fold correctness (through the broader thresholds). The mathematical representation can be expressed as:
GDT-TS = (GDTâ‚Ã… + GDTâ‚‚Ã… + GDTâ‚„Ã… + GDT₈Å) / 4
Where each GDTₓÅ represents the percentage of Cα atoms in the model that fall within x Ångströms of their correct positions after optimal superposition.
For high-accuracy assessment, CASP employs GDT-HA (High Accuracy), which uses stricter distance thresholds (0.5Ã…, 1Ã…, 2Ã…, and 4Ã…) to evaluate models that approach experimental resolution [27]. The progression from GDT-TS to GDT-HA in CASP rankings reflects the field's remarkable advances, with AlphaFold2 achieving GDT scores above 90 for approximately two-thirds of targets in CASP14 [22].
GDT Calculation Workflow
The following diagram illustrates the standard workflow for calculating GDT scores in CASP assessment:
Complementary Assessment Metrics
While GDT serves as the primary evaluation metric, CASP employs complementary measures to provide comprehensive assessment. These include:
- Local Distance Difference Test (lDDT): A superposition-free score that evaluates local distance differences of all atoms in a model, including side chains [28]. lDDT is particularly valuable for assessing model quality in regions without structural alignment.
- Template Modeling Score (TM-score): A metric that balances local and global structural similarities, with values between 0 and 1, where scores >0.5 indicate generally correct topology [29].
- Interface Contact Score (ICS/F1): Used specifically for evaluating quaternary structure predictions in the assembly category, measuring accuracy at subunit interfaces [22].
- QS-score: A quality measure for interface accuracy in complex structures, employed by assessment tools like DeepUMQA-X [28].
The transition in CASP15 to emphasize pLDDT (predicted lDDT) for self-reported accuracy estimates reflects the increasing importance of local quality assessment alongside global fold metrics like GDT [26].
GDT in Action: CASP Assessment and Progress Measurement
Quantifying Historical Progress Through GDT
The GDT metric has provided the quantitative foundation for measuring decades of progress in protein structure prediction. CASP assessments have documented remarkable improvements, particularly in recent years with the advent of deep learning approaches. In CASP14 (2020), AlphaFold2 achieved an extraordinary increase in accuracy, with models competitive with experimental accuracy (GDTTS>90) for approximately two-thirds of targets and of high accuracy (GDTTS>80) for nearly 90% of targets [22].
The progress in template-based modeling (TBM) has been equally impressive. CASP14 models for TBM targets significantly surpassed the accuracy achievable by simple template transcription, reaching an average GDTTS of 92, substantially higher than previous CASPs [22]. For the most challenging template-free modeling targets, progress has been even more dramatic, with the best models in CASP13 showing more than 20% increase in backbone accuracy compared to CASP12, with average GDTTS scores rising from 52.9 to 65.7 [22].
Recent CASP Results and GDT Performance
The most recent CASP16 experiment continued to demonstrate the dominance of AlphaFold-based approaches, though with important nuances in GDT interpretation [27]. While official rankings use z-scores that amplify differences between methods, the actual GDT_HA values reveal that top-performing methods are often closely clustered [27]. Table 2 summarizes key performance data from recent CASP experiments.
Table 2: GDT Performance in Recent CASP Experiments
| CASP Edition | Key Methodological Advance | Representative GDT Performance | Assessment Highlights |
|---|---|---|---|
| CASP13 (2018) | Deep learning with predicted contacts and distances [22] | Average GDT_TS=65.7 for free modeling targets (20% increase from CASP12) [22] | First CASP won by AlphaFold; substantial improvement in template-free modeling [22] [21] |
| CASP14 (2020) | AlphaFold2 end-to-end deep learning [22] | GDTTS>90 for ~2/3 of targets; GDTTS>80 for ~90% of targets [22] | Models competitive with experimental accuracy; extraordinary increase in accuracy [22] |
| CASP15 (2022) | Extension of deep learning to multimeric modeling [22] | Accuracy doubled in Interface Contact Score; 1/3 increase in LDDT for complexes [22] | Enormous progress in multimolecular complexes; new categories introduced [22] [26] |
| CASP16 (2024) | Enhanced sampling (MassiveFold) & AlphaFold3 [27] | All domain folds correct; close GDT_HA clustering among top methods [27] | Domain-level prediction reliability established; challenges remain in complex assembly [27] |
Analysis of CASP16 results revealed that while no protein domain was incorrectly folded—demonstrating remarkable reliability at the domain level—the perception of AlphaFold as "perfect" is inaccurate, with many cases where overall topology is correct but the model contains significant local errors [27]. Furthermore, full-chain modeling of large multidomain proteins and complexes, while showing small improvements over CASP15, remains challenging, particularly for very complex topologies without good templates [27].
Key Software and Servers
The protein structure prediction community relies on specialized software tools and servers for method development and assessment. Table 3 catalogs essential resources frequently employed in CASP-related research.
Table 3: Essential Research Reagents and Computational Tools
| Tool/Resource | Type | Primary Function | Application in CASP |
|---|---|---|---|
| AlphaFold2/3 [27] [29] | End-to-end deep learning | Protein structure prediction from sequence | Top-performing method; baseline for comparisons |
| D-I-TASSER [29] | Hybrid deep learning & physics-based | Protein structure prediction with domain splitting | Outperformed AlphaFold2 on single-domain & multidomain proteins in benchmarks |
| DeepUMQA-X [28] | Quality assessment server | Model accuracy estimation for single-chain & complex models | Top performer in CASP16 EMA blind test across multiple tracks |
| LOMETS3 [29] | Meta-threading server | Template identification & fragment assembly | Component of D-I-TASSER pipeline for template recognition |
| MassiveFold [27] | Large-scale sampling | Extensive model generation with parameter diversity | Provided structural diversity for CASP16 participants; enabled better complex predictions |
| Frama-C [30] | Formal verification | Formal verification of C code specifications | Used in creating verified C code dataset for benchmarking (different CASP acronym) |
Experimental Workflow for Method Development
The following diagram illustrates a typical workflow for developing and benchmarking protein structure prediction methods for CASP:
Limitations and Future Directions
Current Challenges and GDT Limitations
Despite its established role, the GDT metric has limitations in capturing all aspects of model quality. GDT primarily focuses on Cα positions and may not fully reflect side-chain accuracy or local geometric quality [28]. This limitation has prompted increased use of complementary metrics like lDDT in recent CASPs [26] [28].
Current challenges in the field include accurate modeling of large multidomain proteins and complexes, particularly without good templates [27]. CASP16 found that even with known stoichiometry, modeling of large multicomponent complexes remains difficult [27]. Additionally, while protein-ligand docking using co-folding approaches showed promise in CASP16, affinity prediction performance was notably poor, with some intrinsic ligand properties correlating better with binding than specialized prediction tools [27].
Evolving Assessment Paradigms
The protein structure prediction field is evolving toward more specialized assessments as domain-level prediction becomes increasingly reliable. New frontiers include:
- Conformational ensembles: Predicting alternative conformations and protein dynamics [26]
- Inverse design: Generating sequences with target structural properties [25]
- Functional annotation: Predicting biological function from structure [31]
- Experimental synthesizability: Assessing practical feasibility of proposed structures [25]
The transformative success of CASP has established a blueprint for benchmarking in scientific AI, inspiring similar initiatives like the TELOS program proposal for commissioning AI grand challenges aligned with national priorities [25]. As the field progresses, GDT and related metrics will continue to provide the quantitative foundation for measuring breakthroughs in protein structure modeling and its applications to drug discovery and biotechnology.
The Global Distance Test (GDT) has served as a cornerstone metric in protein structure prediction for over two decades, providing a more robust alternative to Root Mean Square Deviation (RMSD) for evaluating model quality. This technical guide examines GDT's role in structural biology, detailing its calculation, interpretation across the accuracy spectrum, and application in critical assessments like CASP (Critical Assessment of Structure Prediction). With the advent of deep learning methods such as AlphaFold2 and AlphaFold3, GDT scores now routinely exceed 90 for many targets, yet challenges persist for difficult targets with shallow multiple sequence alignments. This whitepaper provides researchers with a comprehensive framework for interpreting GDT scores, incorporating recent advances from CASP16 evaluations and addressing uncertainty quantification to facilitate more nuanced model evaluation in structural biology and drug discovery applications.
The Global Distance Test (GDT), specifically the GDTTS (total score) variant, represents a fundamental metric for quantifying similarity between protein structures with known amino acid correspondences [1]. Developed by Adam Zemla at Lawrence Livermore National Laboratory, GDT was designed to address limitations of RMSD, which proves overly sensitive to outlier regions that may occur from poor modeling of individual loop regions in otherwise accurate structures [1]. Since its introduction as an evaluation standard in CASP3 (1998), GDTTS has evolved into a major assessment criterion for benchmarking protein structure prediction methods, particularly in the biannual CASP experiments that evaluate state-of-the-art modeling techniques [1] [24].
The significance of GDT in structural biology research stems from its ability to provide a global assessment of model quality that balances local and global features. Unlike RMSD, which can be disproportionately affected by small regions with large errors, GDT measures the largest set of amino acid residues whose Cα atoms fall within defined distance cutoffs after optimal superposition [1]. This approach captures the biological reality that functionally important regions of protein structures often maintain their fold even when peripheral elements deviate substantially. Within the broader thesis of model evaluation research, GDT represents a pragmatic solution to the fundamental challenge of quantifying structural similarity in ways that align with biological significance and practical utility.
Fundamentals of GDT Calculation
Core Algorithmic Principles
The GDT algorithm identifies the largest set of Cα atoms in a model structure that can be superimposed within specified distance thresholds of their positions in a reference (experimentally determined) structure through iterative superposition [1] [32]. The conventional GDT_TS score calculates the average percentage of residues superimposed under four distance cutoffs: 1Å, 2Å, 4Å, and 8Å [1]. The algorithm implementation in tools like LGA (Local-Global Alignment) involves:
- Initialization: Selecting starting points using a sliding window across residue positions
- Iterative superposition: For each window, repeatedly:
- Computing minimal RMSD superposition on the current subset of residue pairs
- Applying the superposition transformation to all model positions
- Calculating pairwise distances between all model and reference positions
- Defining a new subset of residue pairs within the distance threshold
- Convergence check: Continuing until the subset no longer changes
- Maximum identification: Storing the largest subset observed across all iterations and window positions [32]
This method is computationally challenging, with the Largest Well-predicted Subset (LWPS) problem previously conjectured to be NP-hard, though polynomial-time solutions exist with O(nâ·) complexity, making them impractical for routine use [2]. Heuristic approaches like those in LGA and OpenStructure's implementation balance computational efficiency with accuracy, typically achieving results within 2-3 GDT points of optimal values [2] [32].
Workflow Visualization
The following diagram illustrates the generalized GDT calculation workflow as implemented in structural comparison tools:
Interpreting GDT Scores Across the Accuracy Spectrum
Quantitative Interpretation Framework
GDT_TS scores range from 0-100%, with higher values indicating greater similarity to the reference structure [1]. The table below provides a practical framework for interpreting GDT scores across the accuracy spectrum:
| GDT_TS Range | Model Quality Level | Structural Characteristics | Typical Applications |
|---|---|---|---|
| <50 | Incorrect fold | Limited structural similarity to target; potentially different topology | Limited utility; may help identify completely incorrect predictions |
| 50-70 | Correct fold (low accuracy) | Global topology correct but significant local deviations; domain orientations often incorrect | Identifying overall fold family; low-resolution functional annotation |
| 70-80 | Medium accuracy | Core structural elements well-predicted; loop regions and surface features may deviate | Molecular replacement in crystallography; preliminary drug screening |
| 80-90 | High accuracy | Most structural features accurately predicted; side-chain packing generally correct | Detailed functional analysis; ligand docking studies |
| >90 | Very high accuracy | Minimal deviations from reference; approaching experimental accuracy | Detailed mechanistic studies; rational drug design |
In current CASP assessments, top-performing systems achieve average TM-scores of 0.902 (approximately GDTTS >90) for standard domains, with top-1 predictions reaching high accuracy for 73.8% of domains and correct folds (TM-score >0.5, roughly corresponding to GDTTS >50) for 97.6% of domains [33]. For best-of-top-5 predictions, nearly all domains now achieve correct folds, highlighting the remarkable progress in protein structure prediction [33].
GDT Score Variations and Their Interpretations
Several GDT variants provide specialized assessment for different accuracy regimes:
GDTHA (High Accuracy): Uses smaller distance cutoffs (typically half the size of GDTTS) to more heavily penalize larger deviations [1]. This measure becomes particularly important for evaluating high-accuracy models where distinguishing between excellent and exceptional predictions requires more stringent criteria.
GDC_SC (Global Distance Calculation for Side Chains): Extends GDT-like evaluation to side chain positions using predefined "characteristic atoms" near the end of each residue [1]. This provides crucial information for applications requiring accurate surface representation, such as binding site characterization.
GDC_ALL (Global Distance Calculation for All Atoms): Incorporates full-model information rather than just Cα positions [1]. This comprehensive assessment becomes valuable when evaluating models for detailed structural studies.
The GDT_TS to TM-score relationship provides important interpretive context. While both measure structural similarity, TM-score includes length-dependent normalization that makes it more suitable for comparing scores across proteins of different sizes. As a rough guideline, TM-score >0.5 generally indicates correct topology, while TM-score >0.8 suggests high accuracy [33].
GDT in CASP and Current State of the Art
Evolution of Performance Standards
CASP experiments have tracked remarkable progress in structure prediction methodology, with GDT_TS serving as the primary metric for evaluating tertiary structure prediction accuracy. Recent CASP16 results (2024) demonstrate that integrative systems like MULTICOM4, which combine AlphaFold2 and AlphaFold3 with diverse MSA generation and extensive model sampling, can achieve average TM-scores of 0.902 for 84 CASP16 domains [33]. These systems outperformed standard AlphaFold3 implementations, ranking among the top performers out of 120 predictors [33].
The following table summarizes key GDT-related metrics and benchmarks from recent CASP experiments:
| Assessment Metric | Calculation Method | Current Performance Benchmarks | Significance in Evaluation |
|---|---|---|---|
| GDT_TS | Average of percentages at 1Ã…, 2Ã…, 4Ã…, and 8Ã… cutoffs | >90 for standard single-domain proteins | Primary metric for overall structural accuracy |
| Z-score | Standardized score relative to all predictions | Top predictors: cumulative Z-score ~33 (CASP16) | Normalized performance across multiple targets |
| GDT_HA | Average of percentages at 0.5Ã…, 1Ã…, 2Ã…, and 4Ã… cutoffs | Varies significantly with target difficulty | Distinguishes high-accuracy models |
| GDC_SC | Side chain atom superposition accuracy | Emerging metric with increased importance | Critical for functional site prediction |
Addressing Current Challenges
Despite overall progress, significant challenges remain in protein structure prediction, particularly for targets with:
- Shallow or noisy multiple sequence alignments that provide insufficient co-evolutionary information
- Complicated multi-domain architectures with complex inter-domain interactions
- Intrinsically disordered regions that adopt multiple conformations
- Large macromolecular assemblies where quaternary structure introduces additional constraints [33]
For these difficult targets, the primary challenge often shifts from model generation to model selection, as standard AlphaFold self-assessment scores (pLDDT) cannot consistently identify the best models [33]. Advanced quality assessment methods that combine multiple complementary approaches with model clustering have shown improved ranking reliability [33].
Experimental Protocols and Methodologies
Standard GDT Calculation Protocol
Research Reagent Solutions for GDT Analysis:
| Tool/Resource | Type | Primary Function | Access Method |
|---|---|---|---|
| LGA (Local-Global Alignment) | Standalone program | Reference implementation of GDT calculation | Download from Lawrence Livermore National Laboratory |
| OpenStructure GDT Module | Library component | Integrated GDT calculation within structural biology platform | Import via OpenStructure Python API |
| OptGDT | Optimization tool | Computes nearly optimal GDT scores with theoretical guarantees | Download from University of Waterloo |
| SEnCS Web Server | Online service | Estimates GDT_TS uncertainties using structural ensembles | Access via http://prodata.swmed.edu/SEnCS |
Procedure for Calculating GDT_TS:
Input Preparation:
- Obtain reference structure (experimentally determined by X-ray crystallography, NMR, or cryo-EM)
- Obtain model structure(s) for evaluation
- Ensure identical amino acid sequences and residue correspondence
Structure Preprocessing:
- Extract Cα atomic coordinates for both structures
- Verify coordinate formats and structural integrity
- Align sequences if necessary to establish residue correspondence
GDT Calculation:
- Implement sliding window approach (typically window size 7)
- For each window position, perform iterative superposition:
- Compute minimal RMSD transformation for current residue subset
- Apply transformation to all model positions
- Calculate distances between all corresponding Cα atoms
- Identify residues within specified distance threshold
- Update residue subset and repeat until convergence
- Track largest subset size across all iterations
Score Computation:
Advanced Protocol: Estimating GDT Uncertainties
Protein flexibility introduces uncertainty into structural comparisons, necessitating methods to estimate GDT_TS confidence intervals:
NMR Ensemble Method:
- Obtain NMR structure ensemble (typically 20+ conformers)
- Calculate GDT_TS between model and each ensemble member
- Compute mean and standard deviation across the ensemble
- Typical uncertainty: SD up to 1.23 for NMR structures [24]
Time-Averaged X-ray Refinement:
- Select high-resolution X-ray structures (resolution <1.8Ã…)
- Perform time-averaged refinement using phenix.ensemble_refinement
- Generate structural ensembles representing conformational diversity
- Calculate GDT_TS across generated ensemble
- Typical uncertainty: SD up to 0.3 for X-ray structures [24]
These methods demonstrate that GDT_TS uncertainty increases for scores below 50 and 70, highlighting the importance of confidence estimation when comparing models with similar scores [24].
The Global Distance Test remains an essential tool for evaluating protein structural models, providing a robust metric that balances local and global accuracy. As protein structure prediction continues to advance, with methods like AlphaFold2 and AlphaFold3 achieving high accuracy for most single-chain proteins, the role of GDT is evolving toward addressing more challenging frontiers. These include difficult targets with limited evolutionary information, complex multi-domain proteins, and detailed assessment of side chain positioning.
Future developments in GDT-based evaluation will likely focus on several key areas: (1) improved metrics for ultra-high-accuracy models that approach experimental resolution, (2) standardized methods for evaluating structural ensembles and dynamic properties, (3) integrated quality assessment combining GDT with other metrics for more reliable model selection, and (4) specialized assessments for macromolecular complexes and membrane proteins. As these advances materialize, GDT will continue to provide the fundamental quantitative framework for measuring progress in protein structure prediction and establishing reliability standards for biological and pharmaceutical applications.
The accurate evaluation of predicted protein structures is a cornerstone of computational biology, directly impacting research in drug discovery and protein design. For years, the Global Distance Test Total Score (GDTTS) has served as a central metric in the field, particularly within the Critical Assessment of protein Structure Prediction (CASP) experiments [1]. This measure, which calculates the average percentage of Cα atoms that can be superimposed under multiple distance thresholds (1, 2, 4, and 8 Å) after optimal alignment, provides a robust, global measure of backbone accuracy [1] [20]. However, protein function is often dictated by the precise three-dimensional arrangement of side chains, which facilitate critical interactions such as ligand binding, catalysis, and molecular recognition [34]. Recognizing this limitation, the scientific community has developed more granular metrics: the Global Distance Calculation for side chains (GDCsc) and the Global Distance Calculation for all atoms (GDC_all) [1] [35]. These advanced metrics represent a significant evolution in model evaluation, shifting the focus from overall fold correctness to the atomic-level precision required for realistic functional annotation and applied drug development.
Unpacking the Metrics: From GDTTS to GDCsc and GDC_all
The Foundation: GDTTS and GDTHA
The conventional GDTTS metric is defined as the average of the percentages of Cα atoms that can be superimposed under four distance cutoffs [1]: GDTTS = (GDTP1 + GDTP2 + GDTP4 + GDTP8) / 4
A more stringent variant, GDTHA (High Accuracy), uses tighter distance cutoffs to evaluate high-quality models [20]:
GDTHA = (GDTP0.5 + GDTP1 + GDTP2 + GDTP4) / 4
In these formulas, GDT_Pn denotes the percentage of residues under a distance cutoff of n Ångströms [1] [20]. While these metrics are excellent for assessing the overall topology of a protein model, they provide no information about the correctness of side chain placements.
The Next Generation: GDCsc and GDCall
To address the critical need for side chain and all-atom evaluation, GDCsc and GDCall were developed and implemented within the Local-Global Alignment (LGA) program [1] [2].
GDC_sc (Global Distance Calculation for Side Chains): This metric replaces the Cα atom with a predefined "characteristic atom" located near the end of each residue's side chain for distance deviation evaluations [1] [35]. This atom is chosen to be representative of the side chain's overall position and orientation.
GDC_all (Global Distance Calculation for All Atoms): This is the most comprehensive metric, incorporating all heavy atoms of a protein structure into the evaluation, thereby providing a complete picture of atomic-level accuracy [1] [35].
The calculation for these metrics is more complex than that of GDTTS, as it involves a weighted sum over multiple distance cutoffs [20] [35]:
GDC = 100 * 2 * Σ (from n=1 to k) [ (k+1-n) * GDCPn ] / [ k * (k+1) ]
Where k = 10 and GDC_Pn denotes the percentage of residues (for GDCsc) or atoms (for GDCall) under a distance cutoff of 0.5 * n Ångströms [20] [35]. This weighting scheme assigns a higher score to atoms that fit under tighter distance thresholds, emphasizing precision.
Table 1: Comparison of Key Protein Structure Evaluation Metrics
| Metric | Atoms Evaluated | Description | Use Case |
|---|---|---|---|
| GDT_TS | Cα atoms | Average % of Cα under 1, 2, 4, 8 Å cutoffs [1] | Assessing global backbone fold |
| GDT_HA | Cα atoms | Average % of Cα under 0.5, 1, 2, 4 Å cutoffs [20] | Evaluating high-accuracy backbone models |
| GDC_sc | Side chain "characteristic atom" | Weighted score based on residue fitting under 0.5-5 Ã… cutoffs [1] [35] | Assessing side chain packing and orientation |
| GDC_all | All heavy atoms | Weighted score based on atom fitting under 0.5-5 Ã… cutoffs [1] [35] | Comprehensive all-atom model validation |
The Critical Role of GDCsc and GDCall in Model Evaluation
The adoption of GDCsc and GDCall marks a paradigm shift in model evaluation research, moving beyond the backbone to assess the features that directly determine a protein's functional capabilities.
Establishing Functional Relevance
A model with a high GDTTS score may have a correctly folded backbone but incorrectly oriented side chains, rendering it useless for applications like virtual screening or enzyme active site analysis. GDCsc and GDCall directly evaluate the atomic details that underlie biological function. They assess whether a model's side chains form the correct hydrophobic contacts, hydrogen bonds, and salt bridges that are essential for stability and interaction with binding partners [34]. Consequently, a high GDCall score provides much greater confidence that a predicted structure can be reliably used to hypothesize about biological mechanisms or to guide drug design projects.
The CASP Standard
The CASP experiment, the gold-standard community assessment for protein structure prediction, has formally integrated GDCsc and GDCall as standard measures used by its organizers and assessors to evaluate the accuracy of predicted structural models [1]. This official adoption underscores their importance and provides a unified framework for comparing the performance of different prediction methodologies. For researchers participating in CASP or benchmarking their tools against its results, proficiency in these metrics is indispensable.
The All-Atom Imperative in the Age of Advanced Prediction
The need for sophisticated all-atom metrics has become even more pressing with the rise of deep learning models like AlphaFold 2 and 3, and the creation of all-atom datasets like SidechainNet [34]. These tools have pushed the accuracy of backbone predictions to remarkable levels, making the assessment of side chains the new frontier. Furthermore, novel generative models for protein complexes, such as the All-Atom Protein Generative Model (APM), explicitly aim to model inter-chain interactions at the atomic level [36]. Evaluating the output of such models demands metrics like GDC_all that are sensitive to the precise atomic interfaces which dictate binding affinity and specificity.
Experimental Protocols for GDC Analysis
For researchers seeking to implement GDCsc and GDCall in their own evaluation pipelines, the following methodology provides a detailed roadmap.
Prerequisites and Input Data
- Reference Structure: An experimentally determined structure (e.g., from X-ray crystallography, NMR, or cryo-EM) in PDB format.
- Predicted Model: The computational model to be evaluated, also in PDB format, with an identical amino acid sequence to the reference.
- Software: The LGA (Local-Global Alignment) software package, which is the standard tool for calculating GDT and GDC metrics [1].
Step-by-Step Workflow
- Structure Preparation: Ensure both the reference and model structures are clean and contain only the polypeptide chain(s) of interest. Remove heteroatoms (water, ions, ligands) unless they are directly relevant to the analysis.
- Sequence Alignment Verification: Confirm that the sequence of the model perfectly matches that of the reference structure. The GDC algorithm relies on a known amino acid correspondence [1].
- Execute LGA Analysis: Run the LGA program using a command that specifies the GDC analysis. An example command is:
lga -gdc_sc -gdc_all -o output_file model.pdb reference.pdbThe-gdc_scand-gdc_allflags instruct the program to calculate the respective scores. - Interpret Output: The LGA output file will contain the GDCsc and GDCall scores, typically reported as percentages. Closer to 100 indicates a more accurate model. The output will also include the underlying data for the distance cutoffs used in the weighted calculation.
Diagram 1: GDC Evaluation Workflow. This flowchart outlines the key steps for calculating GDC_sc and GDC_all scores using the LGA program.
Table 2: Key Resources for Protein Structure Evaluation
| Resource Name | Type | Function in Evaluation |
|---|---|---|
| LGA (Local-Global Alignment) | Software | The primary program for calculating GDTTS, GDTHA, GDCsc, and GDCall scores through structural superposition [1]. |
| PDB (Protein Data Bank) | Database | Source of experimentally-determined reference structures required for model validation [34]. |
| SidechainNet | Dataset | An all-atom protein structure dataset that extends ProteinNet, providing standardized data for training and evaluating models with sidechain information [34]. |
| CASP Results Portal | Database | Access to official assessment results, including GDC scores, for thousands of models from past experiments, essential for benchmarking [20]. |
| OptGDT | Algorithm | An alternative tool for calculating GDT scores with theoretically guaranteed accuracies, addressing potential underestimation from heuristic methods [2]. |
The development and standardization of GDCsc and GDCall represent a critical advancement in the field of protein model evaluation. By moving beyond the backbone to provide a quantitative assessment of side chain and all-atom accuracy, these metrics offer a much more rigorous and functionally relevant standard for judging predictive models. As computational methods continue to generate increasingly sophisticated structures, the role of GDCsc and GDCall will only grow in importance, ensuring that the models used in basic research and drug development are not just topologically correct, but atomically precise. For researchers, mastering these tools is no longer optional but essential for conducting state-of-the-art protein science.
The Global Distance Test (GDT) is a fundamental metric for quantifying the similarity between protein structures, serving as a cornerstone in the field of computational structural biology. Unlike root-mean-square deviation (RMSD), which can be overly sensitive to outlier regions, GDT provides a more robust assessment by measuring the largest set of Cα atoms in a model structure that fall within a defined distance cutoff of their positions in a reference structure after optimal superposition [1]. The conventional GDT_TS (total score) is the average of the percentages of residues falling under four distance cutoffs: 1, 2, 4, and 8 Å [1]. This metric is a major assessment criterion in community-wide experiments like the Critical Assessment of protein Structure Prediction (CASP), underscoring its importance for evaluating the accuracy of predicted models, particularly for complex protein targets such as G-protein coupled receptors (GPCRs) and other membrane proteins [37] [1].
GDT Fundamentals and Calculation
The GDT algorithm operates by iteratively superimposing two protein structures and calculating the percentage of Cα atoms in the model that lie within a specified distance cutoff from their corresponding atoms in the experimental reference structure. The process involves multiple distance thresholds, providing a more nuanced view of model quality than a single cutoff.
Variations of the GDT metric have been developed to address specific evaluation needs:
- GDTHA: Uses stricter distance cutoffs (typically half those of GDTTS) to assess high-accuracy models more stringently [1].
- GDC_sc: Evaluates side-chain positioning by using characteristic atoms near the end of each residue, moving beyond the Cα-only assessment [1].
- GDC_all: A comprehensive measure that uses full-model atomic information for evaluation [1].
Table 1: Standard GDT Metrics and Their Applications
| Metric | Description | Primary Application |
|---|---|---|
| GDT_TS | Average % of residues under 1, 2, 4, and 8 Ã… cutoffs | General model accuracy assessment in CASP |
| GDT_HA | Uses smaller distance cutoffs (e.g., 0.5, 1, 2, 4 Ã…) | Evaluating high-accuracy models |
| GDC_sc | Measures side-chain positioning accuracy | Assessing atomic-level model quality |
| GDC_all | Uses full atomic coordinates for evaluation | Comprehensive all-atom model assessment |
Case Study: Evaluating GPCR Modeling Strategies with GDT
Benchmarking Deep Learning Approaches for GPCR Drug Discovery
Recent advances in deep learning (DL) have revolutionized GPCR structure prediction, with GDT serving as a key metric for evaluating these improvements. A comprehensive 2022 study benchmarked 70 diverse GPCR complexes bound to either small molecules or peptides, comparing DL-based approaches against traditional template-based modeling (TBM) strategies [37].
The research demonstrated that substantial improvements in docking and virtual screening became possible through advances in DL-based protein structure predictions. Quantitative analysis using GDT and other metrics revealed that DL-based models showed over 30% improvement in success rates compared to the best pre-DL protocols [37]. This performance level approached that of cross-docking on experimental structures, highlighting the rapidly closing gap between prediction and experiment.
Critical success factors identified included:
- Correct functional-state modeling of receptors
- Receptor-flexible docking capabilities
- State-specific modeling strategies that significantly outperformed generic "as-is" approaches [37]
For peptide-binding Class B1 GPCRs with large extracellular domains, the orientation of these domains could only be accurately modeled when using AlphaFold_multimer with G-alpha subunits, rather than the monomeric version of AlphaFold [37].
GDT Analysis of GPCR Functional States
The evaluation of GPCR models heavily relies on GDT to distinguish between active and inactive states, a critical consideration for drug discovery. Research has shown that model accuracy depends significantly on modeling strategies, with active-state binding site accuracy differing by approximately 20% between basic "AF,as-is" approaches and more sophisticated state-specific strategies [37].
For inactive state modeling, the performance gap between different AlphaFold protocols was smaller, though template-biasing ("AF,bias") still slightly outperformed non-biasing approaches [37]. This nuanced understanding of state-dependent modeling accuracy directly impacts structure-based drug design efforts targeting specific GPCR functional states.
Table 2: GPCR Model Quality Across Different Modeling Strategies
| Modeling Strategy | Global TM-score | Binding Site bbRMSD | Key Applications |
|---|---|---|---|
| Template-Based Modeling (TBM) | Baseline | Baseline | Inactive state modeling only |
| AlphaFold, as-is | Moderate improvement | Moderate improvement | General purpose modeling |
| AlphaFold, state-biased | Significant improvement | Significant improvement | State-specific drug design |
| AlphaFold with G-protein | Maximum improvement | Maximum improvement | Active-state complexes, peptide receptors |
Case Study: Membrane Protein Structure Prediction
Rosetta Membrane Protein Prediction
The Rosetta de novo structure prediction method was specifically adapted for helical transmembrane proteins, with specialized energy functions that account for the membrane environment [38]. The method embeds the protein chain into a model membrane represented by parallel planes defining hydrophobic, interface, and polar membrane layers.
In tests on 12 membrane proteins with known structures, Rosetta successfully predicted between 51 and 145 residues with RMSD < 4Ã… from the native structure [38]. The membrane-specific version of Rosetta's low-resolution energy function incorporated:
- Residue-environment interactions based on membrane layer positioning
- Residue-residue interactions optimized for the membrane context
- Membrane-specific burial states that differ from soluble proteins
A key innovation was the finding that sequential addition of helices to a growing chain produced lower energy and more native-like structures than folding the whole chain simultaneously, potentially mimicking aspects of helical protein biogenesis after translocation [38].
Recent Advances in Membrane Protein Modeling
Recent methodologies have further enhanced membrane protein structure prediction. Distance-AF, a method that enhances AlphaFold2 by incorporating distance constraints, demonstrated remarkable performance on challenging targets, reducing the RMSD of structure models to native by an average of 11.75 Ã… compared to standard AlphaFold2 on a test set of 25 targets [12].
The method, which builds upon AF2's architecture, incorporates user-defined distance constraints between Cα atoms as an additional loss term during the structure generation process. This approach proved particularly valuable for:
- Correcting domain orientations in multi-domain proteins
- Modeling active and inactive conformations of GPCRs
- Generating conformational ensembles consistent with NMR data
- Fitting structures into cryo-EM density maps [12]
Distance-AF outperformed both Rosetta and AlphaLink in benchmark tests, with average RMSD values of 4.22 Ã…, 6.40 Ã…, and 14.29 Ã… respectively [12]. The method showed robustness even with approximate distance constraints, maintaining high accuracy with biases of up to 5 Ã….
Experimental Protocols and Methodologies
GPCR Modeling and Docking Protocol
The benchmarked GPCR modeling protocol involved several critical stages [37]:
Dataset Curation: 70 unique GPCR complexes covering 33 unique families in human GPCRs spanning classes A, B1, C, and F, including 38 active-state and 32 inactive-state complexes.
Receptor Modeling Strategies:
- Four types of AlphaFold protocol for active-state modeling
- Two types for inactive-state modeling
- Variation in inputs to account for functional state differences
- Comparison against best-practice TBM from GPCR TBM database
Quality Metrics:
- Overall receptor TM-score for global model quality
- Binding site backbone RMSD (bbRMSD) for local interface accuracy
- GDT values for structural similarity assessment
- Binding site χ angle accuracy for side-chain positioning
Docking Strategies:
- Four docking methods for small molecules
- Four docking methods for peptides
- Evaluation of success rates and virtual screening performance
Molecular Dynamics for GPCR Conformational Sampling
Large-scale molecular dynamics (MD) simulations have provided unprecedented insights into GPCR flexibility and dynamics. A 2025 study generated an extensive dataset capturing the time-resolved dynamics of 190 GPCR structures, with cumulative simulation time exceeding half a millisecond [39].
The protocol included:
- System Preparation: 181 ligand-GPCR complex systems and corresponding apo systems, plus 9 additional apo-only systems
- Simulation Parameters: Each system simulated for 3 × 500 ns, resulting in 1.5 μs per system
- Diversity Coverage: 33 receptor subtypes, with adenosine, adrenoceptors, opioid, muscarinic, orexin and opsins among the most prevalent
- Ligand Types: Antagonists, (partial) agonists, inverse agonists, NAMs, allosteric (ant)agonists, and PAMs
This massive dataset revealed extensive local "breathing" motions of receptors on nano- to microsecond timescales, providing access to numerous previously unexplored conformational states [39]. The analysis demonstrated that receptor flexibility significantly impacts the shape of allosteric drug binding sites, which frequently adopt partially or completely closed states in the absence of molecular modulators.
Table 3: Key Research Tools for GPCR and Membrane Protein Structure Prediction
| Tool/Resource | Type | Function | Application Context |
|---|---|---|---|
| AlphaFold2 | DL Structure Prediction | Protein structure prediction from sequence | General GPCR and membrane protein modeling |
| Rosetta | Molecular Modeling Suite | de novo structure prediction and refinement | Membrane protein specific protocols available |
| GPCRmd | MD Database & Analysis | Curated GPCR molecular dynamics datasets | Access to community-generated simulation data |
| LGA Program | Structure Comparison | GDT calculation and structure alignment | Standardized model evaluation |
| Distance-AF | Enhanced Prediction | AF2 with distance constraints | Modeling specific conformations and states |
| GPCRdb | Specialized Database | GPCR structure and sequence data | Template selection and functional annotation |
The application of GDT in evaluating GPCR and membrane protein models has been instrumental in quantifying the dramatic improvements brought by deep learning approaches. Case studies demonstrate that modern DL-based protocols now achieve success rates approaching those of cross-docking on experimental structures, representing over 30% improvement from pre-DL methodologies [37]. The critical importance of functional-state modeling and receptor-flexible docking highlights the sophisticated requirements for effective drug discovery targeting these important protein families.
As the field progresses, integration of experimental data through methods like Distance-AF [12] and the generation of massive molecular dynamics datasets [39] are providing unprecedented insights into protein dynamics and allosteric mechanisms. These advances, coupled with robust evaluation metrics like GDT, are accelerating structure-based drug design and expanding our understanding of membrane protein structure and function.
The development of AlphaFold represents a paradigm shift in computational biology, largely defined and validated through the rigorous quantitative framework of the Global Distance Test (GDT). This whitepaper examines how AlphaFold's unprecedented GDT scores in the Critical Assessment of Structure Prediction (CASP) experiments demonstrated a level of accuracy previously unattainable in protein structure prediction. We analyze the technical underpinnings of the GDT metric, detail AlphaFold's performance across successive CASP editions, and explore the evolving methodologies for model quality assessment in the post-AlphaFold era. For researchers in structural biology and drug development, understanding this revolution in evaluation metrics is as crucial as understanding the AI breakthroughs themselves.
Proteins, the workhorses of biological systems, spontaneously fold into unique three-dimensional structures that determine their function. For decades, predicting a protein's 3D structure from its amino acid sequence alone—the "protein folding problem"—stood as a grand challenge in computational biology [40]. The experimental determination of structures through techniques like X-ray crystallography or cryo-electron microscopy is time-consuming and expensive, having elucidated around 170,000 structures over 60 years, a mere fraction of the billions of known protein sequences [41].
The Critical Role of the Global Distance Test (GDT)
To objectively measure progress, the field established the Critical Assessment of Structure Prediction (CASP) as a blind, biennial competition. A cornerstone of CASP evaluation is the Global Distance Test (GDT_TS), a measure of similarity between two protein structures with known amino acid sequences but different tertiary structures [1].
Unlike the Root Mean Square Deviation (RMSD), which is sensitive to outlier regions, GDT is intended as a more robust metric. It calculates the largest set of amino acid residues' alpha carbon atoms in a model structure that fall within a defined distance cutoff of their position in the experimental structure after iterative superimposition. The conventional GDTTS (total score) is the average of the percentages of residues superimposed under four distance cutoffs: 1, 2, 4, and 8 Ångströms (Å) [1]. A higher GDTTS score (on a scale of 0-100) indicates a closer approximation to the reference structure.
Table 1: Key Variations of the GDT Metric
| Metric | Calculation Basis | Use Case |
|---|---|---|
| GDT_TS | Average % of Cα atoms within 1, 2, 4, 8 Å | Standard tertiary structure assessment in CASP |
| GDT_HA | Average % at smaller cutoffs (e.g., 0.5, 1, 2, 4 Ã…) | High-accuracy category, penalizes larger deviations |
| GDC_sc | Uses predefined "characteristic atoms" on side chains | Evaluation of residue side chain accuracy |
| GDC_all | Uses full-model atomic information | Most comprehensive all-atom evaluation |
AlphaFold's Unprecedented Performance in CASP
The Initial Breakthrough: AlphaFold at CASP13
DeepMind's first AlphaFold entry (now known as AlphaFold 1) placed first in the overall rankings of CASP13 in December 2018 [41]. Its performance was particularly notable for the most difficult targets, where no existing template structures were available. For these 43 proteins, AlphaFold gave the best prediction for 25, achieving a median GDT score of 58.9, significantly ahead of the next best teams (52.5 and 52.4) [41]. This demonstrated the potential of deep learning to advance the field beyond traditional homology modeling and fragment-based approaches.
The Revolution: AlphaFold2 at CASP14
In November 2020, a completely redesigned system, AlphaFold 2, achieved what the scientific community described as a "transformational" breakthrough at CASP14 [41]. Its accuracy far surpassed any other method, achieving a level of accuracy competitive with experimental structures.
The most staggering metric was its GDT performance: AlphaFold 2 scored above 90 on CASP's GDT for approximately two-thirds of the proteins [41]. For context, a GDT score of approximately 90 is considered competitive with the resolution of some experimental methods, and CASP14 organizers noted that GDT scores of only about 40 could be achieved for the most difficult proteins as recently as 2016 [41]. AlphaFold 2 made the best prediction for 88 out of the 97 CASP14 targets [41].
Table 2: AlphaFold Performance Across CASP Editions
| CASP Edition | AlphaFold Version | Key GDT Achievement | Overall Ranking |
|---|---|---|---|
| CASP13 (2018) | AlphaFold 1 | Median GDT of 58.9 on most difficult targets | 1st |
| CASP14 (2020) | AlphaFold 2 | GDT > 90 for ~2/3 of proteins; best prediction for 88/97 targets | 1st |
| CASP16 (2024) | AlphaFold 3-based systems | Top predictors achieving average TM-score of 0.902 (equivalent to high GDT) | Leading positions |
AlphaFold GDT Evolution: This diagram illustrates AlphaFold's performance leap in CASP experiments and the subsequent shift from monomer to complex assessment.
Technical Deep Dive: GDT Methodology and AlphaFold's Architecture
Computational Foundations of GDT
The GDT algorithm was developed to provide a more meaningful assessment of global fold accuracy than RMSD, which can be disproportionately affected by small regions of high deviation [1]. The core computation involves:
- Iterative Superposition: The model and experimental structures are repeatedly superimposed to find the optimal alignment.
- Distance Cutoff Application: For each of 20 consecutive distance cutoffs (from 0.5 Å to 10.0 Å), the algorithm identifies the maximum set of Cα atoms that fall within the cutoff distance [1].
- Score Calculation: The final GDT_TS is computed as the average of the percentages at four specific cutoffs: 1, 2, 4, and 8 Ã… [1].
While the problem of finding the optimal superposition to maximize the number of residues within a distance cutoff (the Largest Well-predicted Subset problem) was initially conjectured to be NP-hard, it was later shown to be solvable in polynomial time, albeit with computationally expensive algorithms [2].
AlphaFold2's Neural Architecture
AlphaFold 2's remarkable accuracy stemmed from a completely redesigned architecture that differed significantly from its predecessor:
- End-to-End Differentiable Model: Unlike the separately trained modules of AlphaFold 1, AlphaFold 2 implemented an interconnected system of sub-networks trained in an integrated manner [41].
- Evoformer and Structure Module: The network first processes inputs through novel "Evoformer" blocks that exchange information between multiple sequence alignments (MSA) and pair representations. This is followed by a structure module that explicitly represents 3D atomic coordinates [5].
- Iterative Refinement: The system employs a recycling mechanism where outputs are recursively fed back into the same modules, progressively refining the predicted structure and reducing stereochemical violations [41].
AlphaFold2-GDT Evaluation Pipeline: This workflow shows how AlphaFold2 generates structures from sequences and how they are validated using GDT.
Evolving Evaluation in the Post-AlphaFold Era
Beyond Monomers: Assessing Complex Structures
With the release of AlphaFold 3 in 2024, capable of predicting protein complexes with DNA, RNA, ligands, and ions, evaluation metrics have needed to evolve [41]. While GDT remains valuable for tertiary structure assessment, new specialized metrics have gained importance:
- Interface-specific Scores: For protein complexes, metrics focusing on the interaction interface have proven more reliable than global scores [42].
- ipTM and Model Confidence: AlphaFold's predicted interface TM-score (ipTM) and overall model confidence scores have shown excellent discrimination between correct and incorrect predictions of complexes [42].
- Combined Metrics: New weighted scores like C2Qscore have been developed specifically for assessing protein complex model quality [42].
Current Frontiers and Limitations
As of 2025, despite AlphaFold's remarkable achievements, challenges persist:
- Difficult Targets: Proteins with shallow multiple sequence alignments or complicated multi-domain architectures remain challenging [33].
- Model Ranking: For hard targets, selecting the best model from multiple predictions can be more difficult than generating models in the first place [33].
- Data Limitations: AlphaFold is reportedly "running out of data" from public sources, leading pharmaceutical companies to build proprietary versions using their internal structural data [43].
Advanced systems like MULTICOM4 now address these challenges by combining diverse MSA generation, extensive model sampling, and ensemble quality assessment methods. In CASP16 (2024), such systems achieved an average TM-score of 0.902 for 84 domains, with 73.8% of top-1 predictions reaching high accuracy (TM-score > 0.9) [33].
Table 3: Advanced Model Quality Assessment Methods
| Method Category | Examples | Application Context |
|---|---|---|
| Local Quality Scores | pLDDT (AlphaFold's per-residue confidence) | Identifying reliable regions within a predicted model |
| Interface Assessment | ipTM, DockQ | Evaluating accuracy of protein-protein interaction surfaces |
| Composite Scores | C2Qscore (weighted combination) | Overall quality assessment of complex structures |
| Clustering-Based | Model clustering consensus | Selecting representative models from large ensembles |
The Scientist's Toolkit: Essential Research Reagents
Table 4: Key Resources for Protein Structure Prediction and Validation
| Resource/Reagent | Function | Application in Evaluation |
|---|---|---|
| Protein Data Bank (PDB) | Repository of experimentally determined structures | Source of reference structures for GDT calculation |
| AlphaFold Protein Structure Database | Repository of pre-computed AlphaFold predictions | Initial models for structure-based drug design |
| LGA (Local-Global Alignment) Software | Program implementing GDT calculation | Standardized structural comparison and evaluation |
| Multiple Sequence Alignment (MSA) Tools | Generate evolutionary information from sequence databases | Critical input for AlphaFold predictions |
| ChimeraX with PICKLUSTER | Molecular visualization with modeling plugins | Interactive assessment of complex predictions using metrics like C2Qscore |
| AMBER Force Field | Physics-based energy potential | Final refinement step in AlphaFold to ensure physical constraints |
| (Rac)-Bepotastine-d6 | (Rac)-Bepotastine-d6, MF:C21H25ClN2O3, MW:394.9 g/mol | Chemical Reagent |
| C21H19N3O2S | C21H19N3O2S|High-Purity Research Compound | C21H19N3O2S is a high-purity research compound for investigative use. For Research Use Only. Not for human or veterinary diagnostic or therapeutic use. |
The AlphaFold revolution, quantitatively defined by its unprecedented GDT scores, has fundamentally transformed structural biology and drug discovery. The GDT metric provided the rigorous, standardized framework necessary to validate this breakthrough, demonstrating that computational methods could achieve accuracy competitive with experimental approaches for the majority of single-chain proteins.
As the field progresses, evaluation methodologies continue to evolve beyond monomeric GDT scores toward specialized metrics for complexes, interfaces, and functional states. The focus has shifted from merely predicting correct folds to assessing subtle conformational variations and transient interactions critical for drug design. For researchers, understanding this ecosystem of evaluation metrics—their strengths, limitations, and appropriate applications—is essential for leveraging AlphaFold's capabilities to advance scientific discovery and therapeutic development.
The integration of AlphaFold models into drug discovery pipelines, from target identification to lead optimization, represents an ongoing frontier. As metrics become more sophisticated in assessing model quality for specific applications, the confidence in using these computational predictions will only increase, further accelerating the pace of biomedical research.
Navigating Challenges and Advanced Strategies for Optimal GDT Calculation
The Global Distance Test (GDT) is a cornerstone metric in the field of protein structure prediction, serving as a major assessment criterion in the Critical Assessment of Protein Structure Prediction (CASP) experiments since CASP3 in 1998 [1]. Unlike root-mean-square deviation (RMSD), which can be disproportionately affected by outlier regions, GDT provides a more robust measure of structural similarity by calculating the largest set of amino acid residues' alpha carbon atoms in a model structure that fall within a defined distance cutoff of their positions in the experimental structure after iterative superimposition [1]. The conventional GDT_TS (total score) is computed as the average of the maximum percentages of residues that can be superimposed under four distance cutoffs: 1Ã…, 2Ã…, 4Ã…, and 8Ã… [1]. Despite its conceptual simplicity, the computation of optimal GDT scores presents significant computational challenges that have intrigued researchers for decades, driving innovation in algorithmic approaches and approximation strategies within structural bioinformatics.
The Computational Challenge of LWPS
At its core, the calculation of GDT for a given distance threshold can be abstracted as the Largest Well-predicted Subset (LWPS) problem. Given a protein structure A, a model B, and a threshold distance d, the LWPS problem aims to identify the maximum matching set of residue pairs and a corresponding rigid transformation (rotation and translation) that maximizes the number of residue pairs where the distance between their Cα atoms is within the threshold d after superposition [2].
The Polynomial-Time Solvability and Practical Infeasibility
Contrary to initial conjectures that the LWPS problem was NP-hard, it was subsequently shown to be solvable in polynomial time. Specifically, a careful examination of the algorithm for the d-LCP (largest common point sets) problem reveals that the LWPS problem has a polynomial-time solution in O(nâ·), where n is the number of residues [2]. While this establishes the theoretical computability of optimal GDT scores, the high-order polynomial runtime renders this approach impractical for real-world applications. For a typical protein of 300 residues, the O(nâ·) complexity would require an infeasible amount of computational resources, effectively making the exact computation of optimal GDT scores prohibitively expensive for routine use in protein structure evaluation.
Table 1: Computational Complexity of GDT Calculation Approaches
| Algorithm Type | Computational Complexity | Practical Applicability |
|---|---|---|
| Exact Algorithm | O(nâ·) | Theoretically solvable but practically infeasible for all but smallest proteins |
| Distance Approximation | O(n³ log n/εâµ) | Practical for general protein structures |
| Randomized Algorithm | O(n log² n) | Practical for globular proteins with high probability |
Algorithmic Approaches and Methodologies
Approximation Strategies for Practical Computation
Given the computational intractability of optimal GDT calculation, researchers have developed approximation algorithms that provide practically useful solutions with theoretically guaranteed accuracy. The OptGDT tool implements a distance approximation algorithm that guarantees for a given threshold d and parameter ε, it will identify at least â„“' matched residue pairs, where â„“' is the optimal number of matched residue pairs for the relaxed threshold d/(1+ε) [2]. This approach achieves a time complexity of O(n³ log n/εâµ) for general protein structures, making it practically applicable while providing bounds on solution quality.
For globular proteins, which exhibit specific geometric properties that can be exploited algorithmically, the performance can be further enhanced to a randomized algorithm with O(n log² n) runtime with probability at least 1 - O(1/n) [2]. This significant improvement leverages the compact nature of globular proteins, where the radius RA scales with O(n¹/³) rather than O(n) for general proteins, allowing for more efficient spatial partitioning and search strategies.
Filter-and-Refine Strategies in Structural Alignment
Modern approaches to protein structure comparison, including GDT calculation, often employ filter-and-refine strategies to improve computational efficiency. This methodology, implemented in tools like SARST2 for general protein structure alignment, uses rapid filtering mechanisms to discard clearly non-homologous structures before applying more computationally intensive refinement steps [44]. The filter stage typically utilizes linearly encoded structural information, such as secondary structure element sequences or other simplified representations, to quickly eliminate irrelevant candidates. The refinement stage then applies detailed structural alignment algorithms to the remaining candidates to generate accurate similarity scores.
This approach is particularly valuable in the context of massive structural databases like the AlphaFold Database, which contains over 214 million predicted structures [44]. The computational efficiency gained through filter-and-refine strategies enables researchers to perform large-scale structural comparisons even on ordinary personal computers, dramatically expanding accessibility to structural bioinformatics tools.
Protein-Specific Properties and Their Algorithmic Implications
The computational complexity of GDT calculation is significantly influenced by specific geometric and physical properties of protein structures that can be leveraged to design more efficient algorithms:
Spatial Constraints and Compactness
Protein structures exhibit distance constraints between Cα atoms due to steric clashes and chemical bonding requirements. The distance between any two non-consecutive Cα atoms is typically no less than 4Å, while consecutive atoms are approximately 3.8Å apart [2]. These constraints limit the spatial arrangement of atoms and reduce the search space for potential alignments.
Bounded Radii and Exploitable Geometry
General proteins are bounded within a ball with radius RA = O(n), while globular proteins exhibit more compact organization with RA = O(n¹/³) [2]. This compactness enables more efficient algorithmic approaches for globular proteins, as evidenced by the improved O(n log² n) complexity for randomized algorithms targeting this specific class of proteins.
Table 2: Key Research Reagent Solutions in GDT Calculation
| Research Tool | Function | Application Context |
|---|---|---|
| OptGDT | Computes GDT scores with theoretically guaranteed accuracies | Protein structure model evaluation |
| LGA (Local-Global Alignment) | Original implementation of GDT calculation | CASP experiments |
| Phenix Software Suite | Time-averaged refinement for uncertainty estimation | X-ray structure ensemble generation |
| SEnCS Web Server | Produces structure ensembles for NMR and X-ray structures | GDT_TS uncertainty quantification |
Experimental Protocols for GDT Analysis
Standard GDT Calculation Methodology
The experimental protocol for calculating GDT scores follows a well-established workflow:
Input Preparation: Extract Cα atom coordinates from both the reference (experimentally determined) structure and the predicted model structure.
Superposition Generation: Iteratively generate candidate superpositions that maximize the number of residue pairs within specified distance cutoffs. This step involves solving the underlying LWPS problem through approximation algorithms.
Score Calculation: For each standard distance cutoff (1Ã…, 2Ã…, 4Ã…, 8Ã…), calculate the percentage of residue pairs that can be superimposed within the threshold after optimal transformation.
GDTTS Computation: Compute the final GDTTS score as the average of the four percentages obtained at the different distance cutoffs.
Uncertainty Estimation in GDT Scores
Recent methodological advances have focused on quantifying the uncertainty in GDT scores resulting from protein flexibility. Time-averaged refinement for X-ray datasets using tools like phenix.ensemble_refinement can generate structural ensembles that recapitulate the heterogeneous ensembles present in crystal lattices [24]. For NMR structures, which are naturally deposited as ensembles of alternative conformers, uncertainty can be directly estimated from the variation across the ensemble.
The standard deviation of GDT_TS scores increases for lower scores, reaching maximum values of 0.3 and 1.23 for X-ray and NMR structures, respectively [24]. This uncertainty quantification is crucial for properly interpreting differences in GDT scores between models, particularly when scores are close.
Implications for Structure-Based Drug Discovery
The computational demands of optimal GDT calculation have significant implications for drug discovery pipelines that rely on protein structure analysis. While approximate GDT scores provide practical solutions for model evaluation, the computational complexity limits the scale at which exhaustive structural comparisons can be performed. This challenge is particularly acute in virtual screening scenarios where thousands of protein-ligand complexes must be evaluated.
Recent advances in efficient structural alignment search algorithms, such as SARST2, demonstrate promising approaches to this challenge. SARST2 integrates primary, secondary, and tertiary structural features with evolutionary statistics to achieve accurate alignments while completing AlphaFold Database searches significantly faster and with less memory than sequence-based methods like BLAST [44]. Such efficiency gains are crucial for enabling large-scale structural bioinformatics applications in drug discovery.
The computational complexity of optimal GDT calculation stems from the fundamental challenge of identifying maximum matching sets of residue pairs under spatial transformations—a problem that, while solvable in polynomial time, remains practically infeasible for exact solution. The development of sophisticated approximation algorithms with theoretically guaranteed bounds has enabled practical computation of GDT scores, with complexity ranging from O(n³ log n) for general proteins to O(n log² n) for globular proteins. These algorithmic advances, coupled with filter-and-refine strategies and protein-specific geometric optimizations, have made GDT calculation tractable for routine use in protein structure evaluation. However, the underlying computational demands continue to drive innovation in structural bioinformatics, particularly as the field confronts the challenges of massive structural databases generated by AI prediction tools like AlphaFold2. Understanding these computational complexities is essential for proper interpretation of GDT scores and for guiding future developments in protein structure evaluation methodologies.
The Global Distance Test (GDT) is a cornerstone metric for evaluating predicted protein structures, most prominently used in the Critical Assessment of Protein Structure Prediction (CASP) experiments [1]. Unlike simpler metrics like Root Mean Square Deviation (RMSD), which can be unduly influenced by small outlier regions, GDT provides a more robust measure of global similarity by calculating the largest set of residue pairs that can be superimposed under a series of distance thresholds [2] [1]. The conventional GDT_TS score is the average of these percentages at 1Ã…, 2Ã…, 4Ã…, and 8Ã… cutoffs [1]. The central challenge in computational biology is the calculation of this score: finding the optimal rigid-body transformation that maximizes the number of matched residues between a model and a native structure is a complex problem that forces a fundamental trade-off between computational speed and the accuracy of the result [2]. This trade-off is not merely an implementation detail but a critical design decision that influences the reliability of model assessment in fields like computer-aided drug discovery [45]. This paper explores the technical landscape of this trade-off, examining heuristic methods that prioritize speed and exact algorithms that provide guarantees, and frames their evolution within the broader thesis of continuous improvement in protein model evaluation research.
The Core Computational Problem: LWPS and the Quest for Optimality
Defining the LWPS Problem
At its heart, the computation of the GDT score for a given distance threshold is formalized as the Largest Well-predicted Subset (LWPS) problem. Given a protein structure ( A ) (the native structure) and a model ( B ), both consisting of ( n ) points representing Cα atoms, the LWPS problem aims to find a rigid transformation (rotation and translation) that maximizes the number of residue pairs ( (ai, bi) ) where the distance between the superimposed points is less than or equal to a threshold ( d ) [2]. This maximum set is the "well-predicted" subset.
The Historical Conjecture and Its Resolution
For some time, the LWPS problem was conjectured to be NP-hard, which would mean that no efficient algorithm could guarantee an optimal solution for all cases [2]. This belief led to the widespread development and adoption of heuristic methods. These methods, such as those implemented in the Local-Global Alignment (LGA) program, often use iterative RMSD minimization on different starting residue pairs to find a good, but not necessarily optimal, transformation [2] [1]. Contrary to the conjecture, it was later shown that the LWPS problem can be solved exactly in polynomial time, albeit with a high complexity of ( O(n^7) ), rendering it impractical for most real-world applications [2]. This dichotomy—a theoretically solvable problem that is computationally intractable in practice—creates the perfect environment for the speed-accuracy trade-off to flourish.
Navigating the Trade-off: Heuristic and Approximation Strategies
Heuristic Approaches and Their Limitations
Heuristic strategies are designed for speed. They typically operate by selecting a starting set of residue pairs, calculating the transformation that minimizes their RMSD, applying this transformation to the entire model, and then iterating this process with different starting points. The best solution found is reported [2]. While fast, a significant drawback is that these methods often underestimate the true GDT score because the RMSD-minimizing transformation is not always the one that maximizes the number of matched residues under a threshold. The heuristic nature of these methods means they can miss the globally optimal solution [2].
The OptGDT Algorithm: A Balanced Solution
The OptGDT tool represents a sophisticated middle ground, offering a theoretically guaranteed approximation of the optimal score without the prohibitive cost of an exact algorithm [2]. Its core innovation is a distance approximation algorithm for the LWPS problem.
Key Methodology of OptGDT:
- Radial Axis Concept: The algorithm utilizes the geometric concept of a radial axis (the line between a point and the furthest point in the set) to reduce the number of candidate transformations that need to be checked [2].
- Theoretical Guarantee: For a given distance threshold ( d ) and a small constant ( \epsilon > 0 ), OptGDT finds a transformation that matches at least ( \ell' ) residue pairs, where ( \ell' ) is the optimal number of matches possible for a slightly stricter threshold of ( d/(1+\epsilon) ) [2]. This provides a powerful accuracy guarantee.
- Complexity: The general algorithm runs in ( O(n^3 \log n/\epsilon^5) ) time. For globular proteins, this can be improved to a randomized algorithm with ( O(n \log^2 n) ) runtime with high probability, making it highly practical [2].
Impact on CASP8 Data: When applied to models from CASP8, OptGDT improved the GDT scores for 87.3% of predicted models, with some cases seeing an improvement of at least 10% in the number of matched residue pairs [2]. This demonstrates that commonly used heuristic methods systematically underestimate model quality.
The Modern Shift: Deep Learning and GDT Estimation
Recently, the field has seen a paradigm shift with the integration of deep learning. Instead of directly calculating the GDT score via superposition, new methods estimate the score using deep neural networks. These approaches, as seen in CASP14, treat the problem as a model quality assessment (QA) task [46].
Deep Learning Methodology:
- Feature Extraction: For a given protein model, a wide array of features is computed. These include traditional stereo-chemical checks, statistical potentials, and, crucially, inter-residue distance and contact features derived from models and from predictions made by tools like DeepDist [46].
- Image-Based Similarity: A novel approach involves treating the predicted distance map from the protein sequence and the distance map computed from the 3D model as images. Features are then extracted using image similarity descriptors like ORB and PHASH to quantify their agreement [46].
- Network Training: Deep learning models (e.g., ResNetQA) are trained on datasets from previous CASP experiments to predict a normalized GDT-TS score, learning the complex relationship between the extracted features and the actual superposition-based score [46].
This machine learning approach represents a different point on the speed-accuracy trade-off. It replaces a complex computational geometry problem with a fast, learned prediction, achieving state-of-the-art performance in model selection during CASP14 [46].
The following table summarizes the core characteristics of the different approaches to GDT calculation.
Table 1: Comparison of GDT Calculation Methodologies
| Method Type | Key Examples | Theoretical Guarantee | Computational Complexity | Key Advantages | Key Limitations |
|---|---|---|---|---|---|
| Heuristic | LGA [1] | None | Fast (implementation dependent) | • High speed• Widely used | • Can underestimate GDT score• No optimality guarantee |
| Approximation Algorithm | OptGDT [2] | Yes (for relaxed threshold ( d/(1+\epsilon) )) | ( O(n^3 \log n/\epsilon^5) ) (general) | • Provable accuracy bounds• Significant improvements over heuristics | • Slower than heuristics• Theoretical complexity still high |
| Deep Learning (QA) | MULTICOM, DeepAccNet [46] | No (data-driven accuracy) | Fast after training | • Extremely fast at prediction time• Integrates diverse feature sets | • Performance depends on training data• "Black box" prediction |
Experimental Protocols and Workflows
Protocol for Heuristic GDT Calculation (LGA-style)
- Input: Native structure (A), predicted model (B), distance threshold set (e.g., 1, 2, 4, 8 Ã…).
- Initialization: Select an initial set of residue pairs, often based on sequence identity or local proximity.
- Iterative Superposition: a. Calculate the rigid transformation that minimizes the RMSD between the currently selected residue pairs. b. Apply this transformation to the entire model B. c. Identify all residue pairs (ai, bi) that are within the current distance threshold. d. Use this new, larger set as the selected set for the next iteration.
- Termination: Repeat steps 3a-3d until the number of matched residues converges (no longer changes).
- Multiple Starts: Execute the above process from multiple different initial residue sets to avoid local optima.
- Reporting: For each threshold, report the largest number of matched residues found. The final GDT_TS score is the average of these percentages across the key thresholds [2] [1].
Protocol for Approximation-Based GDT (OptGDT)
- Input: Native structure (A), predicted model (B), single distance threshold ( d ), approximation parameter ( \epsilon ).
- Candidate Generation: Generate a set of candidate rigid transformations using the radial axis concept and other geometric constraints, which is proven to include a transformation close to the optimal one.
- Transformation Evaluation: For each candidate transformation, apply it to model B and count the number of residue pairs within the distance threshold ( d ).
- Selection: Select the transformation that yields the highest count.
- Guarantee: The algorithm ensures that this count is at least as high as the optimal count for the stricter threshold ( d/(1+\epsilon) ) [2].
Protocol for Deep Learning-Based GDT Estimation (MULTICOM-style)
- Input: Protein sequence (S), pool of predicted models (M1, M2, ..., Mk) for the target.
- Distance/Contact Prediction: Use a tool like DeepDist to predict an inter-residue distance map from the sequence S.
- Feature Extraction: For each model Mi in the pool: a. Single-model features: Calculate traditional quality scores (e.g., DOPE, RWplus, statistical potentials). b. Distance-based features: Compute the model's distance map (MDM) from its 3D coordinates. c. Comparison features: Calculate similarity metrics (e.g., Pearson correlation, RMSE, image-based descriptors like ORB/PHASH) between the predicted distance map (PDM) and the MDM. d. Multi-model features (optional): Calculate features that compare Mi to other models in the pool (e.g., APOLLO, Pcons).
- Model Inference: Feed the complete feature vector for M_i into a pre-trained deep learning model (e.g., a residual network).
- Output: The network outputs a predicted normalized GDT-TS score for the model [46].
The workflow for the deep learning-based estimation of GDT scores, which integrates multiple feature sources, can be visualized as follows.
The Scientist's Toolkit: Essential Research Reagents
Table 2: Key Software Tools and Resources for GDT-Based Research
| Tool Name | Type | Primary Function | Relevance to GDT & Model Evaluation |
|---|---|---|---|
| LGA [1] | Software Suite | Protein structure comparison | The original benchmark tool for calculating GDT scores using heuristic methods. Essential for baseline comparisons. |
| OptGDT [2] | Algorithm/Tool | Protein structure comparison | Provides a benchmark for high-accuracy GDT scores with theoretical guarantees. Used to validate the performance of faster methods. |
| DeepDist [46] | Prediction Tool | Inter-residue distance prediction | Generates predicted distance maps from amino acid sequences, which are critical features for modern deep learning-based quality assessment. |
| MULTICOM [46] | Model Quality Assessment Platform | Protein model accuracy estimation | A family of deep learning predictors that exemplify the state-of-the-art in estimating GDT scores without direct superposition. |
| CASP Models & Data [1] [46] | Benchmark Dataset | Experimental data and predictions | The gold-standard dataset for training and testing new GDT calculation and estimation methods. Provides a level playing field for comparison. |
| AlphaFold [45] | Structure Prediction System | Protein 3D structure prediction | The context in which modern GDT tools operate. Highly accurate models from AF2 require refined evaluation methods to discern subtle improvements. |
Implications for Drug Discovery and Future Directions
The accuracy of GDT calculation is not an academic exercise; it has tangible implications for structure-based drug discovery (SBDD). For example, studies on G protein-coupled receptor (GPCR) complexes have shown that docking small molecules and peptides into models generated by deep learning systems like AlphaFold can achieve success rates approaching those of cross-docking on experimental structures, but only when the model quality is sufficiently high and correctly assessed [45]. An underestimation of a model's GDT score could lead to the premature rejection of a useful structural model for virtual screening, while an overestimation could waste resources on futile experiments.
Future research in GDT tools will likely focus on several key areas:
- Refining Deep Learning Models: As seen in CASP14, there is still a need for larger training datasets and more effective ways to leverage inter-residue distance information to fully exploit its potential for quality assessment [46].
- Tighter Integration with Prediction: GDT assessment will become more deeply integrated into the structure prediction pipeline, providing real-time feedback to guide model generation.
- Uncertainty Quantification: Developing methods to estimate the uncertainty of a GDT score, especially for flexible proteins or structures determined by NMR, will be crucial for reliable application in drug discovery [1] [47].
The evolution of GDT tools from fast heuristics to approximation algorithms with guarantees, and now to data-driven deep learning estimators, perfectly encapsulates a broader thesis in computational biology: the relentless pursuit of more accurate and informative model evaluation. The trade-off between speed and accuracy remains, but its frontier is constantly being pushed forward. Heuristic methods provide a quick first pass, approximation algorithms like OptGDT offer a gold standard for validation, and deep learning promises instantaneous, accurate estimates by learning the underlying patterns of protein structure. For researchers in academia and drug development, understanding this landscape is critical for selecting the right tool for the task, ultimately ensuring that the assessment of protein models is as robust and insightful as the models themselves.
The Global Distance Test (GDT) is a cornerstone metric for evaluating predicted protein structures, particularly in community-wide assessments like CASP. While highly valuable, conventional GDT calculation methods are heuristic and can underestimate model quality. This whitepaper introduces OptGDT, a polynomial-time algorithm that computes GDT scores with theoretically guaranteed accuracy. We detail its algorithmic foundations, present experimental validation demonstrating significant improvements over heuristic methods, and discuss its implications for robust model evaluation in structural biology and drug development.
The Critical Role of GDT in Model Evaluation Research
The Global Distance Test (GDT), specifically the GDT_TS (Total Score) metric, is a standard measure for quantifying the similarity between a predicted protein structure and its experimentally determined native conformation [1]. Unlike Root Mean Square Deviation (RMSD), which can be disproportionately skewed by small, poorly predicted regions, GDT offers a more holistic assessment by measuring the largest set of residue pairs that can be superimposed under a defined distance cutoff after optimal alignment [2] [1].
The conventional GDTTS score is calculated as the average percentage of matched Cα atoms at four distance thresholds: 1Å, 2Å, 4Å, and 8Å [1]. A higher GDTTS score (on a scale of 0-100%) indicates a model that more closely approximates the native structure. This metric is a principal assessment criterion in the Critical Assessment of Protein Structure Prediction (CASP), guiding progress in the field [2] [1]. Despite its utility, the computation of the optimal GDT score was long conjectured to be an NP-hard problem, leading to the development of heuristic strategies that often result in underestimated scores and potentially misleading model quality assessments [2].
The OptGDT Algorithm: A Theoretical and Practical Advancement
Problem Formulation and Theoretical Foundation
The core computational challenge addressed by OptGDT is the Largest Well-predicted Subset (LWPS) problem. Given a protein structure ( A ), a predicted model ( B ), and a distance threshold ( d ), the LWPS problem aims to find a rigid transformation (rotation and translation) that maximizes the number of residue pairs whose Cα atoms can be superimposed within the threshold ( d ) [2].
Contrary to the NP-hard conjecture, the LWPS problem is solvable in polynomial time, but a straightforward implementation of the exact method has a complexity of ( O(n^7) ), making it prohibitively slow for practical use with typical protein structures [2]. OptGDT circumvents this bottleneck by employing an approximation framework that delivers scores with provable guarantees.
Algorithmic Workflow and Guarantees
OptGDT is a distance approximation algorithm for the LWPS problem. Its key innovation is guaranteeing that for a given threshold ( d ) and a user-defined parameter ( ε > 0 ), the algorithm will identify a number of matched residue pairs, ( ℓ ), that is at least as large as the optimal number of matches, ( ℓ′ ), achievable under a slightly relaxed threshold of ( d/(1 + ε) ) [2].
- Input: Protein structure ( A ), model ( B ), threshold ( d ), approximation parameter ( ε ).
- Output: A rigid transformation and a matching set of residue pairs such that ( ℓ ≥ ℓ′ ).
- Theoretical Complexity: The algorithm runs in ( O(n^3 \log n/ε^5) ) time for general protein structures. For globular proteins, this is enhanced to a randomized algorithm with ( O(n \log^2 n) ) runtime and a success probability of at least ( 1 - O(1/n) ) [2].
The following diagram illustrates the core logical workflow of the OptGDT algorithm.
Experimental Validation and Performance
Methodology for Benchmarking OptGDT
The performance and practical utility of OptGDT were rigorously evaluated using data from the eighth Critical Assessment of Structure Prediction (CASP8) [2]. In this benchmark:
- Dataset: Predicted protein models from CASP8 were used as the test set.
- Baseline for Comparison: The heuristic-based GDT scores originally computed for these models served as the baseline.
- Evaluation Metric: The primary metric was the number of matched residue pairs (( C\alpha ) atoms) found under a specific distance threshold. The performance was measured by the frequency and magnitude of improvement over the heuristic method.
Key Findings and Quantitative Results
The application of OptGDT to the CASP8 data yielded substantial improvements in model evaluation accuracy, as summarized below.
Table 1: Performance Improvement of OptGDT on CASP8 Data
| Performance Metric | Result |
|---|---|
| Models with Improved GDT Score | 87.3% of predicted models |
| Magnitude of Improvement | Up to at least 10% more matched residue pairs in some cases |
These results demonstrate that heuristic methods systematically underestimate the true quality of many predicted models. OptGDT's ability to find a larger set of well-predicted residues provides a more accurate and optimistic assessment, which is crucial for identifying genuinely successful predictions and guiding the development of prediction methods.
Table 2: Algorithmic Comparison: Heuristic vs. OptGDT
| Feature | Conventional Heuristic GDT | OptGDT |
|---|---|---|
| Theoretical Basis | Heuristic (e.g., iterative RMSD minimization) | Approximation algorithm with proven guarantees |
| Optimality Guarantee | No guarantee | Yes (for relaxed threshold ( d/(1+ε) )) |
| Typical Output | Underestimated score | More accurate, higher score |
| Computational Complexity | Varies (often lower but ineffective) | ( O(n^3 \log n/ε^5) ) for general structures |
The Scientist's Toolkit: Essential Components for GDT Research
Table 3: Research Reagent Solutions for Protein Structure Evaluation
| Item | Function in Research |
|---|---|
| OptGDT Software | Core algorithm to compute GDT scores with theoretical accuracy guarantees. Downloaded as a standalone tool. |
| LGA (Local-Global Alignment) | The original program for calculating GDT scores, used as a standard in the field [1]. |
| CASP Data Sets | Benchmark data sets of native structures and prediction models, essential for validating new assessment methods. |
| Native Protein Structures (PDB) | Experimentally determined reference structures (e.g., from X-ray crystallography, NMR, cryo-EM) from the Protein Data Bank (PDB) [11]. |
| AlphaFold2/Distance-AF | State-of-the-art protein structure prediction tools; their outputs are evaluated using metrics like GDT [11]. |
Implications for the Field of Model Evaluation
The development of OptGDT marks a significant shift from heuristic to algorithmically rigorous protein structure assessment. Its impact is multi-faceted:
- More Accurate Model Assessment: By providing theoretically robust scores, OptGDT prevents the premature dismissal of models that are better than heuristic scores suggest. This leads to a fairer and more precise evaluation of protein structure prediction methods [2].
- Enhanced Method Development: Accurate evaluation metrics are crucial for the iterative improvement of prediction tools like AlphaFold2. OptGDT provides more reliable feedback, enabling developers to make finer adjustments to their algorithms [2] [11].
- Foundation for Advanced Applications: High-accuracy structure models are vital for applications such as molecular replacement in crystallography, fitting into cryo-EM maps, and structure-based drug design. Reliably identifying the best models via OptGDT directly accelerates these downstream research areas [11].
The following diagram contextualizes OptGDT within the broader protein structure research and development workflow.
OptGDT represents a fundamental advancement in the computational assessment of protein structural models. By solving the GDT score calculation problem with theoretical guarantees, it addresses a key limitation of previous heuristic approaches. The documented improvements on CASP data underscore its practical value for researchers and scientists who depend on accurate model evaluation to drive progress in structural biology, bioinformatics, and drug development. As the field continues to evolve with tools like AlphaFold2, the role of rigorous, unbiased evaluation metrics like those provided by OptGDT will only grow in importance.
The Global Distance Test (GDT) score serves as a cornerstone metric in the field of protein structure prediction, providing a critical measure of model quality in community-wide assessments like CASP (Critical Assessment of protein Structure Prediction). However, its interpretation is not absolute. This technical analysis demonstrates that a "good" GDT score is inherently contextual, significantly influenced by factors including experimental structure determination method (X-ray crystallography vs. NMR spectroscopy), target difficulty, and inherent protein flexibility. We quantify the uncertainty associated with GDT_TS scores, finding maximum standard deviations of 0.3 for X-ray structures and 1.23 for NMR structures, establishing essential confidence intervals for meaningful model comparison. Furthermore, we detail emerging methodologies that integrate distance constraints to guide predictions for challenging targets, underscoring the metric's evolving role in the post-AlphaFold2 era where research focus shifts toward complex structures, conformational ensembles, and integration with experimental data.
Since its adoption in CASP3 (1998), the Global Distance Test (GDTTS) has been a principal metric for evaluating protein structure prediction accuracy, valued for its tolerance to localized errors that would inflate root-mean-square deviation (RMSD) [23]. The GDT algorithm identifies the optimal superposition between a prediction and a native structure, calculating the average percentage of residue pairs that fall within four distance thresholds (1Ã…, 2Ã…, 4Ã…, and 8Ã…) [23]. A higher GDTTS score (on a scale of 0-100) indicates a model closer to the native structure.
Despite its standardized calculation, a raw GDT_TS score alone is an insufficient indicator of model quality. The protein structure prediction field has reached an inflection point; with AlphaFold2 achieving a median GDT of 92.4 in CASP14, the problem for single-domain proteins is largely considered solved [48]. Consequently, the research community's focus is shifting toward more complex challenges: protein complexes, multi-domain proteins with flexible linkers, and proteins adopting multiple biological conformations [11] [49]. In this new landscape, interpreting GDT scores requires a nuanced understanding of the underlying protein type, experimental data, and biological context. This guide provides researchers with the framework to perform this nuanced evaluation.
Quantifying Uncertainty in GDT Scores
A critical yet often overlooked aspect of GDT scores is their inherent uncertainty, which arises from the dynamic nature of proteins themselves. Protein structures are not static; they exist as ensembles of conformational states, and this flexibility introduces variability into any single structural comparison [23].
Uncertainty from Experimental Methods
The method used to determine the experimental "native" structure significantly influences GDT score uncertainty:
- Nuclear Magnetic Resonance (NMR): NMR structures are naturally deposited as ensembles of alternative conformers, directly reflecting structural flexibility and refinement uncertainty. Analysis of CASP NMR targets reveals that the standard deviation (SD) of GDT_TS scores increases for scores lower than 50 and 70, reaching a maximum SD of 1.23 [23].
- X-ray Crystallography: Standard X-ray refinement produces a single, static structure averaged over time and space. To recapitulate structural heterogeneity, time-averaged refinement can generate ensembles for uncertainty analysis. For these ensembles, the maximum GDT_TS SD is notably lower at 0.3 [23].
Table 1: Uncertainty of GDT_TS Scores by Experimental Method
| Experimental Method | Source of Uncertainty | Maximum Standard Deviation (SD) of GDT_TS |
|---|---|---|
| X-ray Crystallography | Structural heterogeneity in crystal lattice; estimated via time-averaged refinement. | 0.3 |
| NMR Spectroscopy | Combination of protein dynamics and uncertainty in NMR refinement. | 1.23 |
| Â | Â | Â |
These standard deviations provide crucial confidence intervals. For example, a score difference smaller than the relevant SD may not be statistically significant, fundamentally altering how researchers rank and select models.
The Scientist's Toolkit: Key Reagents for Uncertainty Analysis
Table 2: Essential Research Reagents and Tools for GDT Uncertainty and Advanced Modeling
| Reagent / Tool | Function in Research |
|---|---|
| Phenix Software Suite | Provides the phenix.ensemble_refinement module for performing time-averaged refinement on X-ray datasets to generate structural ensembles [23]. |
| SEnCS Web Server | A user-friendly server that produces structure ensembles for both NMR and X-ray structures, facilitating the estimation of standard deviations for any scores [23]. |
| LGA Structural Aligner | A robust algorithm used for sequence-independent and sequence-dependent structural superposition, which is central to calculating GDTTS and GDTHA scores [23]. |
| Distance-AF Software | A deep learning-based method built upon AlphaFold2 that incorporates user-specified distance constraints into the loss function to guide prediction toward desired conformations [11]. |
Protein-Specific Challenges and GDT Score Interpretation
Multi-Domain Proteins and Flexible Regions
AlphaFold2 often correctly predicts individual domain structures but fails to capture their relative orientations, especially when connected by flexible linkers [11]. For such targets, a high GDT_TS score for individual domains may mask a globally incorrect model. The accuracy estimation problem has thus shifted, with research focus moving "to estimation of model accuracy of protein complexes" [49]. In these cases, a "good" score must be interpreted in conjunction with additional data, such as cryo-electron microscopy maps or cross-linking data, to validate the overall topology.
Modeling Multiple Biological Conformations
Proteins like G protein-coupled receptors (GPCRs) adopt distinct active and inactive states [11]. AF2 is designed to predict a single, static conformation, making it challenging to model alternative biologically relevant states [11]. A model with a moderate GDT_TS score might actually represent a correct, but alternative, biological conformation rather than an incorrect prediction. Evaluating such models requires moving beyond a single GDT score and toward generating and validating conformational ensembles.
Advanced Protocols: Integrating Constraints for Improved Modeling
For difficult targets where standard prediction fails, integrating experimental or hypothesized distance constraints is a powerful strategy. The following protocol details the methodology for one such advanced approach.
Experimental Protocol: Incorporating Distance Constraints with Distance-AF
Distance-AF is a method that builds upon AF2 to improve predictions by incorporating spatial constraints, which can be derived from cryo-EM, NMR, cross-linking mass spectrometry, or biological hypotheses [11].
1. Input Preparation:
- Query Sequence: The amino acid sequence of the target protein.
- Multiple Sequence Alignment (MSA): Constructed from the Uniref30 database [11].
- Distance Constraints: A user-specified list of residue pairs and their target Cα-Cα distances (e.g., derived from experimental data or domain proximity requirements).
2. Model Architecture and Overfitting:
- The Evoformer module from AF2 is used to generate single and pair representations from the MSA [11].
- The structure module then predicts 3D coordinates. Crucially, Distance-AF employs an overfitting mechanism; it iteratively updates the network parameters starting from the original AF2 weights, without pre-training, to force the output to satisfy the provided constraints [11].
3. Loss Function and Iterative Optimization:
- The total loss function (
L) is a weighted sum of several terms, including the FAPE loss (for protein-like geometry), an angle loss, and violation terms [11]. - The key addition is the distance-constraint loss (
L_dis), calculated as the mean squared error between the user-specified distances (d_i) and the distances measured in the predicted structure (d_i'):L_dis = (1/N) * Σ (d_i - d_i')^2[11] - The weight given to the distance-constraint loss is dynamically adjusted based on its current value, ensuring effective guidance during optimization [11].
4. Output:
- The final output is a 3D structure model that satisfies the provided distance constraints while maintaining proper protein geometry.
Diagram 1: Distance-AF Workflow
Benchmarking Performance
Distance-AF demonstrates a remarkable ability to correct large-scale errors in domain packing. In a benchmark test on 25 targets, Distance-AF reduced the RMSD to the native structure by an average of 11.75 Ã… compared to standard AlphaFold2 models. It outperformed other constraint-based methods, achieving an average RMSD of 4.22 Ã…, compared to 6.40 Ã… for Rosetta and 14.29 Ã… for AlphaLink [11].
Table 3: Performance Comparison of Constraint-Based Modeling Methods
| Method | Average RMSD (Ã…) | Key Mechanism |
|---|---|---|
| AlphaFold2 (Baseline) | ~15.97* | Standard prediction without constraints. |
| Distance-AF | 4.22 | Distance constraints added as a loss function term; overfitting. |
| Rosetta | 6.40 | Not specified in search results. |
| AlphaLink | 14.29 | Integrates cross-linking restraints into pair representations. |
| Â | Â | Â |
*Calculated from data in [11]: 4.22 Ã… + 11.75 Ã… reduction = ~15.97 Ã… baseline.
The Evolving Future of GDT in a Post-AlphaFold2 Landscape
The role of GDT is evolving from a primary benchmark for monomer accuracy to a component within a broader toolkit for assessing complex structures. Key future directions include:
- Assessment of Complexes: New metrics and methods are needed to evaluate the topology (global score), interface quality (total and residue-wise scores), and tertiary interactions within protein complexes [49].
- Validation of Conformational Ensembles: As methods like Distance-AF are used to generate ensembles satisfying NMR data [11], GDT-based scores will be applied across multiple conformations, requiring statistical frameworks for interpretation.
- Integration with Experimental Data: The line between prediction and experimental determination is blurring. GDT scores will increasingly be used to measure how well a computationally generated model fits experimental density maps or satisfies spectroscopic constraints.
Interpreting a "good" GDT score requires a deep understanding of context. Researchers must account for the uncertainty inherent in the experimental native structure, the particular challenges of the protein target (e.g., multi-domain architecture, inherent flexibility), and the biological question at hand. The future of model evaluation lies not in relying on a single point estimate of GDT_TS, but in leveraging it as one element of a multifaceted validation strategy that integrates uncertainty quantification, experimental constraints, and specialized metrics for complex structures. This contextual approach is key to advancing the field toward solving the next generation of challenges in structural biology.
GDT in Context: A Comparative Analysis with RMSD, TM-score, and LDDT
In the field of computational structural biology, the quantitative evaluation of protein models is foundational to advancing research in protein folding, function prediction, and drug discovery. Within this context, the Global Distance Test (GDT) and Root Mean Square Deviation (RMSD) have emerged as two pivotal metrics for assessing the global similarity between three-dimensional protein structures. RMSD, one of the oldest and most widely recognized measures, calculates the average distance between corresponding atoms after optimal superposition [10] [50]. In contrast, GDT, developed to address specific limitations of RMSD, quantifies the largest set of amino acid residues that can be superimposed under a series of successive distance thresholds [13] [51]. This whitepaper provides an in-depth, technical comparison of these two metrics, framing their roles within the broader thesis that GDT offers a more biologically relevant and robust framework for model evaluation, particularly in large-scale assessment campaigns like the Critical Assessment of protein Structure Prediction (CASP).
Theoretical Foundations and Mathematical Definitions
Root Mean Square Deviation (RMSD)
The RMSD is a standard measure of the average distance between the atoms of two optimally superimposed structures. For two sets of coordinates, typically the backbone Cα atoms, the RMSD is defined as:
RMSD = √[ (1/N) × Σ(δ_i)² ]
Where:
- N is the number of equivalent atoms being compared.
- δ_i is the distance between the i-th pair of equivalent atoms after optimal rigid-body superposition [10] [50].
The calculation requires finding the optimal rotation and translation that minimizes this value, often achieved through algorithms like Kabsch [50] or modern, differentiable methods using Lie algebra [52].
Global Distance Test (GDT)
The GDT score is a more sophisticated measure designed to find the largest subset of Cα atoms that can be superimposed under a defined distance cutoff. Unlike RMSD, it is typically reported as a percentage. The most common variant, GDT-TS (Total Score), is the average of four specific measurements:
GDT-TS = (GDTP1 + GDTP2 + GDTP4 + GDTP8) / 4
Where GDT_Pn is the percentage of residue pairs under a distance cutoff of n Ångströms [13] [53]. This multi-threshold approach provides a more nuanced view of structural similarity across different spatial scales.
Comparative Analysis: Core Properties and Performance
The following table summarizes the fundamental differences between RMSD and GDT.
Table 1: Fundamental characteristics of RMSD and GDT
| Characteristic | RMSD | GDT (GDT-TS) |
|---|---|---|
| Core Concept | Average distance between equivalent atoms | Largest superimposable subset of residues at given cutoffs |
| Mathematical Type | Average (Ångströms) | Percentage (%) |
| Sensitivity to Outliers | High (dominated by largest deviations) [10] | Low (focuses on conserved core) |
| Handling of Flexibility | Poor; global measure penalizes flexible regions [10] | Good; identifies well-predicted core regardless of flexible parts |
| Dependence on Length | Strong; tends to increase with protein length [51] | Weak; normalized by length, more robust for comparisons |
| Intuitive Interpretation | "0" is perfect; lower values are better, but no upper bound | "100" is perfect; higher values are better, range is 0-100 |
Performance and Biological Relevance
The performance and interpretation of these metrics are critical for evaluating model quality.
Table 2: Performance and interpretation of RMSD and GDT scores
| Metric | Value Range | Interpretation / Performance Grade |
|---|---|---|
| RMSD (Ã…) | < 2.0 Ã… | High accuracy; structures are very similar [13] |
| 2.0 - 4.0 Ã… | Medium accuracy; acceptable depending on task and region [13] | |
| > 4.0 Ã… | Low accuracy; structures are very different [13] | |
| GDT-TS (%) | > 90% | High accuracy; closely matching structures [13] |
| 50% - 90% | Medium accuracy; can be acceptable depending on the task [13] | |
| < 50% | Low accuracy; poor, unreliable prediction [13] |
A key weakness of RMSD is its sensitivity to local errors. As noted in structural comparisons, "the global RMSD, is shown to be the least representative of the degree of structural similarity because it is dominated by the largest error" [10]. This makes it a poor indicator of global fold correctness when localized regions, such as flexible loops or termini, are poorly modeled. GDT, by focusing on the maximal superimposable core, inherently filters out these localized errors, providing a score that often correlates better with a model's overall topological correctness [51].
Experimental Protocols and Applications in Model Evaluation
The practical application of GDT and RMSD is best illustrated through community-wide blind assessments, which serve as the gold standard for evaluating methodological progress.
Standard Protocol for Structure Comparison
A typical workflow for comparing a computational model against an experimental reference structure involves:
- Input Structures: A predicted model and an experimentally determined reference structure (e.g., from the Protein Data Bank).
- Residue Correspondence: Establishment of a one-to-one residue mapping, typically based on sequence identity.
- Optimal Superposition:
- For RMSD: The Kabsch algorithm (or equivalent) is used to find the rotation and translation that minimizes the RMSD between all corresponding Cα atoms [50] [52].
- For GDT: A more complex search is performed to find the optimal superposition that maximizes the number of Cα pairs within a defined distance cutoff (e.g., 1, 2, 4, and 8 Å) [51].
- Calculation & Output:
- RMSD is computed as the square root of the average of squared distances.
- GDT-TS is calculated as the average of the percentages of residues under the four distance cutoffs.
CASP: The Benchmarking Environment
The Critical Assessment of protein Structure Prediction (CASP) is a biennial community experiment that rigorously tests protein structure prediction methods in a blind setting [10]. Within CASP, both RMSD and GDT are employed, but GDT has taken a central role as a primary evaluation metric. Its development and adoption were driven by the need for a measure that more consistently reflects the biological usefulness of a model, especially when comparing predictions for proteins of different sizes and flexibilities [51]. The use of GDT in CASP has been instrumental in tracking progress in the field, including the recent breakthroughs achieved by deep learning systems like AlphaFold2 [13].
The following table lists key software tools and resources essential for calculating and interpreting GDT and RMSD.
Table 3: Research Reagent Solutions for Structural Comparison
| Tool / Resource | Type | Primary Function | Relevance to GDT/RMSD |
|---|---|---|---|
| LGA (Local-Global Alignment) | Software/Algorithm | Structure alignment and comparison | Calculates GDT and RMSD; widely used in CASP [10] |
| MAMMOTH | Software/Algorithm | Structural alignment and comparison | Robust for comparing low-resolution models; uses MaxSub, related to GDT [51] |
| MODELLER | Software Suite | Comparative protein structure modeling | Generates models that require evaluation with GDT/RMSD |
| PyMOL | Visualization Software | Molecular graphics | Visualizes structural alignments and outputs RMSD |
| PyRosetta | Software Suite | Macromolecular modeling | Used for structure prediction and refinement; includes metrics for evaluation |
| spyrmsd | Python Library | RMSD calculation | Calculates symmetry-corrected RMSDs for ligands [9] |
| PDB (Protein Data Bank) | Database | Experimental structures | Source of reference structures for comparison [53] |
Within the broader thesis of model evaluation research, the comparison between GDT and RMSD reveals a clear evolutionary path. While RMSD remains a valuable, intuitive metric for assessing local, high-resolution accuracy, its susceptibility to outliers and poor handling of flexibility limit its utility as a sole measure of global fold correctness. The Global Distance Test was developed specifically to overcome these limitations. By focusing on the largest conserved structural core across multiple distance thresholds, GDT provides a more robust, biologically relevant, and statistically stable measure of overall structural similarity. Its central role in initiatives like CASP has cemented GDT as a cornerstone metric for driving progress in the field, enabling a more nuanced and meaningful evaluation of computational models that ultimately accelerates research in structural biology and drug discovery.
The evaluation of protein structural models against experimentally determined references is a cornerstone of structural biology, directly impacting the progress of fields ranging from drug discovery to functional annotation. For over two decades, the Global Distance TestTotal Score (GDTTS) has served as a central metric in community-wide assessments like CASP (Critical Assessment of protein Structure Prediction). However, a single metric cannot fully capture the multi-faceted nature of structural similarity. This has led to the development and adoption of complementary measures, most notably the Template Modeling score (TM-score) and the Local Distance Difference Test (lDDT). This whitepaper provides an in-depth technical guide to these three core metrics, delineating their methodologies, inherent strengths, and weaknesses. Framed within the broader thesis of GDT_TS's role in model evaluation research, we provide a clear framework to help researchers select the optimal metric—or combination of metrics—based on their specific scientific question, whether it involves assessing global fold capture, local atomic accuracy, or models of dynamic systems.
The development of objective, quantitative metrics for comparing protein structures is fundamental to the advancement of structural bioinformatics. The Global Distance Test (GDT) was developed at Lawrence Livermore National Laboratory to address limitations of the simpler Root-Mean-Square Deviation (RMSD), which is highly sensitive to outlier regions in otherwise reasonable models [1]. Introduced as a major assessment standard in CASP3, GDTTS has since become a primary benchmark for evaluating the performance of protein structure prediction methods in these blind experiments [1] [54]. Its design philosophy is agreement-based: it quantifies the largest set of residues in a model that can be superimposed onto a reference structure within a defined distance cutoff, iteratively optimizing the superposition for each cutoff [1]. The conventional GDTTS is the average of the percentages of Cα atoms that fit under four distance thresholds: 1, 2, 4, and 8 Å [1] [20].
Despite its entrenched role, the CASP assessment process itself has recognized that a well-rounded evaluation requires multiple, conceptually different measures [54] [55]. This necessity arises from the intrinsic multi-parametric nature of protein structure comparison. In response, metrics like TM-score and lDDT were developed to address specific blind spots:
- TM-score was designed to provide a more accurate measure of global fold similarity than RMSD, with a scoring range that is interpretable and less dependent on protein length [56] [57].
- lDDT was created as a superposition-free measure that evaluates local distance differences of all atoms, making it uniquely suited for assessing local atomic details and models of multi-domain proteins with flexible regions [58] [59].
The evolution of these metrics mirrors the progress in the prediction field itself. As models have become more accurate, the focus of assessment has expanded from merely identifying the correct fold to evaluating the atomic-level details critical for biomedical applications like drug design [59] [55].
Core Metric Methodologies and Experimental Protocols
GDTTS (Global Distance TestTotal Score)
Calculation Protocol: The GDT_TS algorithm seeks to find the largest set of corresponding Cα atoms in the model that lie within a defined distance cutoff of the experimental reference structure. The protocol involves the following steps [1]:
- Input: A model structure and a reference structure with known amino acid correspondence (e.g., identical sequences).
- Iterative Superposition: For each of a series of distance cutoffs, the algorithm performs an iterative superposition to find the optimal rotation and translation that maximizes the number of Cα atom pairs within that cutoff.
- Percentage Calculation: For each cutoff distance, the algorithm calculates the percentage of residues (P) whose Cα atoms can be superimposed within the cutoff: P = (Number of residues within cutoff / Total number of residues in reference) × 100.
- Averaging: The final GDTTS score is computed as the average of the percentages obtained at four specific cutoffs: 1, 2, 4, and 8 Ã…. GDTTS = (P1 + P2 + P4 + P8) / 4 [20].
A "high-accuracy" variant, GDTHA, uses more stringent cutoffs (0.5, 1, 2, and 4 Ã…) to more heavily penalize larger deviations and is used for evaluating high-quality models [1] [20]. Extensions like GDCSC and GDC_ALL have been developed to evaluate side-chain and all-atom accuracy, respectively [1] [20].
TM-score (Template Modeling Score)
Calculation Protocol: TM-score is a superposition-based metric that measures global fold similarity. Its calculation normalizes distance differences in a way that makes the score less sensitive to local errors and more indicative of the overall topological similarity [56] [57].
- Input: Two protein structures (model and reference).
- Optimal Superposition: The algorithm finds the optimal superposition that maximizes the TM-score, defined by the equation:
TM-score = max[ 1/L_target * Σ_i^L_common 1 / (1 + (d_i / d_0(L_target))^2 ) ]
where:
- Ltarget is the length of the target (reference) protein.
- Lcommon is the number of residue pairs aligned in the superposition.
- di is the distance between the i-th pair of Cα atoms after superposition.
- d0(Ltarget) = 1.24 * ∛(Ltarget - 15) - 1.8 is a length-scale normalization factor that sets the expected distance for random protein pairs [57].
- Interpretation: The score ranges between (0,1], where 1 indicates a perfect match. A score > 0.5 indicates generally the same fold in SCOP/CATH, while a score < 0.17 corresponds to randomly chosen unrelated proteins [56].
lDDT (local Distance Difference Test)
Calculation Protocol: lDDT is a superposition-free score, meaning it does not require a global rigid-body alignment of the two structures. This makes it inherently robust for comparing structures with domain movements [58] [59].
- Input: A model structure and a reference structure (or an ensemble of reference structures).
- Reference Distance Set: For the reference structure, all pairs of non-bonded atoms (default: within a 15 Ã… inclusion radius) are identified. This defines a set of local distances, L.
- Distance Comparison: For each atom pair in the reference set L, the corresponding distance is calculated in the model structure. A distance is considered "preserved" if the difference between the model and reference distances is within one of four tolerance thresholds: 0.5, 1, 2, and 4 Ã….
- Scoring: The score is calculated for each threshold as the fraction of preserved distances. The final lDDT is the average of these four fractions. It can be computed for all atoms (default) or subsets like backbone or Cα atoms only [58] [59].
Table 1: Core Methodological Differences Between GDT_TS, TM-score, and lDDT
| Feature | GDT_TS | TM-score | lDDT |
|---|---|---|---|
| Core Principle | Agreement-based: Max % of residues within cutoffs | Distance-weighted, length-normalized similarity | Superposition-free local distance difference test |
| Atoms Used | Cα atoms | Cα atoms | All atoms (default) or subsets |
| Superposition | Yes, iterative for each cutoff | Yes, single optimal superposition | No |
| Key Parameters | Cutoffs: 1, 2, 4, 8 Ã… | Length-dependent scale factor dâ‚€ | Inclusion radius (15 Ã…), tolerance thresholds (0.5, 1, 2, 4 Ã…) |
| Handling Domain Movements | Sensitive; dominated by largest domain | Sensitive; global superposition | Robust; local comparisons are independent |
| Primary Strength | Intuitive for residue-level coverage | Excellent global fold assessor, interpretable range | Assesses local & side-chain accuracy, works with ensembles |
A Comparative Analysis of Metric Performance and Properties
A comprehensive analysis of scores performed on data from CASP10-12 revealed that while these metrics are often correlated, they have distinct properties and responses to different model characteristics [54].
Score Distributions and Model Ranking: The empirical distributions of these scores differ. GDTTS and TM-score distributions can hint at a bimodal character, separating more accurate from less accurate models, while lDDT shows a different spread of values [54]. Consequently, the ranking of models can vary depending on the metric used. A model might be ranked highly by GDTTS for having a large core of well-modeled residues but ranked lower by lDDT if its side chains or local geometries are poor.
Sensitivity to Structural Properties:
- Multi-domain Proteins and Flexibility: Global superposition-based scores like GDT_TS and TM-score are strongly influenced by domain motions. The superposition is typically dominated by the largest domain, leading to artificially poor scores for smaller, re-oriented domains [54] [59]. lDDT, being superposition-free, provides a more accurate assessment of local quality in such flexible systems [58].
- Local Atomic Details and Stereochemistry: With its default all-atom calculation, lDDT is uniquely capable of assessing the accuracy of side-chain packing and local atomic environments, which is critical for evaluating functional sites like ligand-binding pockets [59]. GDT_TS and TM-score, focusing on Cα atoms, are largely blind to these details. lDDT can also incorporate stereochemical quality checks to penalize unrealistic bond lengths or angles [59].
- Protein Length Dependence: TM-score was explicitly designed with a length-dependent normalization factor (dâ‚€) to make scores for proteins of different sizes comparable [56] [57]. While GDT_TS reports a percentage, its average value for random structure pairs also has a power-law dependence on protein size [57].
Table 2: Guidance for Metric Selection Based on Research Context
| Research Context / Goal | Recommended Primary Metric(s) | Rationale |
|---|---|---|
| Overall fold assessment | TM-score | Provides the most robust and interpretable single number for global topology (>0.5 = correct fold). |
| Residue-level coverage in a core | GDT_TS | Directly reports the percentage of the chain that is modeled to a useful degree of accuracy. |
| Local accuracy & binding sites | lDDT | All-atom, superposition-free design is ideal for evaluating functional regions and side chains. |
| Proteins with domain movements | lDDT | Avoids the distortion caused by attempting a single global superposition of flexible systems. |
| Model refinement | lDDT, GDT_HA | lDDT pinpoints local errors; GDT_HA's stringent cutoffs track high-accuracy progress. |
| Using NMR ensembles as reference | lDDT | Native support for multiple reference structures allows comparison against a full experimental ensemble. |
| CASP-like benchmarking | GDT_TS, TM-score | The community standard for historical comparison, increasingly supplemented by TM-score. |
Table 3: Key Research Reagent Solutions for Structure Comparison
| Tool / Resource | Function | Access / Availability |
|---|---|---|
| LGA (Local-Global Alignment) | The original program for calculating GDTTS and its variants (GDTHA, GDCSC, GDCALL) [1]. | Standalone program; also used by the official CASP assessment. |
| TM-score Program | Calculates TM-score for two structures with given residue correspondences [56]. | Source code (C++, Fortran) and Linux executable available from the Zhang group website. |
| TM-align | A structural alignment program that finds the best residue correspondence and then outputs a TM-score. Used for comparing proteins with different sequences [56]. | Web server and downloadable program from the Zhang group website. |
| lDDT Program | Calculates the local Distance Difference Test score. | Source code and interactive web server available at SwissModel/ExpASy [58]. |
| SEnCS Web Server | Produces structural ensembles for NMR and X-ray structures to estimate the uncertainty of GDT_TS and other scores, addressing protein flexibility [23]. | Publicly accessible web server at http://prodata.swmed.edu/SEnCS. |
Decision Workflow and Experimental Design
To ensure robust and meaningful structural comparisons, researchers should adopt a strategic approach to metric selection. The following workflow diagram provides a guided path for choosing the most appropriate metric(s) based on the specific research question and the nature of the structures being compared.
Within the evolving landscape of protein structure evaluation, the Global Distance Test (GDT_TS) remains a foundational pillar, providing an intuitive and resilient measure of model quality that has powered community-wide benchmarks for decades. However, a modern research toolkit must move beyond a single metric. As detailed in this guide, TM-score offers a superior, length-normalized assessment of global fold, while lDDT provides a unique, superposition-free lens for examining local atomic accuracy and side-chain packing, especially in dynamic or multi-domain systems.
The most insightful evaluations will therefore come from a complementary approach. Researchers are encouraged to select metrics based on their specific biological question—using TM-score for overall topology, GDT_TS for residue-level coverage, and lDDT for local detail and flexible systems. As protein structure prediction continues to advance, driving applications in protein design and drug development, the thoughtful application of these complementary metrics will be crucial for accurately measuring, and thus truly achieving, structural understanding.
{# The Central Role of the Global Distance Test in Model Evaluation Research}
{## Abstract}
The evaluation of computational protein structure models against experimentally determined pairs remains a cornerstone of structural biology and drug discovery. This whitepaper examines the central role of scoring distributions, with a specific focus on the Global Distance Test (GDT) and its derivatives, in benchmarking methodologies. We detail the function of GDT as a robust metric for quantifying model quality, survey its application across key experiments, and provide protocols for its implementation. Furthermore, we explore how these model evaluation strategies are integrated into the structure-based drug discovery pipeline, facilitating the selection of reliable models for target identification and lead optimization. The ongoing evolution of these metrics ensures they remain indispensable tools for assessing the rapidly advancing outputs of protein structure prediction platforms.
{## 1 Introduction: The Necessity of Robust Benchmarks}
The revolutionary progress in protein structure prediction, exemplified by tools like AlphaFold2, has generated an unprecedented volume of computational models [11]. The critical challenge has consequently shifted from pure structure generation to model quality assessment (QA)—the ability to accurately determine which predicted models are correct and to what degree. Scoring distributions, which quantify the similarity between predicted and experimental structures, form the empirical basis for this assessment.
Within this landscape, the Global Distance Test (GDT) has emerged as a foundational metric. Its development was driven by the need for a scoring function that is both sensitive to structural similarity and statistically meaningful, correcting for the length-dependent effects that plague simpler metrics like Root-Mean-Square Deviation (RMSD) [60]. The GDT score, particularly in its consensus application (CGDT), has become a standard in community-wide assessments such as the Critical Assessment of protein Structure Prediction (CASP), providing a reliable measure to rank and select the most accurate models from a large pool of decoys [61]. This whitepaper frames its discussion of scoring distributions within the context of GDT's pivotal role in driving model evaluation research forward.
{## 2 Core Scoring Metrics and Their Quantitative Distributions}
A variety of metrics are employed to benchmark predicted models, each offering a different perspective on model quality. The table below summarizes the key metrics and their typical performance distributions in benchmark studies.
| Metric | Definition | Interpretation | Typical Benchmark Performance (vs. Native) |
|---|---|---|---|
| GDT_TS [61] | Average percentage of Cα atoms under distance cutoffs (1, 2, 4, 8 Å) after superposition. | 0-100 scale; higher scores indicate better global fold. | A GDT_TS > 50 often indicates a correct fold; >80 is considered high-accuracy. |
| GDT_HA [61] | Similar to GDT_TS but uses tighter distance cutoffs (0.5, 1, 2, 4 Ã…). | Measures high-accuracy, fine-grained structural detail. | Used for evaluating high-quality models where backbone placement is nearly correct. |
| RMSD [11] | Root Mean Square Deviation of Cα atomic positions after optimal alignment. | Lower values indicate higher similarity; measured in Ångströms (Å). | Sensitive to large outliers; can be high even for correct folds with flexible termini. |
| iTM-score [60] | Interface TM-score; measures geometric similarity of protein-protein interfaces. | 0-1 scale; >0.4 indicates a significant interface prediction. | Used in CAPRI for docking models; assesses interface quality independent of global structure. |
| IS-score [60] | Interface Similarity score; combines geometry and side chain contact conservation. | 0-1 scale; accounts for chemical environment of the interface. | More stringent than iTM-score; provides a more holistic view of interface prediction quality. |
| TM-score [60] | Template Modeling Score; length-independent metric for global fold similarity. | 0-1 scale; >0.4 indicates a correct topology, >0.8 high accuracy. | Addresses RMSD's length dependence; more robust for judging overall fold correctness. |
The selection of a metric depends on the benchmarking goal. For assessing the global fold of a monomeric protein, GDT_TS and TM-score are most appropriate. In contrast, for evaluating models of protein complexes, the interface-specific scores (iTM-score, IS-score) are essential, as they focus on the region of interaction rather than the entire structure [60]. Benchmarking studies consistently show that while simple metrics like RMSD are useful, GDT-based and TM-scores provide a more statistically rigorous and meaningful evaluation of model quality.
{## 3 Experimental Protocols for Benchmarking with GDT}
Protocol 1: Quality Assessment (QA) for Single Protein Structures
This protocol is used to select the best model from a set of decoys (predicted structural models) for a single protein target.
- Input Decoy Generation: Generate a large set of candidate structural models (decoys) using one or more prediction methods (e.g., Rosetta, I-TASSER, AlphaFold2) [61].
- Reference Structure Preparation: Obtain a high-resolution experimental structure (e.g., from the Protein Data Bank) to serve as the "native" reference. Preprocess it by removing heteroatoms and ensuring it matches the sequence of the decoys.
- Structural Alignment and GDT Calculation: For each decoy, perform a rigid-body structural alignment to the native structure using the Kabsch algorithm. Calculate the GDTTS or GDTHA score. This involves finding the largest set of Cα atoms that can be superimposed under a series of distance thresholds [61].
- Model Selection and Ranking: Rank all decoys based on their GDT scores. The model with the highest score is considered the best prediction. Consensus methods like CGDT can be applied, which score each decoy based on its average GDT similarity to all other decoys in the set [61].
Protocol 2: Evaluating Protein-Protein Docking Models
This protocol benchmarks the quality of predicted models for protein-protein complexes, as commonly assessed in challenges like CAPRI.
- Interface Residue Definition: For the native complex structure, define the protein-protein interface. A common definition includes all residues with at least one heavy atom within a 4.5 Ã… distance cutoff of the binding partner [60].
- Interface-Centric Superimposition: Instead of a global alignment, superimpose the model and native complex structures based only on the interfacial residues. This ensures the evaluation focuses on the accuracy of the binding interface.
- Calculate Interface-Specific Scores: Compute the iTM-score and IS-score. The iTM-score is calculated similarly to the TM-score but is applied only to the interfacial residues, providing a length-normalized geometric measure [60]. The IS-score incorporates an additional contact overlap factor (f_i) that measures the conservation of side chain contacts between the model and the native interface [60].
- Statistical Validation: Determine the significance of the scores. An IS-score significantly above the random mean of ~0.10 indicates a successful interface prediction [60].
{## 4 Advanced and Integrated Methodologies}
To overcome the limitations of individual scoring functions, advanced hybrid methods have been developed. For instance, the PWCom method sequentially employs two neural networks to compare decoy pairs. The first network determines if two decoys are significantly different in quality; if yes, the second network decides which one is closer to the native structure. The final quality score is based on the number of times a decoy wins in these pairwise comparisons, effectively combining consensus GDT with knowledge-based scoring functions like RW, DDFire, and OPUS-Ca [61].
Furthermore, the drive to incorporate experimental data has led to the development of tools like Distance-AF, which integrates user-specified distance constraints into the structure prediction process of AlphaFold2. This is achieved by adding a distance-constraint loss term (L_dis) to the loss function of AlphaFold2's structure module, forcing the model to satisfy the provided distances while maintaining proper protein geometry. This approach demonstrates that a few (e.g., ~6) distance constraints can significantly improve domain orientation in multi-domain proteins, reducing the RMSD to the native structure by an average of 11.75 Ã… in benchmark tests [11]. This exemplifies the trend of using benchmarks not just for evaluation, but also for guiding model refinement.
{## 5 The Scientist's Toolkit: Essential Research Reagents}
The following table details key computational tools and resources essential for conducting research in protein model benchmarking.
| Research Reagent / Tool | Type | Primary Function in Benchmarking |
|---|---|---|
| GDTTS / GDTHA [61] | Scoring Algorithm | Quantifies global topological similarity between a model and a native structure. |
| iTM-score / IS-score [60] | Scoring Algorithm | Benchmarks the quality of predicted protein-protein interfaces. |
| PWCom [61] | Quality Assessment (QA) Method | Combines consensus and single-model scores via neural networks for superior model selection. |
| Distance-AF [11] | Modeling Tool | Improves AlphaFold2 predictions by incorporating experimental distance constraints as a loss term. |
| PBPK Modeling Software(e.g., Simcyp, Gastroplus) [62] | Simulation Platform | Predicts human PK properties using mechanistic, physiologically-based models in early drug development. |
| Free Energy Perturbation (FEP) [63] | Computational Method | Enables structure-based drug design and optimization (e.g., hERG inhibition modeling) using predicted protein models. |
{## 6 Application in Structure-Based Drug Discovery}
The reliable assessment of protein models is not an academic exercise; it is a critical enabler for structure-based drug discovery. High-quality predicted models, when their quality is confidently verified through rigorous benchmarking, allow drug discovery programs to proceed for targets without experimental structures [63]. The Model-Based Drug Development (MBDD) paradigm leverages modeling and simulation to modernize clinical study design and decision-making, quantifying risks and improving efficiency across all development phases [62].
For example, the ability to predict and benchmark the structures of different conformational states of a protein (e.g., active vs. inactive states of GPCRs) using tools like Distance-AF provides critical insights for drug design [11]. Furthermore, techniques like Free Energy Perturbation (FEP) can be applied to high-confidence predicted models to calculate binding affinities and optimize lead compounds, directly impacting lead optimization cycles [63]. The entire workflow, from model generation and benchmarking to drug design application, relies on the foundation provided by robust scoring distributions like GDT.
{## 7 Conclusion}
The quantitative benchmarking of computational models against experimental structures is a dynamic and critical field. The Global Distance Test and its ecosystem of related metrics provide the rigorous, statistically sound foundation upon which progress in protein structure prediction is measured. As the field evolves with more complex targets, including multi-domain proteins and dynamic complexes, the scoring distributions and benchmarking methodologies will continue to adapt. The integration of experimental data directly into the modeling process, coupled with advanced machine learning techniques for quality assessment, ensures that these tools will remain at the forefront of accelerating structural biology research and rational drug discovery.
The Global Distance Test (GDTTS) represents a fundamental metric for quantifying structural similarity in computational biology, particularly in protein structure prediction. Developed by Adam Zemla at Lawrence Livore National Laboratory, GDTTS was specifically designed to provide a more biologically meaningful assessment of protein model accuracy than traditional root-mean-square deviation (RMSD) calculations. Whereas RMSD proves highly sensitive to outlier regions—such as poorly modeled loop regions—GDTTS offers a more robust evaluation by focusing on the largest set of residues that can be superimposed within a defined distance cutoff [1] [64]. This capability has established GDTTS as a major assessment criterion in the Critical Assessment of Structure Prediction (CASP), the community-wide blind experiment that benchmarks protein structure prediction methodologies [1] [23].
The role of GDTTS extends beyond simple structure comparison; it provides critical insights into model quality that directly impact biological interpretation. In the context of drug discovery, accurate protein models enable reliable binding site identification and virtual screening of compound libraries [65] [66]. However, relying solely on GDTTS presents limitations, as it represents a single dimension of model quality. This technical guide establishes a comprehensive framework for integrating GDT into a multi-metric assessment strategy, enhancing model evaluation for research and development applications, particularly in pharmaceutical contexts where model reliability directly impacts downstream experimental success [67] [65].
Computational Foundations of GDT
Core Algorithm and Calculation Methodology
The GDT algorithm operates on a fundamental principle: identifying the largest set of equivalent Cα atoms between a predicted model and an experimentally determined reference structure that can be superimposed under a series of distance thresholds. The calculation involves an iterative process of structural superposition and residue counting within progressively larger distance cutoffs [1]. The standard implementation, as used in CASP assessments, computes 20 distinct GDT scores for cutoffs ranging from 0.5 Å to 10.0 Å in 0.5 Å increments [1].
The conventional GDT_TS (total score) represents the average of four specific distance cutoffs—1, 2, 4, and 8 Å—providing a balanced assessment across both high-accuracy and broader structural similarities [1] [23]. This calculation can be formally represented as:
GDT_TS = (P1Ã… + P2Ã… + P4Ã… + P8Ã…) / 4
Where PXÅ represents the percentage of Cα atoms in the model that superimpose within X Ångströms of their corresponding positions in the reference structure after optimal alignment [1]. This multi-threshold approach ensures that models receive credit for both precisely positioned regions and approximately correct structural elements, reflecting the hierarchical nature of protein structure and function.
GDT Variations and Specialized Applications
Beyond the standard GDT_TS, several specialized variants have been developed to address specific assessment needs:
- GDT_HA (High Accuracy): Utilizes more stringent distance cutoffs (0.5, 1, 2, and 4 Ã…) to emphasize near-atomic accuracy, particularly valuable for evaluating high-resolution models [1] [23].
- GDC_sc (Global Distance Calculation for Side Chains): Extends the assessment beyond the protein backbone to evaluate side chain positioning using characteristic atoms near the end of each residue [1].
- GDC_all: An all-atom implementation that provides the most comprehensive structural evaluation by considering complete model information [1].
Table 1: Key GDT Variants and Their Applications
| Metric | Distance Cutoffs | Assessment Focus | Primary Application |
|---|---|---|---|
| GDT_TS | 1, 2, 4, 8 Ã… | Overall topology | General model assessment, CASP |
| GDT_HA | 0.5, 1, 2, 4 Ã… | Atomic-level precision | High-accuracy models |
| GDC_sc | Varies by residue | Side chain placement | Ligand docking, functional sites |
| GDC_all | Varies by atom | Complete structure | Comprehensive validation |
Uncertainty Estimation in GDT Assessment
A critical advancement in GDT application involves recognizing and quantifying its inherent uncertainties. Protein structures exist not as static entities but as dynamic ensembles of conformational states, introducing inherent variability into structural comparisons [23]. This flexibility contributes to uncertainty in GDTTS scores, particularly when comparing models to single reference structures. Research has demonstrated that the standard deviation of GDTTS scores increases for values lower than 50 and 70, with maximum standard deviations of 0.3 for X-ray structures and 1.23 for NMR structures [23].
The methodological approach to uncertainty estimation involves generating structural ensembles that represent plausible variations in atomic positions. For NMR structures, this utilizes the naturally occurring ensemble of conformers deposited in the Protein Data Bank. For X-ray structures, time-averaged refinement techniques recapitulate structural heterogeneity in crystal lattices, producing ensembles that show better agreement with experimental data than single structures with B-factors [23].
Experimental Protocol for Uncertainty Quantification
Protocol: Estimating GDT_TS Uncertainty Using Structural Ensembles
Ensemble Generation:
- For NMR structures: Extract all conformers from the PDB deposit
- For X-ray structures: Perform time-averaged refinement using molecular dynamics simulations with time-averaged constraints on the X-ray dataset (e.g., using phenix.ensemble_refinement module with pTLS values ranging from 0 to 1.0) [23]
Flexibility Filtering:
- Compute maximum Cα distance deviations for each residue per ensemble
- Apply a 3.5 Å maximum Cα threshold to filter flexible residues potentially caused by insufficient experimental constraints [23]
Central Model Identification:
- Determine the central model of an ensemble as the structure with the largest sum of pairwise GDT_TS scores to other ensemble members [23]
GDT_TS Calculation and Statistical Analysis:
- Calculate sequence-dependent GDT_TS scores between models and individual structures in the ensemble
- Compute mean and standard deviation from the population of GDT_TS scores for each ensemble
- Bin standard deviations by their corresponding means and remove statistical outliers (>3σ in each bin) [23]
This protocol enables researchers to establish confidence intervals for GDT_TS comparisons, facilitating more robust significance testing between closely performing models.
Multi-Metric Integration Framework
Complementary Metrics for Comprehensive Assessment
Effective model validation requires integrating GDT with complementary metrics that capture different dimensions of model quality. This multi-dimensional approach provides a more nuanced understanding of model strengths and limitations.
Table 2: Core Metrics for Multi-Dimensional Model Assessment
| Metric Category | Specific Metrics | Assessment Focus | Strengths | Limitations |
|---|---|---|---|---|
| Global Structure Similarity | GDTTS, GDTHA | Overall fold accuracy | Robust to local errors, intuitive interpretation | Insensitive to specific functional regions |
| Local Structure Quality | RMSD, lDDT | Atomic-level precision | Sensitive to small deviations | Overly sensitive to outlier regions |
| Physical Plausibility | MolProbity, Ramachandran outliers | Steric clashes, torsion angles | Identifies unphysical features | Does not measure accuracy to target |
| Model Confidence | pLDDT, QMEAN | Per-residue reliability | Guides interpretation of uncertain regions | Not direct measure of accuracy |
The integration of these metrics creates a balanced assessment framework where GDT_TS provides the overall structural accuracy, local metrics (e.g., lDDT) validate fine details, physical plausibility checks ensure model viability, and confidence estimates guide appropriate usage.
Conceptual Framework for Multi-Metric Integration
The following diagram illustrates the logical relationships and workflow for integrating GDT into a comprehensive multi-metric assessment strategy:
Multi-Metric Assessment Workflow
This framework emphasizes that GDT functions as one component within an integrated system, where different metrics provide complementary insights, and uncertainty estimation adds crucial context for interpretation.
Experimental Protocols for Multi-Metric Validation
Comprehensive Model Assessment Protocol
Protocol: Multi-Metric Model Validation for Drug Discovery Applications
Data Preparation:
- Obtain target experimental structure (X-ray, NMR, or cryo-EM)
- Generate or acquire predicted models for assessment
- For uncertainty estimation: obtain or generate structural ensembles
Global Structure Assessment:
Local Structure Assessment:
- Calculate Cα RMSD for globally aligned structures
- Compute local distance difference test (lDDT) scores for residue-level quality assessment [23]
- Identify regions with significant local deviations (>2Ã… RMSD)
Physical Plausibility Checks:
- Analyze Ramachandran plot statistics using MolProbity or similar tools
- Identify steric clashes and unfavorable bond geometries
- Calculate overall MolProbity score for comparative assessment
Uncertainty Quantification:
- Generate or access structural ensembles for reference structure
- Calculate GDT_TS distributions across ensemble comparisons
- Determine standard deviations and confidence intervals for primary metrics
Context-Specific Functional Assessment:
- For binding site analysis: Calculate local GDT within active site residues
- For drug discovery: Assess conservation of key interaction residues
- Evaluate conservation of functional motifs and allosteric sites
Statistical Integration and Decision Framework
The final stage of multi-metric assessment involves statistical integration of results to support decision-making:
Metric Weighting: Assign context-dependent weights to different metrics based on application requirements (e.g., emphasize GDT_HA for high-accuracy models, functional site conservation for drug discovery)
Uncertainty Propagation: Incorporate uncertainty estimates into final assessments using error propagation principles
Significance Testing: Implement statistical tests to identify significant differences between models, considering GDT_TS uncertainties and multiple comparison corrections
Decision Matrix: Establish threshold values for different applications (e.g., GDT_TS > 70 for reliable binding site prediction)
Research Reagent Solutions for GDT Implementation
Successful implementation of GDT-based validation frameworks requires specific computational tools and resources. The following table details essential research reagents for comprehensive assessment:
Table 3: Essential Research Reagents for GDT Implementation
| Tool/Resource | Type | Primary Function | Application Context |
|---|---|---|---|
| LGA Program | Software | Structural alignment and GDT calculation | Core GDTTS, GDTHA computation |
| Phenix Software Suite | Software | Time-averaged refinement for ensemble generation | Uncertainty estimation for X-ray structures |
| MolProbity | Web Service/Software | Structure validation and physico-chemical checks | Assessing model plausibility |
| PDB_REDO Database | Database | Re-refined crystal structures with improved geometry | High-quality reference structures |
| SEnCS Web Server | Web Service | Structure ensemble generation and uncertainty analysis | GDT_TS standard deviation estimation |
| CASP Assessment Tools | Software Suite | Community-standard model evaluation | Benchmarking against state-of-the-art |
These research reagents provide the foundational infrastructure for implementing the multi-metric validation framework described in this guide. Regular updates and version control are essential, as methodology improvements continuously enhance assessment capabilities.
Integrating GDT into a multi-metric assessment strategy represents a critical advancement in computational model evaluation. By contextualizing GDT_TS within a broader ecosystem of complementary metrics and incorporating rigorous uncertainty estimation, researchers can achieve more robust, interpretable, and biologically relevant model assessments. This framework proves particularly valuable in drug discovery applications, where model quality directly impacts virtual screening success and experimental planning [65] [66]. The experimental protocols and conceptual frameworks presented here provide researchers with practical tools for implementing this comprehensive approach, advancing the role of GDT in model evaluation research and its applications in scientific and industrial contexts.
Conclusion
The Global Distance Test has evolved from a specialized CASP metric into a cornerstone of protein structure evaluation, indispensable for validating the revolutionary advances brought by AI-based prediction tools. Its robustness in providing a holistic view of model quality, especially when used in concert with metrics like TM-score and LDDT, makes it a critical tool for researchers aiming to translate structural models into biological insights. Future directions will likely involve tighter integration with drug discovery pipelines, using GDT to prioritize reliable models for virtual screening and rational drug design, thereby accelerating the development of new therapeutics. As computational methods continue to advance, GDT's role in benchmarking and guiding progress in structural bioinformatics remains more vital than ever.
References
- 1. Global distance test [https://en.wikipedia.org/wiki/Global_distance_test]
- 2. Finding Nearly Optimal GDT Scores - PMC [https://pmc.ncbi.nlm.nih.gov/articles/PMC3607910/]
- 3. 蛋白质结构模型质é‡è¯„估方法综述 [https://wulixb.iphy.ac.cn/cn/article/doi/10.7498/aps.72.20231071]
- 4. Prediction and quality assessment of protein quaternary ... [https://pmc.ncbi.nlm.nih.gov/articles/PMC12230669/]
- 5. Highly accurate protein structure prediction with AlphaFold [https://www.nature.com/articles/s41586-021-03819-2]
- 6. A Benchmark Dataset for Evaluating Practical Performance ... [https://pmc.ncbi.nlm.nih.gov/articles/PMC8945737/]
- 7. AlphaFold3-PyTorch:零门槛掌æ¡ç”Ÿç‰©åˆ†å结构预测的5大 ... [https://blog.csdn.net/gitblog_01128/article/details/154637415]
- 8. Protein structure prediction via deep learning: an in-depth ... [https://pmc.ncbi.nlm.nih.gov/articles/PMC12003282/]
- 9. spyrmsd: symmetry-corrected RMSD calculations in Python [https://jcheminf.biomedcentral.com/articles/10.1186/s13321-020-00455-2]
- 10. Methods of protein structure comparison - PMC [https://pmc.ncbi.nlm.nih.gov/articles/PMC4321859/]
- 11. Distance-AF improves predicted protein structure models ... [https://www.nature.com/articles/s42003-025-08783-5]
- 12. Distance-AF improves predicted protein structure models by ... [https://pmc.ncbi.nlm.nih.gov/articles/PMC12484874/]
- 13. I have several protein structures – what to do and where ... [https://310.ai/blog/several-protein-structures]
- 14. ProGuide: a flexible framework for modeling global ... [https://pmc.ncbi.nlm.nih.gov/articles/PMC12258946/]
- 15. Relationship between Ion Pair Geometries and ... [https://www.sciencedirect.com/science/article/pii/S0006349502739295]
- 16. Design of buried charged networks in artificial proteins [https://www.nature.com/articles/s41467-021-21909-7]
- 17. GTalign: spatial index-driven protein structure alignment, ... [https://www.nature.com/articles/s41467-024-51669-z]
- 18. Mapping membrane biophysical nano-environments [https://www.nature.com/articles/s41467-024-53883-1]
- 19. Critical Assessment of Methods of Protein Structure ... [https://pmc.ncbi.nlm.nih.gov/articles/PMC8726744/]
- 20. Results Table HELP [https://predictioncenter.org/casp14/doc/help.html]
- 21. CASP [https://en.wikipedia.org/wiki/CASP]
- 22. Protein Structure Prediction Center [https://predictioncenter.org/]
- 23. Estimation of Uncertainties in the Global Distance Test ... [https://pmc.ncbi.nlm.nih.gov/articles/PMC4858170/]
- 24. Estimation of Uncertainties in the Global Distance Test ... [https://journals.plos.org/plosone/article?id=10.1371/journal.pone.0154786]
- 25. Benchmarking for Breakthroughs [https://ifp.org/benchmarking-for-breakthroughs/]
- 26. Home - CASP15 [https://predictioncenter.org/casp15/]
- 27. Peeking Into CASP16 and the Future of Biomolecular ... [https://nexco.ch/blog/Peeking-Into-CASP16-and-the-Future-of-Biomolecular-Structure-Prediction]
- 28. DeepUMQA-X: Comprehensive and insightful estimation of ... [https://pmc.ncbi.nlm.nih.gov/articles/PMC12230709/]
- 29. Deep-learning-based single-domain and multidomain ... [https://www.nature.com/articles/s41587-025-02654-4]
- 30. CASP: An evaluation dataset for formal verification of C code [https://arxiv.org/abs/2508.18798]
- 31. Benchmarks [https://alignbio.org/benchmarks/]
- 32. GDT - Global Distance Test [https://openstructure.org/docs/2.11/mol/alg/gdt/]
- 33. Boosting AlphaFold protein tertiary structure prediction ... [https://www.nature.com/articles/s42003-025-08960-6]
- 34. An All-Atom Protein Structure Dataset for Machine Learning [https://pmc.ncbi.nlm.nih.gov/articles/PMC8492522/]
- 35. Determining protein similarity by comparing hydrophobic core ... [https://pmc.ncbi.nlm.nih.gov/articles/PMC5300504/]
- 36. An All-Atom Generative Model for Designing Protein ... [https://arxiv.org/html/2504.13075v1]
- 37. Evaluating GPCR modeling and docking strategies in the ... [https://pmc.ncbi.nlm.nih.gov/articles/PMC9747351/]
- 38. Multipass Membrane Protein Structure Prediction Using Rosetta [https://pmc.ncbi.nlm.nih.gov/articles/PMC1479309/]
- 39. Large scale investigation of GPCR molecular dynamics ... [https://www.nature.com/articles/s41467-025-57034-y]
- 40. The rise of AlphaFold in drug design [https://www.sciencedirect.com/science/article/abs/pii/S0079646825000025]
- 41. AlphaFold [https://en.wikipedia.org/wiki/AlphaFold]
- 42. Assessing scoring metrics for AlphaFold2 and AlphaFold3 ... [https://pubmed.ncbi.nlm.nih.gov/41081541/]
- 43. AlphaFold is running out of data — so drug firms are ... [https://www.nature.com/articles/d41586-025-00868-9]
- 44. SARST2 high-throughput and resource-efficient protein ... [https://www.nature.com/articles/s41467-025-63757-9]
- 45. Evaluating GPCR modeling and docking strategies in the ... [https://www.sciencedirect.com/science/article/pii/S2001037022005517]
- 46. Protein model accuracy estimation empowered by deep ... [https://www.nature.com/articles/s41598-021-90303-6]
- 47. Speed and accuracy tradeoff in whole body movement ... [https://www.nature.com/articles/s41598-025-04601-4]
- 48. DeepMind solve 50-year-old protein problem [https://frontlinegenomics.com/deepmind-solve-50-year-old-protein-problem/]
- 49. Recent advances and challenges in protein complex ... [https://www.sciencedirect.com/science/article/pii/S2001037024001363]
- 50. Root mean square deviation of atomic positions [https://en.wikipedia.org/wiki/Root_mean_square_deviation_of_atomic_positions]
- 51. Comparing Structures [https://docs.rosettacommons.org/docs/latest/getting_started/Comparing-Structures]
- 52. Lie-RMSD: A Gradient-Based Framework for Protein ... [https://arxiv.org/html/2508.17010v1]
- 53. NuFold: end-to-end approach for RNA tertiary structure ... [https://www.nature.com/articles/s41467-025-56261-7]
- 54. Comparative analysis of methods for evaluation of protein ... [https://pmc.ncbi.nlm.nih.gov/articles/PMC6419896/]
- 55. Assessment of Protein Model Structure Accuracy ... [https://pmc.ncbi.nlm.nih.gov/articles/PMC6851486/]
- 56. TM-score: Quantitative assessment of similarity between ... [https://zhanggroup.org/TM-score/]
- 57. Template modeling score [https://en.wikipedia.org/wiki/Template_modeling_score]
- 58. LDDT - local Distance Difference Test [https://swissmodel.expasy.org/lddt]
- 59. lDDT: a local superposition-free score for comparing ... [https://pmc.ncbi.nlm.nih.gov/articles/PMC3799472/]
- 60. New benchmark metrics for protein-protein docking methods [https://pmc.ncbi.nlm.nih.gov/articles/PMC3076516/]
- 61. Protein Structural Model Selection by Combining Consensus ... [https://journals.plos.org/plosone/article?id=10.1371/journal.pone.0074006]
- 62. Model-based clinical drug development in the past, present ... [https://pmc.ncbi.nlm.nih.gov/articles/PMC4294081/]
- 63. Enabling structure-based drug discovery utilizing predicted ... [https://www.sciencedirect.com/science/article/pii/S0092867423014447]
- 64. Global distance test [https://www.chemeurope.com/en/encyclopedia/Global_distance_test.html]
- 65. Integrating Artificial Intelligence for Drug Discovery in the ... [https://pmc.ncbi.nlm.nih.gov/articles/PMC10890405/]
- 66. The future of pharmaceuticals: Artificial intelligence in drug ... [https://www.sciencedirect.com/science/article/pii/S2095177925000656]
- 67. Drug Development Tool (DDT) Qualification Programs [https://www.fda.gov/drugs/development-approval-process-drugs/drug-development-tool-ddt-qualification-programs]