Mastering ChIP-seq: A Comprehensive Guide to H3K4me3, H3K27me3, and H3K9me3 Epigenetic Analysis
ChIP-seq is a cornerstone technique for profiling histone modifications like H3K4me3, H3K27me3, and H3K9me3, which play pivotal roles in gene regulation, cellular identity, and disease.
Mastering ChIP-seq: A Comprehensive Guide to H3K4me3, H3K27me3, and H3K9me3 Epigenetic Analysis
Abstract
ChIP-seq is a cornerstone technique for profiling histone modifications like H3K4me3, H3K27me3, and H3K9me3, which play pivotal roles in gene regulation, cellular identity, and disease. This article delivers a thorough resource for researchers, scientists, and drug development professionals, encompassing foundational insights into these marks' biological functions, step-by-step methodological protocols, practical troubleshooting for common challenges, and rigorous validation through comparative omics integration. By addressing current advancements and applications, it empowers robust epigenetic investigations in biomedicine and therapeutic discovery.
Unlocking Epigenetic Code: The Essential Roles of H3K4me3, H3K27me3, and H3K9me3 in Gene Regulation
The Histone Code and Core Mechanisms
The fundamental unit of chromatin is the nucleosome, consisting of 147 base pairs of DNA wrapped around an octamer of core histone proteins: two copies each of H2A, H2B, H3, and H4 [1]. Histone modifications are post-translational alterations to these histone proteins that constitute a sophisticated "histone code" capable of dictating the transcriptional state of local genomic regions without changing the underlying DNA sequence [1] [2]. These modifications play critical roles in cell fate determination, development, and disease by regulating access to DNA for transcriptional machinery [2] [3].
Chromatin architecture exists in two primary states governed by histone modifications. Euchromatin represents an open, transcriptionally active conformation where modifications disrupt histone-DNA interactions, allowing transcriptional machinery to access DNA [1]. In contrast, heterochromatin forms a tightly packed, transcriptionally silent structure where modifications strengthen histone-DNA interactions, preventing DNA access [1]. The dynamic interconversion between these states enables precise spatial and temporal control of gene expression.
At least nine distinct types of histone modifications have been identified [1]. Acetylation, methylation, phosphorylation, and ubiquitylation represent the most thoroughly characterized modifications, while newer discoveries including GlcNAcylation, citrullination, crotonylation, and isomerization remain under active investigation [1]. Each modification is added or removed from specific histone amino acid residues by dedicated enzymatic machinery [1] [2].
Figure 1: Fundamental Mechanism of Histone Modifications in Chromatin Regulation
Major Histone Modifications and Their Functions
Histone Acetylation
Histone acetylation, one of the most extensively studied modifications, involves the addition of acetyl groups to lysine residues on histones H3 and H4 by histone acetyltransferases (HATs), with removal mediated by histone deacetylases (HDACs) [1]. This modification neutralizes the positive charge on lysine residues, weakening histone-DNA interactions and significantly increasing gene expression [1]. Acetylation is involved in cell cycle regulation, proliferation, apoptosis, cellular differentiation, DNA replication and repair, nuclear import, and neuronal repression [1]. An imbalance in histone acetylation equilibrium is strongly associated with tumorigenesis and cancer progression [1] [2].
Prominent examples include H3K9ac and H3K27ac, which typically mark enhancers and promoters of active genes [1]. The dynamic nature of histone acetylation makes it one of the fastest post-translational modifications, faster than methylation but slower than phosphorylation [2]. Overexpression and enhanced activity of HDACs have been identified as drivers of tumor development and metastasis, leading to the development of HDAC inhibitors approved for cancer treatment [2].
Histone Methylation
Histone methylation occurs on lysine or arginine residues of histones H3 and H4, with divergent impacts on transcription [1]. Arginine methylation generally promotes transcriptional activation, while lysine methylation can either activate or repress transcription depending on the specific site [1]. Lysines can be mono-, di-, or tri-methylated, adding considerable functional diversity [1]. This modification differs from acetylation in that it does not alter histone charge or directly impact histone-DNA interactions [1].
Methylation is considered a relatively stable mark that can be propagated through multiple cell divisions, though it is now recognized as actively reversible through demethylase activity [1]. Mutations in histone methyltransferases and demethylases are frequently observed in cancer cells, resulting in altered chromatin methylation patterns that drive tumor development and metastasis [2].
Additional Histone Modifications
Histone phosphorylation adds negative charge primarily to serine, threonine, and tyrosine residues on histone tails, serving as a critical intermediate step in chromosome condensation during cell division, transcriptional regulation, and DNA damage repair [1]. Unlike acetylation and methylation, phosphorylation often establishes interactions between other histone modifications and serves as a platform for effector proteins [1]. For example, phosphorylation of H3S10 and H3S28 plays important roles in chromatin compaction and regulation during mitosis [1].
Histone ubiquitylation can occur on all core histones, though H2A and H2B are most commonly modified [1]. This modification plays a central role in the DNA damage response, with monoubiquitylated H2A associated with gene silencing and H2B with transcription activation [1]. Histone ubiquitylation also participates in crosstalk with other modifications; for instance, ubiquitination of H2B is a prerequisite for methylation of H3K4 and H3K79 [2].
Table 1: Major Histone Modifications and Their Functional Roles
| Histone Modification | Function | Genomic Location | Catalytic Enzymes |
|---|---|---|---|
| H3K4me3 | Transcriptional activation | Promoters, bivalent domains | SET1/MLL complexes (Writers); KDM5 family (Erasers) [4] |
| H3K27me3 | Transcriptional repression | Promoters in gene-rich regions, developmental regulators | EZH1/EZH2 (Writers); KDM6 family (Erasers) [1] [2] |
| H3K9me3 | Permanent heterochromatin formation | Satellite repeats, telomeres, pericentromeres | SUV39H1/2, SETDB1 (Writers); KDM4 family (Erasers) [1] [3] |
| H3K27ac | Transcriptional activation | Enhancers, promoters | p300/CBP (Writers); HDAC1-3 (Erasers) [1] [3] |
| H3K9ac | Transcriptional activation | Enhancers, promoters | GCN5/PCAF (Writers); HDAC1-3 (Erasers) [1] |
| H3K36me3 | Transcriptional activation | Gene bodies | SETD2 (Writer); KDM2/4 families (Erasers) [1] [3] |
| γH2A.X | DNA damage response | DNA double-strand breaks | ATM/ATR kinases (Writers); phosphatases (Erasers) [1] |
Key Histone Modifications in Experimental Research
H3K4me3: A Prime Activation Mark
H3K4me3 represents one of the most studied histone modifications due to its enrichment at transcription start sites and association with active gene expression [4]. This mark plays critical roles in regulating specific phases of transcription, including RNA polymerase II initiation, pause-release, heterogeneity, and consistency [4]. The protein complexes catalyzing mono-, di-, and trimethylation of H3K4, along with their corresponding demethylases and reader proteins, are essential for differentiation and development [4].
Recent studies have revealed that the roles of H3K4me3 in gene expression may differ from original assumptions, with precise regulation proving essential for normal development and disease prevention [4]. Somatic alterations in genes regulating H3K4 methylation are common in cancer, highlighting its therapeutic relevance [4]. In experimental contexts, H3K4me3 typically displays a narrow peak distribution pattern at transcriptional start sites [5].
H3K27me3: A Repressive Mark with Developmental Significance
H3K27me3 functions as a repressive histone modification that serves as a temporary signal at promoter regions to control developmental regulators in embryonic stem cells [1]. This modification is catalyzed by EZH2 within the Polycomb Repressive Complex 2 (PRC2) and is frequently dysregulated in cancer [2]. H3K27me3 works in concert with H2AK119ub to establish facultative heterochromatin, particularly at intergenic and silenced coding regions [1] [2].
The dynamic nature of H3K27me3 makes it particularly important during development and cellular differentiation. In experimental profiling, H3K27me3 often displays broad chromosomal domains rather than sharp peaks, presenting distinct analytical challenges [5].
H3K9me3: A Marker of Constitutive Heterochromatin
H3K9me3 represents a more permanent signal for heterochromatin formation in gene-poor chromosomal regions with tandem repeat structures, including satellite repeats, telomeres, and pericentromeres [1]. This modification creates binding sites for HP1 family proteins, which facilitate the formation of higher-order heterochromatin architecture [2]. H3K9me3 also marks retrotransposons and specific families of zinc finger genes [1].
Unlike H3K27me3, H3K9me3 is generally associated with stable, long-term gene silencing. In certain contexts, H3K9me3 can form bivalent chromatin domains with H3K4me3 to maintain adipogenic master regulatory genes expressed at low levels yet poised for activation when differentiation is required [6].
Table 2: Characteristics of Key Histone Modifications in ChIP-seq Analysis
| Modification | Peak Type | Recommended Sequencing Depth | Typical Antibody Target | Biological Context |
|---|---|---|---|---|
| H3K4me3 | Narrow peak | 10-20 million reads [5] | C-terminal region of H3 [7] | Active promoters, developmental poised promoters |
| H3K27me3 | Broad peak | 10-45 million reads [5] | Residues 25-44 of H3 [8] | Facultative heterochromatin, developmental gene silencing |
| H3K9me3 | Broad peak | 10-45 million reads [5] | N-terminal tail of H3 [6] | Constitutive heterochromatin, repetitive elements |
Chromatin Immunoprecipitation Sequencing (ChIP-seq) Methodology
Fundamental Principles of ChIP-seq
Chromatin Immunoprecipitation followed by sequencing (ChIP-seq) represents a powerful antibody-based technology that enables selective enrichment of specific DNA-binding proteins and their genomic targets [9]. This method provides critical information about chromatin state and gene transcription by combining protein analysis with molecular biology techniques [9]. ChIP-seq offers higher resolution, reduced noise, and greater coverage compared to earlier technologies like ChIP-chip [5].
The core principle involves using antibodies that selectively detect and bind to target proteins, including histones, histone modifications, transcription factors, and cofactors, along with their associated DNA fragments [9]. These immunoprecipitated DNA fragments are then sequenced and mapped to a reference genome to identify the protein or modification's genomic location and abundance [1] [9].
Experimental Workflow and Technical Considerations
The standard ChIP-seq protocol consists of several critical steps. First, protein-DNA crosslinking using formaldehyde-based reagents stabilizes protein-DNA interactions for subsequent analysis [9]. Next, chromatin fragmentation through enzymatic digestion (using micrococcal nuclease) or sonication breaks chromatin into appropriate-sized fragments [9]. Immunoprecipitation with specific antibodies then enriches for target protein-DNA complexes, followed by DNA purification and library preparation for next-generation sequencing [9] [7].
Two primary ChIP approaches exist: Native ChIP (N-ChIP) uses non-crosslinked chromatin and works optimally for histone modifications, while Crosslinked ChIP (X-ChIP) employs formaldehyde fixation and can capture both histone and non-histone protein interactions [9]. N-ChIP offers better antibody affinity but is restricted to stable interactions like histone-DNA binding, while X-ChIP can capture transient interactions but requires more optimization [9].
Figure 2: Standard ChIP-seq Experimental Workflow
Critical Success Factors in ChIP-seq
Antibody quality represents the most crucial factor in ChIP-seq success, as the technique relies entirely on antibody specificity and affinity for target epitopes [5]. Antibodies must be rigorously validated for ChIP applications, with Western blot analysis of knock-down samples providing helpful validation data [5]. Chromatin fragmentation quality significantly impacts resolution and success, with ideal fragment sizes ranging from 200-1000 base pairs [9].
Appropriate sequencing depth varies by target, with transcription factors requiring 10-20 million reads and broad histone marks needing 10-45 million reads for comprehensive coverage [5]. Proper experimental controls, including input DNA and appropriate negative controls, are essential for distinguishing true signal from background [9] [5].
Advanced Technologies and Applications
Emerging Methodologies: CUT&Tag
CUT&Tag (Cleavage Under Targets & Tagmentation) represents an emerging enzyme-tethering approach that offers a streamlined, easily scalable, and cost-effective alternative to ChIP-seq [8]. This method uses permeabilized nuclei to allow antibodies to bind chromatin-associated factors, which then tether a protein A-Tn5 transposase fusion protein (pA-Tn5) that cleaves intact DNA and inserts adapters for sequencing [8].
CUT&Tag demonstrates superior signal-to-noise ratio compared to ChIP-seq, with approximately 200-fold reduced cellular input and 10-fold reduced sequencing depth requirements [8]. Recent benchmarking studies show that CUT&Tag recovers approximately 54% of known ENCODE ChIP-seq peaks for histone modifications like H3K27ac and H3K27me3, with the identified peaks representing the strongest ENCODE peaks and showing the same functional and biological enrichments [8].
Multiplexed Approaches
Multiplexed ChIP-seq methodologies like MINUTE-ChIP enable researchers to profile multiple samples against multiple epitopes in a single workflow [10]. This approach dramatically increases throughput while enabling accurate quantitative comparisons [10]. The protocol involves sample preparation with chromatin fragmentation and barcoding of native or formaldehyde-fixed material, followed by pooling and splitting of barcoded chromatin into parallel immunoprecipitation reactions [10].
Multiplexed approaches empower biologists to perform ChIP-seq experiments with appropriate numbers of replicates and control conditions, delivering more statistically robust and biologically meaningful results [10]. These advancements address traditional limitations of ChIP-seq, including laborious parallel experiments, experimental variation, and challenges in quantitative comparison [10].
The Scientist's Toolkit: Essential Research Reagents
Table 3: Essential Research Reagents for Histone Modification Studies
| Reagent Category | Specific Examples | Function & Importance | Technical Considerations |
|---|---|---|---|
| Validated Antibodies | H3K4me3: Abcam ab8580; H3K27me3: Cell Signaling 9733; H3K9me3: Active Motif 39783 [8] | Target-specific immunoprecipitation; primary determinant of ChIP success | Must be ChIP-seq grade; validate with knock-down controls [5] [7] |
| Chromatin Preparation Kits | SimpleChIP Plus Sonication Chromatin IP Kit [9] | Standardized cell lysis, chromatin fragmentation & preparation | Ensure compatibility with downstream applications [7] |
| DNA Purification Kits | ChIP DNA Clean & Concentrator kits [7] | Post-IP DNA cleanup and concentration | Remove contaminants while maximizing DNA recovery [7] |
| Library Prep Kits | Illumina ChIP-seq Library Prep kits [10] | Sequencing library construction from low-input ChIP DNA | Optimized for low DNA inputs; include unique barcodes for multiplexing [10] |
| Enzymatic Reagents | Micrococcal Nuclease (MNase), Proteinase K, RNase A [9] | Chromatin digestion, protein removal, RNA elimination | Titrate enzymes for optimal activity; ensure complete RNA removal [9] |
Biological Significance and Research Applications
Role in Development and Cellular Differentiation
Histone modifications play indispensable roles in developmental processes and cellular differentiation. During neurogenesis, for example, modifications allow fine-tuning and coordination of spatiotemporal gene expressions as neural stem cells differentiate into specialized brain cell types [3]. Both embryonic and adult neurogenesis are regulated by complex histone modification patterns that determine neural progenitor cell proliferation, fate specification, and differentiation [3].
Bivalent chromatin domains represent particularly important configurations in developmental regulation, initially characterized in embryonic stem cells as regions containing both H3K4me3 (activating) and H3K27me3 (repressing) marks that keep developmental regulatory genes poised for activation [6]. Recent research has revealed alternative bivalent signatures, such as H3K4me3 paired with H3K9me3 in lineage-committed mesenchymal stem cells, which maintain adipogenic master regulatory genes at low expression levels yet primed for activation when differentiation is required [6].
Implications in Disease and Therapeutics
Dysregulation of histone modifications contributes significantly to human diseases, particularly cancer and neurological disorders [2] [3]. In cancer, abnormal alterations in histone modifications affect genome stability and disrupt gene expression patterns, leading to tumor development and metastasis [2]. Mutations within histones or chromatin remodeling complexes represent common features across many tumor types, with histone mutations like H3K27M, H3K36M, and H4G34V/R/W/L frequently occurring in pediatric cancers [2].
Neurodegenerative and neuropsychiatric diseases also demonstrate strong connections to histone modification dysregulation [3]. Alterations in H3K27ac have been associated with neurodegenerative and neuropsychiatric disorders, including Alzheimer's disease [8]. The reversible nature of histone modifications makes them attractive therapeutic targets, with several HDAC inhibitors and other epigenetic drugs already approved for cancer treatment [2].
The strategic investigation of histone modifications through robust methodologies like ChIP-seq continues to provide critical insights into normal development and disease pathogenesis, offering promising avenues for targeted therapeutic interventions across a spectrum of human disorders.
Trimethylation of histone H3 lysine 4 (H3K4me3) represents one of the most extensively studied and evolutionarily conserved epigenetic modifications, serving as a fundamental marker of transcriptionally active promoters across diverse eukaryotic species. This modification is catalyzed by complexes containing H3K4 methyltransferases and dynamically regulated by demethylase enzymes, creating a sophisticated system for transcriptional control [11] [12]. The presence of H3K4me3 at gene promoters facilitates an open chromatin configuration that promotes RNA polymerase II recruitment and activity, thereby enabling and amplifying transcriptional initiation [11]. Beyond its canonical role at promoters, emerging research has revealed that H3K4me3 also operates in intergenic regions, where it participates in regulatory elements and contributes to pervasive transcription throughout mammalian genomes [11] [12]. The precise regulation of H3K4me3 is biologically crucial, as demonstrated by the essential roles of H3K4 methyltransferase and demethylase complexes in cell differentiation, development, and their frequent mutation in various cancers [11].
Within the broader context of histone modification analysis, H3K4me3 represents one pillar of a sophisticated epigenetic regulatory system that includes repressive marks such as H3K27me3 and H3K9me3. While H3K27me3 is associated with facultative heterochromatin and developmental gene repression, and H3K9me3 with constitutive heterochromatin formation, H3K4me3 consistently correlates with active gene expression [13] [14]. This opposing relationship creates a dynamic regulatory balance that controls cellular identity and function. The comprehensive analysis of these modifications through Chromatin Immunoprecipitation followed by sequencing (ChIP-seq) has revolutionized our understanding of epigenetic regulation in development, disease, and therapeutic intervention.
Genomic Distribution and Functional Significance
Distinct Genomic Localization Patterns
H3K4me3 exhibits distinct genomic distribution patterns that correlate with specific regulatory functions. At active gene promoters, H3K4me3 is highly enriched around transcription start sites (TSSs), where it interacts directly with transcriptional cofactor TAF3 and chromatin remodelers such as BPTF and CHD1 to facilitate transcription initiation [11] [12]. This promoter-associated H3K4me3 is characterized by sharp, well-defined peaks in ChIP-seq profiles. In contrast, intergenic H3K4me3 is found at a subset of active candidate cis-regulatory elements (acCREs), particularly those marked by both H3K27ac and H3K4me1, suggesting a role in enhancer function [11]. These intergenic regions with H3K4me3 enrichment demonstrate distinct characteristics, including slightly broader peaks, higher H3K4me2 and H3K27ac signals, stronger RNA polymerase II binding, and increased initiating polymerase (Pol II-S5P) compared to H3K4me3-negative regulatory elements [11].
Table 1: Characteristics of H3K4me3 at Different Genomic Locations
| Genomic Location | Peak Characteristics | Associated Markers | Functional Role |
|---|---|---|---|
| Promoters | Sharp, defined peaks | High H3K4me3, Pol II binding | Transcription initiation, pause release |
| Intergenic acCREs | Broader peaks | H3K27ac, H3K4me1, H3K4me2 | Enhancer activity, non-coding transcription |
| CpG Island-associated | Unimodal H3K27ac | CpG islands | Recruitment of SET1/MLL complexes |
Transcriptional Regulation Mechanisms
H3K4me3 contributes to transcriptional activation through multiple interconnected mechanisms. The modification directly facilitates RNA polymerase II activity through interactions with transcriptional cofactors and chromatin remodeling complexes [11]. Experimental evidence demonstrates that H3K4me3 is actively involved in both transcription initiation and promoter-proximal pause release, a critical regulatory step in gene expression control [11] [12]. The level of H3K4me3 enrichment shows a strong correlation with the rate of transcription initiation, suggesting a quantitative relationship between this histone modification and transcriptional output [11].
Recent research utilizing epigenetic editing tools has provided causal evidence for H3K4me3 function. Targeted deposition of H3K4me3 at candidate promoters using dCas9-fusion systems was sufficient to increase transcript levels when DNA methylation was low, though it could not overcome hypermethylated states [11] [12]. This highlights the context-dependent nature of H3K4me3 functionality and its interaction with other epigenetic regulators. Interestingly, H3K4me3 appears to amplify transcription at intergenic regulatory elements independently of distance to the nearest gene or physical interaction with promoter regions, suggesting a more general role in supporting transcription throughout the genome [12].
Latest Research Advances and Key Findings
Intergenic H3K4me3 and Transcriptional Amplification
Groundbreaking research published in 2025 has revealed novel functions of H3K4me3 in intergenic regions, fundamentally expanding our understanding of this epigenetic mark. Yu et al. demonstrated that dynamic intergenic deposition of H3K4me3 promotes local transcription at permissive chromatin loci independent of enhancer function or target gene activity [11]. Through systematic, targeted H3K4me3 deposition at intergenic cis-regulatory elements using an epigenetic editing tool (dCas9-PRDM9), the researchers established that H3K4me3 is sufficient to increase transcription at active candidate cis-regulatory elements (cCREs) regardless of genomic position [11] [12]. This effect was unlinked from transcript levels of putative target genes and dependent on chromatin context rather than specific cCRE identity or location.
The study further revealed that H3K4me3 is actively remodeled at intergenic regions under normal conditions. Disruption of demethylase function (RACK7/KDM5C complex) caused significant new H3K4me3 deposition at intergenic sites substantially more than at gene promoters, suggesting continuous removal of this mark from intergenic regions [11]. Surprisingly, depletion of Cfp1 (Cxxc1), a subunit of the SET1 H3K4 trimethyltransferase complex that recruits the complex to unmethylated CpG islands, also resulted in increased intergenic H3K4me3 peaks [11]. This suggests that loss of active promoter recruitment may release the complex to deposit H3K4me3 at intergenic sites, indicating a competitive balance between genic and intergenic H3K4me3 deposition.
Context-Dependent Functionality
The functional outcome of H3K4me3 deposition appears highly dependent on chromatin context and coexisting epigenetic marks. Research indicates that approximately one-fourth of H3K4me3-positive active cis-regulatory elements (acCREs) contain CpG islands, whereas almost no H3K4me3-negative acCREs include annotated CpG islands [11]. This suggests that recruitment of SET1/MLL H3K4 methyltransferase complexes to intergenic CpG islands may bias these sites toward H3K4me3 accumulation by helping overcome active H3K4 demethylation. However, the presence of CpG islands cannot explain H3K4me3 at the majority of intergenic acCREs, indicating additional recruitment mechanisms exist.
The relationship between H3K4me3 and transcriptional activity is influenced by promoter characteristics. Studies from 2010 revealed that the nature of the promoter (viral or endogenous) affects H3K4me3 much more than it affects H3K4me2, suggesting potential fundamental differences in the recruitment of methyltransferases for H3K4 trimethylation [15]. Furthermore, transcriptional activity significantly impacts both the overall level and distribution of H3K4me3 in coding regions, while showing minimal effect on H3K4me2 patterns [15].
Table 2: H3K4me3 Dynamics Under Different Biological Contexts
| Biological Context | H3K4me3 Pattern | Functional Consequence | Reference |
|---|---|---|---|
| Rapid growth conditions (A. pacificum) | Increased modification abundance under high light/nitrogen | Upregulation of nitrogen metabolism, endocytosis, vitamin metabolism | [16] |
| CpG-methylated DNA regions | H3K4me3 depletion | Transcriptional repression | [15] |
| Demethylase disruption (RACK7/KDM5C) | Increased intergenic deposition | Enhanced local transcription | [11] |
| Cfp1 depletion | Increased intergenic peaks | Altered SET1 complex distribution | [11] |
Experimental Approaches and Methodologies
ChIP-seq Workflow for H3K4me3 Analysis
Chromatin Immunoprecipitation followed by sequencing (ChIP-seq) represents the gold standard technique for genome-wide mapping of H3K4me3 distributions. The standard ChIP-seq protocol begins with cross-linking proteins to DNA using formaldehyde to stabilize protein-DNA interactions, followed by chromatin fragmentation typically through sonication or micrococcal nuclease (MNase) digestion [17]. While MNase digestion produces uniform mononucleosome-sized fragments ideal for histone modification mapping, sonication is preferred when preserving transcription factor binding sites in linker regions is important [17]. Immunoprecipitation is then performed using specific antibodies against H3K4me3, followed by DNA purification, library preparation, and high-throughput sequencing.
Critical considerations for successful H3K4me3 ChIP-seq include antibody specificity, cross-linking efficiency, and fragmentation optimization. The number of cells used for ChIP is also crucial, with standard protocols requiring 1-10 million cells, though recent advances have enabled histone modification analysis with significantly fewer cells [17]. Proper controls are essential for data interpretation, with input chromatin (non-immunoprecipitated) generally preferred over non-specific IgG controls as it provides better estimation of background biases introduced during chromatin preparation and sequencing [17].
ChIP-seq Workflow for H3K4me3 Profiling
Peak Calling and Data Analysis
Bioinformatic analysis of H3K4me3 ChIP-seq data involves multiple computational steps. Sequence reads are first aligned to a reference genome, followed by peak calling using specialized algorithms. For H3K4me3, which typically produces sharp, well-defined peaks, algorithms such as MACS2 are commonly employed with parameters optimized for histone modification analysis [18] [17]. A standard approach includes peak calling with MACS2 using arguments such as '--BAMPE --q 0.05', followed by quality filtering to retain peaks with q-value scores higher than established thresholds (e.g., 25th percentile) [18].
For comprehensive atlas generation, samples yielding sufficient high-quality peaks (typically >6,000 filtered peaks) can be merged to create a union peak list, with overlapping genomic ranges combined into single features that fully encompass each overlapping peak [18]. This approach enables comparative analysis across multiple experimental conditions or cell types. Advanced analytical methods also consider peak characteristics such as intensity, width, and shape, which can provide insights into the functional state of associated regulatory elements.
Epigenetic Editing Approaches
Beyond observational studies, epigenetic editing tools have emerged as powerful approaches for establishing causal relationships between H3K4me3 and transcriptional outcomes. The development of dCas9-PRDM9 fusion proteins, which combine catalytically dead Cas9 with the catalytic (SET) domain of the H3K4 trimethyltransferase PRDM9, enables targeted deposition of H3K4me3 at specific genomic loci [11] [12]. This approach allows researchers to directly test the functional consequences of H3K4me3 deposition at candidate promoters and enhancers without disturbing other regulatory elements.
Experimental applications of this technology have demonstrated that targeted H3K4me3 deposition can increase transcript levels when DNA methylation is low, but cannot overcome DNA hypermethylated states [11]. This highlights both the potency and limitations of H3K4me3 as a transcriptional activator and underscores the complex interplay between different epigenetic modification systems.
The Scientist's Toolkit: Research Reagent Solutions
Table 3: Essential Research Reagents for H3K4me3 Studies
| Reagent/Category | Specific Examples | Function/Application | Technical Notes |
|---|---|---|---|
| H3K4me3 Antibodies | Anti-trimethyl-histone H3 (lys4) from Upstate Biochemical | Chromatin immunoprecipitation; western blot | Specificity validation crucial; different lots may vary |
| ChIP-Seq Kits | Micrococcal nuclease-based kits; sonication-based kits | Chromatin fragmentation for ChIP-seq | MNase preferred for histone modifications; sonication for transcription factors |
| Epigenetic Editing Tools | dCas9-PRDM9 fusion constructs | Targeted H3K4me3 deposition | Enables causal testing of H3K4me3 function |
| Bioinformatic Tools | MACS2, SICER, ChromaBlocks | Peak calling and domain identification | MACS2 optimal for sharp peaks; SICER for broad domains |
| Positive Control Cell Lines | Human breast cancer cell lines (e.g., MCF-7) | Positive controls for H3K4me3 signals | Known H3K4me3 patterns established |
| Demethylase Inhibitors | KDM5C inhibitors | Modulating H3K4me3 levels | Useful for functional studies |
H3K4me3 in Disease and Therapeutic Applications
Role in Disease Pathogenesis
Dysregulation of H3K4me3 patterning contributes significantly to various disease states, particularly cancer. Mutations in H3K4 methyltransferases and demethylases are frequently observed in numerous cancers, highlighting the importance of proper H3K4me3 regulation for maintaining cellular homeostasis [11] [19]. Abnormal H3K4me3 distributions can lead to altered transcriptional programs that drive oncogenic processes, including uncontrolled proliferation, evasion of apoptosis, and metabolic reprogramming. Beyond cancer, H3K4me3 dysregulation has been implicated in neurological disorders, developmental abnormalities, and immune dysfunction, establishing it as a broad contributor to human disease.
Research across multiple cancer types has revealed that H3K4me3 profiles can serve as biomarkers for disease classification and prognosis. In tumorigenesis, the redistribution of H3K4me3 occurs in coordination with other epigenetic changes, including alterations in DNA methylation and repressive histone marks [14]. This epigenetic reprogramming can silence tumor suppressor genes or activate oncogenes, contributing to cancer initiation and progression. The context-dependent nature of H3K4me3 function is particularly relevant in disease states, where the cellular environment and coexisting epigenetic marks influence the functional outcomes of H3K4me3 deposition.
Applications in Drug Discovery
ChIP-seq profiling of H3K4me3 has emerged as a valuable tool in pharmaceutical research and development, enabling the identification of novel drug targets and providing insights into drug mechanisms of action [19]. By mapping H3K4me3 patterns in disease versus normal states, researchers can identify key regulatory elements and genes driving pathological processes, which may represent promising therapeutic targets. Additionally, monitoring H3K4me3 changes in response to drug treatment can reveal epigenetic mechanisms contributing to therapeutic efficacy or resistance.
The application of ChIP-seq in drug discovery has already contributed to notable successes, particularly in oncology [19]. For instance, H3K4me3 profiling has helped identify oncogenic transcription factors and their target genes in various cancers, leading to the development of targeted therapies that disrupt these regulatory networks. Furthermore, characterizing H3K4me3 patterns in drug-resistant versus sensitive cells has provided insights into epigenetic mechanisms underlying treatment failure, suggesting strategies to overcome resistance through combination therapies targeting multiple epigenetic pathways.
Therapeutic Applications of H3K4me3 Research
Comparative Analysis with Other Histone Modifications
Understanding H3K4me3 within the broader epigenetic landscape requires comparison with other key histone modifications, particularly H3K27me3 and H3K9me3. While H3K4me3 is unequivocally associated with transcriptional activation, H3K27me3 represents a repressive mark deposited by the Polycomb Repressive Complex 2 (PRC2) and is typically associated with facultative heterochromatin and developmental gene silencing [13] [14]. H3K9me3, in contrast, is a hallmark of constitutive heterochromatin formation, particularly in pericentromeric and telomeric regions, and is mediated by SUV39H1/2 methyltransferases [13].
These modifications exhibit distinct genomic distributions and functional characteristics. H3K4me3 typically forms sharp peaks at promoters, while H3K27me3 can form large organized chromatin lysine domains (LOCKs) spanning hundreds of kilobases [14]. Interestingly, these marks can co-occur at certain genomic locations, creating "bivalent" domains that maintain genes in a transcriptionally poised state, ready for rapid activation or stable repression during cellular differentiation [14]. The antagonistic relationship between H3K4me3 and repressive marks creates a dynamic regulatory system that controls cell identity and function.
Technically, the analysis of these different modifications requires tailored experimental and computational approaches. While H3K4me3 peaks are typically sharp and well-defined, requiring peak-calling algorithms like MACS2, broader marks like H3K27me3 LOCKs benefit from domain-calling algorithms such as SICER or ChromaBlocks [17]. Understanding these technical considerations is essential for appropriate experimental design and data interpretation in comprehensive epigenetic studies.
Future Directions and Concluding Remarks
The study of H3K4me3 continues to evolve with emerging technologies and conceptual frameworks. Recent advances in single-cell ChIP-seq methods promise to reveal H3K4me3 heterogeneity within cell populations, potentially uncovering novel regulatory principles in development and disease. Similarly, the integration of H3K4me3 data with other genomic and epigenomic datasets through multi-omics approaches provides increasingly comprehensive views of epigenetic regulation.
The development of more precise epigenetic editing tools represents another exciting frontier, enabling not only targeted deposition but also erasure of H3K4me3 at specific genomic locations. These approaches will further elucidate the causal relationships between H3K4me3 and transcriptional outcomes, potentially leading to novel therapeutic strategies for epigenetic diseases. Additionally, the discovery of "reader" proteins that specifically recognize H3K4me3 and mediate its functional effects continues to expand our understanding of the mechanistic basis of H3K4me3-dependent transcription.
In conclusion, H3K4me3 represents a central epigenetic mark with well-established roles in promoter activity and transcriptional initiation, while ongoing research continues to reveal novel functions in intergenic regions and diverse biological contexts. Its analysis through ChIP-seq and related technologies provides critical insights into normal development and disease processes, with growing applications in drug discovery and therapeutic development. As part of the broader epigenetic landscape including H3K27me3 and H3K9me3, H3K4me3 contributes to the sophisticated regulatory systems that control genome function and cellular identity.
Histone modifications serve as crucial epigenetic markers that regulate gene expression without altering the underlying DNA sequence. Among these, the trimethylation of lysine 27 on histone H3 (H3K27me3) represents a fundamental repressive mark associated with transcriptional silencing. This modification is centrally deposited and maintained by the Polycomb Repressive Complex 2 (PRC2), which plays pivotal roles in cell fate determination, developmental regulation, and disease pathogenesis [20]. The precise mechanisms through which H3K27me3 contributes to gene silencing—through direct chromatin compaction, recruitment of additional repressive complexes, or facilitation of long-range chromatin interactions—have become increasingly refined through advanced genomic technologies. This technical guide examines H3K27me3 within the broader context of chromatin landscape analysis using ChIP-seq methodologies, particularly when integrated with complementary histone marks such as H3K4me3 and H3K9me3 to decode the multilayer regulatory logic of eukaryotic genomes.
Molecular Machinery: PRC2 Complex and H3K27me3 Deposition
Architecture of the PRC2 Core Complex
The PRC2 complex exhibits an exquisite molecular architecture that permits functional modulation and precise regulation of its enzymatic activity. The core PRC2 complex in mammals comprises four essential subunits [20]:
- EZH2 or EZH1: The catalytic subunit containing the SET domain responsible for methyltransferase activity. EZH2-containing complexes show robust allosteric activation, while EZH1 complexes are less responsive to such activation.
- EED: Mediates allosteric activation and chromatin spreading through its WD40 repeat domain that recognizes H3K27me3, creating a positive feedback loop for propagation.
- SUZ12: Provides structural integrity through its C-terminal VEFS domain and serves as a platform for recruiting various accessory factors via its N-terminal extension.
- RBBP4/7: Facilitates chromatin recruitment by directly binding nucleosomes, a process inhibited by H3K4 methylation.
PRC2 Subcomplexes and Accessory Factors
Beyond the core complex, PRC2 incorporates accessory factors that define distinct subcomplexes with specialized targeting capabilities [20]:
Table 1: PRC2 Subcomplexes and Their Key Accessory Factors
| Subcomplex | Accessory Factors | Recruitment Mechanisms | Functional Specialization |
|---|---|---|---|
| PRC2.1 | PCL1/2/3 (PHF1, MTF2, PHF19) | Binds CpG islands via EH module; recognizes H3K36me3 via Tudor domain | De novo chromatin targeting |
| EPOP (C17ORF96) | Interacts with Elongin complex; suppresses transcriptional elongation | Modulation of transcriptional activity | |
| PALI1/2 (C10ORF12) | Positively modulates catalytic activity during embryogenesis | Developmental gene regulation | |
| PRC2.2 | JARID2 | Binds H2AK119ub1, lncRNAs, and DNA; its K116me3 mimics H3K27me3 for allosteric activation | Facilitates recruitment to H2AK119ub1-marked regions |
| AEBP2 | Stabilizes PRC2 binding to genomic targets; interacts with DNA | Complex stabilization and DNA binding |
Figure 1: PRC2 Core Complex Architecture and Recruitment Mechanisms. The diagram illustrates the core subunits and accessory factors that define PRC2.1 and PRC2.2 subcomplexes, highlighting their specialized roles in targeting and depositing the H3K27me3 repressive mark.
Regulation of PRC2 Activity
The catalytic function of PRC2 is subject to multifaceted regulation through various mechanisms [20]:
- Allosteric activation: EED recognition of H3K27me3 creates a positive feedback loop for propagation of this mark along chromatin.
- Competitive inhibition: CXORF67/EZHIP uses an H3-like peptide sequence to competitively inhibit PRC2 activity by binding the EZH2 SET domain.
- Oncohistone inhibition: Cancer-associated H3K27M mutant histones potently inhibit PRC2 activity by sequestering the enzyme.
- RNA-mediated regulation: Both nascent mRNAs and long noncoding RNAs can facilitate PRC2 eviction or functional restriction.
Genomic Distribution and Functional Profiles of H3K27me3
Distinct H3K27me3 Enrichment Profiles
Advanced ChIP-seq analyses have revealed that H3K27me3 exhibits distinct genomic distribution patterns with specialized functional consequences [21]:
- Broad Domains: Extensive H3K27me3 enrichment across gene bodies correlates with strong transcriptional repression, representing the canonical silencing function.
- Promoter-Focused Peaks: Sharp H3K27me3 enrichment at transcription start sites, often associated with bivalent genes that also carry H3K4me3 marks, maintaining genes in a poised state.
- Actively Transcribed Genes: Surprisingly, promoter-proximal H3K27me3 peaks can sometimes associate with actively transcribed genes, suggesting context-dependent functions.
The prevalence of these profiles varies significantly across cell types, reflecting cell-type-specific epigenetic landscapes [21].
Large Organized Chromatin K-domains (LOCKs)
H3K27me3 frequently organizes into large chromatin domains spanning hundreds of kilobases, termed H3K27me3 LOCKs or H3K27me3-rich regions (MRRs) [22] [23]. These macro-domains display distinct characteristics:
Table 2: Characteristics of H3K27me3 Domain Types
| Feature | Typical Peaks | Short LOCKs (<100 kb) | Long LOCKs (>100 kb) |
|---|---|---|---|
| Genomic Coverage | Limited, discrete regions | Up to 100 kb | Several hundred kb |
| Peak Intensity | Moderate | High | Very High |
| DNA Methylation | Intermediate | Low | Very Low |
| Gene Expression | Variable repression | Strong repression | Very strong repression |
| Functional Enrichment | Diverse functions | Poised promoters | Developmental processes |
| Tumor Suppressor Association | Limited | Moderate | Strong |
Comparative analyses indicate that as domain size increases, so does the enrichment for developmental processes such as "epithelial cell differentiation," "embryonic organ development," and "gland development" [22]. These large repressive domains show preferential localization in partially methylated domains (PMDs), particularly short-PMDs in normal cells, where they contribute to robust silencing of developmental genes and oncogenes [22].
Silencing Mechanisms: From Chromatin Modification to Gene Repression
Effector Recruitment and Chromatin Compaction
H3K27me3 executes transcriptional silencing through several interconnected mechanisms [20]:
- Canonical PRC1 Recruitment: H3K27me3 is recognized by canonical PRC1 complexes through chromodomain-containing subunits, leading to H2AK119ub1 deposition and subsequent chromatin compaction.
- BAH Module-Containing Proteins: Proteins like BAHCC1 in humans directly recognize H3K27me3 and facilitate gene silencing through mechanisms including histone deacetylation.
- Phase Separation: Emerging evidence suggests that H3K27me3-rich domains may facilitate phase separation, leading to compaction of repressive chromatin.
Long-Range Chromatin Interactions
H3K27me3-rich regions function as silencer elements that can repress gene expression over long genomic distances through chromatin looping [23]. Key findings include:
- MRRs show dense chromatin interactions and preferentially interact with each other, forming repressive nuclear compartments.
- CRISPR excision of MRRs at interaction anchors leads to upregulated expression of interacting genes, altered H3K27me3 and H3K27ac levels at interacting regions, and disrupted chromatin interactions.
- Genes associated with MRR-mediated long-range interactions are particularly susceptible to H3K27me3 depletion strategies.
- This silencer functionality impacts cell identity, differentiation capacity, and in the context of cancer, xenograft tumor growth [23].
Figure 2: H3K27me3-Mediated Silencing Mechanisms. The diagram illustrates how H3K27me3 deposition leads to gene silencing through multiple effector pathways including PRC1 recruitment, BAH domain protein engagement, and long-range chromatin looping, ultimately maintaining cellular identity and developmental programs.
Bivalent Domains and Poised Transcription
A specialized chromatin configuration called the "bivalent domain" features both H3K4me3 (activating) and H3K27me3 (repressing) marks at promoter regions, maintaining developmental genes in a transcriptionally poised state [21] [24]. These bivalent domains:
- Are enriched in embryonic stem cells on key developmental regulators.
- Adopt a "winner-takes-all" approach during differentiation, resolving toward either active (H3K4me3-only) or repressed (H3K27me3-only) states.
- Allow rapid activation or silencing in response to developmental cues while maintaining low basal expression.
- In differentiated cells, bivalent promoters are often found in short LOCKs and are particularly susceptible to deregulation in cancer [22].
Experimental Analysis: H3K27me3 ChIP-seq Methodology
Standardized ChIP-seq Protocol
Chromatin Immunoprecipitation followed by sequencing (ChIP-seq) represents the gold standard for genome-wide mapping of H3K27me3 distributions. A robust protocol includes [25]:
Cell Fixation and Chromatin Preparation
- Crosslink proteins to DNA using 1% formaldehyde for 10 minutes at room temperature.
- Quench crosslinking with glycine.
- Prepare chromatin by sonicating to 200-500 bp fragments using a focused ultrasonicator.
- Verify fragment size distribution by agarose gel electrophoresis.
Immunoprecipitation
- Incubate 2-10 μg of H3K27me3-specific antibody (e.g., Millipore 07-449) with chromatin equivalent to 2×10^7 cells.
- Use Protein A/G magnetic beads for antibody capture.
- Wash beads sequentially with low salt, high salt, and LiCl buffers.
- Reverse crosslinks and purify DNA.
Library Preparation and Sequencing
- End-repair, A-tail, and adapter-ligate immunoprecipitated DNA.
- Size-select libraries (~200-300 bp) using agarose gel electrophoresis or SPRI beads.
- Amplify libraries with 10-14 PCR cycles.
- Sequence using Illumina platforms (50-75 bp single-end reads recommended).
Bioinformatics Processing Pipeline
Quality Control and Alignment
- Trim adapters using Trim Galore! v0.4.0.
- Align to reference genome (hg19/mm10) using bowtie2 v2.2.5 with parameters to suppress multimapping.
- Remove PCR duplicates using picard MarkDuplicates.
- Filter out blacklisted regions (ENCODE blacklists).
Peak Calling and Domain Identification
- Call broad peaks using epic2 or similar broad peak callers compared to input controls.
- Merge peaks within 3 kb using bedtools merge.
- Identify H3K27me3-rich regions (MRRs) by clustering nearby peaks and ranking by H3K27me3 signal intensity [23].
- Detect LOCKs using the CREAM R package with size thresholds (short: <100 kb, long: >100 kb) [22].
Downstream Analysis
- Generate normalized bigWig files using deepTools bamCoverage with scaling factors.
- Compute enrichment matrices over features of interest using deepTools computeMatrix.
- Visualize data with deepTools plotHeatmap and Integrated Genome Viewer.
- Correlate with expression data from RNA-seq.
Integration with Multi-histone Mark Analyses
Comprehensive epigenetic analysis requires integration of H3K27me3 data with other key histone modifications [26] [24]:
- H3K4me3: Active promoter mark that combined with H3K27me3 defines bivalent promoters.
- H3K27ac: Active enhancer mark that antagonizes H3K27me3.
- H3K9me3: Constitutive heterochromatin mark with distinct silencing mechanisms.
- H3K36me3: Active transcription mark mutually exclusive with H3K27me3.
Integrative analysis reveals coordinated patterns where promoter/active chromatin marks (H3K4me3, H3K9ac, H3K27ac) form one functional cluster, while heterochromatin marks (H3K27me3, H3K9me3) form another [26].
The Scientist's Toolkit: Essential Research Reagents
Table 3: Key Research Reagents for H3K27me3 Studies
| Reagent Category | Specific Examples | Application Notes |
|---|---|---|
| Antibodies | Millipore 07-449 (H3K27me3) | Well-validated for ChIP-seq; recommended by multiple protocols [21] [25] |
| Diagenode C15200147 (H4K20me1) | Used in co-immunoprecipitation studies with PRC components [27] | |
| Cell Lines | K562, ES cells, G1ME | Well-characterized models with established H3K27me3 profiles [21] [23] [27] |
| Bioinformatics Tools | Bowtie2, SAMtools, Picard | Standard alignment and processing tools [25] |
| deepTools v3.3.1 | Comprehensive suite for ChIP-seq data analysis [25] | |
| CREAM R package | Specialized for LOCK identification [22] | |
| Epic2 | Broad peak caller optimized for H3K27me3 [25] | |
| Critical Assays | ChIP-seq | Genome-wide mapping of H3K27me3 distribution [21] [25] |
| ChIP-qPCR | Validation of specific loci [21] | |
| RNA-seq | Correlation of repression with expression [24] | |
| Hi-C/ChIA-PET | Chromatin interaction analyses [23] |
Evolutionary Conservation and Functional Adaptation
The PRC2 system and H3K27me3 mark exhibit remarkable evolutionary conservation across eukaryotes while showing functional adaptations [28] [29]:
- In the closest relatives of animals (choanoflagellates), H3K27me3 decorates cell type-specific genes and regulates transposable elements, suggesting these are ancestral functions.
- Across diverse eukaryotes including diatoms, red algae, and ciliates, PRC2 represses transposable elements through H3K27me3 deposition.
- During plant evolution, the proportion of transposable elements directly repressed by PRC2 decreased, while its role in developmental gene regulation expanded.
- In flowering plants, H3K27me3-marked transposable elements often contain transcription factor binding sites and may have been co-opted to shape transcriptional regulatory networks.
This evolutionary perspective suggests that PRC2 initially functioned in transposable element silencing in the last eukaryotic common ancestor, with developmental gene regulation representing a derived function that expanded in animals and plants [29].
H3K27me3 represents a central repressive signal in the eukaryotic epigenetic landscape, mediating flexible yet stable gene silencing through multifaceted mechanisms. Its functions span from transposable element control to developmental gene regulation, executed through molecular effectors that compact chromatin, modify histones, and facilitate long-range genomic interactions. The analytical framework provided here—encompassing molecular mechanisms, standardized protocols, and integrative bioinformatics approaches—equips researchers to decipher H3K27me3-mediated silencing in diverse biological contexts. As our understanding of PRC2 regulation and H3K27me3 functionality continues to evolve, particularly through comparative evolutionary analyses and single-cell methodologies, so too will our ability to target this system for therapeutic intervention in cancer and developmental disorders.
Histone H3 lysine 9 trimethylation (H3K9me3) represents a fundamental epigenetic mark associated with transcriptionally repressed heterochromatin. This in-depth technical review examines the established role of H3K9me3 in maintaining genomic stability through silencing repetitive elements and its emerging functions in cell fate determination and disease pathogenesis. Within the broader context of ChIP-seq analysis research for H3K4me3, H3K27me3, and H3K9me3, we detail the specialized methodologies required for investigating this repressive mark, summarize key biological findings through structured data presentation, and explore the therapeutic potential of targeting the H3K9me3 regulatory machinery in human malignancies, particularly acute myeloid leukemia.
H3K9me3 demarcates transcriptionally silent genomic regions and serves as a cornerstone of constitutive heterochromatin, particularly at pericentromeric and telomeric regions [30] [31]. Beyond its traditional role in genomic stability, emerging evidence identifies H3K9me3 as a dynamic regulator of lineage-specific gene expression during cellular differentiation and development [30] [31] [32]. This positions H3K9me3 alongside other critical histone modifications like the activating H3K4me3 and the repressive H3K27me3 as essential markers for comprehensive epigenomic mapping using Chromatin Immunoprecipitation followed by sequencing (ChIP-seq).
Unlike the facultative heterochromatin mark H3K27me3, which maintains regions accessible to transcription factors and paused RNA polymerase, H3K9me3 domains are typically inaccessible to DNA-binding factors [30] [31]. This fundamental difference in chromatin accessibility necessitates distinct analytical approaches for ChIP-seq data interpretation. The following sections provide a technical examination of H3K9me3's molecular regulation, biological functions, and analysis methodologies.
Molecular Mechanisms of H3K9me3 Establishment and Function
Writers, Readers, and Erasers
The H3K9me3 landscape is dynamically regulated by a precise enzymatic machinery:
- Methyltransferases (Writers): SUV39H1, SUV39H2, and SETDB1 primarily catalyze H3K9me3, with SUV39H enzymes preferring H3K9me1 substrates to establish H3K9me3, while SETDB1 can mono-, di-, and tri-methylate H3K9me0 in vitro [30] [31]. G9a and GLP contribute to earlier methylation states (H3K9me1/2) in euchromatic regions [30].
- Reader Proteins: Heterochromatin Protein 1 (HP1) recognizes and binds to H3K9me2/3 marks through its chromodomain. Through self-oligomerization and interactions with other repressive complexes, HP1 facilitates chromatin compaction and spreading of heterochromatin [30] [33].
- Demethylases (Erasers): Enzymes such as KDM3A and KDM4C remove H3K9 methylation, providing dynamic regulation of this epigenetic mark and enabling developmental gene activation [31].
Heterochromatin Assembly and Physical States
H3K9me3-dependent heterochromatin formation occurs through both RNAi-dependent and RNAi-independent mechanisms [30]. In fission yeast and plants, RNAi machinery components are essential for constitutive heterochromatin formation, while transcription factor-mediated recruitment of H3K9 methyltransferases represents a key RNAi-independent pathway [30].
Recent research suggests heterochromatin exists in multiple physical states regulated by HP1a protein:
- A soluble state allowing DNA access
- A liquid-droplet state regulating gene repression through phase separation
- A gel-like state characterizing constitutive heterochromatin with structural functions [30]
Table 1: Key Enzymes Regulating H3K9me3 Dynamics
| Enzyme | Role | Specific Function |
|---|---|---|
| SUV39H1/SUV39H2 | Methyltransferase | Preferentially catalyzes H3K9me3, crucial for pericentromeric heterochromatin [30] |
| SETDB1 | Methyltransferase | Mono-, di-, and tri-methylates H3K9; silences developmental genes in ES cells [30] [31] |
| G9a/GLP | Methyltransferase | Establishes H3K9me1/2 in euchromatic regions [30] |
| HP1 (α,β,γ) | Reader | Binds H3K9me2/3; facilitates compaction through self-oligomerization [30] [33] |
| KDM4D | Demethylase | Removes H3K9me3 marks; improves somatic cell nuclear transfer efficiency [34] |
Figure 1: H3K9me3 Establishment and Recognition Pathway. The diagram illustrates the stepwise methylation of H3K9 by specific methyltransferases, recognition by HP1 proteins, and the reversal by demethylases.
Biological Functions of H3K9me3
Genomic Stability and Repetitive Element Silencing
H3K9me3 serves as a crucial guardian of genomic integrity by packaging repeat-rich sequences at centromeres and telomeres into constitutive heterochromatin [30] [31]. This silencing function prevents aberrant recombination between conserved genomic portions and maintains chromosome stability [30]. Recent research has highlighted the role of H3K9me3 in forming boundaries that maintain centromere position, size, and number, with loss of these boundaries leading to progressive expansion of CENP-A domains and nucleation of additional functional centromeres [35].
Cell Identity and Lineage Commitment
During cellular differentiation, H3K9me3 domains are reorganized to silence lineage-inappropriate genes, thereby promoting stable cell identity [30] [31]. In murine ES cells, Setdb1 binds and silences developmental regulatory genes and functions as a co-repressor of Oct3/4 to suppress trophoblast genes [31]. Conversely, Oct3/4 positively regulates the expression of demethylases KDM3A and KDM4C, which remove H3K9me2/3 from pluripotency genes like Tcl1 and Nanog [31].
Barrier to Cellular Reprogramming
H3K9me3 domains constitute a major barrier to changes in cell identity, impeding reprogramming of terminally differentiated cells into induced pluripotent stem cells (iPSCs) [31] [32]. During reprogramming, large regions marked by H3K9me3 prevent binding of the Yamanaka factors (Oct4, Sox2, Klf4, c-Myc) in fibroblast genomes, while these same regions are accessible in pluripotent cells [31]. Reduction of H3K9me3 levels significantly improves reprogramming efficiency in somatic cell nuclear transfer (SCNT) experiments [34].
Table 2: H3K9me3 Functions in Development and Disease
| Biological Context | H3K9me3 Function | Experimental Evidence |
|---|---|---|
| Early Embryogenesis | Differential establishment in maternal vs. paternal genomes; paternal pericentromeres show H3K9me1 and H3K27me3 instead [30] | Studies in zygotes showing asymmetric patterns [30] |
| Cell Fate Stability | Silences lineage-inappropriate genes in differentiated cells [31] [32] | Setdb1 knockout in ES cells leads to derepression of developmental genes [31] |
| Cellular Reprogramming | Acts as a barrier to iPSC generation; impedes transcription factor binding [31] [32] | Only <0.1% of cells successfully reprogram; H3K9me3 demethylation improves efficiency [32] |
| Cancer Pathogenesis | Aberrant methylation silences tumor suppressor genes in AML [33] | Preferential decrease of H3K9me3 at core promoter regions in AML blasts [33] |
| Centromere Stability | Forms boundaries maintaining centromere position and size [35] | Loss of H3K9me3 leads to CENP-A domain expansion and ectopic centromeres [35] |
Analytical Approaches: ChIP-seq for H3K9me3
Specialized Methodologies for H3K9me3 Mapping
The ENCODE consortium has established specific guidelines for H3K9me3 ChIP-seq due to its unique enrichment in repetitive genomic regions [36]. Key methodological considerations include:
- Sequencing Depth: Tissues and primary cells should have 45 million total mapped reads per replicate - significantly higher than requirements for narrow histone marks [36].
- Library Complexity: Preferred quality metrics include NRF > 0.9, PBC1 > 0.9, and PBC2 > 10 [36].
- Peak Calling: The broad-domain nature of H3K9me3 requires specialized peak-calling algorithms different from those used for punctate transcription factor binding sites [36].
Advanced methodologies like Gradient-seq have been developed to directly map compacted heterochromatin by separating sonication-resistant heterochromatin (srHC) from euchromatic fractions [30]. This method has revealed that srHC strongly correlates with H3K9me3, DNA methylation, Lamin B association, and DNase inaccessibility [30].
Comparative Analysis with Other Histone Marks
In computational analyses of histone modifications, H3K9me3 consistently clusters with H3K27me3 as heterochromatin marks, distinct from the active chromatin marks H3K4me3, H3K9ac, and H3K27ac [26]. This clustering reflects their shared repressive functions despite their distinct mechanisms of action.
Recent research in fungal models has identified distinct facultative heterochromatin subcompartments: K4-fHC (adjacent to euchromatin) and K9-fHC (adjacent to constitutive heterochromatin), each with different patterns of gene content and chromatin regulation [37]. These findings demonstrate the complex interplay between different histone modifications in organizing chromosomal domains.
Figure 2: Experimental Workflow for H3K9me3 Heterochromatin Analysis. The diagram outlines key steps from chromatin preparation through to bioinformatic identification of heterochromatin domains, highlighting the separation of sonication-resistant heterochromatin.
H3K9me3 in Disease and Therapeutic Targeting
Role in Acute Myeloid Leukemia and Other Cancers
In acute myeloid leukemia (AML), alterations in H3K9 methylation at promoter regions are associated with inactivation of tumor suppressor genes, blocked differentiation, and deregulated proliferation [33]. Comparative analysis of AML samples versus normal CD34+ stem cells revealed a preferential decrease in H3K9me3 at core promoter regions in AML blasts, with approximately 20% of differentially modified loci showing greater than 2-fold change [33].
Beyond hematological malignancies, H3K9me3 dysregulation has been documented in solid tumors. In pancreatic cancer metastasis, global changes in H3K9 methylation status provide selective advantage and increased treatment resistance without changes to the somatic mutation burden [33].
Emerging Therapeutic Strategies
The reversible nature of H3K9 trimethylation makes its regulatory enzymes attractive therapeutic targets. Current strategies include:
- G9a Inhibitors: Treatment with G9a inhibitors (G9ai) reduces H3K9me1/2 levels, causing secondary loss of H3K9me3 and significantly improving development of mouse SCNT embryos [34]. Combined G9ai and trichostatin A treatment increased cloning efficiency to 14.5% [34].
- Histone Demethylase Activators: Forcing expression of demethylases like KDM4C and KDM3A to remove repressive H3K9 methylation marks [31].
- Combination Epigenetic Therapy: Leveraging the interplay between H3K9me3 and DNA methylation, where loss of H3K27me3 LOCKs in tumors leads to H3K9me3 redistribution [14].
The Scientist's Toolkit: Essential Research Reagents
Table 3: Key Research Reagents for H3K9me3 Investigation
| Reagent Category | Specific Examples | Research Application |
|---|---|---|
| H3K9me3-specific Antibodies | Validated ChIP-grade antibodies | Immunoprecipitation of H3K9me3-associated chromatin for sequencing [36] |
| Methyltransferase Inhibitors | G9a inhibitors (RK-701) | Reduce H3K9me1/2 levels with secondary effects on H3K9me3 [34] |
| Histone Demethylase Enzymes | KDM4D, KDM3A, KDM4C mRNA | Experimental removal of H3K9me3 marks to improve reprogramming [31] [34] |
| Chromatin Assembly Factors | HP1 proteins (α, β, γ isoforms) | Study heterochromatin formation and phase separation mechanisms [30] [33] |
| Epigenetic Modulators | Trichostatin A (HDAC inhibitor) | Combined treatment to enhance H3K9me3 demethylation and zygotic genome activation [34] |
H3K9me3 represents a dynamic epigenetic mark with far-reaching functions beyond its classical role in constitutive heterochromatin. As a key regulator of cell identity and genomic stability, its precise manipulation offers promising therapeutic avenues for cancer and regenerative medicine. Future research should focus on elucidating the RNA-dependent mechanisms of H3K9me2/3 establishment in mammalian systems, the molecular basis for tissue-specific H3K9me3 domain organization, and developing more selective inhibitors targeting the H3K9me3 regulatory machinery. The integration of H3K9me3 mapping with other epigenomic datasets will continue to reveal new insights into chromosomal organization and gene regulatory networks in health and disease.
Biological Implications in Development, Differentiation, and Disease Pathogenesis
The packaging of DNA into chromatin is a dynamic regulator of gene expression, and post-translational modifications of histone proteins serve as a primary mechanism for controlling this dynamic process [38]. Among these modifications, the trimethylation of lysine residues on histone H3—specifically, H3K4me3, H3K27me3, and H3K9me3—constitutes a critical epigenetic layer governing cell identity, developmental transitions, and disease states [38] [26]. These marks form a complex regulatory language: H3K4me3 is predominantly associated with active gene promoters, H3K27me3 with facultative heterochromatin and repressed developmental genes, and H3K9me3 with constitutive heterochromatin and long-term silencing [38] [26]. The precise profiling of their genomic locations is essential for understanding transcriptional control.
Chromatin Immunoprecipitation followed by sequencing (ChIP-seq) has been the cornerstone method for generating genome-wide maps of these histone modifications [38]. By capturing a snapshot of protein-DNA interactions in vivo, ChIP-seq enables researchers to correlate the presence of specific histone marks with gene expression outcomes, thereby deciphering their biological functions [38]. This technical guide explores the roles of H3K4me3, H3K27me3, and H3K9me3 in development, differentiation, and disease, detailing the experimental and computational frameworks for their analysis and presenting key findings that underscore their therapeutic relevance.
Functional Roles of Key Histone Modifications
The table below summarizes the core functions and genomic distributions of H3K4me3, H3K27me3, and H3K9me3.
Table 1: Core Functional Characteristics of H3K4me3, H3K27me3, and H3K9me3
| Histone Mark | Associated Enzyme(s) | Primary Genomic Location | Transcriptional Role | Key Biological Functions |
|---|---|---|---|---|
| H3K4me3 | COMPASS/MLL complexes | Transcription Start Sites (TSS), Promoters [39] [40] | Activation [39] [26] | Promotes open chromatin; marks active and poised genes [38] [39] |
| H3K27me3 | Polycomb Repressive Complex 2 (PRC2) [21] [14] | Promoters, Gene bodies; can form broad domains (LOCKs) [21] [14] | Repression [21] [26] | Silences developmental genes; maintains cell identity; forms bivalent domains with H3K4me3 [38] [21] |
| H3K9me3 | SUV39H, SETDB1 | Constitutive heterochromatin, repetitive elements [38] [26] | Repression [26] | Maintains genomic stability; silences repeats and transposons [38] [14] |
Distinct and Combinatorial Signaling
These histone modifications rarely function in isolation. A quintessential example of their interplay is the bivalent domain, where a promoter is co-marked by the activating H3K4me3 and the repressing H3K27me3 [21]. This configuration maintains key developmental genes in a poised state, ready for rapid activation or stable silencing upon receiving differentiation cues [21] [14]. In embryonic stem cells (ESCs), over 85% of H3K27me3-marked promoters are bivalent, enriching for lineage-specific transcription factors [14].
Furthermore, these marks can form large chromatin domains. H3K27me3 Large Organized Chromatin Lysine Domains (LOCKs), spanning hundreds of kilobases, are strongly associated with developmental functions and show dynamic redistribution in cancer [14]. An antagonistic relationship exists between H3K27me3 and DNA methylation, as they exhibit negative correlation and limited genomic overlap [14].
Experimental Methodologies for ChIP-seq Profiling
Standard Chromatin Immunoprecipitation (ChIP-seq) Protocol
The standard ChIP-seq protocol involves crosslinking proteins to DNA in living cells, followed by chromatin fragmentation, immunoprecipitation with specific antibodies, and high-throughput sequencing [38]. The following diagram illustrates this core workflow.
Diagram 1: ChIP-seq Experimental Workflow
Detailed Protocol Steps:
- Crosslinking: Treat cells with 1% formaldehyde for 10 minutes at room temperature to covalently crosslink histones to DNA. Quench the reaction with glycine [38] [21].
- Cell Lysis and Chromatin Preparation: Resuspend cell pellets in cell lysis buffer (e.g., 5 mM PIPES pH 8, 85 mM KCl, 1% igepal) with protease inhibitors. Pellet nuclei and resuspend in nuclei lysis buffer (e.g., 50 mM Tris-HCl pH 8, 10 mM EDTA, 1% SDS) [38].
- Chromatin Fragmentation: Sonicate chromatin using a focused ultrasonicator (e.g., Bioruptor) to shear DNA to fragments between 200–500 bp. Critical optimization is required to achieve appropriate fragment size [38] [21].
- Immunoprecipitation: Dilute sheared chromatin in IP dilution buffer and incubate with validated, histone modification-specific antibodies overnight at 4°C [38].
- Recovery of Complexes: Add protein A/G magnetic beads to capture antibody-bound complexes. Wash beads extensively with low-salt and high-salt buffers to remove non-specific binding [38].
- Elution and Reverse Crosslinks: Elute protein-DNA complexes from beads using elution buffer (e.g., 50 mM NaHCO3, 1% SDS). Reverse crosslinks by incubating at 65°C with high salt [38].
- DNA Purification: Treat samples with RNase A and proteinase K. Purify DNA using a PCR purification kit (e.g., QIAquick from QIAGEN) [38].
- Library Preparation and Sequencing: Prepare sequencing libraries from purified ChIP DNA using kits for the Illumina platform. The library is then amplified and sequenced [38] [21].
Advanced and Low-Input Methods
For samples with limited cell numbers, such as preimplantation embryos or rare cell populations, CUT&Tag (Cleavage Under Targets and Tagmentation) offers a powerful alternative [40]. This method uses a protein A-Tn5 transposase fusion protein targeted by antibodies to simultaneously cleave and tag genomic regions with sequencing adapters in situ, bypassing crosslinking, fragmentation, and library prep steps required in ChIP-seq [40]. A modified version, NON-TiE-UP CUT&Tag (NTU-CAT), has been successfully applied to profile H3K4me3 and H3K27me3 in single bovine blastocysts [40].
Data Analysis and Quality Control
Key Analytical Steps for ChIP-seq Data
- Read Alignment and Quality Control: Map sequenced reads to a reference genome (e.g., hg38) using aligners like BWA-MEM. Tools like FastQC assess raw read quality [41].
- Peak Calling: Identify significantly enriched regions using tools such as MACS2. H3K4me3 typically produces narrow peaks, while H3K27me3 and H3K9me3 often form broad domains, requiring appropriate settings [14] [41].
- Genome Partitioning and Domain Identification: For broad marks, partitioning algorithms (e.g., ChIP-Part) can segment the genome into signal-rich and signal-poor regions. The CREAM package can identify large domains like H3K27me3 LOCKs [14] [42].
- Differential Enrichment and Integrative Analysis: Compare peak signals between conditions to identify dynamic changes. Integration with RNA-seq data is crucial to correlate epigenetic states with gene expression [43] [41].
Critical Quality Control Checkpoints
- Fragment Size: Post-sonication fragment size should be verified, ideally 200-500 bp [38].
- Antibody Specificity: Use ChIP-grade antibodies validated for specificity to avoid false positives [38].
- Library Complexity: Ensure high complexity of the final library to guarantee even genome coverage [38].
Biological Implications in Development and Disease
Roles in Normal Development and Differentiation
The coordinated action of H3K4me3 and H3K27me3 is fundamental to maintaining pluripotency and guiding differentiation. In ESCs, PRC2-dependent H3K27me3 represses developmental gene promoters, many of which are simultaneously marked by H3K4me3, creating a bivalent, poised state [21] [14]. Upon differentiation, resolution of bivalency—loss of H3K27me3 for activation or loss of H3K4me3 for stable silencing—directs cells toward specific lineages [14]. H3K9me3, in contrast, stabilizes heterochromatin and silences repetitive elements, ensuring genomic integrity during rapid cell divisions [38].
Dysregulation in Human Disease and Cancer
Dysregulation of these epigenetic marks is a hallmark of cancer, driving aberrant gene expression programs that promote tumorigenesis [14] [43] [41].
- H3K27me3 Redistribution in Cancer: In tumors, the distribution of H3K27me3 LOCKs is reconfigured. In normal cells, long H3K27me3 LOCKs are often found in partially methylated domains (PMDs) and help suppress oncogenes. In cancer cell lines (e.g., from esophageal and breast cancer), these long LOCKs shift away from short-PMDs, and a subset shows reduced H3K9me3, suggesting H3K27me3 may compensate for H3K9me3 loss to maintain silencing [14].
- Metabolic and Microenvironmental Influence: Studies in breast cancer cells (MCF7) under hypoxia revealed that H3K4me3 and H3K27me3 markings are dynamically modulated. Hypoxia can induce bivalency at promoters of developmental genes, a mechanism that may contribute to tumor cell plasticity and adaptation [43].
- Epigenetic Dysregulation in Breast Cancer Subtypes: Integrative analysis of H3K4me3 ChIP-seq and RNA-seq in breast cancer cell lines has identified subtype-specific miRNA-gene regulatory networks. For instance, distinct H3K4me3 patterns at miRNA promoters in triple-negative breast cancer (TNBC) versus luminal-A subtypes correlate with differential expression of target genes involved in cancer pathways [41].
Table 2: Key Research Reagent Solutions for ChIP-seq Analysis
| Reagent / Resource | Specification / Example | Critical Function |
|---|---|---|
| Crosslinking Agent | Formaldehyde (37%) [38] | Covalently links DNA and associated proteins in vivo |
| Chromatin Shearing Device | Bioruptor Sonicator (Diagenode) [38] | Fragments chromatin to 200-500 bp for immunoprecipitation |
| Core Histone Modification Antibodies | H3K4me3: CST #9751S; H3K27me3: Millipore #07-449; H3K9me3: CST #9754S [38] [21] | Specific immunoprecipitation of target histone mark |
| DNA Purification Kit | QIAquick PCR Purification Kit (QIAGEN) [38] | Purification of immunoprecipitated DNA after reverse crosslinking |
| Sequencing Platform | Illumina Genome Analyzer / NovaSeq [38] | High-throughput sequencing of ChIP DNA fragments |
| Alignment Software | BWA-MEM [41] | Maps sequenced reads to a reference genome |
| Peak Calling Software | MACS2 (Model-based Analysis of ChIP-Seq) [41] | Identifies statistically significant regions of enrichment |
The following diagram illustrates how the interplay of histone modifications contributes to cell fate decisions and how their dysregulation leads to disease, particularly cancer.
Diagram 2: Histone Modification Dynamics in Fate and Disease
The combinatorial analysis of H3K4me3, H3K27me3, and H3K9me3 through ChIP-seq provides a powerful lens through which to view the mechanisms of development, differentiation, and disease. The ability to map these marks genome-wide has revealed fundamental principles of gene regulation, including the poised state of bivalent promoters and the large-scale organization of repressive chromatin. The dynamic redistribution of these marks, particularly H3K27me3 LOCKs, in diseases like cancer, highlights their profound clinical relevance. As low-input methods like CUT&Tag become more widespread, and as integrative multi-omics analyses become more sophisticated, our understanding of this epigenetic code will deepen. This knowledge is paving the way for novel therapeutic strategies, including epigenetic drugs that target the writers and erasers of these marks, offering new hope for modulating the epigenome in human disease.
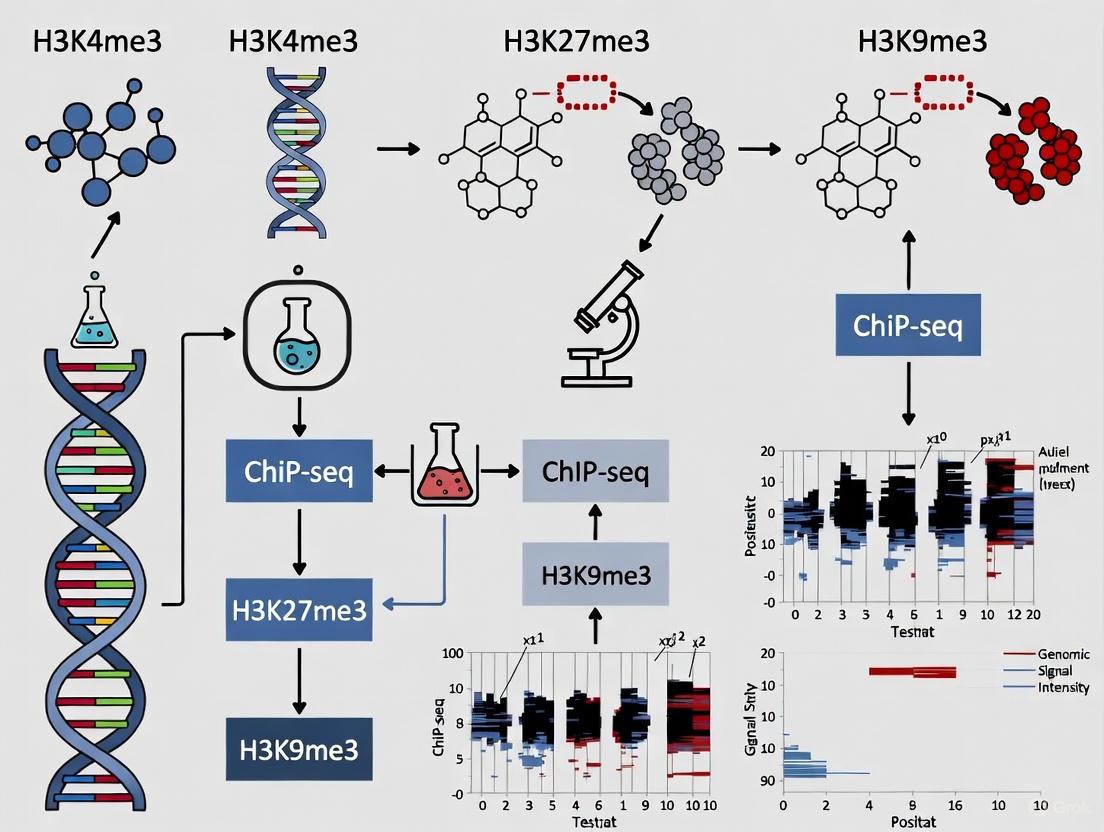
Practical ChIP-seq Workflow: From Sample to Insight for H3K4me3, H3K27me3, and H3K9me3
Chromatin Immunoprecipitation followed by sequencing (ChIP-seq) is a powerful technique for mapping the genome-wide locations of DNA-associated proteins and post-translational histone modifications, providing critical insights into epigenetic regulatory mechanisms [44]. This method enables researchers to capture a snapshot of specific protein-DNA interactions in vivo, forming a cornerstone for understanding gene regulation in development, disease, and cellular differentiation [45]. For researchers investigating the histone modifications H3K4me3, H3K27me3, and H3K9me3, ChIP-seq offers unparalleled capability to identify where these key epigenetic marks are located across the genome, thereby elucidating their roles in activating or repressing gene expression [28] [46]. The technique's principle involves crosslinking and stabilizing protein-DNA complexes, shearing chromatin into workable fragments, immunoprecipitating target complexes with specific antibodies, and then sequencing the bound DNA fragments to map their genomic locations [45] [44].
Step-by-Step Experimental Protocol
Crosslinking: Stabilizing Protein-DNA Interactions
ChIP-seq begins with covalent stabilization of protein-DNA complexes using crosslinking reagents. Formaldehyde serves as the primary crosslinker, effectively trapping direct protein-DNA interactions through zero-length crosslinks. For investigating higher-order complexes or capturing interactions involving larger protein assemblies, longer crosslinkers such as ethylene glycol bis(succinimidyl succinate) (EGS, 16.1 Å) or disuccinimidyl glutarate (DSG, 7.7 Å) may be used in combination with formaldehyde [45]. The crosslinking process is typically performed by adding formaldehyde directly to cells to a final concentration of 1% and incubating for 8-10 minutes at room temperature. The reaction is then quenched with 125 mM glycine [47]. Critical considerations for this step include optimizing crosslinking duration—insufficient time results in inefficient crosslinking, while excessive crosslinking leads to difficulty in chromatin shearing and reduced antigen accessibility [45]. After crosslinking, cell pellets can be stored at -80°C, providing a convenient stopping point.
Cell Lysis and Chromatin Preparation
Following crosslinking, cells are lysed using detergent-based lysis solutions to liberate cellular components while maintaining crosslinked protein-DNA complexes. To reduce background signal and increase sensitivity, the nuclear fraction is often isolated from cytoplasmic components using specialized extraction buffers [45] [47]. A typical protocol involves sequential incubation in two different nuclear extraction buffers: the first (e.g., containing 50 mM HEPES-NaOH pH=7.5, 140 mM NaCl, 1 mM EDTA, 10% Glycerol, 0.5% NP-40, 0.25% Triton X-100) gently permeabilizes cells, while the second (e.g., 10 mM Tris-HCl pH=8.0, 200 mM NaCl, 1 mM EDTA, 0.5 mM EGTA) further purifies the nuclear fraction [47]. Protease and phosphatase inhibitors are essential throughout this process to maintain intact protein-DNA complexes [45]. Successful cell lysis can be visually confirmed by comparing whole cells versus nuclei under a microscope using a hemocytometer [45].
Chromatin Shearing: Sonication and Enzymatic Fragmentation
The extracted chromatin must be fragmented into manageable pieces for subsequent analysis. The ideal fragment size ranges from 200-700 bp, with different optimal sizes for various protein targets: 150-300 bp for histone targets and 200-700 bp for non-histone targets [47]. Two primary methods are employed for chromatin fragmentation:
- Sonication: Uses ultrasonic energy to physically shear DNA and provides truly randomized fragments. Limitations include the requirement for dedicated equipment, potential heat generation requiring careful temperature control, extended hands-on time, and extensive optimization needs [45].
- Enzymatic Digestion: Employes micrococcal nuclease (MNase) for highly reproducible fragmentation. MNase preferentially cleaves internucleosomal regions, resulting in less random fragmentation patterns compared to sonication [45].
Table 1: Comparison of Chromatin Fragmentation Methods
| Parameter | Sonication | Enzymatic Digestion (MNase) |
|---|---|---|
| Fragment Distribution | Randomized | Preferential for nucleosome-free regions |
| Reproducibility | Requires extensive optimization | Highly reproducible |
| Equipment Needs | Dedicated sonicator | Standard laboratory equipment |
| Temperature Sensitivity | High (must be kept on ice) | Low |
| Hands-on Time | Extended | Minimal |
| Cost | High initial equipment cost | Recurrent enzyme cost |
Specialized sonication buffers are recommended for different targets. For histone modifications, a buffer containing 1% SDS (e.g., 50 mM Tris-HCl pH=8.0, 10 mM EDTA, 1% SDS, protease inhibitors) is commonly used, while for transcription factors and non-histone targets, a milder buffer without SDS (e.g., 10 mM Tris-HCl pH=8.0, 100 mM NaCl, 1 mM EDTA, 0.5 mM EGTA, 0.1% sodium deoxycholate, 0.5% sodium lauroylsarcosine) is preferred [47]. After shearing, cell debris is pelleted by centrifugation at 17,000 × g for 15 minutes at 4°C, and the supernatant containing sheared chromatin is collected for subsequent steps [47].
Immunoprecipitation: Target Enrichment
Immunoprecipitation selectively enriches chromatin fragments bound to the protein or histone modification of interest using specific antibodies. Prior to immunoprecipitation, magnetic beads (Protein A, Protein G, or a 50:50 mixture) are prepared by washing with ice-cold PBS and blocking with buffer containing BSA [47]. The choice between monoclonal, polyclonal, or recombinant antibodies depends on application requirements. Polyclonal antibodies often recognize multiple epitopes and may provide better detection, while monoclonal antibodies offer higher specificity [45]. For histone modification studies, antibody validation is particularly crucial—for example, an antibody against H3K9me2 should not cross-react with H3K9me1 or H3K9me3, as these marks have distinct biological functions [45].
The immunoprecipitation process involves incubating the sheared chromatin with antibody-bound beads for approximately 6 hours or overnight at 4°C with gentle rotation [47]. Typical antibody amounts are 4 μg for histone targets and 8 μg for non-histone targets per immunoprecipitation reaction [47]. Following incubation, beads are washed with buffers of increasing stringency (e.g., RIPA-150: 50 mM Tris-HCl pH=8.0, 150 mM NaCl, 1 mM EDTA, 0.1% SDS, 1% Triton X-100, 0.1% sodium deoxycholate) to remove non-specifically bound chromatin [47]. After washing, protein-DNA complexes are eluted from the beads, and crosslinks are reversed by incubation with proteinase K at 65°C [45] [47]. Finally, DNA is purified and prepared for sequencing.
Sequencing and Data Analysis
The immunoprecipitated DNA is processed for next-generation sequencing, which involves library preparation where adapters are ligated to DNA fragments, followed by massive parallel sequencing [44]. For studies comparing different biological states (e.g., drug treatments or genetic manipulations), differential ChIP-seq analysis is performed using computational tools specifically designed to handle different peak characteristics [48].
Table 2: Recommended Computational Tools for Differential ChIP-seq Analysis Based on Peak Characteristics
| Peak Type | Biological Scenario | Recommended Tools | Key Considerations |
|---|---|---|---|
| Transcription Factors (sharp peaks) | Balanced changes (50:50) | bdgdiff, MEDIPS, PePr | High positional accuracy required |
| Sharp Histone Marks (H3K4me3, H3K27ac) | Global decrease (100:0) | csaw, NarrowPeaks | Normalization critical for global changes |
| Broad Histone Marks (H3K27me3, H3K9me3) | Balanced changes (50:50) | SICER2, hiddenDomains | Tools must handle diffuse signals |
| Broad Histone Marks (H3K27me3, H3K9me3) | Global decrease (100:0) | ChromHMM, BATH | Chromatin state analysis beneficial |
Recent advances in computational analysis include tools like BATH (Bayesian Analysis for Transitions of Histone States), which quantitatively analyzes chromatin state dynamics between different cell types and has proven particularly useful for tracking changes in H3K27me3 patterns during cellular differentiation [46]. For visualization, platforms such as SeqCode provide standardized approaches for generating occupancy plots (meta-plots), density heatmaps, and other representations that facilitate biological interpretation [49].
Research Reagent Solutions
Table 3: Essential Reagents for ChIP-seq Experiments
| Reagent Category | Specific Examples | Function & Application Notes |
|---|---|---|
| Crosslinkers | Formaldehyde, EGS, DSG | Stabilize protein-DNA interactions; choice depends on interaction distance |
| Cell Lysis Buffers | Nuclear Extraction Buffer 1 & 2 | Isolate nuclear fraction; reduce cytoplasmic background |
| Shearing Reagents | Micrococcal nuclease (MNase), Sonication buffers | Fragment chromatin; method choice affects fragment distribution |
| Immunoprecipitation Beads | Protein A/G magnetic beads | Bind antibody-chromatin complexes; enable magnetic separation |
| Wash Buffers | RIPA-150, High-salt buffers | Remove non-specifically bound chromatin; increasing stringency reduces background |
| Antibodies | H3K4me3, H3K27me3, H3K9me3 specific | Key reagent for target specificity; require validation for ChIP applications |
| DNA Purification | Proteinase K, Phenol-chloroform, Columns | Reverse crosslinks, purify DNA for sequencing |
Workflow Diagram
The ChIP-seq methodology provides a comprehensive approach for mapping genome-wide protein-DNA interactions, with particular utility for investigating histone modifications such as H3K4me3, H3K27me3, and H3K9me3 in epigenetic research. Each step—from crosslinking through sequencing—requires careful optimization and validation to ensure specific and reproducible results. As computational methods continue to advance, integration of ChIP-seq with other genomic datasets will further enhance our understanding of epigenetic regulation in development, disease, and drug discovery.
Selecting and Validating High-Quality Antibodies for Specific Histone Marks
The accuracy of chromatin immunoprecipitation followed by sequencing (ChIP-seq) data for histone post-translational modifications (PTMs) hinges entirely on the specificity and quality of the antibodies employed. Histone antibodies that recognize modifications such as H3K4me3, H3K27me3, and H3K9me3 are fundamental reagents for understanding the regulatory landscapes that control gene expression in development, disease, and drug response [50]. However, these reagents are notoriously challenging to develop and validate. Alarming studies have demonstrated that a significant proportion of commercially available histone PTM antibodies exhibit unacceptable rates of cross-reactivity or poor binding efficiency in chromatin mapping assays, potentially leading to incorrect biological conclusions [51] [50]. For instance, one analysis found that over 70% of tested commercial histone PTM antibodies showed unacceptable cross-reactivity in chromatin mapping assays [51]. This technical whitepaper provides an in-depth guide for researchers and drug development professionals on selecting and validating high-quality antibodies for specific histone marks, framed within the context of robust ChIP-seq research.
The Histone Antibody Specificity Challenge
The fundamental challenge in histone immunoprecipitation stems from the biological reality of the histone code itself. The N-terminal tails of histones are densely packed with potentially modifying residues, and antibodies must distinguish between highly similar states, such as mono-, di-, and trimethylation on a single lysine residue [52]. Furthermore, the presence of neighboring PTMs can profoundly influence antibody binding, a phenomenon known as neighboring PTM sensitivity [50].
The pitfalls of using poorly validated antibodies are significant and can manifest in several ways:
- Off-Target Recognition: An antibody may pull down chromatin marked with a similar, but functionally distinct, PTM. For example, an H3K4me3 antibody might cross-react with H3K4me2, leading to an inaccurate genomic map [50].
- Misleading Conclusions: Non-specific antibodies can generate ChIP-seq peaks at genomic locations that do not genuinely contain the target mark, resulting in flawed biological models [51] [53].
- Wasted Resources: The time and cost associated with performing ChIP-seq on multiple samples are substantial. Using an unreliable antibody can invalidate an entire study's worth of data.
A pivotal concept is that antibody performance is application-specific. An antibody that works superbly for western blotting, where it recognizes denatured, linear epitopes on a peptide array, may fail completely in ChIP-seq, where it must recognize its target in the context of a folded nucleosome within native chromatin [51] [53]. This distinction underscores why validation in the intended end application is non-negotiable.
Methodologies for Antibody Validation
Rigorous validation of histone PTM antibodies requires a multi-faceted approach. The most reliable strategies move beyond simple peptide-based assays to incorporate physiological nucleosome substrates.
Peptide Microarray Analysis
Peptide microarrays provide an initial assessment of antibody specificity. This method uses a library of hundreds of biotinylated histone peptides carrying known PTMs alone and in combination [50]. The antibody is incubated with the array, and its binding profile is measured.
- Procedure: A high-density histone peptide microarray is constructed. The candidate antibody is applied to the array, and binding is detected using a fluorescently labeled secondary antibody. The signal intensity for each peptide is quantified and normalized.
- Data Interpretation: Specificity is determined by calculating a "specificity factor"—the ratio of the average intensity for all spots containing the target PTM to those lacking it [52]. A specific antibody shows strong, exclusive binding only to its intended target peptide.
- Limitations: As this is a denaturing assay using linear peptides, it cannot predict performance in a native chromatin context like ChIP-seq [51] [53].
SNAP-ChIP / ICeChIP Assay
The SNAP-ChIP (Sample Normalization and Antibody Profiling for Chromatin Immunoprecipitation) assay, also known as ICeChIP, is considered a gold standard for validating antibodies for ChIP applications because it uses the physiological substrate: the nucleosome [53].
- Procedure: A panel of semi-synthetic nucleosomes, each containing a specific histone PTM (e.g., unmethylated, mono-, di-, and trimethylated forms of H3K4, H3K9, H3K27, etc.) and wrapped with a unique DNA barcode, is spiked into the native chromatin sample before immunoprecipitation [51] [53]. After the ChIP workflow, the precipitated DNA barcodes are quantified via qPCR or sequencing.
- Data Interpretation: The recovery of each barcoded nucleosome is measured. Antibody specificity is calculated as the percentage of the target nucleosome immunoprecipitated relative to off-target nucleosomes. Efficiency is measured as the percentage of the target nucleosome recovered relative to the input amount [53].
- Advantages: This method directly quantifies both specificity and efficiency in the context of a ChIP assay, providing a definitive metric for antibody performance. EpiCypher's SNAP-Certified antibodies, for example, must demonstrate less than 20% cross-reactivity to related PTMs [51].
Table 1: Key Performance Metrics for SNAP-Certified Histone Antibodies
| Performance Metric | Definition | Passing Threshold (Example) |
|---|---|---|
| Specificity | Ability to isolate the target epitope without cross-reactivity | <20% cross-reactivity to related PTMs in SNAP spike-in panel [51] |
| Efficiency | Affinity and ability to recover the target epitope | Consistent genomic enrichment across a 10-fold dilution of cell inputs [51] |
| Reproducibility | Consistent performance between production lots | Each lot individually tested to ensure consistency [51] |
A Practical Guide to Antibody Selection
When selecting an antibody for ChIP-seq analysis of H3K4me3, H3K27me3, or H3K9me3, researchers should follow a systematic approach to ensure data quality.
Defining Antibody Quality
A high-quality antibody for ChIP-seq is defined by three core features [51]:
- High Specificity: The antibody reliably isolates the target epitope and nothing else. It should distinguish between methylation states and resist interference from neighboring PTMs.
- High Target Efficiency: The antibody has sufficient affinity to deliver meaningful biological signals across diverse sample types, including low cell inputs or low-abundance epitopes.
- Reproducibility: The antibody performance is consistent across different production lots, ensuring experimental reliability over time.
Selection Workflow and Criteria
The following decision workflow outlines a robust process for selecting and validating a histone PTM antibody.
Table 2: Troubleshooting Guide for Antibody Validation
| Problem | Potential Cause | Solutions |
|---|---|---|
| High Background/Noise | Non-specific antibody binding | Use a more specific antibody; increase wash stringency; include a negative control IgG [51]. |
| Low Signal/Enrichment | Poor antibody efficiency or epitope inaccessibility | Use a higher efficiency antibody; optimize chromatin shearing; verify sample quality [51]. |
| Inconsistent Peaks Between Replicates | Antibody lot variability or poor reproducibility | Use a lot-validated antibody; ensure consistent experimental conditions across replicates [51] [36]. |
| Unexpected Peaks | Antibody cross-reactivity with off-target PTMs | Validate antibody with SNAP-ChIP or similar nucleosome-based assay to check for cross-reactivity [53] [50]. |
If a pre-validated antibody for your target is unavailable, EpiCypher recommends an empirical testing approach: obtain 3-5 monoclonal antibodies from various vendors targeting distinct epitopes and perform a small-scale CUT&RUN or ChIP experiment using the SNAP-CUTANA K-MetStat Panel or similar spike-in controls for quantitative assessment [51]. Notably, antibodies that perform well in immunofluorescence have been anecdotally observed to also work in CUT&RUN, though this is not a guarantee [51].
Experimental Protocols for Validation
SNAP-ChIP Protocol for Antibody Validation
This protocol is adapted from methodologies used to determine antibody specificity in ChIP applications [53].
- Cell Preparation and Cross-linking: Harvest and cross-link cells (e.g., HEK293) with 1% formaldehyde for 10 minutes at room temperature. Quench the reaction with glycine.
- Chromatin Preparation and Spike-in: Lyse cells and sonicate chromatin to a fragment size of 200–500 bp. Spike in the K-MetStat panel (or other relevant SNAP-ChIP controls) according to the manufacturer's instructions.
- Immunoprecipitation: Incubate the chromatin-spike-in mixture with the candidate antibody overnight at 4°C. Capture the antibody with protein A/G beads, then wash the beads with low-salt, high-salt, and LiCl wash buffers, followed by a TE buffer wash.
- DNA Elution and Decross-linking: Elute the immunoprecipitated DNA from the beads. Reverse cross-links by incubating with NaCl at 65°C overnight.
- qPCR Analysis: Purify the DNA and perform qPCR using primers specific to the DNA barcodes of the spike-in nucleosomes.
- Data Analysis: Calculate the % recovery for each nucleosome in the panel relative to its input. Determine antibody specificity as the percentage of the target nucleosome recovered versus off-target nucleosomes.
ChIP-seq Library Preparation and Quality Control
After antibody validation, the main ChIP-seq experiment must be performed to a high standard. The ENCODE consortium provides rigorous guidelines for histone ChIP-seq [36].
- Input Material: For broad histone marks like H3K27me3 and H3K9me3, the ENCODE standard is 45 million usable fragments per replicate. For narrow marks like H3K4me3, 20 million fragments are required. H3K9me3 is an exception due to its enrichment in repetitive regions and requires 45 million total mapped reads for tissues and primary cells [36].
- Controls: Each ChIP-seq experiment must include a corresponding input control with matching run type, read length, and replicate structure [36].
- Quality Control Metrics: Key quality metrics include the FRiP score (Fraction of Reads in Peaks), which should be reported, and library complexity measures such as NRF (Non-Redundant Fraction; preferred >0.9), PBC1 (PCR Bottlenecking Coefficient 1; preferred >0.9), and PBC2 (preferred >10) [36].
The Scientist's Toolkit: Research Reagent Solutions
Table 3: Essential Reagents for Histone PTM Antibody Validation and ChIP-seq
| Reagent / Tool | Function | Example Product / Note |
|---|---|---|
| Validated Histone PTM Antibodies | Target-specific immunoprecipitation in ChIP-seq. | SNAP-Certified antibodies; Invitrogen antibodies validated by SNAP-ChIP [51] [52] [53]. |
| SNAP-ChIP Spike-In Controls | Internal standards for quantifying antibody specificity and efficiency in ChIP. | K-MetStat Panel (barcoded nucleosomes with various lysine methylation states) [51] [53]. |
| Chromatin Shearing Equipment | Fragment chromatin to optimal size for immunoprecipitation. | Sonication systems (e.g., Bioruptor, Covaris) or enzymatic digestion kits. |
| MAGnify Chromatin Immunoprecipitation System | A commercial kit that streamlines the ChIP workflow. | Includes beads, buffers, and reagents for efficient and reproducible chromatin pull-down [52]. |
| Histone Antibody Specificity Database | Online resource to check preliminary antibody characterization data. | www.histoneantibodies.com; provides peptide microarray data for over 100 antibodies [50]. |
| ENCODE ChIP-seq Pipelines | Standardized bioinformatics workflows for processing ChIP-seq data. | Available on GitHub; ensures consistent mapping, peak calling, and quality control [36]. |
The integrity of ChIP-seq data for histone modifications is fundamentally dependent on the quality of the antibodies used. As the field of epigenetics continues to reveal the critical roles of marks like H3K4me3, H3K27me3, and H3K9me3 in health and disease, the demand for highly specific and well-validated reagents will only intensify. By adopting a rigorous validation framework centered on nucleosome-based methods like SNAP-ChIP, researchers can ensure their findings are accurate, reproducible, and biologically meaningful. This disciplined approach to antibody selection and validation is not merely a technical detail but a cornerstone of robust epigenetic research and successful therapeutic development.
Library Preparation and Next-Generation Sequencing Best Practices
Chromatin Immunoprecipitation followed by sequencing (ChIP-seq) has revolutionized our ability to study genome-wide epigenetic landscapes, providing unprecedented insights into gene regulatory mechanisms in development, disease, and drug discovery. For researchers investigating the histone modifications H3K4me3, H3K27me3, and H3K9me3, the library preparation phase represents a critical determinant of experimental success. These marks present distinct technical challenges due to their varying genomic distributions and biological functions. H3K4me3 typically forms sharp peaks at active promoters, H3K27me3 can form broad domains across repressed developmental genes, and H3K9me3 marks extensive heterochromatic regions. The fundamental goal of ChIP-seq library preparation is to convert immunoprecipitated DNA fragments into a sequenceable library that accurately represents the in vivo protein-DNA interactions, while maintaining complexity and minimizing biases. Optimal library preparation enables researchers to generate high-quality data that reliably captures the biological reality of chromatin states, forming a solid foundation for downstream analyses and scientific discovery.
Experimental Design Considerations for Histone Modification Analysis
Input Material Requirements and Sample Preparation
Successful ChIP-seq experiments begin with careful consideration of input requirements, which vary significantly depending on the histone mark being studied and the cellular context. The table below summarizes key input considerations for different scenarios:
Table 1: Input Requirements for Different Histone Modifications and Protocols
| Histone Mark | Cell Number Range | Protocol Type | Special Considerations | Citations |
|---|---|---|---|---|
| H3K4me3 | 10^4 - 10^6 cells | Crosslinking (XChIP) | Requires more material due to focused distribution; may need 2-4 additional PCR cycles during library prep | [54] |
| H3K27me3 | 10^3 - 10^6 cells | Native (NChIP) | Broad domains require higher sequencing depth; ULI-NChIP enables single-embryo PGC profiling | [54] |
| H3K9me3 | 10^3 - 10^6 cells | Native (NChIP) | High background possible with low inputs; excellent results with ULI-NChIP from 10^3 ESCs | [54] |
| Multiple marks | 1μg chromatin | Crosslinking (XChIP) | Suitable for primary cells and tissues; Roadmap Epigenomics standard | [38] |
For rare cell populations, ultra-low-input native ChIP (ULI-NChIP) protocols enable genome-wide profiling from as few as 1,000 cells by minimizing sample loss through optimized detergent-based nuclear isolation and avoiding pre-amplification steps that can introduce PCR artifacts [54]. This method allows researchers to sort cells directly into nuclear isolation buffer, enabling sample storage or pooling. For standard inputs, 1μg of chromatin isolated from approximately 1 million cells serves as a reliable starting point for most histone modification studies [38].
Crosslinking vs. Native ChIP Approaches
The choice between crosslinking (XChIP) and native (NChIP) approaches significantly impacts library quality and experimental outcomes:
Native ChIP (NChIP) utilizes micrococcal nuclease (MNase) digestion to fragment chromatin without formaldehyde crosslinking, preserving native histone-DNA interactions and offering improved resolution for histone modifications [54]. This approach is particularly advantageous for low-input studies as it involves fewer processing steps, thereby reducing sample loss.
Crosslinking ChIP (XChIP) employs formaldehyde fixation to covalently link proteins to DNA, followed by sonication for fragmentation [38]. While this approach can capture more transient interactions, it may introduce greater background noise and requires additional steps for crosslink reversal.
For studying H3K4me3, H3K27me3, and H3K9me3, NChIP generally provides superior resolution and lower background, making it particularly suitable for mapping broad histone modification domains like H3K27me3 and H3K9me3 [54].
Step-by-Step Library Preparation Protocol
Chromatin Immunoprecipitation Phase
The immunoprecipitation step requires mark-specific optimization to ensure high-specificity enrichment:
Antibody Selection: Use ChIP-grade antibodies validated for specific histone modifications. Recommended antibodies include: Anti-Tri-Methyl-Histone H3 (Lys4) (C42D8) rabbit monoclonal antibody (CST #9751S) for H3K4me3; Anti-Tri-Methyl-Histone H3 (Lys27) (C36B11) rabbit monoclonal antibody (CST #9733S) for H3K27me3; and Anti-Tri-Methyl-Histone H3 (Lys9) rabbit antibody (CST #9754S) for H3K9me3 [38].
Chromatin Fragmentation: For NChIP, optimize MNase concentration and digestion time to yield predominantly mononucleosomal fragments (150-200 bp). For XChIP, sonicate using a focused ultrasonicator (e.g., Bioruptor UCD-200) to achieve fragments between 200-500 bp, with peak distribution around 200-300 bp [38].
Immunoprecipitation Conditions: Incubate 1μg chromatin with 1-5μg antibody in IP dilution buffer (50 mM Tris-HCl pH 7.4, 150 mM NaCl, 1% igepal, 0.25% deoxycholic acid, 1 mM EDTA) with protease inhibitors overnight at 4°C with rotation [38]. Include appropriate controls (IgG and input DNA) for background subtraction and normalization.
Library Construction Workflow
The following workflow illustrates the core library preparation process:
Diagram 1: ChIP-seq Library Construction Workflow
End Repair and dA-Tailing: Convert ChIP DNA fragments into blunt-ended, 5'-phosphorylated molecules using T4 DNA polymerase and Klenow fragment, followed by 3' A-tailing using Klenow exo- (3' to 5' exo minus) to facilitate adapter ligation [38].
Adapter Ligation: Ligate indexed Illumina-compatible adapters using T4 DNA ligase with a 5:1 to 10:1 molar excess of adapter to insert DNA. Use reduced incubation times (15-30 minutes) to minimize adapter dimer formation [54].
PCR Amplification: Amplify libraries using 8-14 cycles with high-fidelity DNA polymerase. H3K4me3 libraries typically require 2-4 additional cycles due to lower abundance compared to H3K27me3 and H3K9me3 [54]. Use minimal cycles necessary to yield sufficient material (≥2nM) to maintain library complexity.
Size Selection: Purify libraries to select fragments between 200-600 bp using SPRI beads or gel extraction to exclude adapter dimers and large fragments [38].
Quality Control Checkpoints
Implement rigorous QC checkpoints throughout library preparation:
- Post-ChIP DNA Quality: Assess fragment size distribution using Bioanalyzer or TapeStation; confirm presence of nucleosomal laddering pattern for NChIP.
- Post-Library QC: Verify library concentration by Qubit and size distribution by Bioanalyzer; ensure minimal adapter dimer contamination (<5%).
- qPCR Validation: Test library enrichment using positive control regions (e.g., active promoters for H3K4me3, repressed genes for H3K27me3) and negative control regions.
Sequencing Considerations and Data Quality Metrics
Sequencing Configuration and Depth Requirements
Appropriate sequencing parameters ensure sufficient coverage for reliable peak calling:
Table 2: Sequencing Requirements for Different Histone Modifications
| Histone Mark | Recommended Read Depth | Read Length | Sequencing Type | Rationale |
|---|---|---|---|---|
| H3K4me3 | 20-40 million reads | 50-100 bp SE or PE | Illumina | Sharp, focused peaks require less depth but benefit from precise mapping |
| H3K27me3 | 40-60 million reads | 75-150 bp PE | Illumina | Broad domains require greater coverage; PE enables better mapping |
| H3K9me3 | 40-60 million reads | 75-150 bp PE | Illumina | Extensive heterochromatic regions need high depth for accurate calling |
| Multi-mark panels | 50+ million reads | 75-100 bp PE | Illumina | Comprehensive coverage across mark types with varying distributions |
The ENCODE consortium recommends a minimum of 10 million uniquely mapped reads for transcription factors with sharp peaks, while broad histone marks like H3K27me3 and H3K9me3 typically require 40+ million reads for human samples due to their weaker signal-to-noise ratio [55] [56]. For studies involving multiple marks across conditions, increased depth (50+ million reads) provides robustness for differential enrichment analysis.
Essential Quality Control Metrics
Comprehensive quality assessment is crucial for validating library quality and sequencing success:
Table 3: Key Quality Control Metrics and Interpretation Guidelines
| Quality Metric | Target Value | Assessment Method | Implications |
|---|---|---|---|
| Fraction of Reads in Peaks (FRiP) | >5% (TF), >30% (PolII), >1% (some marks) | ChIPQC | Measures signal-to-noise; low values indicate poor enrichment |
| Normalized Strand Coefficient (NSC) | >1.5 (broad), >5.0 (sharp) | Phantompeakqualtools | Indicates enrichment strength; values <1.05 suggest no enrichment |
| Relative Strand Correlation (RSC) | >1.0 | Phantompeakqualtools | Normalized strand cross-correlation; values <1 indicate poor quality |
| Library Complexity (NRF) | >0.8 | Preseq, ChIPQC | Measures proportion of non-redundant reads; low values indicate over-amplification |
| Reads in Blacklisted Regions (RiBL) | <1-2% | ChIPQC | High values indicate technical artifacts; should be minimal |
| PCR Bottleneck Coefficient | >0.8 | Preseq | Measures library complexity loss during amplification; higher is better |
The FRiP score (Fraction of Reads in Peaks) is particularly important as it measures signal-to-noise ratio, with successful H3K27me3 and H3K9me3 datasets typically achieving 5% or higher [55]. Library complexity assessment using Preseq helps determine whether libraries can be sequenced deeper to obtain sufficient distinct reads for robust analysis [54]. The standard deviation of signal pile-up (SSD) provides evidence of enrichment, with higher scores indicating better enrichment, though this metric should be interpreted alongside FRiP scores as high SSD can sometimes reflect technical artifacts rather than genuine enrichment [55].
The Scientist's Toolkit: Essential Research Reagents and Materials
Table 4: Key Research Reagents and Solutions for ChIP-seq Library Preparation
| Reagent Category | Specific Products | Function | Application Notes |
|---|---|---|---|
| Chromatin Preparation | Formaldehyde (37%), Glycine, Protease Inhibitor Cocktail, MNase | Crosslinking and chromatin fragmentation | Glycine quenches formaldehyde; MNase concentration must be titrated for cell type |
| Immunoprecipitation | Protein A/G Magnetic Beads, ChIP-grade Antibodies, IP Dilution Buffer | Target-specific enrichment | Magnetic beads simplify washing; antibody validation is critical |
| Library Construction | End Repair Mix, dA-Tailing Master Mix, T4 DNA Ligase, Indexed Adapters | Library preparation for sequencing | Illumina TruSeq kits provide optimized reagent mixtures |
| Purification & Size Selection | SPRIselect Beads, QIAquick PCR Purification Kit, Agarose Gels | Cleanup and size fractionation | SPRI beads enable rapid size selection; gel extraction offers higher precision |
| Quality Control | Bioanalyzer DNA HS Kit, Qubit dsDNA HS Assay, qPCR Reagents | Quality assessment at multiple stages | Bioanalyzer reveals adapter dimers; qPCR quantifies libraries accurately |
Advanced Applications and Integrated Analysis Approaches
Biological Interpretation of Histone Modification Profiles
Understanding the distinct genomic distributions and regulatory functions of each mark enables appropriate experimental design and interpretation:
H3K4me3 typically forms sharp peaks at transcription start sites (TSSs) of actively transcribed genes, marking promoters with high transcriptional potential [57] [21]. This mark exhibits the most focused distribution pattern, requiring high resolution but less genomic coverage.
H3K27me3 displays complex enrichment profiles, with at least three distinct patterns identified: broad domains across gene bodies (canonical repression), TSS-focused peaks (bivalent genes), and promoter peaks associated with active transcription in specific contexts [21]. These patterns have distinct regulatory consequences, necessitating careful bioinformatic analysis.
H3K9me3 marks constitutive heterochromatin, particularly at pericentromeric regions, telomeric repeats, and transposable elements, playing critical roles in genome stability and silencing of repetitive elements [58]. This mark often forms extensive domains requiring significant sequencing depth.
Integrated Multi-Omics Analysis Framework
The following diagram illustrates how ChIP-seq data integrates with other genomic approaches to elucidate gene regulatory mechanisms:
Diagram 2: Multi-Omic Data Integration Framework
Advanced analytical approaches enable researchers to extract maximum biological insights from ChIP-seq data. Chromatin state annotation using tools like ChromHMM integrates multiple histone modifications to segment the genome into functionally distinct elements [59]. Association of histone modification patterns with RNA-seq data reveals direct regulatory relationships, particularly when H3K27me3 enrichment at promoter regions correlates with transcriptional repression [54] [57]. Recent methodologies also enable prediction of gene expression levels from epigenomic data and identification of chromatin loops from histone modification patterns, providing insights into three-dimensional genome organization [59].
For H3K27me3 specifically, clusters of peaks forming H3K27me3-rich regions (MRRs) can function as silencer elements that repress gene expression through chromatin looping, analogous to super-enhancers but with opposing functional consequences [23]. CRISPR-based perturbation of these MRRs demonstrates their functional importance in maintaining repressive chromatin states and cellular identity.
Optimized library preparation and sequencing strategies form the foundation of successful ChIP-seq studies investigating H3K4me3, H3K27me3, and H3K9me3 distributions. Key considerations include: (1) matching input requirements and protocol selection (NChIP vs. XChIP) to biological questions and sample availability; (2) implementing rigorous quality control throughout library preparation to maintain complexity and minimize biases; (3) tailoring sequencing depth and configuration to the specific histone mark's distribution characteristics; and (4) employing appropriate analytical frameworks that account for the distinct biological properties of each modification. As single-cell ChIP-seq methodologies continue to develop, these fundamental best practices will enable researchers to generate high-quality data that reveals novel insights into epigenetic regulation across diverse biological contexts and disease states.
Chromatin immunoprecipitation followed by sequencing (ChIP-seq) has emerged as a foundational method in epigenomic research, enabling genome-wide analysis of histone modifications and their profound influence on cell identity, development, lineage specification, and disease states [59]. The analysis of specific histone modifications—particularly H3K4me3, H3K27me3, and H3K9me3—provides critical insights into the regulatory mechanisms governing gene expression. H3K4me3 is predominantly localized to active promoters and is strongly associated with transcriptional activation, while H3K27me3 represents a repressive mark maintained by the Polycomb Repressive Complex 2 (PRC2) that silences gene expression in a cell type-specific manner [21] [39]. In contrast, H3K9me3 is enriched in repetitive regions and heterochromatic domains, functioning as a key marker of transcriptional repression [36]. Understanding the complex relationships between these histone modifications requires sophisticated bioinformatic approaches for peak calling, annotation, and functional enrichment analysis. This technical guide provides a comprehensive framework for analyzing these biologically significant histone marks, with a focus on practical implementation for researchers, scientists, and drug development professionals engaged in epigenomic studies.
Experimental Design and Data Standards
Experimental Considerations for Histone Modification Studies
Proper experimental design is paramount for generating high-quality ChIP-seq data. The ENCODE Consortium has established rigorous standards for ChIP-seq experiments, emphasizing the necessity of biological replicates, high-quality antibodies, and appropriate controls [36]. For histone modifications, experiments should include at least two biological replicates (isogenic or anisogenic) to ensure reproducibility. Each ChIP-seq experiment must be accompanied by a corresponding input control experiment with matching run type, read length, and replicate structure to account for background noise and technical artifacts. Antibody validation is particularly crucial, as poorly characterized antibodies can yield misleading results; researchers should utilize antibodies with demonstrated specificity and performance through ENCODE characterization standards or similar rigorous validation processes.
Library complexity metrics provide essential quality indicators for ChIP-seq experiments. The Non-Redundant Fraction (NRF) should exceed 0.9, while PCR Bottlenecking Coefficients (PBC1 and PBC2) should be >0.9 and >10, respectively [36]. These metrics help identify potential issues with over-amplification or insufficient library complexity that could compromise downstream analyses. Additional quality control measures include strand cross-correlation analysis to assess the signal-to-noise ratio, with high-quality experiments typically showing strong clustering of reads around specific genomic features.
Sequencing Depth Requirements
The required sequencing depth varies significantly depending on the specific histone modification being studied, primarily due to differences in genomic distribution patterns. The ENCODE Consortium provides target-specific standards for sequencing depth, distinguishing between narrow and broad histone marks [36].
Table 1: Sequencing Depth Requirements for Histone Modifications
| Histone Modification Type | Classification | Minimum Usable Fragments per Replicate | Genomic Features |
|---|---|---|---|
| H3K4me3 | Narrow | 20 million | Sharp peaks at active promoters |
| H3K27ac | Narrow | 20 million | Sharp peaks at active enhancers and promoters |
| H3K9ac | Narrow | 20 million | Sharp peaks at active promoters |
| H3K27me3 | Broad | 45 million | Broad domains covering repressed genes |
| H3K9me3 | Exception | 45 million (total mapped reads) | Enriched in repetitive regions |
| H3K36me3 | Broad | 45 million | Broad enrichment across gene bodies of actively transcribed genes |
| H3K4me1 | Broad | 45 million | Broad enrichment at enhancer regions |
These requirements reflect the fundamental differences in the genomic distribution of these marks. Narrow marks such as H3K4me3 produce sharp, well-defined peaks typically localized to specific genomic coordinates like transcription start sites (TSSs). In contrast, broad marks such as H3K27me3 form extensive domains that can span large genomic regions, necessitating greater sequencing depth for comprehensive coverage [60] [36]. H3K9me3 represents a special case due to its enrichment in repetitive genomic regions, which complicates read mapping and requires special consideration during analysis.
Bioinformatic Workflow: From Raw Data to Biological Insight
Primary Data Processing and Quality Control
The initial phase of ChIP-seq analysis involves processing raw sequencing data to generate aligned reads suitable for downstream analysis. This process begins with quality assessment of raw FASTQ files using tools such as FastQC to identify potential issues with adapter contamination, sequence quality, or base composition biases [61]. Following quality assessment, preprocessing steps include adapter trimming and quality filtering using tools such as Trimmomatic to remove low-quality bases and ensure only high-quality reads proceed to alignment [61].
High-quality reads are then aligned to a reference genome using aligners such as Bowtie or BWA-MEM [60] [61]. The choice of aligner depends on several factors, including read length, sequencing type (single-end vs. paired-end), and computational resources. For histone modification analysis, the ENCODE pipeline recommends using either the GRCh38 (human) or mm10 (mouse) reference genomes, though other genomes can be used depending on the organism under study [36]. Following alignment, additional quality control metrics should be assessed, including mapping statistics, library complexity measurements (NRF, PBC1, PBC2), and strand cross-correlation analysis to confirm successful immunoprecipitation [60].
Table 2: Key Tools for ChIP-seq Data Processing
| Analysis Step | Tool | Function | Key Parameters |
|---|---|---|---|
| Quality Control | FastQC | Assesses raw read quality | Default parameters |
| Read Trimming | Trimmomatic | Removes adapters and low-quality bases | ILLUMINACLIP:adapters.fa:2:30:10 SLIDINGWINDOW:4:10 MINLEN:20 |
| Read Alignment | BWA-MEM | Aligns reads to reference genome | Reference genome-specific |
| File Conversion | Samtools | Converts SAM to BAM, sorts and indexes | Default parameters |
| Format Conversion | Bedtools | Converts BAM to BED format | Default parameters |
| Signal Track Generation | DeepTools | Creates normalized coverage tracks | --extendReads 200 --binSize 5 --normalizeUsing None |
Peak Calling Algorithms and Strategies
Peak calling represents a critical step in ChIP-seq analysis, where regions of significant histone modification enrichment are identified against background noise. The choice of peak calling algorithm significantly influences results, as different tools employ distinct statistical models and are optimized for different types of histone marks [60].
MACS2 (Model-based Analysis of ChIP-Seq) is among the most widely used peak callers and can be applied to both narrow and broad marks through its broad peak calling mode [60] [62]. For broad marks such as H3K27me3 and H3K9me3, SICER (Spatial Clustering for Identification of ChIP-Enriched Regions) may be preferable, as it specifically addresses the spatial clustering characteristics of broad domains [61]. Specialized tools such as GoPeaks have also been developed for specific technologies like CUT&Tag, offering improved performance for low-background data [62].
Comparative studies have revealed that performance differences between peak callers are more pronounced for certain histone modifications. For marks with low fidelity such as H3K4ac, H3K56ac, and H3K79me1/me2, peak calling results consistently show lower performance across multiple parameters, suggesting their genomic positions might not be accurately captured by current methods [60]. For the histone marks central to this guide—H3K4me3, H3K27me3, and H3K9me3—selection should be informed by their distribution patterns: H3K4me3 typically forms narrow peaks, H3K27me3 forms broad domains, and H3K9me3 displays broad enrichment in repetitive regions.
The following workflow diagram illustrates the complete ChIP-seq analysis process from raw data to functional interpretation:
Peak Annotation and Genomic Distribution Analysis
Following peak calling, the identified regions require annotation to determine their genomic context and potential functional significance. Peak annotation involves mapping peaks to genomic features such as promoters, transcription start sites (TSSs), gene bodies, intergenic regions, and enhancer elements [63]. Tools such as HOMER and ChIPseeker provide comprehensive annotation capabilities, assigning peaks to genes based on their proximity to TSSs and other regulatory elements [61].
The genomic distribution of histone modifications follows distinct patterns that reflect their functional roles. H3K4me3 is predominantly enriched around transcription start sites, particularly in active promoters [63] [39]. H3K27me3 can exhibit multiple enrichment profiles: broad domains spanning gene bodies associated with strong repression, peaks around TSSs often associated with bivalent genes (co-localized with H3K4me3), and surprisingly, promoter peaks associated with active transcription in certain contexts [21]. H3K9me3 is primarily localized to heterochromatic regions, including repetitive elements and gene-poor regions [36].
Quantitative analysis of histone modification distribution across genic regions reveals characteristic patterns. Studies in multiple systems, including rice and insect models, have demonstrated that H3K4me2, H3K4me3, H3K9ac, and H3K27ac show strong enrichment around TSSs and are associated with active transcription [63]. These modifications often display complementary distribution patterns with repressive marks such as H3K27me3 and H3K9me3, creating a complex regulatory landscape that fine-tunes gene expression in response to developmental and environmental cues.
Functional Enrichment Analysis
Functional enrichment analysis places histone modification data in biological context by identifying overrepresented functional categories among genes associated with specific marks. This analysis typically involves several steps: first, generating a gene list associated with peaks of interest; second, testing this gene set for enrichment of specific biological processes, molecular functions, cellular components, or pathways; and third, interpreting the results in the context of the biological system under study.
Tools such as clusterProfiler, DAVID, and HOMER provide robust frameworks for functional enrichment analysis, connecting genomic coordinates to biological meaning through gene ontology (GO), Kyoto Encyclopedia of Genes and Genomes (KEGG) pathways, and other functional databases [61]. For example, genes marked by H3K27me3 in embryonic stem cells are frequently enriched for developmental processes and lineage specification factors, reflecting the role of this mark in maintaining pluripotency while poising developmental genes for future activation [21]. Similarly, H3K4me3-marked genes typically show enrichment for housekeeping functions and cell type-specific processes depending on the cellular context.
Advanced enrichment approaches can address more complex questions, such as identifying biological processes associated with bivalent domains (regions co-marked by H3K4me3 and H3K27me3) or assessing the functional significance of cell type-specific histone modification patterns. These analyses provide critical insights into the regulatory networks controlled by histone modifications and their contribution to cellular identity and function.
Advanced Applications and Integrative Analysis
Chromatin State Annotation and Integrative Genomics
Beyond analyzing individual histone modifications, advanced approaches integrate multiple epigenetic marks to define comprehensive chromatin states. Chromatin state annotation methods such as ChromHMM and Segway use multivariate hidden Markov models to segment the genome into discrete states based on combinations of histone modifications [59]. These chromatin states correspond to functional elements such as active promoters, enhancers, transcribed regions, and repressive domains, providing a more holistic view of the epigenomic landscape.
Integrative analysis that combines histone modification data with other genomic datasets can reveal novel regulatory relationships. For example, correlating H3K4me3 and H3K27me3 patterns with chromatin accessibility data (from ATAC-seq or DNase-seq) and transcription factor binding profiles can elucidate the hierarchy of regulatory events controlling gene expression [63]. Similarly, integrating histone modification data with chromatin conformation information (from Hi-C) has demonstrated that domains with similar histone modification profiles tend to cluster in three-dimensional nuclear space, revealing connections between the linear epigenome and spatial genome organization [64].
Machine learning approaches are increasingly being applied to histone modification data for tasks such as predicting gene expression levels, identifying chromatin loops from epigenomic data, and data imputation [59]. Deep neural networks have been used to investigate the relationship between histone modifications (including H3K4me3 and H3K27me3) and higher-order chromatin architecture, revealing that these marks contribute significantly to the formation of topological association domain (TAD) boundaries [64].
Single-Cell Histone Modification Analysis
Traditional ChIP-seq approaches require thousands to millions of cells, obscuring cellular heterogeneity within complex tissues. Recent methodological advances have enabled profiling of histone modifications at single-cell resolution, revealing the cellular diversity of epigenomic states in development and disease [59]. Single-cell ChIP-seq (scChIP-seq) technologies provide unprecedented resolution for studying epigenetic heterogeneity, dynamic changes during differentiation, and rare cell populations.
Analysis of single-cell histone modification data presents unique computational challenges, including sparsity, technical noise, and the need for specialized normalization methods. Nevertheless, these approaches have already provided insights into the dynamics of epigenetic regulation during embryonic development, cellular reprogramming, and cancer evolution. As these methods continue to mature, they promise to transform our understanding of how histone modification patterns are established and maintained in individual cells and how epigenetic heterogeneity contributes to cellular plasticity and fate decisions.
Successful ChIP-seq analysis requires both computational tools and wet-lab reagents. The following table outlines key resources for studying H3K4me3, H3K27me3, and H3K9me3.
Table 3: Essential Research Reagents and Resources for Histone Modification Analysis
| Resource Category | Specific Product/Platform | Application/Function | Considerations |
|---|---|---|---|
| Antibodies | Anti-H3K4me3 (e.g., Millipore 07-473) | Specific detection of H3K4me3 epitope | Validate specificity using peptide competition or knockout cells |
| Anti-H3K27me3 (e.g., Millipore 07-449) | Specific detection of H3K27me3 epitope | Critical for PRC2 target identification [21] | |
| Anti-H3K9me3 (e.g., Abcam ab8898) | Specific detection of H3K9me3 epitope | Important for heterochromatin studies [36] | |
| Analysis Platforms | H3NGST | Fully automated web-based ChIP-seq analysis | No installation required; uses BioProject ID for data retrieval [61] |
| Galaxy/Cistrome | Web-based analysis with user-friendly interface | Accessible to wet-lab researchers with limited coding experience | |
| ENCODE Histone Pipeline | Standardized processing for histone ChIP-seq | Reproducible, consortium-approved methods [36] | |
| Quality Control Tools | SPP | Strand cross-correlation analysis | Assesses signal-to-noise ratio [60] |
| FastQC | Sequencing data quality assessment | Identifies adapter contamination and quality issues [61] | |
| ChIPQC (Bioconductor) | Comprehensive quality metrics for ChIP-seq | Evaluates replicate concordance and library complexity | |
| Reference Datasets | ENCODE Consortium Data | Publicly available histone modification profiles | Essential for comparative analysis and method benchmarking [36] |
| Roadmap Epigenomics Project | Reference epigenomes for diverse cell types | Provides context for cell type-specific patterns [60] |
The comprehensive analysis of histone modifications through ChIP-seq represents a powerful approach for deciphering the epigenetic code governing gene regulation. The specialized analytical approaches required for H3K4me3, H3K27me3, and H3K9me3—from experimental design through peak calling, annotation, and functional interpretation—highlight the importance of mark-specific methodologies. As epigenomic research continues to evolve, emerging technologies such as single-cell ChIP-seq and integrative multi-omics approaches will further enhance our ability to understand epigenetic regulation in development, homeostasis, and disease. The frameworks and methodologies outlined in this technical guide provide researchers with a solid foundation for conducting rigorous, reproducible analysis of these critical epigenetic marks, facilitating advances in both basic science and therapeutic development.
This technical guide explores the pivotal role of chromatin immunoprecipitation followed by sequencing (ChIP-seq) in profiling the histone modifications H3K4me3, H3K27me3, and H3K9me3 to drive drug discovery. Framed within a broader thesis on epigenomic research, this whitepaper provides an in-depth analysis of how quantitative ChIP-seq analysis uncovers dynamic epigenetic landscapes in cancer, neurodegenerative diseases, and immune function. We present structured case studies, detailed experimental methodologies, and validated research reagents to equip scientists with the tools for targeting epigenetic mechanisms therapeutically.
The post-translational modification of histone proteins constitutes a primary epigenetic mechanism for regulating gene expression without altering the underlying DNA sequence. Among these modifications, H3K4me3 is highly enriched at active promoters and is considered a transcription activation biomarker [26]. Conversely, H3K27me3, catalyzed by Polycomb Repressive Complex 2 (PRC2), and H3K9me3, associated with constitutive heterochromatin, are repressive histone marks that silence transcriptional activity [26] [21]. These modifications form two distinct functional clusters: promoter/active chromatin tags (H3K4me3) versus heterochromatin marks (H3K27me3, H3K9me3) [26].
The dynamic and reversible nature of these epigenetic marks, mediated by histone methyltransferases and demethylases, makes them promising therapeutic targets [65]. ChIP-seq has emerged as a powerful method to map the genome-wide distribution of these modifications, enabling systematic analysis of how the epigenomic landscape contributes to cell identity, disease pathogenesis, and therapeutic response [59]. This guide details the application of ChIP-seq analysis in drug discovery across three key therapeutic areas.
Core Molecular Signatures and Drug Discovery Relevance
Table 1: Functional Roles of Key Histone Modifications in Drug Discovery
| Histone Mark | Molecular Function | Catalytic Enzymes | Therapeutic Relevance |
|---|---|---|---|
| H3K4me3 | Transcription activation; enriched at promoters [26] | SETD1B, MLL family (KMT2) [66] [65] | Sustains oncogenic expression in cancer [67] |
| H3K27me3 | Facultative heterochromatin; transcriptional repression [26] | EZH2 (PRC2 complex) [21] [65] | Dysregulated in cancer and neurodegeneration [68] [65] |
| H3K9me3 | Constitutive heterochromatin; transcriptional repression [26] | SUV39H1/2, SETDB1 [65] | Genome stability; dysregulated in cancer [68] |
The interplay of these modifications creates a "histone code" that determines cellular identity and function. H3K4me3 and H3K27me3 bivalency at promoter regions poises genes for activation or repression in response to developmental or environmental cues, a mechanism particularly relevant in stem cell biology and cancer [21] [43]. Understanding these signatures provides the foundation for epigenetic drug discovery.
Experimental Protocols for ChIP-seq Analysis
Standard ChIP-seq Workflow
The fundamental ChIP-seq protocol involves cross-linking proteins to DNA, chromatin shearing, immunoprecipitation with specific antibodies, and high-throughput sequencing [59]. A typical workflow includes:
- Cell Fixation and Cross-linking: Use 1% formaldehyde for 10-20 minutes at room temperature to fix cells, preserving protein-DNA interactions [21].
- Chromatin Shearing: Sonicate chromatin to fragments between 200-500 bp using a focused ultrasonicator (e.g., Bandelin sonicator at 30% amplitude with 15-25 bursts) [21].
- Immunoprecipitation: Incubate chromatin with validated antibodies against target histone modifications (see Section 7 for recommended antibodies).
- Library Preparation and Sequencing: Size-select immunoprecipitated DNA (∼200 bp), add sequencing adapters, and perform PCR amplification before sequencing on platforms such as Illumina [21].
Quantitative ChIP-seq Analysis
For dynamic biological systems, quantitative ChIP-seq analysis is essential. This involves:
- Identification of Sustained Regions: Define genomic regions with stable epigenetic marking across conditions to serve as an internal reference [43].
- Normalization: Calculate sample-specific scaling factors based on sustained regions to enable quantitative comparison between conditions [43].
- Peak Calling and Annotation: Use tools like MACS for peak detection and annotate peaks with genomic features.
- Integration with Transcriptomics: Correlate histone modification changes with gene expression data from RNA-seq for comprehensive biological interpretation [43].
Figure 1: ChIP-seq Experimental and Computational Workflow. The diagram outlines key steps from sample preparation to data interpretation, highlighting parallel analysis of different histone modifications.
Case Study 1: Cancer - Targeting H3K4 Methylation in Triple-Negative Breast Cancer
Epigenetic Profiling of Breast Cancer Subtypes
Comprehensive mass spectrometry-based epigenetic profiling of 202 breast cancer samples revealed that triple-negative breast cancers (TNBCs) display the most divergent histone modification patterns compared to other subtypes [67]. The TNBC epigenetic signature is characterized by:
- Increased H3K4 methylation (H3K4me1, H3K4me2, H3K4me3)
- Elevated H3K9me3 and H3K36 methylation
- Decreased H3K27me3 and H3K79 methylation
- Reduced H4K20me3 and H4K16ac [67]
Functional Validation of H3K4me2 as a Therapeutic Target
Multi-OMICs integration of epigenomic, transcriptomic, and proteomic data demonstrated that H3K4me2 sustains the expression of genes associated with the TNBC phenotype [67]. Mechanistic validation involved:
- CRISPR-mediated epigenome editing to specifically reduce H3K4me2 levels at target genes
- Pharmacological inhibition of H3K4 methyltransferases, which reduced TNBC cell growth in vitro and in vivo [67]
Table 2: Quantitative Histone Modification Changes in Triple-Negative Breast Cancer
| Histone Mark | Change in TNBC | Functional Consequence | Therapeutic Approach |
|---|---|---|---|
| H3K4me2/3 | Significant increase [67] | Sustains oncogenic transcriptional programs | H3K4 methyltransferase inhibitors [67] |
| H3K27me3 | Decrease [67] | Loss of repression at developmental genes | EZH2 inhibitors (under investigation) |
| H3K9me3 | Increase [67] | Heterochromatin redistribution | Combination therapies |
These findings establish H3K4 methylation as a novel therapeutic target for TNBC, for which targeted therapies are currently lacking [67].
Case Study 2: Neurodegenerative Disorders - Histone Methylation Dysregulation
Epigenetic Dysregulation in Neurodegeneration
Neurodegenerative disorders, including Alzheimer's disease (AD), Parkinson's disease (PD), and Huntington's disease (HD), exhibit characteristic dysregulation of histone methylation patterns that contribute to disease pathogenesis [65]. Key findings include:
- Reduced H3K4me3 at promoters of synaptic genes in AD, correlating with decreased expression
- Elevated H3K9me3 and H3K27me3 at memory-related genes in AD models
- Altered H3K4 methylation in HD, influenced by mutant huntingtin protein [65]
Enzymatic Targets for Therapeutic Intervention
The enzymes responsible for writing, reading, and erasing histone methylation marks represent promising therapeutic targets for neurodegenerative disorders:
- Histone methyltransferases (KMTs) and demethylases (KDMs) are dynamic and reversible in neurons [65]
- KDM1A (LSD1) demethylates H3K4me1/2 and H3K9me1/2, with inhibitors showing neuroprotective effects in models
- KDM4 family demethylases target H3K9me3 and H3K36me3, implicated in AD pathogenesis [65]
Figure 2: Histone Methylation Dysregulation in Neurodegenerative Diseases and Therapeutic Strategies. The diagram illustrates how different histone methylation defects contribute to neurodegeneration and potential intervention approaches.
Case Study 3: Immunology - Chromatin Dynamics in Hematopoiesis
Single-Cell Chromatin Profiling in Hematopoietic System
Single-cell sortChIC analysis has mapped active (H3K4me1, H3K4me3) and repressive (H3K27me3, H3K9me3) histone modifications during mouse hematopoiesis, revealing hierarchical chromatin regulation [69]. Key findings include:
- Hematopoietic stem and progenitor cells (HSPCs) already possess active chromatin marks (H3K4me3, H3K4me1) at genes of different blood cell fates before lineage commitment
- Repressive H3K27me3 is upregulated during differentiation to silence genes of alternative cell fates
- H3K9me3 dynamics distinguish differentiation trajectories and lineages, while euchromatin dynamics reflect cell types within lineages [69]
Implications for Immunological Therapeutics
The chromatin dynamics uncovered in hematopoiesis have significant implications for immunology-focused drug discovery:
- Lineage-specific epigenetic programs can be targeted to modulate immune cell function
- H3K27me3-mediated silencing of alternative lineages provides a mechanism for stabilizing cellular identities
- H3K9me3-marked heterochromatin establishes lineage barriers that could be manipulated in cell engineering
Table 3: Chromatin State Changes During Hematopoietic Differentiation
| Cell Stage | H3K4me3 Pattern | H3K27me3 Pattern | H3K9me3 Pattern | Functional Outcome |
|---|---|---|---|---|
| HSPCs | Intermediate level at multiple lineage genes [69] | Low at lineage-specific genes | Defining differentiation trajectories [69] | Multipotency; lineage priming |
| Differentiated Cells | Increased at cell-type-specific genes [69] | Increased at alternative lineage genes [69] | Lineage-specific domains [69] | Lineage commitment; silencing alternatives |
The Scientist's Toolkit: Essential Research Reagents
Table 4: Key Research Reagent Solutions for ChIP-seq Experiments
| Reagent Category | Specific Product/Kit | Function in Experiment | Technical Notes |
|---|---|---|---|
| H3K4me3 Antibodies | Millipore 07-473 [21] | Immunoprecipitation of H3K4me3-bound chromatin | Validate with positive control genes (e.g., active promoters) |
| H3K27me3 Antibodies | Millipore 07-449 [21] | Immunoprecipitation of H3K27me3-bound chromatin | Check specificity with EZH2 inhibitor-treated cells |
| H3K9me3 Antibodies | Multiple commercial sources [69] | Immunoprecipitation of heterochromatin regions | Optimal for profiling constitutive heterochromatin |
| Chromatin Shearing | Bandelin Sonopuls [21] | Fragment chromatin to 200-500 bp | Optimize duration and amplitude for cell type |
| Library Prep Kits | Illumina ChIP-seq Library Prep | Prepare sequencing libraries | Include size selection step (∼200 bp) |
| Spike-in Controls | Heavy-isotope labeled histones [67] | Normalization for quantitative comparisons | Essential for cross-condition comparisons |
ChIP-seq analysis of H3K4me3, H3K27me3, and H3K9me3 provides critical insights into disease mechanisms across cancer, neurodegeneration, and immunology. The case studies presented demonstrate how epigenetic profiling reveals novel therapeutic targets, from H3K4 methylation in triple-negative breast cancer to histone methylation dysregulation in neurodegenerative disorders and chromatin dynamics in immune cell development. As single-cell epigenomic technologies advance and multi-OMICs integration becomes more sophisticated, the precision of epigenetic drug discovery will continue to improve. The experimental protocols and research reagents detailed herein provide a foundation for researchers to explore these compelling epigenetic mechanisms in their drug discovery programs.
Solving ChIP-seq Challenges: Expert Tips for Optimizing H3K4me3, H3K27me3, and H3K9me3 Assays
Common Pitfalls in Sample Preparation and Crosslinking Efficiency
Chromatin Immunoprecipitation followed by sequencing (ChIP-seq) has become an indispensable technique for genome-wide profiling of histone modifications, including the repressive marks H3K27me3 and H3K9me3, and the active mark H3K4me3 [70]. The quality of the final ChIP-seq data is profoundly dependent on the initial steps of sample preparation and the efficiency of crosslinking. Errors introduced at these stages can compromise data integrity, leading to false positives, loss of signal, and biologically misleading conclusions [71]. Within the context of a broader thesis on ChIP-seq for H3K4me3, H3K27me3, and H3K9me3 analysis, this guide details common pitfalls in sample preparation and crosslinking, providing detailed methodologies and strategies to overcome these challenges for researchers, scientists, and drug development professionals.
Histone Modifications and Their ChIP-seq Profiles
The analysis of histone modifications via ChIP-seq requires an understanding of their distinct biological roles and genomic distribution patterns. H3K4me3 is typically associated with active promoters, marked by sharp, narrow peaks around the transcription start site (TSS) [39]. In contrast, H3K27me3, catalyzed by Polycomb Repressive Complex 2 (PRC2), is associated with facultative heterochromatin and gene repression. It can form broad domains that spread across entire gene bodies or large genomic regions, and can also be found in a "bivalent" state co-localizing with H3K4me3 at promoters to keep genes in a poised state [21] [39]. H3K9me3 is linked to constitutive heterochromatin and also forms very broad repressive domains [71]. A critical analytical pitfall is misclassifying these broad marks by using peak-calling parameters designed for narrow transcription factor binding sites, which can fragment biologically coherent domains into hundreds of meaningless, sharp peaks [71].
Table 1: Characteristics of Key Histone Modifications in ChIP-seq
| Histone Modification | Associated Function | Typical ChIP-seq Profile | Key Analytical Consideration |
|---|---|---|---|
| H3K4me3 | Active transcription initiation | Narrow, sharp peaks at transcription start sites | Suitable for standard narrow peak-calling (e.g., MACS2 default) |
| H3K27me3 | Facultative heterochromatin, gene repression | Broad domains (can span entire genes or 100+kb) | Requires broad peak-calling mode (e.g., MACS2 --broad) or alternative tools (SICER2) |
| H3K9me3 | Constitutive heterochromatin | Very broad, expansive domains | Requires broad peak-calling mode; highly sensitive to background noise |
Critical Pitfalls in Sample Preparation
Suboptimal Crosslinking Strategy
The choice between native (N-ChIP) and cross-linked (X-ChIP) protocols is fundamental and depends on the target epitope.
Native ChIP (N-ChIP): This method uses micrococcal nuclease (MNase) for chromatin fragmentation without chemical crosslinking. It is generally considered the gold standard for histone modifications as it provides higher resolution and avoids epitope masking or denaturation caused by formaldehyde [72]. It is ideally suited for investigating abundant targets like histone marks [72]. A major limitation is that it is generally not suitable for transcription factors or chromatin-associated proteins that do not directly bind DNA.
Cross-linked ChIP (X-ChIP): This method employs formaldehyde to covalently crosslink proteins to DNA and to other proteins. Its primary advantage is the ability to capture indirect associations, such as those of chromatin regulators that are part of large complexes but do not directly contact DNA [73] [74]. However, over-crosslinking can create a dense network of crosslinks, making chromatin difficult to shear and leading to epitope masking, which reduces antibody efficiency and increases background noise [72].
Double-Crosslinking (dxChIP-seq): Advanced protocols now use double-crosslinking, often with a combination of disuccinimidyl glutarate (DSG) and formaldehyde, to stabilize protein-protein interactions before fixing proteins to DNA. This approach significantly improves the mapping of chromatin factors that do not bind DNA directly, enhancing the signal-to-noise ratio for challenging targets [73] [74].
Table 2: Comparison of Chromatin Immunoprecipitation Methods
| Method | Key Advantage | Key Disadvantage | Ideal Use Case |
|---|---|---|---|
| Native ChIP (N-ChIP) | High resolution; no epitope masking; cells in "native" state | Generally only for direct DNA binders (e.g., histones); chromatin sheared only enzymatically | Histone modifications (H3K4me3, H3K27me3, H3K9me3) |
| Cross-linked ChIP (X-ChIP) | Captures indirect & direct binders; shearing by sonication or enzymatically | Risk of epitope masking; over-crosslinking reduces efficiency & data quality | Transcription factors, chromatin regulators with indirect DNA association |
| Dual-Crosslinked ChIP (dxChIP-seq) | Enhanced capture of indirect interactions; improved signal-to-noise | More complex protocol; requires optimization of two crosslinking steps | Challenging chromatin targets, multi-subunit complexes |
Inefficient Chromatin Shearing and Fragmentation
The goal of chromatin shearing is to generate DNA fragments of an appropriate size (typically 200–600 bp for sonication) while preserving the integrity of the protein-DNA complex.
Pitfall 1: Under-sonication. This results in large, heterogeneous chromatin fragments. It decreases resolution and can lead to false-positive peak calls in downstream analysis because large, precipitated fragments can span multiple genuine binding sites and non-specific regions.
Pitfall 2: Over-sonication. Excessive sonication can damage the target epitopes, destroy the antibody binding site, and physically break the DNA-protein crosslinks, leading to a loss of specific signal and an increase in background noise.
Pitfall 3: Inconsistent Shearing Between Samples. For comparative studies, inconsistent shearing efficiency between samples introduces a major technical variable that can confound biological differences. This is especially critical for differential binding analyses.
Optimization Protocol: A standard optimization involves a sonication time-course experiment. Aliquot your crosslinked chromatin and subject each aliquot to a different duration of sonication (e.g., 5, 10, 15, 20 minutes). After reversing crosslinks and purifying the DNA, analyze the fragment size distribution of each aliquot using a bioanalyzer or tapestation. The ideal condition produces a majority of fragments in the 200–500 bp range. This optimized time should then be used consistently for all samples in a study.
Working with Low Cell Numbers
A common bottleneck in epigenomic research is the need for abundant starting material, often in the range of 1–20 million cells [75]. When working with rare cell populations or primary samples, low cell number ChIP-seq presents specific pitfalls.
Increased PCR Duplicates and Noise: As cell numbers decrease, the amount of immunoprecipitated DNA becomes vanishingly small, requiring more cycles of PCR amplification during library preparation. This leads to a higher proportion of PCR duplicate reads, which do not provide new genomic information and can distort signal quantification [75].
Reduced Mapping Efficiency and Sensitivity: Studies have shown that as input cell numbers fall, the percentage of reads that can be uniquely mapped to the genome decreases due to an increase in amplification artifacts [75]. Consequently, the number of high-confidence peaks called is reduced, compromising sensitivity.
Optimization Strategies: To mitigate these issues, specialized low-input protocols have been developed. These often involve carrier-free immunoprecipitations and optimized library construction methods that reduce purification losses and require fewer PCR cycles [75]. For example, an enhanced native ChIP-seq method has been demonstrated to work with as few as 100,000 cells per immunoprecipitation, a 200-fold reduction over some standard protocols [75]. It is crucial to be aware of these limitations and to either employ low-input protocols or ensure sufficient sequencing depth to compensate for the reduced complexity when working with limited material.
The Scientist's Toolkit: Key Research Reagent Solutions
Table 3: Essential Reagents for Robust ChIP-seq Sample Preparation
| Reagent / Material | Function | Key Considerations |
|---|---|---|
| Formaldehyde (37%) | Reversible crosslinking of proteins to DNA. | Standard for X-ChIP; concentration and incubation time must be optimized to avoid over-crosslinking. |
| DSG (Disuccinimidyl glutarate) | Protein-protein crosslinker for dual-crosslinking protocols. | Used prior to formaldehyde to stabilize weak or transient protein complexes [73]. |
| Micrococcal Nuclease (MNase) | Enzymatic fragmentation of chromatin for N-ChIP. | Provides nucleosome-level resolution; digestion must be titrated to yield primarily mononucleosomes. |
| Protein A/G Magnetic Beads | Solid-phase support for antibody-mediated capture of complexes. | Bead-free systems (e.g., Chromatrap) are also available and can reduce background [72]. |
| Antibodies (H3K4me3, H3K27me3, H3K9me3) | Specific immunoprecipitation of target epitope. | Antibody quality is paramount; use ChIP-grade validated antibodies to ensure specificity. |
| Protease Inhibitor Cocktails | Prevention of protein degradation during chromatin preparation. | Essential for preserving native chromatin structure and epitope integrity. |
| PCR-free Library Prep Kits | Preparation of sequencing libraries without amplification bias. | Critical for low-input ChIP-seq to minimize PCR duplicates and artifacts [75]. |
Sample preparation and crosslinking efficiency form the foundational pillars of a successful ChIP-seq experiment. Missteps at this stage, such as choosing an inappropriate crosslinking method, inefficient shearing, or ignoring the constraints of low cell numbers, can introduce irreparable biases that no amount of sophisticated bioinformatic analysis can correct. This is especially true for the analysis of complex histone marks like the broad domains of H3K27me3 and H3K9me3, which require particular care in both wet-lab and computational handling. By understanding these common pitfalls, rigorously optimizing protocols, and implementing the detailed methodologies and quality controls outlined in this guide, researchers can ensure the generation of robust, high-quality data that accurately reflects the underlying biology of the epigenome.
Chromatin immunoprecipitation followed by sequencing (ChIP-seq) has become an indispensable method for mapping protein-DNA interactions and histone modifications genome-wide. The quality of chromatin shearing is a critical determinant of success in ChIP-seq experiments, directly impacting resolution, signal-to-noise ratio, and the validity of biological conclusions. Proper chromatin fragmentation ensures efficient immunoprecipitation and minimizes non-specific background, making optimization of sonication parameters essential for high-quality data.
This technical guide focuses on optimizing chromatin shearing specifically for studying key histone modifications—H3K4me3, H3K27me3, and H3K9me3. These modifications represent different chromatin states with distinct biological functions: H3K4me3 marks active promoters, H3K27me3 characterizes facultative heterochromatin regulated by Polycomb complexes, and H3K9me3 defines constitutive heterochromatin involved in stable transcriptional repression [76] [28]. Each exhibits different genomic distributions, with H3K4me3 typically forming sharp, point-source peaks, while H3K27me3 and H3K9me3 often cover broader domains [77], necessitating tailored shearing approaches for optimal mapping.
Fundamentals of Chromatin Sonication
Sonication Principle and Equipment
Sonication utilizes high-frequency sound waves to create cavitation bubbles in liquid solutions, generating shear forces that fragment chromatin. The efficiency of this process depends on both equipment and sample characteristics. Two primary sonication systems are employed:
- Probe Sonicators: Utilize a titanium probe directly immersed in the sample, providing high energy transfer but requiring careful technique to prevent cross-contamination and overheating. The Branson Digital Sonifier with a 1/8-inch micro tip is a commonly used system [78].
- Cup/Horn Sonicators: Employ a water bath-style chamber where samples in sealed tubes are subjected to indirect sonication, reducing cross-contamination risk but potentially requiring longer processing times.
The choice between systems involves trade-offs between throughput, sample volume, and fragmentation efficiency. For most applications, probe sonicators provide more efficient and consistent fragmentation, though proper technique is essential to prevent sample degradation and maintain reproducibility.
Impact of Cross-linking on Shearing Efficiency
Formaldehyde cross-linking stabilizes protein-DNA interactions but creates chromatin that is more resistant to fragmentation. The cross-linking duration significantly impacts shearing efficiency, requiring parameter adjustments:
- Histone modifications (H3K4me3, H3K27me3, H3K9me3): 10 minutes fixation is typically sufficient [78].
- Transcription factors: 10-30 minutes fixation recommended.
- Transcription cofactors: May require up to 30 minutes fixation.
Longer cross-linking times increase chromatin stability but reduce the proportion of fragments within the ideal size range after sonication. With extended fixation, the target percentage of fragments <1 kb may decrease from 60-90% to 30-60%, necessitating increased sonication intensity or duration [78].
Optimizing Sonication Parameters
Core Sonication Parameters
Optimal chromatin fragmentation requires balancing multiple sonication parameters to achieve the desired fragment size distribution while maintaining antigen integrity. Key adjustable parameters include:
- Amplitude/Intensity: The power output of the sonicator, typically expressed as a percentage of maximum capability.
- Duration: Total active sonication time, often applied in cycles to prevent overheating.
- Duty Cycle: The pattern of active and rest periods (e.g., 1 second on/1 second off).
- Sample Volume and Concentration: Critical factors affecting energy transfer efficiency.
Based on established protocols using a Branson Digital Sonifier with a 1/8-inch micro tip, the following parameters typically yield good fragmentation: 50% amplitude with 1-second on/1-second off cycles for 8 minutes total processing time (4 minutes actual sonication time) [78]. This configuration generally produces chromatin fragments where 60-90% are smaller than 1 kb, ideal for most ChIP-seq applications.
Table 1: Recommended Sonication Parameters for Different Sample Types
| Sample Type | Amplitude | Cycle Pattern | Total Duration | Expected Fragment Size |
|---|---|---|---|---|
| Cultured Cells | 50% | 1 sec on/1 sec off | 8 minutes (4 min active) | 60-90% < 1 kb |
| Solid Tissues | 50-60% | 1 sec on/1 sec off | 10-15 minutes (5-7.5 min active) | 50-80% < 1 kb |
| High Cross-linking | 50-60% | 1 sec on/1 sec off | 10-12 minutes (5-6 min active) | 30-60% < 1 kb |
Sample-Specific Optimization
The optimal sonication parameters vary significantly depending on sample characteristics:
Cell Culture Samples:
- Ideal concentration: 1×10⁷ to 2×10⁷ cells per 1 ml of lysis buffer [78]
- Lower cell concentrations may require reduced sonication time
- Cell type differences (e.g., embryonic stem cells vs. differentiated cells) may necessitate adjustment
Tissue Samples:
- Recommended amount: 100-150 mg tissue per 1 ml lysis buffer [79] [78]
- Dense tissues may require pre-homogenization using Dounce homogenizers or mechanical dissociators [79]
- Connective tissue-rich samples often need increased amplitude or duration
- Tissue-specific optimization is essential—validated parameters for colorectal cancer tissue are available [79]
Sample Volume and Configuration:
- Consistent volume (typically 1 ml) is critical for reproducible results
- Samples should be kept in an ice-water bath throughout sonication to prevent heating
- The sonicator probe should not touch the tube walls or bottom to avoid foaming and inefficient energy transfer
Quality Control of Sheared Chromatin
Fragment Size Analysis
Rigorous quality assessment of sheared chromatin is essential before proceeding to immunoprecipitation. Multiple methods are available for evaluating fragment size distribution:
- Agarose Gel Electrophoresis: Provides visual assessment of fragment size distribution but has limited sensitivity for precise quantification.
- Bioanalyzer/TapeStation: Microfluidics-based systems offering digital sizing and quantification of DNA fragments, providing high resolution between 100-1000 bp.
- qPCR Methods: Can assess shearing efficiency at specific genomic loci but does not provide genome-wide overview.
For H3K27me3 and H3K9me3 analyses, which often target broader domains, a slightly larger average fragment size (300-500 bp) may be acceptable compared to the 100-300 bp ideal for transcription factors or sharp marks like H3K4me3 [80]. However, the majority of fragments should still be under 500 bp for efficient library preparation and sequencing.
Quality Metrics and Troubleshooting
Systematic quality control ensures consistent, reproducible results and identifies suboptimal shearing before committing valuable samples to full ChIP-seq workflows.
Table 2: Quality Control Metrics for Sheared Chromatin
| QC Metric | Target Value | Assessment Method | Corrective Action |
|---|---|---|---|
| Fragment Size Distribution | 60-90% fragments <1 kb | Bioanalyzer, agarose gel | Increase sonication time or amplitude |
| DNA Concentration | >5 ng/μL (post-crosslink reversal) | Fluorometric assay | Increase starting material |
| Fragment Size Range | Majority between 100-500 bp | Bioanalyzer | Adjust sonication parameters |
| Size Consistency | Similar profiles across replicates | Bioanalyzer, gel | Standardize sonication protocol |
Common shearing issues and solutions:
- Under-sonication: Results in large fragments (>1000 bp) reducing resolution and IP efficiency. Increase sonication time or amplitude incrementally.
- Over-sonication: Produces very small fragments (<100 bp) that may damage epitopes and reduce IP efficiency. Reduce sonication time or amplitude.
- Inconsistent Fragmentation: Often caused by variable sample handling or temperature. Ensure consistent sample volume, cell concentration, and cooling.
- Foaming During Sonication: Indicates probe placement issues. Adjust tube position to prevent probe contact with tube walls.
The Scientist's Toolkit: Essential Reagents and Equipment
Table 3: Essential Reagents and Equipment for Chromatin Shearing
| Item | Function | Specific Examples/Recommendations |
|---|---|---|
| Probe Sonicator | Chromatin fragmentation | Branson Digital Sonifier with 1/8-inch micro tip [78] |
| Protease Inhibitor Cocktail | Prevent protein degradation during processing | 200X PIC in lysis buffers [78] |
| Lysis Buffers | Nuclear isolation and chromatin preparation | ChIP Sonication Cell Lysis Buffer, ChIP Sonication Nuclear Lysis Buffer [78] |
| Formaldehyde | Cross-linking protein-DNA interactions | Fresh 37% formaldehyde or 16% methanol-free formaldehyde [78] |
| Dounce Homogenizer | Tissue disruption | 7 ml Dounce tissue grinder with pestle A [79] |
| Glycine | Quench cross-linking reaction | 10X Glycine solution [78] |
| Ice-water Bath | Sample cooling during sonication | Maintain samples at 4°C during fragmentation [78] |
Experimental Workflow and Visualization
The complete chromatin shearing workflow integrates sample preparation, cross-linking optimization, and quality assessment in a systematic pipeline to ensure reproducible fragmentation.
The visualization above outlines the critical decision points in chromatin shearing optimization. The red-highlighted sonication steps represent the most variable component requiring empirical optimization, while green steps indicate standardized procedures. The quality control checkpoint ensures fragments meet size distribution standards before proceeding to immunoprecipitation.
Advanced Considerations for Specific Histone Modifications
The optimal shearing approach varies for different histone modifications due to their distinct chromatin contexts:
H3K4me3: Typically found in open, accessible chromatin at active promoters [28]. Standard sonication parameters usually suffice, with target fragment sizes of 100-300 bp for high resolution of these sharp peaks.
H3K27me3: Characterizes facultative heterochromatin with broader domains [76] [28]. Slightly larger fragment sizes (200-500 bp) may help capture the extended nature of these repressive domains while maintaining mapping precision.
H3K9me3: Marks constitutive heterochromatin, often in repeat-rich regions [76]. These areas can be more resistant to fragmentation, potentially requiring increased sonication intensity. However, over-sonication should be avoided to prevent damaging the H3K9me3 epitope.
For studies investigating multiple modifications simultaneously, a balanced approach targeting 200-400 bp fragments often provides satisfactory results across different chromatin types. Verification of shearing efficiency by qPCR at representative genomic loci for each modification type is recommended before proceeding to genome-wide analysis.
Optimized chromatin shearing is a foundational step in generating high-quality ChIP-seq data for histone modification studies. By systematically optimizing sonication parameters, implementing rigorous quality control, and tailoring approaches to specific biological contexts, researchers can ensure robust and reproducible mapping of H3K4me3, H3K27me3, and H3K9me3 distributions. The protocols and guidelines presented here provide a framework for establishing reliable chromatin shearing methods that form the basis for accurate epigenetic profiling in diverse research applications, from basic mechanism studies to drug development pipelines.
Ensuring Antibody Specificity and Reducing Background Noise
In chromatin immunoprecipitation followed by sequencing (ChIP-seq), antibody specificity is the cornerstone for generating reliable and interpretable data, directly impacting the accuracy of genome-wide maps for histone modifications like H3K4me3, H3K27me3, and H3K9me3 [44]. High background noise can obscure true biological signals, leading to flawed conclusions about the epigenetic landscape [81]. This technical guide provides a comprehensive framework for ensuring antibody specificity and minimizing noise, framed within the critical context of epigenetic research aimed at understanding gene regulation in development and disease [46] [82].
Antibody Validation: The First Line of Defense
A successful ChIP-seq experiment fundamentally depends on an antibody that effectively and specifically captures the target epitope across the entire genome [83]. Rigorous, multi-step validation is non-negotiable.
Standard Validation Practices
Commercially available ChIP-seq validated antibodies typically undergo a stringent process [83]:
- Initial ChIP-qPCR Screening: The antibody is first tested using quantitative PCR against known positive and negative genomic regions to confirm enrichment.
- Signal-to-Noise Assessment for Sequencing: Antibody sensitivity is confirmed by analyzing the signal-to-noise ratio across the genome, requiring a minimum number of defined enrichment peaks and a minimum signal threshold compared to an input chromatin control [83].
- Motif Analysis (for Transcription Factors): For antibodies against sequence-specific DNA-binding proteins, specificity is checked by determining if the enriched DNA sequences contain the known binding motif.
- Epitope and Complex Redundancy Checks: Specificity is further confirmed by comparing enrichment patterns using multiple antibodies against different epitopes of the same target or different subunits of a protein complex [83].
Advanced In-Assay Specificity Analysis
Recent advancements allow for the direct assessment of antibody specificity within the ChIP-seq experiment itself. The sans spike-in quantitative ChIP (siQ-ChIP) method leverages the principle that the immunoprecipitation step is a competitive binding reaction [81]. By titrating the antibody concentration and sequencing points along the resulting binding isotherm, researchers can distinguish an antibody's spectrum of binding interactions:
- Narrow-Spectrum Antibodies: Exhibit one dominant binding constant, indicating specific interaction with the intended epitope.
- Broad-Spectrum Antibodies: Display a range of binding constants, where strong (high-affinity) interactions are likely on-target, and weaker (low-affinity) interactions may represent off-target binding [81].
This method reveals that the interpretation of histone modification distribution can depend on antibody concentration, highlighting the importance of optimizing this parameter for each specific antibody [81].
Key Research Reagents and Solutions
The following table details essential reagents and their functions for ensuring specificity and low noise in ChIP-seq experiments.
Table 1: Key Research Reagent Solutions for ChIP-seq Experiments
| Reagent/Solution | Function/Role in Specificity & Noise Reduction |
|---|---|
| ChIP-seq Validated Antibodies | Antibodies pre-verified for effective genome-wide capture of the target protein or histone mark; undergo rigorous signal-to-noise and specificity checks [83]. |
| Micrococcal Nuclease (MNase) | Enzyme used for chromatin fragmentation; produces consistent mono-nucleosome-sized fragments, reducing size-based bias and improving quantification accuracy compared to sonication [81]. |
| Input Chromatin Control | A sample of chromatin taken before immunoprecipitation; serves as a critical background model for computational peak calling and identifying non-specific enrichment [44]. |
| Tris-based Quenching Solution | An effective alternative to glycine for quenching formaldehyde crosslinking; improves reproducibility by more reliably terminating the crosslinking reaction [81]. |
| Magnetic Protein A/G Beads | Solid support for antibody capture; in optimized protocols, pre-clearing and blocking steps can be omitted as non-specific bead-chromatin interactions are typically minimal (<1.5% of input) [81]. |
Experimental Optimization for Noise Reduction
A meticulously optimized wet-lab protocol is paramount for minimizing background noise and achieving high-quality data.
Chromatin Preparation and Fragmentation
- MNase Digestion vs. Sonication: MNase digestion is superior for generating a tight distribution of mono-nucleosome-sized fragments (∼150-200 bp), which enhances reproducibility and simplifies downstream quantitative analysis [81]. Sonication often produces a wider range of fragment sizes (100-800 bp), introducing complexity and potential bias [81] [44].
- Optimizing Digestion Conditions: Over-digestion by MNase must be avoided, as it degrades the mono-nucleosome band and reduces DNA yield. A standard starting condition is 75 units of MNase for 5 minutes per 10 cm dish of HeLa cells at 80% confluence, which has proven effective across multiple cell types [81]. Digestion efficiency should always be assessed using purified DNA, not crude chromatin, for an accurate representation [81].
Immunoprecipitation and Washes
- Antibody Titration: Performing a titration series to establish a binding isotherm is a core principle of siQ-ChIP. Using either too little or too much antibody can compromise results; the goal is to identify the saturation point for optimal capture [81].
- Crosslinking Quenching: Replacing 125 mM glycine with 750 mM Tris as a formaldehyde quencher has been shown to improve reproducibility, potentially because glycine cannot form a terminal product with formaldehyde [81].
- Bead Control: Bead-only controls (without antibody) should be included to measure non-specific chromatin binding. Bead-only DNA capture should ideally be below 1.5% of the input DNA; if higher, it may indicate a need for protocol adjustment [81].
Computational Quality Control and Background Assessment
After sequencing, robust computational QC metrics are essential to evaluate the success of the experiment and the specificity of the antibody.
Key QC Metrics
- Fraction of Reads in Peaks (FRiP): This measures the proportion of all sequenced reads that fall within called peaks. A high FRiP score (e.g., >1% for broad marks, >5% for sharp marks) indicates strong enrichment over background. High-quality MOWChIP-seq datasets for histone marks can achieve average FRiP scores of 0.45 for H3K4me3 and 0.38 for H3K27ac [82].
- Strand Cross-Correlation: This analysis measures the clustering of reads from forward and reverse strands, which is indicative of successful enrichment.
- Normalized Strand Cross-correlation (NSC): An NSC value >1.05 is recommended by ENCODE. For example, H3K4me3 data often shows high NSC values (~1.66) [82].
- Relative Strand Cross-correlation (RSC): An RSC value >1.0 is recommended. Repressive marks like H3K27me3 can show high RSC values (e.g., ~3.87) [82].
- Library Complexity and Mapping Rates: A high rate of uniquely mapped reads (e.g., >50-70%) indicates good library quality. High redundancy (duplicate reads) can suggest PCR amplification bias from limited starting material [44] [82].
Table 2: Representative Quality Control Metrics from High-Quality Histone Mark ChIP-seq Data
| Histone Mark | Average FRiP Score | Average NSC (>1.05) | Average RSC (>1.0) | Replicate Correlation (Pearson's) |
|---|---|---|---|---|
| H3K4me3 | 0.450 | 1.66 | 1.60 | 0.95 |
| H3K27ac | 0.377 | 1.12 | 2.01 | 0.93 |
| H3K4me1 | 0.396 | 1.13 | 1.45 | 0.93 |
| H3K27me3 | 0.122 | 1.02 | 3.87 | 0.92 |
| H3K9me3 | 0.181 | 1.03 | 1.47 | 0.95 |
Data adapted from a multiomic study of lung cancer using MOWChIP-seq [82].
Peak Calling and Background Modeling
Peak calling identifies genomic regions with significant enrichment over background. Effective peak callers like MACS model the bimodal distribution of reads on forward and reverse strands to pinpoint binding sites precisely [44]. The use of an appropriate control (e.g., input DNA) is critical for statistical models (Poisson or negative binomial) to calculate significance and control the false discovery rate (FDR) [44].
Integrated Workflow for Specificity and Low Noise
The following diagram summarizes the key experimental and computational steps, highlighting critical decision points for ensuring antibody specificity and minimizing background noise throughout the ChIP-seq pipeline.
ChIP-seq Specificity and Noise Control Workflow
The reliability of conclusions drawn from ChIP-seq data, especially in research focused on the dynamic balance of activating and repressive marks like H3K4me3, H3K27me3, and H3K9me3, is inextricably linked to rigorous antibody validation and meticulous noise control [46] [82]. By integrating advanced antibody characterization methods like siQ-ChIP [81], optimized wet-lab protocols that leverage MNase fragmentation and controlled quenching [81], and stringent computational quality assessments using metrics like FRiP and strand cross-correlation [82], researchers can achieve the high data quality required to unravel complex epigenetic mechanisms in health and disease.
Addressing Low Signal-to-Noise Ratio and False Positives
Chromatin Immunoprecipitation followed by sequencing (ChIP-seq) remains a cornerstone method for epigenomic research, enabling genome-wide analysis of histone modifications including H3K4me3, H3K27me3, and H3K9me3. However, the technique is plagued by persistent challenges with signal-to-noise ratio and false positives that can compromise biological interpretations. These issues stem from fundamental methodological limitations, particularly the requirement for crosslinking and sonication, which disproportionately affect heterochromatic regions rich in repetitive elements [84]. Understanding and addressing these biases is crucial for researchers investigating chromatin states in disease mechanisms and drug development contexts.
Recent methodological comparisons reveal that our current understanding of chromatin states is "extensively incomplete" due to technical deficiencies in ChIP-based methods [84]. This technical whitepaper examines the sources of noise and false positives in ChIP-seq experiments, provides validated protocols for quality assessment, and introduces emerging methodologies that overcome these limitations for more accurate chromatin analysis.
Understanding Methodological Biases and Their Impact
Systematic Biases in Chromatin Immunoprecipitation
ChIP-seq exhibits systematic biases toward accessible euchromatic regions, primarily due to differential DNA sensitivity to sonication and crosslinking efficiency. Studies demonstrate that input material for ChIP-seq is significantly biased toward open chromatin regions, while condensed loci are substantially underrepresented [84]. This bias creates a fundamental limitation for investigating heterochromatic features, including repetitive elements and retrotransposons marked by modifications such as H3K9me3.
Quantitative analyses reveal that loci with high ChIP-seq input enrichment scores (putative false positives) are preferentially located near gene transcription start sites and exhibit high chromatin accessibility [84]. These regions show strong correlation between ChIP-seq input values and ATAC-seq measurements (R = 0.76 at promoters), indicating that accessibility, rather than true biological signal, drives much of the apparent enrichment [84].
Histone Modification-Specific Biases
The extent of bias varies significantly across different histone modifications, with H3K9me3 demonstrating the most pronounced methodological artifacts:
Table 1: Methodological Comparison for Key Histone Modifications
| Histone Modification | Genomic Context | ChIP-seq Performance | CUT&Tag Performance | Correlation Between Methods |
|---|---|---|---|---|
| H3K4me3 | Active promoters | Strong at genic loci [84] | Strong at genic loci [84] | High correlation over enriched regions [84] |
| H3K27me3 | Facultative heterochromatin | Effective at genic loci [84] | Effective at genic loci [84] | High correlation over enriched regions [84] |
| H3K9me3 | Constitutive heterochromatin/repetitive elements | Underrepresents repetitive elements [84] | Robust detection over repetitive elements [84] | Low correlation (R = 0.151-0.190) [84] |
The dramatically low correlation between ChIP-seq and CUT&Tag for H3K9me3 (R = 0.151-0.190) underscores the severe limitations of ChIP-seq for investigating heterochromatic regions [84]. This is particularly problematic for drug development research focusing on epigenetic therapies that target heterochromatic silencing.
Experimental Protocols for Quality Optimization
Comprehensive ChIP-seq Quality Control Workflow
A robust quality control pipeline is essential for identifying and mitigating technical artifacts in ChIP-seq data. The following protocol outlines key steps for quality assessment:
Alignment Processing and Quality Metrics
- Remove duplicated reads and blacklisted "hyper-chippable" regions [85]
- Prepare normalized coverage tracks for genome browser visualization [85]
- Calculate strand cross-correlation to assess clustering of enriched fragments [85]
Strand Cross-Correlation Analysis Strand cross-correlation is computed as Pearson's linear correlation between tag density on forward and reverse strands, calculated after shifting the reverse strand by k base pairs. This analysis typically produces two peaks: a fragment length peak and a "phantom peak" corresponding to read length [85].
Key quality metrics derived from cross-correlation analysis include:
- NSC (Normalized Strand Cross-correlation coefficient): Ratio of the fragment peak correlation to the background correlation
- RSC (Relative Strand Cross-correlation coefficient): Ratio of the fragment peak to the phantom peak
- Quality Tags: RSC-based classifications ranging from -2 (veryLow) to 2 (veryHigh) [85]
Table 2: Essential Quality Metrics for ChIP-seq Experiments
| Quality Metric | Calculation | Interpretation | Optimal Range |
|---|---|---|---|
| Strand Cross-correlation | Pearson correlation between forward/reverse strand densities | Indicates enrichment quality | Clear fragment-length peak > phantom peak [85] |
| NSC (Normalized Strand Cross-correlation) | COL4 / COL8 from cross-correlation output | Normalized measure of enrichment | >1.05, higher indicates stronger enrichment [85] |
| RSC (Relative Strand Cross-correlation) | (COL4 - COL8) / (COL6 - COL8) | Relative enrichment over background | >0.8, higher indicates better signal-to-noise [85] |
| Quality Tag | Thresholded RSC value | Overall quality assessment | 1:High or 2:veryHigh [85] |
Advanced Protocol: CUT&Tag for Heterochromatic Regions
For investigations focusing on H3K9me3 or other heterochromatic marks, the CUT&Tag method provides superior performance:
Methodological Overview
- Utilizes Tn5 transposase to map genomic locations of chromatin modifications
- Eliminates need for crosslinking or sonication [84]
- Performs in situ chromatin fragmentation, retaining insoluble heterochromatin
Experimental Advantages
- Increased specificity and signal-to-noise ratios [84]
- Requires fewer input cells (cost-effective) [84]
- Enables mapping of chromatin features at young repetitive elements [84]
- Detects robust H3K9me3 levels over evolutionarily young retrotransposons [84]
Visualization of Methodological Workflows
ChIP-seq Workflow and Bias Introduction
CUT&Tag Workflow and Advantages
The Scientist's Toolkit: Essential Research Reagents
Table 3: Key Research Reagents for Chromatin Profiling Experiments
| Reagent / Solution | Function | Application Notes |
|---|---|---|
| Specific Antibodies | Target protein immunoprecipitation | Validate specificity for H3K4me3, H3K27me3, H3K9me3 [84] |
| Protein A-Tn5 Transposase | In situ chromatin fragmentation | Core enzyme for CUT&Tag; eliminates sonication bias [84] |
| Phantompeakqualtools | Strand cross-correlation analysis | Calculates NSC/RSC metrics for quality assessment [85] |
| Input Chromatin Samples | Background signal control | Essential for normalizing ChIP-seq enrichment [85] |
| OnTAD Algorithm | Hierarchical TAD identification | Identifies nested chromatin domains; robust performance [64] |
Discussion and Future Perspectives
The methodological limitations of ChIP-seq, particularly for H3K9me3 analysis, necessitate careful experimental design and interpretation. The emergence of in situ chromatin profiling methods like CUT&Tag provides powerful alternatives that overcome many traditional limitations, especially for heterochromatic regions [84]. For researchers in drug development, these technical considerations are paramount when investigating epigenetic mechanisms in disease or evaluating epigenetic therapeutics.
Future directions in chromatin profiling will likely involve increased adoption of in situ methods, single-cell epigenomic approaches, and integrated multi-omics frameworks that combine chromatin state with three-dimensional genome architecture [64]. As these technologies evolve, they will provide more comprehensive understanding of chromatin regulation in development and disease, enabling more targeted therapeutic interventions.
Best Practices for Experimental Replicates and Statistical Power
Chromatin Immunoprecipitation followed by sequencing (ChIP-seq) has revolutionized our ability to map protein-DNA interactions and histone modifications genome-wide, forming a cornerstone of modern epigenomic research [59]. For scientists investigating histone modifications such as H3K4me3, H3K27me3, and H3K9me3, rigorous experimental design is not merely a preliminary step but a fundamental determinant of success. A well-designed experiment ensures that results are biologically valid, statistically sound, and reproducible, transforming data into reliable scientific knowledge.
The core challenge in ChIP-seq experimental design lies in distinguishing true biological signal from technical noise and systematic biases. As high-throughput technologies become more powerful, the importance of statistical literacy and careful planning has only intensified [86]. Thoughtful design prevents the waste of resources on experiments with low prospects of success and reduces the risk of introducing biases or drawing incorrect conclusions, which is especially critical in drug development contexts where decisions have significant downstream implications. This guide outlines established best practices and emerging standards to empower researchers in designing robust and powerful ChIP-seq experiments.
Core Principles of Experimental Design for ChIP-seq
Biological Replication: The Foundation of Statistical Inference
Biological replicates—samples collected from distinct biological units (e.g., different cell cultures, different individuals)—are essential for assessing the reproducibility and generalizability of findings. They capture natural biological variation, allowing researchers to distinguish consistent effects from random fluctuations.
- Minimum Replicate Requirements: For ChIP-seq experiments, a minimum of two biological replicates is essential, but three or more are strongly recommended whenever possible [87]. This practice is aligned with the standards established by large consortia like ENCODE and modENCODE, which have performed thousands of ChIP-seq experiments [77].
- Avoiding Pseudoreplication: A common experimental error is pseudoreplication, which occurs when treatments are applied to non-independent samples but treated statistically as independent observations. For example, sequencing the same biological sample across multiple lanes to increase read depth generates technical replicates, not biological replicates. While technical replicates can help assess sequencing technical variation, they provide no information about biological variability and cannot substitute for true biological replicates [86].
The Critical Importance of Controls
Appropriate controls are non-negotiable for accurate data interpretation and normalization in ChIP-seq analysis. Their primary function is to account for technical and sequence-dependent biases.
- Input DNA Controls: The most widely used and recommended control is the "input DNA" or "whole-cell extract" control. This sample consists of cross-linked and sonicated chromatin that has not undergone immunoprecipitation [21] [88]. It controls for biases introduced by chromatin fragmentation, sequencing, and mapping. The ENCODE guidelines emphasize that input controls should be processed similarly to the ChIP samples, excluding the immunoprecipitation step [77].
- IgG Controls: In some experimental designs, control immunoprecipitations with a non-specific immunoglobulin G (IgG) can be used to account for non-specific antibody binding.
- Spike-in Controls: For experiments where global changes in histone modification levels are expected (e.g., comparing different cell types or drug-treated samples), spike-in controls using chromatin from a distant organism (e.g., Drosophila chromatin spiked into human or mouse samples) can help normalize for variations in ChIP efficiency and allow more qualitative comparisons between conditions [87].
Table 1: Essential Controls for ChIP-seq Experiments
| Control Type | Description | Primary Function | When to Use |
|---|---|---|---|
| Input DNA | Cross-linked, sonicated DNA before IP | Accounts for technical biases (sonication, sequencing, mappability) | Standard for all ChIP-seq experiments |
| IgG | Non-specific antibody IP | Controls for non-specific antibody binding | When background antibody binding is a concern |
| Spike-in | Chromatin from a distant organism | Normalizes for global changes in histone marks between vastly different conditions | Comparing different cell types or drug treatments |
Designing for Statistical Power
Determining Optimal Sequencing Depth
Sequencing depth (the number of reads per sample) significantly impacts the ability to detect genuine binding events or enrichment domains. The optimal depth varies depending on the biological target.
- Transcription Factors (Point-source factors): For factors that bind at specific genomic locations, producing sharp, narrow peaks, a sequencing depth of 10-15 million reads is typically sufficient [87].
- Histone Modifications (Broad-source factors): For histone marks like H3K27me3 and H3K9me3 that form broad domains, a higher sequencing depth of at least 30 million reads is recommended to adequately cover these expansive regions [87]. The distinct enrichment profiles of H3K27me3—which can manifest as broad domains, promoter peaks on bivalent genes, or promoter peaks on active genes—further underscore the need for sufficient depth to capture these varied patterns [21].
Power Analysis for Sample Size Determination
Power analysis is a statistical method used to determine the sample size needed to detect an effect of a certain size with a given level of confidence. While underused in genomics, it provides a principled approach to optimize resource allocation.
- Key Components: Power analysis involves five elements: (1) sample size, (2) expected effect size, (3) within-group variance, (4) false discovery rate, and (5) statistical power [86].
- Practical Application: Since the true effect size and variance are often unknown before conducting the experiment, researchers can use estimates from pilot studies, comparable published literature, or biologically meaningful thresholds. For example, a biologist might define a minimum interesting effect as a 2-fold change in enrichment based on known stochastic fluctuations in the system [86].
- The Replication vs. Depth Trade-off: When working with a fixed budget, researchers face a trade-off between sequencing depth and the number of biological replicates. Evidence suggests that increasing biological replicates provides greater statistical power than increasing sequencing depth per sample beyond a moderate level [86]. Power gains from deeper sequencing plateau, whereas additional replicates better capture biological variability.
Table 2: Sequencing Recommendations for Histone Modifications
| Histone Mark | Expected Pattern | Recommended Sequencing Depth | Key Biological Role |
|---|---|---|---|
| H3K4me3 | Sharp peaks at transcription start sites (TSS) | ~30 million reads | Associated with active promoters [57] |
| H3K27me3 | Broad domains or promoter peaks | ~30 million reads or more | Associated with transcriptional repression; can form bivalent domains with H3K4me3 [21] [57] |
| H3K9me3 | Broad domains | ~30 million reads or more | Associated with heterochromatin and transcriptional repression [77] |
Practical Experimental Protocols and Reagent Solutions
Antibody Validation Framework
The specificity of the antibody used for immunoprecipitation is arguably the most critical factor in ChIP-seq experiment quality. The ENCODE consortium has established rigorous guidelines for antibody characterization [77].
- Primary Characterization Methods:
- Immunoblot (Western Blot): The primary recommended method. A successful immunoblot should show a single dominant band at the expected molecular weight, containing at least 50% of the total signal. Bands at unexpected sizes or multiple strong bands suggest potential cross-reactivity [77].
- Immunofluorescence: An alternative method when immunoblot is not successful. The staining pattern should match expected subcellular localization (e.g., nuclear for histone modifications) [77].
- Secondary Validation: Additional validation can include demonstrating that the signal is reduced upon siRNA knockdown or mutation of the target, or identifying the immunoprecipitated protein by mass spectrometry [77].
- Source Considerations: When obtaining antibodies, prioritize "ChIP-seq grade" antibodies validated by reliable sources such as the ENCODE Consortium or Epigenome Roadmap. For commercial antibodies, note that quality can vary between different lot numbers, even with the same catalog number [87].
Standardized ChIP-seq Workflow
A typical ChIP-seq protocol involves the following key steps, with careful attention at each stage to minimize variability:
- Cross-linking: Cells are treated with formaldehyde to covalently cross-link proteins to DNA [77].
- Cell Lysis and Chromatin Shearing: Chromatin is fragmented to sizes of 100-300 bp, typically via sonication or enzymatic digestion [77] [21].
- Immunoprecipitation: The protein-DNA complex of interest is enriched using a specific antibody [77].
- Cross-link Reversal and DNA Purification: Protein-DNA cross-links are reversed, and the enriched DNA is purified [77].
- Library Preparation and Sequencing: Sequencing adapters are ligated to the DNA fragments, which are then amplified and sequenced [21].
ChIP-seq Experimental and Analytical Workflow
Essential Research Reagent Solutions
Table 3: Key Reagents for ChIP-seq Experiments
| Reagent Category | Specific Examples | Function & Importance | Quality Control Considerations |
|---|---|---|---|
| Antibodies | Anti-H3K4me3, Anti-H3K27me3, Anti-H3K9me3 | Specifically enrich for the histone modification of interest; most critical reagent | Use "ChIP-seq grade" antibodies; validate via immunoblot/immunofluorescence; check lot numbers [77] [87] |
| Cell Culture Reagents | Formaldehyde (for cross-linking) | Preserves in vivo protein-DNA interactions | Optimize cross-linking time; avoid over-cross-linking |
| Molecular Biology Kits | Library preparation kits | Prepare sequencing libraries from immunoprecipitated DNA | Use kits compatible with low-input DNA; include appropriate barcodes for multiplexing |
| Control Materials | Input DNA, IgG, Spike-in chromatin (e.g., Drosophila) | Normalize for technical biases and global changes | Process input control alongside IP samples; use spike-ins from evolutionarily distant species [87] |
Statistical Considerations and Data Analysis
Accounting for Technical Biases
ChIP-seq data analysis must account for several technical biases that can affect results:
- Mappability Bias: Genomic regions with high repetitiveness or low complexity may have fewer uniquely mapping reads, creating artificial "valleys" in coverage [89] [90].
- GC Content Bias: The nucleotide composition of DNA fragments affects their amplification and sequencing efficiency. Regions with extreme GC content (very high or very low) are often under-represented in sequencing libraries [89].
- Background Modeling: Advanced statistical frameworks like MOSAiCS use a non-homogeneous negative binomial regression model to account for these biases, providing more accurate peak calling than models assuming uniform background [89].
Reproducibility Assessment
Evaluating the consistency between biological replicates is essential for quality control. The ENCODE consortium standards provide benchmarks for assessing replicate quality, typically requiring high correlation between replicates. Irreproducible results suggest either technical issues or high biological variability requiring additional replicates.
Robust experimental design is the cornerstone of impactful ChIP-seq research, particularly for studies investigating the nuanced roles of histone modifications like H3K4me3, H3K27me3, and H3K9me3. By adhering to established best practices—including adequate biological replication, appropriate controls, validated antibodies, sufficient sequencing depth, and bias-aware statistical analysis—researchers can generate data that yields biologically meaningful and statistically sound conclusions. These practices ensure efficient use of resources and enhance the reproducibility and reliability of epigenomic findings, ultimately accelerating discovery in basic research and drug development.
Validating ChIP-seq Data: Integrating H3K4me3, H3K27me3, and H3K9me3 with Multi-Omics Approaches
In the field of epigenetic research, particularly in Chromatin Immunoprecipitation followed by sequencing (ChIP-seq) studies of histone modifications such as H3K4me3, H3K27me3, and H3K9me3, the reliability of the entire experimental workflow depends on rigorous validation at critical technical stages. ChIP-seq enables genome-wide identification of binding sites and epigenetic marks, but its power is fully realized only when supported by validated methods at key points: the quantitative PCR (qPCR) used for initial validation of ChIP enrichment, and the western blotting used to confirm antibody specificity [21] [91]. Without proper validation, researchers risk drawing erroneous conclusions about epigenetic mechanisms, potentially misallocating resources in drug development, or pursuing false leads in biomarker discovery. The reproducibility crisis in life sciences research, driven partly by unvalidated reagents and methods, underscores the critical importance of these practices [92]. This guide provides a comprehensive framework for implementing validation techniques specifically within the context of ChIP-seq-based epigenetic research, offering standardized approaches that support data integrity from bench to publication and ultimately to clinical application.
qPCR Validation in Epigenetic Research
Core Principles and Application in ChIP-seq Workflows
Quantitative PCR (qPCR) serves as a cornerstone validation technique in epigenetic research, particularly for confirming target enrichment in ChIP-seq experiments before proceeding to full sequencing. The powerful amplification capability of PCR—theoretically generating 1000 billion copies from a single DNA molecule after 40 cycles—makes validation essential to avoid amplifying contaminants or non-specific targets, which could lead to incorrect conclusions about histone modification patterns [93]. The research community has established guidelines like the Minimum Information for Publication of Quantitative Real-Time PCR Experiments (MIQE) to standardize reporting and ensure reliability of results across laboratories [93]. More recently, the CardioRNA consortium has addressed the "noticeable lack of technical standardization" with additional guidelines specifically for clinical research applications, highlighting the evolving nature of validation standards [94].
In the context of ChIP-seq for histone modifications like H3K4me3, H3K27me3, and H3K9me3, qPCR validation typically occurs at two critical points: after chromatin immunoprecipitation to confirm specific enrichment of target regions before library preparation, and during the assay development phase to validate primers and probes against known positive and negative genomic regions.
Key Validation Parameters for qPCR
For researchers validating qPCR assays to support ChIP-seq experiments, three fundamental parameters must be established to ensure data reliability.
Inclusivity measures how well the qPCR detects all intended target sequences or variants. When developing a qPCR assay to validate enrichment of a specific histone modification across multiple genomic contexts, the assay must reliably amplify all relevant target regions. Without proper inclusivity validation, researchers might fail to detect certain epigenetic states, leading to incomplete understanding of histone modification patterns [93]. International standards recommend testing up to 50 well-defined target sequences where applicable to properly establish inclusivity.
Exclusivity (or cross-reactivity assessment) evaluates how well the qPCR assay distinguishes target sequences from genetically similar non-targets. In histone modification studies, this ensures that primers do not amplify regions with similar sequences but different modification status. Exclusivity validation involves both in silico analysis using genetic databases to check for sequence similarities, and experimental testing to confirm specificity [93].
Linear Dynamic Range establishes the range of template concentrations over which the fluorescent signal is directly proportional to the DNA template concentration. This is typically determined using a seven 10-fold dilution series of DNA standard run in triplicate, with a well-optimized assay demonstrating linearity across 6-8 orders of magnitude. The correlation coefficient (R²) should be ≥0.980, and primer efficiency must fall between 90-110% for confident quantitative results [93].
Table 1: Essential qPCR Validation Parameters for ChIP-seq Research
| Parameter | Definition | Validation Method | Acceptance Criteria |
|---|---|---|---|
| Inclusivity | Ability to detect all target variants/sequences | Test against 50 certified target sequences | Detection of all intended targets |
| Exclusivity | Ability to exclude non-target sequences | In silico analysis and experimental testing | No amplification of non-targets |
| Linear Dynamic Range | Range where signal is proportional to template | 7-point 10-fold dilution series in triplicate | R² ≥ 0.980, 6-8 orders of magnitude |
| Amplification Efficiency | Reaction efficiency during exponential phase | Standard curve from dilution series | 90-110% |
| Limit of Detection (LOD) | Lowest detectable target concentration | Probabilistic analysis of low concentration samples | 95% detection rate |
Advanced Considerations for Clinical Research Applications
For researchers translating epigenetic findings toward clinical applications, additional validation rigor is required. The fit-for-purpose (FFP) concept dictates that "the level of validation associated with a medical product development tool is sufficient to support its context of use" [94]. Clinical research (CR) assays occupy the middle ground between research use only (RUO) and fully regulated in vitro diagnostics (IVD), requiring more thorough validation than basic research assays but not reaching the stringency of certified diagnostic tests [94].
Key performance characteristics for CR assays include:
- Analytical precision: Closeness of repeated measurements to each other
- Analytical sensitivity: Ability to detect the target analyte at low concentrations
- Analytical specificity: Ability to distinguish target from non-target analytes
- Analytical trueness: Closeness of measured values to true values [94]
These parameters must be established with the specific clinical context in mind, whether for diagnostic, prognostic, predictive, or monitoring applications of histone modification biomarkers identified through ChIP-seq studies.
Western Blot Antibody Validation
The Critical Role of Antibody Specificity in Protein Analysis
In epigenetic research, western blotting serves as an essential technique for validating antibody specificity before their use in ChIP-seq experiments for histone modifications like H3K4me3, H3K27me3, and H3K9me3. The accuracy of western blot results relies heavily on the quality of primary antibodies, and inconsistent antibody performance represents a significant source of irreproducibility in research findings [92]. Well-characterized antibodies that consistently demonstrate both specificity (ability to recognize and bind the target epitope) and selectivity (preference to bind the target antigen in the presence of competing proteins) are fundamental to robust, reproducible research [92]. The International Working Group for Antibody Validation (IWGAV) has established guidelines to address these concerns, recommending that researchers employ multiple validation strategies to confirm antibody performance in their specific experimental context [92] [95].
Comprehensive Validation Strategies for Western Blotting
For researchers investigating histone modifications, employing multiple complementary validation strategies provides the highest confidence in antibody specificity.
Genetic Strategies represent the gold standard for antibody validation in western blotting. This approach involves measuring signal in control cells or tissues where the target epitope has been knocked out or knocked down using CRISPR-Cas9 or RNA interference (RNAi) [95] [96]. Since there should be little to no expression of the target protein in these controls, any remaining signal indicates cross-reactivity or non-specific binding. For histone modifications, this might involve using cell lines with mutations in specific histone genes or histone-modifying enzymes.
Orthogonal Strategies involve cross-referencing antibody-based results with data obtained using non-antibody-based methods [97]. This could include mining publicly available databases (such as CCLE, BioGPS, or Human Protein Atlas) for genomic and transcriptomic profiling information to confirm whether observed immunostaining results align with predicted expression patterns [97]. For histone modifications, mass spectrometry-based proteomic approaches can provide independent confirmation of modification status.
Independent Antibody Strategies employ two or more different antibodies against the same target protein but recognizing different epitopes [95]. The correlation between results obtained with these independent antibodies provides strong evidence of specificity, as it's unlikely that multiple antibodies would exhibit the same off-target binding pattern. This approach pairs effectively with genetic knockout or knockdown validation [95].
Expression of Tagged Proteins validates antibodies by expressing the target protein with an affinity tag (e.g., FLAG or v5) or fluorescent protein (such as GFP), then confirming that antibody signal corresponds with the tag-based detection [95]. This approach is most effective when tagging the endogenous gene, as overexpression might artificially mask off-target binding issues.
Table 2: Antibody Validation Strategies for Western Blotting in Epigenetic Research
| Validation Method | Key Principle | Experimental Approach | Advantages |
|---|---|---|---|
| Genetic Strategies | Target ablation confirms specificity | CRISPR-Cas9, RNAi knockout/knockdown | Gold standard, definitive evidence |
| Orthogonal Strategies | Non-antibody methods confirm results | Proteomics, transcriptomics, public databases | Independent verification, utilizes existing data |
| Independent Antibody | Multiple antibodies to different epitopes | Compare results from ≥2 independent antibodies | Strong evidence when antibodies correlate |
| Tagged Protein Expression | Correlation with tagged target | Endogenous tagging with FLAG, GFP, etc. | Direct target correspondence |
Practical Implementation and Batch Variation Management
Proper implementation of antibody validation requires careful attention to experimental controls and conditions. Appropriate positive and negative controls are essential for all western blotting experiments [92]. Positive controls using lysate from cell lines known to express the specific target protein provide information about protocol success, while negative controls help identify non-specific binding. It's advisable to test antibodies on multiple cell or tissue types to build a comprehensive protein expression profile, as different biological contexts may present different cross-reactive epitopes [92].
Batch variation represents a significant source of irreproducibility in antibody-based experiments. Vendors and researchers are encouraged to perform validation testing on every antibody batch produced [92]. Recombinant antibodies offer particular advantages for reducing batch variation, as they are produced via synthetic DNA expression vectors introduced into suitable expression systems, eliminating traditional reliance on hybridoma cells and their associated instability or "genetic drift" [92]. This production method reliably yields high titers of homogeneous antibody with greater consistency across batches.
Orthogonal Assays for Validation
Principles and Applications in Research Validation
Orthogonal validation represents a fundamental principle in research methodology: using multiple independent techniques to analyze or validate results, thereby reducing potential biases and enhancing overall measurement accuracy [98]. In pharmaceutical and biopharmaceutical contexts, orthogonal methods are essential for characterizing complex biological products, but the same principles apply powerfully to basic research validation [98]. The core concept of orthogonality dictates that results obtained through primary methods (such as antibody-based detection) require corroboration by non-antibody-based detection methods [97]. This approach provides an additional level of detail to support results generated by other validation strategies.
In epigenetic research, particularly for ChIP-seq studies of histone modifications, orthogonal validation strengthens conclusions by demonstrating that findings are not methodological artifacts. For example, positive and negative expression of a target observed by western blotting should be confirmed using an orthogonal approach, such as genetic sequencing to confirm knockout or transcriptomic analysis of mRNA to confirm expression patterns [97]. This multi-faceted approach is especially valuable when investigating complex epigenetic phenomena like the distinct H3K27me3 profiles associated with different regulatory consequences identified through ChIP-seq analysis [21].
Implementation Strategies for Epigenetic Research
Orthogonal validation can be implemented through several approaches in histone modification research:
Validation Using 'Omics Data involves mining publicly available databases for genomic and transcriptomic profiling information to confirm whether immunostaining results align with predicted expression patterns [97]. For example, western blot detection of a target across various cell lines should correlate with transcriptomic data from sources like the Cancer Cell Line Encyclopedia (CCLE) or DepMap Portal. When antibody-based results consistently align with orthogonal transcriptomic data across multiple cell lines, confidence in antibody specificity increases significantly.
Validation of Antibody Data Generated Using Imaging Techniques employs methods such as in situ hybridization, RNA-seq, and RNAscope to detect protein expression and/or localization in tissues, providing independent confirmation of results obtained through immunocytochemistry or immunohistochemistry [97]. The defining criterion of success for an orthogonal strategy is consistency between the known or predicted biological role and localization of a gene/protein of interest and the resultant antibody staining [97].
Mass Spectrometry-Based Approaches provide particularly powerful orthogonal validation for histone modification studies. Advanced mass spectrometry techniques, particularly Data Independent Acquisition (DIA) methods such as SWATH-MS, enable comprehensive identification and quantification of post-translational modifications including histone marks [98]. Unlike antibody-based methods, mass spectrometry can directly detect and quantify specific histone modifications without relying on epitope recognition, providing truly independent verification of results.
Integration with Multiple Validation Strategies
While orthogonal strategies provide compelling evidence that an antibody is behaving as expected, it is critical to combine orthogonal testing with other validation approaches to assure comprehensive confidence in research findings [97]. No single validation strategy is sufficient in isolation. The most robust research implementations combine orthogonal approaches with genetic strategies, independent antibody verification, and other relevant validation methods to create a compelling body of evidence supporting experimental conclusions.
This multi-pronged approach is particularly valuable in translational research, where orthogonal techniques are increasingly vital for meeting regulatory requirements [98]. Regulatory agencies like the FDA and EMA recommend orthogonal analytical techniques to address the unique challenges presented by complex biologics and advanced therapeutic products [98]. Implementing orthogonal strategies provides the knowledge necessary to ensure that research findings meet the highest standards of reliability, ultimately supporting the translation of basic epigenetic discoveries toward clinical application.
Integrated Workflow for ChIP-seq Validation
Comprehensive Validation in Histone Modification Studies
For researchers investigating histone modifications such as H3K4me3, H3K27me3, and H3K9me3 using ChIP-seq, validation techniques must be integrated throughout the experimental workflow to ensure reliable, reproducible results. The technical complexity of ChIP-seq, combined with the subtle nuances of histone modification patterns, demands a systematic approach to validation that begins before chromatin immunoprecipitation and continues through data interpretation. Research has revealed that H3K27me3 displays distinct enrichment profiles with different regulatory consequences—broad domains across gene bodies corresponding to transcriptional repression, peaks around transcription start sites associated with bivalent genes, and surprisingly, promoter peaks associated with active transcription in some contexts [21]. Identifying these patterns confidently requires rigorous validation at multiple stages.
The diagram below illustrates the integrated validation workflow for ChIP-seq studies of histone modifications:
Research Reagent Solutions for Validation Experiments
Table 3: Essential Research Reagents for Validation Experiments
| Reagent Category | Specific Examples | Validation Application | Key Considerations |
|---|---|---|---|
| Validated Antibodies | Anti-H3K4me3, Anti-H3K27me3, Anti-H3K9me3 | Western blot, ChIP-seq | Species reactivity, lot consistency, application-specific validation |
| qPCR Reagents | Primers, probes, master mixes, standards | Target enrichment validation | Amplification efficiency, specificity, linear dynamic range |
| Cell Line Models | Knockout/Knockdown lines, overexpression lines | Genetic validation strategies | Endogenous tagging, isogenic controls |
| Orthogonal Tools | Mass spectrometry kits, RNA-seq reagents | Independent verification | Platform compatibility, sensitivity requirements |
| Reference Materials | Certified histone standards, control cell extracts | Assay standardization | Source reproducibility, stability documentation |
Practical Implementation in Research Studies
Implementing this integrated validation approach requires careful experimental planning and execution. In practice, ChIP-seq studies of histone modifications like H3K9me3 in disease contexts (such as membranous nephropathy research) demonstrate this comprehensive approach [91]. These studies employ specific antibodies for chromatin immunoprecipitation, followed by high-throughput sequencing and sophisticated bioinformatic analysis to identify differentially enriched regions [91]. Throughout this process, validation at each stage ensures that observed differences reflect biology rather than technical artifacts.
For example, research identifying distinct H3K27me3 profiles employed rigorous ChIP-seq methodology including proper controls (input DNA and control IgG), precise chromatin fragmentation, quality control of sequencing libraries, and appropriate bioinformatic analysis using tools like MACS for peak calling [21]. These methodological rigor enables identification of subtle but biologically important patterns in histone modification enrichment that might otherwise be overlooked or misinterpreted.
The integrated workflow emphasizes that validation is not a separate activity, but an essential component embedded throughout the research process. From initial antibody selection through final data interpretation, each step builds upon previous validation checkpoints to create a solid foundation for scientific conclusions. This approach is particularly crucial when investigating complex epigenetic phenomena such as the relationship between H3K27me3 patterns and transcriptional activity, where multiple enrichment profiles with distinct regulatory consequences coexist within the same cellular context [21].
Technical validation through qPCR, western blotting, and orthogonal assays represents the foundation of reliable, reproducible epigenetic research. In ChIP-seq studies of histone modifications like H3K4me3, H3K27me3, and H3K9me3, these validation techniques provide the critical checks and balances necessary to distinguish biological signal from methodological artifact. As research progresses toward clinical applications, implementing thorough validation frameworks becomes increasingly essential for translating basic scientific discoveries into meaningful advances in drug development and clinical diagnostics.
The field continues to evolve, with emerging technologies and increasingly sophisticated analytical approaches offering new opportunities for validation. However, the fundamental principles remain constant: multiple lines of evidence, independent verification, and transparent reporting. By integrating these validation techniques throughout the research workflow—from initial reagent qualification through final data interpretation—scientists can advance our understanding of epigenetic mechanisms with confidence in their findings and their potential to impact human health.
Comparative Analysis with ATAC-seq, RNA-seq, and DNA Methylation Data
The regulation of gene expression is a complex process governed not only by the genetic code but also by a dynamic layer of epigenetic modifications and chromatin architecture. While techniques like Chromatin Immunoprecipitation followed by sequencing (ChIP-seq) for histone marks such as H3K4me3, H3K27me3, and H3K9me3 provide crucial insights into the epigenetic landscape, a comprehensive understanding requires the integration of complementary datasets. Combining information on chromatin accessibility (ATAC-seq), transcriptional output (RNA-seq), and DNA methylation offers a powerful, multi-faceted approach to decipher the regulatory logic of the genome in development, health, and disease. This integrated strategy is particularly valuable for identifying master regulatory transcription factors, elucidating the mechanisms of gene silencing and activation, and discovering novel therapeutic targets in complex diseases like cancer [99] [100].
Each of these technologies provides a distinct yet interconnected view of cellular regulation: ATAC-seq maps the open regions of chromatin that are accessible to regulatory proteins; RNA-seq quantifies the abundance of all RNA transcripts, reflecting the final output of gene expression; and DNA methylation analysis reveals the methylation status of cytosine bases, a key repressive epigenetic mark. When framed within the context of a broader thesis on ChIP-seq for histone modifications, this integrated approach allows researchers to connect the dots between histone marks, chromatin structure, DNA chemical modifications, and gene expression. For instance, H3K27me3 is a well-known repressive mark deposited by the Polycomb Repressive Complex 2 (PRC2) [21]. Integrating H3K27me3 ChIP-seq data with ATAC-seq can reveal how this mark influences chromatin compaction, and further correlation with RNA-seq can directly link it to transcriptional repression of target genes.
Core Methodologies and Techniques
Assay for Transposase-Accessible Chromatin using Sequencing (ATAC-seq)
ATAC-seq is a high-throughput method for mapping genome-wide chromatin accessibility. It utilizes a hyperactive Tn5 transposase that simultaneously fragments DNA and inserts sequencing adapters into accessible regions of chromatin. These regions are typically nucleosome-free and enriched for regulatory elements such as promoters, enhancers, and insulators. The key advantage of ATAC-seq is its sensitivity and simplicity—it requires far fewer cells (as few as 50,000) than traditional methods like DNase-seq or MNase-seq and can be performed in a matter of hours [101].
The wet-lab protocol involves several critical steps. First, cells are lysed with a mild, non-ionic detergent to isolate intact nuclei. It is crucial to use fresh, unfixed cells for optimal results, as crosslinking can reduce the efficiency of the transposition reaction. The crude nuclei preparation is then immediately subjected to the transposition reaction, which combines the nuclei with the Tn5 transposase enzyme and a reaction buffer (TD), incubating at 37°C for 30 minutes. The transposed DNA is then purified using a standard PCR purification kit. The final step is a limited-cycle PCR amplification to generate the sequencing library. To minimize PCR amplification biases, a quantitative PCR (qPCR) side reaction is often used to determine the optimal number of cycles needed before the reaction plateaus. The resulting libraries are sequenced, typically using paired-end sequencing, to capture fragment length information that can also be used to infer nucleosome positions [101].
RNA Sequencing (RNA-seq)
RNA-seq provides a quantitative profile of the transcriptome, enabling the discovery of differentially expressed genes, alternative splicing events, and novel transcripts. The success of an RNA-seq experiment hinges on the quality and quantity of the starting RNA material. Isolating high-quality RNA with minimal degradation is paramount, as differential degradation between samples can be mistaken for true biological changes in gene expression [102].
Two primary approaches are commonly used: total RNA-seq and mRNA-seq. Total RNA-seq sequences all RNA molecules, both coding and non-coding, after the removal of abundant ribosomal RNA (rRNA). This provides the most comprehensive view of the transcriptome but generates noisier data and requires higher sequencing depth. In contrast, mRNA-seq enriches for polyadenylated (polyA) RNA, which primarily captures messenger RNA (mRNA) and some long non-coding RNAs. This method yields cleaner data focused on the coding transcriptome and is more cost-effective for gene expression quantification, but it is not suitable for non-polyadenylated RNAs and can introduce 3'-bias, especially with lower-quality RNA [103]. For RNA with low integrity (RIN < 7), total RNA-seq is generally recommended. A minimum of 500 ng of total RNA with an RNA Integrity Number (RIN) of 7 or higher is typically required for library preparation. The quality of RNA is best assessed using an Agilent TapeStation, which provides an objective RIN score [102].
DNA Methylation Analysis
DNA methylation in vertebrates involves the addition of a methyl group to the 5' carbon of cytosine, primarily in the context of CpG dinucleotides. This modification is a key epigenetic regulator of gene expression, and its analysis can be broadly divided into genome-wide and targeted approaches. Selecting the appropriate method depends on the biological question, the required resolution, DNA quality and quantity, and budgetary constraints [104].
Table 1: Comparison of Key DNA Methylation Sequencing Methods
| Method | Resolution | Coverage | Pros | Cons | Best For |
|---|---|---|---|---|---|
| Whole Genome Bisulfite Sequencing (WGBS) | Base-pair | Whole genome | Gold standard; comprehensive | Harsh treatment degrades DNA; expensive | Discovery in high-quality DNA [105] |
| Enzymatic Methylation Sequencing (e.g., EM-seq) | Base-pair | Whole genome | Gentler than bisulfite; less DNA damage | Newer method; fewer comparative studies | High-precision profiling in low-input/degraded samples [105] |
| Reduced Representation Bisulfite Seq (RRBS) | Base-pair | ~5-10% of CpGs | Cost-effective; focuses on CpG islands | Biased; limited genome coverage | Cost-sensitive studies of promoters/CpG islands [105] |
| Methylated DNA Immunoprecipitation (MeDIP-seq) | ~100-500 bp | Whole genome | Cost-effective; lower sequencing depth | Low resolution; antibody-dependent | Studying genome-wide methylation trends [105] |
| Long-Read Sequencing (PacBio/Nanopore) | Base-pair | Whole genome | Detects methylation on native DNA; long reads | Higher error rates; more DNA required | Phasing methylation with genetic variants [105] |
Whole Genome Bisulfite Sequencing (WGBS) is considered the gold standard for base-pair resolution mapping of DNA methylation across the entire genome. Sodium bisulfite conversion deaminates unmethylated cytosines to uracils (which are read as thymines during sequencing), while methylated cytosines remain unchanged. The primary drawback is that the harsh chemical treatment can significantly degrade DNA [105]. Alternative methods like Enzymatic Methylation Sequencing use a series of gentler enzymatic reactions to achieve the same conversion, preserving DNA integrity better and performing well with low-input or degraded samples such as those from Formalin-Fixed Paraffin-Embedded (FFPE) tissues [105].
Integrative Analysis and Workflow
Data Integration Strategies
Integrating data from ATAC-seq, RNA-seq, and DNA methylation assays allows researchers to build a mechanistic model of gene regulation. The general workflow begins with individual processing and quality control of each dataset. For ATAC-seq, this includes aligning sequencing reads, calling peaks of accessibility, and annotating these peaks to genomic features like promoters, enhancers, and insulators. RNA-seq data is processed for alignment and quantification of gene expression levels, followed by differential expression analysis. DNA methylation data, whether from sequencing or arrays, is analyzed to identify differentially methylated regions (DMRs) or specific CpG sites [106] [100].
A powerful initial integration step involves correlating chromatin accessibility at promoter regions with the expression levels of the associated genes. A positive correlation suggests that changes in accessibility may directly influence gene transcription. This analysis can be performed using a Spearman correlation on matched samples from the same patients. For example, one study defined a significant correlation with a coefficient ≥ 0.65 and a p-value < 0.01 [100]. These correlated genes can then be cross-referenced with DMRs, particularly those in promoter or enhancer regions. Typically, hypermethylation of a gene promoter is associated with transcriptional repression, while hypomethylation is linked to activation. By overlaying these datasets, one can identify genes whose aberrant expression in disease (e.g., cancer) is potentially driven by epigenetic mechanisms.
Table 2: Key Reagents and Research Solutions for Multi-Omics Experiments
| Item | Function | Example Products/Assays |
|---|---|---|
| Tn5 Transposase | Fragments DNA and ligates adapters in accessible chromatin | Illumina Tagment DNA TDE1 [101] |
| Methyl-Binding Domain | Enriches for methylated DNA for sequencing | meCUT&RUN [105] |
| Bisulfite Conversion Kit | Converts unmethylated cytosine to uracil for WGBS/RRBS | EZ DNA Methylation kits (Zymo Research) |
| RNA Stabilization Reagent | Preserves RNA integrity in tissues/cells post-collection | RNALater (Qiagen) [102] |
| RNA Isolation Kit | Purifies high-quality total RNA; removes contaminants | RNeasy kits (Qiagen) [102] |
| Methylation Arrays | High-throughput, cost-effective methylation profiling | Illumina Infinium MethylationEPIC [105] |
The Role of Machine Learning in Multi-Omics
Machine learning (ML) has emerged as an indispensable tool for integrating complex multi-omics data and predicting clinically relevant outcomes. ML algorithms can handle the high-dimensional nature of these datasets—where the number of features (genes, peaks, CpG sites) far exceeds the number of samples—to identify the most informative biomarkers.
A common application is feature selection to identify a minimal set of genes or epigenetic marks that can robustly classify disease subtypes or predict recurrence. Techniques like Recursive Feature Elimination with Cross-Validation (RFECV) combined with models like Support Vector Machines (SVM) are used to rank features by their importance [100]. For example, one study on endometrial cancer integrated DNA methylation, RNA-seq, and genomic variant data from The Cancer Genome Atlas (TCGA). They used decision trees and random forest models to identify key biomarkers like hypomethylation of PARD6G-AS1 and overexpression of CD44 that were predictive of cancer recurrence [106]. Similarly, in breast cancer, integrating ATAC-seq and RNA-seq with ML led to the identification of 10 signature genes that accurately classified intrinsic subtypes, providing insights into the underlying regulatory mechanisms [100].
Multi-Omics Data Integration Workflow
Experimental Protocols and Practical Guidelines
Detailed ATAC-seq Protocol
The following is a condensed version of a standard ATAC-seq protocol, optimized for human cells [101]:
- Cell Preparation and Lysis: Harvest and wash 50,000 intact cells in cold PBS. Resuspend the cell pellet in 50 µl of cold lysis buffer (10 mM Tris-HCl, pH 7.4, 10 mM NaCl, 3 mM MgCl2, 0.1% IGEPAL CA-630) to lyse the cell membrane and isolate nuclei. Spin down immediately at 500 RCF for 10 minutes at 4°C and discard the supernatant.
- Transposition Reaction: Resuspend the crude nuclei pellet in a transposition mix containing 25 µl of 2x TD Buffer, 2.5 µl of Tn5 Transposase (TDE1), and 22.5 µl of nuclease-free water. Incubate the reaction at 37°C for 30 minutes. Immediately purify the DNA using a Qiagen MinElute PCR Purification Kit and elute in 10 µl of Elution Buffer.
- Library Amplification: Amplify the transposed DNA by PCR using 10 µl of the purified DNA, 2.5 µl of each custom Nextera PCR primer (25 µM), 12.5 µl of nuclease-free water, and 25 µl of NEBNext High-Fidelity 2x PCR Master Mix. Use the following thermocycler conditions: 72°C for 5 minutes; 98°C for 30 seconds; then 5 cycles of (98°C for 10 seconds, 63°C for 30 seconds, 72°C for 1 minute).
- qPCR for Cycle Determination: To avoid over-amplification, run a 5 µl aliquot of the PCR product with SYBR Green in a qPCR reaction to determine the optimal number of additional cycles (N). This is the cycle number corresponding to one-quarter of the maximum fluorescent intensity.
- Final Amplification and Cleanup: Run the remaining PCR reaction for N additional cycles. Purify the final library using the MinElute PCR Purification Kit. The library can be quantified and visualized on a high-sensitivity gel or bioanalyzer before sequencing.
Sample Quality Control Across Platforms
Rigorous quality control is critical for each data type in an integrated study:
- RNA-seq: Assess RNA integrity using the RNA Integrity Number (RIN). A RIN of 7–10 is desirable, and the range across a sample set should be narrow (1–1.5) to avoid artifacts. Use a NanoDrop to check sample purity, with 260/280 and 260/230 ratios ideally above 1.8 [102].
- ATAC-seq: The number of cells used for the transposition reaction is crucial, as the transposase-to-cell ratio dictates the fragment distribution. An excess of cells can lead to under-transposition, while too few can cause over-digestion. After library amplification, the fragment size distribution should be checked on a high-sensitivity gel or bioanalyzer, showing a characteristic periodicity of nucleosome-protected fragments [101].
- DNA Methylation: The required input DNA amount and quality vary by method. While LC-MS/MS can work with as little as 50-100 ng of even degraded DNA, WGBS requires microgram quantities of high-quality DNA for best results. For FFPE samples, enzymatic methods or arrays are more robust choices [104] [105].
The integrative analysis of ATAC-seq, RNA-seq, and DNA methylation data provides a powerful, multi-dimensional lens through which to view the regulatory genome. When contextualized with ChIP-seq data for histone modifications like H3K4me3, H3K27me3, and H3K9me3, this approach enables the construction of comprehensive models that connect epigenetic states and chromatin architecture to transcriptional outcomes. As the protocols for each method become more refined and accessible, and as machine learning algorithms for data integration grow more sophisticated, this multi-omics strategy will undoubtedly continue to drive discoveries in basic biology and unlock new avenues for therapeutic intervention in cancer and other complex diseases.
Correlating Histone Marks with Gene Expression and Phenotypic Outcomes
The central dogma of molecular biology outlines the flow of genetic information from DNA to RNA to protein, yet this sequence alone cannot explain the remarkable diversity of cell types and functions that arise from an identical genetic blueprint. Epigenetic modifications, particularly post-translational modifications of histone proteins, serve as critical regulators that enable this functional diversity by modulating chromatin structure and gene expression without altering the underlying DNA sequence [41]. Among the numerous histone modifications identified, three marks stand out for their well-characterized and often opposing roles in gene regulation: H3K4me3 (associated with active transcription), H3K27me3 (linked to facultative gene repression), and H3K9me3 (connected to constitutive heterochromatin formation) [41] [21] [23]. These histone modifications function as integral components of a complex regulatory system that translates genetic information into specific phenotypic outcomes through precise spatiotemporal control of gene expression programs.
The relationship between histone modifications and gene expression is not merely correlative but often causal in establishing cellular identity and function. Disruptions in these epigenetic marks have been implicated in numerous disease states, including cancer, developmental disorders, and metabolic diseases, making them attractive targets for therapeutic intervention [41] [23]. This technical guide explores the mechanisms by which H3K4me3, H3K27me3, and H3K9me3 influence gene expression and ultimately contribute to phenotypic manifestations, with particular emphasis on experimental approaches for their study and analysis. By integrating recent research findings and methodological advances, we aim to provide researchers with a comprehensive framework for investigating these critical epigenetic regulators within the broader context of chromatin biology and disease pathogenesis.
Histone Modifications: Types and Functional Roles
Activating Mark: H3K4me3
Histone H3 lysine 4 trimethylation (H3K4me3) represents one of the most extensively characterized activation-associated histone modifications. This mark predominantly localizes to transcription start sites (TSS) of active genes and is recognized by multiple transcription factors and chromatin-modifying complexes that facilitate an open chromatin configuration conducive to transcription [41] [107]. The established paradigm positions H3K4me3 as a hallmark of actively transcribed genes, with its density at gene promoters frequently correlating with transcription levels [107]. Beyond this conventional role, emerging evidence suggests more nuanced functions for H3K4me3 in transcriptional regulation, including the identification of "broad H3K4me3" domains that extend beyond narrow promoter regions and appear to play specialized roles in maintaining robust transcription of developmentally critical genes [108].
Recent research has revealed that H3K4me3 operates within a complex regulatory network involving other epigenetic modifications. In breast cancer models, H3K4me3 patterns at miRNA promoters have been shown to predict miRNA expression levels, which subsequently influence mRNA expression through post-transcriptional regulation, establishing an intricate miRNA-mRNA regulatory axis governed by epigenetic mechanisms [41]. Similarly, during spermatogenesis, SETD1B-mediated broad H3K4me3 domains control proper temporal patterns of gene expression critical for spermatid development, demonstrating how this histone modification coordinates complex developmental processes [108]. These findings underscore the functional significance of H3K4me3 not only as a marker of active transcription but as an active participant in fine-tuning gene expression programs in both normal physiology and disease states.
Repressive Mark: H3K27me3
Histone H3 lysine 27 trimethylation (H3K27me3) constitutes a fundamental repressive histone modification deposited by the Polycomb Repressive Complex 2 (PRC2) [21] [23]. This mark is associated with facultative heterochromatin and serves to reversibly silence gene expression in a cell type-specific manner, particularly for genes involved in developmental processes, cell fate decisions, and differentiation [21] [23]. The distribution of H3K27me3 across the genome follows distinct enrichment profiles that correlate with specific regulatory consequences, including broad domains spanning gene bodies that correspond to strong repression, peaked enrichment at transcription start sites often associated with bivalent genes (co-occurring with H3K4me3), and surprisingly, promoter-proximal peaks that in certain contexts associate with active transcription [21].
A significant advancement in understanding H3K27me3 functionality emerged from the identification of H3K27me3-rich regions (MRRs), which function as silencer elements that repress gene expression through chromatin interactions [23]. These MRRs, characterized by clusters of H3K27me3 peaks, show preferential interactions with each other and with their target genes, effectively establishing repressive chromatin hubs that can act over considerable genomic distances. CRISPR-based excision of these MRR elements leads to upregulation of interacting genes, altered H3K27me3 and H3K27ac levels at interacting regions, and changes in chromatin interactions, confirming their functional role in long-range gene repression [23]. This silencing mechanism particularly affects tumor suppressor genes and developmental regulators, with MRR-associated genes being enriched in processes related to development and differentiation [23]. The discovery of MRRs provides a mechanistic framework for understanding how H3K27me3 contributes to the establishment and maintenance of cell identity and how its dysregulation might contribute to disease processes, particularly cancer.
Constitutive Repressive Mark: H3K9me3
Histone H3 lysine 9 trimethylation (H3K9me3) represents a hallmark of constitutive heterochromatin, which is typically associated with permanently silenced genomic regions such as telomeres, centromeres, and repetitive elements [109] [110]. In contrast to the more dynamic H3K27me3 mark, H3K9me3 establishes a relatively stable repressive chromatin state that is maintained through cell divisions and is less responsive to developmental cues [23]. This modification creates binding sites for heterochromatin protein 1 (HP1), which facilitates chromatin compaction and spreads the repressive signal along the chromatin fiber, effectively limiting DNA accessibility to transcriptional machinery [23].
Research across diverse biological systems has illuminated the critical functional roles of H3K9me3. In the whitefly Bemisia tabaci, H3K9me3 dynamics regulate mitochondrial function in ovaries through modulation of mitochondrial-related genes, ultimately influencing fertilization and offspring sex ratio [110]. This study demonstrated that symbiont-derived folate regulates H3K9me3 levels, establishing a direct link between metabolism and epigenetic regulation of reproductive outcomes. In mammalian systems, H3K9me3 works in concert with other repressive marks to maintain cellular identity, with dramatic reorganizations of H3K9me3 patterns observed during key developmental transitions, such as the shift from mitotic to meiotic phases in spermatogenesis [108]. These coordinated changes in H3K9me3 distribution contribute to the silencing of lineage-inappropriate genes and ensure proper execution of developmental programs, highlighting its crucial role in maintaining cellular homeostasis and function.
Table 1: Characteristics and Functions of Major Histone Modifications
| Histone Mark | Chromatin State | Genomic Distribution | Primary Functions | Enzyme Writers | Reader Domains |
|---|---|---|---|---|---|
| H3K4me3 | Euchromatin | Transcription start sites, promoters | Transcription activation, promoter recognition | SET1A/B, MLL1-4 | TAF3, PHD fingers |
| H3K27me3 | Facultative heterochromatin | Promoters, gene bodies, H3K27me3-rich regions | Gene silencing, developmental regulation | EZH1/2 (PRC2) | CBX proteins (PRC1) |
| H3K9me3 | Constitutive heterochromatin | Repetitive regions, telomeres, centromeres | Permanent silencing, genome stability | SUV39H1/2, SETDB1 | HP1 proteins |
Experimental Approaches: From Sample to Data
Chromatin Immunoprecipitation Sequencing (ChIP-seq)
Chromatin Immunoprecipitation followed by sequencing (ChIP-seq) represents the gold standard methodology for genome-wide mapping of histone modifications and transcription factor binding sites [41] [21]. The fundamental principle underlying ChIP-seq involves the selective immunoprecipitation of chromatin fragments using antibodies specific to particular histone modifications, followed by high-throughput sequencing of the associated DNA [41]. This approach generates comprehensive maps of histone mark distribution across the genome, enabling researchers to correlate epigenetic patterns with gene expression and phenotypic outcomes.
A robust ChIP-seq protocol begins with crosslinking cells using formaldehyde to preserve protein-DNA interactions, followed by chromatin fragmentation typically achieved through sonication or enzymatic digestion [41] [21]. The fragmented chromatin is then subjected to immunoprecipitation with modification-specific antibodies, such as anti-H3K4me3, anti-H3K27me3, or anti-H3K9me3 [41]. After reversing crosslinks and purifying the immunoprecipitated DNA, sequencing libraries are prepared and subjected to high-throughput sequencing [41] [21]. Critical quality control measures include checks for antibody specificity, fragment size distribution, and library complexity, with recommendations for sequencing depth varying based on the histone mark studied (e.g., 20-50 million reads for narrow marks like H3K4me3, potentially more for broad domains like H3K27me3) [41] [21].
Recent methodological advances have streamlined the ChIP-seq workflow and improved its accessibility. The development of automated platforms like H3NGST has addressed challenges related to manual processing complexity and technical barriers by integrating SRA data retrieval, FastQC quality control, BWA-MEM alignment, and HOMER peak calling into a unified pipeline [111]. These improvements enhance analysis efficiency and reproducibility, facilitating more robust investigations into histone modification landscapes [111]. For specialized applications, such as mapping broad H3K4me3 domains during spermatogenesis, modifications to standard protocols including increased sequencing depth and specialized peak-calling parameters may be necessary to capture the full extent of these epigenetic features [108].
Integrating ChIP-seq with Multi-Omics Data
While ChIP-seq provides invaluable information about histone modification landscapes, its full interpretive power emerges when integrated with complementary genomic datasets. RNA sequencing (RNA-seq) represents the most common pairing, enabling direct correlation between histone modification patterns and transcriptional outputs [41] [107]. This integrated approach has revealed that H3K4me3 density in promoters generally correlates with gene expression levels, though the relationship is not always linear and varies by biological context [107]. Additional layers of information can be incorporated through other epigenetic mapping techniques, including ATAC-seq for chromatin accessibility, methylC-seq for DNA methylation, and Hi-C for three-dimensional chromatin architecture [112] [23] [108].
The integration of multiple data types requires careful computational approaches to account for technical variations and biological specificity. For example, in breast cancer research, combined analysis of H3K4me3 ChIP-seq and RNA-seq data has identified specific miRNAs whose promoter methylation status predicts their expression, ultimately influencing mRNA targets through post-transcriptional regulation [41]. Similarly, in studies of chromatin silencing, the combination of H3K27me3 ChIP-seq with chromatin interaction data has revealed that H3K27me3-rich regions function as silencers that repress gene expression through long-range chromatin loops [23]. These multi-omics approaches significantly enhance our ability to derive mechanistic insights from epigenetic data and establish causal relationships between histone modifications and phenotypic outcomes.
Table 2: Key Analytical Tools for ChIP-seq Data Analysis
| Analysis Step | Software/Tool | Key Features | Applicable Histone Marks |
|---|---|---|---|
| Quality Control | FastQC | Quality metrics, sequence biases | All marks |
| Alignment | BWA-MEM | Optimized for ChIP-seq, handles multimapping | All marks |
| Peak Calling | MACS2 | Model-based analysis, narrow/broad peak detection | H3K4me3 (narrow), H3K27me3 (broad) |
| Peak Annotation | HOMER | Genomic region assignment, motif discovery | All marks |
| Differential Analysis | DESeq2 | Statistical rigor, normalization | All marks |
| Visualization | CEAS | ChIP enrichment annotation | All marks |
| IDR Analysis | IDR | Irreproducible discovery rate, replicate consistency | All marks |
Advanced Methodologies and Emerging Techniques
Beyond standard ChIP-seq protocols, several advanced methodologies offer enhanced capabilities for specific research applications. The NOMe-seq (Nucleosome Occupancy and Methylome sequencing) technique simultaneously maps nucleosome positioning and DNA methylation patterns from the same DNA molecule, providing complementary information about chromatin organization and its relationship to epigenetic modifications [113] [108]. This approach has proven particularly valuable for understanding how DNA methylation and nucleosome occupancy interact with histone modifications to establish transcriptional states during developmental processes such as spermatogenesis [108].
For investigating the functional consequences of specific histone modifications, CRISPR-based genome editing approaches enable targeted manipulation of epigenetic marks at precise genomic locations [23]. CRISPR excision of H3K27me3-rich regions has demonstrated their causal role in gene repression and has revealed how these elements influence chromatin architecture and cellular phenotypes [23]. Similarly, genetic perturbation of histone-modifying enzymes, such as SETD1B in the context of spermatogenesis, has elucidated the functional significance of specific methylation events in developmental processes [108]. These functional validation approaches move beyond correlation to establish causation, strengthening the link between histone modifications and phenotypic outcomes.
Emerging single-cell epigenomic technologies promise to further transform the field by enabling the characterization of histone modification patterns at cellular resolution. While not yet covered in the available literature, these approaches will undoubtedly reveal the cell-to-cell heterogeneity in epigenetic states that underlies phenotypic diversity in complex tissues and disease contexts.
Data Analysis and Interpretation
Peak Calling and Annotation
The computational analysis of ChIP-seq data begins with peak calling, a process that identifies genomic regions with significant enrichment of sequencing reads compared to background [41]. The choice of peak-calling algorithm and parameters must be tailored to the specific histone mark under investigation. For narrow marks like H3K4me3, algorithms such as MACS2 with narrow peak settings are appropriate, while broad marks like H3K27me3 require specialized approaches that can detect extended domains of enrichment [41] [21]. Following peak identification, genomic annotation assigns these regions to specific features such as promoters, enhancers, gene bodies, or intergenic regions, providing biological context for subsequent analyses [41].
The concept of peak calling has evolved to accommodate complex histone modification patterns, including the recently described "broad H3K4me3" domains that extend over large genomic regions [108]. These broad domains, identified during spermatogenesis, challenge the traditional view of H3K4me3 as a focused promoter-associated mark and require specialized analytical approaches for accurate detection and quantification [108]. Similarly, the identification of H3K27me3-rich regions (MRRs) through clustering of H3K27me3 peaks has revealed functional silencer elements that operate through chromatin looping, demonstrating how analytical refinements can uncover novel regulatory mechanisms [23].
Quality assessment represents a critical component of ChIP-seq analysis, with metrics including FRiP (Fraction of Reads in Peaks) scores, peak reproducibility between replicates, and cross-correlation analyses evaluating the quality of the dataset [41]. Tools such as IDR (Irreproducible Discovery Rate) provide statistical frameworks for assessing consistency between biological replicates, ensuring that only high-confidence peaks are considered in downstream analyses [41]. These rigorous analytical standards are essential for generating biologically meaningful data that accurately reflects the underlying epigenetic landscape.
Integrating Histone Modification Data with Gene Expression
The correlation between histone modifications and gene expression represents a central focus of epigenetic research, with integrated analysis of ChIP-seq and RNA-seq data serving as the primary methodological approach [41] [107]. This integration can take multiple forms, from quantitative assessments relating mark density to expression levels to categorical analyses comparing expression between genes with and without specific modifications [107]. Studies in multiple systems, including murine prefrontal cortex and breast cancer cell lines, have demonstrated that H3K4me3 density at promoters generally correlates with transcriptional activity, though the strength of this correlation varies by biological context and can be influenced by additional factors such as the presence of other histone modifications [41] [107].
Beyond simple correlation, advanced analytical approaches examine how combinations of histone marks influence gene expression. Bivalent domains, characterized by the simultaneous presence of H3K4me3 and H3K27me3 at promoter regions, maintain genes in a transcriptionally poised state that can be rapidly activated or silenced in response to developmental cues [21] [108]. The dynamic reorganization of these bivalent domains during cellular differentiation underscores the complex interplay between activating and repressive marks in fine-tuning gene expression programs [108]. Similarly, the relationship between H3K9me3 and gene expression reveals context-dependent effects, with this mark typically associated with strong repression but occasionally co-occurring with transcribed genes in certain biological settings [110].
Machine learning approaches have increasingly been applied to predict gene expression from histone modification patterns, with models incorporating multiple marks generally outperforming those based on single modifications. These computational methods highlight the combinatorial nature of epigenetic regulation and demonstrate how integrated analysis of multiple histone marks provides more accurate insights into transcriptional states than examination of individual marks in isolation.
From Correlation to Causation: Establishing Functional Relationships
While correlative relationships between histone modifications and gene expression provide valuable insights, establishing causal relationships requires complementary experimental approaches. Genetic perturbation of histone-modifying enzymes represents a powerful strategy for directly testing the functional consequences of specific methylation events [108]. For example, germ cell-specific knockout of Setd1b in mice disrupts broad H3K4me3 domains and leads to aberrant gene expression and spermatid developmental defects, directly demonstrating the functional significance of this modification in a developmental context [108].
CRISPR-based genome editing approaches enable even more precise manipulation of epigenetic regulatory elements [23]. Excision of specific H3K27me3-rich regions has been shown to cause upregulation of interacting genes, alterations in H3K27me3 and H3K27ac levels at interacting regions, and changes in chromatin interactions, providing direct evidence for their role as silencer elements [23]. These functional perturbations not only establish causality but also reveal the mechanistic basis by which histone modifications influence gene expression, such as through changes in chromatin architecture or accessibility.
Pharmacological inhibition of histone-modifying enzymes offers an additional approach for establishing functional relationships, particularly with therapeutic applications in mind. EZH2 inhibition, for instance, leads to changes in chromatin interactions and histone modifications at H3K27me3-rich regions, accompanied by upregulation of associated genes [23]. These chemical genetic approaches complement molecular manipulations and provide insights into the therapeutic potential of targeting histone modification pathways in disease contexts.
Diagram 1: Relationship between histone modifications and phenotypic outcomes. This flowchart illustrates how different histone marks influence chromatin state, which in turn affects transcription factor binding, polymerase recruitment, and gene expression, ultimately contributing to cellular phenotypes and disease outcomes. Feedback mechanisms maintain epigenetic states and fine-tune gene expression programs.
Case Studies: Histone Modifications in Biological Context
Breast Cancer Subtype Regulation
Comprehensive analysis of H3K4me3 patterns in breast cancer has revealed subtype-specific epigenetic regulation that contributes to disease pathogenesis and progression [41]. By comparing H3K4me3 ChIP-seq data from normal-like (MCF10A), luminal-A (MCF7, ZR751), and triple-negative breast cancer (MB231, MB436) cell lines, researchers identified distinct miRNA expression patterns regulated by promoter H3K4me3 status [41]. These epigenetic differences translated into specific mRNA expression profiles through miRNA-mRNA interactions, establishing an epigenetic-regulated post-transcriptional network that distinguishes breast cancer subtypes.
Notably, this integrated approach identified five triple-negative breast cancer-specific miRNAs (miR153-1, miR4767, miR4487, miR6720, and miR-LET7I) with corresponding 13 gene targets that may contribute to the aggressive phenotype associated with this breast cancer subtype [41]. Additionally, eight miRNA promoter peaks showed differential H3K4me3 enrichment in at least three breast cancer cell lines, with 44 corresponding gene targets identified through complementary RNA-seq analysis [41]. These findings demonstrate how histone modification patterns not only correlate with but potentially drive the molecular heterogeneity observed in breast cancer subtypes, offering insights into subtype-specific regulatory mechanisms and potential therapeutic targets.
Cellular Differentiation and Development
Histone modifications play fundamental roles in orchestrating developmental processes, as exemplified by their dynamic regulation during spermatogenesis [108]. Comprehensive epigenomic mapping across eleven distinct stages of mouse spermatogenesis revealed coordinated changes in multiple histone modifications, including the reorganization of repressive marks during key developmental transitions [108]. Specifically, researchers observed two major reorganizations of heterochromatin marks: first during the transition from B-type spermatogonia to zygotene spermatocytes, where H3K9me2 significantly increased to silence mitotic genes, and second during the mid-pachytene stage, where H3K9me2/3 decreased while H3K27me3 was re-established to repress meiotic genes and activate spermatid-specific genes [108].
A particularly significant finding from this work was the identification of SETD1B-mediated broad H3K4me3 domains in round spermatids that control proper temporal patterns of gene expression critical for spermatid development [108]. These broad domains, which overlap with H3K27ac-marked enhancers and promoters, compete with canonical H3K4me3 for transcription machinery recruitment, thereby maintaining precise transcriptional timing and strength during the elaborate process of spermatid differentiation [108]. Disruption of this SETD1B-RFX2 regulatory axis led to aberrant gene expression patterns and impaired spermatogenesis, directly demonstrating the functional importance of these specialized epigenetic features in developmental processes [108].
Metabolic Regulation of Epigenetics
The relationship between cellular metabolism and epigenetic regulation is exemplified by research on the whitefly Bemisia tabaci, where the bacterial symbiont Hamiltonella was found to influence host sex ratio through modulation of H3K9me3 levels [110]. In this system, Hamiltonella-derived folate serves as a methyl donor for histone methylation, directly linking metabolic activity to epigenetic regulation [110]. Hamiltonella elimination led to significantly altered H3K9me3 levels, with ChIP-seq analysis revealing changes in H3K9me3 peaks associated with mitochondrial function genes [110].
This metabolic-epigenetic connection had direct phenotypic consequences, as Hamiltonella deficiency impaired mitochondrial function in ovaries, ultimately affecting fertilization and offspring sex ratio [110]. Crucially, folate supplementation restored both H3K9me3 levels and mitochondrial function, demonstrating the reversibility of this metabolic-epigenetic-phenotypic axis [110]. This case study highlights how extrinsic factors, including microbial symbionts and nutritional status, can influence epigenetic regulation and ultimately determine phenotypic outcomes through modulation of specific histone modifications.
Table 3: Experimental Evidence Linking Histone Modifications to Phenotypic Outcomes
| Biological Context | Histone Mark | Experimental Approach | Key Findings | Phenotypic Outcome |
|---|---|---|---|---|
| Breast Cancer Subtypes | H3K4me3 | ChIP-seq, RNA-seq in cell lines | Subtype-specific miRNA regulation | TNBC-specific gene expression patterns [41] |
| Spermatogenesis | Broad H3K4me3, H3K27me3, H3K9me2/3 | Multi-stage ChIP-seq, knockout models | SETD1B-mediated broad H3K4me3 controls temporal gene expression | Impaired spermatid development upon disruption [108] |
| Whitefly Sex Determination | H3K9me3 | ChIP-seq, symbiont manipulation | Symbiont-derived folate regulates H3K9me3 on mitochondrial genes | Altered offspring sex ratio [110] |
| Gene Silencing Mechanisms | H3K27me3-rich regions | CRISPR excision, ChIP-seq, Hi-C | MRRs function as silencers via chromatin looping | Changes in cell identity, tumor growth [23] |
Core Reagents for Histone Modification Studies
The investigation of histone modifications and their functional roles requires a collection of specialized reagents and resources. High-quality antibodies specific to each histone modification represent the most critical component, as antibody specificity directly determines the reliability of ChIP-seq results [41] [21]. These antibodies must be rigorously validated for specificity and efficiency through methods such as peptide competition assays, Western blotting, and use of positive and negative control cell lines [41]. For H3K4me3, H3K27me3, and H3K9me3, commercial antibodies from multiple suppliers are available, but batch-to-batch variability necessitates careful quality assessment for each new lot.
Cell line models with well-characterized epigenetic profiles serve as valuable experimental systems for investigating histone modification dynamics [41]. In breast cancer research, the use of normal-like (MCF10A), luminal-A (MCF7, ZR751), and triple-negative (MB231, MB436) cell lines has enabled comparative analysis of subtype-specific epigenetic regulation [41]. Similarly, primary cell cultures and animal models, such as the genetically modified mice used in spermatogenesis studies, provide more physiologically relevant contexts for examining histone modifications in developmental processes [108]. The choice of experimental model should align with the specific research questions being addressed, with consideration given to both biological relevance and practical experimental constraints.
The analysis and interpretation of histone modification data rely heavily on computational tools and genomic resources. The ENCODE (Encyclopedia of DNA Elements) and Roadmap Epigenomics projects provide comprehensive reference epigenomes for diverse cell types and tissues, enabling comparative analyses and validation of experimental findings [41] [21]. These resources offer processed ChIP-seq data for multiple histone marks across numerous biological contexts, serving as valuable benchmarks for experimental data.
Specialized software tools have been developed to address the specific analytical challenges associated with different types of histone modifications [41] [21] [111]. The H3NGST platform represents an integrated solution for ChIP-seq analysis, automating the entire workflow from data retrieval to peak annotation and thereby enhancing reproducibility and accessibility for researchers with limited bioinformatics expertise [111]. For more specialized analyses, such as the identification of broad histone modification domains or H3K27me3-rich regions, custom analytical approaches may be necessary to capture these features effectively [23] [108]. The continued development of user-friendly computational tools will be essential for maximizing the research utility of histone modification data.
Diagram 2: ChIP-seq experimental and computational workflow. This flowchart outlines the key steps in ChIP-seq analysis, from sample preparation through sequencing and computational analysis, highlighting quality control checkpoints and multi-omics integration opportunities.
The investigation of histone modifications represents a rapidly advancing field that continues to yield insights into the fundamental mechanisms of gene regulation and their relationships to phenotypic outcomes. The established correlations between H3K4me3, H3K27me3, and H3K9me3 with specific transcriptional states provide a foundation for understanding how epigenetic information is encoded and interpreted within the genome. However, recent research has revealed unexpected complexity in these relationships, including the existence of broad H3K4me3 domains with specialized regulatory functions [108] and H3K27me3-rich regions that act as silencers through chromatin looping [23]. These findings challenge simplified models of histone modification function and highlight the context-dependent nature of epigenetic regulation.
Looking forward, several emerging trends promise to further transform our understanding of histone modifications and their functional roles. Single-cell epigenomic technologies will enable the characterization of histone modification patterns at cellular resolution, revealing the heterogeneity within complex tissues and disease states. The integration of multi-omics datasets across spatial and temporal dimensions will provide increasingly comprehensive views of how epigenetic information flows through biological systems to influence phenotype. Additionally, the development of more precise epigenetic editing tools will facilitate causal testing of specific histone modifications and their functional consequences in diverse biological contexts.
From a translational perspective, the growing recognition of histone modification dysregulation in disease states, particularly cancer, has stimulated interest in therapeutic targeting of epigenetic pathways. The demonstration that H3K27me3-rich regions influence tumor growth [23] and that broad H3K4me3 domains are essential for proper development [108] highlights the therapeutic potential of manipulating these epigenetic features. As our understanding of histone modification biology continues to deepen, so too will opportunities for translating these insights into novel diagnostic and therapeutic approaches for human disease.
Leveraging Public Databases and Tools for Benchmarking and Reproducibility
The explosion of chromatin immunoprecipitation followed by sequencing (ChIP-seq) data has revolutionized epigenomic research, particularly for histone modifications such as H3K4me3, H3K27me3, and H3K9me3. Ensuring the benchmarking and reproducibility of ChIP-seq analyses requires robust computational frameworks that leverage public databases and standardized tools. This technical guide provides a comprehensive overview of current resources and methodologies for analyzing these key histone marks, with a focus on reproducible workflow implementation, performance benchmarking of computational tools, and integration of diverse data sources. We present standardized experimental protocols, quantitative comparisons of analysis tools, and visualization strategies to enhance the reliability and interpretability of epigenomic studies, framed within the broader context of establishing rigorous standards for ChIP-seq research in academic and drug development settings.
Histone modifications serve as critical epigenetic markers that regulate gene expression by altering chromatin structure. H3K4me3 is predominantly associated with active promoters, marking genes poised for transcription. In contrast, H3K27me3 is linked to facultative heterochromatin and transcriptional repression, particularly in developmental gene regulation. H3K9me3 represents constitutive heterochromatin involved in long-term gene silencing. The distinct genomic distributions and functions of these marks present unique challenges for ChIP-seq analysis, as they produce different peak profiles requiring specialized computational approaches. H3K4me3 typically produces sharp, well-defined peaks at transcription start sites, whereas H3K27me3 and H3K9me3 form broad domains that can span large genomic regions [114].
Analyzing these histone marks necessitates different bioinformatic strategies, particularly for peak calling and differential analysis. The benchmarking of computational tools must account for these distinct peak characteristics to ensure accurate identification and quantification. Furthermore, the integration of data from public repositories demands careful consideration of experimental protocols, sequencing depth, and normalization methods to enable valid cross-study comparisons. This guide addresses these challenges by providing a structured framework for leveraging public resources while maintaining rigorous analytical standards.
Public Data Repositories for Histone Modification Analysis
Curated ChIP-seq Databases
Public data repositories host an extensive collection of histone modification datasets that serve as invaluable resources for benchmarking analytical methods and contextualizing new findings. These databases provide uniformly processed data that facilitate reproducible epigenomic research.
Table 1: Major Public Data Repositories for Histone Modification ChIP-seq Data
| Repository Name | Data Content | Key Features | Utility for Benchmarking |
|---|---|---|---|
| ChIP-Atlas [115] | 433,000+ ChIP-seq, ATAC-seq, and Bisulfite-seq experiments | Fully integrated epigenomic landscapes with peak browser and differential analysis tools | Enables cross-sample comparison and differential peak detection across multiple cell types and conditions |
| European Genome-Phenome Archive (EGA) [116] | ChIP-seq data for H3K4me3, H3K27ac, and H3K27me3 across 13 human embryonic tissues | Tissue-specific histone modification patterns during organogenesis | Provides reference data for developmental studies and tissue-specific epigenetic regulation |
| GEO Accession Viewer [117] | ChIP-seq sequencing of interactors of H3K4me3, H3K36me3, and H3K9me3 | Includes histone modification profiles in HeLa cells with replicates | Offers controlled datasets for method validation and comparison |
| Mass Genome Annotation (MGA) [118] | Hundreds of publicly available ChIP-seq datasets with unified processing | Fast full-text search and data export in multiple formats | Facilitates rapid access to standardized datasets for pipeline testing |
These repositories provide essential foundational data for constructing benchmarking sets. For example, the ChIP-Atlas suite has recently enhanced its capabilities with differential analysis tools that enable detection of differential peaks or differentially methylated regions [115]. Similarly, the specialized collection of human embryonic tissues in the EGA offers unique insights into tissue-specific epigenetic regulation during development [116]. When building reference datasets for benchmarking, researchers should select samples that represent the diversity of peak profiles expected in experimental data, including both sharp transcription factor binding sites and broad histone modification domains.
Constructing Benchmark Sets
Creating effective benchmark sets requires careful selection of datasets that represent realistic biological scenarios. Standardized reference datasets can be generated through in silico simulation or sub-sampling of genuine ChIP-seq data to model different biological scenarios and binding profiles [114]. For histone mark analysis, it is essential to include data representing:
- Sharp marks: H3K4me3 and H3K27ac with defined peak regions of up to a few kilobases
- Broad marks: H3K27me3 and H3K9me3 spreading over large genomic regions of several hundred kilobases
- Multiple biological conditions: Both balanced (50:50) regulation scenarios and global decrease (100:0) scenarios that mimic knockout or inhibition experiments
Benchmarking efforts should incorporate data from multiple repositories to ensure comprehensive coverage of epigenetic states and experimental conditions. The integration of data from different sources must account for batch effects and platform-specific biases through appropriate normalization procedures.
Standardized Workflows for ChIP-seq Analysis
End-to-End Analysis Pipelines
Reproducible ChIP-seq analysis requires standardized workflows that encapsulate best practices from quality control through advanced interpretation. Several community-vetted pipelines provide robust solutions for consistent data processing.
The nf-core/chipseq [119] pipeline represents a comprehensive, containerized solution for ChIP-seq analysis that includes peak-calling, quality control, and differential binding analysis. Built using Nextflow, it ensures portability across computing environments and reproducible results through Docker/Singularity containers. The pipeline processes transcription factors and histone marks with appropriate peak-calling strategies for each data type and generates comprehensive quality reports through MultiQC. It automatically creates IGV session files containing bigWig tracks, peaks, and differential sites for streamlined data visualization [119].
The ChIP-Seq Web Server [118] offers an accessible alternative for researchers without advanced computational infrastructure. Its toolkit includes ChIP-Cor for aggregation plots, ChIP-Peak for narrow peak detection, ChIP-Part for broad region identification, and ChIP-Track for visualization file generation. This resource is particularly valuable for preliminary analyses and educational purposes, though it may lack the scalability of command-line solutions for large-scale datasets.
Table 2: Standardized Workflows for ChIP-seq Analysis
| Workflow Name | Implementation | Key Features | Supported Analyses |
|---|---|---|---|
| nf-core/chipseq [119] | Nextflow with Docker/Singularity containers | Automated CI/CD testing on full-sized datasets, sensible resource allocation | Peak-calling, QC, differential binding, IGV session creation |
| ChIP-Seq Web Server [118] | Web-based tools | Accessible interface, multiple input formats, integration with MGA database | Peak calling, correlation plots, genome partitioning, track generation |
| SeqCode [49] | Portable ANSI C with web frontend | Efficient graphical analysis, standardized nomenclature for representations | Occupancy plots, density heatmaps, read counts, peak annotation |
Visual Analysis and Interpretation
Beyond primary analysis, effective visualization is essential for interpreting ChIP-seq results and generating biological insights. SeqCode [49] provides a specialized suite for graphical data mining that produces publication-quality representations from processed data. Its functions include:
- buildChIPprofile: Generates genome-wide distributions in BedGraph format for visualization in genome browsers
- produceTSSplots: Creates average occupancy profiles around transcription start sites
- produceTSSmaps: Generates density heatmaps showing signal strength patterns
- genomeDistribution: Classifies peaks into genomic features and produces annotation charts
These visualization approaches help researchers identify patterns specific to different histone modifications, such as the promoter-focused distribution of H3K4me3 versus the broad genomic domains of H3K27me3 and H3K9me3. The standardized outputs facilitate comparisons across studies and experimental conditions.
Diagram 1: Integrated ChIP-seq analysis workflow showing the interplay between standard processing steps (green) and reproducibility-enhancing activities (red). The workflow demonstrates how public data integration and method benchmarking inform multiple analytical stages.
Benchmarking Differential ChIP-seq Analysis Tools
Performance Evaluation Across Scenarios
Differential ChIP-seq analysis presents distinct challenges compared to other sequencing applications, as tools must accommodate different peak characteristics and biological scenarios. A comprehensive evaluation of 33 computational tools [114] revealed that performance is strongly dependent on peak size, shape, and the specific biological regulation scenario being investigated.
For the histone marks central to this guide, benchmarking results indicate that:
- H3K4me3 (sharp mark): Tools like MACS2 and NarrowPeaks demonstrate high accuracy in balanced regulation scenarios
- H3K27me3 (broad mark): SICER2 and other broad peak callers outperform narrow peak-focused tools, particularly in global decrease scenarios
- H3K9me3 (broad mark): Similar to H3K27me3, broad peak callers with appropriate normalization methods are essential for accurate detection
The benchmarking study established two primary biological scenarios for evaluation: balanced changes (50:50 ratio of increasing to decreasing signals) representative of physiological comparisons, and global decrease scenarios (100:0 ratio) typical of knockout or inhibition experiments [114]. These scenarios help researchers select appropriate tools based on their experimental context.
Table 3: Performance Characteristics of Differential ChIP-seq Tools for Histone Marks
| Tool Category | Best For | H3K4me3 Performance | H3K27me3/H3K9me3 Performance | Key Considerations |
|---|---|---|---|---|
| Peak-dependent tools | Sharp marks, balanced scenarios | High AUPRC with simulated and real data | Moderate AUPRC, struggles with broad domains | Require external peak calling (MACS2, SICER2, JAMM) |
| Peak-independent tools | Broad marks, global changes | Good AUPRC, robust to noise | High AUPRC, handles large domains well | Internal peak calling, better with sub-sampled data |
| Custom approaches | Specific experimental designs | Variable performance | Variable performance | Can be optimized for particular scenarios |
Tool Selection Guidelines
Based on comprehensive benchmarking studies [114], tool selection should be guided by the specific characteristics of the histone mark being investigated and the biological question being addressed. The area under the precision-recall curve (AUPRC) serves as a reliable metric for evaluating tool performance across different scenarios.
For H3K4me3 analysis, peak-dependent tools like MACS2 generally provide excellent results, particularly when using default or recommended parameters for sharp marks. These tools effectively capture the well-defined promoter-associated peaks characteristic of this mark. For H3K27me3 and H3K9me3, peak-independent tools or those specifically designed for broad domains (e.g., SICER2) demonstrate superior performance, as they can accurately identify the large genomic regions marked by these repressive modifications.
Normalization methods must be carefully considered, particularly for global change scenarios. Tools initially developed for RNA-seq analysis may assume that most genomic regions do not change between conditions, an assumption that fails when histone modifications are globally altered through inhibition or protein depletion. In such cases, specialized differential ChIP-seq tools with appropriate normalization strategies are essential.
Experimental Protocols for Reproducible Analysis
Standardized Processing Workflow
Reproducible ChIP-seq analysis requires meticulous attention to each processing step, from raw data quality control to final interpretation. The following protocol outlines a standardized approach suitable for H3K4me3, H3K27me3, and H3K9me3 data:
Quality Assessment: Evaluate raw read quality using FastQC or similar tools, checking for base quality scores, GC content, adapter contamination, and sequence duplication levels. Low-quality bases should be trimmed, and adapter sequences removed.
Read Alignment: Map reads to an appropriate reference genome using optimized aligners such as BWA or Bowtie2. For histone marks, allow for relatively multimapping reads compared to transcription factor analysis, while maintaining mapping quality filters.
Peak Calling: Apply mark-specific peak calling strategies:
- H3K4me3: Use MACS2 with narrow peak parameters (--broad flag not set)
- H3K27me3/H3K9me3: Use broad peak callers like SICER2 or MACS2 with --broad flag enabled
- For all marks, include appropriate control samples (input DNA) to account for technical artifacts and sequencing biases
Differential Analysis: Select tools based on the mark characteristics and biological scenario, following the guidelines in Section 4. Include multiple replicates per condition to enhance statistical power and reliability.
Visualization and Interpretation: Generate genome browser tracks, aggregate plots, and heatmaps using tools like SeqCode [49] or IGV. Annotate peaks with genomic features and integrate with complementary data types such as RNA-seq for functional interpretation.
Quality Control Metrics
Comprehensive quality control is essential for reproducible ChIP-seq analysis. Key metrics should be monitored throughout the processing workflow:
- Sequencing depth: Minimum of 20-30 million reads per sample for histone marks, with increased depth for complex genomes or heterogeneous samples
- Library complexity: Assessed using non-redundant fraction metrics, with higher values indicating better quality libraries
- Fraction of reads in peaks (FRiP): H3K4me3 typically shows higher FRiP scores (5-10%) than broad marks (10-20%) due to more focused distributions
- Cross-correlation analysis: Calculate strand cross-correlation to assess enrichment, with strong enrichments at the fragment length indicating successful immunoprecipitation
These metrics should be documented for each dataset and considered when comparing results across studies or integrating public data.
Diagram 2: ChIP-seq analysis protocol showing key stages from data input to reproducible output. The diagram highlights how mark-specific tools and public databases enhance different analytical stages.
Table 4: Essential Research Reagent Solutions for ChIP-seq Analysis
| Resource Category | Specific Tools/Resources | Function | Application Context |
|---|---|---|---|
| Peak Calling Software | MACS2 [114], SICER2 [114], FindPeaks [120] | Identify statistically significant enriched regions from aligned reads | MACS2 for sharp marks (H3K4me3); SICER2 for broad marks (H3K27me3, H3K9me3) |
| Differential Analysis Tools | 33 tools benchmarked [114] including csaw, DiffBind, narrowPeaks | Identify changes in histone modification between conditions | Selection depends on mark type and biological scenario (balanced vs. global change) |
| Workflow Management Systems | nf-core/chipseq [119] | Containerized, reproducible pipeline execution | Standardized processing from raw reads to results across computing environments |
| Visualization Platforms | SeqCode [49], IGV, ChIP-Atlas Peak Browser [115] | Graphical data mining and interpretation | SeqCode for publication-quality plots; IGV for genome browsing; ChIP-Atlas for public data exploration |
| Public Data Repositories | ChIP-Atlas [115], EGA [116], GEO [117] | Reference datasets for benchmarking and contextualization | Method validation, normalisation control, biological context interpretation |
| Quality Control Tools | FastQC, MultiQC [119] | Assess data quality throughout processing pipeline | Identify technical issues, confirm library complexity, ensure sufficient sequencing depth |
| Benchmarking Datasets | Manually curated benchmarks [120], simulated data [114] | Tool performance evaluation | Creating standardized test sets with known true and false positive peaks |
This toolkit provides the essential components for establishing a reproducible ChIP-seq analysis pipeline. When selecting resources, researchers should prioritize tools with active development communities, comprehensive documentation, and compatibility with existing computational infrastructure. The integration of multiple tools into coordinated workflows, such as those enabled by nf-core/chipseq, enhances reproducibility and reduces analytical variability.
The landscape of public databases and analytical tools for ChIP-seq research has matured significantly, enabling robust benchmarking and reproducible analysis of histone modifications including H3K4me3, H3K27me3, and H3K9me3. By leveraging standardized workflows, performance-validated tools, and comprehensive data repositories, researchers can enhance the reliability and interpretability of their epigenomic studies. The continued development of integrated platforms like ChIP-Atlas and nf-core/chipseq promises to further lower barriers to reproducible analysis while maintaining high analytical standards. As single-cell epigenomic methods advance and multi-omic integration becomes increasingly routine, the principles and practices outlined in this guide will provide a solid foundation for rigorous, reproducible chromatin biology in both basic research and drug development contexts.
The study of epigenetics has been revolutionized by the ability to profile histone modifications at single-cell resolution, revealing unprecedented cellular heterogeneity within tissues. Single-cell chromatin immunoprecipitation followed by sequencing (scChIP-seq) enables researchers to map the distribution of key histone marks—including H3K4me3 (associated with active promoters), H3K27me3 (associated with Polycomb repression), and H3K9me3 (associated with heterochromatin)—across individual cells [121]. However, a significant limitation of these approaches has been the loss of spatial context due to tissue dissociation procedures. The emerging integration of single-cell epigenomics with spatial transcriptomics represents a paradigm shift, allowing scientists to preserve and analyze epigenetic information within its native tissue architecture [122]. This technical guide explores the cutting-edge methodologies, computational tools, and applications driving this integrated approach, with particular focus on its relevance for drug development and therapeutic discovery.
The significance of this integration is particularly evident when studying complex biological systems such as tumor microenvironments, developmental biology, and neurological disorders. For instance, recent studies have demonstrated that chromatin landscapes vary not only between cell types but also within apparently homogeneous populations, suggesting previously unappreciated layers of regulatory complexity [123]. When these epigenetic patterns are mapped within their spatial context, researchers can begin to decipher how cellular neighborhoods influence gene regulation and cell fate decisions. This whitepaper provides an in-depth technical examination of the tools and methods enabling this powerful multidimensional analysis.
Technological Foundations: From Bulk to Single-Cell to Spatial Assays
Evolution of Epigenomic Profiling Technologies
Traditional bulk ChIP-seq approaches have provided comprehensive maps of histone modifications across cell populations but obscure cell-to-cell variation [121]. The recent development of single-cell epigenomic technologies has addressed this limitation through innovative adaptations that fall into two primary categories: ligation-based methods (e.g., scChIP-seq) and enzymatic cleavage-based methods (e.g., scChIC-seq, scCUT&Tag) [124] [125]. These techniques have revealed remarkable heterogeneity in histone modification patterns that correlate with cellular identity and functional states.
More recently, the field has witnessed the development of sophisticated multi-omic approaches that simultaneously capture multiple layers of epigenetic information. The scEpi2-seq method, for example, achieves joint readout of histone modifications and DNA methylation in single cells by leveraging TET-assisted pyridine borane sequencing (TAPS) [126]. This represents a significant advancement because DNA methylation and histone modifications interact in several ways, such as recruitment of DNMTs to H3K36me3 or binding of H3K9me3 by UHRF1, and were previously challenging to study in concert at single-cell resolution.
Table 1: Key Single-Cell Epigenomic Profiling Technologies
| Technology | Principle | Histone Marks Profiled | Cell Throughput | Key Advantages |
|---|---|---|---|---|
| scChIP-seq [123] | Chromatin immunoprecipitation with barcoding | H3K27me3, H3K4me3 | ~3,000-10,000 cells | Compatible with many existing ChIP antibodies |
| scCUT&Tag [123] | Antibody-guided tethering of Tn5 transposase | H3K27me3, H3K4me3, H3K9me3 | ~5,000-10,000 cells | Higher signal-to-noise ratio; lower input requirement |
| iscChIC-seq [124] | Indexing single-cell immunocleavage sequencing | H3K4me3, H3K27me3 | >10,000 cells | High cell throughput with minimal handling |
| sortChIC [125] | Fluorescence-activated cell sorting combined with immunocleavage | H3K4me3, H3K27me3, H3K9me3 | Hundreds to thousands | Enables profiling of rare cell populations |
| scEpi2-seq [126] | Combined immunocleavage with TAPS sequencing | H3K9me3, H3K27me3, H3K36me3 + DNA methylation | ~1,700-2,600 cells | Multi-omic readout from same single cell |
Spatial Transcriptomic Technologies for Integration
Spatial transcriptomics (ST) encompasses a range of technologies that preserve spatial information while capturing transcriptomic data. These can be broadly classified into image-based approaches (e.g., MERFISH, seqFISH) that use in situ hybridization, and barcode-based approaches (e.g., 10X Visium) that utilize spatially indexed oligonucleotide arrays [127]. While these methods initially focused on transcriptomics, they provide the spatial framework upon which single-cell epigenomic data can be mapped computationally.
The resolution of spatial transcriptomics technologies has been steadily improving, with some platforms now achieving subcellular resolution. However, most commercially available platforms still capture spots containing multiple cells, creating a computational challenge for precise integration with single-cell epigenomic data. Innovative computational methods like SIMO (Spatial Integration of Multi-Omics) have been developed specifically to address this challenge by using probabilistic alignment to map single-cell data onto spatial coordinates [122].
Integrated Methodologies: Bridging Single-Cell Epigenomics with Spatial Context
Computational Integration Strategies
The integration of single-cell epigenomic data with spatial transcriptomics relies on sophisticated computational approaches that can align datasets across modalities. SIMO (Spatial Integration of Multi-Omics) represents a state-of-the-art method that uses a sequential mapping process [122]. Initially, SIMO integrates spatial transcriptomics (ST) with single-cell RNA sequencing (scRNA-seq) data based on their shared transcriptomic modality. This establishes a foundational spatial framework. Subsequently, SIMO integrates non-transcriptomic single-cell data, such as scATAC-seq or scChIP-seq data, by using gene activity scores as a bridge between chromatin and transcriptomic modalities.
The algorithm employs Unbalanced Optimal Transport (UOT) for label transfer between modalities and Gromov-Wasserstein (GW) transport calculations to determine alignment probabilities between cells across different modal datasets [122]. Benchmarking tests on simulated datasets with complex spatial patterns have demonstrated that SIMO can accurately recover spatial positions for >91% of cells in simple patterns and >73% in complex patterns even under significant noise conditions (δ = 5) [122].
Spatial Integration Workflow for Single-Cell Epigenomic Data
Analytical Frameworks for Integrated Data
Once integrated, the resulting spatial epigenomic datasets require specialized analytical frameworks. ChromSCape is a user-friendly interactive Shiny/R application specifically designed for analyzing single-cell epigenomic data, including histone modifications and chromatin accessibility [123]. It processes these sparse datasets to identify subpopulations with common epigenomic features, find differentially enriched regions between subpopulations, and interpret epigenomes by linking regions to associated genes and pathways.
For the analysis of histone modification patterns, ChromSCape has demonstrated excellent performance in identifying cell identities from scChIP-seq data, with an Adjusted Rand Index (ARI) of 0.998 when classifying four distinct cell types [123]. The tool includes functionality for batch effect correction using the fastMNN method, which is crucial for integrating data from different experimental batches or technologies without overcorrecting biological differences.
Experimental Protocols for Spatial Epigenomics
sortChIC Protocol for Histone Modification Profiling
The sortChIC (sort-assisted single-cell chromatin immunocleavage) method combines single-cell histone modification profiling with fluorescence-activated cell sorting (FACS), enabling the study of rare cell populations [125]. The protocol involves the following key steps:
Cell Preparation and Staining: Cells are first stained with surface antigens for cell type recognition and fixed in ethanol. Fixed cells are then incubated with primary antibodies specific to the histone modification of interest (e.g., H3K4me3, H3K27me3, or H3K9me3).
Antibody-guided Cleavage: A protein A-micrococcal nuclease (pA-MN) fusion protein is added, which binds to the histone-bound antibody at specific genomic regions where the modification is present.
Cell Sorting: Single cells in G1 phase of the cell cycle are sorted based on Hoechst staining into 384-well plates using FACS. This step enables enrichment of rare cell populations.
MNase Digestion and Library Preparation: MNase digestion is initiated by adding calcium, allowing MNase to digest antibody-proximal internucleosomal DNA regions. The resulting fragments are ligated to adapters containing a unique molecular identifier (UMI) and cell-specific barcode.
Amplification and Sequencing: Genomic fragments are amplified by in vitro transcription and PCR, then sequenced using Illumina platforms.
Application of sortChIC to mouse bone marrow has revealed that during hematopoiesis, hematopoietic stem and progenitor cells (HSPCs) acquire active chromatin states mediated by cell-type-specifying transcription factors that are unique for each lineage, while most alterations in repressive marks occur independent of the final cell type [125].
scEpi2-seq for Multi-omic Profiling
The scEpi2-seq protocol enables simultaneous detection of histone modifications and DNA methylation in single cells [126]. This method is particularly valuable for studying epigenetic interactions during cell type specification:
Cell Isolation and Permeabilization: Single cells are isolated and permeabilized to allow antibody access.
Antibody Binding and Cleavage: Similar to sortChIC, a pA-MNase fusion protein is tethered to specific histone modifications using antibodies, followed by MNase digestion initiated by Ca²⁺ addition.
Fragment Processing: The resulting fragments are repaired and A-tailed, then ligated to adapters containing a single-cell barcode, UMI, T7 promoter, and Illumina handle.
TAPS Conversion: Material from a 384-well plate is collected and subjected to TET-assisted pyridine borane sequencing (TAPS), which converts methylated cytosine (5mC) to uracil while leaving barcoded single-cell adaptors intact.
Library Preparation and Sequencing: Library preparation includes in vitro transcription (IVT), reverse transcription, and PCR, followed by paired-end sequencing.
Application of scEpi2-seq has revealed how DNA methylation maintenance is influenced by the local chromatin context, with regions marked by H3K27me3 and H3K9me3 showing much lower methylation levels (8-10%) compared to H3K36me3-marked regions (50%) [126].
The Scientist's Toolkit: Essential Research Reagents and Materials
Table 2: Essential Research Reagents for Single-Cell Spatial Epigenomics
| Reagent/Material | Function | Examples/Specifications | Key Considerations |
|---|---|---|---|
| Histone Modification Antibodies | Target-specific recognition of epigenetic marks | H3K4me3, H3K27me3, H3K9me3 antibodies | Specificity validation crucial; lot-to-lot consistency important |
| Protein A-MNase Fusion Protein | Antibody-guided chromatin cleavage | Recombinant pA-MNase | Enzyme activity optimization required for different cell types |
| Cell Sorting Reagents | Identification and isolation of specific cell populations | Fluorescently-labeled antibodies, Hoechst stain | Panel design must account for spectral overlap |
| Barcoded Adapters | Single-cell indexing and library preparation | UMIs, cell barcodes, Illumina handles | Barcode design should minimize index hopping |
| TAPS Conversion Reagents | Bisulfite-free DNA methylation detection | TET enzyme, pyridine borane | Gentler on DNA than bisulfite treatment; preserves adapter integrity |
| Spatial Capture Slides | Positional barcoding for spatial context | 10X Visium slides, Slide-seq beads | Spot size and density determine spatial resolution |
| Library Amplification Reagents | Amplification of limited single-cell material | T7 polymerase, PCR reagents | Amplification bias must be minimized |
Applications and Biological Insights
Characterizing Tumor Microenvironment Heterogeneity
The integration of single-cell epigenomics with spatial transcriptomics has proven particularly valuable for characterizing the tumor microenvironment (TME). Using ChromSCape to analyze H3K27me3 profiles in breast cancer samples, researchers have identified distinct chromatin landscapes associated with different breast tumor subtypes and cell identities within the TME [123]. These epigenetic differences contribute to functional specialization within the TME, influencing therapeutic response and resistance mechanisms.
Analysis of H3K4me3 in HIV-infected individuals has revealed spectacular abnormalities in exons, introns, and promoter-TSS regions of neutrophils, with main changes related to genes responsible for cell activation, cytokine production, and adhesive molecule expression [128]. These findings demonstrate how spatial epigenomics can uncover molecular mechanisms underlying immune dysfunction in disease states.
Deciphering Lineage Commitment Decisions
In mammalian development, the integration of single-cell epigenomics with spatial information has revealed how chromatin dynamics guide lineage choices. Studies of mouse bone marrow using sortChIC have shown that during hematopoiesis, lineage choice at the chromatin level occurs at the progenitor stage [125]. Specifically, HSPCs already bear active chromatin marks (H3K4me1 and H3K4me3) at genes that will later be expressed in differentiated lineages, while repressive H3K27me3 marks are upregulated in non-lineage cells to silence inappropriate genes.
Joint profiling of H3K4me1 and H3K9me3 has demonstrated that cell types within the myeloid lineage have distinct active chromatin but share similar myeloid-specific heterochromatin states [125]. This implies a hierarchical regulation of chromatin during hematopoiesis: heterochromatin dynamics distinguish differentiation trajectories and lineages, while euchromatin dynamics reflect cell types within lineages.
Hierarchical Chromatin Regulation in Lineage Commitment
Quantitative Data and Performance Metrics
Performance Benchmarks for Spatial Integration Methods
Table 3: Performance Metrics for Spatial Epigenomic Integration Methods
| Method/Technology | Accuracy Metrics | Resolution | Multimodal Capacity | Limitations |
|---|---|---|---|---|
| SIMO [122] | 91% mapping accuracy (simple patterns); 73.8% (complex patterns); RMSE: 0.205 (complex) | Cellular | ST + scRNA-seq + scATAC-seq + DNA methylation | Sequential mapping may propagate errors |
| ChromSCape [123] | ARI: 0.998 (cell type identification); handles 25,000 cells on standard laptop | Genomic regions (5-50kb bins) | Multiple histone marks + chromatin accessibility | Designed for analysis rather than integration |
| sortChIC [125] | FRiP: 0.72-0.88; detects >50,000 CpGs per cell (in scEpi2-seq) | Single-cell | Currently single-modality per cell | Lower throughput than droplet-based methods |
| scEpi2-seq [126] | 5mC correlation: >0.8 (single-CpG level); TAPS conversion: ~95% | Single-molecule | Histone modifications + DNA methylation simultaneously | Complex workflow; expertise required |
Future Directions and Concluding Remarks
The integration of single-cell ChIP-seq with spatial epigenomics represents a transformative approach for understanding gene regulation in tissue context. As methods continue to evolve, several exciting directions are emerging. First, the development of true multi-omic technologies that simultaneously capture histone modifications, DNA methylation, chromatin accessibility, and transcriptomics in the same single cell while preserving spatial information will provide unprecedented insights into epigenetic regulation. Second, computational methods for integrating temporal dynamics with spatial epigenomics will enable researchers to not only understand where epigenetic events occur but how they evolve over time during development, disease progression, and therapeutic intervention.
For drug development professionals, these technologies offer promising avenues for identifying novel epigenetic biomarkers of disease progression and therapeutic response that account for both cellular heterogeneity and spatial context. This is particularly relevant for cancer immunotherapy, where the spatial arrangement of immune and tumor cells significantly influences treatment outcomes. Additionally, the ability to map epigenetic landscapes in patient tissues before and during treatment may reveal mechanisms of drug resistance and identify rational combination therapies.
The field of spatial epigenomics is still in its early stages, with technical challenges remaining in resolution, throughput, and multimodal integration. However, the rapid pace of innovation in both experimental and computational methods suggests that these limitations will be addressed in the coming years, making spatially-resolved single-cell epigenomics an increasingly accessible and powerful approach for basic research and translational applications.
Conclusion
This guide synthesizes critical aspects of ChIP-seq for H3K4me3, H3K27me3, and H3K9me3, highlighting their foundational roles in epigenetics, robust methodological frameworks, troubleshooting strategies for reliable data, and validation through multi-omics convergence. As epigenetic research advances, future directions include harnessing single-cell resolution, AI-driven analytics, and clinical translation for personalized medicine, offering transformative potential in understanding complex diseases and accelerating therapeutic development.
References
- 1. Histone modifications [https://www.abcam.com/en-us/technical-resources/guides/epigenetics-guide/histone-modifications]
- 2. The roles of histone modifications in tumorigenesis and ... [https://pmc.ncbi.nlm.nih.gov/articles/PMC11256729/]
- 3. The role of histone modifications: from neurodevelopment ... [https://www.nature.com/articles/s41392-022-01078-9]
- 4. Review Roles of H3K4 methylation in biology and disease [https://www.sciencedirect.com/science/article/pii/S0962892424001156]
- 5. ChIP-seq应用领域、研究思路、数据挖掘、下游实验 [https://blog.csdn.net/E_gene/article/details/126380562]
- 6. / H Bivalent Chromatin Domains Targeted by... 3 K 4 H 3 K 9 me 3 [https://pubmed.ncbi.nlm.nih.gov/26590716/]
- 7. ChIP-seq全流程解决方案 [https://abclonal.com.cn/chip-seq-whole-process-solution]
- 8. CUT&Tag recovers up to half of ENCODE ChIP-seq ... [https://www.nature.com/articles/s41467-025-58137-2]
- 9. 染色质免疫沉淀法(ChIP) 概述 - Cell Signaling Technology [https://www.cellsignal.cn/applications/chip-and-chip-seq/regulation-expression-in-cell-and-tissue]
- 10. Multiplexed chromatin immunoprecipitation sequencing for ... [https://pubmed.ncbi.nlm.nih.gov/39363107/]
- 11. H3K4me3 amplifies transcription at intergenic active ... [https://pmc.ncbi.nlm.nih.gov/articles/PMC12581817/]
- 12. H3K4me3 amplifies transcription at intergenic active ... [https://genesdev.cshlp.org/content/39/21-22/1290.full]
- 13. H3K9me3 and H3K27me3 are epigenetic barriers to ... [https://pmc.ncbi.nlm.nih.gov/articles/PMC12082551/]
- 14. Comprehensive analysis of H3K27me3 LOCKs under different ... [https://epigeneticsandchromatin.biomedcentral.com/articles/10.1186/s13072-025-00570-0]
- 15. Transcriptional Activity Affects the H3K4me3 Level and ... [https://pmc.ncbi.nlm.nih.gov/articles/PMC2876678/]
- 16. First insight into H3K4me3 modification in the rapid growth ... [https://www.frontiersin.org/journals/marine-science/articles/10.3389/fmars.2022.1011663/full]
- 17. Application of ChIP-Seq and related techniques to the study of ... [https://pmc.ncbi.nlm.nih.gov/articles/PMC3137373/]
- 18. H3K4me3 ChIP-seq peak calling and atlas generation. [https://bio-protocol.org/exchange/minidetail?id=10779681&type=30]
- 19. The Use of ChIP-seq in Drug Discovery [https://dovetailbiopartners.com/2023/09/26/the-use-of-chip-seq-in-drug-discovery/]
- 20. Polycomb gene silencing mechanisms: PRC2 chromatin ... [https://pmc.ncbi.nlm.nih.gov/articles/PMC8119337/]
- 21. ChIP-seq analysis reveals distinct H3K27me3 profiles that ... [https://pmc.ncbi.nlm.nih.gov/articles/PMC3177187/]
- 22. Comprehensive analysis of H3K27me3 LOCKs under ... [https://pmc.ncbi.nlm.nih.gov/articles/PMC11748335/]
- 23. H3K27me3-rich genomic regions can function as silencers ... [https://www.nature.com/articles/s41467-021-20940-y]
- 24. Comparative Analyses of H3K4 and H3K27 Trimethylations ... [https://pmc.ncbi.nlm.nih.gov/articles/PMC5054206/]
- 25. H3K27me3 ChIP-seq data analysis [https://bio-protocol.org/bio101/r9229770]
- 26. H3K4me3, H3K9ac, H3K27ac, H3K27me3 and H3K9me3 ... [https://pmc.ncbi.nlm.nih.gov/articles/PMC6770625/]
- 27. Inference of interactions between chromatin modifiers and ... [https://pmc.ncbi.nlm.nih.gov/articles/PMC4267652/]
- 28. Chromatin profiling identifies putative dual roles for ... [https://www.nature.com/articles/s41467-025-64570-0]
- 29. The Polycomb repressive complex 2 deposits H3K27me3 ... [https://www.sciencedirect.com/science/article/pii/S0960982223011533?via%3Dihub]
- 30. Role of H3K9me3 Heterochromatin in Cell Identity ... [https://pmc.ncbi.nlm.nih.gov/articles/PMC6759373/]
- 31. Role of H3K9me3 heterochromatin in cell identity ... [https://www.sciencedirect.com/science/article/abs/pii/S0959437X19300127]
- 32. H3K9me3-Dependent Heterochromatin: Barrier to Cell ... [https://www.sciencedirect.com/science/article/abs/pii/S0168952515001961]
- 33. The Emerging Role of H3K9me3 as a Potential ... [https://pmc.ncbi.nlm.nih.gov/articles/PMC6687838/]
- 34. Reduction of H3K9 methylation by G9a inhibitors improves ... [https://www.sciencedirect.com/science/article/pii/S2213671124001097]
- 35. Heterochromatin boundaries maintain centromere position, ... [https://www.nature.com/articles/s41594-025-01706-2]
- 36. Histone ChIP-seq Data Standards and Processing Pipeline [https://www.encodeproject.org/chip-seq/histone/]
- 37. Analysis of histone modification interplay reveals two ... [https://pmc.ncbi.nlm.nih.gov/articles/PMC12284244/]
- 38. Using ChIP-Seq Technology to Generate High-Resolution ... [https://pmc.ncbi.nlm.nih.gov/articles/PMC4151291/]
- 39. ChIP-seq profiling of H3K4me3 and H3K27me3 in an ... [https://www.frontiersin.org/journals/genetics/articles/10.3389/fgene.2023.1108104/full]
- 40. Genome-wide profiling of histone H3K4me3 and ... [https://www.nature.com/articles/s41598-022-15417-x]
- 41. Analysis of H3K4me3-ChIP-Seq and RNA-Seq data to ... [https://pmc.ncbi.nlm.nih.gov/articles/PMC8261273/]
- 42. ChIP-Seq Analysis Tutorial - Computational Cancer Genomics [https://epd.expasy.org/chipseq/doc/chipseq_tutorial_p2.php]
- 43. Quantitative analysis of ChIP-seq data uncovers dynamic and ... [https://epigeneticsandchromatin.biomedcentral.com/articles/10.1186/s13072-016-0090-4]
- 44. Computational methodology for ChIP-seq analysis - PMC [https://pmc.ncbi.nlm.nih.gov/articles/PMC4346130/]
- 45. A Step-by-Step Guide to Successful Chromatin ... [https://www.thermofisher.com/us/en/home/life-science/antibodies/antibodies-learning-center/antibodies-resource-library/antibody-application-notes/step-by-step-guide-successful-chip-assays.html]
- 46. Bath: a Bayesian approach to analyze epigenetic ... [https://pmc.ncbi.nlm.nih.gov/articles/PMC12203727/]
- 47. Cross-linking ChIP-seq protocol [https://www.abcam.com/en-us/technical-resources/protocols/cross-linking-chip-seq]
- 48. Comprehensive assessment of differential ChIP-seq tools ... [https://genomebiology.biomedcentral.com/articles/10.1186/s13059-022-02686-y]
- 49. Productive visualization of high-throughput sequencing ... [https://www.nature.com/articles/s41598-021-98889-7]
- 50. An interactive database for the assessment of histone ... [https://pmc.ncbi.nlm.nih.gov/articles/PMC4530063/]
- 51. How to select the best histone PTM antibody for CUT&RUN ... [https://www.epicypher.com/resources/blog/how-to-select-the-best-histone-ptm-antibody-for-cutrun-and-cuttag/]
- 52. Specificity Analysis of Antibodies That Recognize Histone ... [https://www.thermofisher.com/us/en/home/references/newsletters-and-journals/bioprobes-journal-of-cell-biology-applications/bioprobes-78/antibody-specificity-histone-posttranslational-modifications.html]
- 53. SNAP-ChIP: A Robust Method for Determining Histone ... [https://www.thermofisher.com/us/en/home/references/newsletters-and-journals/bioprobes-journal-of-cell-biology-applications/bioprobes-79/snap-chip-histone-PTM-antibody-specificity.html]
- 54. An ultra-low-input native ChIP-seq protocol for genome- ... [https://www.nature.com/articles/ncomms7033]
- 55. ChIP-seq Quality Assessment | In-depth-NGS-Data-Analysis ... [https://hbctraining.github.io/In-depth-NGS-Data-Analysis-Course/sessionV/lessons/05_combine_chipQC_and_metrics.html]
- 56. How to Analyze ChIP-Seq Data: From Data Preprocessing ... [https://www.cd-genomics.com/how-to-analyze-chip-seq-data.html]
- 57. ChIP-seq profiling of H3K4me3 and H3K27me3 in an invasive ... [https://pmc.ncbi.nlm.nih.gov/articles/PMC9996634/]
- 58. Requirements for establishment and epigenetic stability of ... [https://pmc.ncbi.nlm.nih.gov/articles/PMC12478525/]
- 59. Methods for ChIP-seq analysis: A practical workflow and ... [https://www.sciencedirect.com/science/article/pii/S1046202320300591]
- 60. Comparative analysis of commonly used peak calling ... [https://pmc.ncbi.nlm.nih.gov/articles/PMC7808876/]
- 61. a fully automated, web-based platform for end-to-end ChIP- ... [https://pmc.ncbi.nlm.nih.gov/articles/PMC12512806/]
- 62. GoPeaks: histone modification peak calling for CUT&Tag [https://genomebiology.biomedcentral.com/articles/10.1186/s13059-022-02707-w]
- 63. Genome-Wide Analysis of Histone Modifications: H3K4me2 ... [https://pmc.ncbi.nlm.nih.gov/articles/PMC3842134/]
- 64. The hierarchical folding dynamics of topologically ... [https://pmc.ncbi.nlm.nih.gov/articles/PMC12210587/]
- 65. Histone Methylation Regulation in Neurodegenerative Disorders [https://pmc.ncbi.nlm.nih.gov/articles/PMC8125694/]
- 66. SETD1B-mediated broad H3K4me3 controls proper ... [https://www.nature.com/articles/s41422-025-01080-0]
- 67. A histone-centric multi-omics study shows that increased ... [https://www.nature.com/articles/s41467-025-63745-z]
- 68. Integrative pan cancer analysis reveals epigenomic variation ... [https://pmc.ncbi.nlm.nih.gov/articles/PMC7930052/]
- 69. Single-cell sortChIC identifies hierarchical chromatin ... [https://www.nature.com/articles/s41588-022-01260-3]
- 70. ChIP-Seq: advantages and challenges of a maturing ... [https://pmc.ncbi.nlm.nih.gov/articles/PMC3191340/]
- 71. Ten Common Mistakes in ChIP-seq Data Analysis [https://www.accurascience.com/blogs_35_0.html]
- 72. Advantages and Disadvantages of Native and Cross- ... [https://www.news-medical.net/whitepaper/20160616/Advantages-and-Disadvantages-of-Native-and-Cross-Linked-Chromatin-Immunoprecipitation.aspx]
- 73. Protocol for double-crosslinking ChIP-seq to improve data ... [https://www.sciencedirect.com/science/article/pii/S2666166725005775]
- 74. Protocol for chromatin immunoprecipitation of ... [https://www.sciencedirect.com/science/article/pii/S2666166725001017]
- 75. Limitations and possibilities of low cell number ChIP-seq [https://bmcgenomics.biomedcentral.com/articles/10.1186/1471-2164-13-645]
- 76. Requirements for establishment and epigenetic stability of ... [https://www.sciencedirect.com/science/article/pii/S1097276525007105]
- 77. ChIP-seq guidelines and practices of the ENCODE and ... [https://pmc.ncbi.nlm.nih.gov/articles/PMC3431496/]
- 78. Sonication Chromatin Immunoprecipitation Protocol [https://www.cellsignal.com/protocols/1404?srsltid=AfmBOorfByBEk3naaT_SG0weKpB1uGn09mddJz0FPkd8koFOEJsFe7mg]
- 79. Refined ChIP‐Seq Protocol for High‐Quality Chromatin ... [https://pmc.ncbi.nlm.nih.gov/articles/PMC12628287/]
- 80. How should I prepare and sequence samples for ChIP-seq? [https://dnatech.ucdavis.edu/faqs/how-should-i-prepare-samples-for-chip-seq]
- 81. Analysis of histone antibody specificity directly in ... [https://pmc.ncbi.nlm.nih.gov/articles/PMC10028865/]
- 82. Comprehensive multimodal and multiomic profiling reveals ... [https://www.nature.com/articles/s42003-025-07954-8]
- 83. ChIP-seq Validated Antibodies [https://www.cellsignal.com/applications/chip-and-chip-seq/chip-seq-antibodies?srsltid=AfmBOor798J0CU4ginkgxmklvhptPl01iumwCDcGJBYRd4YpgZkOoITo]
- 84. CUT&Tag overcomes biases of ChIP and establishes ... [https://pmc.ncbi.nlm.nih.gov/articles/PMC12605858/]
- 85. ChIP-seq data processing tutorial [https://nbis-workshop-epigenomics.readthedocs.io/en/latest/content/tutorials/chipseqProc/lab-chipseq-processing.html]
- 86. How thoughtful experimental design can empower ... [https://www.nature.com/articles/s41467-025-62616-x]
- 87. Experimental Design: Best Practices - Bioinformatics [https://bioinformatics.ccr.cancer.gov/ccbr/project-support/experimental-design-best-practices/]
- 88. ChIP-chip versus ChIP-seq: Lessons for experimental design ... [https://bmcgenomics.biomedcentral.com/articles/10.1186/1471-2164-12-134]
- 89. A Statistical Framework for the Analysis of ChIP-Seq Data - PMC [https://pmc.ncbi.nlm.nih.gov/articles/PMC4608541/]
- 90. Statistical Aspects of ChIP-Seq Data Analysis [https://escholarship.org/uc/item/1ss936z1]
- 91. ChIP-seq analysis of histone H3K9 trimethylation in peripheral ... [https://pmc.ncbi.nlm.nih.gov/articles/PMC3932972/]
- 92. Antibody validation for Western blot: By the user, for the user [https://pmc.ncbi.nlm.nih.gov/articles/PMC6983856/]
- 93. Quantitative PCR validation for research scientists: Part 1 of 2 [https://virologyresearchservices.com/2023/01/13/quantitative-pcr-validation-part-1-of-2/]
- 94. Consensus guidelines for the validation of qRT-PCR ... [https://pmc.ncbi.nlm.nih.gov/articles/PMC8792405/]
- 95. How and why you should validate your antibodies [https://azurebiosystems.com/blog/quantitative-western-blotting-how-and-why-you-should-validate-your-antibodies/]
- 96. Antibody Validation for Western Blotting [https://www.cellsignal.com/about-us/our-approach-process/antibody-validation-western-blotting?srsltid=AfmBOope3ObjML1Jl8rUEeoUc0mg4od6IX1xkXjRfq-ENjAfUljtZaS4]
- 97. Hallmarks of Antibody Validation: Orthogonal Strategy [https://www.cellsignal.com/about-us/approach-validation-principles/orthogonal-data?srsltid=AfmBOop9S4WQlNZCz5Ol4GhP8tPiglJzRrpUnYVS8f30bI1XdCztO0-t]
- 98. Orthogonal method in pharmaceutical product analysis [https://alphalyse.com/orthogonal-method/]
- 99. Integration of ATAC-Seq and RNA-Seq identifies key ... [https://pmc.ncbi.nlm.nih.gov/articles/PMC10024148/]
- 100. Integrative Analysis of ATAC-Seq and RNA-Seq through ... [https://www.mdpi.com/2079-7737/13/10/799]
- 101. ATAC-seq: A Method for Assaying Chromatin Accessibility ... [https://pmc.ncbi.nlm.nih.gov/articles/PMC4374986/]
- 102. RNA-seq Sample Guidelines | Genomics Core Facility [https://www.huck.psu.edu/core-facilities/genomics-core-facility/sample-recommendations/rna-seq-sample-guidelines]
- 103. RNA-Sequencing | Medical Genomics | Service Cores [https://medicine.iu.edu/service-cores/facilities/medical-genomics/faq/rna-sequencing]
- 104. DNA Methylation Analysis: Choosing the Right Method - PMC [https://pmc.ncbi.nlm.nih.gov/articles/PMC4810160/]
- 105. A Comprehensive Guide to DNA Methylation Sequencing ... [https://www.epicypher.com/resources/blog/a-comprehensive-guide-to-dna-methylation-sequencing-methods/]
- 106. Integrative analysis of DNA methylation, RNA sequencing ... [https://www.frontiersin.org/journals/genetics/articles/10.3389/fgene.2025.1569122/full]
- 107. Data of correlation analysis between the density ... [https://www.sciencedirect.com/science/article/pii/S2352340920312580]
- 108. 易基因:Cell Res/IF25.9:童明汉/蓝斐/汤富酬合作利用ChIP ... [https://www.cnblogs.com/E-GENE/p/19118221]
- 109. 器官基因的组蛋白h3k9三甲基化表达差异的分析方法与 ... [https://patents.google.com/patent/CN103667455A/zh]
- 110. 组蛋白ChIP-seq揭示烟粉虱含菌细胞共生菌调控宿主生殖的 ... [https://blog.csdn.net/e_gene/article/details/129121630]
- 111. 面向ChIP-seq全流程分析的自动化网络平台及其在表观遗传 ... [https://www.ebiotrade.com/newsf/2025-10/20251009211622707.htm]
- 112. 染色质可及性数据助力基因型推断:遗传调控机制的新探索 [https://www.benagen.com/index.php?c=show&id=1032]
- 113. 一文了解染色质可及性和表观基因组调控原创 [https://blog.csdn.net/weixin_47195452/article/details/145317469]
- 114. Comprehensive assessment of differential ChIP-seq tools ... [https://pmc.ncbi.nlm.nih.gov/articles/PMC9128273/]
- 115. ChIP-Atlas [https://chip-atlas.org/]
- 116. ChIP-seq data of H3K4me3, H3K27ac and H3K27me3 on ... [https://ega-archive.org/studies/EGAS00001003163]
- 117. GSE20303 - GEO Accession viewer - NIH [https://www.ncbi.nlm.nih.gov/geo/query/acc.cgi?acc=GSE20303]
- 118. ChIP-Seq - Computational Cancer Genomics - Expasy [https://epd.expasy.org/chipseq/]
- 119. nf-core/chipseq: ChIP-seq peak-calling, QC and differential ... [https://github.com/nf-core/chipseq]
- 120. A manually curated ChIP-seq benchmark demonstrates room ... [https://pmc.ncbi.nlm.nih.gov/articles/PMC3045577/]
- 121. Integrative analysis of 111 reference human epigenomes [https://www.nature.com/articles/nature14248]
- 122. Spatial integration of multi-omics single-cell data with SIMO [https://www.nature.com/articles/s41467-025-56523-4]
- 123. Interactive analysis of single-cell epigenomic landscapes ... [https://www.nature.com/articles/s41467-020-19542-x]
- 124. Profiling single-cell histone modifications using indexing ... [https://pmc.ncbi.nlm.nih.gov/articles/PMC8494230/]
- 125. Single-cell sortChIC identifies hierarchical chromatin ... [https://pmc.ncbi.nlm.nih.gov/articles/PMC9925381/]
- 126. Single-cell multi-omic detection of DNA methylation and ... [https://www.nature.com/articles/s41592-025-02847-4]
- 127. Single-cell and spatial transcriptomics integration [https://www.frontiersin.org/journals/immunology/articles/10.3389/fimmu.2025.1649468/full]
- 128. H3K4me3 Histone ChIP-Seq Analysis Reveals Molecular ... [https://www.frontiersin.org/journals/immunology/articles/10.3389/fimmu.2021.682094/full]