A Comprehensive Guide to BS-seq Data Quality Control: Best Practices for Pre-alignment and Post-alignment Analysis
This article provides a complete guide to quality control (QC) for Bisulfite Sequencing (BS-seq) data, a gold-standard method for DNA methylation analysis.
A Comprehensive Guide to BS-seq Data Quality Control: Best Practices for Pre-alignment and Post-alignment Analysis
Abstract
This article provides a complete guide to quality control (QC) for Bisulfite Sequencing (BS-seq) data, a gold-standard method for DNA methylation analysis. Tailored for researchers and bioinformaticians, it details essential QC procedures for both pre-alignment raw data and post-alignment results. The content covers foundational concepts, step-by-step methodologies, common troubleshooting scenarios, and validation techniques. By integrating the latest benchmarking studies and tool comparisons, this guide empowers scientists to implement robust QC pipelines, ensuring the accuracy and reliability of methylation data for downstream biomedical and clinical research applications.
Understanding the Critical Role of Quality Control in BS-seq Analysis
Core FAQs: Understanding BS-Seq Challenges
Why does BS-seq require more specialized quality control than standard DNA sequencing?
BS-seq requires specialized QC because the bisulfite conversion process fundamentally alters the DNA sequence and introduces specific technical artifacts that standard sequencing workflows are not designed to handle. The conversion of unmethylated cytosines to uracils reduces sequence complexity, transforming a four-letter genome into a three-letter one (A, T, G) for subsequent analysis. This reduction complicates read alignment, increases ambiguity, and can lead to inaccurate mapping. Furthermore, the harsh chemical treatment causes significant DNA degradation and loss, which must be quantified as it directly impacts library complexity and coverage uniformity. specialized QC is essential to verify that the conversion itself was efficient, as any incomplete conversion leads to false positive methylation calls, severely compromising data integrity [1] [2] [3].
What are the primary sources of data complexity loss in a BS-seq experiment?
The primary sources of data complexity loss are:
- Sequence Space Reduction: The conversion of unmethylated C to T decreases the information density of the genome, making unique alignment more difficult [2] [3].
- DNA Degradation: Bisulfite treatment is conducted under acidic and high-temperature conditions, which fragment DNA strands. This results in shorter sequencing fragments, lower library yields, and over-representation of smaller DNA fragments in the final library [1] [4].
- Incomplete Conversion: If unmethylated cytosines are not fully converted to uracils, they are misinterpreted as methylated cytosines during sequencing, leading to an overestimation of global methylation levels [5].
- GC-Bias: The process can introduce biases in the representation of GC-rich regions of the genome, such as promoters and CpG islands, leading to uneven coverage [1] [6].
How can I determine if my BS-seq data has suffered from severe DNA degradation?
DNA degradation can be assessed both computationally and experimentally:
- Computational Assessment: Analyze the distribution of insert sizes in your aligned sequencing data. A strong bias towards very short fragments suggests significant degradation. Tools like FastQC can help visualize this.
- Experimental Assessment: Prior to sequencing, use a qPCR-based assay (like BisQuE) that targets amplicons of different lengths. A significant drop in the yield of the long amplicon compared to the short one indicates fragmentation. Alternatively, bioanalyzer electrophoresis can directly show the fragment size distribution of your library, with degraded samples showing a smear of small fragments instead of a clear peak [1] [4].
My BS-seq library yield is low. Is this due to bisulfite conversion, and how can I improve it?
Yes, low library yield is a common consequence of bisulfite conversion due to DNA loss from fragmentation and purification steps. To improve yields:
- Use Modern Kits: Consider ultra-mild bisulfite conversion kits (e.g., UMBS-seq) or enzymatic conversion methods (e.g., EM-seq) that are designed to minimize DNA damage [1].
- Increase Input DNA: If possible, use a higher amount of input DNA to compensate for expected losses, though this is not an option for low-input samples.
- Optimize Purification: Minimize the number of cleanup steps and use purification methods that maximize recovery of single-stranded, converted DNA [2] [6].
- Switch Methods: For extremely precious, low-input, or degraded samples (like cfDNA or FFPE), enzymatic conversion methods like EM-seq or UMBS-seq can provide significantly higher library yields and complexity than conventional bisulfite methods [1] [7].
Troubleshooting Common BS-Seq Issues
Issue 1: High Duplication Rates and Low Library Complexity
Problem: After sequencing, a very high percentage of your reads are flagged as PCR duplicates, indicating low library complexity.
Diagnosis and Solutions:
- Root Cause: The most common cause is low input DNA or severe DNA degradation during bisulfite conversion, which results in a low diversity of unique DNA molecules for PCR amplification. This leads to the over-amplification of the few surviving fragments [1] [6].
- Verification: Check the bioanalyzer profile of your post-conversion DNA. A profile showing a low molecular weight smear instead of a distinct peak confirms degradation. A qPCR assay showing low recovery of converted DNA also supports this diagnosis [4].
- Solution:
- Optimize Conversion: Use gentler conversion protocols. The recently developed Ultra-Mild Bisulfite Sequencing (UMBS-seq) method demonstrates significantly less DNA damage and higher library complexity compared to conventional kits [1].
- Increase Input: If possible, use more input DNA.
- Use Enzymatic Methods: For future experiments, consider the NEBNext EM-seq or UMBS-seq kits, which are gentler on DNA and preserve complexity, especially with low inputs [1] [2].
Issue 2: High Background Noise and False Positive Methylation Calls
Problem: You observe methylation signals at genomic loci expected to be unmethylated.
Diagnosis and Solutions:
- Root Cause: This is typically caused by incomplete bisulfite conversion, where some unmethylated cytosines were not converted to uracils and are thus sequenced as cytosines, mimicking a true methylation signal [5].
- Verification: It is crucial to measure the bisulfite conversion efficiency. This can be done computationally by analyzing the methylation levels in genomic contexts known to be unmethylated, such as mitochondrial DNA, chloroplast DNA (in plants), or non-CpG sites in somatic tissues. A conversion efficiency below 99.5% is often a cause for concern [5] [3].
- Solution:
- QC Conversion Efficiency: Always include a spike-in control of unmethylated DNA (e.g., lambda phage DNA) in your conversion reaction. After sequencing, the conversion efficiency can be calculated from this control. Computational tools like
BCREvalcan also estimate the conversion ratio from the sequencing data itself by using native genomic regions like telomeres as an internal control [5]. - Optimize Protocol: Ensure your bisulfite conversion protocol is followed precisely, with fresh reagents and correct incubation times and temperatures. Some newer kits offer faster and more efficient conversion [1].
- QC Conversion Efficiency: Always include a spike-in control of unmethylated DNA (e.g., lambda phage DNA) in your conversion reaction. After sequencing, the conversion efficiency can be calculated from this control. Computational tools like
Issue 3: Poor Mapping Efficiency and Alignment Rates
Problem: A large proportion of your sequencing reads fail to align to the reference genome.
Diagnosis and Solutions:
- Root Cause: The reduced sequence complexity after bisulfite conversion (a T-rich genome) makes it difficult for standard alignment algorithms to find unique mapping positions. Furthermore, high levels of DNA damage or adapter contamination can also contribute to poor mapping [6] [8].
- Verification: Use a pre-alignment QC tool like FastQC to check for adapter content and overall read quality. Then, use a bisulfite-aware aligner such as Bismark or BSMAP and check its log files for the reported alignment rate [8] [3].
- Solution:
- Use Specialized Aligners: Always use aligners specifically designed for BS-seq data. These tools in silico convert the reference genome to mimic the bisulfite treatment, allowing for accurate alignment of your T-rich reads [8].
- Aggressive Adapter Trimming: Perform thorough adapter trimming before alignment to prevent adapter sequences from interfering with the mapping process [6].
- Check Library Prep: If mapping rates remain low, revisit the library preparation. Protocols like post-bisulfite adapter tagging (PBAT) can sometimes improve outcomes for difficult samples [6].
Performance Data & Method Comparisons
The following tables summarize key performance metrics from recent comparative studies of bisulfite and enzymatic conversion methods, highlighting the impact of conversion chemistry on data quality.
Table 1: Comparative Performance of Conversion Methods with Low-Input DNA
| Performance Metric | UMBS-seq [1] | Conventional BS-seq [1] | EM-seq (Enzymatic) [1] |
|---|---|---|---|
| Library Yield | Highest across all input levels (5 ng to 10 pg) | Low | Intermediate, but lower than UMBS-seq |
| Library Complexity | High (low duplication rate) | Low (high duplication rate) | High, comparable to UMBS-seq |
| DNA Damage | Low | Severe | Very Low |
| Background (C-to-T conversion efficiency) | ~0.1% (very low and consistent) | <0.5% (acceptable) | Can exceed 1% at low inputs, inconsistent |
| Insert Size | Long | Short | Long |
Table 2: Independent QC Assessment of Commercial Kits (using 10 ng input) [2]
| Kit Type / Example | Conversion Efficiency | Converted DNA Recovery | Induced Fragmentation |
|---|---|---|---|
| Bisulfite (Zymo EZ DNA Methylation) | High (>99.6%) | Structurally overestimated (e.g., 130%) | High |
| Enzymatic (NEB EM-seq) | Slightly lower (~94%) | Low (e.g., 40%) | Low to Medium |
Experimental Protocols for Key QC Experiments
Protocol 1: Multiplex qPCR for Assessing Bisulfite Conversion (BisQuE Assay)
This protocol allows for the simultaneous evaluation of conversion efficiency, DNA recovery, and degradation from a single converted sample [4].
- Primer and Probe Design: Design two sets of cytosine-free (C-free) primers to amplify a short (~104 bp) and a long (~238 bp) amplicon from a multi-copy genomic target (e.g., LINE-1 elements). Also, design TaqMan probes that can distinguish between converted (T) and unconverted (C) bases at non-CpG sites within the short amplicon.
- qPCR Setup: Perform a multiplex qPCR reaction containing:
- The two sets of C-free primers.
- The TaqMan probes for converted and unconverted templates.
- The bisulfite-converted DNA sample.
- Data Calculation:
- Conversion Efficiency: Determined by comparing the signals from the probes detecting converted vs. unconverted templates.
- DNA Recovery: Calculated by comparing the quantity of the short amplicon in the converted DNA to a known quantity of unconverted genomic DNA.
- Degradation Index: Calculated as the ratio of the long amplicon quantity to the short amplicon quantity. A lower ratio indicates greater degradation.
Protocol 2: Computational Evaluation of Bisulfite Conversion Ratio (BCREval)
This method uses telomeric repeats in the sequencing data as a native spike-in control to estimate the unconverted rate [5].
- Sequence Extraction: Scan the raw FASTQ files for reads containing telomeric repeat sequences (e.g.,
TTAGGGfor the forward strand,CCCTAAfor the reverse strand in humans). A minimum of 8 consecutive repeats is used to confidently identify telomeric reads. - C-to-T Analysis: For all identified telomeric reads, count the number of unconverted cytosines at non-CpG sites within the telomeric repeat pattern. Since these sites are expected to be unmethylated in most somatic tissues, any remaining C is presumed to result from incomplete conversion.
- Ratio Calculation: The bisulfite conversion ratio (BCR) is calculated as: ( BCR = 1 - \frac{\text{Number of unconverted non-CpG C's in telomeric reads}}{\text{Total number of non-CpG C's in telomeric reads}} ) A BCR > 99.5% is generally considered acceptable.
Essential Visual Workflows
Bisulfite Sequencing QC Workflow
Impact of Bisulfite Conversion on DNA
The Scientist's Toolkit: Essential Research Reagents & Materials
Table 3: Key Solutions for BS-seq QC and Troubleshooting
| Reagent / Kit | Function | Key Consideration |
|---|---|---|
| Ultra-Mild Bisulfite Kits (e.g., UMBS-seq) | Gentle chemical conversion that minimizes DNA degradation. | Ideal for low-input and fragmented samples like cfDNA; provides high library complexity [1]. |
| Enzymatic Conversion Kits (e.g., NEB EM-seq) | Uses enzymes (TET2/APOBEC) instead of chemicals for C-to-T conversion. | Reduces DNA damage but may have higher background noise at very low inputs; requires optimization of bead cleanups [1] [2]. |
| Unmethylated Spike-in Control (e.g., Lambda DNA) | Provides an internal standard for calculating bisulfite conversion efficiency. | Essential for distinguishing true methylation from incomplete conversion; must be spiked in before conversion [5] [3]. |
| Multiplex qPCR Assays (e.g., BisQuE, qBiCo) | Quantifies conversion efficiency, DNA recovery, and fragmentation in one reaction. | Critical for pre-sequencing QC, especially when working with limited or degraded samples [2] [4]. |
| Bisulfite-Aware Aligners (e.g., Bismark, BSMAP) | Aligns T-rich BS-seq reads to a reference genome by performing in-silico conversion. | Non-negotiable for data analysis; standard aligners will fail. Choice affects mapping efficiency and speed [8] [3]. |
| Computational QC Tools (e.g., BCREval, FastQC) | Assesses conversion ratio from sequencing data and general sequence quality. | Allows for post-sequencing verification of conversion efficiency without a physical spike-in [5]. |
Core Principles of DNA Methylation Analysis and Its Importance as a Biomarker
DNA methylation, the process of adding a methyl group to cytosine bases in DNA, is a fundamental epigenetic modification that regulates gene expression without altering the underlying DNA sequence. This modification plays crucial roles in cellular processes including development, differentiation, and aging, with abnormal methylation patterns strongly associated with various diseases, particularly cancer [9]. Bisulfite sequencing (BS-seq) has emerged as the gold standard method for detecting DNA methylation at single-nucleotide resolution, making it invaluable for both basic research and clinical biomarker development [10] [11].
As DNA methylation biomarkers gain traction in clinical applications—especially in liquid biopsies for cancer diagnosis, prognosis, and treatment monitoring—ensuring data quality throughout the BS-seq workflow becomes paramount [12]. This technical support center addresses common challenges and provides troubleshooting guidance for researchers working with BS-seq data, with particular emphasis on quality control measures during pre-alignment and post-alignment phases.
Frequently Asked Questions (FAQs)
1. What are the primary limitations of conventional bisulfite sequencing, and how can they be addressed? Conventional BS-seq suffers from several limitations: lengthy reaction times (often 3+ hours), severe DNA degradation (up to 90% loss), incomplete cytosine-to-uracil conversion particularly in high-GC or structured regions, and inability to distinguish between 5-methylcytosine (5mC) and 5-hydroxymethylcytosine (5hmC) [13] [11]. Newer approaches like Ultrafast BS-seq (UBS-seq) use highly concentrated bisulfite reagents at elevated temperatures to reduce reaction time by approximately 13-fold, resulting in less DNA damage and lower background noise [13]. Alternatively, bisulfite-free methods like EM-seq and TAPS eliminate bisulfite conversion altogether, though they introduce enzymatic steps that may increase complexity and batch variability [13].
2. How does reduced representation bisulfite sequencing (RRBS) differ from whole-genome bisulfite sequencing (WGBS)? The table below compares key features of these two common BS-seq approaches:
| Feature | WGBS | RRBS |
|---|---|---|
| Coverage | ~90% of CpGs in human genome [10] | 10-15% of CpGs (focus on CpG islands) [11] |
| Resolution | Single-base | Single-base |
| Cost | Higher | Lower |
| Input DNA | More required | Less required |
| Best For | Comprehensive methylation profiling, non-CG methylation | Targeted profiling, promoter-rich regions |
| Limitations | Expensive for large genomes [10] | Biased selection, misses non-island regions [11] |
3. What quality control metrics should be monitored during BS-seq data analysis? Quality control should be performed at multiple stages. Pre-alignment QC includes assessing bisulfite conversion efficiency (should be >99%), DNA degradation levels, and sequence quality scores [14] [15]. Post-alignment QC involves examining alignment rates, mapping quality scores, coverage depth and uniformity, and CpG methylation distribution patterns [10]. Tools like FastQC, Bismark, and Qualimap can generate these metrics, while specialized packages like methylKit in R facilitate downstream analysis [10].
4. Why might bisulfite conversion fail, and how can success be ensured? Incomplete bisulfite conversion can result from poor DNA quality, inadequate denaturation of double-stranded DNA, presence of DNA secondary structures, or suboptimal reaction conditions [13] [15]. To ensure success: use high-quality input DNA; employ positive controls for conversion efficiency; consider optimized kits or protocols like UBS-seq for problematic regions; and verify conversion rates bioinformatically by examining non-CpG cytosine conversion in the data [13] [15].
5. How can DNA methylation biomarkers be validated for clinical use? Clinical validation requires demonstrating analytical validity (accuracy, sensitivity, specificity) and clinical validity (association with disease state/outcome) across multiple independent cohorts [16] [17]. For example, the PLAT-M8 biomarker for ovarian cancer prognosis was validated across five clinical cohorts (n=391 total) using bisulfite pyrosequencing, showing significant association with overall survival (HR=2.50, 95% CI: 1.64-3.79) [16]. Successful clinical translation also requires choosing appropriate liquid biopsy sources (blood, urine, etc.) based on cancer type and ensuring biomarkers perform reliably in the intended sample matrix [12].
Troubleshooting Common BS-Seq Issues
Pre-Alignment Quality Control
Problem: Low Bisulfite Conversion Efficiency
- Symptoms: High percentage of cytosines remaining at non-CpG positions in sequenced reads.
- Possible Causes: Incomplete denaturation of DNA, degraded bisulfite reagents, insufficient reaction time or temperature, poor DNA quality.
- Solutions:
- Verify DNA quality and concentration before conversion.
- Use fresh bisulfite reagents and check expiration dates.
- Increase denaturation temperature or time; consider using thermocycler for precise temperature control.
- Implement positive controls (e.g., fully unmethylated DNA) to monitor conversion efficiency.
- Consider adopting UBS-seq protocols for more complete conversion [13].
Problem: Excessive DNA Degradation
- Symptoms: Low molecular weight DNA fragments, poor library complexity, reduced mapping efficiency.
- Possible Causes: Overly long bisulfite reaction times, excessive temperature, multiple freeze-thaw cycles of converted DNA.
- Solutions:
Problem: Low Sequence Diversity/Complexity
- Symptoms: Low sequencing quality scores, poor base calling, high duplication rates.
- Possible Causes: BS conversion reduces sequence complexity (converts most C's to T's), insufficient input DNA, PCR bias.
- Solutions:
- Increase input DNA amount when possible.
- Use unique molecular identifiers (UMIs) to distinguish true biological variants from PCR duplicates.
- Employ PCR protocols with reduced bias (e.g., limited cycles, high-fidelity polymerases).
- Consider tagmentation-based WGBS (T-WGBS) for low-input samples [11].
Post-Alignment Quality Control
Problem: Low Mapping Efficiency
- Symptoms: Low percentage of reads aligning to reference genome.
- Possible Causes: High degradation, poor sequence quality, inappropriate alignment parameters, reference genome issues.
- Solutions:
- Use BS-specific aligners (Bismark, bwa-meth) with optimized parameters [10].
- Check for adapter contamination and trim if necessary.
- Verify reference genome is appropriate and includes bisulfite-converted sequence context.
- Consider allowing for slightly higher mismatch rates in aligner settings.
Problem: Biased Methylation Measurements
- Symptoms: Systematic over- or under-estimation of methylation levels, particularly in specific genomic contexts.
- Possible Causes: Incomplete bisulfite conversion, PCR bias toward certain sequences, mapping errors in low-complexity regions.
- Solutions:
- Bioinformatically correct for conversion errors using non-CpG cytosine conversion rates.
- Implement duplicate removal while preserving true biological variation.
- Use statistical methods that account for potential biases, such as beta-binomial models in differential methylation analysis [9].
- Consider using smoothing approaches or regional analysis rather than single-CpG analysis.
Problem: Batch Effects
- Symptoms: Methylation patterns cluster by processing date or batch rather than biological groups.
- Possible Causes: Different bisulfite conversion batches, different library preparation dates, different sequencing runs.
- Solutions:
- Randomize samples across processing batches.
- Include technical replicates across batches.
- Use statistical methods (e.g., ComBat, SVA) to correct for batch effects.
- Process cases and controls simultaneously whenever possible.
BS-Seq Workflow and Quality Control Diagram
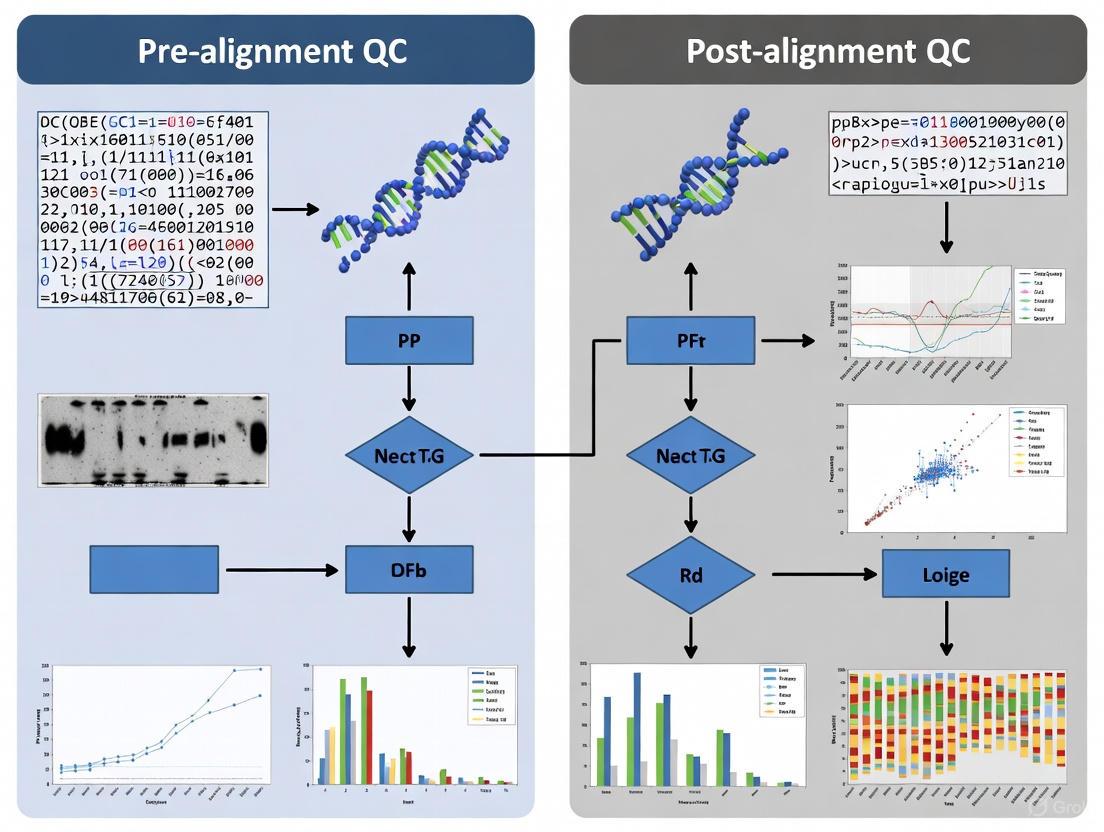
BS-Seq Quality Control Workflow: This diagram illustrates the complete BS-seq workflow with key quality control checkpoints at both pre-alignment and post-alignment stages, emphasizing the critical points where data quality must be verified.
Essential Research Reagents and Tools
The table below outlines key reagents, kits, and computational tools essential for successful BS-seq experiments and analysis:
| Category | Product/Tool | Key Function | Considerations |
|---|---|---|---|
| Bisulfite Kits | Zymo EZ DNA Methylation-Gold [13] | Conventional BS conversion | Well-established but lengthy protocol |
| Qiagen Epitect Bisulfite Kit [15] | BS conversion | Simplified protocol for consistent results | |
| UBS-seq reagents [13] | Ultrafast BS conversion | Reduced DNA damage, faster processing | |
| Library Prep | T-WGBS kits [11] | Tagmentation-based library prep | Suitable for low-input samples (~20 ng) |
| scBS-seq protocols [11] | Single-cell BS-seq | Enables methylation profiling at single-cell level | |
| Alignment | Bismark [10] | BS-read alignment | Most widely used BS-specific aligner |
| bwa-meth [10] | BS-read alignment | Alternative to Bismark | |
| Analysis | methylKit [10] | Differential methylation | R package for comprehensive analysis |
| DSS [9] | Differential methylation | Handles general experimental designs | |
| BiQ Analyzer [15] | Data quality assessment | Evaluates conversion efficiency, generates diagrams | |
| Quality Control | FastQC [14] | Sequence quality | Standard for NGS QC |
| Qualimap [14] | Alignment QC | Examines mapping statistics, coverage | |
| MultiQC [10] | QC report aggregation | Combines metrics from multiple tools |
Advanced Methodologies for Differential Methylation Analysis
For detecting differentially methylated loci (DML) or regions (DMRs), several statistical approaches are available. The DSS package implements a beta-binomial regression model with "arcsine" link function that is particularly suited for complex experimental designs with multiple factors [9]. This method provides computational efficiency and stability even when methylation levels approach 0 or 1, addressing limitations of other approaches that fail under these conditions [9].
When analyzing differential methylation, consider these key methodological aspects:
- Biological vs. Technical Variation: Beta-binomial models account for both biological variation and sampling variability, providing more reliable inference than binomial models [9].
- Experimental Design: For multi-factor designs (e.g., treatment, time, batch), use methods like DSS-general that handle complex designs through regression frameworks [9].
- Multiple Testing: Account for the large number of statistical tests performed across the genome using false discovery rate (FDR) control methods like Benjamini-Hochberg.
- Regional vs. Single-site Analysis: Consider analyzing differentially methylated regions (DMRs) rather than single CpGs to increase biological interpretability and statistical power.
Quality control in BS-seq experiments is not a single step but a continuous process that must be integrated throughout the entire workflow, from sample preparation to data analysis. The principles and troubleshooting guidelines presented here provide a framework for generating reliable DNA methylation data suitable for both basic research and clinical biomarker development.
As DNA methylation biomarkers continue to transition from research to clinical applications—evidenced by FDA-approved tests like Epi proColon for colorectal cancer detection—maintaining rigorous quality standards becomes increasingly critical [12]. By implementing systematic quality control measures and understanding common pitfalls, researchers can ensure their BS-seq data generates biologically meaningful and clinically actionable insights.
Whole-genome bisulfite sequencing (WGBS) is a powerful method for profiling DNA methylation at single-base resolution across the entire genome. This technique leverages the differential sensitivity of methylated and unmethylated cytosines to bisulfite conversion, enabling researchers to investigate epigenetic regulation in development, disease, and various biological processes. The complete BS-seq workflow encompasses multiple critical stages, from initial library preparation through computational analysis to final methylation calling. This technical support guide addresses common challenges and provides troubleshooting advice for researchers conducting BS-seq experiments within the context of data quality control research, focusing on both pre-alignment and post-alignment considerations.
Library Preparation Methods
Library preparation is a foundational step that significantly impacts downstream data quality. The table below compares the primary BS-seq library preparation methods:
Table 1: Comparison of BS-seq Library Preparation Methods
| Method | Key Features | Optimal Input DNA | Advantages | Limitations |
|---|---|---|---|---|
| Conventional WGBS | Standard bisulfite conversion protocol [18] | 500 ng or more [18] | Comprehensive genome coverage; single-base resolution [18] [11] | Significant DNA degradation (up to 90%); reduced sequence complexity [1] [11] |
| UMBS-seq | Ultra-mild bisulfite conversion [1] | Low-input (tested down to 10 pg) [1] | Reduced DNA damage; higher library complexity; better performance with low inputs [1] | Longer conversion time (90 min at 55°C) [1] |
| T-WGBS | Tagmentation-based approach [11] | Low-input (~20 ng) [11] | Faster protocol with fewer steps; minimal DNA loss [11] | Reduced sequence complexity; cannot distinguish 5mC from 5hmC [11] |
| RRBS | Restriction enzyme-based [10] [11] | Varies by protocol | Cost-effective; focuses on CpG-rich regions [10] [11] | Limited genome coverage (~10-15% of CpGs); biased representation [11] |
| EM-seq | Enzymatic conversion [1] [19] | Low-input (comparable to UMBS-seq) [1] | Reduced DNA damage; longer insert sizes [1] | Higher cost; complex workflow; enzyme instability [1] |
Key Protocol Details
Conventional WGBS Library Preparation: The standard protocol involves multiple steps: RNaseA treatment to remove contaminating RNA, DNA fragmentation (typically by ultrasonication), end-repair and A-tailing, adapter ligation, bisulfite conversion, and final library amplification [18]. The bisulfite conversion step uses sodium bisulfite to convert unmethylated cytosines to uracils while methylated cytosines remain protected [18] [11]. This process typically takes 3-5 days to complete and can be performed using self-prepared reagents or commercial kits [18].
UMBS-seq Protocol Improvements: UMBS-seq (Ultra-Mild Bisulfite Sequencing) introduces optimized bisulfite formulation consisting of 100 μL of 72% ammonium bisulfite and 1 μL of 20 M KOH, incubated at 55°C for 90 minutes [1]. This approach significantly reduces DNA damage compared to conventional methods while maintaining high conversion efficiency, achieving background unconversion rates of approximately 0.1% even with low-input samples [1].
The following diagram illustrates the complete BS-seq workflow from sample preparation to methylation calling:
Critical Quality Control Checkpoints
Pre-Alignment Quality Control
Pre-alignment quality control is essential for identifying issues early in the analysis pipeline. The table below summarizes key pre-alignment QC metrics and their implications:
Table 2: Pre-Alignment Quality Control Metrics
| QC Metric | Assessment Tool | Optimal Range | Potential Issues | Troubleshooting Steps |
|---|---|---|---|---|
| Sequence Quality | FastQC [20] [19] | Q-score ≥30 across all bases | Low quality scores at read ends | Increase trimming stringency; investigate sequencing issues |
| Adapter Contamination | TrimGalore! [20] | <5% adapter content | High adapter contamination indicates fragmentation issues | Optimize fragmentation; increase adapter trimming |
| Bisulfite Conversion Efficiency | Bismark [10] [20] | ≥99% for lambda DNA spike-in [1] | Low conversion efficiency | Optimize bisulfite conversion conditions; check reagent quality |
| GC Content Distribution | FastQC [20] | Organism-specific expected distribution | Abnormal GC distribution | Check for over-amplification; assess conversion bias |
| Sequence Duplication Level | FastQC [20] | <20% for WGBS | High duplication rates | Increase input DNA; optimize library amplification |
Pre-Alignment QC Protocol:
- Run FastQC on raw sequencing files to assess base quality, GC content, adapter contamination, and duplication rates [20].
- Use TrimGalore! to remove adapters and low-quality bases with parameters:
--fastqc --phred33 --gzip --length 20[20]. - Include unmethylated lambda DNA spike-in controls to calculate bisulfite conversion efficiency [18] [1].
- For UMBS-seq and EM-seq, verify expected reduction in duplication rates compared to conventional BS-seq [1].
Post-Alignment Quality Control
After alignment, specific quality metrics must be assessed to ensure data reliability:
Table 3: Post-Alignment Quality Control Metrics
| QC Metric | Assessment Method | Optimal Range | Potential Issues | Troubleshooting Steps |
|---|---|---|---|---|
| Mapping Efficiency | Bismark reports [10] [20] | >70% for WGBS | Low mapping efficiency | Check reference genome compatibility; assess over-trimming |
| Strand Alignment Balance | Methylation extractor reports [20] | ~50% OT vs OB strands | Significant strand bias | Examine bisulfite conversion uniformity |
| CpG Coverage | Coverage files [10] [20] | ≥10X for most applications; ≥30X for confident calling [21] | Inadequate coverage | Increase sequencing depth; optimize library complexity |
| Methylation Distribution | Genome-wide methylation levels [10] | Context-specific (CG > CH) | Abnormal distribution patterns | Check conversion efficiency; examine biological expectations |
| Cross-Contamination | Bisulfite conversion of non-CG contexts [1] | CHG and CHH <2% in mammalian samples | Elevated non-CG methylation | Verify conversion efficiency; check for sample contamination |
Post-Alignment QC Protocol:
- Generate alignment reports using Bismark with parameters:
--score_min L,0,-0.6 -N 0 -L 20[20]. - Extract methylation calls using Bismark methylation extractor with
--no_overlap --comprehensive --gzip --CX --cytosine_reportoptions [20]. - Calculate coverage statistics and filtering using a minimum coverage threshold (typically 10-30x) [21].
- For EM-seq data, implement additional filtering to remove reads with widespread C-to-U conversion failure (reads with >5 unconverted cytosines) [1].
Bisulfite Conversion Principles
The core principle of BS-seq involves the differential chemical modification of methylated versus unmethylated cytosines by bisulfite treatment. The following diagram illustrates this process:
Methylation Calling and Data Analysis
Methylation Calling Methods
Methylation calling involves quantifying methylation levels at each cytosine position:
Basic Methylation Calling Workflow:
- Process alignment files (BAM) to count methylated and unmethylated reads at each cytosine position [10] [20].
- Calculate methylation percentage (beta value) as: β = mC / (mC + uC) where mC represents methylated reads and uC represents unmethylated reads [10].
- Filter low-coverage positions (typically <10X coverage) to ensure statistical reliability [21].
- Generate genome-wide methylation files in standardized formats (e.g., BedGraph, BigWig) for visualization [20].
Differential Methylation Analysis:
- Use specialized tools such as methylKit, MethylSeekR, or HOME to identify differentially methylated regions (DMRs) [10] [20] [19].
- Apply appropriate multiple testing correction (e.g., Benjamini-Hochberg) to control false discovery rates [10].
- Consider biological significance thresholds (e.g., ≥10% methylation difference) in addition to statistical significance [10].
Read Alignment Strategy
The reduced sequence complexity after bisulfite conversion requires specialized alignment approaches:
Frequently Asked Questions (FAQs)
Q1: Our BS-seq libraries show extremely high duplication rates (>80%). What could be causing this and how can we address it?
A: High duplication rates in BS-seq typically indicate insufficient library complexity, which can result from:
- Insufficient input DNA: Ensure you're using adequate starting material (≥500 ng for conventional WGBS) [18].
- Excessive PCR amplification: Reduce the number of PCR cycles during library amplification and optimize reaction conditions [18].
- DNA degradation: Check DNA integrity before library preparation using gel electrophoresis or bioanalyzer [22].
- Suboptimal bisulfite conversion: Consider switching to UMBS-seq, which demonstrates lower duplication rates due to reduced DNA damage [1].
Q2: We're observing low bisulfite conversion efficiency (<95%) in our spike-in controls. How can we improve this?
A: Low conversion efficiency can result from several factors:
- Suboptimal bisulfite reaction conditions: Ensure proper pH, temperature, and incubation time. UMBS-seq optimization (55°C for 90 min) may improve efficiency [1].
- Insufficient denaturation: Implement an alkaline denaturation step before bisulfite treatment to ensure complete DNA denaturation [1].
- Bisulfite reagent degradation: Prepare fresh bisulfite solutions and verify reagent quality.
- Incomplete desulfonation: Ensure proper alkaline treatment after bisulfite conversion [18].
Q3: Our mapping efficiency is consistently below 50%. What steps can we take to improve it?
A: Low mapping efficiency in BS-seq often stems from:
- Inadequate read trimming: Use TrimGalore! with appropriate parameters to remove low-quality bases and adapters [20].
- Incorrect reference genome preparation: Ensure the bisulfite-converted reference genome is properly generated using bismarkgenomepreparation [20].
- Alignment parameter optimization: Adjust Bismark parameters such as
-N(number of mismatches) and-L(seed length) [20]. - Sequence complexity issues: Consider that 10% of CpG sites may be inherently difficult to align after bisulfite conversion [11].
Q4: When should we choose enzymatic methylation sequencing (EM-seq) over conventional BS-seq?
A: EM-seq may be preferable when:
- Working with low-input or degraded samples: EM-seq and UMBS-seq both outperform conventional BS-seq with low-input DNA [1].
- Minimizing DNA damage is critical: EM-seq causes substantially less DNA fragmentation [1].
- GC bias is a concern: EM-seq demonstrates improved coverage uniformity in GC-rich regions [1].
- However, consider that EM-seq has limitations including higher cost, longer workflow, and potential enzyme instability [1].
Q5: How do we determine adequate sequencing depth for our BS-seq experiment?
A: Sequencing depth requirements depend on your research goals:
- General methylome profiling: 10-15X coverage may be sufficient for overall methylation patterns [21].
- Confident methylation calling at individual CpGs: ≥30X coverage is recommended, particularly for differential methylation analysis [21].
- Rare allele detection or heterogeneous samples: Significantly higher coverage (≥50X) may be necessary.
- Consider using coverage analysis tools in pipelines like msPIPE to assess coverage uniformity across genomic regions [20].
The Researcher's Toolkit
Table 4: Essential Reagents and Software for BS-seq Experiments
| Category | Item | Specific Examples | Function/Purpose |
|---|---|---|---|
| Wet Lab Reagents | Bisulfite Conversion Reagents | Sodium bisulfite, Ammonium bisulfite [18] [1] | Chemical conversion of unmethylated cytosines to uracils |
| Library Preparation Enzymes | Klenow Fragment, T4 DNA Ligase, PfuTurbo Cx hotstart DNA polymerase [18] | DNA end-repair, adapter ligation, and library amplification | |
| Clean-up Kits | AMPure XP beads, MinElute PCR Purification kit [18] | Size selection and purification of DNA fragments | |
| Quantification Assays | Qubit dsDNA BR Assay, TapeStation D1000 [18] | Accurate quantification and size distribution analysis | |
| Bioinformatics Tools | Quality Control | FastQC, TrimGalore!, MultiQC [20] [19] | Assessment of read quality and adapter contamination |
| Alignment Software | Bismark, BS-Seeker2, bwa-meth [10] [20] [19] | Mapping bisulfite-treated reads to reference genomes | |
| Methylation Calling | Bismark methylation extractor, MethylDackel [10] [20] | Extraction of methylation percentages at each cytosine | |
| Differential Analysis | methylKit, MethylSeekR, HOME [10] [20] [19] | Identification of differentially methylated regions | |
| Comprehensive Pipelines | msPIPE, nf-core/methylseq [20] | End-to-end analysis workflows integrating multiple tools |
Advanced Applications and Emerging Methods
Targeted Bisulfite Sequencing
For clinical applications and biomarker validation, targeted BS-seq approaches offer cost-effective alternatives:
- Custom targeted panels can reliably reproduce results from methylation arrays while enabling analysis of larger sample sets [21].
- QIAseq Targeted Methyl Panels demonstrate strong concordance with Infinium Methylation EPIC array data, particularly for tissue samples [21].
- Hybridization-based capture followed by bisulfite sequencing enables focused analysis of specific genomic regions of interest [1].
Single-Cell BS-seq Methods
Single-cell bisulfite sequencing (scBS-seq) enables methylation analysis at cellular resolution:
- Utilizes post-bisulfite adaptor tagging (PBAT) to minimize DNA loss [11].
- Involves multiple rounds of random priming and PCR amplification from single cells [11].
- Enables investigation of cellular heterogeneity in epigenetic patterns.
Multi-Omics Integration
BS-seq data can be integrated with other genomic data types:
- Combining with transcriptomics: Correlate methylation patterns with gene expression data to identify regulatory relationships [11].
- Linking with genetic variants: Simultaneous detection of genetic and epigenetic information using approaches like Illumina's 5-base solution [11].
- Chromatin state integration: Combine with ATAC-seq or ChIP-seq data to understand epigenetic mechanisms comprehensively.
The three most critical sources of technical bias in bisulfite sequencing experiments are fragmentation artifacts, adapter contamination, and incomplete bisulfite conversion. These issues can significantly compromise methylation quantification accuracy if not properly addressed.
Fragmentation Artifacts: During library preparation, DNA fragmentation creates ends that are repaired using unmethylated cytosines, introducing artificially low methylation rates at both ends of DNA fragments [23]. This "end-repair bias" is particularly problematic as these reads still map perfectly to the reference genome while providing inaccurate methylation data [23].
Adapter Contamination: When DNA fragments are shorter than the sequencing read length, sequencers read into adapter sequences [24]. This results in constitutively methylated cytosines from adapters being sequenced, biasing methylation estimates [24] [6]. This affects approximately 10-15% of RRBS reads [24].
Incomplete Bisulfite Conversion: When unmethylated cytosines fail to convert to uracils, they are misinterpreted as methylated cytosines during sequencing, creating artificially high methylation rates [23] [3]. This failure is often enriched at the 5' end of reads, likely due to re-annealing of sequences adjacent to methylated adapters during conversion [23].
Table 1: Key Technical Biases in BS-seq Experiments
| Bias Type | Primary Effect | Common Detection Method | Typical Location |
|---|---|---|---|
| End-repair bias | Artificially low methylation | M-bias plot | Both ends of DNA fragments |
| Adapter contamination | Artificially high methylation | FastQC, alignment metrics | 3' end of reads |
| Bisulfite conversion failure | Artificially high methylation | Non-CpG cytosine analysis | 5' end of reads |
| Over-amplification | Reduced complexity, bias | Duplication rate analysis | Genome-wide |
How do I detect and resolve adapter contamination in BS-seq data?
Adapter contamination occurs when sequencing extends beyond the biological DNA fragment into adapter sequences. This is especially problematic in Reduced Representation Bisulfite Sequencing (RRBS), where 10-15% of reads may be affected [24].
Detection Methods:
- FastQC: Provides visual identification of adapter sequences in sequencing reads [23] [6].
- BioAnalyzer/TapeStation: Sharp peaks around 70-90 bp indicate adapter dimers [25].
- Alignment Metrics: Unexplained low mapping efficiency may suggest adapter presence [24].
Resolution Strategies:
- Pre-alignment Trimming: Tools like Trim Galore (a wrapper for Cutadapt) or Fastx_clipper specifically remove adapter sequences [24] [26].
- Quality Assessment: Post-trimming, verify removal with FastQC and reassess library quality [3].
- Library Preparation Optimization: Accurate fragment size selection and quantification minimize adapter contamination in future experiments [25].
For RRBS data, the TRACE-RRBS method attaches adapter sequences to digitally digested fragments during alignment, facilitating more precise removal without aggressive pre-trimming that might remove biological sequences [24].
What methods effectively identify and correct end-repair biases?
End-repair bias results from the incorporation of unmethylated cytosines during the end-repair step of library preparation, creating artificially low methylation rates at fragment ends [23].
Detection with M-bias Plots: M-bias plots visualize average methylation levels at each position along sequencing reads [23]. In unbiased data, the plot appears as a horizontal line, while end-repair bias shows characteristic deviations at read ends [23]. Generate separate plots for different strand orientations and read lengths, as biases may affect them differently [23].
Automated Correction with BSeQC: The BSeQC tool automates bias detection and trimming using a statistical approach [23]:
- Calculates average methylation levels in high-quality read center positions (30-70% of read length)
- Fits a normal null distribution to these center positions
- Computes p-values for each read end position's deviation from the null
- Automatically trims positions with significant biases (p ≤ 0.01)
- Generates bias-free BAM/SAM files for downstream analysis [23]
Validation: After correction, assess improvement by examining:
- Inter-replicate concordance using Kullback-Leibler distance [23]
- Agreement between paired-end mates [23]
- M-bias plot normalization toward a horizontal line [23]
Table 2: Tools for Addressing BS-seq Technical Biases
| Tool Name | Primary Function | Bias Type Addressed | Input/Output Format |
|---|---|---|---|
| BSeQC | Quality control & bias trimming | End-repair, bisulfite conversion failure | SAM/BAM to SAM/BAM |
| Trim Galore | Adapter trimming | Adapter contamination | FASTQ to FASTQ |
| FastQC | Quality assessment | Multiple biases | FASTQ to HTML report |
| TRACE-RRBS | Targeted alignment & end-repair correction | End-repair artificial cytosines | FASTQ to methylation calls |
| Bismark | Alignment & methylation calling | General BS-seq analysis | FASTQ to BAM/coverage files |
How do I validate bisulfite conversion efficiency and address conversion failures?
Bisulfite conversion efficiency is fundamental to accurate methylation measurement, as incomplete conversion causes false positive methylation calls [3].
Validation Methods:
- Non-CpG Cytosine Analysis: In mammalian systems, non-CpG cytosines are predominantly unmethylated in most tissues. High methylation levels at these positions indicate conversion failure [23] [3].
- Spike-in Controls: Include completely unmethylated control DNA (e.g., lambda phage DNA) in your experiment. Calculate conversion efficiency as the percentage of converted cytosines in this control [3].
- Conversion Efficiency Calculation: Efficiency should typically exceed 99%, calculated as: (1 - percentage of unconverted cytosines in unmethylated regions) × 100 [3].
- PCR Controls: Amplify bisulfite-converted DNA with non-bisulfite-specific primers. Successful amplification indicates incomplete conversion [3].
Addressing Conversion Failures:
- Optimize Bisulfite Treatment: Ensure fresh bisulfite reagents, proper pH (5.0-5.2), and sufficient incubation time (typically 16-20 hours) [3].
- Prevent DNA Reannealing: Use thermocyclers with precise temperature control to prevent reannealing during conversion, which protects unmethylated cytosines from conversion [23].
- Purification: Ensure complete desulfonation after conversion to prevent carryover of bisulfite that might inhibit downstream applications [3].
What alignment-specific issues affect methylation quantification?
BS-seq alignment presents unique challenges due to the reduced sequence complexity from C-to-T conversion [11] [27].
Reduced Sequence Complexity: Bisulfite conversion reduces the four-letter genetic alphabet to three (A, T, G), increasing ambiguous mapping, particularly in repetitive regions [11] [27]. This is exacerbated in mammalian genomes with high repetitive content.
Soft-clipping Artifacts: Some aligners use soft-clipping to force ambiguous reads to align, particularly problematic for BS-seq data [27]. This can:
- Increase falsely aligned reads in repetitive regions by 80% or more [27]
- Create coverage hotspots near telomeres and centromeres [27]
- Generate incorrect methylation calls from misaligned reads [27]
Mitigation Strategies:
- Unique Alignment Requirement: Most bisulfite aligners require unique alignments, as methylation states cannot be confidently called from ambiguous mappings [27].
- MAPQ Filtering: Filter out reads with MAPQ < 40 to remove potentially misaligned reads [27].
- Appropriate Aligner Selection: Use BS-specific aligners like Bismark, BSMAP, or bwa-meth that account for bisulfite conversion [10] [24] [8].
- End-to-End Alignment: When possible, use end-to-end alignment mode rather than local alignment to prevent inappropriate soft-clipping [27].
Alignment Efficiency Expectations: Realistic alignment rates for BS-seq are approximately 86% for human and 78% for mouse data with 100bp reads [27]. Claims near 100% often indicate over-aggressive soft-clipping and potential misalignment [27].
Research Reagent Solutions for BS-seq Quality Control
Table 3: Essential Research Reagents and Tools for BS-seq QC
| Reagent/Tool | Function | Application Notes |
|---|---|---|
| Sodium Bisulfite (Fresh) | DNA conversion | Critical for efficient conversion; degrade over time |
| Unmethylated Lambda DNA | Conversion control | Spike-in control for conversion efficiency assessment |
| High-Fidelity Hot-Start Polymerases | BS-PCR amplification | Redces non-specific amplification with AT-rich converted DNA |
| Methylated Adapters | Library preparation | Prevent conversion of adapter cytosines |
| Size Selection Beads | Fragment purification | Removes adapter dimers and selects optimal insert size |
| Bisulfite Conversion Kits | Standardized conversion | Provide optimized protocols for consistent results |
| BSeQC Software | Automated bias trimming | Statistical removal of end-repair and conversion artifacts |
| Trim Galore | Adapter trimming | Wrapper for Cutadapt with automated adapter detection |
| Bismark | BS-seq alignment | Most widely used aligner for BS-seq data |
Frequently Asked Questions (FAQs)
1. What are the four strands in BS-seq, and how are they defined? In bisulfite sequencing, the four strands originate from the treatment of the two original, complementary strands of genomic DNA. After bisulfite conversion, which renders the strands non-complementary, each original strand and its complement are sequenced independently [28] [29].
- Original Top (OT) / Bisulfite Watson (BSW): This is one of the original, non-complementary strands from the genomic DNA (the "Watson" or forward strand) [29].
- Original Bottom (OB) / Bisulfite Crick (BSC): This is the other original, non-complementary strand (the "Crick" or reverse strand) [29].
- Complement to Original Top (CTOT) / Bisulfite Watson Reverse (BSWR): This strand is the complement of the Original Top (OT) strand.
- Complement to Original Bottom (CTOB) / Bisulfite Crick Reverse (BSCR): This strand is the complement of the Original Bottom (OB) strand [29].
2. What is the critical difference between directional and non-directional libraries? The key difference lies in which of these four strands are sequenced, which is determined by your library preparation protocol [28] [29].
- Directional Library: In this protocol, the sequencing reads originate from a specific, limited subset of the four strands. Typically, the first read of a pair (or every read in single-end sequencing) is known to come from either the OT or OB strand, and the second read of a pair comes from the complementary strand (CTOT or CTOB) [28]. Examples include the QIAseq Methyl Library Kit and the Illumina TruSeq DNA Methylation Kit [28].
- Non-directional Library: In this protocol, the first read of a pair can potentially originate from any of the four strands (OT, OB, CTOT, or CTOB) [28]. Consequently, you will observe reads mapping to all four strands with approximately equal frequency [29]. Examples include the Zymo Pico Methyl-Seq Library Kit [28].
3. I am observing an unexpected distribution of reads across the four strands. Is this a problem? An unexpected distribution is a critical data quality flag. If you are using a directional library protocol but your data shows a significant proportion of reads aligning to all four strands, this indicates a potential issue with the library preparation, suggesting it may have become non-directional [28] [29]. This mis-specification can lead to errors in downstream methylation calling. Always verify your library type with your protocol vendor and configure your alignment software accordingly [28].
4. How does library directionality affect the alignment process? Alignment tools must be informed about your library's directionality to map reads correctly and efficiently. For directional libraries, the aligner can restrict its search to the two relevant strands, improving accuracy and speed. For non-directional libraries, the aligner must search all four possible strands, which doubles the computational workload and RAM requirements compared to a regular DNA-seq alignment [28].
Troubleshooting Guide: Strand Distribution Issues
The following table outlines common problems, their causes, and recommended solutions related to strand distribution in BS-seq data.
| Problem | Potential Causes | Diagnostic Checks | Solutions |
|---|---|---|---|
| Unexpected strand distribution (e.g., reads on all four strands in a directional library) | Incorrect library preparation; Misconfiguration of alignment software. | Verify library kit type; Check alignment software settings for "directional" or "non-directional" parameter. | Confirm protocol with vendor; Re-run alignment with correct settings [28]. |
| Low mapping efficiency | Incorrect strand specification forcing searches in unproductive directions. | Review mapping efficiency report from aligner; Check for high rates of unaligned reads. | Ensure library type (directional/non-directional) is correctly specified in the aligner [28] [6]. |
| Bias in per base sequence content (Failed FastQC module) | Expected outcome of bisulfite conversion (C→T), not an error [30]. | Inspect the FastQC "Per base sequence content" plot for a T-rich pattern. | This is normal. Disregard the "Fail" flag from FastQC for this specific module in BS-seq data [30]. |
Visualizing the Four Strands of BS-seq
The diagram below illustrates the relationship between the original DNA strands and the four sequencing strands in a BS-seq experiment, highlighting the difference between directional and non-directional library outcomes.
The Scientist's Toolkit: Key Research Reagents & Materials
The following table details essential reagents and materials used in a typical BS-seq workflow, with a focus on the bisulfite conversion step.
| Item | Function in BS-seq | Technical Notes |
|---|---|---|
| Sodium Bisulfite / Metabisulfite [31] [32] | The active chemical that deaminates unmethylated cytosine to uracil. | Must be fresh or properly aliquoted and stored under argon to prevent oxidation [31]. |
| Hydroquinone [31] [32] | A reducing agent that prevents the oxidation of bisulfite to bisulfate, maintaining conversion efficiency. | Prepare fresh for each conversion reaction [31]. |
| NaOH (Sodium Hydroxide) [31] [32] | Used for two critical steps: DNA denaturation before conversion and desulfonation after conversion. | Must be prepared fresh to ensure effective denaturation and desulfonation [31]. |
| DNA Purification Kit (e.g., Minicolumn-based) [31] | To desalt and purify DNA after bisulfite treatment, removing the harsh chemicals before PCR. | Essential for cleaning the reaction before the desulfonation step [31]. |
| Glycogen or tRNA [31] [32] | Acts as a carrier to precipitate the often minute amounts of DNA after bisulfite conversion, improving recovery. | Particularly important when working with low input DNA [31]. |
| Desulfonation Buffer [31] | Provides the alkaline conditions (high pH) necessary to complete the conversion of cytosine intermediates to uracil. | Included in some commercial kits; otherwise, a fresh NaOH solution is used [31]. |
A Step-by-Step Pipeline for Pre-alignment and Post-alignment QC
A Technical Support Guide for BS-seq Data Quality Control
This guide addresses common challenges researchers encounter during the initial quality control and adapter trimming of Whole-Genome Bisulfite Sequencing (WGBS) data, a critical pre-alignment step for accurate methylation analysis.
Frequently Asked Questions (FAQs)
1. Why does my Trim Galore job get suspended or take extremely long to run?
This can occur with specific data types. One reported issue involved PacBio sequencing data, where the job was suspended for over a day despite output files being created [33]. For standard Illumina data, ensure your FASTQ files are not corrupted or truncated, as this can cause unexpected behavior.
2. Why does FastQC still report adapter content or other failures after running Trim Galore?
First, check the Trim Galore report to confirm that adapters were detected and trimmed. It is normal for FastQC to report warnings such as "Per base sequence content" for RNA-seq or BS-seq data due to the intrinsic biases introduced by cDNA primer binding or bisulfite conversion [34]. If adapter content remains high, your reads might contain the reverse complement of the adapter sequence, which Trim Galore does not search for by default in single-end mode [35].
3. What does the error "cutadapt: error: Line 1 in FASTQ file is expected to start with '@', but found '\n'" mean?
This error indicates a problem with your FASTQ file format [36]. The file may be truncated from an incomplete data transfer, corrupted during upload, or contain internal blank lines if multiple files were concatenated incorrectly. The error is often internal to the file, not necessarily at the very beginning.
4. What should I do if I get a "UnicodeDecodeError" when running Trim Galore?
This error, such as UnicodeDecodeError: 'utf-8' codec can't decode byte 0x8b in position 1, often suggests that a compressed (.gz) file is being read as an uncompressed text file, or vice-versa [36]. Ensure your file is correctly compressed and that its extension matches its actual format.
Troubleshooting Guide
Problem: Trim Galore Fails or Hangs
Issue: The process terminates with an error or becomes unresponsive.
Solutions:
- Check File Integrity: A corrupted or truncated FASTQ file is a common cause. Use tools like
Fastq Groomeror check the file's final lines withtailto ensure it is complete and correctly formatted [36]. - Decompress Files: On some operating systems, there can be issues with reading compressed files. Try decompressing your
.fastq.gzfiles and running Trim Galore on the uncompressed.fastqversions [35]. - Verify Adapter Presence: If unsure which adapter was used, allow Trim Galore to auto-detect it from the first million sequences. Manually specifying an incorrect adapter can lead to poor performance [33] [36].
Problem: Poor FastQC Results After Trimming
Issue: After running Trim Galore, FastQC still reports "adapter content" or shows skewed "K-mer content."
Solutions:
- Interpret FastQC Correctly:
- Adapter Content: A few random adapter matches (e.g., 10-20 counts in 1 million sequences) are statistically expected and not a cause for concern [34].
- Sequence Content & GC Content: For BS-seq and RNA-seq data, it is common to fail "Per base sequence content" and "Per sequence GC content" tests. The bisulfite conversion process, which reduces sequence complexity (changing unmethylated C's to T's), is a major contributor to this bias in WGBS data [6] [34] [37].
- Check for Reverse Complement Adapters: If high levels of adapter content persist, the reverse complement of the adapter might be present. By default, Trim Galore does not search for this in single-end mode. You may need to investigate your library preparation protocol to determine if this is a likely issue [35].
Problem: Handling Paired-End Data
Issue: Confusion about which output files to use for downstream analysis.
Solution: For paired-end data, Trim Galore creates _val_1.fq and _val_2.fq files. These are the final, validated pairs after trimming and should be used for all subsequent alignment and analysis steps. The temporary _trimmed.fq files are deleted automatically [35].
The table below summarizes common metrics and their interpretations.
| Observed Issue | Potential Cause | Recommended Action |
|---|---|---|
| Job suspended for a day [33] | Possible issue with specific data types (e.g., PacBio) or compute environment. | Monitor system resources; test on a small subset; ensure using latest software version. |
| Low adapter counts (e.g., 0.02%) [36] | Expected random matches; adapters may already be trimmed. | Proceed to alignment; no further action needed. |
| High adapter counts after trimming | Reverse complement adapter present; incorrect adapter specified. | Investigate library construction; consider manual adapter specification. |
| FastQC fails: "Per base sequence content" [34] | Known bias in BS-seq and RNA-seq data. | Expected for BS-seq data due to bisulfite conversion; can generally be ignored. |
| FastQC fails: "Overrepresented sequences" (low count, e.g., 17) [34] | Statistically insignificant; not a practical concern. | Ignore if counts are very low relative to total library size. |
| "Broken pipe" or "UnicodeDecodeError" [36] | Corrupted or improperly formatted FASTQ file. | Validate and repair the FASTQ file integrity. |
Essential Workflow for BS-seq Data
The following diagram illustrates the critical pre-alignment quality control steps for BS-seq data, incorporating checks and decision points based on common issues.
The Scientist's Toolkit: Key Research Reagent Solutions
| Tool or Reagent | Function in Pre-alignment QC |
|---|---|
| FastQC | Provides an initial quality assessment of raw sequencing reads, highlighting potential issues like adapter contamination, low-quality bases, and biased sequence composition [6] [38]. |
| Trim Galore | A wrapper tool that automates adapter trimming (using Cutadapt) and quality trimming. It is particularly useful for its ability to auto-detect common adapter sequences [33] [36]. |
| Cutadapt | The core trimming engine that performs the actual removal of adapter sequences. Trim Galore leverages this tool under the hood [33] [36]. |
| AdapterRemoval | An alternative standalone tool for comprehensive adapter trimming. It can handle both single-end and paired-end data, collapse overlapping reads, and trim low-quality bases [39]. |
| BBDuk | Part of the BBMap package, this tool can perform adapter trimming, quality trimming, and other filtering operations, and includes a built-in list of standard Illumina adapters [38]. |
Frequently Asked Questions (FAQs)
Q1: What is BSeQC and why is it a critical pre-alignment step in my BS-seq pipeline? BSeQC is a dedicated quality control (QC) package designed to evaluate and correct for technical biases specific to bisulfite sequencing (BS-seq) experiments. It is a critical step because conventional QC tools are not designed to handle BS-seq-specific issues. BSeQC ensures your data is free from technical artifacts that would otherwise lead to inaccurate methylation estimation before you proceed with alignment and downstream analysis [23].
Q2: What specific biases does BSeQC correct that other tools might miss? BSeQC is specifically designed to address two key biases intrinsic to BS-seq protocols:
- Overhang End-repair Bias: After sonication, DNA fragment overhangs are repaired using unmethylated cytosines, which introduces artificially low methylation rates at both ends of the fragments [23].
- 5' Bisulfite Conversion Failure: Caused by the re-annealing of sequences near methylated adapters, this leads to artificially high methylation rates at the 5' end of reads [23]. While other biases like residual adapters or low 3' sequencing quality are also present in other NGS data, the two above are highly specific to BS-seq [23].
Q3: My pipeline already uses FastQC. Is BSeQC still necessary? Yes, BSeQC and FastQC serve different purposes. FastQC focuses on general sequence quality (e.g., per-base sequencing quality, adaptor content, GC distribution) [23]. BSeQC, however, is focused on bisulfite-specific technical biases that affect methylation quantification directly. These biases can be present in data that passes FastQC's general checks. Using both tools provides a comprehensive QC strategy.
Q4: How does BSeQC's bias correction improve my downstream methylation results? BSeQC improves the concordance of methylation levels between biological replicates. For example, in a real paired-end mouse dataset, the use of BSeQC's bias-free output significantly increased the agreement between two read mates, especially at high methylation levels. The Kullback-Leibler distance (a measure of difference between two distributions) decreased from 0.207 to 0.129 after BSeQC trimming, indicating a substantial improvement in quantification accuracy [23].
Q5: What are the input and output file formats for BSeQC? BSeQC is designed for easy integration into existing pipelines. It takes standard SAM or BAM files as input and generates corresponding bias-free SAM or BAM files for downstream analysis [23].
Troubleshooting Guide
Issue 1: Unexpected or No Biases Detected in the M-bias Plot
Problem: After running BSeQC, the M-bias plot does not show the expected position-specific deviations, or shows no bias at all.
| Possible Cause | Diagnostic Steps | Solution |
|---|---|---|
| High-quality input DNA | Review the quality control metrics of your starting DNA. Was it intact and high-quality? | High-quality DNA and an optimized bisulfite conversion can result in minimal bias. This is an ideal outcome. Verify with other QC measures. |
| Incomplete Bisulfite Conversion | Check the non-CpG cytosine M-bias plot in BSeQC. Non-CpG cytosines should be almost completely converted; high levels of C indicate poor conversion [23]. | Troubleshoot your bisulfite conversion step: ensure fresh reagents, complete DNA denaturation, and sufficient reaction time, especially for GC-rich regions [40] [41]. |
| Incorrect Library Prep | Verify that your library preparation protocol matches the expected inputs for BSeQC (e.g., standard SAM/BAM from BS-seq aligners). | Ensure your library protocol is validated for BS-seq. BSeQC is designed to work with data from standard BS-seq protocols [23]. |
Issue 2: Poor Concordance Between Replicates After BSeQC Processing
Problem: Even after running BSeQC, the methylation levels between your technical or biological replicates show low agreement.
| Possible Cause | Diagnostic Steps | Solution |
|---|---|---|
| Insufficient Read Depth | Calculate the coverage depth at the CpG sites you are comparing. | Ensure sufficient sequencing depth. Low coverage leads to stochastic noise that obscures true biological signals. |
| Biological Variation | Check if the poor concordance is consistent across all genomic contexts or specific to certain regions (e.g., promoters, enhancers). | Some genomic regions are inherently more variable. Increase biological replication to account for this. |
| Other Technical Biases | Use BSeQC's additional functions to remove clonal reads from over-amplification and avoid double-counting of overlapped segments in paired-end reads [23]. | Enable BSeQC's full suite of filters, including clonal read removal and handling of paired-end overlaps. |
Issue 3: Errors During BSeQC Execution or File Parsing
Problem: The BSeQC tool fails to run or generates error messages related to input files.
| Possible Cause | Diagnostic Steps | Solution |
|---|---|---|
| Incorrect File Format | Validate your input SAM/BAM file using tools like samtools quickcheck. |
Ensure the input file is a properly formatted and sorted SAM/BAM file from a BS-seq aligner. |
| Corrupted or Incomplete Files | Attempt to read the file with other tools (e.g., samtools view) to check for integrity. |
Re-generate the input alignment file if it is corrupted. |
| Version Incompatibility | Check the BSeQC documentation for the required specifications of the input BAM/SAM files. | Ensure your alignment software generates files that are compatible with the version of BSeQC you are using. |
The Scientist's Toolkit: Essential Research Reagent Solutions
The following table lists key materials and their functions that are crucial for generating high-quality input for BSeQC, starting from the initial biological sample.
| Item | Function in BS-seq Workflow | Relevance to BSeQC |
|---|---|---|
| High-Quality DNA Isolation Kit (e.g., Qiagen DNeasy Blood & Tissue Kit [15]) | To obtain clean, high-molecular-weight genomic DNA. | Minimizes DNA degradation, which can exacerbate end-repair biases and complicate bias detection [40]. |
| Bisulfite Conversion Kit (e.g., Qiagen Epitect, Zymo Research EZ DNA Methylation kits [15] [42]) | To chemically convert unmethylated cytosines to uracil while leaving methylated cytosines unchanged. | Ensures high conversion efficiency, which is critical for accurate M-bias plotting. Inefficient conversion is a major source of bias [41]. |
| BS-seq Specific Aligner (e.g., BSMAP, Bismark, BWA-meth [23] [10] [43]) | To accurately map the bisulfite-converted, sequence-complexity-reduced reads to a reference genome. | Generates the standard SAM/BAM input files required by BSeQC. The choice of aligner can affect the initial mapping quality. |
Workflow Diagram: BSeQC's Role in BS-seq Bias Evaluation and Correction
The diagram below illustrates the logical workflow of the BSeQC tool within a BS-seq analysis pipeline.
Within the context of a broader thesis on BS-seq data quality control, selecting an appropriate alignment strategy is a critical pre-alignment decision that profoundly impacts all downstream results. "Three-base" aligners are specifically designed to handle the reduced sequence complexity of bisulfite-converted DNA, where unmethylated cytosines are converted to thymines. This technical support guide provides a detailed comparison and troubleshooting resource for three prominent aligners—Bismark, BWA-meth, and gemBS—to assist researchers in making informed choices and effectively resolving common experimental issues.
Aligner Comparison and Performance Metrics
Different three-base aligners employ distinct algorithmic approaches, leading to significant variations in processing speed, resource requirements, and mapping accuracy. The table below summarizes the key technical specifications and performance characteristics of each aligner.
Table 1: Technical Specifications and Performance of Three-Base Aligners
| Feature | Bismark | BWA-meth | gemBS |
|---|---|---|---|
| Core Alignment Engine | Bowtie 2 [44] | BWA-MEM [44] | GEM3 [44] |
| Primary Alignment Strategy | Alignment to four bisulfite-converted genome versions [10] | "Seed-and-extend" with SMEMs [44] | On-the-fly read conversion and "strata" grouping of seeds [44] |
| Typical RAM Requirements | 8-16 GB [44] | 8-16 GB [44] | ~48 GB [44] |
| Relative Speed | Baseline | Similar to Bismark | >7x faster than Bismark and BWA-meth [44] |
| Key Strength | Widespread use, comprehensive toolkit | Built on robust BWA-MEM algorithm | Superior speed and mapping accuracy [44] |
Troubleshooting FAQs and Guides
FAQ 1: How do I choose the right aligner for my project?
The choice depends on your project's constraints and priorities.
- Choose gemBS when you have access to sufficient RAM (~48 GB) and priority is placed on maximum speed for processing large datasets, such as whole-genome bisulfite sequencing (WGBS), without sacrificing accuracy [44].
- Choose Bismark or BWA-meth for standard computing environments with more limited RAM (8-16 GB). Bismark is a robust, all-in-one solution, while BWA-meth leverages the efficient BWA-MEM algorithm [44].
FAQ 2: My Bismark alignment is running very slowly or producing unexpected results. What should I check?
A known bug in older versions of the nf-core/methylseq pipeline (which uses Bismark) could cause the input read files to be specified twice in the command line. This results in the aligner processing the data twice, effectively doubling the runtime for single-end data and adding redundant arguments for paired-end data [45].
- Symptoms: Alignment takes approximately twice as long as expected for single-end data, though the final output BAM files are ultimately correct [45].
- Solution: Ensure you are using the most recent, patched version of the pipeline. Verify the alignment command does not list the input FASTQ files twice [45].
FAQ 3: I encounter a "Broken pipe" (IOError) when running BWA-meth. What causes this and how can I fix it?
This error typically indicates a failure in the data stream between the alignment and sorting steps, often when using older versions of the software [46] [47].
- Solution:
FAQ 4: Bismark fails with "Exiting because chromosome name already exists." How do I resolve this?
This error occurs when the genome index contains duplicate chromosome or scaffold names [48].
- Solution:
- Validate the genome FASTA file: Carefully inspect your reference genome file to ensure all chromosome and scaffold names are unique.
- Re-run genome preparation: After correcting any duplicate names, rerun
bismark_genome_preparationto build a new, valid index [48].
Essential Research Reagent Solutions
The following table lists key software and materials essential for a BS-seq alignment workflow, from read preparation to methylation calling.
Table 2: Key Research Reagents and Software Tools for BS-Seq Alignment
| Item Name | Function/Application |
|---|---|
| Bismark | End-to-end suite for aligning BS-seq reads and performing methylation calls [10]. |
| BWA-meth | A three-base aligner for BS-seq data built upon the BWA-MEM algorithm [44]. |
| gemBS | A high-speed three-base aligner for large-scale BS-seq studies [44]. |
| Trim Galore | Wrapper tool for automated quality and adapter trimming, crucial for pre-alignment QC. |
| BSeQC | Specialized tool for identifying and correcting BS-seq specific biases (e.g., end-repair, conversion failure) in aligned BAM files [23]. |
| Picard Toolkit | Provides essential utilities for manipulating aligned data, such as MarkDuplicates for PCR duplicate removal. |
| SAMtools | A fundamental toolkit for processing, indexing, and viewing aligned sequence data. |
| Methylation Caller (e.g., in Bismark) | Scripts that calculate methylation percentages at each cytosine based on C-to-T conversions in the aligned reads [10]. |
Experimental Protocols and Workflows
Standardized Workflow for Three-Base Alignment
The following diagram illustrates a generalized experimental protocol for aligning BS-seq data, applicable to Bismark, BWA-meth, and gemBS, with notes on aligner-specific steps.
Diagram Title: General Workflow for BS-Seq Data Alignment with Three-Base Aligners
Detailed Protocol Steps
Pre-Alignment Quality Control and Trimming: This critical pre-alignment step removes adapter sequences and low-quality bases. Use tools like Trim Galore (a wrapper for Cutadapt and FastQC). While some aligners perform soft-clipping, pre-trimming is still recommended for optimal results [44].
Genome Indexing: This is a one-time, aligner-specific preparation step.
- For Bismark: Use the
bismark_genome_preparationcommand to build Bowtie 2 indices for four bisulfite-converted versions of the reference genome (original, top strand C→T converted, bottom strand G→A converted, and a combined forward/reverse conversion) [10] [48]. - For BWA-meth: Use the
bwameth.py indexcommand to create a C-to-T converted version of the reference genome for the alignment process. - For gemBS: The
gembs indexcommand creates the required index, which is more resource-intensive but supports its high-speed alignment [44].
- For Bismark: Use the
Bisulfite Read Alignment: Execute the core alignment command.
Post-Alignment Processing and Quality Control:
- Deduplication: Use tools like
deduplicate_bismark(for Bismark) or Picard'sMarkDuplicatesto remove PCR duplicates [44]. - Bisulfite-Specific QC: Use specialized tools like BSeQC to identify and correct technical biases inherent to BS-seq protocols, such as end-repair bias (causing artificially low methylation at reads ends) and bisulfite conversion failure (causing artificially high methylation at read starts) [23]. BSeQC generates M-bias plots to visualize these issues and produces bias-trimmed BAM files for more accurate downstream methylation analysis [23].
- Deduplication: Use tools like
Methylation Calling: The final step involves using the aligner's extraction tool (e.g.,
bismark_methylation_extractor) or a dedicated caller to count methylated and unmethylated calls at each cytosine, producing the final methylation landscape for downstream differential analysis [10].
FAQ: PCR Duplicate Filtering in Bisulfite Sequencing
Should I remove PCR duplicates from my BS-seq data? The decision is not universal and depends on your library preparation method. For standard BS-seq libraries, duplicate removal is often recommended to mitigate artifacts from over-amplification during PCR. However, if your protocol incorporates Unique Molecular Identifiers (UMIs), you should use the UMI information to identify and remove true PCR duplicates. For other protocols, consult the specific recommendations for your library type [50] [51].
What is the risk of removing duplicates based only on mapping coordinates? Removing duplicates based solely on their genomic mapping coordinates (e.g., using tools like Picard MarkDuplicates) is considered overly aggressive and can introduce substantial bias [52]. This method cannot distinguish between:
- Technical duplicates: Multiple reads from a single original molecule due to PCR amplification.
- Biological duplicates: Multiple, independent molecules that happen to map to the same genomic location, which is common for highly expressed short transcripts or small RNAs [52] [50]. Removing biological duplicates can lead to an under-representation of these features in your data.
How do UMIs help with accurate duplicate removal? UMIs are short random nucleotide sequences added to each molecule during library preparation. Before amplification, every original molecule is tagged with a unique UMI. During analysis, reads that share both the same mapping coordinates and the same UMI are identified as true PCR duplicates originating from a single molecule. This allows for precise duplicate removal without discarding biologically meaningful reads [52].
What factors influence the rate of PCR duplicates? The frequency of PCR duplicates is primarily determined by:
- The amount of starting material (lower input leads to higher duplicate rates).
- The sequencing depth (deeper sequencing increases the chance of sampling duplicates) [52]. Contrary to common belief, the number of PCR cycles alone is not a major determining factor when these other variables are considered [52].
Troubleshooting Guide: Assessing Mapping Efficiency
Problem: Low mapping efficiency after bisulfite alignment. Low mapping efficiency is a common challenge in BS-seq due to the reduced sequence complexity from C-to-T conversion [53] [11].
| Potential Cause | Description | Solution |
|---|---|---|
| Inadequate Read Trimming | Adapter sequences or low-quality bases at read ends interfere with alignment. | Re-run quality control (e.g., FastQC) and perform adapter/quality trimming before alignment [54]. |
| Overly Strict Alignment Parameters | The aligner is not allowing for the expected number of mismatches from bisulfite conversion. | Consider adjusting the aligner's parameters. For Bismark with Bowtie 2, you can modify the seed mismatch count (-N) and seed length (-L) [54]. |
| High Levels of DNA Degradation | Bisulfite treatment can degrade DNA, leading to shorter, harder-to-map fragments [11]. | Use fluorometric quantification to assess DNA integrity before library prep and use fresh, high-quality DNA. |
| Incorrect Library Type Specification | Using "directional" parameters for a "non-directional" library, or vice versa. | Confirm your library preparation protocol and specify the --non_directional flag in Bismark if your library is non-directional [54]. |
Problem: High duplicate rate in the aligned data. A high rate of duplicates indicates potential issues with library complexity.
| Potential Cause | Description | Solution |
|---|---|---|
| Insufficient Input DNA | Low starting material results in lower library complexity, making over-amplification and duplicates more likely. | Increase input DNA if possible, or use protocols designed for low input, such as those incorporating UMIs [52] [25]. |
| Over-amplification during PCR | Too many PCR cycles exponentially amplifies a small number of original molecules. | Optimize library preparation by using the minimum number of PCR cycles necessary [25]. |
| Pervasive Bias from Coordinate-Only Deduplication | What appears to be a high duplicate rate may be an artifact of the removal method itself. | If you do not have UMIs, be cautious in interpreting duplicate rates. For RNA-seq data, the general recommendation is to not remove duplicates without UMIs [50] [51]. |
Experimental Protocols for Key Analyses
Protocol: Incorporating and Analyzing UMIs in Sequencing Libraries
- Library Preparation: Use custom adapters that contain stretches of random nucleotides (e.g., 5-10 nt) during the ligation step. Each original molecule is tagged with a random UMI sequence [52].
- Sequencing: Sequence the library as usual. The initial sequencing cycles will read the UMI before reaching the biological sequence.
- Data Preprocessing: Use tools like
UMI-toolsto extract UMI sequences from the read headers and associate them with each read. - Deduplication: After alignment, group reads by their genomic coordinates and UMI sequence. Within each group, retain only one read as the unique original molecule and flag the rest as PCR duplicates [52] [50].
Protocol: Using BSeQC for BS-Seq Specific Bias Trimming BSeQC automates the trimming of technical biases specific to BS-seq protocols [23].
- Input: Provide your aligned data in SAM/BAM format to BSeQC.
- M-bias Assessment: The tool generates M-bias plots, which show the average methylation level at each position in the read. In an ideal, unbiased library, this plot should be a horizontal line.
- Statistical Trimming: BSeQC uses the read center positions (assumed to be high-quality) to establish a null distribution for methylation levels. Read end positions that significantly deviate from this distribution are automatically trimmed.
- Output: The tool produces a new, bias-free BAM file for downstream methylation calling [23].
Workflow Diagram: Post-Alignment Filtering Decision Process
The Scientist's Toolkit: Essential Research Reagents and Software
| Tool or Reagent | Function in PCR Duplicate Filtering & QC |
|---|---|
| UMI Adapters | Custom oligonucleotides containing random nucleotide stretches that tag each original molecule with a unique barcode before PCR amplification [52]. |
| Bismark | A widely used aligner for bisulfite-converted reads. It performs alignment and methylation calling in one step and its output can be used for subsequent duplicate marking [54]. |
| BSeQC | A quality control tool specifically designed for BS-seq data. It evaluates and trims technical biases like end-repair artifacts and bisulfite conversion failure, which can improve methylation quantification [23]. |
| UMI-Tools | A software package for handling UMI data. It extracts UMIs from read headers and performs accurate, UMI-aware deduplication [50]. |
| Picard Tools | A general-purpose toolkit for NGS data. Its MarkDuplicates function is commonly used for coordinate-based duplicate marking, though its limitations for RNA-seq and small RNA-seq should be noted [52] [55]. |
| FastQC | A quality control tool that provides an initial assessment of raw sequencing data, helping to identify issues like adapter contamination or low-quality bases that can affect mapping efficiency [54]. |
What is an M-bias plot and why is it critical for BS-seq quality control?
An M-bias plot is a diagnostic graph that visualizes the average DNA methylation level at each position along the length of sequencing reads [23]. In BS-seq experiments, methylation levels are expected to be independent of read positions under ideal conditions. The "M" stands for methylation, and the "bias" refers to any systematic deviation from this expected uniform distribution.
These plots are critical because they reveal technical artifacts that can compromise methylation data quality. Such biases, if uncorrected, lead to inaccurate methylation estimation and can invalidate downstream biological conclusions [23]. M-bias plots specifically help diagnose two major BS-seq-specific technical issues:
- End-repair bias: Artificially low methylation rates at both ends of DNA fragments caused by the use of unmethylated cytosines during the end-repair step of library preparation [23].
- Bisulfite conversion failure: Artificially high methylation rates at the 5' end of reads, often caused by the re-annealing of sequences adjacent to methylated adapters during bisulfite conversion [23].
How is an M-bias plot generated?
The generation of an M-bias plot involves counting methylation states at each read position. For every cytosine in a uniquely aligned read, bioinformatics tools record its relative position in the read and its methylation state (methylated as C, unmethylated as T). For a given SAM/BAM file, all records are piled up, and the mean methylation level is calculated and plotted for each read position [23].
Different strands and read lengths can exhibit distinct biases; therefore, it is considered best practice to generate separate M-bias plots for different strand and read-length configurations [23]. The following workflow outlines the core process, which is implemented by tools like Bismark and BSeQC:
How do I interpret common patterns in M-bias plots?
Interpreting an M-bias plot involves recognizing specific deviation patterns from a horizontal line and linking them to potential technical causes. The table below summarizes common patterns, their interpretations, and recommended actions.
Table 1: Troubleshooting Guide for Common M-bias Plot Patterns
| Observed Pattern | Potential Technical Cause | Biological Implication | Recommended Action |
|---|---|---|---|
| Drop in methylation at the very beginning (5') of Read 2 in paired-end sequencing [56] | "Filled-in" unmethylated cytosines during the end-repair step of library preparation [56]. | Artificial under-representation of methylation at these positions, introducing hundreds of thousands of incorrect calls [56]. | Trim the affected bases from the 5' end of Read 2 using a tool like BSeQC or Trim Galore! [56]. |
| Gradual decrease in total cytosine calls (CHG, CHH) across the length of Read 2 in paired-end sequencing [56] | The --no_overlap option in Bismark, which avoids double-counting methylation in fragment overlap regions by using only Read 1 data for overlaps [56]. |
No biological implication; this is a computational correction. The drop reflects fewer total C's being counted, not a real change in methylation levels [56]. | This is expected behavior. Use --no_overlap as recommended. Re-run with --include_overlap for diagnosis only [56]. |
| Spike in methylation at the 5' end of reads [23] | 5' bisulfite conversion failure, likely due to re-annealing of sequences adjacent to methylated adapters [23]. | Artificial overestimation of methylation levels at the 5' end. | Trim the biased positions from the 5' end using a dedicated BS-seq QC tool [23]. |
| Drop in methylation at the 3' end of reads [23] | Sequencing into the adaptor sequence or low sequencing quality at the 3' end [23]. | Artificial under-representation of methylation at the 3' end. | Trim the biased positions from the 3' end; ensure thorough adapter trimming prior to alignment [23]. |
What tools can I use to generate and correct for M-bias?
Several bioinformatics tools can generate M-bias plots and, in some cases, perform automated trimming to correct identified biases. The key is to use tools specifically designed for BS-seq data, as general NGS QC tools will not detect these specific artifacts [23].
Table 2: Research Reagent Solutions for M-bias Analysis
| Tool / Resource | Primary Function | Key Features / Explanation | Reference/Link |
|---|---|---|---|
| Bismark | Alignment & Methylation Calling | Its bismark_methylation_extractor function automatically generates M-bias report text files and plots as part of its standard output [56] [57]. |
Bismark User Guide |
| BSeQC | Dedicated BS-seq QC | Comprehensively evaluates BS-seq technical biases and uses a statistical cutoff to automatically trim nucleotides with significant biases, producing a "bias-free" BAM file [23]. | BSeQC Google Code Page |
| MethylDackel | Methylation Caller | A modern tool that can be used as an alternative to Bismark's methylation extractor and is recommended by some bioinformaticians for generating methylation counts [57]. | GitHub Repository |
| BWA-meth | Three-base Aligner | An aligner for bisulfite data that uses BWA-MEM. It produces standard SAM/BAM but requires external tools like MethylDackel for methylation calling and QC [58]. | GitHub Repository |
What are the best practices for mitigating bias identified in M-bias plots?
A systematic approach to M-bias ensures data integrity. The best practices are:
- Always Generate Plots: Make M-bias plots a non-negotiable step in every BS-seq analysis pipeline.
- Stratify Your Data: Generate separate plots for different read orientations (e.g., OT, OB, CTOT, CTOB) and read lengths, as biases can be strand-specific [23].
- Inspect Non-CpG Contexts: Use non-CpG cytosine M-bias plots to detect bisulfite conversion failure more clearly, as non-CpG cytosines are expected to be almost completely unconverted in most contexts [23].
- Trim Systematically: Use statistical methods, rather than arbitrary trimming (e.g., "first 3 bases"), to decide which positions to trim. Tools like
BSeQCautomate this by comparing the methylation level of each position to a NULL distribution derived from high-quality central read positions (e.g., 30-70% of read length) and trimming positions with a significant deviation (e.g., P ≤ 0.01) [23]. - Validate with Replicates: Use the concordance of methylation levels between technical replicates to validate that bias correction has improved data quality [23].
Methylation Calling and Generating Coverage Files for Downstream Analysis
Troubleshooting Guide: Common Issues in Methylation Calling
FAQ: What are the most common issues during methylation calling and how can they be resolved?
| Issue | Cause | Solution |
|---|---|---|
| Appearance of non-CpG sites in CpG coverage files | Potential aligner bug or misclassification of cytosines in different sequence contexts [59]. | Validate a subset of problematic sites by checking the reference genome sequence to confirm the cytosine context. Consider updating to the latest version of your alignment software [59]. |
| Overestimation of methylation levels | Incomplete bisulfite conversion, where unmethylated cytosines fail to convert to uracils, making them appear as methylated [6] [13]. | Use spike-in controls (e.g., unmethylated lambda DNA) to monitor conversion efficiency. For DNA, consider Ultrafast BS-seq (UBS-seq) which reduces this bias [13]. |
| Low genome coverage or high duplicate reads | Severe DNA degradation during traditional bisulfite treatment or excessive PCR amplification during library prep [6] [13]. | Optimize library preparation protocol. For low-input samples, consider post-bisulfite adapter tagging (PBAT) or enzymatic methods (EM-seq) to reduce damage [6]. |
| Unstable parameter estimates in differential methylation | Methylation levels near 0 or 1 (boundaries) in many CpG sites, causing statistical models to fail [9]. | Use statistical methods with arcsine link function (e.g., in DSS package) that are more stable for data at the boundaries, instead of standard logit link functions [9]. |
FAQ: My coverage files contain loci with very low read counts. Should I filter them?
Yes, filtering is a standard and crucial step. Including sites with low coverage can make methylation level estimates unreliable and introduce noise into downstream analyses.
- Recommended Threshold: A common practice is to include only CpG sites with a minimum read coverage of 10x [10] [60]. This threshold can be adjusted based on the overall depth of your sequencing data.
- Implementation: This filtering is easily performed by tools like
methylKit(using thefilterByCoveragefunction) or by setting themincovparameter in PiGx BSseq [10] [60].
Essential Protocols for Reliable Analysis
Protocol: Standard Workflow for Generating Methylation Coverage Files
This protocol outlines the key steps for processing Bisulfite-Sequencing (BS-seq) data from raw reads to coverage files ready for downstream analysis [10] [61] [60].
Step-by-Step Methodology:
- Quality Control and Trimming: Process raw FASTQ files with tools like
Trim Galore!to remove low-quality bases and adapter sequences. This step is critical for BS-seq data due to reduced sequence complexity after bisulfite conversion [61] [60]. - Bisulfite-Aware Alignment: Map the trimmed reads to a reference genome using a specialized "three-base" aligner.
- Bismark: Considered the gold standard. It performs in-silico bisulfite conversion of reads and the reference genome and uses Bowtie2 or HISAT2 for alignment. It provides comprehensive methylation calling and QC reports [61].
- BWA-meth: Generally faster than Bismark. It uses the BWA-MEM algorithm and streams converted reads to the aligner on the fly, reducing temporary storage needs [61].
- Post-Alignment Processing: This typically involves sorting alignment files and removing PCR duplicates using tools like
samblasterorsamtools. Deduplication is crucial for WGBS to avoid inflated confidence in methylation signals, though it is often skipped for RRBS data due to the nature of the protocol [61] [60]. - Methylation Calling: Extract methylation information for each cytosine in the genome.
Protocol: Best Practices for Bisulfite Conversion
The core of BS-seq is the bisulfite conversion reaction. Recent advancements highlight key considerations for optimal results [6] [13].
Key Improvements in Protocol:
- Ultrafast BS-seq (UBS-seq): This method uses highly concentrated ammonium bisulfite/sulfite reagents at high temperatures (98°C) to complete the conversion reaction in approximately 10 minutes, compared to several hours for conventional kits [13].
- Advantages: UBS-seq significantly reduces DNA degradation and results in less overestimation of methylation levels, providing higher genome coverage, especially from low-input samples like cell-free DNA or embryonic stem cells [13].
- Library Preparation:
- Pre-bisulfite Protocols: Adapter ligation before conversion. Can require large DNA input (≥5 µg) and suffers from biased fragmentation [6].
- Post-bisulfite Protocols (e.g., PBAT): Adapter ligation after conversion. Requires less starting material (as low as 100 ng for mammalian genomes), reduces coverage bias, and is better for low-biomass samples [6].
The Scientist's Toolkit: Research Reagent Solutions
Table: Essential Computational Tools for BS-seq Analysis
| Tool/Function | Primary Use | Key Feature |
|---|---|---|
| Bismark | Bisulfite-aware read alignment and methylation calling | Gold standard; performs multiple in-silico alignments to resolve strand ambiguity; integrated QC [61]. |
| BWA-meth | Bisulfite-aware read alignment | Faster alignment leveraging BWA-MEM; requires external methylation caller (e.g., MethylDackel) [61]. |
| methylKit (R package) | Downstream differential methylation analysis | Loads coverage files, performs filtering, quality control, and identification of differentially methylated regions [10]. |
| DSS (R package) | Differential methylation analysis for general experimental designs | Uses a beta-binomial model with a powerful 'arcsine' link function for stable estimation, ideal for complex designs [9] [62]. |
| ViewBS | Visualization of methylation data | Generates publication-quality figures like meta-gene plots, heatmaps, and violin-boxplots from coverage files [63]. |
| nf-core/methylseq | End-to-end workflow | A standardized, portable Nextflow pipeline that wraps tools like Bismark/BWA-meth for reproducible analysis [61]. |
| PiGx BSseq | Integrated preprocessing and analysis pipeline | A comprehensive workflow from FASTQ to differential methylation, including quality control and final reporting [60]. |
Table: Key Experimental Reagents and Kits
| Item | Function in BS-seq | Consideration |
|---|---|---|
| Sodium Bisulfite | Chemical conversion of unmethylated cytosine to uracil. | Standard reagent; can cause significant DNA degradation with prolonged incubation [6]. |
| Ammonium Bisulfite/Sulfite | Core of UBS-seq; allows for highly concentrated bisulfite reagent. | Enables faster reaction times, reducing DNA degradation and improving conversion efficiency [13]. |
| Unmethylated Lambda DNA | Spike-in control for assessing bisulfite conversion efficiency. | Essential for quantifying the background non-conversion rate and identifying false positives [61]. |
| EM-seq Kit | Enzymatic conversion as an alternative to bisulfite treatment. | Reduces DNA damage and improves coverage uniformity compared to traditional BS-seq [6]. |
Solving Common BS-seq QC Problems and Optimizing Computational Workflows
Diagnosing and Correcting Incomplete Bisulfite Conversion Using Spike-in Controls
FAQ: The Role of Spike-in Controls in Bisulfite Sequencing
What are spike-in controls and why are they used in BS-seq? Spike-in controls are known quantities of synthetic DNA with a predefined methylation status (either fully methylated or completely unmethylated) that are added to a sample prior to bisulfite conversion [3]. They serve as an internal experimental control, allowing researchers to directly monitor the efficiency and completeness of the bisulfite conversion process in each individual library [3]. By comparing the sequenced methylation status of these controls to their known status, you can obtain a quantitative measure of conversion efficiency, which is crucial for validating data quality.
How do spike-ins help diagnose incomplete conversion? Incomplete bisulfite conversion is a major source of artifacts and false positives in BS-seq data, as unconverted unmethylated cytosines can be misinterpreted as methylated cytosines [64]. Spike-in controls provide an direct measure of this. After sequencing, you analyze the spike-in sequences. In a successfully converted library, the unmethylated spike-in control should show a methylation level of 0% (all Cs converted to Ts), and the fully methylated control should show a level of 100% (all Cs remaining as Cs). Any deviation from these expected values, such as a 5% methylation level in the unmethylated control, indicates incomplete conversion and provides a quantitative estimate of the error rate in your data [3] [64].
What are the limitations of using spike-in controls? While highly valuable, spike-in controls only report on the conversion efficiency of the specific DNA fragments they contain. If the experimental sample DNA is of lower quality or more heavily fragmented than the spike-ins, the conversion efficiency for the sample might differ. Therefore, spike-ins are a necessary, but not always sufficient, control for overall data quality.
Troubleshooting Guide: Incomplete Bisulfite Conversion
Symptoms and Diagnosis
| Symptom | How to Detect | Underlying Cause |
|---|---|---|
| Artifactual Methylation | Higher-than-expected methylation levels, especially in known unmethylated regions [64]. | Failure of sodium bisulfite to deaminate unmethylated cytosines to uracils. |
| Failed Spike-in Control Metrics | Unmethylated spike-in control does not show ~0% methylation; methylated control does not show ~100% methylation [3]. | Inefficient bisulfite conversion chemistry. |
| Inconsistent Results | Poor reproducibility between technical replicates [64]. | Variable conversion efficiency due to protocol inconsistencies. |
Table 1: Key symptoms and causes of incomplete bisulfite conversion.
Corrective and Preventative Actions
1. Optimize Sample DNA Quality and Purity The presence of contaminants in your DNA sample can inhibit the bisulfite reaction. Ensure that your DNA is pure and free of proteins, RNA, and other contaminants [64]. Particulate matter in the conversion reaction should be removed by centrifugation, using only the clear supernatant for conversion [65].
2. Adhere to Optimized Conversion Protocols Closely follow the manufacturer's instructions if using a commercial bisulfite conversion kit. For in-lab protocols, ensure that the reaction is performed under the correct conditions of temperature, pH, and incubation time [64]. A standard protocol involves incubating denatured DNA in a fresh bisulfite solution for several hours, typically between 4-16 hours, often with thermal cycling [64]. After conversion, a thorough desulfonation step is critical to clean the sample [3] [64].
3. Use High-Input DNA Amounts and Avoid Over-fragmentation Bisulfite treatment is harsh and causes DNA fragmentation and degradation [66] [11]. Using the recommended DNA input amount for your chosen protocol (e.g., 50 ng to 2 μg for some genomic DNA protocols) helps ensure sufficient recovery of converted DNA [65] [64]. While shearing or digesting DNA can sometimes help, excessive fragmentation can lead to loss of material [64].
4. Verify with Multiple Controls In addition to commercial spike-in controls, you can use internal biological controls. These include amplifying a known unmethylated genomic region or a gene subject to imprinting (e.g., on the X chromosome), which provides one methylated and one unmethylated allele per cell [15].
Quantitative Data from Controls
Table 2: Interpretation of spike-in control results and recommended actions.
| Control Type | Expected Methylation Level | Result Indicating Incomplete Conversion | Implication for Experimental Data |
|---|---|---|---|
| Unmethylated Spike-in | 0% | >0% (e.g., 5%, 10%) | All methylation calls are overestimated; the reported value should be adjusted down by the observed error rate. |
| Methylated Spike-in | 100% | <100% (e.g., 95%, 90%) | The conversion process may be overly harsh, but this is a less common artifact. |
Experimental Protocol: Implementing Spike-in Controls
Materials Needed:
- Fully methylated genomic DNA control (e.g., from CpG methylase-treated DNA)
- Fully unmethylated genomic DNA control (e.g., from whole genome amplification)
- Commercial unmethylated and methylated spike-in control sets (available from various epigenetics suppliers)
Methodology:
- Spike-in Addition: Prior to library preparation, spike a small, known amount (e.g., 0.1-1%) of the control DNA into your experimental sample [3].
- Library Preparation: Proceed with your standard BS-seq library preparation protocol, including bisulfite conversion, adaptor ligation, and PCR amplification [3] [11].
- Sequencing and Data Processing: Sequence the library. During the data analysis, separate the sequencing reads originating from the spike-in controls from the reads of your experimental genome.
- Efficiency Calculation: Align the spike-in control reads to their reference sequences. Calculate the percentage of cytosines (at non-CpG sites for unmethylated control, and at all cytosine contexts for methylated control) that were correctly converted or remained unchanged.
- Data Quality Decision: Establish a quality threshold for your experiment (e.g., >99% conversion efficiency for the unmethylated control). If the efficiency falls below this threshold, the data set may require correction or should be repeated.
Workflow: Integrating Spike-in Controls for BS-seq QC
The following diagram illustrates the integration of spike-in controls into a standard BS-seq workflow for pre-alignment and post-alignment quality assessment.
The Scientist's Toolkit: Essential Reagents for BS-seq Quality Control
Table 3: Key research reagents and materials for implementing spike-in controls and ensuring high-quality BS-seq.
| Item | Function in Experiment | Key Considerations |
|---|---|---|
| Synthetic Spike-in Controls | Provides an internal, quantitative standard for measuring bisulfite conversion efficiency [3]. | Select controls that are compatible with your organism's genome and have a sequence distinct from it. |
| Commercial Bisulfite Kits | Provides optimized reagents and protocols for efficient and consistent bisulfite conversion and cleanup [65] [15]. | Look for kits with high reported conversion efficiency and compatibility with your DNA input amount. |
| Hot-Start Taq Polymerase | Amplifies bisulfite-converted DNA with high fidelity and reduced non-specific amplification [65] [3]. | Proof-reading polymerases are not recommended as they cannot read through uracil [65]. |
| DNA Purification Kits | Purifies DNA before conversion and cleans up the reaction afterwards, removing contaminants and salts [15]. | Efficient cleanup after bisulfite treatment (desulfonation) is critical for downstream steps [3]. |
Addressing End-Repair Bias and 5' Bisulfite Conversion Failure Artifacts
Frequently Asked Questions (FAQs)
What are end-repair bias and 5' bisulfite conversion failure, and why are they problematic in BS-seq data? End-repair bias and 5' bisulfite conversion failure are two technical artifacts specific to bisulfite sequencing protocols. End-repair bias occurs when unmethylated cytosines are used during the library end-repair step, making the filled-in bases appear artificially unmethylated after sequencing [23] [67]. 5' bisulfite conversion failure is an enrichment of artificially high methylation rates at the 5' end of reads, likely caused by the re-annealing of sequences adjacent to methylated adapters during conversion [23]. Both artifacts introduce inaccuracies in methylation level estimation, adding noise and potential false discoveries to downstream analyses.
How can I detect these artifacts in my own BS-seq datasets? The primary method for detection is the M-bias plot, which visualizes the average DNA methylation level for each position in the sequencing read [23] [67]. In an ideal, bias-free dataset, this plot should appear as a horizontal line, indicating that methylation levels are independent of read position. Deviations from this horizontal line at the read ends are indicative of technical artifacts:
- A sharp drop in methylation at the start of Read 2 in paired-end sequencing suggests end-repair bias [67].
- Artificially high or low methylation rates at the 5' end of reads suggest 5' bisulfite conversion failure [23].
What are the best practices for preventing 5' bisulfite conversion failure during the wet-lab phase? To ensure high bisulfite conversion efficiency:
- Use a validated bisulfite conversion kit and follow the manufacturer's protocol precisely [68].
- Prepare the CT Conversion Reagent fresh before each use and protect it from light and oxygen [68].
- Perform the conversion in a thermal cycler with a heated lid, ensure samples are mixed thoroughly, and spin down tubes completely to prevent precipitation [68].
- Use high-quality, intact input DNA and accurately quantify it with a dsDNA-specific method (e.g., Qubit or Picogreen) [68].
Troubleshooting Guides
Identification and Diagnosis
The first step in troubleshooting is to generate M-bias plots for your aligned BAM/SAM files. This can be done using dedicated quality control tools like BSeQC [23] or the bismark2report utility from the Bismark suite [67]. These tools generate separate plots for different DNA strands and read lengths, which is crucial as biases can be strand-specific [23].
Table 1: Signature Patterns of Common BS-seq Artifacts
| Artifact | Typical Location in Read | Signature in M-bias Plot | Underlying Cause |
|---|---|---|---|
| End-Repair Bias [67] | Start of Read 2 (paired-end) | Sharp drop in methylation (%) | Fill-in of 5' overhangs with unmethylated cytosines during library prep |
| 5' Bisulfite Conversion Failure [23] | 5' end of reads | Artificially high methylation (%) | Re-annealing of sequences near methylated adapters during conversion |
| 3' Low Quality/Adapter [23] | 3' end of reads | Deviation in methylation level | Residual adapters or low sequencing quality not fully removed by trimming |
The following diagram illustrates the experimental workflow of a typical directional BS-seq library preparation, highlighting the steps where these artifacts are introduced.
Computational Mitigation and Correction
After identifying biases, you can mitigate them computationally during data processing.
For End-Repair Bias:
- The most straightforward solution for paired-end data is to trim a few bases from the start of Read 2 during methylation extraction. For example, using the Bismark methylatio n extractor with the
--ignore_r2 2flag will ignore the first 2 bases of Read 2, effectively removing the spurious hypomethylation signal [67]. The exact number of bases to trim can be determined from the M-bias plot.
For 5' Bisulfite Conversion Failure and General Bias Trimming:
- Tools like BSeQC implement an automated, statistical approach to trimming. Instead of arbitrarily trimming a fixed number of bases, BSeQC uses a statistical cutoff (e.g., P ≤ 0.01) to evaluate the deviation of methylation levels at each read end position from the high-quality read center (typically 30–70% of read length). It then automatically trims all biased positions and generates a bias-free BAM file for downstream analysis [23].
Table 2: Summary of Computational Solutions for BS-seq Artifacts
| Tool/Function | Recommended Use | Key Parameter(s) | Output |
|---|---|---|---|
| Bismark Methylation Extractor [67] | Mitigate end-repair bias in PE data | --ignore_r2 <N> |
Methylation calls with R2 start bases ignored |
| BSeQC [23] | Comprehensive bias assessment and trimming | User-defined statistical cutoff (e.g., P=0.01) | Bias-free SAM/BAM file |
| Manual Trimming | Pre-alignment removal of biased ends | Determined from M-bias plot | Trimmed FASTQ files |
The logic flow for diagnosing and correcting these artifacts is summarized in the following troubleshooting pathway.
The Scientist's Toolkit: Key Research Reagents and Materials
Table 3: Essential Materials for Robust BS-seq Experiments
| Item | Function/Description | Considerations for Avoiding Bias |
|---|---|---|
| Validated Bisulfite Kits (e.g., EZ DNA Methylation Kit) [68] | Chemical conversion of unmethylated C to U. | Use kits validated for your platform (e.g., Illumina arrays); follow incubation protocols exactly. |
| High-Quality Input DNA | Starting material for library prep. | Use intact DNA; quantify via dsDNA-specific methods (Qubit). Degraded DNA requires higher input [68]. |
| Unmethylated Cytosines | Standard nucleotides for end-repair reaction. | Source of end-repair bias; cannot be avoided, so computational mitigation is essential [67]. |
| Methylated Adapters | Oligonucleotides for sample indexing and sequencing. | Can contribute to 5' conversion failure; ensure proper bisulfite conversion conditions [23]. |
| λ-Phage DNA | Spike-in control for bisulfite conversion efficiency. | Should be fully unconverted; provides a quantitative measure of conversion success (>99%) [69]. |
| BSeQC Software [23] | Post-alignment quality control and bias trimming. | Uses statistical testing for unbiased trimming, superior to fixed base trimming. |
Whole-genome DNA methylation sequencing at single-base resolution is a powerful tool for epigenetics research. However, when working with low-input DNA samples, such as those from biopsies, liquid biopsies, or limited cell populations, choosing and optimizing the right library preparation method is critical for success. This guide addresses key considerations for three prominent low-input protocols: Post-Bisulfite Adaptor Tagging (PBAT), Tagmentation-based Whole-Genome Bisulfite Sequencing (T-WGBS), and Enzymatic Methyl-seq (EM-seq). The content is framed within a comprehensive thesis on bisulfite sequencing data quality control, encompassing both pre- and post-alignment analysis.
Frequently Asked Questions (FAQs)
1. For low-input DNA samples (1-10 ng), which method generally provides superior library and sequencing quality?
Comparative studies indicate that EM-seq generally outperforms PBAT for low-input DNA in the 1-10 ng range. EM-seq demonstrates better library and sequencing quality, including larger insert sizes, higher alignment rates, and higher library complexity with a lower duplication rate [70]. Furthermore, EM-seq shows higher CpG coverage, better overlap of CpG sites between samples, and higher consistency across a series of input amounts [70]. While PBAT remains a viable option, especially for extremely low inputs approaching single-cell levels, EM-seq's enzymatic conversion process avoids the DNA fragmentation inherent to bisulfite treatment, leading to more robust results for low-input samples [71].
2. What are the primary sources of DNA damage and bias in low-input protocols, and how can they be mitigated?
The primary source of DNA damage differs by protocol:
- Bisulfite-based Methods (PBAT, T-WGBS): The harsh chemical treatment of sodium bisulfite causes substantial DNA degradation and fragmentation, which is the major drawback [70] [72]. This leads to sample loss, lower library complexity, and higher duplication rates. Mitigation strategies include using optimized bisulfite conversion kits and protocols designed for low inputs, such as PBAT, which tags the DNA after conversion to avoid further degradation of adaptor-ligated fragments [72].
- Enzyme-based Method (EM-seq): This method circumvents bisulfite-induced damage by using a cocktail of enzymes (TET2 and APOBEC) to distinguish methylated from unmethylated cytosines [70] [71]. This results in significantly less DNA fragmentation and loss, making it particularly advantageous for low-input and precious samples [70].
3. How do protocol choices impact downstream data processing and analysis?
The library preparation method directly influences the data processing workflow:
- Read Trimming: PBAT libraries often require specific base clipping from the read ends (e.g.,
--clip_r1 9 --clip_r2 9in Bismark) due to their random priming-based library construction [70]. - Alignment and Methylation Calling: Specialized bioinformatics pipelines like nf-core/methylseq are essential. They must be configured for the specific protocol used. For example, the
--pbatflag is used for PBAT data, while the--em_seqparameter is required for processing EM-seq data, which typically generates longer fragments [70]. It is critical to select a workflow that is validated for your specific protocol to ensure accurate alignment and methylation calling [72].
4. Can the standard WGBS workflow be used for low-input DNA?
Using the standard WGBS workflow with DNA input below the recommended amount (typically 100 ng+) results in lower library yields and potential failure. While libraries may be generated, their quality will be compromised [73]. For low-input samples (e.g., 25-99 ng), it is mandatory to use a dedicated low-input library protocol, and the final library yield must be assessed by qPCR before pooling for sequencing, as normalization is not reliably achieved [73].
Troubleshooting Guides
Common Issues and Solutions for Low-Input Methylation Sequencing
| Problem | Potential Causes | Recommended Solutions |
|---|---|---|
| Low Library Complexity / High Duplication Rate | - Severe DNA fragmentation (BS-based methods).- Insufficient input DNA.- Over-amplification by PCR. | - Switch to an enzymatic method like EM-seq [70].- Optimize bisulfite conversion time/temperature (for PBAT/T-WGBS) [72].- Reduce the number of PCR amplification cycles [70]. |
| Low Alignment Rate | - Inadequate read trimming.- Incorrect workflow configuration for the protocol.- High levels of adapter contamination. | - Use appropriate trimming parameters (e.g., clip first 9bp for PBAT) [70].- Ensure the bioinformatics pipeline uses the correct flags (e.g., --pbat or --em_seq) [70].- Verify the efficiency of size selection and adapter removal steps. |
| Insufficient CpG Coverage | - Low library complexity.- Biased GC coverage (especially in WGBS).- Inadequate sequencing depth. | - Use EM-seq for more uniform GC-rich region coverage [71].- Increase input DNA if possible.- Sequence to a greater depth. |
| Inconsistent Methylation Levels Between Replicates | - High technical variation from low-input protocol.- Inconsistent bisulfite conversion efficiency. | - Use EM-seq for higher consistency between input amounts [70].- Include controls (e.g., unmethylated lambda phage DNA) to monitor conversion efficiency [70]. |
Workflow Diagram: Low-Input Methyl-Seq Experimental Steps
The following diagram outlines the key decision points and steps in a low-input methylation sequencing experiment, from sample preparation to data analysis.
Quantitative Method Comparison
The table below summarizes a systematic comparison of key performance metrics for EM-seq and PBAT derived from a controlled study using low-input DNA (1-10 ng) [70].
Table 1: Performance Comparison of EM-seq and PBAT for Low-Input DNA Methylation Sequencing
| Performance Metric | EM-seq | PBAT | Technical Implications |
|---|---|---|---|
| DNA Conversion Principle | Enzymatic (TET2/APOBEC) [70] [71] | Chemical (Bisulfite) [70] [72] | EM-seq minimizes DNA fragmentation [70]. |
| Insert Size | Larger [70] | Smaller [70] | EM-seq provides better genomic coverage. |
| Alignment Rate | Higher [70] | Lower [70] | EM-seq yields more usable data per run. |
| Library Complexity | Higher [70] | Lower [70] | EM-seq provides more unique information. |
| Duplication Rate | Lower [70] | Higher [70] | PBAT has more PCR-driven redundancy. |
| CpG Coverage | Higher [70] | Lower [70] | EM-seq detects more methylation sites. |
| Consistency Across Inputs | Higher [70] | Lower [70] | EM-seq is more robust for variable inputs. |
The Scientist's Toolkit: Key Reagents and Materials
Table 2: Essential Research Reagent Solutions for Low-Input Methylation Sequencing
| Item | Function/Application | Example Kits/Reagents |
|---|---|---|
| High-Sensitivity DNA QC Kit | Accurate quantification and quality assessment of trace DNA samples. | Qubit dsDNA HS Assay Kit, Agilent High-Sensitivity DNA Kit |
| EM-seq Library Prep Kit | Enzymatic conversion-based library construction for low-input DNA; reduces DNA damage. | NEBNext Enzymatic Methyl-seq Kit (EM-seq) [70] |
| PBAT Reagents | Bisulfite conversion and post-conversion adaptor tagging for ultra-low-input applications. | Imprint DNA Modification Kit (Sigma), Klenow exo- enzyme, custom biotinylated primers [70] |
| T-WGBS Kit | Combines bisulfite conversion with tagmentation for efficient library prep from moderate-to-low inputs. | Commercial T-WGBS kits or optimized protocols [72] |
| Methylated & Unmethylated Spike-in Controls | Monitoring bisulfite/enzymatic conversion efficiency and identifying potential biases. | Lambda phage DNA (unmethylated), CpG-methylated plasmid DNA (e.g., pUC19) [70] |
| High-Fidelity PCR Master Mix | Limited-cycle amplification of libraries while maintaining accuracy and complexity. | KAPA HiFi HotStart ReadyMix, LongAmp Hot Start Taq 2X Master Mix [70] [74] |
| Solid Phase Reversible Immobilization (SPRI) Beads | Cleanup, size selection, and purification of libraries between reaction steps. | Agencourt AMPure XP beads [70] [74] |
| Bioinformatics Pipeline | End-to-end processing of sequencing data, including quality control, alignment, and methylation calling. | nf-core/methylseq, Bismark, BAT [70] [72] |
Frequently Asked Questions
What are the most critical pre-alignment quality metrics for BS-seq data? Pre-alignment quality control is essential for reliable downstream analysis. You should focus on:
- Adapter Contamination: Use tools like FastQC to detect adapter sequences, which are common in BS-seq libraries due to DNA fragmentation.
- Bisulfite Conversion Efficiency: Calculate the non-CpG cytosine conversion rate. An efficiency rate below 99% can indicate incomplete conversion, leading to inaccurate methylation calls [72] [8].
- Sequence Quality Scores: Per-base sequence quality (e.g., from FastQC) identifies cycles with poor quality that may need trimming [72] [8].
- Read Length Distribution: Ensure read lengths match the expected size from your library preparation protocol (e.g., WGBS, RRBS) [72].
My alignment rates are low. What could be the cause? Low alignment rates in BS-seq often stem from pre-alignment issues or inappropriate aligner selection. systematically check the following:
- Insufficient Quality Trimming: Poor quality bases at read ends hinder alignment. Re-trim your reads with a dedicated trimmer [72].
- Incorrect Adapter Trimming: Residual adapter sequence prevents reads from mapping to the genome.
- Low Bisulfite Conversion Efficiency: High levels of unconverted cytosines create excessive mismatches, confusing the aligner. Verify your conversion rate [72].
- Mismatched Reference Genome: Ensure the reference genome build (e.g., hg19, hg38) matches the one used in your experiment.
- Suboptimal Aligner Choice: Different aligners (three-letter vs. wildcard) perform better under different conditions, such as with high levels of C-T conversions [75].
How do I choose between a speed-optimized and an accuracy-optimized workflow? The choice depends on your experimental goals and computational resources. The table below summarizes the core trade-offs [76]:
| Aspect | Speed-Focused Workflow | Accuracy-Focused Workflow |
|---|---|---|
| Best Use Cases | Preliminary data screening, large cohort studies | Clinical diagnostics, publication-ready analysis, low-input samples |
| Primary Benefit | Faster results, lower computational cost, high throughput | Trustworthy and precise methylation calls, better for complex genomes |
| Resource Needs | Lower computational demands (CPU, memory, time) | High computational requirements (CPU, memory, time) |
| Development/Execution Time | Shorter | Longer |
| Risk Tolerance | Higher (tolerates some alignment errors) | Low (errors can impact biological conclusions) |
What are the common post-alignment filters, and in what order should I apply them? Apply filters sequentially to avoid removing potentially valid data prematurely.
- Remove Unmapped Reads: Discard reads with the SAM flag 4.
- Remove Duplicates: Use tools to filter PCR duplicates, which can bias methylation level estimates [72].
- Filter by Mapping Quality: Remove reads with a low MAPQ score (e.g., < 10 or < 20). This filters out multi-mapping reads that lack a unique alignment position [72] [75].
- Remove Overlapping Reads: In paired-end sequencing, overlapping read regions can lead to double-counting of methylation evidence.
What does "model drift" mean in the context of methylation calling, and how can I prevent it? Model drift refers to the degradation of a machine learning model's performance over time. For methylation callers that use probabilistic models, this can happen if the model's underlying assumptions no longer hold true for new data—for example, due to changes in laboratory protocols, sequencing technologies, or the study of a new disease type with different methylation patterns [77]. To prevent it:
- Continuous Monitoring: Regularly benchmark your workflow's output against a known gold-standard dataset [77] [72].
- Periodic Retraining: If you are using a learning-based tool, plan for periodic retraining with new, accurately labeled data that reflects current experimental conditions [77].
Troubleshooting Guides
Problem: Systematic Bias in Methylation Levels (e.g., Over-estimation)
- Symptoms: Consistently higher methylation levels compared to expected values or other published datasets; bias is more pronounced in hypomethylated regions.
- Diagnosis: This is a known issue with certain alignment strategies. Wildcard alignment methods can be biased towards better aligning reads from hypermethylated regions, leading to an under-representation of reads from hypomethylated regions and consequently an overestimation of the global methylation level [75].
- Solution: Consider switching from a wildcard-based aligner to a three-letter aligner or a context-aware aligner like ARYANA-BS, which is specifically designed to treat reads from methylated and unmethylated regions more equally [75]. Always validate your results with a different alignment algorithm.
Problem: High Duplication Rate in Post-Alignment QC
- Symptoms: A high percentage of PCR duplicates reported by tools like
picard MarkDuplicates. - Diagnosis: PCR amplification bias, often caused by low input DNA or an excessive number of PCR cycles during library preparation [72].
- Solution:
- Prevention: Optimize library preparation by using sufficient input DNA and minimizing PCR cycles. Consider PCR-free protocols if feasible.
- Remediation: In silico removal of duplicates is standard practice. However, be aware that in some cases (e.g., very low input samples), this can remove a large fraction of your data. Analyze data with and without duplicates to ensure your conclusions are robust.
Problem: Inconsistent Methylation Calls Between Replicates
- Symptoms: Poor correlation of methylation levels between technical or biological replicates.
- Diagnosis: Inconsistent data quality or inadequate sequencing depth.
- Solution: Follow this diagnostic workflow to identify and resolve the issue:
Problem: Workflow is Too Slow for Large-Scale Data
- Symptoms: Workflow execution takes days; unable to process cohort-sized datasets in a reasonable time.
- Diagnosis: Computational bottlenecks at alignment or methylation calling steps.
- Solution:
- Benchmark Aligners: Select an aligner that offers a good balance for your needs. The table below benchmarks several aligners on key performance metrics, based on a 2025 study [75]:
| Aligner | Alignment Strategy | Relative Speed | Relative Accuracy | Best For |
|---|---|---|---|---|
| ARYANA-BS | Context-aware, multi-index | Medium | Very High | Maximum accuracy, cancer/cfDNA studies [75] |
| Bismark | Three-letter | Medium | High | General purpose, widely used [72] [75] |
| BSMAP | Wildcard | Fast | Medium (Risk of Bias) | Fast screening where some bias is acceptable [75] |
| bwa-meth | Three-letter | Very Fast | Medium | Large-scale studies where speed is critical [75] |
| abismal | Two-letter | Fast | Low-Medium | Extremely fast processing on less complex data [75] |
The Scientist's Toolkit: Research Reagent Solutions
The following table details key software and data "reagents" essential for BS-seq workflow benchmarking and quality control.
| Item Name | Function/Explanation |
|---|---|
| ARYANA-BS | A novel context-aware BS-seq aligner that uses multiple genomic indexes and an optional EM step to achieve high accuracy, especially for long or complex reads [75]. |
| Bismark | A widely used aligner that performs three-letter alignment by converting all Cs to Ts in both reads and reference, providing a robust and standard approach [72] [75]. |
| FastQC | A quality control tool that provides an overview of pre-alignment read quality, including per-base sequencing quality, adapter contamination, and sequence duplication levels [72]. |
| Gold-Standard Reference Samples | Genomic DNA samples with accurately known methylation levels at specific loci, used to benchmark and validate the accuracy of entire computational workflows [72]. |
| Multi-Protocol Benchmarking Dataset | A dedicated dataset (like the one in PMC:12539629) where the same biological sample is sequenced using multiple BS-seq protocols (WGBS, T-WGBS, EM-seq, etc.), enabling fair tool comparison [72]. |
| BSBolt | A software package that provides tools for both alignment and methylation calling from BS-seq data, implementing a three-letter alignment approach [72]. |
| Samtools | A ubiquitous suite for post-alignment processing. It is used for sorting, indexing, filtering (e.g., by mapping quality), and quickly viewing SAM/BAM files [72]. |
| MethylKit | An R package for post-alignment analysis, including calculation of methylation percentages, identification of differentially methylated regions (DMRs), and visualization. |
Workflow Performance and Hardware Specifications
Processing Whole Genome Bisulfite Sequencing (WGBS) data demands substantial computational resources. The following table summarizes the performance and requirements of commonly used workflows, based on a comprehensive benchmarking study that evaluated workflows on a virtual machine equipped with 512 GB RAM and 56 CPU threads [72].
| Workflow | Key Characteristics | Performance & Resource Notes |
|---|---|---|
| BSMAP | Uses wildcard alignment strategy [75]. | Fastest running speed, particularly for large-scale data; requires larger memory resources [78]. |
| Bismark | Uses 3-letter alignment strategy; widely used and effective [75]. | A viable alternative when memory resources are limited [78]. |
| Bismark-bwt2-e2e | Specific alignment method of Bismark. | Lower memory consumption compared to BSMAP [78]. |
| Aryana-bs | Novel, context-aware aligner; integrates BS-specific alterations [75]. | Achieves state-of-the-art accuracy with competitive speed and memory efficiency [75]. |
| General WGBS | -- | Requires conversion-aware alignment and specialized processing steps [72] [8]. |
Optimizing the Alignment Strategy
The core computational challenge in WGBS analysis is the alignment of bisulfite-converted reads to a reference genome. The choice of alignment strategy directly impacts resource consumption and accuracy [75].
Different strategies offer trade-offs. The wildcard approach (used by BSMAP) is fast but can overestimate methylation levels, while the three-letter approach (used by Bismark) is more straightforward but may fail to uniquely map more reads [75]. Newer aligners like Aryana-bs attempt to mitigate these issues by using a context-aware, multi-index approach, which may require more CPU cycles but improves accuracy [75].
Frequently Asked Questions (FAQs)
Q1: My workflow is failing due to insufficient memory. What are my options?
- Consider alternative tools: If you are using a memory-intensive tool like BSMAP, switch to a workflow with lower memory consumption, such as Bismark with its
bwt2-e2ealigner [78]. - Check preprocessing steps: Ensure that your input files are correctly formatted and have not been corrupted. Downsampling a small subset of your data can be useful for testing memory requirements before running the entire dataset.
- Allocate more resources: The benchmarking studies were performed on systems with 512 GB of RAM [72]. For large mammalian genomes, ensure your computational node has sufficient memory, typically 64GB or more as a starting point.
Q2: The alignment step is taking too long. How can I speed it up?
- Select a faster aligner: BSMAP has been shown to have the fastest running speed in several benchmarking studies [78].
- Leverage parallel processing: Most modern WGBS workflows are designed to use multiple CPU threads. Ensure you are specifying a sufficient number of threads (e.g., 16-32) in your command-line parameters [72].
- Validate data quality: Use pre-alignment quality control (QC) tools like FastQC to check for issues like adapter contamination or low-quality bases that might be slowing down the aligner [72] [8].
Q3: Why is my methylation level estimation biased?
- This could be due to algorithmic bias in your aligner. Wildcard aligners like BSMAP are known to have a bias that leads to better alignment of reads from hypermethylated regions, potentially causing systematic overestimation of methylation levels [75].
- Solution: If high accuracy is critical, consider using a context-aware aligner like Aryana-bs or a workflow that has demonstrated high accuracy in independent benchmarks, even if it is computationally more expensive [72] [75].
Q4: How much storage space should I allocate for a typical WGBS project?
Storage requirements can be broken down into three main phases:
- Raw Sequence Files (FASTQ): A single human WGBS sample sequenced at 30x coverage can produce hundreds of gigabytes of compressed FASTQ files.
- Intermediate Files (SAM/BAM): The aligned files in SAM format are uncompressed and very large. Converting to compressed BAM format reduces size significantly, but this step still requires temporary disk space.
- Processed Outputs: The final methylation call files (e.g., bedGraph or tab-separated files) are much smaller but must be retained for analysis.
- Recommendation: As a rough estimate, ensure you have at least 1-2 terabytes of free storage for a small-scale project with a few samples. Always monitor disk usage during processing.
| Item | Function in WGBS |
|---|---|
| High-Molecular-Weight DNA | Starting material for library preparation; integrity is crucial for high-quality data [79]. |
| Sodium Bisulfite / Conversion Kit | Chemically converts unmethylated cytosine to uracil, enabling discrimination of methylation status [7] [79]. |
| EpiTect Bisulfite Kit (Qiagen) | A commercial kit for performing bisulfite conversion [72]. |
| EZ DNA Methylation Kit (Zymo Research) | Another commercial kit for bisulfite conversion [21]. |
| Illumina Sequencing Platform | The dominant technology for high-throughput bisulfite sequencing [72] [79]. |
| Reference Genome | Essential for aligning sequencing reads and calling methylation status [79]. |
| Docker/Singularity | Containerization technologies used to package workflows, enhancing stability and reproducibility [72]. |
Validating Your Pipeline and Comparing Methods for Robust Results
Benchmarking with Gold-Standard Samples and Accurate Locus-Specific Measurements
Frequently Asked Questions
Q1: Why is benchmarking with gold-standard samples critical in BS-seq experiments? A1: Benchmarking with gold-standard samples is fundamental for validating the entire BS-seq workflow, from library preparation to data analysis. These samples, often with known methylation profiles or spiked-in controls, allow researchers to quantify technical variability, assess bisulfite conversion efficiency, measure alignment accuracy, and verify methylation calling performance. This process is essential for distinguishing true biological variation from technical artifacts, ensuring that conclusions about differential methylation are reliable [80] [6].
Q2: What are the primary advantages of locus-specific BS-seq methods for validation? A2: Targeted bisulfite sequencing methods, such as RainDrop BS-seq or multiplexed PCR-based approaches, offer several key advantages for validating findings from genome-wide studies like EWAS. They provide:
- High Sensitivity: Accurate methylation measurement from nanogram quantities of DNA, making them suitable for limited clinical samples [80].
- Cost-Effectiveness: Focused sequencing on candidate regions drastically reduces sequencing costs compared to whole-genome methods [81].
- High-Throughput: Capability to process hundreds of samples simultaneously in a single sequencing run [81].
- Accuracy: High correlation (e.g., median R = 0.92) with microarray-based platforms like the Illumina 450K array, confirming their reliability for validating epigenetic biomarkers [80].
Q3: How do pre- and post-alignment QC metrics differ in their function? A3: Pre- and post-alignment quality control (QC) metrics serve distinct but complementary functions in establishing data quality:
- Pre-alignment QC assesses the raw sequencing data. It involves checking raw read quality (Phred scores), adapter contamination, nucleotide composition, and bisulfite conversion efficiency from fastq files. Tools like FastQC are typically used at this stage.
- Post-alignment QC evaluates the success of the mapping process and the integrity of the methylation data. This includes calculating alignment rates, assessing the distribution of reads across genomic features, checking for positional biases, and verifying that expected methylation patterns (e.g., low CHH methylation) are present. This often requires specialized tools like the Qualimap module within nf-core/methylseq or MethylKit [82] [10].
Troubleshooting Guides
Low DNA Input or Degraded Samples
Problem: Inadequate amplification, poor library complexity, or low mapping rates when working with low-input DNA (e.g., from FFPE tissue, microdissected samples, or sorted cell populations).
Solutions:
- Whole-Genome Amplification (WGA): Implement multiple displacement amplification (MDA)-based WGA after bisulfite conversion. This enables analysis from as little as 10-50 ng of starting DNA, though a slight reduction in correlation with standard inputs should be expected (e.g., median R dropping from 0.92 to 0.79) [80].
- Optimized Library Kits: Use post-bisulfite library preparation protocols like PBAT (Post-Bisulfite Adapter Tagging). These methods minimize DNA loss by ligating adapters after the bisulfite treatment step, which can cause fragmentation, making them ideal for low-biomass samples [6].
- Target Enrichment: Focus on a specific panel of loci using methods like RainDrop BS-seq or multiplexed PCR to increase coverage on regions of interest without requiring large amounts of genomic DNA [80].
Poor Alignment Efficiency
Problem: Low percentage of sequencing reads successfully mapping to the reference genome, leading to poor coverage and unreliable methylation calls.
Solutions:
- Specialized Aligners: Always use bisulfite-aware alignment tools such as BSBolt, Bismark, or BWA-meth. These tools are specifically designed to handle the reduced sequence complexity and C-to-T substitutions inherent in BS-seq data, and they outperform standard aligners [83] [6].
- Pre-alignment Read Assessment: For non-directional libraries, use tools like BSBolt that perform a pre-alignment assessment of read base composition to determine the correct bisulfite conversion pattern (C-to-T or G-to-A). This eliminates the need for multiple alignments of the same read and improves mapping efficiency [83].
- Quality and Adapter Trimming: Rigorously trim low-quality bases and adapter sequences from reads before alignment. This improves mappability and prevents misalignment caused by adapter contamination [6].
Inconsistent Methylation Measurements
Problem: Discrepancies in methylation levels between replicates, technical platforms, or expected versus observed values.
Solutions:
- Spike-in Controls: Use spike-in controls with known methylation states (e.g., phage lambda DNA) to empirically measure the bisulfite conversion efficiency in each sample. An conversion rate below 99% indicates a problem with the bisulfite treatment step [84] [6].
- Coverage Depth: Ensure sufficient sequencing depth. A minimum coverage of 30x is often recommended, but for confident detection of small methylation differences or for heterogeneous samples, much higher coverage (e.g., >100x) may be required, especially in targeted sequencing [81].
- Duplicate Removal: Remove PCR duplicates from the alignment files to prevent over-amplification of specific fragments from skewing the methylation quantification [6].
- Context-Specific Analysis: Be aware that the accuracy of methylation calling can vary by sequence context (CG, CHG, CHH). The majority of CH sites are expected to be unmethylated in eukaryotic genomes; a high level of observed CH methylation can be a red flag for incomplete bisulfite conversion [83].
Troubleshooting Table: Common BS-seq Issues and Fixes
| Problem | Possible Causes | Recommended Solutions |
|---|---|---|
| Low alignment rate | Standard (non-BS) aligner used; Adapter contamination; Low read quality | Use a bisulfite-specific aligner (BSBolt, Bismark); Trim adapters and low-quality bases; Perform pre-alignment QC [83] [6] |
| Erroneous methylation calls | Incomplete bisulfite conversion; Insufficient read coverage; PCR biases | Use spike-in controls to verify >99% conversion efficiency; Sequence to higher depth; Use amplification-free or low-bias library methods (e.g., PBAT, EM-seq) [81] [6] |
| High duplicate rate | Low input DNA leading to over-amplification; Insfficient library complexity | Increase input DNA if possible; Use library prep methods designed for low input (e.g., post-bisulfite tagging); Normalize data during differential analysis [6] |
| Poor replication among technical replicates | Technical batch effects; Library preparation inconsistencies | Randomize samples during library prep; Use unique barcodes for all samples; Include control samples in each batch [80] |
Experimental Protocols and Workflows
Workflow for Targeted Locus-Specific Validation
The following diagram illustrates a robust workflow for validating differentially methylated regions (DMRs) using targeted bisulfite sequencing, incorporating benchmarking practices.
Benchmarking Data from RainDrop BS-seq Study
The following table summarizes key performance metrics from a systematic assessment of RainDrop BS-seq, a targeted bisulfite sequencing method, using different DNA input quantities. This data serves as a practical benchmark for expected outcomes.
| DNA Input Quantity | Whole-Genome Amplification (WGA) | Correlation with 450K Array (Median R) | Key Applications and Notes |
|---|---|---|---|
| 100 - 1500 ng | No | 0.92 | Ideal for validation studies; high correlation with array platforms [80] |
| 250 ng | Yes | Data not explicitly stated | Performance comparable to unamplified 100-250 ng samples [80] |
| 100 ng | Yes | Data not explicitly stated | Performance comparable to unamplified 100-250 ng samples [80] |
| 50 ng | Yes | 0.79 | Suitable for samples with limited DNA; slight reduction in correlation [80] |
| 10 ng | Yes | 0.79 | Enables analysis of very low input samples; requires WGA [80] |
The Scientist's Toolkit: Essential Research Reagents and Materials
| Item | Function in BS-seq Benchmarking |
|---|---|
| EZ-96 DNA Methylation-Gold Kit (Zymo Research) | For high-efficiency bisulfite conversion of unmethylated cytosines to uracil, a critical first step [81]. |
| TruSeq DNA Methylation Kit (Illumina) | A post-bisulfite library preparation method that reduces DNA loss and is useful for CpG-dense regions [6]. |
| RainDance ThunderStorm System | A microdroplet-based PCR platform for simultaneous amplification of thousands of target loci from bisulfite-converted DNA [80]. |
| PhiX Control Library (Illumina) | A well-characterized control spiked into sequencing runs to monitor sequencing accuracy and base calling, especially in low-diversity BS-seq libraries [6]. |
| Lambda DNA | A common spike-in control for quantifying the bisulfite conversion efficiency, as its genome is unmethylated and should show ~100% C-to-T conversion [84] [6]. |
| BSBolt / Bismark Software | Specialized bisulfite-seq read aligners that account for C-T changes, providing accurate alignment and methylation calls [10] [83]. |
| MethylKit R Package | A comprehensive tool for the downstream analysis of methylation data, including sample quality visualization, clustering, and differential methylation analysis [10]. |
Using Inter-Replicate Concordance to Validate Data Quality and Pipeline Performance
Frequently Asked Questions (FAQs)
FAQ 1: Why is inter-replicate concordance a critical metric for BS-seq data quality? Inter-replicate concordance measures the consistency of methylation calls between independent replicate experiments. High concordance indicates that your results are reproducible and not dominated by technical noise. In genomic studies, a lack of replication can lead to highly inconsistent results; for example, in G-quadruplex ChIP-Seq studies, it was observed that only a minority of peaks were shared across all replicates, highlighting the risk of false positives without replicate analysis [85]. For BS-seq, it validates that your wet-lab protocols and bioinformatic pipelines are yielding reliable, robust data.
FAQ 2: My replicates show low concordance. What are the primary areas I should troubleshoot? Low concordance can stem from various issues. You should systematically investigate the following:
- Wet-lab Procedures: Inconsistent bisulfite conversion efficiency, DNA degradation (which can reach up to 90% during conversion), or variations in library preparation between samples [11] [3].
- Bioinformatic Pipeline: The choice of alignment algorithm can significantly impact genomic coverage and methylation calls. Some mappers may fail to cover 8-12% of genomic regions that others can map [86].
- Experimental Design: Insufficient sequencing depth or an inadequate number of replicates. Research suggests that at least three replicates are needed to significantly improve detection accuracy, with four being sufficient for most studies [85].
FAQ 3: What are the key pre-alignment QC steps to ensure before assessing concordance? Rigorous pre-alignment quality control is foundational for meaningful concordance metrics.
- Adapter Trimming: Use tools like Cutadapt to remove adapter sequences, which can introduce constitutively methylated Cs and cause methylation calling bias [86] [6].
- Quality Trimming: Trim low-quality bases (e.g., quality score < 30, indicating 99.9% base-calling accuracy) and filter out short reads (e.g., < 50 bp) to improve mappability [86] [6].
- Conversion Efficiency: Assess the efficiency of bisulfite conversion by checking the conversion rate of unmethylated cytosines in non-CpG contexts or by using spiked-in unmethylated controls. High efficiency is crucial for accurate methylation analysis [3].
FAQ 4: Which computational methods are best for quantitatively assessing reproducibility between replicates? Several computational methods exist to statistically evaluate reproducibility across replicates. A comparative study evaluating three common methods—IDR, MSPC, and ChIP-R—found that MSPC (Multiple Sample Peak Calling) consistently outperformed the others for reconciling inconsistent signals in epigenetic data. MSPC integrates evidence from multiple replicates to rescue weak but consistent peaks, providing a superior balance between precision and recall [85].
FAQ 5: How does the choice of alignment tool impact inter-replicate concordance? Different bisulfite-aware aligners use distinct algorithms (e.g., "wild card" vs. "three-letter" alignment), which can lead to variations in the sets of genomic regions they can map. A systematic comparison of five mappers (Bismark, BSMAP, Pash, BatMeth, and BS Seeker) revealed that while most showed high concordance (r² ≥ 0.95) for methylation estimates in covered regions, there were significant differences in genomic coverage. For instance, 8–12% of genomic regions covered by Bismark and Pash were not covered by BSMAP [86]. Using a mapper with low coverage can artificially reduce concordance because shared biological signals are not captured.
Troubleshooting Guides
Problem: Low Concordance Due to Wet-Lab Protocol Inconsistencies
Symptoms: High variability in mapping efficiency, global methylation levels, or the number of detected CpG sites between replicates.
Solution:
- Standardize Bisulfite Conversion: Use a commercial bisulfite conversion kit to ensure consistent reaction conditions across all samples. Verify conversion efficiency (ideally >99%) for each sample using non-conversion specific PCR or spiked-in controls [3].
- Optimize Library Preparation: Choose a library preparation method suitable for your sample type and research goal. For low-input DNA, consider post-bisulfite adapter tagging (PBAT) or tagmentation-based (T-WGBS) protocols, which minimize DNA loss [6] [11]. For consistent genome-wide coverage, SPLAT or Accel-NGS Methyl-Seq are recommended over TruSeq, which may discard more data [6].
- Control DNA Quality: Use high-quality, high-molecular-weight DNA. If using FFPE samples, employ specialized protocols that include steps like end-polishing to recover more usable data [3].
Problem: Low Concordance Due to Bioinformatics Pipeline Issues
Symptoms: Discrepancies in aligned reads, coverage breadth, or methylation calls after processing replicates through the same pipeline.
Solution:
- Select an Appropriate Mapper: Choose a bisulfite-specific aligner that offers a good balance of coverage and accuracy. Benchmarking studies indicate that Bismark provides an attractive combination of processing speed, genomic coverage, and quantitative accuracy [86].
- Ensure Sufficient Sequencing Depth: Low sequencing depth leads to sparse and noisy data, reducing concordance. A minimum of 10-15 million mapped reads per replicate is recommended for robust detection, though this can vary by project [85].
- Apply Consistent Post-Alignment Filtering: Apply uniform filters to all replicates. This includes:
Quantitative Data for Pipeline Performance Assessment
Table 1: Comparison of Bisulfite-Seq Mapping Algorithms [86]
| Mapper | Alignment Strategy | Mapping Speed | Genomic CpG Coverage | Concordance of Methylation Estimates (r²) |
|---|---|---|---|---|
| Bismark | Three-letter | Medium | >70% | ≥ 0.95 |
| BSMAP | Wild card | Fastest | >70%* | ≥ 0.95 |
| Pash | Heuristic k-mer | Slowest | >70% | ≥ 0.95 |
| BatMeth | Wild card | Not Specified | Lower than others | Not Specified |
Note: BSMAP showed 8-12% lower regional coverage compared to Bismark and Pash in certain genomic areas [86].
Table 2: Impact of Replicate Number on Data Reliability [85]
| Number of Replicates | Impact on Detection Accuracy & Reproducibility |
|---|---|
| 2 (Conventional) | Suboptimal; higher rates of false positives and negatives. |
| 3 | Significantly improves detection accuracy compared to two replicates. |
| 4 | Sufficient to achieve reproducible outcomes with diminishing returns beyond this point. |
Experimental Protocol: Assessing Inter-Replicate Concordance
This protocol outlines a method to quantitatively verify the performance of a BS-seq pipeline using inter-replicate concordance.
Objective: To ensure that a BS-seq data processing pipeline produces consistent and reproducible methylation calls from biological replicates.
Materials:
- Biological Replicates: At least three independently processed samples from the same source [85].
- Computing Resources: A server or cluster with adequate memory and storage.
- Software Tools:
Methodology:
- Data Generation and Pre-processing:
- Sequence your biological replicates using your established WGBS, RRBS, or other BS-seq protocol.
- Perform quality control on raw FASTQ files using FastQC.
- Trim adapters and low-quality bases using Cutadapt, keeping bases with a quality score ≥ 28 and read length ≥ 50 bp [86].
Alignment and Methylation Calling:
- Map the quality-filtered reads to a reference genome (e.g., UCSC hg19) using your chosen aligner (e.g., Bismark with Bowtie 2) with consistent parameters for all samples [86] [87].
- Extract methylation calls for each cytosine in the genome, outputting the number of methylated and unmethylated reads per site.
Data Filtering and Segmentation:
Concordance Assessment:
- Correlation Analysis: Calculate the Pearson correlation (r²) of percentage methylation between each pair of replicates for all covered CpG sites or bins. High correlations (e.g., r² ≥ 0.95) indicate good concordance [86].
- Reproducibility Scoring: Use a computational method like MSPC to identify a high-confidence set of methylated regions that are consistently called across replicates [85]. The proportion of total peaks falling into this high-confidence set is a direct metric of inter-replicate concordance.
Interpretation: A successful pipeline will yield high correlation coefficients and a large proportion of methylated features supported by multiple replicates. Low values indicate a need to re-examine wet-lab protocols or bioinformatic parameters.
Workflow Visualization
BS-seq Concordance Workflow
The Scientist's Toolkit: Essential Research Reagents & Solutions
Table 3: Key Reagents and Tools for BS-seq Quality Control
| Item | Function in BS-seq QC | Example / Note |
|---|---|---|
| Sodium Bisulfite | Chemically converts unmethylated C to U, enabling methylation detection. | Use commercial kits (e.g., Zymo Research EZ DNA Methylation-Direct) for consistent conversion efficiency [86] [3]. |
| High-Fidelity PCR Polymerase | Amplifies bisulfite-converted DNA with low error rates, reducing bias. | Essential due to the low complexity of converted DNA [3]. |
| Spiked-in Controls | Completely methylated and unmethylated DNA controls added to samples. | Allows direct assessment of conversion efficiency and detection accuracy in each library [3]. |
| Restriction Enzymes (e.g., MspI) | Used in RRBS to digest genomic DNA and enrich for CpG-rich regions. | Creates a reduced representation of the genome, lowering sequencing costs [6] [10]. |
| Bisulfite-Specific Aligner | Software designed to map bisulfite-converted reads to a reference genome. | Bismark is widely used and offers a good balance of speed and accuracy [86] [87]. |
| Reproducibility Assessment Tool | Computational method to quantify consistency between replicates. | MSPC is recommended for integrating evidence from multiple replicates [85]. |
DNA methylation analysis is a cornerstone of epigenetic research, providing critical insights into gene regulation, cellular differentiation, and disease mechanisms. The three prominent technologies for genome-wide methylation profiling—Whole Genome Bisulfite Sequencing (WGBS), Enzymatic Methyl Sequencing (EM-seq), and the Infinium MethylationEPIC Array—each offer distinct advantages and limitations. This technical support center provides researchers with a comprehensive framework for selecting and implementing these technologies, with particular emphasis on quality control procedures essential for thesis research involving BS-seq data analysis. The protocols discussed here represent current methodological standards as of 2025, enabling researchers to make informed decisions based on their specific experimental requirements, sample types, and analytical goals [88] [89].
Each technology operates on different biochemical principles for detecting methylated cytosines. WGBS employs harsh chemical conversion using sodium bisulfite to deaminate unmethylated cytosines to uracils, while EM-seq utilizes a gentler enzymatic approach involving TET2 and APOBEC enzymes to achieve similar conversion. In contrast, the EPIC Array uses hybridization of bisulfite-converted DNA to predefined probes on a beadchip [88] [90] [91]. These fundamental differences in detection principles directly impact DNA integrity, genomic coverage, resolution, and ultimately, the choice of quality control metrics throughout the analytical pipeline from library preparation to post-alignment data assessment.
Technical Comparisons & Methodologies
Comparative Technical Specifications
Table 1: Comprehensive comparison of DNA methylation profiling technologies
| Parameter | WGBS | EM-seq | EPIC Array |
|---|---|---|---|
| Detection Principle | Bisulfite chemical conversion | Enzymatic conversion (TET2, APOBEC) | Beadchip hybridization |
| Resolution | Single-base | Single-base | Single-CpG (predefined sites) |
| Genomic Coverage | Genome-wide (~80% of CpGs) | Genome-wide | Targeted (~935,000 CpG sites) |
| DNA Input | 1-5 μg [91] [90] | >200 ng [91] [90] | 0.5-1 μg [91] |
| FFPE Compatibility | Yes [91] | Yes [91] | Yes [91] |
| Species Applicability | Any species with a reference genome [91] [90] | Any species with a reference genome [91] | Human only [91] |
| Key Advantages | Gold standard, complete genome coverage [90] | Minimal DNA damage, better library complexity [88] [90] | Cost-effective for large cohorts [21] [91] |
| Primary Limitations | DNA fragmentation, high input requirement [88] [90] | Higher reagent cost, complex data analysis [90] | Limited to predefined sites [91] |
Experimental Workflows
Whole Genome Bisulfite Sequencing (WGBS) Protocol
The standard WGBS protocol begins with genomic DNA fragmentation, typically by sonication or enzymatic digestion, to ~200-300bp fragments. Following fragmentation, DNA undergoes end-repair, A-tailing, and adapter ligation using methylated adapters to preserve methylation information during subsequent steps. The critical bisulfite conversion is performed using commercial kits (e.g., EZ-96 DNA Methylation-Gold, Zymo Research) with optimized temperature and pH conditions to maximize conversion efficiency while minimizing DNA degradation. Following conversion, libraries are amplified with a low number of PCR cycles (typically 4-8 cycles) to avoid amplification bias, followed by size selection and quality control before sequencing [72]. For low-input applications, post-bisulfite adapter tagging (PBAT) methods can be employed where bisulfite conversion precedes adapter ligation to minimize DNA loss [72].
Enzymatic Methyl Sequencing (EM-seq) Protocol
The EM-seq workflow utilizes a two-step enzymatic conversion process. First, DNA is incubated with TET2 and T4-BGT enzymes which oxidize 5-methylcytosine (5mC) to 5-carboxylcytosine (5caC) and glucosylate 5-hydroxymethylcytosine (5hmC), effectively protecting modified cytosines. Second, APOBEC3A deaminates all unmodified cytosines to uracils while protected modified cytosines remain unchanged. Following conversion, standard library preparation procedures including adapter ligation and PCR amplification are performed. The enzymatic reactions are typically performed using commercial kits (e.g., NEBNext EM-seq, New England Biolabs) with optimized buffer conditions and incubation times [88] [92]. This approach significantly reduces DNA damage compared to bisulfite treatment, resulting in higher library complexity and better coverage of GC-rich regions [88] [90].
Infinium MethylationEPIC Array Protocol
The EPIC array workflow begins with bisulfite conversion of 500-1000ng genomic DNA using optimized kits (e.g., EZ DNA Methylation Kit, Zymo Research). The converted DNA is then amplified, fragmented, and hybridized to the array containing over 935,000 probes targeting specific CpG sites across the genome. After hybridization, single-base extension with fluorescently labeled nucleotides allows detection of methylation status at each targeted CpG. The arrays are then scanned, and fluorescence intensities are processed to generate beta-values representing methylation levels at each site [89] [21]. The current EPICv2 platform covers approximately 3-4% of CpGs in the human genome, with enhanced coverage of enhancer regions and open chromatin areas compared to its predecessors [91].
Diagram 1: Comparative experimental workflows for the three major DNA methylation profiling technologies
Troubleshooting Guides & FAQs
Pre-alignment Quality Control
Q1: What are the key quality control metrics to check before alignment for each technology?
For WGBS and EM-seq sequencing data, standard pre-alignment QC includes FastQC analysis to assess per-base sequencing quality, nucleotide composition, and adapter contamination. Specifically for conversion-based methods, check for expected cytosine depletion in the read composition—theoretical C% should be dramatically lower than T% after successful conversion. For EM-seq, the enzymatic conversion typically results in more uniform coverage distribution compared to WGBS [88]. For EPIC arrays, quality metrics include sample-independent controls (staining, extension, hybridization), bisulfite conversion efficiency controls, and sample-dependent metrics including detection P-values (>0.05 indicates poor quality) and intensity values [21].
Q2: How can I troubleshoot poor conversion efficiency in WGBS/EM-seq?
For WGBS, poor conversion efficiency (typically >99% for unmethylated controls) can result from incomplete denaturation, partial renaturation during conversion, or suboptimal bisulfite concentration. Ensure fresh bisulfite reagents, proper temperature control, and include unmethylated lambda phage DNA as a spike-in control to quantify conversion efficiency [88] [89]. For EM-seq, poor conversion may indicate enzyme activity issues—ensure proper storage of enzymatic reagents, check reaction conditions (buffer pH, incubation time/temperature), and include appropriate controls. EM-seq typically achieves >99.5% conversion efficiency with less variability than WGBS [92].
Q3: What are the solutions for insufficient library yield in WGBS?
WGBS library yields are frequently compromised by DNA degradation during bisulfite treatment. To mitigate this: (1) Use recent bisulfite conversion kits with optimized chemistry to reduce DNA damage; (2) Implement PBAT (post-bisulfite adapter tagging) protocols where adapters are ligated after bisulfite treatment to minimize handling of converted DNA; (3) Increase input DNA amount if possible; (4) Use specialized polymerases designed for bisulfite-converted DNA during PCR amplification; (5) Consider switching to EM-seq which demonstrates significantly higher library yields due to minimal DNA damage [88] [72].
Post-alignment Quality Control
Q4: What post-alignment QC metrics are most critical for assessing data quality?
Table 2: Essential post-alignment quality control metrics
| QC Metric | Target Value | Calculation Method | Interpretation |
|---|---|---|---|
| Alignment Rate | >70% [72] | Aligned reads / Total reads | Low rates indicate poor library quality or reference mismatch |
| Bisulfite Conversion Efficiency | >99% [88] | C→T conversions in unmethylated controls | Inefficient conversion causes false methylation calls |
| Coverage Uniformity | Even across GC% range [88] | Coverage distribution across genomic regions | WGBS shows bias in extreme GC regions |
| CpG Coverage Depth | ≥30X for WGBS/EM-seq [21] | Mean reads per CpG site | Low coverage reduces methylation calling accuracy |
| Duplicate Rate | <20% for WGBS, <15% for EM-seq [88] | PCR duplicates / Total reads | EM-seq typically shows lower duplication rates |
| Methylation Distribution | Beta-value histogram shape | Distribution of methylation values | Bimodal distribution expected in mammalian genomes |
Q5: How do I address coverage bias in WGBS data?
WGBS consistently demonstrates coverage bias in extremely GC-rich regions due to DNA fragmentation and amplification inefficiencies during library preparation [88] [89]. This manifests as lower coverage in CpG islands and promoter regions. Solutions include: (1) Using EM-seq instead, which provides more uniform coverage across varying GC contexts [88]; (2) Implementing specialized library preparation protocols with lower PCR amplification cycles; (3) Using bioinformatics tools like BSseq or methylKit that can partially correct for coverage bias in downstream differential methylation analysis; (4) Increasing sequencing depth to compensate for uncovered regions, though this increases cost [72].
Q6: What are the best practices for handling batch effects in EPIC array data?
EPIC arrays are susceptible to batch effects from sample processing date, array chip, and position on chip. Mitigation strategies include: (1) Randomizing samples across arrays and processing batches; (2) Using functional normalization (e.g., preprocessFunnorm in minfi) that effectively removes unwanted technical variation [21]; (3) Including control samples replicated across batches to monitor technical variability; (4) Performing principal component analysis to identify batch-associated variation; (5) Applying batch correction algorithms like ComBat when processing multiple batches together, while being cautious not to remove biological signal [21].
The Scientist's Toolkit: Research Reagent Solutions
Table 3: Essential reagents and materials for DNA methylation analysis
| Reagent/Material | Function | Technology Application |
|---|---|---|
| NEBNext EM-seq Kit | Enzymatic conversion of unmodified cytosines | EM-seq [88] |
| EZ-96 DNA Methylation-Gold Kit | Bisulfite conversion of DNA | WGBS, EPIC Array [88] [21] |
| Accel-NGS Methyl-Seq Kit | Library preparation with reduced amplification bias | WGBS [88] |
| TruSeq DNA Methylation Kit | Array-based methylation analysis | EPIC Array [89] |
| QIAseq Targeted Methyl Panel | Custom targeted methylation sequencing | Targeted BS-seq [21] |
| Lambda Phage DNA | Unmethylated control for conversion efficiency | WGBS, EM-seq QC [88] |
| Fully Methylated Human DNA | Methylated control for assay validation | All technologies |
| Proteinase K | DNA purification from complex samples | Sample preparation [93] |
| 5-mC Monoclonal Antibody | Immunoprecipitation of methylated DNA | MeDIP-seq [93] |
Data Processing Workflows
Diagram 2: Comprehensive quality control workflow for BS-seq data processing from raw reads to final analysis
Workflow Implementation
The data processing workflow encompasses four critical stages where quality control must be rigorously applied. In the pre-alignment phase, specialized trimmers like Trim Galore! automatically detect adapter contamination and perform quality-based trimming while accounting for the reduced sequence complexity of conversion-based methods [72]. During alignment, conversion-aware aligners such as Bismark (which uses a three-letter genome approach) or BWA-meth (wildcard alignment) must be used to properly handle the C→T transitions [72]. Post-alignment filtering should address PCR duplicates, poorly mapped reads, and reads with low methylation call quality. Finally, methylation extraction and differential analysis should incorporate appropriate statistical models that account for coverage variation and biological variability [72].
Benchmarking studies have identified that workflow combinations using Bismark or BWA-meth for alignment followed by specialized methylation callers like MethylDackel consistently demonstrate superior performance across multiple metrics including alignment efficiency, methylation calling accuracy, and differential methylation detection [72]. For EPIC array data, the minfi package in R provides comprehensive quality control and normalization pipelines, with functional normalization specifically recommended for removing unwanted technical variation while preserving biological signals [21].
The selection between WGBS, EM-seq, and EPIC array technologies involves careful consideration of research objectives, sample availability, and analytical requirements. WGBS remains the established gold standard for comprehensive methylation profiling but presents challenges in DNA quality and coverage uniformity. EM-seq emerges as a robust alternative with superior library complexity and reduced DNA damage, particularly valuable for precious or low-input samples. The EPIC array offers a cost-effective solution for large human cohort studies where targeted profiling suffices. For thesis research focused on BS-seq data quality control, implementation of rigorous pre-alignment and post-alignment quality metrics is non-negotiable for generating publication-quality results. As enzymatic methods continue to mature and benchmarking studies refine best practices for data processing, researchers are equipped with an increasingly sophisticated toolkit for unlocking the biological insights contained within the methylome.
Evaluating Alignment Accuracy, CpG Coverage, and Methylation Call Reproducibility
Troubleshooting Guides & FAQs
Alignment Accuracy
Why are my bisulfite-converted reads not aligning to the reference genome, and how can I improve mapping rates?
Bisulfite conversion reduces sequence complexity by converting unmethylated cytosines to thymines, making alignment challenging. This complexity reduction creates significant divergence from the reference genome and can result in ambiguous mappings, especially for sequences with high numbers of C-to-T conversions [94] [11].
Solution: Implement probabilistic alignment algorithms that specifically account for bisulfite-converted sequences. Tools like GNUMAP-bs integrate base quality scores and sequence uncertainty to distinguish between true bisulfite conversions and sequencing errors [94]. In performance comparisons, probabilistic aligners (GNUMAP-bs, Novoalign, LAST) demonstrated 96-97% mapping sensitivity, significantly outperforming more heuristic methods (93-94% sensitivity) [94].
Additional Troubleshooting Steps:
- Allow for flexible mismatch parameters (e.g., up to 3-4 base differences in 100-bp reads)
- Consider using alignment tools that support insertions and deletions, as some BS-aligners have limited indel support [94]
- For human genomes with repetitive sequences, allow multiple mapping locations (up to 20 locations per read) to improve sensitivity [94]
How does bisulfite conversion specifically impact sequence alignment?
Bisulfite treatment creates several technical challenges for alignment [11]:
- Sequence complexity reduction: Unmethylated cytosines convert to thymines, reducing the alphabet from four nucleotides to three (A, T, G) in converted regions
- Reference genome divergence: Converted reads can vary significantly from the reference due to both bisulfite conversion and natural genome variation
- Alignment ambiguity: It becomes difficult to distinguish between thymines that originated from unmethylated cytosines versus true thymines from genomic variation
- DNA degradation: Bisulfite treatment can degrade up to 90% of DNA, further complicating library preparation and sequencing [11]
CpG Coverage
Why does my methylation data only cover a fraction of the CpG sites in the genome?
Different methylation profiling techniques have inherent biases toward specific CpG density regions, which dramatically affects genomic coverage [95]:
Table 1: CpG Coverage and Bias by Methylation Analysis Method
| Method | CpG Density Bias | % Genome Assessed | Sequence Alignment Rate | Key Limitations |
|---|---|---|---|---|
| MeDIP-Seq | Low density (<5 CpG/100 bp) | >95% | >95% | Cannot provide single-base resolution; not suitable for base pair analysis |
| RRBS | High density (≥3 CpG/100 bp) | <20% | ~75% | Targets only CpG islands; restriction enzyme selection bias |
| WGBS | Broad density (≥2 CpG/100 bp) | ~50% | ~75% | High sequencing depth required; higher cost |
| Methylation Arrays | Manufacturer-defined sites | <3% of total CpGs | >95% | Limited to pre-defined CpG sites; no discovery capability |
Solution: Select the appropriate method based on your research question and coverage needs. For genome-wide discovery, MeDIP-Seq provides the broadest coverage, while WGBS offers a balance between base-resolution and coverage. For targeted approaches, RRBS or targeted panels are cost-effective but cover limited genomic regions [95].
How does CpG density vary across genomes, and why does this matter for experimental design?
The majority (>90%) of vertebrate genomes fall into low CpG density categories (1-3 CpGs/100 bp), while less than 10% of the genome contains higher density regions (>5 CpGs/100 bp) [95]. This distribution is consistent across human, rat, bird, and fish genomes. Since different methods target different density regions, understanding this distribution is crucial for selecting appropriate methodologies and interpreting results.
Methylation Call Reproducibility
Why do I get different methylation results across replicates or between laboratories?
Methylation studies are particularly vulnerable to technical variability, with seemingly minor experimental variations significantly impacting outcomes [96]. A controlled study across three laboratories using identical rat strains identified 3,852 differentially methylated and 1,075 differentially expressed genes between laboratories—despite no experimental intervention [96].
Key sources of irreproducibility:
- Animal vendor sources: Different vendors introduce significant variation
- Husbandry procedures: Caging, diet, and handling differences
- Tissue extraction protocols: Minor variations in dissection or processing
- Batch effects: Especially prominent in MeDIP-Seq protocols [95]
Solution: Implement strict protocol standardization and include within-laboratory controls [96] [97]. For multi-site studies, ensure identical vendors, harmonized procedures, and standardized tissue processing. Additionally, consider that the correlation between methylation changes and gene expression changes can be surprisingly low (0-5% overlap between DMGs and DEGs in controlled studies) [96].
How can I distinguish true biological methylation signals from technical artifacts?
True biological signals should be consistent across properly controlled replicates and correlate with known biological features. Technical artifacts often appear as:
- Systematic differences between processing batches
- Inconsistent results across methodological approaches
- Lack of correlation with biological outcomes
Validation approach:
- Use orthogonal methods (e.g., compare array-based and sequencing-based results) [21]
- Implement cross-laboratory validation when possible
- Apply stringent quality controls and filtering thresholds
Experimental Protocols & Methodologies
Protocol 1: Assessing Alignment Accuracy with Simulated BS-seq Data
Purpose: Systematically evaluate the performance of bisulfite sequencing alignment algorithms [94].
Methodology:
- Genome Preparation: Use reference genome (e.g., NCBI build37/HG19) and randomly assign methylation status:
- 20% of CGs as unmethylated (convert C to T)
- 75% as fully methylated (C remains C)
- 5% as partially methylated (10-90% methylation)
- Assume all non-CG sites are unmethylated (C to T)
Read Simulation: Use dwgsim tool with parameters:
Alignment Evaluation:
- Map simulated reads using multiple aligners (GNUMAP-bs, BSMAP, Bismark, etc.)
- Use parameters allowing 3-4 bp differences in 100-bp reads
- Allow up to 20 multiple mapping locations
- Calculate sensitivity and false positive rates
Expected Outcomes: Probabilistic aligners should achieve 96-97% sensitivity compared to 93-94% for heuristic methods [94].
Protocol 2: Evaluating Cross-Platform Concordance
Purpose: Validate that bisulfite sequencing replicates results from methylation arrays [21].
Methodology:
- Sample Preparation:
- Extract DNA from matched samples (e.g., ovarian tissue and cervical swabs)
- Divide each sample for both array and sequencing analysis
Bisulfite Conversion:
- Use EZ DNA methylation kit for array analysis
- Use EpiTect Bisulfite kit for sequencing analysis
Parallel Processing:
- Array Analysis: Process on Infinium Methylation EPIC platform
- Sequencing: Process using custom targeted methyl panel (e.g., QIAseq Targeted Methyl Custom Panel)
Quality Control:
- Exclude samples with coverage <30X in >1/3 CpG sites
- Remove CpG sites with <30X coverage in >50% of samples
- Mark datapoints with coverage <30X as "missing"
Concordance Assessment:
- Calculate Spearman correlation between beta values
- Perform Bland-Altman analysis
- Evaluate preservation of diagnostic clustering patterns
Expected Results: Strong sample-wise correlation between platforms, particularly in high-quality tissue samples (slightly reduced concordance in lower-quality samples like cervical swabs) [21].
Visualizations
Bisulfite Sequencing Alignment Challenge
CpG Density Distribution and Method Bias
Methylation Call Reproducibility Factors
The Scientist's Toolkit: Research Reagent Solutions
Table 2: Essential Reagents and Tools for BS-seq Quality Control
| Category | Specific Tool/Reagent | Function/Purpose | Key Considerations |
|---|---|---|---|
| Alignment Algorithms | GNUMAP-bs | Probabilistic alignment for BS-seq data | Higher sensitivity (97%) vs heuristic methods; integrates base quality scores [94] |
| Bismark | Burrows-Wheeler transform-based aligner | Limited indel support; reports up to 2 valid alignments [94] | |
| LAST | Variable-length seed extension aligner | Uses quality information; high sensitivity (96.9%) [94] | |
| Methylation Detection Methods | MeDIP-Seq | Antibody-based methylation enrichment | Covers >95% of genome; biased to low CpG density regions [95] |
| RRBS | Restriction enzyme-based reduction | Covers <20% of genome; targets high CpG density regions [95] | |
| WGBS | Whole-genome bisulfite sequencing | Covers ~50% of genome; requires high sequencing depth [95] | |
| Oxidative Bisulfite Sequencing | Distinguishes 5mC from 5hmC | Provides base resolution; differentiates methylation forms [11] | |
| Quality Control Tools | Nanopolish | Detection of modified bases from nanopore data | Groups proximal CpGs; provides methylation log-likelihood ratios [98] |
| Bowtie/BWA | Standard read alignment | Suitable for MeDIP-Seq; not for bisulfite-converted reads [95] | |
| Laboratory Reagents | EZ DNA Methylation Kit | Bisulfite conversion for arrays | Optimized for array-based applications [21] |
| EpiTect Bisulfite Kit | Bisulfite conversion for sequencing | Designed for sequencing applications [21] | |
| QIAseq Targeted Methyl Panel | Custom targeted methylation sequencing | Cost-effective for large sample sets; customizable targets [21] |
Leveraging Interactive Platforms for Continuous Benchmarking of QC Workflows
In the field of DNA methylation research, particularly in bisulfite sequencing (BS-seq), quality control (QC) is paramount for generating accurate, reproducible data. The integration of interactive platforms enables continuous benchmarking of QC workflows, allowing researchers to compare performance metrics across tools, protocols, and laboratories in real-time. This approach is transforming traditional, static QC into a dynamic process that adapts to new data and methodologies, which is especially critical for clinical applications like cancer biomarker detection where methylation patterns serve as diagnostic tools [72] [21]. This technical support center provides targeted guidance for implementing these advanced QC strategies within the context of BS-seq data analysis, addressing both pre-alignment and post-alignment challenges.
Troubleshooting Guides
Pre-Alignment Quality Control Issues
Low Conversion Efficiency in Bisulfite Treatment
- Problem: Incomplete conversion of unmethylated cytosines to uracils leads to false positive methylation calls.
- Troubleshooting Steps:
- Verify Reagent Quality: Ensure fresh bisulfite reagents are used; degraded reagents cause incomplete conversion.
- Optimize Reaction Conditions: For conventional bisulfite sequencing (CBS-seq), extend incubation time or slightly increase temperature per manufacturer guidelines. Consider switching to Ultra-Mild Bisulfite Sequencing (UMBS-seq) which uses optimized bisulfite formulation at 55°C for 90 minutes to enhance efficiency while reducing DNA damage [1].
- QC Check: Measure conversion efficiency using unmethylated lambda phage DNA controls. The conversion rate should be ≥98% [99]. Rates below this threshold indicate need for protocol optimization.
Excessive DNA Fragmentation Post-Bisulfite Treatment
- Problem: Severe DNA degradation following bisulfite treatment, particularly problematic for low-input samples like cell-free DNA (cfDNA).
- Troubleshooting Steps:
- Implement Milder Protocols: Adopt UMBS-seq which causes significantly less DNA fragmentation compared to conventional methods while maintaining high conversion efficiency [1].
- Assess DNA Integrity: Use bioanalyzer electrophoresis to verify fragment size distribution post-treatment. UMBS-seq better preserves the characteristic cfDNA triple-peak profile compared to UBS-seq [1].
- Modify Input Requirements: If using enzymatic methods like EM-seq, note that although fragmentation is reduced, DNA recovery may be lower due to multiple purification steps [1].
Low Library Complexity in Low-Input Samples
- Problem: High duplication rates in sequencing libraries prepared from limited starting material (e.g., cfDNA, FFPE samples).
- Troubleshooting Steps:
- Protocol Selection: Implement UMBS-seq which consistently produces higher library yields and lower duplication rates than both CBS-seq and EM-seq across input levels from 5 ng to 10 pg [1].
- Library Amplification Optimization: Reduce PCR cycles and incorporate unique molecular identifiers (UMIs) to distinguish true biological duplicates from technical duplicates.
- Complexity Monitoring: Calculate library complexity metrics using FastQC or similar tools. UMBS-seq demonstrates substantially higher complexity (lower duplication rates) than CBS-seq libraries and performs comparably to or better than EM-seq [1].
Post-Alignment Quality Control Issues
Low Mapping Efficiency
- Problem: Poor alignment rates of bisulfite-converted reads to reference genomes.
- Troubleshooting Steps:
- Alignment Tool Selection: Utilize conversion-aware aligners like Bismark, Bismark (BAT), or BSBolt that account for C-to-T conversions [72].
- Reference Genome Preparation: Ensure proper bisulfite-converted reference genomes are used. The ENCODE pipeline uses a Bismark-transformed, Bowtie-indexed genome [99].
- Workflow Consistency: Implement standardized workflows like the ENCODE Uniform Processing Pipeline which specifies alignment to both primary and lambda genomes for quality assessment [99].
Inconsistent Methylation Calls Between Replicates
- Problem: Poor correlation of methylation beta values between biological replicates.
- Troubleshooting Steps:
- Coverage Verification: Ensure sufficient sequencing depth - the ENCODE standard requires ≥30X coverage for each replicate [99].
- Statistical QC: Calculate Pearson correlation between replicates' methylation states at CpG sites. The ENCODE standard requires ≥0.8 correlation for sites with ≥10X coverage [99].
- Filtering Implementation: Remove CpG sites with coverage <30X in more than 50% of samples, and exclude samples with coverage <30X in more than one-third of CpG sites [21].
Background Noise and False Positives
- Problem: Elevated unconverted cytosine background, particularly problematic in low-input samples.
- Troubleshooting Steps:
- Background Assessment: Quantify unconverted cytosines in unmethylated control regions. UMBS-seq consistently generates very low background levels (~0.1%) across all input amounts, while EM-seq shows significantly higher background signals exceeding 1% at lowest inputs [1].
- Read Filtering: For EM-seq data, filter out reads containing more than five unconverted cytosines, which reduces background noise from 2% to 0.4% [1].
- Platform Selection: For low-input applications, consider that UMBS-seq demonstrates lower and more consistent background across input levels compared to both CBS-seq and EM-seq [1].
Frequently Asked Questions (FAQs)
General Workflow Questions
What are the key advantages of continuous benchmarking for BS-seq QC workflows? Continuous benchmarking allows real-time comparison of workflow performance across multiple metrics including mapping efficiency, duplication rates, coverage uniformity, and methylation calling accuracy. This approach identifies superior workflows and reveals development trends, ensuring labs maintain state-of-the-art practices as new tools emerge [72].
How can interactive platforms enhance traditional QC processes? Interactive platforms provide adaptable data presentation that can be customized to user-defined criteria, allowing researchers to focus on metrics most relevant to their specific applications. These platforms are readily expandable to incorporate new software tools and benchmarking datasets as they become available [72].
Technical Methodology Questions
What specific QC metrics should I monitor for BS-seq data? Key metrics include: bisulfite conversion efficiency (should be ≥98%), coverage uniformity (≥30X coverage per replicate), correlation between biological replicates (Pearson correlation ≥0.8 for CpG sites with ≥10X coverage), mapping efficiency, library complexity, and background conversion rates [99] [21].
Which bisulfite sequencing method performs best with low-input DNA? UMBS-seq outperforms both conventional bisulfite sequencing and enzymatic methods (EM-seq) for low-input DNA samples across multiple metrics: higher library yields, greater complexity (lower duplication rates), longer insert sizes, better GC coverage uniformity, and lower background signals, particularly at inputs below 1ng [1].
Data Analysis Questions
How do I resolve discrepancies between methylation array and sequencing results? Ensure proper targeting of comparable CpG sites between platforms. In comparative studies, limit analysis to sites shared between the array and BS-seq panel. Implement rigorous QC filters: remove CpG sites with <30X coverage in >50% of samples, and exclude samples with <30X coverage in >1/3 of CpG sites [21].
What are the recommended computational workflows for BS-seq data processing? Comprehensive benchmarks identify several workflows that consistently demonstrate superior performance, including BAT, Biscuit, Bismark, BSBolt, and others. Selection should consider specific protocol requirements (e.g., standard WGBS vs. low-input methods like PBAT or T-WGBS) and analysis objectives [72].
Quantitative Data Tables
Table 1: Performance Comparison of DNA Methylation Detection Methods
| Method | Optimal Input | Conversion Efficiency | Background Noise | DNA Damage | Library Complexity | Best Application |
|---|---|---|---|---|---|---|
| Conventional BS-seq | High (μg) | ~98% (with optimization) | <0.5% | Severe fragmentation | Low (high duplication) | Standard samples with abundant DNA [1] |
| EM-seq | Moderate to low | Variable, decreases with low input | >1% at low inputs | Minimal fragmentation | Moderate | Limited DNA material, but not ultralow inputs [1] |
| UMBS-seq | Broad (5ng to 10pg) | >99% | ~0.1% (consistent across inputs) | Minimal fragmentation | High (low duplication) | Low-input samples, cfDNA, clinical applications [1] |
| T-WGBS | Low (30ng) | >98% | <0.5% | Moderate | Moderate | Low-input research applications [72] |
Table 2: Quality Control Standards for BS-seq Experiments
| QC Metric | Minimum Standard | Optimal Performance | Calculation Method |
|---|---|---|---|
| Bisulfite Conversion Rate | ≥98% [99] | ≥99% | Unmethylated lambda DNA control |
| Coverage Depth | ≥30X per replicate [99] | ≥50X | SamTools, Bismark metrics |
| Replicate Correlation | Pearson r ≥0.8 (CpG sites with ≥10X coverage) [99] | Pearson r ≥0.9 | Correlation of beta values at CpG sites |
| Mapping Efficiency | Protocol-dependent | >70% | Alignment statistics from Bismark, BWA-meth |
| Library Complexity | Protocol-dependent | Duplication rate <20% | MarkDuplicates, FastQC |
Table 3: Research Reagent Solutions for BS-seq QC Workflows
| Reagent/Kit | Primary Function | Key Features | Best For |
|---|---|---|---|
| EZ DNA Methylation-Gold Kit (Zymo Research) | Bisulfite conversion | Standardized conversion protocol | Conventional BS-seq with sufficient input DNA [21] |
| EpiTect Bisulfite Kit (QIAGEN) | Bisulfite conversion | Reduced DNA degradation | Targeted BS-seq panels [21] |
| NEBNext EM-seq Kit | Enzymatic conversion | Reduced DNA fragmentation, no bisulfite | Applications where DNA integrity is critical [1] |
| UMBS Formulation | Ultra-mild bisulfite conversion | Minimal DNA damage, high efficiency | Low-input DNA, cfDNA, clinical samples [1] |
| QIAseq Targeted Methyl Panel | Targeted methylation sequencing | Custom panel design, low input requirements | Biomarker validation, clinical assay development [21] |
| Maxwell RSC Tissue DNA Kit | DNA extraction from tissues | High-quality DNA from FFPE/frozen | Cancer biospecimens [21] [100] |
| QIAamp DNA Mini Kit | DNA extraction from swabs | Efficient isolation from low-yield samples | Cervical swabs, other clinical specimens [21] |
Workflow Visualization
BS-seq QC Interactive Benchmarking Platform
BS-seq Experimental and Computational Workflow
Conclusion
A rigorous, multi-stage quality control protocol is non-negotiable for generating reliable and biologically meaningful results from BS-seq experiments. As outlined, this process begins with a solid foundational understanding of BS-seq-specific challenges, is executed through a meticulous methodological pipeline, is refined via proactive troubleshooting, and is ultimately validated through comparative benchmarking. The integration of these four intents creates a robust framework that safeguards against technical artifacts, from bisulfite conversion failures to alignment ambiguities. For the future of biomedical research, especially in sensitive applications like liquid biopsies and disease biomarker discovery, adopting these comprehensive QC standards is paramount. Emerging methodologies like EM-seq and long-read sequencing will continue to evolve the landscape, necessitating ongoing validation and adaptation of QC practices to ensure that DNA methylation data remains a powerful and trustworthy tool for scientific discovery and clinical innovation.
References
- 1. Ultra-mild bisulfite outperforms existing methods for 5- ... [https://www.nature.com/articles/s41467-025-66033-y]
- 2. Comparative performance evaluation of bisulfite [https://pmc.ncbi.nlm.nih.gov/articles/PMC11969950/]
- 3. Bisulfite sequencing in DNA methylation analysis [https://www.abcam.com/en-us/knowledge-center/dna-and-rna/bisulfite-sequencing]
- 4. Bisulfite-Converted DNA Quantity Evaluation: A Multiplex ... [https://www.frontiersin.org/journals/genetics/articles/10.3389/fgene.2021.618955/full]
- 5. BCREval: a computational method to estimate the bisulfite ... [https://bmcbioinformatics.biomedcentral.com/articles/10.1186/s12859-019-3334-z]
- 6. Analysis and performance assessment of the whole ... [https://pmc.ncbi.nlm.nih.gov/articles/PMC8963483/]
- 7. A Comprehensive Guide to DNA Methylation Sequencing ... [https://www.epicypher.com/resources/blog/a-comprehensive-guide-to-dna-methylation-sequencing-methods/]
- 8. Review Strategies for analyzing bisulfite sequencing data [https://www.sciencedirect.com/science/article/pii/S0168165617315936]
- 9. Differential methylation analysis for BS-seq data under ... [https://pmc.ncbi.nlm.nih.gov/articles/PMC12157722/]
- 10. DNA Methylation: Bisulfite Sequencing Workflow [https://nbis-workshop-epigenomics.readthedocs.io/en/latest/content/tutorials/methylationSeq/Seq_Tutorial.html]
- 11. Bisulfite Sequencing (BS-Seq)/WGBS [https://www.illumina.com/techniques/sequencing/methylation-sequencing/bisulfite-sequencing.html]
- 12. a roadmap for DNA methylation biomarkers in liquid biopsies [https://www.nature.com/articles/s41388-025-03624-5]
- 13. Ultrafast bisulfite sequencing detection of 5-methylcytosine ... [https://www.nature.com/articles/s41587-023-02034-w]
- 14. Garbage In, Garbage Out: Dealing with Data Errors ... [https://blog.omni-inc.com/blog/garbage-in-garbage-out-dealing-with-data-errors-bioinformatics]
- 15. 10 Ways to Improve Your Bisulfite Sequencing Results [https://bitesizebio.com/9957/10-ways-to-improve-your-bisulfite-sequencing-results/]
- 16. Clinical validation of a DNA methylation biomarker ... [https://pubmed.ncbi.nlm.nih.gov/41175040/]
- 17. Clinical validation of a DNA methylation biomarker to ... [https://www.medrxiv.org/content/10.1101/2024.09.18.24312711v1]
- 18. Library Preparation for Genome-Wide DNA Methylation ... [https://pmc.ncbi.nlm.nih.gov/articles/PMC12602117/]
- 19. Computational Workflow for Genome-Wide DNA ... [https://pubmed.ncbi.nlm.nih.gov/41230550/]
- 20. msPIPE: a pipeline for the analysis and visualization of whole ... [https://bmcbioinformatics.biomedcentral.com/articles/10.1186/s12859-022-04925-2]
- 21. Comparative Performance of Methylation Array and ... [https://pmc.ncbi.nlm.nih.gov/articles/PMC12589796/]
- 22. A Step-by-Step Guide to EM-Seq: From DNA Extraction ... [https://www.cd-genomics.com/resource-em-seq-workflow-sample-extraction-library-construction.html]
- 23. BSeQC: quality control of bisulfite sequencing experiments [https://pmc.ncbi.nlm.nih.gov/articles/PMC3842756/]
- 24. Targeted alignment and end repair elimination increase ... [https://bmcgenomics.biomedcentral.com/articles/10.1186/s12864-016-2494-8]
- 25. How to Troubleshoot Sequencing Preparation Errors (NGS ... [https://www.cd-genomics.com/resource-sequencing-preparation-troubleshooting.html]
- 26. How To Best Deal With Adapter Contamination (Illumina)? [https://www.biostars.org/p/3461/]
- 27. Soft-clipping of reads may add potentially unwanted ... [https://sequencing.qcfail.com/articles/soft-clipping-of-reads-may-add-potentially-unwanted-alignments-to-repetitive-regions/]
- 28. QIAGEN Bioinformatics Manuals [https://resources.qiagenbioinformatics.com/manuals/clcgenomicsworkbench/1202/index.php?manual=Map_Bisulfite_Reads_Reference.html]
- 29. Glossary of Terms | BISCUIT [https://huishenlab.github.io/biscuit/docs/glossary.html]
- 30. FastQC Tutorial & FAQ - Research Technology Support Facility [https://rtsf.natsci.msu.edu/genomics/technical-documents/fastqc-tutorial-and-faq.aspx]
- 31. Bisulfite Sequencing of DNA - PMC [https://pmc.ncbi.nlm.nih.gov/articles/PMC3214597/]
- 32. Bisulfite Protocol [https://stuparlab.cfans.umn.edu/protocols/bisulfite-protocol]
- 33. Trim galore gets stuck on quality and adapter trimming #178 [https://github.com/FelixKrueger/TrimGalore/issues/178]
- 34. Issues with adapter trimming (Trim Galore) [https://bioinformatics.stackexchange.com/questions/22601/issues-with-adapter-trimming-trim-galore]
- 35. Quality-, adapter- and RRBS-trimming with Trim Galore! [https://www.seqanswers.com/forum/bioinformatics/bioinformatics-aa/16050-quality-adapter-and-rrbs-trimming-with-trim-galore/page7]
- 36. Trim Galore error due to problematic fastq format - Galaxy Help [https://help.galaxyproject.org/t/trim-galore-error-due-to-problematic-fastq-format/1253]
- 37. Bisulfite Sequencing: Introduction, Features, Workflow, and ... [https://www.cd-genomics.com/resource-bisulfite-sequencing.html]
- 38. Automating pre-alignment (and post-alignment) quality ... [https://www.biostars.org/p/174393/]
- 39. AdapterRemoval: easy cleaning of next-generation ... [https://pmc.ncbi.nlm.nih.gov/articles/PMC3532080/]
- 40. Benchtop Tips to Improve the Reliability and Consistency ... [https://www.epigentek.com/catalog/benchtop-tips-to-improve-the-reliability-and-consistency-of-bisulfite-conversion-assays-n-200.html?newsPath=15&srsltid=AfmBOoriwlloz9mNPMoWWTaX7-cKdKX4FFHLkVqLGIhxT5UxDVOJoEOp]
- 41. A Researcher's Guide to Successful DNA Bisulfite Conversion [https://www.whatisepigenetics.com/a-researchers-guide-to-successful-dna-bisulfite-conversion/]
- 42. Bisulfite Conversion for Illumina Methylation Arrays [https://www.zymoresearch.com/blogs/blog/bisulfite-conversion-for-illumina-methylation-arrays?srsltid=AfmBOooewb6TVcwY9gyUSZ2U1HyR1YVe3QtSy4eeqy7Bq7ahOAUxTDtt]
- 43. Manipulating base quality scores enables variant calling from ... [https://bmcgenomics.biomedcentral.com/articles/10.1186/s12864-022-08691-6]
- 44. Accelerating the alignment processing speed of ... [https://pmc.ncbi.nlm.nih.gov/articles/PMC10329742/]
- 45. Bug in bismark alignment command · Issue #210 · nf-core/ ... [https://github.com/nf-core/methylseq/issues/210]
- 46. Broken pipe, no alignments written to bam file. · Issue #15... [https://github.com/brentp/bwa-meth/issues/15]
- 47. IOError: Paired End Reads · Issue #32 · brentp/ bwa - meth · GitHub [https://github.com/brentp/bwa-meth/issues/32]
- 48. Bismark alignment fails with "Exiting because chromosome ... [https://github.com/FelixKrueger/Bismark/issues/166]
- 49. Problems with my Bismark Mapper results [https://help.galaxyproject.org/t/problems-with-my-bismark-mapper-results/9435]
- 50. Should I remove PCR duplicates from my RNA-seq data? | DNA Technologies Core [https://dnatech.genomecenter.ucdavis.edu/faqs/should-i-remove-pcr-duplicates-from-my-rna-seq-data/]
- 51. Removing PCR duplicates in RNA-seq Analysis [https://bioinformatics.stackexchange.com/questions/2282/removing-pcr-duplicates-in-rna-seq-analysis]
- 52. Elimination of PCR duplicates in RNA-seq and small RNA-seq using unique molecular identifiers | BMC Genomics | Full Text [https://bmcgenomics.biomedcentral.com/articles/10.1186/s12864-018-4933-1]
- 53. Objective and Comprehensive Evaluation of Bisulfite Short ... [https://pmc.ncbi.nlm.nih.gov/articles/PMC4009243/]
- 54. Alignment - Bismark [https://felixkrueger.github.io/Bismark/bismark/alignment/]
- 55. Remove duplicates from reads: best practices? [https://www.biostars.org/p/230822/]
- 56. Sequence Bias Bismark Output Interpretation [https://www.biostars.org/p/259801/]
- 57. Bismark Meth. Extractor not generating coverage files [https://help.galaxyproject.org/t/bismark-meth-extractor-not-generating-coverage-files/6125]
- 58. methylseq: Usage [https://nf-co.re/methylseq/4.1.0/docs/usage/bs-seq-primer/]
- 59. Possible bug for bismark when methylation calling ? #69 [https://github.com/FelixKrueger/Bismark/issues/69]
- 60. PiGx BS-seq [http://bioinformatics.mdc-berlin.de/pigx_docs/pigx-bs-seq.html]
- 61. methylseq: Usage [https://nf-co.re/methylseq/dev/docs/usage/bs-seq-primer]
- 62. Differential methylation analysis for bisulfite sequencing ... [https://pmc.ncbi.nlm.nih.gov/articles/PMC8171293/]
- 63. ViewBS: a powerful toolkit for visualization of high-throughput ... [https://pmc.ncbi.nlm.nih.gov/articles/PMC5860610/]
- 64. Identification and resolution of artifacts in bisulfite sequencing [https://www.sciencedirect.com/science/article/abs/pii/S1046202302000609]
- 65. DNA Methylation Analysis Support—Troubleshooting [https://www.thermofisher.com/us/en/home/technical-resources/technical-reference-library/epigenetics-support-center/dna-methylation-analysis-support/dna-methylation-analysis-support-troubleshooting.html]
- 66. Bisulfite sequencing, but at what cost? [https://www.neb.com/en-us/nebinspired-blog/bisulfite-sequencing-but-at-what-cost?srsltid=AfmBOoq9YGx6B2znxkQslsVlH_DAxHd0qBiMAGH8V3vpk_z3K7uxTeSW]
- 67. Library end-repair reaction introduces methylation biases ... [https://sequencing.qcfail.com/articles/library-end-repair-reaction-introduces-methylation-biases-in-paired-end-pe-bisulfite-seq-applications/]
- 68. Bisulfite Conversion for Illumina Methylation Arrays [https://www.zymoresearch.com/blogs/blog/bisulfite-conversion-for-illumina-methylation-arrays?srsltid=AfmBOopCkifKR9miiNX0l3mFkUrh4Cs78oNmoXJNzCE1_cpXysl5K-hg]
- 69. A Practical Guide to the Measurement and Analysis of DNA ... [https://pmc.ncbi.nlm.nih.gov/articles/PMC6775954/]
- 70. Comparison of EM-seq and PBAT methylome library methods ... [https://pmc.ncbi.nlm.nih.gov/articles/PMC9542412/]
- 71. Practical Case Studies for Comparison Between EM-seq ... [https://www.cd-genomics.com/resource-em-seq-comparison-wgbs-pbat-case.html]
- 72. PMC - PubMed Central [https://pmc.ncbi.nlm.nih.gov/articles/PMC12539629/]
- 73. Standard vs Low Input Workflow selection FAQ for Illumina ... [https://knowledge.illumina.com/library-preparation/dna-library-prep/library-preparation-dna-library-prep-faq-list/000003460]
- 74. low input by PCR (SQK-LSK114 with EXP-PCA001) [https://nanoporetech.com/document/ligation-sequencing-gdna-low-input-by-pcr-sqk-lsk114-with-exp]
- 75. context-aware alignment of bisulfite-sequencing reads [https://link.springer.com/article/10.1186/s12859-025-06182-5]
- 76. Trade-offs in LLM Benchmarking: Speed vs. Accuracy [https://latitude.so/blog/trade-offs-in-llm-benchmarking-speed-vs-accuracy/]
- 77. Top Artificial Intelligence Workflows for Modern Enterprises in ... [https://www.kuse.ai/blog/insight/top-artificial-intelligence-workflows-for-modern-enterprises-in-2025]
- 78. Assessment of bisulfite sequencing alignment tools for ... [https://www.sciencedirect.com/science/article/abs/pii/S0141813025014898]
- 79. Principles and Workflow of Whole Genome Bisulfite ... [https://www.cd-genomics.com/principles-and-workflow-of-whole-genome-bisulfite-sequencing.html]
- 80. Assessment of RainDrop BS-seq as a method for large-scale ... [https://pmc.ncbi.nlm.nih.gov/articles/PMC4063826/]
- 81. Medium throughput bisulfite sequencing for accurate detection ... [https://bmcgenomics.biomedcentral.com/articles/10.1186/s12864-017-3489-9]
- 82. Strategies for analyzing bisulfite sequencing data [https://pubmed.ncbi.nlm.nih.gov/28822795/]
- 83. BiSulfite Bolt: A bisulfite sequencing analysis platform - PMC [https://pmc.ncbi.nlm.nih.gov/articles/PMC8106542/]
- 84. An alignment algorithm for bisulfite sequencing using the ... [https://pmc.ncbi.nlm.nih.gov/articles/PMC2905549/]
- 85. Evaluating Reproducibility and Best Practices for Replicate ... [https://www.mdpi.com/1422-0067/26/19/9769]
- 86. Comparison and quantitative verification of mapping ... [https://pmc.ncbi.nlm.nih.gov/articles/PMC3973287/]
- 87. Bismark [https://felixkrueger.github.io/Bismark/]
- 88. Comprehensive comparison of enzymatic and bisulfite DNA ... [https://pmc.ncbi.nlm.nih.gov/articles/PMC12495756/]
- 89. Comparison of current methods for genome-wide DNA ... [https://pmc.ncbi.nlm.nih.gov/articles/PMC12376410/]
- 90. WGBS vs. EM-seq: Key Differences in Principles, Pros ... [https://www.cd-genomics.com/resource-em-seq-wgbs-comparison-workflow-applications.html]
- 91. Choosing the Appropriate DNA Methylation Sequencing ... [https://www.cd-genomics.com/resource-how-choose-dna-methylation-sequencing-technology.html]
- 92. Whole Genome Methylation Sequencing via Enzymatic ... [https://pubmed.ncbi.nlm.nih.gov/39546198/]
- 93. MeDIP Application Protocol [https://www.epigentek.com/catalog/medip-application-protocol-n-33.html?srsltid=AfmBOorPjciOjNH0LClzYic30p5WYMJIOxr6xO_sHX2U7RaxP-huuTgV]
- 94. Probabilistic alignment leads to improved accuracy and read ... [https://pmc.ncbi.nlm.nih.gov/articles/PMC3924334/]
- 95. Genome-wide CpG density and DNA methylation analysis ... [https://pmc.ncbi.nlm.nih.gov/articles/PMC9067529/]
- 96. The impact of methodology on the reproducibility and rigor ... [https://www.nature.com/articles/s41598-021-04346-w]
- 97. Evaluating the challenges and reproducibility of studies ... [https://pmc.ncbi.nlm.nih.gov/articles/PMC8978984/]
- 98. A comparison of methods for detecting DNA methylation from ... [https://genomebiology.biomedcentral.com/articles/10.1186/s13059-024-03207-9]
- 99. Whole-Genome Bisulfite Sequencing Data Standards and ... [https://www.encodeproject.org/data-standards/wgbs/]
- 100. Protocol for generating high-quality genome-scale DNA ... [https://www.sciencedirect.com/science/article/pii/S2666166723006810]