A Comprehensive Guide to Identifying and Validating Shine-Dalgarno Sequences in Genomic Data
This article provides a systematic framework for researchers and bioinformaticians to accurately identify and characterize Shine-Dalgarno (SD) sequences in prokaryotic genomes.
A Comprehensive Guide to Identifying and Validating Shine-Dalgarno Sequences in Genomic Data
Abstract
This article provides a systematic framework for researchers and bioinformaticians to accurately identify and characterize Shine-Dalgarno (SD) sequences in prokaryotic genomes. Covering foundational principles to advanced applications, we detail computational methods using free energy models and sequence analysis, address common challenges like sequence diversity and start codon mis-annotation, and outline experimental validation techniques. By integrating contemporary research on SD sequence variation and its impact on translation initiation, this guide serves as an essential resource for optimizing gene expression in synthetic biology and drug development efforts.
Understanding the Shine-Dalgarno Sequence: From Basic Mechanism to Genomic Diversity
Defining the Canonical SD Sequence and its Role in Translation Initiation
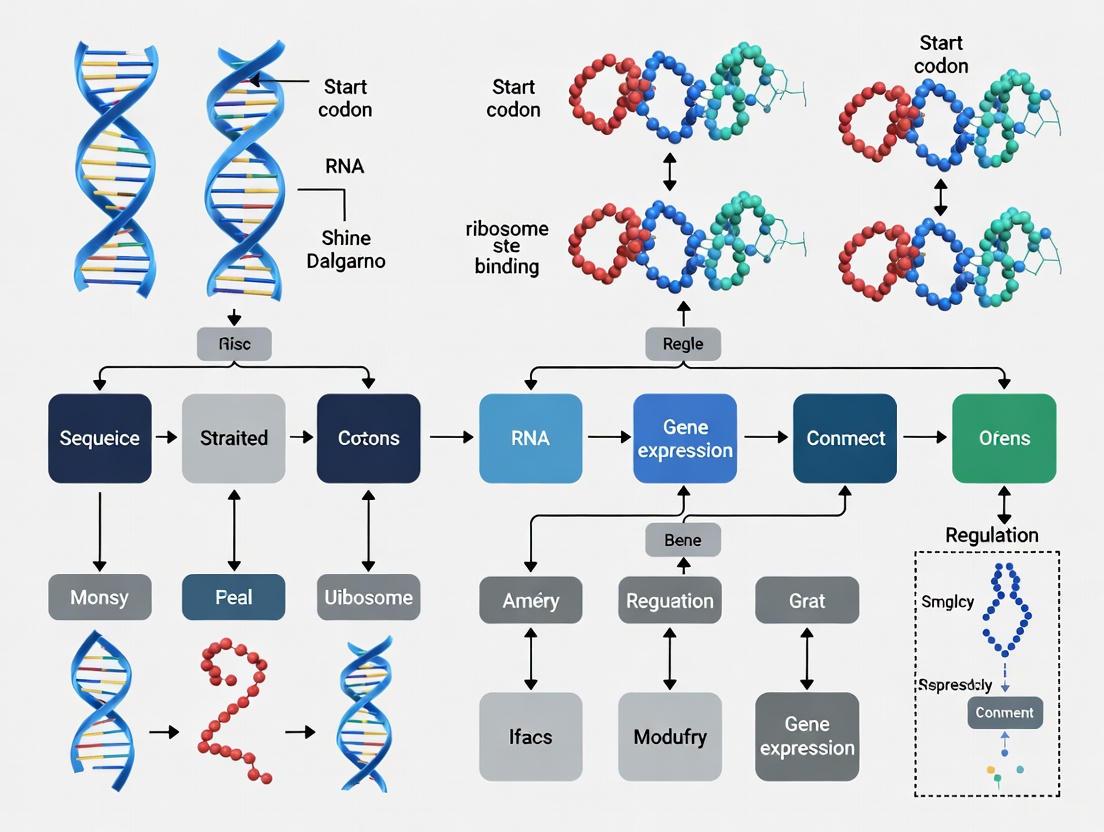
The Shine-Dalgarno (SD) sequence, a key ribosomal binding site in prokaryotic messenger RNA (mRNA), serves as a fundamental component for translational initiation by facilitating accurate start codon selection. This purine-rich sequence, typically located upstream of the start codon, base-pairs with the complementary anti-Shine-Dalgarno (aSD) sequence at the 3' end of 16S ribosomal RNA (rRNA), thereby aligning the ribosome for proper initiation of protein synthesis. This whitepaper provides an in-depth technical examination of the canonical SD sequence, its molecular mechanisms, experimental methodologies for identification and analysis, and its implications for genomic research and drug development. Framed within the context of bacterial genomics, we present a comprehensive guide for researchers investigating translational regulation in prokaryotic systems.
Historical Context and Discovery
The Shine-Dalgarno sequence was first identified and proposed by Australian scientists John Shine and Lynn Dalgarno in 1973 through their investigation of nucleotide sequences in bacterial mRNAs and their complementarity to the 3' end of 16S ribosomal RNA [1]. Their seminal work revealed that a conserved pyrimidine-rich tract at the 3' end of Escherichia coli 16S rRNA (5'-YACCUCCUUA-3') recognized a complementary purine-rich sequence (5'-AGGAGGU-3') positioned upstream of the initiation codon AUG in several bacteriophage mRNAs [1]. This complementary base-pairing mechanism was established as crucial for ribosome positioning and initiation site selection in prokaryotes.
Biological Significance in Translation Initiation
In the canonical translation initiation pathway, the SD sequence functions as a positioning element that recruits the 30S ribosomal subunit to the mRNA through specific RNA-RNA interactions [1] [2]. This recruitment aligns the ribosome such that the initiation codon is correctly positioned in the ribosomal P-site, facilitating the start of protein synthesis. The strength of the SD-aSD interaction influences translational efficiency, with optimal spacing between the SD sequence and start codon being critical for maximal protein expression [1]. While the SD mechanism predominates in bacteria, it also occurs in archaea and certain organelles, though with varying frequency and conservation [1] [3].
Defining the Canonical SD Sequence
Consensus Sequence and Variations
The canonical SD sequence exhibits a core consensus motif, though specific sequences vary across bacterial species and genetic contexts. The table below summarizes key variations of the SD sequence across different biological contexts.
Table 1: SD Sequence Variations Across Biological Contexts
| Biological Context | Consensus Sequence | Notes | Reference |
|---|---|---|---|
| E. coli Consensus | 5'-AGGAGGU-3' | Most common canonical form | [1] |
| E. coli Virus T4 Early Genes | 5'-GAGG-3' | Shorter, dominant motif in phage | [1] |
| General Bacterial Consensus | 5'-AGGAGG-3' | Six-base core consensus | [1] [4] |
| Plastid/Chloroplast | Variable | Similar to bacterial consensus | [3] |
The six-base consensus sequence AGGAGG represents the most prevalent pattern, though natural variations exist that maintain complementarity to the aSD sequence of 16S rRNA [1] [4]. In E. coli, the extended sequence AGGAGGU is common, while the shorter GAGG motif dominates in T4 phage early genes [1]. The position of the SD sequence is typically 6-10 nucleotides upstream of the start codon AUG, with an optimal spacing of approximately 8 bases established in E. coli [1] [4].
Molecular Mechanism of SD-aSD Interaction
The SD sequence functions through specific Watson-Crick base pairing with the aSD sequence located at the 3' terminus of 16S rRNA (5'-CCUCCU-3' in E. coli) [1] [2]. This interaction positions the ribosomal machinery precisely for initiation complex formation. The degree of complementarity between SD and aSD sequences correlates with translation initiation efficiency, though even suboptimal pairings can support translation under certain conditions [1] [5].
Diagram: Molecular Mechanism of SD-aSD Mediated Translation Initiation
The diagram illustrates how the SD sequence on mRNA interacts with the complementary aSD sequence on the 16S rRNA component of the 30S ribosomal subunit, leading to formation of the translation initiation complex with proper positioning at the start codon.
Experimental Methods for SD Sequence Analysis
Ribosome Profiling for Genome-Wide Analysis
Ribosome profiling (ribo-seq) provides a powerful methodology for assessing SD-dependent translation on a genomic scale. This technique involves deep sequencing of ribosome-protected mRNA fragments, allowing researchers to map translational efficiency across the entire transcriptome [3].
Table 2: Key Research Reagents for SD Sequence Analysis
| Reagent/Technique | Function/Application | Experimental Context |
|---|---|---|
| Ribosome Profiling | Genome-wide analysis of translation efficiency | Identification of SD-dependent genes [3] |
| aSD Mutant Ribosomes | Testing SD-aSD interaction requirement | Transplastomic tobacco lines with mutated 16S rRNA [3] |
| SiM-KARTS | Single-molecule kinetics of SD accessibility | PreQ1 riboswitch studies in T. tengcongensis [6] |
| Anti-SD Probe | Fluorescent detection of SD accessibility | Cy5-labeled RNA complementary to SD sequence [6] |
| HMM Analysis | Quantifying binding kinetics from single-molecule data | Analysis of SiM-KARTS trajectories [6] |
Protocol: Genome-Wide Ribosome Profiling for SD Sequence Analysis
- Cell Lysis and Ribosome Protection: Rapidly lyse bacterial cultures and treat with RNase I to digest mRNA regions not protected by ribosomes.
- Ribosome Fragment Isolation: Purify ribosome-protected mRNA fragments (∼30 nt) using sucrose gradient centrifugation or size selection.
- Library Construction: Convert protected fragments into a sequencing library with appropriate adapters.
- High-Throughput Sequencing: Perform deep sequencing to map ribosome positions across the genome.
- Bioinformatic Analysis: Align sequences to the reference genome and quantify ribosome density at translation initiation sites.
- SD Correlation Analysis: Correlate translational efficiency with predicted SD-aSD binding energies and sequence features.
This approach was successfully employed to demonstrate that weakened SD-aSD interactions through aSD mutations in tobacco plastids resulted in significantly reduced translation efficiency for many plastid-encoded genes [3].
Single-Molecule Kinetic Analysis (SiM-KARTS)
Single Molecule Kinetic Analysis of RNA Transient Structure (SiM-KARTS) enables direct observation of SD sequence accessibility and dynamics under various conditions [6].
Protocol: SiM-KARTS for SD Accessibility
- mRNA Immobilization: Engineer target mRNA with biotinylated capture strand and immobilize on streptavidin-coated quartz slide.
- Probe Design: Synthesize fluorescently labeled (Cy5) RNA anti-SD probe complementary to the SD sequence of interest.
- Visualization Marker: Hybridize TYE563-labeled locked nucleic acid (LNA) to distinct region of mRNA for localization.
- TIRF Microscopy: Image using total internal reflection fluorescence microscopy to visualize single molecules.
- Binding Kinetic Analysis: Flow anti-SD probe at defined concentrations and record binding/unbinding events over time.
- HMM Analysis: Apply Hidden Markov Models to extract dwell times in bound and unbound states (τbound and τunbound).
This methodology revealed that individual mRNA molecules alternate between conformational states with different SD accessibilities, and ligand binding (e.g., preQ1) decreases the lifetime of the high-accessibility state, providing direct mechanistic insight into translational regulation [6].
Diagram: SiM-KARTS Experimental Workflow
Evolutionary Conservation Analysis
Comparative evolutionary analysis assesses functional constraint on SD-like sequences within protein-coding genes by measuring nucleotide substitution rates across related species [5].
Protocol: Evolutionary Analysis of SD Sequences
- Homolog Identification: Assemble homologous protein families from multiple bacterial species (e.g., 61 Enterobacteriales species).
- Sequence Alignment: Perform multiple sequence alignment of coding regions.
- Substitution Rate Calculation: Quantify nucleotide-level substitution rates using tools like LEISR, normalizing by gene-wide averages.
- SD-like Motif Identification: Identify SD-like sequences within coding regions using binding energy thresholds (e.g., -4.5 kcal/mol).
- Control Selection: Implement paired-control strategies comparing substitution rates at SD-like sites versus:
- Codon controls: Same codon in different context
- Context controls: Same trinucleotide context in different position
- Statistical Testing: Compare substitution rates between SD-like and control sites to detect signatures of purifying selection (conservation) or accelerated evolution (deleterious effects).
This approach revealed that SD-like sequences within coding regions are generally not conserved and may be deleterious due to potential for spurious translation initiation, with strongest SD sequences showing least conservation [5].
Quantitative Analysis of SD Sequence Features
SD-aSD Binding Energies and Translational Efficiency
The binding energy between SD and aSD sequences significantly influences translational efficiency. Mutational studies demonstrate that alterations to either sequence affect protein synthesis rates, with compensatory mutations restoring translation [1] [3].
Table 3: Effect of aSD Mutations on SD-aSD Binding Energy
| aSD Mutation | Base Change | Effect on Pairing | ΔG Change | Biological Consequence |
|---|---|---|---|---|
| TCT | GC→GU | Weaker terminal pair (3H-bonds→2H-bonds) | Moderate increase | Mild reduction in translation [3] |
| CCC | Central mismatch | Purine-pyrimidine mismatch | Significant increase | Moderate translation defect [3] |
| CCA | Central mismatch | Purine-purine mismatch (more destabilizing) | Largest increase | Severe translation defect [3] |
Research in plastid systems demonstrated a pronounced correlation between predicted SD-aSD interaction strength and translation efficiency, though additional factors like mRNA secondary structure around the start codon significantly modulate this relationship [3]. mRNAs with strong secondary structures surrounding the start codon show greater dependence on SD-aSD interactions for efficient translation [3].
Genomic Distribution and Conservation Patterns
Analysis of SD sequence distribution across bacterial genomes reveals distinctive patterns between authentic initiation sites and internal SD-like sequences.
Conservation Metrics:
- Authentic 5' UTR SD sequences: Show significant enrichment compared to random expectation (1,998 vs. expected 638.57 in E. coli, p < 10⁻¹⁶) [5]
- Internal SD-like sequences: Significant depletion within protein-coding genes (25,001 vs. expected 30,397.57 in E. coli, p < 10⁻¹⁶) [5]
- Substitution rates: Internal SD-like sequences exhibit significantly higher substitution rates than control sites (ratio = 1.07, p < 0.001), indicating selective pressure against their maintenance [5]
These patterns suggest internal SD sequences are generally deleterious, likely due to potential for spurious internal translation initiation, which is supported by significant depletion of ATG start codons downstream of internal SD-like sequences [5].
Research Applications and Implications
SD Sequences in Synthetic Biology and Protein Engineering
The predictable nature of SD-aSD interactions enables rational engineering of translation initiation for recombinant protein production:
Design Principles:
- Incorporate strong SD sequences (e.g., AGGAGG) 6-8 nucleotides upstream of start codon
- Optimize spacer region to minimize secondary structure
- Consider binding energy thresholds for optimal initiation
- Avoid internal SD-like sequences in coding regions to prevent translational pausing and spurious initiation [5] [2]
Experimental evidence demonstrates that introducing SD sequences within coding regions negatively impacts protein accumulation, recommending their avoidance in heterologous expression designs [2].
SD Sequences as Therapeutic Targets
The essential nature of translation initiation in bacteria makes the SD-aSD interaction a potential target for antibacterial development:
Pathogen-Specific Applications:
- Mycobacterium tuberculosis: MazF-mt11 toxin cleaves 16S rRNA before the aSD sequence, inhibiting translation and potentially inducing persistence [7]
- Species-specific targeting: Sequence variations in aSD regions could enable selective antibacterial strategies
- Riboswitch therapeutics: Ligand-responsive SD sequestration in riboswitches (e.g., preQ1) presents opportunities for chemical intervention [6]
The canonical Shine-Dalgarno sequence represents a fundamental genetic element directing translation initiation in prokaryotic systems. Its definition extends beyond a simple consensus sequence to encompass positional constraints, binding energetics, and structural accessibility that collectively determine translational efficiency. Contemporary methodologies, including ribosome profiling, single-molecule analysis, and evolutionary approaches, provide powerful tools for identifying functional SD sequences in genomic contexts and quantifying their contributions to gene expression. Understanding these principles enables refined genomic annotation, optimized protein expression systems, and novel antibacterial strategies targeting this essential molecular interaction. As research continues to elucidate the complex relationship between SD sequence features and translational output, our ability to predict and manipulate gene expression in prokaryotic systems will continue to advance.
Translation initiation is a critical, rate-limiting step in protein synthesis in bacteria. The molecular mechanism underpinning this process often involves a canonical interaction between a sequence on the messenger RNA (mRNA) and its complementary sequence on the ribosomal RNA. This review delves into the specifics of the Shine-Dalgarno (SD) and anti-Shine-Dalgarno (aSD) base pairing mechanism, a foundational principle for ribosome recruitment and start codon selection in prokaryotes. For researchers identifying SD sequences in genomes, understanding this interaction's nuances—its sequence, spacing, strength, and the boundaries of the participating sequences—is paramount. This guide synthesizes current knowledge on the SD-aSD pairing, framing it within the practical context of genomic research and the emerging understanding that this mechanism is one of several initiation pathways whose utilization varies across bacterial species [8].
The Core Components of SD-aSD Interaction
The SD-aSD mechanism is an RNA-RNA interaction that facilitates the initial binding of the small ribosomal subunit (30S) to the mRNA. The key components are:
- The Shine-Dalgarno (SD) Sequence: This is a purine-rich tract located in the 5' untranslated region (5' UTR) of many bacterial mRNAs. The canonical sequence is 5'-AGGAGG-3', though significant variation exists both within and between genomes [1] [2].
- The Anti-Shine-Dalgarno (aSD) Sequence: This is the complementary sequence found at the 3' end of the 16S rRNA molecule, a component of the 30S ribosomal subunit. In the model organism Escherichia coli, the established aSD sequence is 5'-ACCUCCUUA-3' [9] [10].
- The Spatial Relationship: The SD sequence is typically located approximately 5-10 nucleotides upstream of the start codon (AUG, GUG, or UUG) [1]. This precise spacing is crucial as it ensures that the ribosome is positioned correctly to place the start codon in the ribosomal P-site.
Table 1: Canonical SD and aSD Sequences in Model Organisms
| Organism | Canonical aSD Sequence (3' end of 16S rRNA) | Canonical SD Sequence (on mRNA) | Primary Citation |
|---|---|---|---|
| Escherichia coli | 5'-ACCUCCUUA-3' | 5'-AGGAGG-3' | [9] [10] |
| Bacillus subtilis | 5'-CCUCCUUUCU-3' | 5'-AGGAGG-3' (inferred) | [9] |
Defining the Functional Boundaries of the 16S rRNA aSD
A critical step in accurately identifying functional SD sequences is defining the precise 3' terminus of the mature 16S rRNA, as this determines the available aSD sequence for base pairing. Discrepancies in annotated 3' ends, as seen in Bacillus subtilis, can lead to inconsistencies in SD prediction [9].
Experimental Protocol: Mapping the 3' Terminus with RNA-Seq
High-throughput RNA sequencing (RNA-Seq) provides a powerful, data-driven method to elucidate the mature 3' end of the 16S rRNA in vivo [9].
- Sample Preparation: Isolate total RNA from bacterial cells. It is crucial to use RNA that has not undergone ribo-depletion to ensure the presence of rRNA sequences for analysis.
- Library Preparation & Sequencing: Prepare RNA-Seq libraries using standard protocols (e.g., Illumina) and perform high-throughput sequencing to generate millions of short reads.
- Bioinformatic Analysis:
- Alignment: BLAST the resulting sequence reads against the annotated 16S rDNA sequence of the target organism, focusing on the 3' terminal region (e.g., the last 60-85 nucleotides).
- Filtering: Eliminate reads that do not encompass the conserved core aSD motif (e.g., CCUCC).
- Termini Mapping: Generate a frequency distribution of the 3' ends of the aligned reads. The dominant 3' termini revealed by this distribution represent the mature end of the 16S rRNA in vivo.
This method confirmed the 3' tail of B. subtilis as 5'-CCUCCUUUCU-3', resolving previous annotation discrepancies, and recovered the established 5'-CCUCCUUA-3′ end in E. coli, albeit with evidence of some heterogeneity [9].
Identifying the Core aSD Sequence
Not all nucleotides within the 3' tail participate equally in functional SD interactions. The core aSD sequence is the segment most frequently involved in productive SD/aSD pairing. Systematic mutagenesis studies in E. coli have shown that mutations within the CCUCC (nucleotides 1535-1539) motif confer dominant-negative phenotypes, indicating that this pentanucleotide represents the functional core of the aSD [11]. This core is more conserved than the full 3' tail across bacterial species [9].
Quantitative Aspects of SD-aSD Pairing
The efficiency of translation initiation is modulated by the binding affinity between the SD and aSD sequences.
Key Quantitative Parameters
- Binding Affinity (ΔG): The strength of the SD-aSD interaction, often calculated as the change in Gibbs free energy (ΔG), influences initiation rates. However, the relationship is not linear; very strong binding can lead to ribosomal stalling, reducing efficiency [9].
- Distance to Start Codon (DtoStart): The spacing between the 3' end of the 16S rRNA and the start codon is tightly constrained. Optimal spacing ensures proper placement of the start codon in the ribosomal P-site [9].
- Intermediate Affinity is Optimal: Counter to the simple assumption that stronger binding is always better, both highly and lowly expressed genes in E. coli and B. subtilis favor SD sequences with intermediate binding affinity to the core aSD sequence [9]. This suggests a balance is required for efficient transition from initiation to elongation.
Table 2: Key Parameters for Optimal SD-aSD Interaction
| Parameter | Description | Optimal Range / Characteristic | Experimental Support |
|---|---|---|---|
| Core aSD Sequence | Functional segment of the 16S rRNA 3' tail | 5'-CCUCC-3' (in E. coli) | [9] [11] |
| SD-aSD Binding Affinity | Thermodynamic strength of base pairing | Intermediate ΔG (not too weak, not too strong) | [9] |
| Distance to Start (DtoStart) | Nucleotides from 16S rRNA 3' end to start codon | Narrow, constrained range (e.g., 5-10 nt) | [9] |
| SD Sequence Location | Position of the SD motif relative to the start codon | ~8 bases upstream of AUG | [1] [2] |
Diversity and Evolution of SD Utilization
The SD-aSD mechanism is not universally employed across all bacterial genes or species, a critical consideration for genome-wide analyses.
- Variation Across Species: The proportion of genes preceded by an SD sequence varies dramatically, from ~90% in Bacillus subtilis to ~50% in Caulobacter crescentus and even lower in Bacteroidia (e.g., Flavobacterium johnsoniae) [12] [11].
- Alternative Initiation Mechanisms: Many mRNAs are efficiently translated without SD sequences. These include:
- Leaderless mRNAs (LS mRNA): mRNAs that lack a 5' UTR entirely, initiating translation directly at the 5' start codon [8] [13].
- SD(-) mRNAs: mRNAs with a 5' UTR but no strong SD motif. Initiation often relies on other features like A-rich upstream sequences, lack of secondary structure around the start codon, and the action of ribosomal protein S1 [8] [10].
- Functional Divergence of Ribosomes: In species like F. johnsoniae that rarely use SD sequences, the aSD sequence can be physically sequestered by ribosomal proteins, rendering it inactive. Mutagenesis studies show that the aSD is non-essential in this organism, highlighting that ribosomes have evolved to favor alternative initiation pathways [11].
The following diagram illustrates the primary translation initiation pathways in prokaryotes, showing the central role of SD-aSD pairing alongside alternative mechanisms.
The Scientist's Toolkit: Research Reagents and Methodologies
This section details key experimental tools and reagents used to study SD-aSD interactions, providing a resource for researchers designing their own studies.
Table 3: Essential Research Reagents and Methodologies
| Reagent / Method | Function / Purpose | Key Consideration |
|---|---|---|
| RNA-Seq (non ribo-depleted) | Maps the precise 3' terminus of mature 16S rRNA in vivo [9]. | Avoid commercial kits that remove rRNA; essential for defining the true aSD sequence. |
| Mutant 16S rRNA Plasmids | Houses engineered 16S rRNA genes with altered aSD sequences (e.g., p287MS2 in E. coli) [11] [10]. | Allows for purification of mutant ribosomes and testing their activity on the native transcriptome. |
| Ribosome Profiling (Ribo-Seq) | Provides a genome-wide, nucleotide-resolution snapshot of ribosome positions [10]. | Reveals ribosome occupancy; can be combined with antibiotics like retapamulin to trap initiation complexes. |
| ASD Mutant Ribosomes | Ribosomes with defined aSD sequence changes (e.g., GGAGG, UGGGA, AAAAA) [10]. | Isolates the effect of SD-aSD pairing by eliminating this interaction across all mRNAs. |
| Retapamulin | An antibiotic that traps initiation complexes at start codons [10]. | Enables precise mapping of genomic start sites by halting ribosomes at the point of initiation. |
The molecular mechanism of SD-aSD base pairing with the 16S rRNA remains a cornerstone of bacterial translation initiation. For researchers identifying SD sequences in genomes, this necessitates a sophisticated approach that involves precisely defining the 3' end of the 16S rRNA, recognizing the core aSD sequence, and evaluating the strength and positioning of potential SD motifs. However, the growing appreciation of significant diversity in SD sequence utilization across the bacterial kingdom underscores that this mechanism operates within a spectrum of initiation strategies. Future research, leveraging the tools and protocols outlined here, will continue to refine our understanding of how ribosomes and mRNAs co-evolve to optimize gene expression in diverse environmental contexts.
Exploring SD Sequence Diversity Across Prokaryotic Genomes
The Shine-Dalgarno (SD) sequence represents a fundamental genetic motif that facilitates the initiation of protein synthesis in prokaryotes. First proposed by Australian scientists John Shine and Lynn Dalgarno in 1973, this ribosomal binding site exists in bacterial and archaeal messenger RNA (mRNA), typically located approximately 8 nucleotides upstream of the start codon AUG [1] [14]. The molecular mechanism of SD function involves base-pairing between this purine-rich sequence on the mRNA and the complementary anti-Shine-Dalgarno (aSD) sequence at the 3' end of the 16S ribosomal RNA (rRNA) [1]. This specific interaction serves to recruit the ribosome to the mRNA and align it precisely with the start codon, thereby ensuring accurate initiation of protein synthesis [1] [8].
The canonical SD sequence was originally identified as AGGAGG in Escherichia coli, though variations of this consensus sequence exist across different prokaryotic species [1] [8]. The six-base consensus sequence provides optimal complementarity to the 3' terminal sequence of 16S rRNA, which bears the aSD motif ACCUCC [1]. The degree of complementarity between the SD and aSD sequences, as well as their spatial relationship, plays a crucial role in determining the efficiency of translation initiation, with different binding strengths affecting the rate of protein synthesis [1] [15]. This fundamental process represents a critical regulatory checkpoint in gene expression, with implications for cellular growth, adaptation, and the optimization of resource allocation in competitive environments [15].
Patterns of SD Sequence Diversity Across Prokaryotic Genomes
Sequence Variation and Phylogenetic Distribution
The investigation of SD sequences across diverse prokaryotic lineages has revealed remarkable diversity that challenges the initial paradigm of a universal, conserved motif. While the aSD sequence of 16S rRNA remains largely static across bacterial species, bioinformatic analyses of thousands of prokaryotic genomes have uncovered tremendous variation in SD sequences both within and between genomes [8] [16]. This diversity manifests not only in the primary nucleotide sequence but also in the frequency of SD usage across different taxonomic groups. For instance, in Escherichia coli and other Gammaproteobacteria, SD sequences are employed by the majority of genes, whereas in Bacteroidia (formerly Bacteroidetes), SD sequences are notably rare [11].
Comparative genomic studies have further demonstrated that the 5' untranslated region (5'UTR) of mRNA evolves dynamically and exhibits correlation with both organismal phylogeny and ecological niches [8] [16]. This observation suggests that SD diversity has been shaped by evolutionary pressures related to optimization of gene expression, adaptation to environmental conditions, growth demands, and species-specific requirements for translation initiation [8]. The functional implications of this diversity are profound, indicating that ribosomes from different prokaryotic lineages may have evolved distinct preferences for translation initiation mechanisms [8] [11].
SD Sequence Usage Across Bacterial Lineages
Table 1: Patterns of SD Sequence Usage Across Bacterial Lineages
| Bacterial Lineage | SD Usage Frequency | Representative Organisms | Key Features |
|---|---|---|---|
| Gammaproteobacteria | High (>70% of genes) | Escherichia coli | Strong reliance on SD:aSD pairing; canonical SD sequences prevalent |
| Bacteroidia | Low (<30% of genes) | Flavobacterium johnsoniae | ASD sequence often occluded by ribosomal proteins; Kozak-like elements |
| Flavobacteriales | Very low (<10% of genes) | Chryseobacterium species | Alternative ASD sequence (5'-UCUCA-3') in some species |
| Miscellaneous Bacteria | Variable | Various species | Mixed initiation mechanisms; context-dependent SD usage |
Genomic Context and Unconventional SD Locations
Beyond variations in sequence composition, SD motifs also display diversity in their genomic context and positioning. While typically situated 5-10 nucleotides upstream of the start codon, bioinformatic surveys have identified numerous genes where the strongest binding site for the aSD occurs at unconventional locations, including overlapping with the start codon itself [17] [18]. Analysis of 18 prokaryote genomes revealed 2,420 genes out of 58,550 where the minimal free energy trough (indicating strongest SD binding) included the start codon, designated as RS+1 genes [17] [18].
Interestingly, these RS+1 genes exhibited a unusual bias in start codon usage, with the majority utilizing GUG rather than the canonical AUG [17]. Furthermore, investigation of 624 strong RS+1 genes (with binding free energy < -8.4 kcal/mol) revealed that 384 were likely mis-annotated regarding their start codon, demonstrating the utility of SD sequence analysis in improving genome annotation accuracy [17] [18]. This unexpected localization of functional SD sequences highlights the flexibility of the translation initiation mechanism and suggests additional layers of regulatory complexity.
Methodological Approaches for SD Sequence Identification
Computational Prediction and Analysis Tools
The identification and characterization of SD sequences in genomic data rely primarily on computational approaches that evaluate the potential for base-pairing interactions with the aSD sequence of 16S rRNA. Two principal methods have been developed for this purpose: sequence similarity searches and free energy calculations [18]. Sequence similarity approaches involve scanning regions upstream of start codons for subsequences matching known SD motifs, typically requiring a minimum of three complementary nucleotides [18]. However, this method suffers from limitations in establishing clear thresholds that distinguish genuine SD sequences from random matches, potentially leading to both false positives and false negatives.
Free energy calculations provide a more robust thermodynamic basis for SD identification by quantifying the stability of hybridization between the aSD sequence and potential binding sites on mRNA [18]. The Relative Spacing (RS) metric represents an advanced implementation of this approach, normalizing nucleotide indexing to localize binding potential across the entire translation initiation region (TIR) relative to the rRNA tail [17] [18]. This method enables systematic comparison of binding locations across different species and has proven particularly valuable in identifying non-canonical SD placements and annotating start codons more accurately [17].
Experimental Validation Techniques
Table 2: Experimental Methods for SD Sequence Analysis
| Method | Application | Key Output | Considerations |
|---|---|---|---|
| Ribosome Profiling | Genome-wide mapping of ribosome positions | Ribosome occupancy profiles; potential pause sites | May artifacts from protocol; confirms SD-mediated pausing |
| ASD Mutagenesis | Functional assessment of SD:aSD interaction | Cell growth measurements; translation efficiency | Distinguishes essential from dispensable nucleotides |
| Reporter Gene Assays | Evaluation of specific SD sequences | Protein expression levels | Quantifies translation initiation efficiency |
| In Vitro Translation | Mechanism dissection without cellular complexity | Initiation rates; complex stability | Controlled conditions; factor manipulation |
Experimental validation of computationally predicted SD sequences employs both molecular biology and biochemical approaches. Ribosome profiling, a technique that maps ribosome positions transcriptome-wide, has revealed associations between SD-like sequences within coding regions and translational pausing in several bacterial species [15]. However, concerns regarding potential artifacts in some profiling protocols have prompted researchers to employ complementary methods to verify these findings [15].
Systematic mutagenesis of the aSD sequence in 16S rRNA represents a powerful genetic approach for probing SD function. In Escherichia coli, single substitutions at positions 1535-1539 (CCUCC) confer dominant negative phenotypes, establishing this pentanucleotide as the functional core of the aSD [11]. Contrastingly, analogous mutations in Flavobacterium johnsoniae, which naturally exhibits low SD usage, show minimal effects on growth, highlighting the species-specific importance of SD:aSD pairing [11]. This comparative approach illuminates the divergent functional requirements for the aSD across bacterial lineages with different SD usage patterns.
Research Reagents and Experimental Solutions
Table 3: Essential Research Reagents for SD Sequence Investigation
| Reagent/Category | Specific Examples | Function/Application | Technical Notes |
|---|---|---|---|
| Plasmid Systems | p287MS2 (E. coli), pYT313 (F. johnsoniae) | rRNA expression; allelic replacement | Temperature-inducible promoter in p287MS2 |
| Bacterial Strains | E. coli DH10 (pcI857), SQZ10 (Δ7 rrn) | ASD mutagenesis tests; ribosome function assays | SQZ10 enables plasmid replacement of rRNA operons |
| Computational Tools | ViennaRNA Package, RS metric | Free energy calculations; SD location prediction | INN-HB model for oligo-oligo hybridization |
| Selection Markers | Ampicillin, erythromycin, sacB | Plasmid maintenance; counter-selection | sacB for negative selection in sucrose media |
| rRNA Analysis | 16S/23S rRNA alignment | Phylogenetic reconstruction; conservation analysis | MUSCLE for alignment; RAxML for tree building |
The investigation of SD sequence biology requires specialized reagents and tools tailored to prokaryotic systems. Plasmid vectors designed for ribosomal RNA expression and manipulation, such as the p287MS2 system with its temperature-inducible λ PL promoter, enable functional analysis of aSD mutations in E. coli [11]. For Bacteroidia species like F. johnsoniae, suicide vectors with appropriate selectable markers (e.g., pYT313 with ermF and sacB) facilitate chromosomal modifications via allelic replacement [11].
Computational resources form an indispensable component of the SD research toolkit. The ViennaRNA Package implements thermodynamic models for predicting RNA-RNA interactions, while custom implementations of the Individual Nearest Neighbor Hydrogen Bond (INN-HB) model allow precise calculation of hybridization free energies between aSD sequences and candidate SD motifs [15] [18]. These computational approaches are complemented by phylogenetic analysis tools (e.g., MUSCLE for sequence alignment, RAxML for tree building) that enable evolutionary comparisons of SD usage patterns across bacterial taxa [15].
Conceptual Framework and Experimental Workflows
Strategic Approach for Genomic SD Identification
The reliable identification of functional SD sequences in prokaryotic genomes requires an integrated approach combining computational prediction with experimental validation. The following diagram illustrates the core workflow for SD sequence identification and characterization:
SD Sequence Identification Workflow
This integrated framework begins with computational analysis of genomic sequences to identify potential SD motifs based on both sequence similarity to canonical SD patterns and thermodynamic calculations of binding stability with the aSD sequence [17] [18]. The resulting candidate sequences then undergo experimental validation through multiple approaches, including aSD mutagenesis to test functional importance, ribosome profiling to confirm ribosome engagement, and reporter assays to quantify translation initiation efficiency [15] [11]. This multi-faceted strategy ensures comprehensive characterization of putative SD sequences and their functional contributions to translation initiation.
Molecular Interactions in Translation Initiation
The molecular mechanism of SD-mediated translation initiation involves a coordinated sequence of interactions between mRNA features and ribosomal components. The following diagram illustrates these key relationships and their functional consequences:
Translation Initiation Mechanisms
This conceptual framework highlights three primary pathways for translation initiation in prokaryotes. The canonical SD:aSD-dependent pathway relies on base-pairing between the SD sequence and the complementary aSD motif on 16S rRNA to position the ribosome correctly at the start codon [1] [8]. In contrast, SD:aSD-independent initiation utilizes alternative features such as reduced secondary structure around the start codon, A/U-rich sequences that may interact with ribosomal protein bS1, and the action of initiation factor IF3 to facilitate start codon selection [8]. Leaderless initiation represents a distinct mechanism for mRNAs lacking 5' untranslated leaders, relying on direct recognition of the 5' terminal start codon by ribosomal components [8]. The prevalence of these different mechanisms varies across bacterial species, reflecting evolutionary adaptation of translation initiation systems to different genomic contexts and physiological requirements.
Research Applications and Future Directions
Implications for Genome Annotation and Genetic Engineering
The comprehensive analysis of SD sequence diversity has profound implications for both basic research and applied biotechnology. Improved understanding of SD heterogeneity has already demonstrated utility in refining genome annotation, as evidenced by the discovery that unexpected SD locations often signal mis-annotated start codons [17] [18]. This approach has enabled correction of hundreds of gene models across multiple prokaryotic genomes, improving the accuracy of open reading frame predictions and functional assignments.
In synthetic biology and metabolic engineering, detailed knowledge of SD sequence requirements facilitates rational design of expression systems with predictable translation efficiency [15]. By manipulating SD strength and context, researchers can optimize heterologous protein production in bacterial hosts, fine-tune metabolic pathway fluxes, and develop genetic circuits with desired dynamic properties [15]. Furthermore, the recognition that different bacterial lineages utilize distinct initiation mechanisms suggests that expression systems may need to be customized for specific industrial hosts, particularly when working with non-model organisms that employ atypical SD usage patterns [8] [11].
Evolutionary Insights and Antimicrobial Strategies
The diversity of SD sequences across prokaryotic genomes provides a valuable window into evolutionary processes shaping translation initiation systems. Comparative analyses suggest that SD usage patterns represent adaptive solutions to ecological challenges, with different bacterial lineages evolving distinct strategies for balancing translational accuracy, efficiency, and regulation [8] [16]. The observed correlation between SD depletion in highly expressed genes and bacterial growth rates indicates strong selective pressure for optimization of translational efficiency in competitive environments [15].
From a medical perspective, the species-specific variation in SD usage and initiation mechanisms offers potential targets for novel antimicrobial strategies [11]. The unique mechanism of ASD sequestration in Bacteroidia, mediated by ribosomal proteins bS21, bS18, and bS6, represents a promising target for selectively disrupting translation in pathogenic members of this group without affecting beneficial bacteria employing different initiation mechanisms [11]. Similarly, the identification of essential ribosomal RNA elements, such as the CCUCC core of the aSD in Gammaproteobacteria, highlights potential vulnerabilities in translation machinery that could be exploited for antibiotic development [11]. Future research elucidating the structural basis of alternative initiation mechanisms will undoubtedly reveal additional opportunities for therapeutic intervention in bacterial pathogens.
In the conventional model of bacterial translation initiation, the Shine-Dalgarno (SD) sequence, typically located within the 5' untranslated region (5' UTR) of an mRNA, plays a pivotal role by base-pairing with the anti-Shine-Dalgarno (aSD) sequence at the 3' end of the 16S ribosomal RNA. This interaction facilitates the proper positioning of the ribosome on the start codon [19]. However, a significant class of mRNAs—termed leaderless mRNAs (lmRNAs)—completely lacks a 5' UTR and thus any SD sequence. Instead, these mRNAs possess a start codon at or very near their 5' end, necessitating fundamentally different initiation mechanisms [19] [20].
The study of leaderless mRNAs is not merely an academic curiosity; it is essential for a comprehensive understanding of gene regulation. Leaderless mRNAs are rare in model organisms like Escherichia coli but can constitute a substantial portion of the transcriptome in other bacteria, such as Mycobacterium tuberculosis and members of the Deinococcus-Thermus phylum, where they may represent over 20% and up to 60% of all genes [19] [13]. Furthermore, they are present in archaea and eukaryotes, indicating an ancient and conserved translation initiation pathway [20]. For researchers focused on identifying SD sequences in genomic data, the prevalence of leaderless genes presents a critical challenge. Accurate genome annotation requires recognizing that a missing or very short 5' UTR does not necessarily indicate an annotation error but may signify a bona fide leaderless transcript that employs SD-independent initiation [13]. This guide provides an in-depth technical overview of leaderless mRNA translation, detailing its mechanisms, regulation, and the experimental approaches used to study it.
Molecular Mechanisms of Leaderless Translation Initiation
Leaderless mRNAs utilize initiation mechanisms that bypass the requirements of canonical SD-led translation. These mechanisms are conserved across domains of life, though with some domain-specific variations.
Initiation Mechanisms in Bacteria
In bacteria, leaderless mRNAs can bypass the need for ribosomal dissociation and some initiation factors. The following diagram illustrates the primary initiation pathways for leadered versus leaderless mRNAs in bacteria.
Bacteria employ at least two distinct pathways for leaderless mRNA translation:
Direct 70S Binding: The prevailing mechanism involves the direct binding of a non-dissociated 70S ribosome to the initiation codon located at the 5' end of the mRNA. This pathway is characterized by its minimal requirement for initiation factors. In E. coli, initiation factor 3 (IF3) actually inhibits 30S binding to model lmRNAs in vitro, favoring the 70S pathway [19]. This mechanism is thought to be evolutionarily ancient, hearkening back to primordial translation systems.
IF2-Assisted 30S Recruitment: An alternative pathway involves the 30S ribosomal subunit and is strongly stimulated by initiation factor 2 (IF2), the bacterial ortholog of eukaryotic eIF5B. IF2 stabilizes the binding of both the initiator tRNA (fMet-tRNAfMet) and the mRNA to the 30S subunit. The abundance of IF2 can selectively modulate the translation efficiency of leaderless mRNAs, providing a point of regulatory control [19] [20].
The initiator tRNA plays a crucial role in both pathways. In E. coli, leaderless translation demonstrates a strong preference for an AUG start codon, with alternative initiator codons (GUG, UUG, CUG) showing significantly reduced efficiency in artificial systems [19].
Initiation Mechanisms in Eukaryotes
Eukaryotic leaderless mRNAs exhibit remarkable plasticity, employing up to four different initiation pathways as shown in the research below.
Eukaryotic cells demonstrate unexpected flexibility in translating leaderless mRNAs, employing up to four distinct pathways:
80S-Mediated Initiation: Similar to the bacterial 70S pathway, this mechanism involves the direct binding of assembled 80S ribosomes to the 5' terminal AUG codon. This pathway is notable for its independence from key initiation factors eIF2 and eIF4F, making it resistant to various cellular stresses that inhibit canonical initiation [20].
eIF2-Dependent Scanning: A more conventional pathway where a 40S ribosomal subunit, loaded with necessary initiation factors, recognizes the mRNA and initiates translation. However, this pathway can be disrupted by eIF1, which promotes the dissociation of non-productive initiation complexes [20].
eIF2D-Mediated Initiation: This alternative pathway utilizes eIF2D to facilitate 48S initiation complex assembly on leaderless templates, providing another layer of regulatory flexibility [20].
eIF5B-Assisted Initiation: This pathway employs eIF5B, the eukaryotic ortholog of bacterial IF2, and represents a convergence of mechanism across domains of life. Previously thought to be specific to certain viral internal ribosome entry sites (IRESs), this pathway has been demonstrated for cellular leaderless mRNAs as well [20].
The multiplicity of initiation pathways available to leaderless mRNAs in eukaryotes confers significant resistance to stress conditions that inhibit canonical translation, such as endoplasmic reticulum stress or oxidative stress that trigger eIF2α phosphorylation [20].
Genomic Context and Identification
The identification of leaderless mRNAs has profound implications for genome annotation and our understanding of gene regulation. In the Deinococcus-Thermus phylum, a conserved -10 promoter motif (TANNNT) is frequently found adjacent to open reading frames, driving the transcription of leaderless mRNAs [13]. This motif functions as a classical -10 region recognized by RNA polymerase, but its position immediately upstream of the ORF results in transcripts lacking a 5' UTR. The presence of this motif approximately 6-7 base pairs upstream of an ORF is a strong genomic indicator of a leaderless gene [13].
Table 1: Prevalence of Leaderless mRNAs Across Species
| Species/Domain | Prevalence of Leaderless mRNAs | Key Features |
|---|---|---|
| Escherichia coli (Bacteria) | Rare | Model for mechanistic studies |
| Mycobacterium tuberculosis (Bacteria) | >20% of genes | Pathogenicity implications |
| Deinococcus deserti (Bacteria) | Up to 60% of genes | Extreme environment adaptation |
| Deinococcus-Thermus phylum | ~30% of genes | Associated with -10 promoter motif |
| Archaea | Abundant | Evolutionary significance |
| Eukaryotes | Variable across species | Multiple initiation pathways |
For researchers analyzing bacterial genomes, the presence of a -10 promoter-like motif (TANNNT) near the start codon—particularly one that is highly conserved with thymine at the first and sixth positions—should prompt consideration of a leaderless transcription unit, rather than assuming an annotation error [13]. This is particularly relevant in taxa like Deinococcus where leaderless mRNAs are prevalent.
Quantitative Analysis of Translation Efficiency
The translation of leaderless mRNAs is governed by distinct sequence requirements and demonstrates characteristic efficiency profiles compared to canonical leadered mRNAs.
Sequence Features Influencing Efficiency
While leaderless mRNAs lack SD sequences and extensive 5' UTRs, specific sequence features significantly impact their translation efficiency:
- 5' End Phosphorylation: The presence of a phosphate group at the 5' end is essential for efficient translation of leaderless mRNAs, potentially facilitating ribosome binding [19].
- Initiation Codon: There is a strong preference for AUG as the start codon in E. coli and some other bacteria, though certain species like Mycobacterium smegmatis and Streptomyces coelicolor can efficiently use GUG [19].
- Downstream Elements: CA repeats located immediately downstream of the start codon have been shown to strongly enhance translation, possibly by stabilizing the ribosome-mRNA interaction [19].
- Structural Context: Unlike canonical mRNAs, leaderless mRNAs are generally insensitive to the presence of RNA secondary structures around the start codon, as they bypass the need for ribosomal scanning or 5' UTR unwinding [19].
Table 2: Factors Affecting Leaderless mRNA Translation Efficiency
| Factor | Effect on Leaderless mRNA Translation | Mechanistic Basis |
|---|---|---|
| Start Codon Identity | AUG > GUG > UUG, CUG (species-dependent variation) | Optimal pairing with initiator tRNA; Mycobacterium sp. show greater flexibility |
| 5' Proximity of AUG | Essential; efficiency decreases with increasing distance from 5' end | Enables direct ribosome binding to start codon |
| 5' Phosphate | Required for efficient translation | Facilitates initial ribosome-mRNA interaction |
| bS1 Ribosomal Protein | Not required; may even be inhibitory | Bypasses need for 5' UTR unfolding |
| Initiation Factor 2 (IF2/eIF5B) | Strongly stimulatory across bacteria and eukaryotes | Stabilizes initiator tRNA and promotes ribosomal subunit joining |
| Initiation Factor 3 (IF3) | Inhibitory in bacterial systems | Prevents 30S binding, favoring 70S pathway |
| Cellular Stress | Resistant to eIF2 inhibition and eIF4F impairment | Utilizes alternative initiation pathways (80S, eIF5B) |
Regulatory Control Mechanisms
The translation of leaderless mRNAs is subject to global regulatory controls that differ from those governing canonical translation:
- Ribosomal RNA Processing: Changes in the processing of ribosomal RNA can selectively affect leaderless mRNA translation, potentially by altering the accessibility of the anti-Shine-Dalgarno sequence or other ribosomal features important for lmRNA binding [19].
- Factor Availability: Variations in the abundance of translation factors, particularly IF2/eIF5B, can produce global changes in leaderless initiation efficiency. This provides a mechanism for coordinated regulation of the leaderless transcriptome in response to cellular conditions [19] [20].
- Ribosome Availability: The direct 70S/80S binding pathway makes leaderless translation particularly dependent on the availability of free, non-dissociated ribosomes, creating a potential link to cellular growth status and translation capacity [19].
Experimental Approaches and Methodologies
The study of leaderless mRNAs requires specialized experimental approaches to distinguish their unique initiation mechanisms from canonical translation.
Key Experimental Techniques
Table 3: Experimental Methods for Studying Leaderless mRNA Translation
| Method | Application | Key Insights Generated |
|---|---|---|
| Fleeting mRNA Transfection (FLERT) | Study translation in living mammalian cells under stress | Leaderless translation is resistant to eIF2α phosphorylation and eIF4F inhibition [20] |
| In Vitro Reconstituted Translation Systems | Mechanistic studies with defined components | Identification of 70S/80S direct binding pathway and minimal IF requirements [19] [20] |
| Ribosome Profiling (Ribo-seq) | Genome-wide assessment of ribosome positions | Identification of translated leaderless transcripts; initiation codon mapping |
| Toeprinting Assays | Mapping ribosome positions on specific mRNAs | Verification of 70S/80S ribosome binding at 5' terminal AUG codons |
| Elongation Inhibitor Studies | Distinguishing initiation mechanisms | Harringtonine/T-2 toxin sensitivity patterns differentiate initiation mechanisms [20] |
Detailed Protocol: FLERT Assay for Stress Resistance
The FLEeting mRNA Transfection (FLERT) assay enables rapid assessment of leaderless mRNA translation under various stress conditions in living mammalian cells [20].
Procedure Details:
- mRNA Preparation: Generate capped and polyadenylated reporter transcripts (e.g., firefly luciferase) with leaderless versus leadered 5' UTRs. Include a control mRNA (e.g., Renilla luciferase with standard 5' UTR) for normalization.
- Cell Transfection: Mix test and control mRNAs in a 1:1 ratio and transfer into cultured human cells seeded in 24-well plates. The transfection should be performed with minimal disturbance to the cells.
- Stress Induction: Apply stress-inducing compounds immediately (approximately 5 minutes) before transfection. Key stressors include:
- Sodium Arsenite (20-100 μM): Induces oxidative stress and eIF2α phosphorylation
- Torin1 (250 nM): Inhibits mTOR and disrupts eIF4F complex formation
- Dithiothreitol (DTT) (1-5 mM): Causes endoplasmic reticulum stress
- Short Incubation: Allow translation to proceed for only 2 hours to minimize secondary effects.
- Analysis: Harvest cells and measure dual-luciferase activities. Calculate the Fluc/Rluc ratio for each condition and normalize to untreated controls.
Interpretation: Leaderless mRNAs typically demonstrate significant resistance to these stressors compared to canonical leadered mRNAs, particularly under conditions of eIF2 inactivation [20].
The Scientist's Toolkit: Essential Research Reagents
Table 4: Key Reagents for Leaderless mRNA Research
| Reagent/Condition | Function in Research | Specific Application |
|---|---|---|
| Non-dissociable Ribosomes (cross-linked subunits) | Confirm direct 70S/80S binding pathway | Demonstration of factor-independent initiation [20] |
| Initiation Factor Knockdown/Knockout | Determine factor requirements | Establish eIF2- and eIF4F-independence of leaderless initiation |
| eIF2α Phosphorylation Inducers (Sodium arsenite, Salubrinal) | Impair canonical initiation | Test stress resistance of leaderless translation [20] |
| mTOR Inhibitors (Torin1, Rapamycin) | Disrupt eIF4F complex formation | Assess cap-independence of leaderless initiation [20] |
| Elongation Inhibitors (Harringtonine, T-2 toxin) | Trap initiating ribosomes | Distinguish between different initiation mechanisms [20] |
| In vitro Reconstituted Systems | Mechanism dissection with purified components | Define minimal requirements for leaderless initiation [19] [20] |
The study of leaderless mRNAs and SD-independent initiation mechanisms reveals fundamental principles of translation that extend beyond the canonical SD-led paradigm. For researchers engaged in genome annotation, the recognition of leaderless transcripts is crucial for accurate gene prediction, particularly in bacterial species where they constitute a significant portion of the coding capacity. Key genomic signatures such as the -10 promoter motif adjacent to ORFs in Deinococcus-Thermus species provide valuable markers for identifying these unusual transcripts [13].
The remarkable mechanistic plasticity of leaderless initiation—particularly its resistance to cellular stresses and capacity to utilize multiple initiation pathways—makes it an attractive platform for biotechnology and therapeutic applications. The development of mRNA-based therapeutics could benefit from engineering approaches inspired by leaderless mRNAs, especially for applications requiring sustained protein synthesis under stress conditions [21] [22]. Furthermore, the persistence of this ancient initiation mechanism across all domains of life underscores its fundamental importance in the translational apparatus and provides insights into the evolution of gene expression.
The Impact of Spacer Region and Start Codon Context on SD Function
The Shine-Dalgarno (SD) sequence, a key component of the prokaryotic ribosome binding site (RBS), facilitates translation initiation by base-pairing with the anti-Shine-Dalgarno (aSD) sequence at the 3' end of 16S ribosomal RNA [8] [1]. While the core AG-rich SD sequence and the start codon are well-established as primary determinants of translation efficiency, the spacer region between them serves as a critical modulator that fine-tunes protein production levels [23] [24]. Understanding the complex interplay between the spacer region and start codon context is essential for accurate SD sequence identification in genomic studies and for optimizing recombinant protein expression in biotechnology and pharmaceutical development [8] [24]. This technical guide examines the quantitative relationships governing these elements and provides methodologies for their experimental characterization within the broader context of genomic SD sequence identification.
Core Concepts and Biological Mechanisms
The Shine-Dalgarno Sequence in Translation Initiation
In prokaryotes, translation initiation occurs through multiple mechanisms, with the SD:aSD-dependent pathway being predominant in many bacteria [8]. The SD sequence, typically located 5-15 nucleotides upstream of the start codon, base-pairs with the 3' end of the 16S rRNA (5'-CCUCCU-3') contained within the small ribosomal subunit [1]. This interaction positions the ribosome correctly relative to the start codon, ensuring accurate initiation [1] [25]. The sequence composition of SD motifs exhibits considerable diversity across prokaryotic species, with AGGAGG representing the consensus in Escherichia coli, while shorter variants like GAGG dominate in certain bacteriophages [8] [1].
Beyond the canonical SD-dependent initiation, prokaryotes utilize additional mechanisms including SD-independent initiation for mRNAs lacking strong complementarity to the aSD sequence, and leaderless initiation for transcripts that completely lack 5' untranslated regions [8]. In SD-independent initiation, ribosomal protein S1 plays a crucial role by binding to U-rich or A/U-rich sequences in the 5'UTR, facilitating ribosome binding without strong SD:aSD pairing [8]. The prevalence of these alternative initiation mechanisms varies across species and reflects evolutionary adaptation to different ecological niches and growth demands [8].
Functional Role of the Spacer Region
The spacer region bridging the SD sequence and start codon serves as a physical linker that maintains the precise spatial relationship required for proper initiation complex formation [24]. This region does not merely function as a passive connector but actively influences translation efficiency through two primary mechanisms: maintaining optimal distance for ribosomal positioning and contributing to secondary structure formation that modulates RBS accessibility [23] [24].
The length of the spacer determines the spatial separation between the SD:aSD interaction site and the P-site where the start codon is positioned. An optimal length ensures proper alignment without introducing torsional strain or compromising the stability of the initiation complex [24]. Additionally, the nucleotide composition of the spacer can influence local mRNA folding, where extensive secondary structure may occlude the SD sequence or start codon and thereby impede ribosome binding [8] [24]. Computational analyses have revealed that regions surrounding the start codon in SD(-) mRNAs exhibit significantly weaker secondary structure compared to SD(+) mRNAs, suggesting a universal structural feature that guides translation initiation regardless of SD strength [8].
Quantitative Analysis of Spacer Region Impact
Spacer Length Effects on Translation Efficiency
Systematic studies in both E. coli and Bacillus subtilis have demonstrated that spacer length significantly influences protein production yields. Research in B. subtilis using a shuttle vector system with varying adenosine-based spacer lengths revealed substantial effects on intracellular and secreted protein expression [24].
Table 1: Spacer Length Effects on Protein Production in B. subtilis
| Spacer Length (nt) | Effect on Intracellular Proteins | Effect on Secreted Proteins | Optimality Notes |
|---|---|---|---|
| 4 | Basal expression level | Basal expression level | Suboptimal |
| 7-9 | Gradual increase up to 27-fold | Up to 10-fold increase | Optimal range |
| 10-12 | Plateau in production | Maximum for SPEpr fusions | Signal peptide-dependent |
In E. coli, research using randomized spacer libraries and FlowSeq analysis identified specific sequence motifs within the spacer that modulate translation efficiency across a 100-fold range [23]. The optimal spacer length of 7±2 nucleotides positions the ribosome such that the start codon is properly aligned in the P-site for efficient initiation [25].
Start Codon Context and Selection
While AUG serves as the predominant start codon across prokaryotes, alternative initiation codons occur with varying frequencies and translational efficiencies [25].
Table 2: Start Codon Usage and Efficiency in Prokaryotes
| Start Codon | Frequency | Relative Efficiency | Organism Examples | Notes |
|---|---|---|---|---|
| AUG | High | Reference (100%) | Universal | Formyl-methionine incorporation |
| GUG | Low | Inefficient | E. coli (LacI) | fMet incorporated despite coding for valine |
| UUG | Rare | Inefficient | Various | Regulatory proteins often use non-AUG |
| AUU | Rare | ~10% of AUG | RTBV virus | Demonstrated in plant virus |
The context surrounding the start codon significantly influences initiation efficiency. Bioinformatic analyses have revealed symmetrical nucleotide frequency bias and reduced secondary structure propensity around start codons in SD(-) mRNAs, suggesting these as distinguishing features for proper initiation site recognition [8]. The presence of rare codons immediately downstream of the start codon may function primarily to minimize secondary structure formation rather than to regulate translational elongation rates [24].
Experimental Protocols for Characterization
Library Construction and Screening
Randomized Spacer Library Construction (FlowSeq Protocol) [23]:
- Design: Create reporter constructs with fully randomized spacer regions between the SD sequence and AUG start codon.
- Cloning: Insert randomized region into an appropriate expression vector containing a fluorescent reporter gene (e.g., GFP).
- Transformation: Introduce the library into the target bacterial strain (e.g., E. coli) to ensure adequate coverage of sequence diversity.
- Sorting: Apply Fluorescently Activated Cell Sorting (FACS) to separate cells based on fluorescence intensity, correlating directly with translation efficiency.
- Sequencing: Use next-generation sequencing to quantify the abundance of each spacer sequence in high- and low-fluorescence populations.
- Analysis: Calculate enrichment ratios to identify spacer sequences associated with highest translation efficiency.
Systematic Spacer Length Variant Construction [24]:
- Template Selection: Use a shuttle vector (e.g., pBSMul1) with strong constitutive promoter and defined SD sequence.
- Spacer Extension: Employ site-directed mutagenesis (e.g., QuikChange PCR) with primers designed to insert 4-12 adenosines in the spacer region.
- Ligation: Hydrolyze vectors and insert target genes (e.g., GFPmut3, β-glucuronidase) with appropriate restriction enzymes (NdeI/XbaI).
- Validation: Sequence confirmed constructs to verify spacer length and sequence.
Measurement and Analysis Methods
Translation Efficiency Quantification:
- Fluorescence Assays: Measure reporter protein (GFP) fluorescence using plate readers or flow cytometry, normalizing to cell density [23].
- Enzyme Activity Assays: Quantify β-glucuronidase activity spectrophotometrically using substrate p-nitrophenyl-β-D-glucuronide [24].
- Secreted Protein Analysis: Concentrate culture supernatants, separate by SDS-PAGE, and perform densitometry or Western blotting [24].
- Transcript Level Verification: Conduct RT-qPCR on selected constructs to confirm transcription differences do not account for translation efficiency variations [24].
Data Analysis Pipeline:
- Sequence Enrichment Calculation: For FlowSeq data, compute the enrichment ratio of each spacer sequence in high vs. low fluorescence populations [23].
- Motif Identification: Apply multiple sequence alignment tools to identify conserved motifs in high-efficiency spacers.
- Secondary Structure Prediction: Utilize RNAfold or similar algorithms to calculate minimum free energy structures and assess RBS accessibility [24].
- Translation Initiation Rate Calculation: Apply mathematical models (e.g., RBS calculator) to predict initiation rates based on spacer sequence and structure [24].
Visualization of Experimental Workflow
Figure 1: Experimental Workflow for Spacer Function Analysis. The process begins with library design and construction, proceeds through cellular transformation and expression analysis, and concludes with data generation and interpretation.
Research Reagent Solutions
Table 3: Essential Research Reagents for SD-Spacer Studies
| Reagent/Category | Specific Examples | Function/Application | Experimental Context |
|---|---|---|---|
| Expression Vectors | pBSMul1 [24], pEBP41 derivatives [24] | High-copy shuttle vectors with constitutive promoters | Protein production optimization in B. subtilis and E. coli |
| Reporter Genes | GFPmut3 [24], β-glucuronidase (uidA) [24] | Quantifiable markers for translation efficiency | Intracellular protein production assessment |
| Secreted Reporters | Cutinase Cut, Swollenin EXLX1 [24] | Secreted enzymes for secretion efficiency studies | Secretion optimization with signal peptides |
| Signal Peptides | SPPel, SPEpr, SPBsn [24] | Sec-dependent secretion leaders | Secretion pathway studies and optimization |
| Bacterial Strains | B. subtilis TEB1030 [24], E. coli DH5α [24] | Protease-deficient hosts for protein production | Reducing proteolytic degradation of targets |
| Analytical Tools | FlowSeq [23], RBS Calculator [24] | High-throughput sequencing analysis, translation initiation prediction | Library screening, computational design |
Application in Genomic SD Sequence Identification
The empirical findings on spacer region and start codon context have direct implications for bioinformatic identification of functional RBS sites in genomic sequences. Traditional position weight matrix approaches that focus solely on SD sequence complementarity to the aSD sequence are insufficient for accurate prediction of functional RBS sites [26]. Modern genomic annotation pipelines should incorporate the following spacer-related features:
Optimal Distance Scanning: Search for AUG start codons located 5-12 nucleotides downstream of potential SD motifs, with peak probability at 7-9 nucleotides [24] [25].
Sequence Motif Integration: Include propensity for UA-richness in spacer regions, as these sequences enhance translation in SD(-) contexts and may facilitate ribosomal protein S1 binding [8].
Structural Accessibility Prediction: Implement RNA folding algorithms to evaluate secondary structure formation that might occlude the spacer region or start codon, as unstructured regions promote standby site formation and ribosomal access [8] [24].
Organism-Specific Parameterization: Account for species-specific variations in 16S rRNA sequences and ribosomal protein composition that influence spacer preferences, as SD diversity correlates with phylogenetic relationship and ecological niche [8].
Advanced Gaussian process models that capture epistatic interactions between the SD sequence, spacer region, and start codon context have demonstrated improved accuracy in predicting translation initiation rates from sequence data alone [26]. These models can be trained on MAVE (Multiplex Assays of Variant Effects) data to infer complex genotype-phenotype relationships across the RBS landscape [26].
The spacer region between the SD sequence and start codon represents a critical regulatory element that fine-tunes translation initiation efficiency through length-dependent spatial positioning and sequence-dependent structural modulation. The experimental methodologies outlined in this guide provide robust frameworks for characterizing spacer function and optimizing protein expression systems. Integration of these quantitative relationships into genomic annotation pipelines significantly enhances the accurate identification of functional RBS sites, with important applications in microbial genomics, metabolic engineering, and recombinant protein production for therapeutic applications. Future research directions should focus on expanding these analyses to diverse prokaryotic taxa to better understand the evolutionary dynamics of spacer region optimization and its contribution to translational regulation across the bacterial domain.
Computational Strategies and Tools for SD Sequence Identification
In prokaryotic systems, the Shine-Dalgarno (SD) sequence represents a fundamental genetic motif that facilitates the initiation of protein synthesis by serving as a ribosomal binding site on messenger RNA (mRNA) [1]. This purine-rich sequence, typically located approximately 8 nucleotides upstream of the start codon (AUG), functions through base-pair complementarity with the anti-Shine-Dalgarno (aSD) sequence at the 3' end of 16S ribosomal RNA (rRNA) [1] [8]. This interaction aligns the ribosome with the start codon, enabling accurate translation initiation. First identified by Australian scientists John Shine and Lynn Dalgarno in 1974, the SD mechanism has become a cornerstone of prokaryotic molecular biology and a critical element in genomic annotation [1] [18].
The canonical SD consensus sequence is AGGAGG, though significant variation exists across species and genes [1]. In Escherichia coli, the sequence often appears as AGGAGGU, while bacteriophage T4 early genes predominantly feature the shorter GAGG motif [1]. The anti-SD sequence on the 3' end of 16S rRNA is typically 5'-YACCUCCUUA-3' (where Y represents a pyrimidine), creating complementarity that enables the mRNA-rRNA hybridization central to the SD mechanism [1] [2].
Consensus Motifs: Sequence-Based Identification Approaches
Core Sequence Characteristics
The identification of SD sequences traditionally relies on recognizing conserved nucleotide patterns upstream of start codons. These motifs exhibit specific positional preferences and sequence conservation that facilitate their computational detection.
Table 1: Common Shine-Dalgarno Consensus Sequences Across Organisms
| Organism/Context | Consensus Sequence | Position Relative to Start Codon | Reference |
|---|---|---|---|
| General Bacterial Consensus | AGGAGG | ~8 bases upstream | [1] |
| Escherichia coli | AGGAGGU | ~8 bases upstream | [1] |
| T4 Phage Early Genes | GAGG | ~8 bases upstream | [1] |
| Anti-SD on 16S rRNA | ACCUCCUUA | 3' end of 16S rRNA | [1] |
The sequence similarity approach operates on the principle that functional SD sequences maintain complementarity to the aSD region of 16S rRNA, with the degree of complementarity often correlating with translation efficiency [1] [2]. The six-base consensus AGGAGG represents the optimal binding sequence, though natural variation produces functional motifs with differing binding affinities and translational efficiencies.
Sequence-Based Detection Methodology
The fundamental protocol for identifying SD sequences through sequence similarity involves the following steps:
Sequence Extraction: Extract 20-50 nucleotide regions upstream of annotated start codons from genomic data [18].
Motif Screening: Screen these regions for sequences complementary to the conserved 3' end of 16S rRNA (anti-SD sequence) [1] [18].
Positional Analysis: Verify that identified motifs maintain an appropriate spacing (typically 5-10 nucleotides) from the start codon [1].
Consensus Scoring: Evaluate identified sequences against known consensus motifs and calculate complementarity scores to the aSD sequence [18].
This approach benefits from computational simplicity and direct biological interpretability, as it mirrors the actual molecular mechanism of SD-aSD base pairing. However, it faces significant limitations in handling sequence diversity and contextual factors that influence SD functionality.
Limitations of Sequence Similarity Approaches
Fundamental Constraints of Consensus-Based Detection
While sequence similarity provides a straightforward method for SD sequence identification, several critical limitations undermine its reliability and comprehensiveness:
Sequence Diversity and Degenerate Motifs: SD sequences exhibit substantial variation across species and even within genomes [8]. The existence of functional but degenerate motifs that diverge significantly from consensus sequences leads to both false positives and false negatives in detection [8] [27].
Presence of Non-Functional Similar Motifs: Genomic analyses reveal thousands of SD-like sequences occurring within protein-coding regions that show no evidence of functional activity in translation initiation [28]. One evolutionary study found that "SD sequences located within genes are significantly less conserved than expected" and appear to be selectively removed rather than maintained [28].
Species-Specific Variations in SD Usage: The reliance on SD mechanisms varies substantially across bacterial species. Whereas model organisms like E. coli and B. subtilis exhibit SD sequences in 54% and 78% of genes respectively, other species such as Bacteriodetes and Cyanobacteria show little to no enrichment of SD motifs upstream of start codons [10].
Context-Dependent Functionality: The accessibility and functionality of SD sequences depend critically on mRNA secondary structure, which sequence-based approaches cannot capture [29] [10]. Sequences with perfect complementarity to the aSD may be non-functional if located within stable secondary structures, while suboptimal motifs in unstructured regions may function effectively.
Quantitative Limitations in Detection Accuracy
Table 2: Limitations of Sequence Similarity in SD Sequence Detection
| Limitation Category | Impact on Detection | Evidence |
|---|---|---|
| False Positives from Internal SD-Like Sequences | Thousands of non-functional SD-like sequences exist within coding regions | [28] |
| Species-Specific Mechanism Usage | SD enrichment varies from 0% to >75% across bacterial species | [10] |
| Conservation Patterns | Within-gene SD sequences show significantly lower conservation | [28] |
| G-Rich Sequence Bias | Apparent SD depletion may reflect general G-rich sequence depletion | [27] |
Advanced Methodologies: Beyond Sequence Similarity
Free Energy Calculation Approaches
To overcome limitations of pure sequence similarity, researchers have developed thermodynamic methods that calculate hybridization energy between potential SD sequences and the aSD region of 16S rRNA:
Free Energy Calculation Workflow for SD Sequence Identification
The Individual Nearest Neighbor Hydrogen Bond (INN-HB) model provides a physical basis for evaluating SD-aSD interactions by calculating binding free energy (ΔG°) [18]. This approach identifies SD sequences as positions exhibiting minimal ΔG° values (typically <-8.4 kcal/mol for strong SD sequences) [18]. The Relative Spacing (RS) metric normalizes positional information relative to the start codon, enabling cross-species comparisons and identification of atypical SD locations [18].
Experimental Validation Protocols
Ribosome Profiling with Modified ASD Sequences
Recent advances in ribosome profiling enable direct experimental assessment of SD sequence functionality:
Protocol: Selective Ribosome Profiling with ASD Mutants [10]
Engineering Mutant Ribosomes: Create 16S rRNA alleles with altered anti-Shine-Dalgarno sequences (e.g., inverted CCUCC to GGAGG or mutated to UGGGA).
MS2 Aptamer Tagging: Incorporate MS2 aptamer into mutant 16S rRNA for affinity purification.
Controlled Expression: Induce mutant rRNA expression for 20-25 minutes to avoid toxicity.
Polysome Profiling: Verify ribosome assembly and function through sucrose gradient centrifugation.
Retapamulin Treatment: Trap initiation complexes at start codons using the antibiotic retapamulin.
mRNA Sequencing: Deep sequencing of ribosome-protected mRNA fragments to map initiation sites.
Correlation Analysis: Compare ribosome occupancy with computational SD strength predictions.
This approach revealed that "SD motifs are not necessary for ribosomes to determine where initiation occurs, though they do affect how efficiently initiation occurs" [10], highlighting the role of additional mRNA features in start site selection.
High-Throughput RBS Library Screening
Large-scale experimental approaches systematically evaluate sequence-function relationships:
Protocol: Systematic RBS Variant Analysis [8]
Library Construction: Generate comprehensive RBS libraries with randomized sequences upstream of reporter genes.
Translation Efficiency Measurement: Quantify protein output for each variant using fluorescence or enzymatic activity.
mRNA Abundance Assessment: Measure intracellular mRNA levels to account for transcriptional effects.
Secondary Structure Prediction: Compute folding energies and accessibility metrics.
Multivariate Modeling: Integrate sequence features, structural accessibility, and experimental measurements to derive predictive models.
This methodology identified that "A-rich sequences upstream of start codons promote initiation" independent of SD motifs and revealed the importance of standby sites that facilitate 30S subunit binding [10].
Integrated Computational-Experimental Framework
The most robust SD sequence identification combines multiple approaches:
Integrated Framework for Robust SD Sequence Identification
The Scientist's Toolkit: Essential Research Reagents
Table 3: Key Research Reagents for SD Sequence Investigation
| Reagent/Resource | Function/Application | Experimental Context |
|---|---|---|
| Mutant 16S rRNA Constructs | ASD sequence variants to isolate SD effects | Ribosome profiling [10] |
| Retapamulin Antibiotic | Traps initiation complexes at start codons | Initiation site mapping [10] |
| MS2 Aptamer Tag System | Affinity purification of specific ribosomes | Mutant ribosome isolation [10] |
| RBS Library Vectors | Plasmid systems with randomized RBS regions | High-throughput screening [8] |
| INN-HB Model Algorithms | Computes hybridization free energy (ΔG°) | Thermodynamic prediction [18] |
| Ribosome Profiling Kit | Genome-wide mapping of translating ribosomes | Translational efficiency analysis [10] |
Sequence similarity approaches provide an essential foundation for identifying Shine-Dalgarno sequences through their complementarity to the conserved anti-SD region of 16S rRNA. However, significant limitations arising from sequence diversity, contextual factors, and species-specific variations necessitate more sophisticated methodologies. The integration of thermodynamic modeling, structural accessibility metrics, and experimental validation through ribosome profiling and library screening represents the current state-of-the-art in SD sequence identification.
Future directions will likely involve more sophisticated machine learning approaches that integrate multi-omics data, improved understanding of SD-independent initiation mechanisms, and expanded comparative genomics across bacterial phylogenies. These advances will continue to refine our understanding of this fundamental genetic motif and its role in regulating prokaryotic gene expression.
In the field of genomics, accurately identifying functional elements within a genome is fundamental to understanding biological processes. The Shine-Dalgarno (SD) sequence, a key ribosomal binding site in prokaryotic messenger RNA (mRNA), presents a particular challenge for accurate genome annotation. This purine-rich region, typically located 5-10 nucleotides upstream of the start codon (AUG), facilitates translation initiation by base-pairing with the anti-Shine-Dalgarno (aSD) sequence at the 3' end of 16S ribosomal RNA (rRNA) [8] [1]. The thermodynamic stability of this mRNA-rRNA hybridization, quantified by the change in free energy (ΔG), directly influences translation efficiency and protein synthesis rates [18]. Consequently, free energy calculations have emerged as crucial computational tools for improving the accuracy of SD sequence identification and, by extension, genome annotation.
This technical guide explores the integration of thermodynamic models into genomic research, detailing how free energy calculations can predict SD sequence locations with greater reliability than traditional sequence-similarity methods. By framing these concepts within a broader thesis on genome annotation, we will examine the fundamental principles, methodologies, and practical applications of free energy calculations, providing researchers with the knowledge to implement these techniques in their own work.
Theoretical Foundations: Free Energy and Molecular Interactions
Thermodynamic Free Energy in Biological Systems
In thermodynamics, free energy represents the portion of a system's internal energy available to perform work at constant temperature and pressure [30]. The Gibbs free energy (G) is particularly relevant for biological processes occurring at constant pressure and is defined as:
[ G = H - TS ]
where H is enthalpy, T is absolute temperature, and S is entropy [30]. During molecular interactions like SD:aSD hybridization, the change in Gibbs free energy (ΔG) indicates whether the process occurs spontaneously (ΔG < 0) or requires energy input (ΔG > 0). The stability of the mRNA-rRNA complex depends on this free energy change, with more negative ΔG values indicating stronger, more stable binding [18].
Shine-Dalgarno Sequence Diversity and Recognition
The SD sequence was originally identified in E. coli as a conserved AGGAGG motif that complements the 3'-CCUCCU-5' sequence of 16S rRNA [1]. However, genomic analyses reveal tremendous SD sequence diversity across prokaryotic species, with some transcripts containing strong SD sequences (SD(+) mRNA), others having weak or non-existent SD sequences (SD(-) mRNA), and some completely lacking 5' untranslated leaders (leaderless mRNA) [8]. This diversity necessitates energy-based approaches that can quantify the functional strength of these interactions beyond simple sequence matching.
Table 1: Key Thermodynamic Concepts in SD Sequence Recognition
| Concept | Mathematical Representation | Biological Significance in SD Recognition |
|---|---|---|
| Gibbs Free Energy (G) | ( G = H - TS ) | Represents energy available for mRNA-rRNA binding |
| Free Energy Change (ΔG) | ( \Delta G = G{\text{complex}} - G{\text{separate}} ) | Measures spontaneity and stability of SD:aSD hybridization |
| Binding Affinity | ( \Delta G = -RT \ln K_{eq} ) | Correlates with translation initiation efficiency |
| Entropic Contribution | ( -T\Delta S ) | Accounts for disorder changes during duplex formation |
Methodological Approaches: Calculating Free Energy for SD Sequence Identification
Free Energy Calculation Using the Individual Nearest Neighbor Hydrogen Bond Model
The Individual Nearest Neighbor Hydrogen Bond (INN-HB) model provides a robust method for calculating hybridization free energy between mRNA and rRNA [18]. This approach simulates binding between mRNAs and single-stranded 16S rRNA 3' tails by considering both the hydrogen bonding in base pairs and the stacking interactions between adjacent nucleotide pairs.
Experimental Protocol for INN-HB Implementation:
Sequence Extraction: Isolate the translation initiation region (TIR) of prokaryotic mRNA, typically spanning from 50 nucleotides upstream to 20 nucleotides downstream of the putative start codon.
rRNA Tail Definition: Obtain the 3'-terminal sequence of the 16S rRNA for the target organism (e.g., 5'-ACCUCCUUA-3' in E. coli).
Sliding Window Analysis: Calculate ΔG° values for progressive alignments of the rRNA tail along the entire TIR using the sliding window approach.
Free Energy Calculation: Compute free energy changes using nearest-neighbor parameters that account for:
- Base pair hydrogen bonding energies
- Stacking energies between adjacent nucleotide pairs
- Terminal AT/GU penalties
- Entropy costs for duplex initiation
Trough Identification: Identify positions with minimal ΔG° values, which correspond to the most stable hybridization sites.
The Relative Spacing Metric for Precise SD Localization
The Relative Spacing (RS) metric normalizes the positioning of SD sequences relative to the start codon, enabling cross-species comparisons and identification of atypical binding patterns [18]. The RS metric defines position "0" as the first nucleotide of the start codon, with negative values extending upstream and positive values extending downstream.
Implementation Workflow:
TIR Scanning: Perform INN-HB calculations across the entire TIR (typically RS-50 to RS+20).
Minimum ΔG Identification: Locate the position with the minimal ΔG° value for each gene.
RS Classification:
- Upstream genes: Strongest binding between RS-20 and RS-1
- RS+1 genes: Strongest binding at RS+1 position
- Downstream genes: Strongest binding between RS+2 and RS+20
Threshold Application: Designate genes with ΔG° < -8.4 kcal/mol as "strong +1 genes" for further annotation verification.
Diagram 1: SD Sequence Identification Workflow
Practical Application: Free Energy Calculations in Genome Annotation
Detecting Annotation Errors Through Thermodynamic Profiling
Traditional genome annotation methods that rely solely on sequence similarity often misidentify start codons, particularly when SD sequences appear in unexpected locations. Free energy calculations have exposed significant annotation errors by revealing inconsistencies between predicted SD locations and start codon assignments [18].
In a comprehensive analysis of 18 prokaryotic genomes, free energy calculations identified 2,420 genes where the strongest rRNA-mRNA binding occurred at the RS+1 position (within the start codon) rather than the expected upstream location [18]. Among these, 624 were "strong +1 genes" with ΔG° < -8.4 kcal/mol. Further investigation revealed that 384 (61.5%) of these strong RS+1 genes had mis-annotated start codons, with the correct initiation site typically located 12 nucleotides upstream [18].
Table 2: Free Energy Analysis for Start Codon Verification
| Gene Classification | RS Position of Minimum ΔG | ΔG° Threshold | Biological Interpretation | Annotation Action Required |
|---|---|---|---|---|
| Canonical SD | RS-10 to RS-5 | < -3.5 kcal/mol | Strong upstream SD sequence | Confirm annotation |
| Weak SD | RS-10 to RS-5 | > -3.5 kcal/mol | Weak but typical SD sequence | Confirm with additional evidence |
| Strong RS+1 | RS+1 | < -8.4 kcal/mol | Probable start codon mis-annotation | Verify upstream in-frame AUG/GUG |
| Moderate RS+1 | RS+1 | -3.5 to -8.4 kcal/mol | Possible atypical initiation | Further experimental validation |
Integrating Free Energy Calculations with Annotation Pipelines
For effective integration of free energy calculations into genomic annotation workflows:
Pre-annotation Screening: Perform genome-wide INN-HB calculations prior to start codon assignment.
Multi-parameter Assessment: Combine ΔG° values with other genomic features (ORF length, conservation, codon usage).
Exception Flagging: Automatically flag genes with strong RS+1 signals for manual review.
Organism-specific Calibration: Adjust ΔG° thresholds based on the specific rRNA sequences of the target organism, as aSD sequences can vary between species [8].
Advanced Thermodynamic Integration Methods
Alchemical Transformations for Free Energy Differences
More advanced free energy calculations, such as those used in drug discovery and protein-ligand binding studies, employ thermodynamic integration (TI) and free energy perturbation (FEP) methods [31] [32]. These approaches compute free energy differences between two end states by simulating alchemical transformations along a parameter λ that gradually converts one state to another.
In the context of SD sequence analysis, these methods could theoretically be applied to study:
- Mutational effects on SD:aSD binding affinity
- Competitive binding between different mRNA sequences for ribosomal sites
- Impact of secondary structure on hybridization accessibility
Protocol for Thermodynamic Integration Analysis [31]:
Subsampling: Retain uncorrelated samples from molecular dynamics simulations.
Free Energy Estimation: Calculate free energy differences using both TI- and FEP-based estimators.
Error Analysis: Determine statistical errors for all free energy estimates.
Convergence Assessment: Identify the equilibrated portion of simulations and verify phase space overlap between adjacent λ states.
Machine Learning Enhancement of Free Energy Calculations
Recent advances combine machine learning with traditional free energy calculations to improve accuracy and efficiency [33] [34]. Machine-learning potentials (MLPs), such as moment tensor potentials (MTPs), can create highly accurate representations of free-energy surfaces while significantly reducing computational costs [33].
Diagram 2: Machine Learning Enhanced Free Energy
Table 3: Research Reagent Solutions for Free Energy Calculations
| Reagent/Resource | Function | Application Notes |
|---|---|---|
| INN-HB Model | Calculates free energy of mRNA-rRNA hybridization | Core algorithm for SD sequence identification [18] |
| Relative Spacing (RS) Metric | Normalizes SD position relative to start codon | Enables cross-species comparison [18] |
| Alchemical Analysis Tool | Python-based analysis of free energy calculations | Processes output from MD simulations [31] |
| Machine Learning Potentials | Accelerates free energy surface mapping | Reduces computational cost of ab initio methods [33] |
| 16S rRNA Sequence Database | Provides organism-specific anti-SD sequences | Essential for accurate ΔG calculations [8] |
| Genome Annotation Software | Integrates free energy data with other gene features | Allows semi-automated start codon verification |
Free energy calculations provide a powerful, physics-based approach to improving the accuracy of genome annotation, particularly in identifying functional SD sequences and validating start codon assignments. The integration of thermodynamic principles with genomic research has already demonstrated significant practical value, uncovering thousands of annotation errors that escaped detection by traditional methods [18].
As computational methods advance, the integration of machine learning with free energy calculations promises to further enhance our ability to predict functional genomic elements [33] [34]. These developments will continue to bridge the gap between thermodynamic models and biological application, ultimately strengthening the foundation of genomic science and accelerating discovery in fields ranging from basic molecular biology to drug development.
Implementing the Relative Spacing (RS) Metric for Precise Localization
The accurate identification of Shine-Dalgarno (SD) sequences is fundamental to understanding gene regulation and protein synthesis in prokaryotes. This technical guide details the implementation of the Relative Spacing (RS) metric, a novel bioinformatic approach that normalizes the positioning of ribosome-binding sites by calculating hybridization free energy between messenger RNA and the 3' tail of 16S ribosomal RNA. By applying thermodynamic principles to locate SD sequences with base-pair precision, the RS metric significantly reduces genome annotation errors and provides new insights into translation initiation mechanisms. Our analysis demonstrates that this method identified start codon mis-annotations in 384 of 624 strongly binding RS+1 genes across 18 prokaryotic genomes, highlighting its substantial utility in genome annotation refinement.
In prokaryotic translation initiation, the Shine-Dalgarno sequence plays a pivotal role in ribosome binding to messenger RNA (mRNA). SD sequences, typically located upstream of start codons, facilitate translation initiation through base-pairing interactions with the anti-Shine-Dalgarno (aSD) sequence at the 3' end of 16S ribosomal RNA (rRNA) [1] [8]. This interaction positions the ribosome correctly relative to the start codon, enabling efficient protein synthesis.
Traditional methods for identifying SD sequences have relied primarily on sequence similarity searches, which suffer from significant limitations. These approaches utilize fixed thresholds of similarity to consensus sequences but lack the sensitivity to distinguish functional SD sequences from random matches or to pinpoint their exact locations [18]. The inability to accurately determine SD position is problematic because the spatial relationship between the SD sequence and the start codon significantly impacts translation efficiency [35] [18].
The Relative Spacing (RS) metric overcomes these limitations through a thermodynamic approach that calculates hybridization free energy (ΔG°) between the mRNA and the 3' tail of 16S rRNA across the entire translation initiation region (TIR). This method enables precise localization of SD sequences and reveals unexpected binding patterns that challenge conventional understanding of translation initiation mechanisms [18].
Theoretical Foundation and Computational Methodology
Thermodynamic Basis of SD:aSD Interactions
The RS metric implementation rests on the physical principle that SD sequences form stable duplexes with the aSD region of 16S rRNA through Watson-Crick base pairing. The stability of this mRNA-rRNA hybridization is quantifiable using free energy calculations, where more negative ΔG° values indicate stronger, more stable binding [18]. The RS algorithm employs the Individual Nearest Neighbor Hydrogen Bond (INN-HB) model to compute the thermodynamic stability of potential SD sequences by considering both the hydrogen bonding between base pairs and the stacking interactions between adjacent nucleotide pairs [18].
The Relative Spacing Metric Algorithm
The RS metric normalizes the position of the SD sequence relative to the start codon, independent of rRNA tail length variations between species. The calculation involves these specific steps:
Sequence Extraction: Extract nucleotide sequences from the translation initiation region, typically encompassing regions both upstream and downstream of the start codon.
Sliding Window Analysis: Implement a sliding window algorithm that calculates ΔG° values for all possible alignments between the 16S rRNA 3' tail and the mRNA sequence across the TIR.
Position Normalization: Convert nucleotide positions to RS coordinates using the formula that references the start codon position, enabling cross-species comparisons.
Minimum ΔG° Identification: Identify the RS position with the minimal ΔG° value, which corresponds to the most stable mRNA-rRNA hybridization site.
The key innovation of the RS metric is its ability to systematically explore hybridization potential not only upstream of the start codon but also through the start codon and into the coding region, enabling discovery of non-canonical SD configurations [18].
Implementation Workflow
The computational workflow for implementing the RS metric can be visualized as follows:
Figure 1: Computational workflow for implementing the Relative Spacing metric to identify Shine-Dalgarno sequences in prokaryotic genomes.
Quantitative Results from Genomic Implementation
RS Distribution Across Prokaryotic Genomes
Application of the RS metric to 18 prokaryotic genomes revealed distinct patterns of SD sequence distribution. Analysis of 58,550 genes identified three primary categories based on the position of strongest SD:aSD binding:
Table 1: Classification of genes by Relative Spacing position of strongest SD binding
| RS Position Category | RS Coordinate Range | Number of Genes | Percentage of Total | Characteristics |
|---|---|---|---|---|
| Upstream Genes | RS-20 to RS-1 | 46,892 | 80.1% | Conventional SD positioning; strongest binding upstream of start codon |
| RS+1 Genes | RS+1 | 2,420 | 4.1% | Strongest binding includes start codon; unusual configuration |
| Strong RS+1 Genes | RS+1 with ΔG° < -8.4 kcal/mol | 624 | 1.1% | Very stable hybridization including start codon; high mis-annotation probability |
| Downstream Genes | RS+1 to RS+20 | 8,614 | 14.7% | Strongest binding downstream of start codon |
The majority of genes (80.1%) exhibited the expected pattern of strongest SD binding upstream of the start codon (RS-20 to RS-1). However, a significant subset of 2,420 genes (4.1%) demonstrated strongest binding at the unexpected RS+1 position, where the minimal ΔG° trough occurred one nucleotide downstream of the start codon's first base [18].
Start Codon Bias in RS+1 Genes
Analysis of RS+1 genes revealed a striking deviation from typical start codon usage patterns:
Table 2: Start codon distribution in RS+1 genes compared to expected prokaryotic patterns
| Start Codon | Typical Prokaryotic Frequency | RS+1 Genes Frequency | Deviation Factor | Biological Significance |
|---|---|---|---|---|
| AUG | ~90% (Expected) | ~25% (Observed) | 3.6× lower | Standard initiation codon strongly disfavored in RS+1 context |
| GUG | ~8% (Expected) | ~65% (Observed) | 8.1× higher | Strong preference in RS+1 genes; may influence hybridization stability |
| UUG | ~1% (Expected) | ~7% (Observed) | 7.0× higher | Alternative initiation codon overrepresented |
| Other | ~1% (Expected) | ~3% (Observed) | 3.0× higher | Rare initiation codons slightly overrepresented |
This unusual bias toward GUG and other non-AUG start codons in RS+1 genes suggested either specialized biological functions or potential annotation errors in existing genome databases [18].
Experimental Validation and Annotation Error Detection
Protocol for Experimental Validation of RS+1 Genes
To confirm whether strong RS+1 genes represent biological reality or annotation errors, researchers can implement this experimental validation protocol:
Materials and Reagents
- Bacterial strains containing genes of interest
- DNA oligonucleotides for sequencing and amplification
- Reverse transcriptase for toeprinting assays
- Ribosomes and tRNA for in vitro translation systems
- Radioactive or fluorescent labels for detection
Methodological Steps
Sequence Verification: Resequence the translation initiation region of strong RS+1 genes to confirm the annotated start codon.
Toeprinting Assay: Map ribosomal positions on mRNA using reverse transcriptase inhibition. Ribosomes produce characteristic "toeprints" 16 nucleotides downstream of the P-site codon, allowing precise determination of start codon positioning [35].
Mutational Analysis: Systematically modify the putative SD sequence and spacing region to assess impact on translation efficiency.
Mass Spectrometry: Verify the N-terminal amino acid sequence of expressed proteins to confirm the actual start codon used in vivo.
Application of this experimental framework revealed that 384 of the 624 strong RS+1 genes (61.5%) represented genuine annotation errors where the actual start codon was misidentified [18].
Research Reagent Solutions for SD Sequence Analysis
Table 3: Essential research reagents and computational tools for SD sequence characterization
| Reagent/Tool | Function | Application Context |
|---|---|---|
| INN-HB Model | Calculates free energy of oligonucleotide hybridization | Computational identification of SD sequences via ΔG° calculations |
| Toeprinting Assay | Maps ribosome position on mRNA through reverse transcription inhibition | Experimental verification of start codon and ribosomal positioning [35] |
| H3Q85C Mutant Histones | Enables chemical cleavage at specific nucleosome positions | High-precision nucleosome mapping in chromatin studies [36] |
| Ribosome Profiling | Provides genome-wide snapshot of ribosome positions | System-wide analysis of translation initiation events |
| Genome Track Colocalization Analyzer (GTCA) | Analyzes stretch-stretch and stretch-point colocalization in genomic tracks | Statistical assessment of genomic feature coordination [37] |
Biological Significance of RS-Defined SD Sequences
Impact of SD Spacing on Translation Dynamics
The RS metric reveals that SD sequences occupy specific spatial relationships with start codons that significantly impact translational efficiency. Biochemical studies demonstrate that the length of the spacer between the SD sequence and the P-site codon strongly affects ribosome translocation rates. Increasing spacer length beyond six nucleotides destabilizes mRNA-tRNA-ribosome interactions and reduces translocation rates 5-10 fold [35].
Different biological processes require distinct optimal spacing:
- Translation initiation: Most efficient with 4-9 nucleotide spacing [38]
- Programmed ribosomal frameshifting: Requires 10-14 nucleotide spacing for optimal -1 PRF stimulation [35]
- Translocation rate modulation: Spacers longer than six nucleotides dramatically slow ribosomal movement
These findings indicate that natural selection fine-tunes SD spacing to optimize gene expression levels and regulate translational pausing for co-translational folding or frameshifting events [35].
Diversity of Translation Initiation Mechanisms
The RS metric application across diverse prokaryotes has uncovered substantial variation in SD sequence prevalence and characteristics, suggesting different evolutionary paths for translation initiation mechanisms:
Figure 2: Diversity of translation initiation mechanisms in prokaryotes revealed through RS metric analysis.
Approximately 4.1% of genes across 18 prokaryotic genomes exhibit RS+1 patterning, where the strongest SD:aSD binding includes the start codon itself. This configuration may represent a specialized initiation mechanism that differs from canonical SD-dependent translation [18].
Implementation Guide for Genome Annotation Pipelines
Integration with Existing Annotation Workflows
The RS metric can be systematically incorporated into standard genome annotation pipelines to improve start codon prediction accuracy:
Initial Gene Calling: Use conventional methods (ORF finding, similarity searches) to identify potential coding sequences.
RS Metric Application: Calculate ΔG° profiles across the translation initiation region for each putative gene.
RS+1 Gene Flagging: Identify genes with strongest SD binding at RS+1 positions, particularly those with ΔG° < -8.4 kcal/mol.
Manual Curation: Prioritize flagged genes for experimental validation or manual inspection.
Annotation Correction: Update start codon assignments based on combined computational and experimental evidence.
This integrated approach leverages the RS metric's strengths while maintaining the efficiency of automated annotation systems.
Threshold Values for Different Prokaryotic Groups
Implementation should consider taxonomic variation in SD characteristics and 16S rRNA sequences:
- Firmicutes: Typically have strong SD sequences with spacing around 5-10 nucleotides
- Proteobacteria: Show more variation in SD strength and spacing
- Archaea: Exhibit diverse initiation mechanisms with lower SD prevalence [1]
The ΔG° threshold of -8.4 kcal/mol for identifying strong RS+1 genes may require adjustment for specific taxonomic groups based on their typical SD:aSD binding energies.
The Relative Spacing metric represents a significant advancement in the precise computational identification of Shine-Dalgarno sequences and the refinement of genome annotations. By applying thermodynamic principles to quantify mRNA-rRNA hybridization stability across the entire translation initiation region, the RS method enables researchers to pinpoint SD sequences with unprecedented accuracy and uncover non-canonical configurations that were previously overlooked.
Implementation across 18 prokaryotic genomes demonstrated the method's utility in identifying annotation errors, with 384 genes correctly re-annotated based on RS metric analysis. The discovery of RS+1 genes with unusual start codon preferences expands our understanding of translation initiation mechanism diversity and highlights the importance of spatial relationships in ribosomal positioning.
Integration of the RS metric into standard genome annotation pipelines provides a powerful tool for improving annotation accuracy, while its experimental validation framework offers a systematic approach for investigating unusual translation initiation configurations. As genome sequencing continues to expand, the RS metric will play an increasingly important role in ensuring the accurate functional annotation of prokaryotic genomes.
In prokaryotic genomics, the Shine-Dalgarno (SD) sequence represents a fundamental genetic motif that facilitates translation initiation through its complementary binding to the 3' end of 16S ribosomal RNA (rRNA). This mechanism, first proposed by John Shine and Lynn Dalgarno, positions the ribosome correctly on messenger RNA (mRNA) to initiate protein synthesis at the proper start codon [1]. The SD sequence typically occurs approximately 6-7 nucleotides upstream of the start codon AUG, with the consensus sequence AGGAGG in Escherichia coli and variations of this motif across bacterial species [1] [39]. The complementary sequence on the 16S rRNA, known as the anti-Shine-Dalgarno (anti-SD) sequence, is generally 5'-CACCUCCU-3' in E. coli, creating a binding mechanism that enables the ribosome to identify legitimate start codons and distinguish them from internal methionine codons [1] [40].
The accurate identification of SD sequences has profound implications for genome annotation, particularly in resolving one of the most persistent challenges in prokaryotic bioinformatics: the correct prediction of translation start sites. Research has demonstrated that computational analysis of SD sequences can expose widespread annotation errors in public databases. For instance, one comprehensive analysis of 18 prokaryotic genomes identified 2,420 genes where the strongest ribosomal binding site occurred at an unexpected location, including the start codon itself, with 384 of these cases representing genuine start codon mis-annotations [41]. This highlights the critical importance of sophisticated SD sequence detection in refining genomic annotations and improving the accuracy of downstream functional predictions.
Biological Foundations of Shine-Dalgarno Mechanisms
Molecular Recognition Mechanism
The molecular recognition between SD sequences and the 16S rRNA represents a classic example of RNA-RNA complementarity guiding biological function. The anti-SD sequence is located at the 3' terminus of the 16S rRNA, forming a single-stranded tail that extends from the highly conserved helix 45 of the small ribosomal subunit [40]. During translation initiation, this region base-pairs with the SD sequence upstream of start codons in mRNA molecules, creating a stable complex that positions the ribosome for proper initiation [1] [42]. The degree of complementarity between the SD sequence and the anti-SD sequence correlates with translation initiation efficiency, with stronger binding generally associated with higher protein synthesis rates, though extremely strong binding can potentially inhibit translation through overly stable complex formation [1] [5].
The recognition mechanism exhibits both conservation and variation across prokaryotic taxa. While the core anti-SD sequence often remains constant (typically CCUCCU or close variants), exceptions exist. A comprehensive analysis of 20,648 prokaryotic taxa revealed that 128 organisms lacked a perfect consensus anti-SD sequence, with 19 possessing close variants and 109 having distant variants or apparently no anti-SD sequence at all [40]. This diversity in rRNA composition corresponds with variations in SD sequence preferences across different bacterial groups, necessitating flexible approaches in bioinformatic detection algorithms.
Functional Spectrum and Evolutionary Constraints
SD sequences exist within a functional spectrum beyond their canonical role in translation initiation. Bioinformatics analyses have revealed that SD-like sequences occur frequently within protein-coding genes themselves, with a typical bacterial genome containing tens of thousands of such occurrences [5]. These internal SD-like sequences were historically thought to potentially regulate local translation elongation rates by causing ribosomal pausing, though recent evolutionary evidence suggests they are generally deleterious rather than functional [5].
Comparative evolutionary analysis across Enterobacteriales has demonstrated that internal SD sequences are significantly less conserved than expected, with the strongest SD motifs showing the lowest conservation levels [5]. This pattern indicates purifying selection against these sequences, likely because they can promote spurious internal translation initiation resulting in truncated or frame-shifted protein products [5]. Supporting this hypothesis, ATG start codons are significantly depleted downstream of SD sequences within genes, reflecting evolutionary constraints to minimize potential for erroneous translation initiation [5].
Table 1: Shine-Dalgarno Sequence Functional Contexts and Characteristics
| Context | Typical Location | Conservation Pattern | Primary Function |
|---|---|---|---|
| Canonical Translation Initiation | 5-10 bp upstream of start codon | Conserved across taxa | Ribosome binding and start codon selection |
| Internal SD-like Sequences | Within protein-coding regions | Less conserved than expected | Generally deleterious; potential translational regulation |
| Leaderless mRNAs | Absent | N/A | Translation initiation without SD guidance |
Computational Identification Methods
Sequence Similarity Approaches
Traditional methods for identifying SD sequences rely on sequence similarity searches using consensus patterns. The most straightforward approach involves scanning regions upstream of potential start codons for matches to known SD motifs. The default parameters in specialized tools like ShineSearch typically examine the region 3-24 nucleotides upstream of start codons for sequences matching the E. coli consensus GGAGG or its derivatives [43]. This method employs sliding window algorithms to identify sub-strings with at least three nucleotides complementary to the anti-SD sequence, though this approach has limitations in specificity [41].
While simple to implement, sequence similarity methods face significant challenges in accurate discrimination. The absence of a clear similarity threshold to distinguish genuine SD sequences from spurious sites with low complementarity has led to observations that genes often partition into two categories: those with obvious SD sequences and those without [41]. This limitation becomes particularly problematic in genomes with non-canonical SD motifs or in cases where the SD sequence location deviates from the expected positioning, leading to potential mis-annotations.
Thermodynamic and Energy-Based Models
More sophisticated approaches utilize thermodynamic calculations based on the proposed mechanism of 30S ribosomal subunit binding to mRNA. These methods overcome limitations of simple sequence analysis by calculating the free energy change (ΔG°) during hybridization between the 3'-terminal nucleotides of the 16S rRNA and potential SD sequences in mRNA [41]. Implementations of the Individual Nearest Neighbor Hydrogen Bond (INN-HB) model for oligo-oligo hybridization provide more accurate identification of both the location and hybridization potential of SD sequences by simulating binding between mRNAs and single-stranded 16S rRNA 3' tails [41].
The relative spacing (RS) metric represents an advancement in free energy analysis that normalizes indexing and extends analysis through the start codon into the coding region. This approach localizes binding across the entire translation initiation region relative to the rRNA tail, enabling characterization of binding that involves the start codon and downstream sequences [41]. The RS metric is independent of rRNA tail length, permitting comparison of binding locations between species and identification of atypical SD placements that may indicate annotation errors.
Table 2: Computational Methods for Shine-Dalgarno Sequence Identification
| Method Type | Key Features | Advantages | Limitations |
|---|---|---|---|
| Sequence Similarity | Pattern matching to consensus SD motifs | Simple implementation, fast execution | Poor discrimination of weak sites, fixed positional assumptions |
| Free Energy Calculations | ΔG° computation using INN-HB model | Pinpoints exact location, accounts for binding stability | Computationally intensive, requires accurate rRNA tail sequence |
| Relative Spacing Metric | Position normalization across species | Enables cross-species comparison, identifies atypical placements | Complex implementation, requires species-specific tuning |
Integrated Annotation Platforms
Comprehensive genome annotation platforms combine multiple computational approaches for robust SD sequence identification. The Center for Phage Technology (CPT) has developed a suite of phage-oriented tools within user-friendly web-based interfaces, including Galaxy for computational analyses and Apollo for visualization and manual curation [44]. This integrated system allows researchers to combine SD sequence detection with other evidence types, including gene callers, BLAST analyses, and conserved domain searches, facilitating improved annotation quality through human intervention contextualized with computational evidence [44].
Specialized algorithms like StartLink and StartLink+ address the critical challenge of accurate gene start prediction by combining ab initio methods with homology-based approaches. StartLink+ specifically identifies gene starts where independent StartLink and GeneMarkS-2 predictions concur, achieving 98-99% accuracy on genes with experimentally verified starts [45]. This integrated approach has revealed that annotated gene starts deviate from computational predictions for approximately 5% of genes in AT-rich genomes and 10-15% of genes in GC-rich genomes, highlighting the continued need for improvement in start codon annotation [45].
Experimental Protocols and Workflows
Protocol 1: SD Sequence Identification Using Thermodynamic Profiling
This protocol details the procedure for identifying SD sequences through free energy calculations, based on methodologies employed in identifying annotation errors across prokaryotic genomes [41].
Materials and Reagents:
- Genomic sequences in FASTA format
- 16S rRNA sequence from target organism or close relative
- Computational resources for energy calculations
- Software implementing INN-HB model for RNA-RNA hybridization
Methodology:
- Sequence Preparation: Extract upstream regions of all annotated genes (typically 50-100 nucleotides upstream of start codons) including the beginning of the coding sequence.
- 16S rRNA Tail Definition: Identify the exact 3' end of the 16S rRNA, noting that mis-annotation is common. The anti-SD sequence is typically located within the 13-base tail following helix 45 [40].
- Energy Calculation: For each gene, calculate hybridization free energy (ΔG°) between the 16S rRNA tail and sliding windows of the mRNA sequence across the translation initiation region.
- Relative Spacing Determination: Compute the RS metric to normalize the position of energy minima relative to the start codon, enabling cross-species comparisons.
- Atypical Gene Identification: Flag genes where the strongest binding site occurs at unexpected positions, particularly those with minimal ΔG° at RS+1 (within the start codon).
- Annotation Validation: For strong RS+1 genes (ΔG° < -8.4 kcal/mol), examine in-frame upstream start codons as potential mis-annotations.
Protocol 2: Comparative Evolutionary Analysis of SD-like Sequences
This protocol describes the procedure for assessing functional constraint on internal SD-like sequences through comparative genomics, based on research examining their evolutionary conservation [5].
Materials and Reagents:
- Homologous protein families from multiple related species
- Multiple sequence alignment tools
- Custom scripts for substitution rate calculation (e.g., LEISR)
- Statistical analysis software
Methodology:
- Dataset Assembly: Compile homologous protein families from closely related species (e.g., 61 species in Enterobacterales).
- Substitution Rate Calculation: Quantify nucleotide-level substitution rates across coding sequences, normalizing by the mean rate for each gene.
- SD-like Sequence Identification: Scan protein-coding regions for sequences with significant complementarity to the anti-SD sequence (e.g., binding energy threshold of -4.5 kcal/mol).
- Control Selection: Implement paired-control strategy selecting control sites from the same gene matching either codon identity (codon controls) or trinucleotide context (context controls).
- Conservation Analysis: Compare substitution rates between SD-like sequences and control sites using appropriate statistical tests.
- Functional Inference: Interpret significantly higher substitution rates in SD-like sequences as evidence of purifying selection against these motifs.
Workflow Visualization
Diagram 1: Shine-Dalgarno Sequence Identification and Annotation Improvement Workflow. This workflow illustrates the process from initial genomic data to curated annotations, highlighting key steps including energy calculation and atypical pattern detection.
Annotation Error Detection and Correction
Recognition of Atypical SD Patterns
Bioinformatic analyses of SD sequences have revealed systematic patterns indicative of annotation errors. Research examining 18 prokaryotic genomes identified 2,420 genes where the strongest binding site for the 16S rRNA occurred at the unusual RS+1 position, incorporating the start codon itself rather than the expected 5-10 bases upstream [41]. Among these, 624 genes demonstrated particularly strong binding (ΔG° < -8.4 kcal/mol), with 384 containing in-frame initiation codons within 12 nucleotides upstream, strongly suggesting mis-annotation of the true start codon [41]. These atypical genes also showed a striking bias in start codon usage, with the majority using GUG rather than the canonical AUG, providing an additional signature for potential annotation problems [41].
The detection of these anomalous patterns enables a targeted approach to annotation refinement. By focusing computational and manual curation efforts on genes with strong RS+1 binding sites, annotation efficiency can be significantly improved. This approach is particularly valuable in high-throughput annotation pipelines where manual review of all gene calls is impractical. Integration of SD sequence analysis with other evidence types, such as sequence conservation across homologs and ribosomal profiling data, creates a robust framework for identifying and correcting annotation errors.
Integration with Gene Prediction Algorithms
Modern gene prediction algorithms increasingly incorporate SD sequence analysis to improve start codon identification. Tools like GeneMarkS-2 employ multiple models of sequence patterns in gene upstream regions within the same genome, accounting for the diversity of translation initiation mechanisms across prokaryotic taxa [45]. Computational analyses have revealed that only 61.5% of bacterial genomes primarily use SD-directed translation initiation, with the remainder utilizing non-canonical RBSs or leaderless transcription [45].
The integration of SD sequence detection with start codon prediction represents a critical advancement in annotation accuracy. Research has demonstrated that major gene-finding algorithms (GeneMarkS-2, Prodigal, and NCBI's PGAP pipeline) disagree on start codon predictions for 15-25% of genes in a typical genome [45]. By combining ab initio prediction with SD sequence analysis and homology-based methods, tools like StartLink+ achieve 98-99% accuracy on genes with experimentally verified starts, significantly reducing this discrepancy [45].
Diagram 2: Genome Annotation Improvement Process Through SD Sequence Analysis. This diagram illustrates the iterative refinement of genome annotations by identifying discrepancies between predicted SD sequences and annotated start codons.
Research Reagent Solutions
Table 3: Essential Research Reagents and Computational Tools for SD Sequence Analysis
| Reagent/Tool | Specifications | Application in SD Research |
|---|---|---|
| Galaxy Platform [44] | Web-based bioinformatics platform | Provides workflow environment for SD sequence detection and integration with other annotation evidence |
| Apollo Annotation Editor [44] | JBrowse-based genome visualization | Enables manual curation of SD sequences and start codons in genomic context |
| INN-HB Model Implementation [41] | Thermodynamic model for RNA-RNA hybridization | Accurately calculates binding energy between 16S rRNA and potential SD sequences |
| ShineFind Tool [43] | SD sequence detection algorithm | Scans upstream regions for matches to consensus SD motifs and derivatives |
| StartLink+ [45] | Hybrid gene start predictor | Combines ab initio and homology-based methods for start codon identification |
| 16S rRNA Sequence Database [40] | Curated collection of rRNA sequences | Provides correct anti-SD sequences for hybridization calculations |
Current Research Challenges and Future Directions
The field of SD sequence research continues to face several significant challenges. One persistent issue involves the accurate identification of the 3' end of 16S rRNA sequences, which is critical for determining the correct anti-SD sequence for hybridization calculations. A comprehensive analysis revealed that 12,495 of 20,648 prokaryotic taxids had mis-annotated 16S rRNA 3' ends that missed part or all of the anti-SD sequence [40]. This widespread annotation error necessitates verification and correction of rRNA annotations before reliable SD sequence analysis can be performed.
Another major challenge concerns the diversity of translation initiation mechanisms beyond canonical SD-directed initiation. Growing evidence indicates that many prokaryotes utilize leaderless mRNAs that lack 5' untranslated regions and therefore do not contain upstream SD sequences [13] [45]. Research on Deinococcus radiodurans has revealed that approximately one-third of genes are transcribed as leaderless mRNAs, with a promoter -10 region-like motif (TANNNT) located immediately upstream of the ORF serving both transcriptional and possibly translational initiation functions [13]. This phenomenon appears widespread in the Deinococcus-Thermus phylum and necessitates adaptation of bioinformatic workflows to account for alternative initiation mechanisms.
Future directions in SD sequence research will likely focus on integrating multiple evidence types for comprehensive translation initiation site annotation. The combination of thermodynamic profiling, sequence conservation, ribosomal profiling data, and experimental validation will provide increasingly accurate genome annotations. Additionally, the development of more sophisticated algorithms that can simultaneously model multiple initiation mechanisms within a single genome will improve annotation quality, particularly for non-model organisms and metagenomic assemblies. As these methods mature, they will enhance our understanding of the evolution of translation initiation mechanisms and facilitate more accurate functional annotation across the prokaryotic tree of life.
Leveraging Software Tools and Algorithms for High-Throughput Analysis
The Shine-Dalgarno (SD) sequence is a conserved ribosomal binding site in bacterial and archaeal messenger RNA (mRNA), typically located approximately 8 bases upstream of the start codon AUG [1]. This purine-rich sequence, with a consensus sequence of AGGAGG, plays a critical role in protein synthesis initiation by base-pairing with the complementary anti-Shine-Dalgarno (aSD) sequence at the 3' end of the 16S ribosomal RNA (rRNA) [1]. This interaction aligns the ribosome with the start codon, ensuring proper initiation of translation. The degree of complementarity between the SD and aSD sequences significantly influences translation efficiency, with mutations in this region capable of either reducing or increasing protein expression levels in prokaryotes [1].
Within the context of high-throughput genomic analysis, accurate identification of Shine-Dalgarno sequences enables researchers to better understand and manipulate gene regulation in bacterial systems. The development of sophisticated bioinformatics tools and algorithms has revolutionized our capacity to identify these regulatory elements across entire genomes, facilitating large-scale studies of translational regulation, phylogenetic relationships, and bacterial pathogenesis. This technical guide explores the software tools, experimental methodologies, and computational workflows essential for high-throughput analysis of Shine-Dalgarno sequences, with particular emphasis on their application in drug development and basic research.
Computational Tools for Sequence Analysis and Identification
Integrated Bioinformatics Platforms
Comprehensive bioinformatics suites provide researchers with streamlined workflows for genomic analysis, including the identification of regulatory elements like Shine-Dalgarno sequences. Geneious Prime offers a multifaceted environment for sequence analysis through its intuitive interface and powerful algorithms [46]. The platform enables researchers to automatically annotate motifs, open reading frames (ORFs), and repetitive elements within genomic sequences, which can be extended to include Shine-Dalgarno sequence identification through custom annotation patterns [46]. Its real-time annotation capabilities via similarity searches against databases facilitate rapid verification of putative SD sequences, while the integrated primer design tools assist in creating oligonucleotides for experimental validation of predicted ribosomal binding sites [46].
The platform supports multiple sequence alignment using established algorithms such as MUSCLE, MAFFT, and Clustal Omega, enabling comparative analysis of SD sequences across different bacterial strains or species [46]. This functionality is particularly valuable for identifying conserved regulatory elements and studying sequence-structure-function relationships in translation initiation. Furthermore, Geneious Prime's molecular cloning tools allow researchers to design experiments that manipulate SD sequences and assess their impact on gene expression, providing an integrated workflow from computational prediction to experimental design [46].
RNA-Seq Analysis Tools
Transcriptome sequencing and analysis tools provide indirect methods for studying Shine-Dalgarno sequences through their functional effects on gene expression. The DRAGEN (Dynamic Read Analysis for GENomics) RNA-Seq pipeline on Illumina's BaseSpace Sequence Hub enables ultra-rapid processing of transcriptomic data, which can reveal expression patterns influenced by SD sequence efficiency [47]. This platform supports a broad range of transcriptome studies, from gene expression analysis to total RNA expression profiling, with specialized applications for mRNA sequencing, targeted RNA sequencing, and small RNA sequencing [47].
For functional interpretation of RNA-Seq results in the context of translation initiation, Illumina Correlation Engine provides a valuable resource for biological context. This omics research database contains curated and normalized datasets from thousands of public studies, enabling researchers to connect differential gene expression data with disease associations and visualize correlated genes [47]. Such integrative analysis can help identify relationships between SD sequence variations and expression phenotypes relevant to drug development.
Table 1: Bioinformatics Software Tools for High-Throughput Sequence Analysis
| Tool/Platform | Primary Function | SD Sequence Relevance | Supported Analyses |
|---|---|---|---|
| Geneious Prime | Integrated sequence analysis | Motif annotation, comparative genomics | Multiple sequence alignment, primer design, molecular cloning |
| DRAGEN RNA-Seq | Secondary analysis of RNA-Seq data | Indirect assessment via expression analysis | Read alignment, quantification, differential expression |
| Partek Flow | Multiomics data analysis | Pattern identification in genomic contexts | Statistical analysis, visualization, integrative omics |
| Illumina Correlation Engine | Biological interpretation | Contextualizing SD-mediated regulation | Pathway analysis, functional annotation, knowledge mining |
Quality Control and Preprocessing Tools
High-quality data forms the foundation of reliable Shine-Dalgarno sequence identification in genomic studies. Several specialized tools facilitate quality assessment and preprocessing of next-generation sequencing data:
- FastQC provides comprehensive quality control metrics for high-throughput sequence data, enabling researchers to identify potential issues with raw sequencing reads that could impact downstream analysis [48].
- MultiQC aggregates and visualizes results from multiple quality control tools (including FastQC, HTSeq, RSeQC, and others) across all samples into a single report, facilitating efficient quality assessment in large-scale studies [48].
- Trimming tools such as cutadapt and Flexbar remove adapter sequences and low-quality bases from reads, which is particularly important for accurate identification of regulatory elements in the 5' regions of transcripts [48].
- RSeQC analyzes diverse aspects of RNA-Seq experiments, including sequence quality, strand specificity, and read distribution over genome structure, providing insights into potential biases that might affect SD sequence detection [48].
High-Throughput Genomic Analysis Frameworks
Large-Scale Genotyping and Sequencing Technologies
High-throughput genomics studies investigating regulatory elements like Shine-Dalgarno sequences require technologies capable of processing tens to hundreds of thousands of samples efficiently [49]. Illumina sequencing by synthesis technology enables comprehensive characterization of any genome by detecting single bases as they are incorporated into growing DNA strands, providing the read accuracy necessary for identifying conserved motifs such as SD sequences [49]. For extremely large-scale genotyping studies, BeadArray microarray technology offers exceptional coverage of valuable genomic regions, making it suitable for population-level studies of ribosomal binding sites [49].
The efficiency of high-throughput genomic analysis depends significantly on supporting infrastructure and workflows. Library prep automation using liquid-handling robots provides a reliable option for laboratories preparing large quantities of sequencing libraries, reducing human error and increasing reproducibility [49]. Similarly, sample multiplexing allows large numbers of libraries to be pooled and sequenced simultaneously during a single sequencing run, significantly increasing throughput while reducing per-sample costs [49]. These approaches enable researchers to design studies with sufficient statistical power to identify subtle variations in SD sequences and their association with phenotypic traits.
Genome Analysis Toolkit for Variant Discovery
The Genome Analysis Toolkit (GATK) provides a comprehensive framework for variant discovery in high-throughput sequencing data, with applications extending to bacterial genomics and regulatory element analysis [50]. Developed at the Broad Institute, GATK offers a wide variety of tools with a primary focus on variant discovery and genotyping, employing a powerful processing engine and high-performance computing features capable of handling projects of any scale [50].
While originally developed for human genetics, GATK has evolved to handle genome data from any organism, with any level of ploidy, making it suitable for bacterial genomic studies including Shine-Dalgarno sequence analysis [50]. The toolkit includes best practices workflows for all major classes of variants, from germline short variants to somatic copy number variants, providing a structured approach to identifying sequence variations that might affect SD function [50]. The incorporation of the Picard toolkit for manipulation and quality control of high-throughput sequencing data further enhances its utility for comprehensive genomic analysis [50].
Experimental Protocols for Validation
Single Molecule Kinetic Analysis of RNA Transient Structure
The SiM-KARTS (Single Molecule Kinetic Analysis of RNA Transient Structure) technique provides a powerful experimental approach for directly investigating SD sequence accessibility and its modulation by ligands or cellular factors [6]. This methodology employs a short, fluorescently labeled nucleic acid probe complementary to the SD sequence to probe changes in RNA structure through repeated binding and dissociation events, offering direct insight into the dynamic nature of riboswitch regulation at single-molecule resolution [6].
Table 2: Key Research Reagents for SD Sequence Analysis
| Reagent/Resource | Function | Application Example |
|---|---|---|
| Anti-SD Probe (Cy5-labeled) | Reports SD sequence accessibility | SiM-KARTS analysis of riboswitch regulation [6] |
| TYE563-LNA Marker | Visualizes and blocks secondary SD sequences | Immobilization and specific targeting in single-molecule studies [6] |
| Biotinylated Capture Strand | Surface immobilization of mRNA | Single-molecule TIRFM imaging [6] |
| RiboGrove Database | Curated collection of full-length 16S rRNA genes | Identification of anti-SD sequences across prokaryotes [51] |
| preQ1 Ligand | Riboswitch modulator | Investigation of ligand-dependent SD accessibility [6] |
Protocol: SiM-KARTS for SD Sequence Accessibility
Probe Design: Design a fluorescently (Cy5) labeled RNA anti-SD probe with the sequence of the 12 nucleotides at the very 3' end of the relevant species' 16S rRNA [6].
Target Preparation: Hybridize target mRNA molecules with a high-melting-temperature TYE563-labeled locked nucleic acid (LNA) for visualization. For mRNAs with multiple open reading frames, design the LNA marker to block distinct SD sequences and start codons of secondary ORFs to prevent non-specific probe binding [6].
Surface Immobilization: Immobilize mRNA molecules on a quartz slide at low density via a biotinylated capture strand. Confirm successful assembly by visualizing TYE563 fluorescence, which should only be observed when all components are properly assembled on the surface [6].
Image Acquisition: Image samples with single-molecule sensitivity by total internal reflection fluorescence microscopy (TIRFM). Under TIRFM, only probe molecules transiently immobilized to the slide surface via the mRNA target will be observed within the evanescent field and co-localized with TYE563 in a diffraction-limited spot [6].
Data Analysis: Extract dwell times of the probe in bound and unbound states (τbound and τunbound) from Cy5 emission trajectories using a two-state Hidden Markov Model (HMM). This analysis quantitatively reports on the accessibility of the SD sequence and thus the secondary structure of individual mRNA molecules [6].
Riboswitch Functional Analysis in Native Context
To study SD sequence function within translational riboswitches in their native context, the following protocol can be employed:
In vitro Translation Assay: Perform in vitro translation using purified translation factors and ribosomes. For the Tte preQ1 riboswitch, this approach successfully produced the two expected proteins encoded by the bicistronic operon [6].
Competition Experiments: Conduct translation competitions using a molar ratio of target mRNA to control mRNA (e.g., 4:1 ratio of Tte to chloramphenicol acetyltransferase mRNA). The control mRNA should not contain the riboswitch and thus not be modulated in its translation by the ligand under investigation [6].
Ligand Modulation: Add saturating concentrations of the relevant ligand (e.g., 16 and 100 μM preQ1 for the Tte riboswitch) to assess mRNA-specific changes in translation efficiency [6].
Quantification: Account for differences in labeled amino acid incorporation between target and control proteins when quantifying translation efficiency. For the Tte riboswitch, this approach revealed an approximately 40% decrease in translation of the target genes upon addition of preQ1 [6].
Diagram 1: High-Throughput SD Sequence Analysis Workflow
Data Analysis and Interpretation
Specialized Databases for 16S rRNA Sequences
The RiboGrove database represents a valuable resource for researchers studying Shine-Dalgarno sequences and their complementary anti-SD sequences [51]. Unlike other 16S rRNA databases that contain both complete and partial gene sequences, RiboGrove comprises exclusively full-length sequences of 16S rRNA genes originating from completely assembled prokaryotic genomes deposited in RefSeq [51]. This exclusive focus on complete sequences enables analyses that would not be possible using amplicon-derived gene sequences, including comprehensive surveys of anti-SD sequence conservation across prokaryotic organisms.
The absence of partial gene sequences in RiboGrove enabled the identification of prokaryotic organisms that lack the core anti-Shine-Dalgarno sequence in their 16S rRNA genes, revealing important exceptions to this nearly universal feature of bacterial translation initiation [51]. Such databases provide essential reference data for interpreting high-throughput studies of SD sequences, enabling researchers to contextualize their findings within a comprehensive framework of prokaryotic ribosomal biology.
Integration with Multiomics Approaches
Advanced analysis of Shine-Dalgarno sequences increasingly involves integration with other data modalities through multiomics approaches. The combination of genomics with transcriptomics, methylomics, proteomics, and metabolomics provides a systems-level understanding of how variations in SD sequences impact cellular physiology and phenotype [49]. Such integrated analyses can uncover targets for common chronic diseases and reveal the complex regulatory networks in which SD-mediated translation control operates.
Illumina's Correlation Engine supports this integrative approach by providing a knowledge base of biological relationships drawn from thousands of public omics studies [47]. This resource helps researchers contextualize differential gene expression data within broader biological frameworks, connecting SD sequence variations with disease associations, drug activities, and functional pathways [47]. For drug development professionals, such integrative analysis can prioritize potential therapeutic targets and guide intervention strategies based on comprehensive molecular profiling.
The high-throughput analysis of Shine-Dalgarno sequences has been transformed by advances in both computational tools and experimental methodologies. Integrated bioinformatics platforms like Geneious Prime provide comprehensive environments for sequence annotation and analysis, while specialized techniques such as SiM-KARTS enable direct investigation of SD sequence accessibility at single-molecule resolution [6] [46]. The continuing development of databases like RiboGrove, containing curated full-length 16S rRNA sequences, supports increasingly sophisticated comparative analyses of these fundamental regulatory elements across diverse prokaryotic taxa [51].
For researchers and drug development professionals, these tools and methodologies enable systematic investigation of how sequence variations in ribosomal binding sites influence gene expression, cellular function, and ultimately phenotype. The integration of SD sequence analysis with multiomics datasets provides particularly powerful insights for identifying therapeutic targets and understanding bacterial pathogenesis mechanisms. As high-throughput technologies continue to evolve, they will undoubtedly yield even more refined approaches for elucidating the complex relationship between SD sequence features and their functional consequences in prokaryotic systems.
Addressing Common Challenges and Optimizing Prediction Accuracy
The Shine-Dalgarno (SD) sequence, a ribosomal binding site in prokaryotes, facilitates translation initiation through base-pairing with the anti-Shine-Dalgarno (aSD) sequence on 16S rRNA. While conventionally defined as an AG-rich motif located upstream of the start codon, genomic studies reveal significant sequence diversity and widespread occurrence of AG-rich regions that may not function as true SD sequences. This technical guide synthesizes current computational and experimental methodologies to distinguish functional SD sequences from random AG-rich regions, addressing a critical challenge in genome annotation, gene expression prediction, and synthetic biology design. We present quantitative frameworks for evaluation, detailed experimental protocols for validation, and integrative approaches that leverage both sequence analysis and functional assessment to resolve annotation ambiguity in prokaryotic genomes.
The Shine-Dalgarno sequence was first identified in 1973 by John Shine and Lynn Dalgarno as a purine-rich region in bacterial mRNA that complements the 3' end of 16S ribosomal RNA [1] [14]. This sequence enables proper ribosome positioning for translation initiation by base-pairing with the anti-SD sequence of the 16S rRNA, typically aligning the start codon (AUG) with the ribosomal P-site [1]. The canonical SD sequence in Escherichia coli is 5'-AGGAGGU-3', located approximately 8 bases upstream of the start codon, though significant sequence variation exists across prokaryotic taxa [1] [52].
Despite the established role of SD sequences in translation initiation, several challenges complicate their accurate identification in genomic sequences. Bacterial genomes contain abundant AG-rich regions that may mimic SD sequences but lack functional significance in translation initiation. Additionally, numerous genes utilize SD-independent translation initiation mechanisms, including leaderless mRNAs that completely lack 5' untranslated regions [2] [8]. The traditional definition of SD sequences as strictly AG-rich motifs has been questioned by genomic surveys showing that guanine content, rather than specific motif matching, better predicts translation efficiency [52]. This ambiguity necessitates robust computational and experimental approaches to distinguish functional SD sequences from random AG-rich regions.
Computational Identification Methods
Sequence-Based Analysis
Traditional sequence-based identification methods rely on motif searching using position-specific scoring matrices or consensus sequences. The six-base consensus SD sequence is AGGAGG, though significant variation occurs across species and even within genomes [1]. For example, in E. coli phage T4 early genes, the shorter GAGG motif dominates [1]. Simple pattern matching approaches typically search for sub-strings complementary to the aSD sequence (CCUCCU) that are at least three nucleotides long, but these methods suffer from high false positive rates due to the frequency of AG-rich regions in genomic sequences [53].
Table 1: Consensus SD Sequences Across Organisms
| Organism/Context | Consensus Sequence | Position Relative to AUG | Reference |
|---|---|---|---|
| E. coli canonical | AGGAGGU | ~8 bases upstream | [1] |
| E. coli phage T4 early genes | GAGG | ~8 bases upstream | [1] |
| General prokaryotic consensus | AGGAGG | 5-10 bases upstream | [1] |
| Optimal spacing | AG-rich | 5-9 bases upstream | [1] |
Free Energy Calculations
Thermodynamic calculations of hybridization energy between potential SD sequences and the aSD provide a more robust approach than simple sequence matching. The free energy change (ΔG°) of mRNA-rRNA binding correlates with translation initiation efficiency and helps identify functional SD sequences [53]. Implementation of the Individual Nearest Neighbor Hydrogen Bond (INN-HB) model for oligo-oligo hybridization allows precise calculation of binding stability, significantly improving prediction accuracy over motif-based methods [53].
The relative spacing (RS) metric normalizes indexing across different rRNA tail lengths and enables systematic scanning of the entire translation initiation region (TIR), including sequences downstream of the start codon [53]. This approach identified unexpected SD-like sequences at the RS+1 position (within the start codon) in 2,420 genes across 18 prokaryotic genomes, many of which represented start codon mis-annotations [53].
Table 2: Free Energy Thresholds for SD Sequence Classification
| Free Energy (ΔG°) | Classification | Functional Interpretation | Reference |
|---|---|---|---|
| > -3.45 kcal/mol | Weak/Non-functional | Minimal ribosomal binding | [53] |
| -3.45 to -8.4 kcal/mol | Moderate | Functional SD sequence | [53] |
| < -8.4 kcal/mol | Strong | High translation efficiency | [53] |
| Context-dependent | Optimal | Varies by genomic context | [52] |
Genomic Context Integration
Advanced prediction methods incorporate genomic context features beyond the immediate SD sequence, including:
- Upstream standby sites: Single-stranded regions 13-22 nucleotides upstream of start codons that facilitate initial ribosomal attachment [8]
- mRNA secondary structure: Stability of the SD sequence region, as structured regions inhibit ribosomal access [52] [8]
- Start codon type: Non-AUG start codons (particularly GUG) frequently associate with atypical SD positioning [53]
- Gene conservation patterns: Evolutionary conservation of putative SD sequences across related species
Experimental Validation Methods
High-Throughput Sort-Seq Platform
Recent advances enable systematic measurement of SD sequence functionality through high-throughput experimental platforms. One robust approach employs fluorescent reporter systems to quantify translation efficiency across thousands of SD variants [52].
Experimental Workflow
Diagram 1: Sort-seq workflow for SD function
Protocol Details
Library Construction:
- Create SD variant libraries covering all possible 9-nucleotide sequences (262,144 genotypes) in the 11-nt region 5-15 bases upstream of the start codon
- Clone variants into plasmid vectors containing GFP reporter cassettes with different RBS contexts to control for mRNA secondary structure effects [52]
Cell Sorting and Sequencing:
- Transform libraries into E. coli and grow in liquid culture to mid-log phase (OD₆₀₀ = 0.55-0.65)
- Sort cells into multiple bins based on GFP fluorescence intensity using FACS
- Extract and sequence plasmids from each bin to determine genotype distribution [52]
Fitness Calculation:
- Calculate translation efficiency (fitness) for each genotype from its distribution across fluorescence bins
- Define fitness as Log[GFP] to establish additive relationship between SD sequence changes and protein production [52]
This approach generated comprehensive fitness landscapes for SD sequences, revealing that guanine content rather than specific motif conservation best predicts translation efficiency [52].
Molecular Validation Assays
Ribosome Binding Assays
Direct measurement of ribosome-mRNA binding affinity provides functional validation of putative SD sequences:
- Native gel shift assays: Monitor formation of 30S ribosomal subunit-mRNA complexes
- Filter binding assays: Quantify binding affinity using radiolabeled mRNA and purified ribosomes
- Toeprinting assays: Map precise ribosome positions on mRNA templates through reverse transcription inhibition
Mutational Analysis
Systematic mutagenesis of putative SD sequences and compensatory mutations in 16S rRNA tests functionality through restoration of translation efficiency:
- Introduce mutations into putative SD sequences that reduce complementarity to aSD
- Measure reduction in translation efficiency using reporter assays
- Engineer compensatory mutations in 16S rRNA aSD sequence that restore complementarity
- Confirm restoration of translation efficiency, validating functional importance [1]
Research Reagent Solutions
Table 3: Essential Research Reagents for SD Sequence Analysis
| Reagent/Resource | Function | Application Example | Reference |
|---|---|---|---|
| GFP reporter plasmids | Quantitative translation measurement | Sort-seq fitness mapping | [52] |
| INN-HB algorithm | Free energy calculation | Computational SD prediction | [53] |
| 16S rRNA variants | aSD complementarity testing | Mutational validation | [1] |
| Ribosome purification kits | In vitro binding studies | Direct affinity measurement | [2] |
| FACS instrumentation | Cell population sorting | High-throughput screening | [52] |
| Randomized oligonucleotide libraries | SD sequence diversity | Empirical fitness landscapes | [52] |
Interpretation Guidelines
Distinguishing Functional Features
True functional SD sequences demonstrate:
- Optimal spacing: Located 5-9 nucleotides upstream of start codons, with 7-12 nt being the typical functional range [1] [8]
- Moderate binding energy: ΔG° values between -3.45 and -8.4 kcal/mol, with extremes in either direction potentially suboptimal [53]
- Sequence accessibility: Minimal mRNA secondary structure surrounding the SD region, as determined by folding algorithms [52] [8]
- Evolutionary conservation: Maintenance of complementary to species-specific aSD sequences across phylogenetically related organisms
Context-Dependent Considerations
SD sequence functionality depends on broader genomic and cellular contexts:
- Gene essentiality: Essential genes often exhibit stronger SD sequences than non-essential genes [52]
- Growth conditions: SD strength correlates with expression demands under different environmental conditions [8]
- Operon position: Translationally coupled genes in polycistronic operons may exhibit atypical SD features [8]
- Species-specificity: aSD sequences vary across prokaryotic taxa, necessitating species-adjusted prediction models [8]
Accurate discrimination between functional Shine-Dalgarno sequences and random AG-rich regions requires integrated computational and experimental approaches. While sequence complementarity to the aSD remains a fundamental criterion, contemporary understanding emphasizes guanine content, binding free energy, and genomic context as critical discriminators. The experimental and computational frameworks presented herein provide researchers with robust methodologies for resolving SD sequence ambiguity, thereby enhancing genome annotation accuracy, enabling precise metabolic engineering, and advancing fundamental understanding of translation initiation mechanisms in prokaryotic systems. Future advances in single-molecule imaging and CRISPR-based genomic editing will further refine these approaches, ultimately enabling predictive design of synthetic SD sequences for optimized gene expression in biotechnology and therapeutic applications.
Correcting Start Codon Mis-annotation Using SD Location Analysis
Accurate genome annotation is fundamental to modern biological research and its applications in drug development and synthetic biology. Despite advances in computational prediction, mis-annotation of start codons remains a persistent challenge in prokaryotic genomics. This technical guide explores the theory and methodology of using Shine-Dalgarno (SD) sequence location analysis as a powerful tool for identifying and correcting these errors. We present a detailed framework that leverages the conserved spatial relationship between SD sequences and authentic start codons, enabling researchers to improve annotation accuracy through analysis of ribosomal binding site architecture.
In prokaryotic systems, translation initiation typically relies on the Shine-Dalgarno mechanism, wherein a purine-rich SD sequence in the 5' untranslated region of mRNA base-pairs with the anti-SD sequence at the 3' end of the 16S ribosomal RNA [2] [1]. This interaction positions the ribosome correctly relative to the initiation codon, with the SD sequence generally located approximately 5-10 nucleotides upstream of the start codon [2] [1].
The degeneracy of SD sequences and biological exceptions to the canonical mechanism make computational start codon prediction challenging. Traditional annotation pipelines primarily rely on sequence homology and codon usage patterns, which can miss genuine start sites or mis-annotate internal methionine codons as initiation sites. These errors propagate through downstream analyses, affecting metabolic pathway predictions, essential gene determinations, and experimental design in drug discovery workflows.
Starmer et al. demonstrated that analyzing the position of the strongest ribosomal binding site relative to putative start codons can reveal systematic annotation errors [18]. Their approach identified hundreds of mis-annotated genes across multiple prokaryotic genomes by detecting violations of the expected spatial relationship between SD sequences and authentic start codons.
Theoretical Foundation: SD-Start Codon Spatial Relationship
The Canonical SD Positioning Paradigm
The ribosomal binding site architecture follows conserved principles across bacterial taxa. The SD sequence, typically exhibiting complementarity to the 3' terminal sequence of 16S rRNA (5'-ACCUCCUUA-3'), is positioned at a specific distance upstream of the initiation codon to ensure proper ribosomal positioning [2] [8]. This spacing allows the start codon to be precisely placed in the ribosomal P-site during initiation complex formation.
Experimental studies have determined optimal spacing distances that maximize translation efficiency. Vellanoweth and Rabinowitz established that the optimal spacing differs between Gram-positive and Gram-negative bacteria, measuring approximately 9 nucleotides in Gram-positives and 7 nucleotides in Gram-negatives [54]. Significant deviations from these optimal distances dramatically reduce translation initiation efficiency, providing a biological basis for identifying mis-annotated start codons that disrupt this spatial relationship.
Exceptional Translation Initiation Mechanisms
While the SD mechanism dominates prokaryotic translation initiation, several exceptions exist that complicate annotation efforts:
- Leaderless mRNAs: Some transcripts lack 5' untranslated regions entirely, initiating translation directly at the 5' terminal start codon without SD mediation [55] [8].
- SD-independent initiation: Some mRNAs utilize structured elements or specific nucleotide composition around the start codon rather than canonical SD pairing [55] [8].
- Translational coupling: In polycistronic operons, translation of downstream genes can be coupled to upstream genes without strong internal SD sequences [8].
These exceptions notwithstanding, the majority of prokaryotic genes follow the canonical SD-mediated initiation pattern, making SD location analysis a valuable correction tool.
Methodology: SD Location Analysis for Start Codon Validation
Core Computational Framework
The Relative Spacing (RS) metric developed by Starmer et al. provides a normalized coordinate system for analyzing ribosomal binding energy profiles relative to start codons [18]. This approach involves calculating hybridization energy between the 3' end of 16S rRNA and mRNA sequences across the translation initiation region (TIR), typically defined as positions -60 to +20 relative to the annotated start codon (position 0).
The methodology employs the Individual Nearest Neighbor Hydrogen Bond (INN-HB) model to compute Gibbs free energy (ΔG°) of hybridization between the mRNA and the 3' terminal segment of 16S rRNA (typically the final 8-13 nucleotides) [18] [55]. Scanning this calculation across the TIR identifies positions of strongest ribosomal binding, with the minimal ΔG° value indicating the most probable SD location.
Table 1: Key Parameters for SD Location Analysis
| Parameter | Typical Value | Description |
|---|---|---|
| TIR Scanning Window | -60 to +20 | Region analyzed relative to start codon |
| 16S rRNA 3' Tail Length | 8-13 nucleotides | Anti-SD sequence used for ΔG calculation |
| Optimal Spacing (Gram-negative) | ~7 nt | Distance from SD to start codon |
| Optimal Spacing (Gram-positive) | ~9 nt | Distance from SD to start codon |
| Strong Binding Threshold | < -8.4 kcal/mol | ΔG value indicating strong SD sequence |
Identification of Mis-annotated Genes
Analysis of 18 prokaryotic genomes revealed that in most properly annotated genes, the position of minimal ΔG° (strongest ribosomal binding) occurs 5-10 nucleotides upstream of the true start codon (RS-5 to RS-10) [18]. However, examination of 58,550 genes identified 2,420 genes where the strongest binding site included the start codon itself (RS+1 position). Among these, 624 genes exhibited particularly strong binding (ΔG° < -8.4 kcal/mol) at this unexpected location [18].
Further investigation determined that 384 (62%) of these strong RS+1 genes had an in-frame initiation codon located within 12 nucleotides downstream of the strong SD sequence [18]. The most parsimonious explanation for this pattern is mis-annotation of the true start codon, with the actual initiation site located downstream of the annotated position. This approach successfully flagged hundreds of genes for manual re-examination across multiple bacterial genomes.
SD Analysis Workflow for Start Codon Correction
Experimental Validation Approaches
Computational predictions require experimental validation to confirm start codon corrections:
Ribosome Profiling: Ribosome-protected mRNA footprinting provides direct evidence of ribosomal positioning at specific initiation sites. True start codons show characteristic ribosome occupancy patterns.
Mutational Analysis: Introducing mutations at predicted SD sequences and monitoring translation efficiency changes confirms functional importance. Compensatory mutations in 16S rRNA can restore translation when SD sequences are mutated [1].
Mass Spectrometry: N-terminal peptide mapping via proteomic approaches directly identifies translation initiation sites, providing definitive validation of start codon predictions.
Reporter Gene Assays: Fusion of putative regulatory regions to fluorescent or enzymatic reporters quantitatively measures translation initiation efficiency at candidate start codons.
Case Studies and Genomic Applications
Large-Scale Genomic Corrections
The RS metric approach has been applied to identify systematic annotation errors across diverse bacterial taxa. In one comprehensive analysis, researchers examined translation initiation regions in 260 prokaryotic species (235 bacteria and 25 archaea), identifying distinct nucleotide frequency biases around start codons in non-SD genes [55]. These patterns provided additional evidence for correcting start codon annotations in species with high proportions of leaderless mRNAs or SD-independent initiation.
Comparative analysis revealed that species with high fractions of non-SD genes exhibited symmetrical nucleotide frequency biases around initiation codons, potentially reducing secondary structure formation and facilitating SD-independent initiation [55]. These findings enabled development of phylum-specific correction algorithms that account for taxonomic differences in translation initiation mechanisms.
Table 2: SD Sequence Features Across Prokaryotic Taxa
| Taxonomic Group | SD Prevalence | Common SD Variants | Notable Features |
|---|---|---|---|
| E. coli & Close Relatives | High (~80%) | AGGAGGU, GGAGG | Strong complementarity to 16S rRNA |
| Gram-positive Bacteria | Variable | GGAGG, GAGG | Longer optimal spacing (~9 nt) |
| Archaea | Lower than Bacteria | Varied | Mixed initiation mechanisms |
| Halobacterium salinarum | Low | Non-canonical | High leaderless mRNA prevalence |
Specialized Applications in Synthetic Biology
SD location analysis has proven valuable in synthetic biology and metabolic engineering applications. The IIT-Madras iGEM team developed a machine learning model that incorporates SD binding energy and spacing as key features for predicting gene expression levels [54]. Their RBS Optimization Tool enables precise tuning of translation initiation rates for metabolic pathway engineering, demonstrating the practical utility of understanding SD-start codon relationships.
In riboswitch studies, single-molecule analysis (SiM-KARTS) has directly visualized how ligand binding modulates SD sequence accessibility, revealing complex dynamics beyond simple binary switching [6]. These findings have implications for designing riboswitch-regulated expression systems with precise dynamic ranges for metabolic engineering and therapeutic applications.
Table 3: Key Research Reagents and Computational Tools
| Resource | Type | Function/Application |
|---|---|---|
| RiboGrove Database [51] | Data Resource | Curated collection of full-length 16S rRNA sequences from complete genomes |
| free_scan Software [55] | Computational Tool | Calculates ΔG of hybridization between mRNA and 16S rRNA 3' tail |
| ViennaRNA Package [54] | Computational Library | RNA secondary structure prediction and free energy calculation |
| RBS Calculator [54] | Prediction Tool | Models and predicts translation initiation rates based on RBS sequence |
| Anti-SD Probes [6] | Experimental Reagent | Fluorescently-labeled oligonucleotides for measuring SD accessibility |
| Purified Translation System [6] | Biochemical System | Cell-free translation for validating initiation site predictions |
Implementation Considerations and Best Practices
Methodological Refinements
Effective implementation of SD location analysis requires attention to several technical considerations:
Species-Specific 16S rRNA Sequences: While the core anti-SD sequence is often conserved, variations exist across taxa that affect hybridization energy calculations. Using the correct 16S rRNA 3' sequence for the target organism significantly improves prediction accuracy [51]. The RiboGrove database provides curated, full-length 16S rRNA sequences from completely assembled genomes for this purpose.
Energy Calculation Parameters: The INN-HB model provides more accurate energy calculations than simple sequence matching, accounting for nearest-neighbor effects and stabilizing interactions. Setting appropriate scanning windows (-20 to -5 for SD regions) and using experimentally validated energy parameters improves detection sensitivity.
Multiple Hypothesis Testing: Genome-wide scans require correction for multiple comparisons, as random low-energy binding sites can occur by chance. Combining energy thresholds with positional criteria reduces false positives.
Integration with Complementary Approaches
SD location analysis proves most powerful when integrated with other evidence sources:
Sequence Conservation: Genuine start codons typically show higher conservation across orthologs than mis-annotated sites.
Nucleotide Composition Patterns: The region immediately downstream of true start codons often exhibits characteristic composition biases that facilitate ribosomal binding and translocation [55].
Protein Homology: Corrected start codons should produce proteins with improved alignment to homologous sequences, particularly at the N-terminus.
Ribosome Profiling Data: When available, ribosomal footprinting data provides direct experimental evidence for translation initiation sites.
SD location analysis represents a powerful addition to the genome annotation toolkit, leveraging fundamental principles of translation initiation to identify and correct start codon mis-annotations. The methodology capitalizes on the conserved spatial relationship between SD sequences and authentic start codons, flagging violations of this relationship for manual curation. As genomic sequencing accelerates and applications in drug development increasingly rely on accurate gene annotation, computational approaches that leverage biological principles like SD-start codon spacing will play an increasingly important role in ensuring annotation quality. Future developments incorporating machine learning and single-molecule validation will further enhance the precision and applicability of these methods across diverse prokaryotic taxa.
Accounting for mRNA Secondary Structure and Sequence Accessibility
The identification of functional Shine-Dalgarno (SD) sequences is fundamentally constrained by mRNA secondary structure, which can occlude these ribosomal binding sites and dramatically impact translation initiation efficiency. This technical guide examines the intricate relationship between mRNA accessibility and SD sequence recognition, providing researchers with both theoretical frameworks and practical methodologies to account for structural elements in genomic analyses. We integrate computational prediction algorithms with experimental validation techniques to create a comprehensive workflow for accurately identifying functional SD sequences that account for the dynamic nature of RNA folding in biological systems, particularly relevant for antibiotic target identification and optimizing heterologous gene expression in synthetic biology applications.
The Shine-Dalgarno sequence is a ribosomal binding site in bacterial and archaeal messenger RNA, typically located approximately 8 bases upstream of the start codon AUG [1]. This purine-rich sequence (consensus: AGGAGG) facilitates translation initiation through complementary base pairing with the 3' end of 16S ribosomal RNA (5'-YACCUCCUUA-3') [1]. While the nucleotide sequence itself is readily identifiable through pattern matching in genomic sequences, the functional activity of SD sequences is profoundly influenced by local mRNA secondary structure, which can sequester the SD sequence in double-stranded regions, rendering it inaccessible to ribosomal binding.
The accessibility paradox presents a significant challenge in genomics research: a perfect consensus SD sequence may be functionally inactive due to structural occlusion, while a non-consensus sequence with favorable accessibility may serve as an efficient ribosomal binding site. This technical guide addresses this complexity by providing methodologies to account for both sequence and structural determinants of functional SD sequences, with particular emphasis on their implications for drug development targeting bacterial translation machinery and optimizing recombinant protein expression.
Computational Prediction of RNA Secondary Structure
Thermodynamic Modeling Approaches
Thermodynamic models represent the foundational approach to RNA secondary structure prediction, employing free energy minimization algorithms to identify the most stable structures. The Turner nearest-neighbor model decomposes secondary structures into characteristic substructures (hairpin loops, internal loops, bulge loops, base-pair stackings, and multi-branch loops), with experimentally determined free energy parameters for each component [56]. The free energy of an entire RNA structure is calculated by summing the energy contributions of these decomposed elements.
Implementation of these models is available through several established tools:
- RNAstructure: Implements algorithms for predicting minimum free energy (MFE) structures, maximum expected accuracy (MEA) structures, and pseudoknotted structures via the ProbKnot algorithm [57]
- RNAfold: Part of the ViennaRNA Package, providing MFE and equilibrium probability calculations [58]
- UNAfold/Mfold: Early implementations that continue to be widely used for secondary structure prediction [56]
These tools employ dynamic programming algorithms, notably the Zuker algorithm, to efficiently compute optimal secondary structures [56]. The minimum free energy structure represents the conformation predicted to be most probable at equilibrium, though it may not always represent the biologically active form.
Machine Learning and Deep Learning Advances
Recent advances in machine learning have significantly improved RNA structure prediction accuracy. MXfold2 integrates deep learning-derived folding scores with Turner's thermodynamic parameters, using a deep neural network to compute four types of folding scores for each nucleotide pair [56]. This hybrid approach employs thermodynamic regularization during training to minimize overfitting by ensuring folding scores remain consistent with experimental free energy measurements.
Comparative performance analysis demonstrates that MXfold2 achieves an F-value of 0.761 for sequences structurally similar to training data (TestSetA) and 0.601 for structurally dissimilar sequences (TestSetB), outperforming other methods in robustness [56]. Alternative machine learning approaches include:
- CONTRAfold: Uses conditional random fields for structure prediction
- SPOT-RNA: Implements deep neural networks for base-pair classification
- E2Efold: Employs end-to-end deep learning for secondary structure prediction
Table 1: Performance Comparison of RNA Secondary Structure Prediction Tools
| Tool | Methodology | Advantages | F-value (TestSetA) | F-value (TestSetB) |
|---|---|---|---|---|
| MXfold2 | Deep learning + thermodynamics | Highest robustness | 0.761 | 0.601 |
| ContextFold | Machine learning | High accuracy on similar sequences | 0.759 | 0.502 |
| CONTRAfold | Conditional random fields | Tunable prediction parameters | 0.719 | 0.573 |
| RNAstructure | Thermodynamic model | Handles pseudoknots | Varies | Varies |
| RNAfold | Thermodynamic model | Fast computation | Varies | Varies |
Accessibility Profiling and Boltzmann Sampling
Beyond single-structure prediction, the Boltzmann sampling algorithm generates statistically representative ensembles of secondary structures to estimate the probability of particular structural motifs [59]. This approach computes the equilibrium partition function for all possible secondary structures, then uses recursive sampling to draw structures according to their Boltzmann probabilities.
For SD sequence identification, this enables accessibility profiling of potential ribosomal binding sites. The probability of a region being unpaired (accessible) can be calculated as:
[P{\text{access}}(i) = 1 - \sum{j} P_{\text{pair}}(i,j)]
where (P_{\text{pair}}(i,j)) is the base-pairing probability between nucleotides i and j, computed from the Boltzmann ensemble [59]. This probabilistic approach more accurately reflects the dynamic nature of RNA folding in physiological conditions compared to single-structure predictions.
Experimental Methodologies for Assessing mRNA Accessibility
High-Throughput Experimental Mapping
Experimental validation is essential for confirming computational predictions of mRNA accessibility. Several high-throughput methods have been developed to probe RNA structures in their native cellular environments:
INTERFACE (In vivo Transcriptional Elongation Analyzed by RNA-seq for Functional Accessibility Characterization) couples regional hybridization detection to transcription elongation outputs measurable by RNA-seq [60]. This system employs:
- Toehold-switch probes: Engineered antisense RNA sequences (9-26 nt) complementary to target regions
- Transcription anti-termination output: Hybridization activates transcription elongation into a reporter sequence
- High-throughput sequencing: Quantifies accessibility of hundreds of regions simultaneously
The method has demonstrated that approximately two-thirds of tested bacterial small RNAs feature Hfq chaperone-dependent accessible regions, highlighting the importance of protein interactions in determining RNA accessibility [60].
MAST (mRNA Accessible Site Tagging) immobilizes mRNA molecules and hybridizes them to randomized oligonucleotide libraries [61]. Specifically bound oligonucleotides are then sequenced to precisely define accessible sites. Validation studies demonstrated that antisense oligonucleotides designed against MAST-identified accessible sites in human RhoA mRNA showed strong correlation between accessibility and gene knockdown efficacy [61].
Traditional Biochemical Probing
While lower in throughput, traditional biochemical methods remain valuable for focused studies:
- RNase H mapping: Uses short DNA oligonucleotides to hybridize to accessible regions, recruiting RNase H to cleave the RNA-DNA heteroduplex
- Chemical probing: Reagents like DMS (dimethyl sulfate) modify unpaired bases, providing nucleotide-resolution accessibility data
- Gel shift assays: Measure binding affinity of oligonucleotides to target mRNA regions
These methods have been largely superseded by high-throughput approaches for genomic-scale studies but remain valuable for validating specific targets.
Integrated Workflow for SD Sequence Identification
Computational Screening Pipeline
A robust workflow for identifying functional SD sequences incorporates both sequence and structural analysis:
- Sequence Scanning: Identify potential SD sequences using pattern matching with degeneracy (e.g., AGGAGG, GAGG, GGAG)
- Context Definition: Extract sequences encompassing ~100 nucleotides surrounding each potential SD site
- Structure Prediction: Compute secondary structures using multiple algorithms (e.g., MXfold2, RNAfold)
- Accessibility Scoring: Calculate the probability of the SD sequence being unpaired using Boltzmann sampling
- Energy Calculation: Estimate hybridization energy between each SD sequence and 16S rRNA
- Functional Ranking: Combine accessibility, hybridization energy, and conservation into a composite score
Table 2: Research Reagent Solutions for mRNA Accessibility Studies
| Reagent/Resource | Type | Function | Example Source |
|---|---|---|---|
| RNAstructure | Software suite | Predicts MFE, MEA, and pseudoknotted structures | [57] |
| MXfold2 | Algorithm | Deep learning with thermodynamic integration | [56] |
| INTERFACE | Experimental system | High-throughput in vivo accessibility mapping | [60] |
| MAST | Experimental protocol | Solution-based accessible site tagging | [61] |
| Dynabeads | Streptavidin-coated paramagnetic beads | mRNA immobilization for hybridization selection | [61] |
| Biotin-UTP | Modified nucleotide | Labeling in vitro transcribed mRNA for immobilization | [61] |
| Randomized oligonucleotide libraries | Nucleic acid reagents | Probing accessible regions in experimental mapping | [61] |
Experimental Validation Strategies
Confirmation of predicted functional SD sequences requires experimental validation:
- Toehold switch reporters: Engineer riboregulators that activate translation only when specific SD sequences are accessible
- Ribosomal binding assays: Direct measurement of ribosomal protein binding to candidate sequences
- Mutational analysis: Systematically disrupt predicted structural elements to confirm their impact on accessibility
- Gene expression correlation: Compare accessibility predictions with measured translation efficiency from ribosome profiling data
Diagram: Integrated Workflow for Identifying Functional Shine-Dalgarno Sequences
Diagram: INTERFACE Method for In Vivo Accessibility Mapping
Applications in Drug Development and Biotechnology
The precise identification of functional SD sequences has significant implications for pharmaceutical and biotechnology applications:
Antibiotic Target Identification
Many antibiotics target the bacterial translation machinery, and understanding SD sequence accessibility enables:
- Species-specific targeting: Identification of SD sequences unique to pathogenic bacteria
- Resistance mechanism analysis: Understanding how structural mutations affect antibiotic efficacy
- Novel antibiotic design: Developing oligonucleotides that competitively inhibit ribosomal binding
Optimizing Heterologous Expression
In recombinant protein production, strategic manipulation of SD accessibility can dramatically enhance yields:
- Codon context engineering: Modifying sequences flanking SD sites to maximize accessibility
- Structural destabilization: Introducing silent mutations that disrupt inhibitory structures without altering protein sequence
- Ribosomal binding site optimization: Designing synthetic SD sequences with optimal accessibility and complementarity to 16S rRNA
Accurate identification of functional Shine-Dalgarno sequences requires integration of both sequence-based and structure-based approaches. Computational methods, particularly those combining deep learning with thermodynamic principles like MXfold2, provide robust predictions of mRNA accessibility, while high-throughput experimental methods like INTERFACE offer in vivo validation. The integrated workflow presented in this guide enables researchers to move beyond simple sequence pattern matching to a sophisticated understanding of how RNA structural dynamics influence ribosomal binding and translation initiation. As structural genomics continues to advance, these methodologies will become increasingly essential for both basic research and applied biotechnology in the identification of novel antibiotic targets and optimization of protein expression systems.
Interpreting Weak or Atypical SD Sequences in Different Genomic Contexts
The Shine-Dalgarno (SD) sequence, a core element of prokaryotic ribosome-binding sites, has long been recognized as a key facilitator of translation initiation through base-pairing with the anti-Shine-Dalgarno (aSD) sequence at the 3' end of 16S ribosomal RNA (rRNA) [8] [1]. This molecular interaction aligns the ribosome with the start codon on messenger RNA (mRNA), enabling efficient protein synthesis initiation. While the classical model posits a well-conserved, AG-rich SD sequence (typically AGGAGG) located approximately 8 bases upstream of the start codon, contemporary genomic analyses reveal a far more complex reality [1]. Examination of thousands of prokaryotic species has uncovered tremendous SD sequence diversity both within and between genomes, while aSD sequences remain largely static [8]. This divergence from the established paradigm necessitates advanced interpretive frameworks for identifying and characterizing weak and atypical SD sequences across different genomic contexts.
The spectrum of translation initiation mechanisms extends beyond canonical SD-aSD pairing. Current understanding recognizes three principal pathways: (1) SD:aSD-dependent initiation for mRNAs with strong SD sequences; (2) SD:aSD-independent initiation for mRNAs lacking stable SD pairing capacity (SD(-) mRNA); and (3) leaderless (LS) initiation for mRNAs essentially lacking a 5' untranslated region [8]. The prevalence of these alternative mechanisms varies significantly across species, growth conditions, and genomic contexts, reflecting an evolutionary adaptation to optimize gene expression in diverse biological environments. This technical guide provides researchers with advanced methodologies for identifying and interpreting weak and atypical SD sequences, framed within the broader context of genomic research and therapeutic development.
Computational Identification and Analysis Framework
Sequence-Based Detection Algorithms
Computational identification of SD sequences requires specialized algorithms that extend beyond simple pattern matching. While the canonical SD motif (AGGAGG) serves as a useful reference, actual genomic SD sequences exhibit substantial variation in both sequence composition and binding strength.
Table 1: Classification of SD Sequences by Binding Strength
| Strength Category | Free Energy Range (kcal/mol) | Representative Motifs | Genomic Prevalence |
|---|---|---|---|
| Strong | ≤ -7.0 | AGGAGG, GGGAG | ~15% of bacterial genes |
| Moderate | -7.0 to -5.0 | AGGAG, GAGGT | ~25% of bacterial genes |
| Weak | -5.0 to -4.5 | AGGA, GAGG | ~30% of bacterial genes |
| Atypical | > -4.5 | Variable, minimal complementarity | ~30% of bacterial genes |
Effective computational detection requires scanning upstream regions of start codons (typically -20 to -1 nucleotides) for sequences complementary to the 3' end of 16S rRNA (anti-SD sequence: CACCUCCU) [8] [1]. The binding energy threshold for defining functional SD sequences is typically set at -4.5 kcal/mol, though this varies by organism [5]. For weak and atypical sequences, this threshold may need adjustment based on experimental validation. Advanced tools incorporate not only sequence complementarity but also positional weighting (optimal spacing 5-9 nucleotides upstream of start codon), secondary structure accessibility, and phylogenetic conservation patterns.
When scanning within protein-coding regions, it is crucial to distinguish functional SD sequences from SD-like sequences that occur by chance. Comparative evolutionary analysis reveals that strong SD-like sequences within genes are generally not conserved and are likely deleterious due to potential for spurious translation initiation [5]. This depletion pattern provides an important filter for distinguishing functional elements from random occurrences.
Structural Accessibility Considerations
The accessibility of SD sequences to ribosomal binding is heavily influenced by local mRNA secondary structure. The standby site model proposes that the 30S ribosomal subunit initially binds to single-stranded regions upstream of RBSs, awaiting transient relaxation of mRNA structure before engaging the SD sequence [8]. Computational prediction of SD accessibility should therefore include:
- Free energy calculations of the region spanning -30 to +20 nucleotides relative to the start codon
- Base-pairing probability profiles to identify regions of persistent single-stranded character
- Co-transcriptional folding simulations to account for temporal aspects of structure formation
Studies demonstrate that synonymous mutations in coding regions can dramatically affect translation efficiency by altering SD accessibility through long-range RNA interactions [62]. This highlights the importance of considering full transcript architecture when interpreting weak SD sequences, as occluded SD sequences can reduce protein expression by 20-fold or more despite adequate sequence complementarity [62].
Table 2: Computational Tools for SD Sequence Analysis
| Tool Category | Representative Tools | Key Features | Limitations |
|---|---|---|---|
| SD sequence scanners | RBSCalculator, SDseq | Energy-based scoring, position weighting | May miss contextual factors |
| Secondary structure predictors | RNAfold, Mfold | Free energy minimization, partition function | Static predictions, no co-transcriptional folding |
| Comparative genomics suites | PhyloSD, RBSfinder | Conservation-based inference, phylogenetic signals | Requires multiple genomes, computationally intensive |
| Riboswitch detectors | RiboSW, RibEx | Regulatory element integration, ligand responsiveness | Specialized for regulated systems |
Phylogenetic and Conservation Analysis
Evolutionary conservation provides powerful evidence for functional significance of weak or atypical SD sequences. Comparative analysis across related species can distinguish functionally constrained SD sequences from random occurrences. However, the approach requires careful implementation:
- Focus on 4-fold redundant sites within coding regions to isolate nucleotide-level conservation from amino acid constraints [5]
- Calculate substitution rates relative to carefully matched control sites from the same genes
- Assess depletion patterns of start codons downstream of internal SD-like sequences as evidence of functional constraint
Contrary to what might be expected for functional elements, research shows that strong SD-like sequences within protein-coding genes exhibit higher substitution rates than control sites, indicating they are generally deleterious and removed by purifying selection [5]. This pattern highlights the evolutionary trade-off between potential benefits of translational pausing and costs of spurious initiation.
Experimental Validation Methodologies
Single-Molecule Accessibility Profiling
Single Molecule Kinetic Analysis of RNA Transient Structure (SiM-KARTS) provides direct measurement of SD sequence accessibility in near-native conditions [6]. This technique enables real-time observation of probe binding dynamics to individual mRNA molecules, revealing transient accessibility states that would be averaged out in bulk measurements.
Table 3: Key Reagents for SiM-KARTS Experiments
| Research Reagent | Function/Description | Experimental Role |
|---|---|---|
| Cy5-labelled anti-SD probe | Short RNA complementary to SD sequence | Reports on SD accessibility through binding events |
| TYE563-LNA marker | High-affinity nucleic acid analog | mRNA immobilization and visualization |
| Biotinylated capture strand | Oligonucleotide for surface attachment | Facilitates single-molecule imaging |
| Quartz slide with PEG-biotin coating | Low-fluorescence surface | Platform for immobilized mRNA molecules |
Protocol: SiM-KARTS for SD Accessibility Measurement
mRNA Preparation: Synthesize target mRNA containing the SD sequence of interest, ensuring inclusion of any relevant regulatory contexts (e.g., riboswitch aptamers, native 5' UTRs).
Surface Functionalization: Prepare quartz slides with polyethylene glycol (PEG) coating containing 0.5-1% biotin-PEG for neutravidin attachment. Incubate with neutravidin (0.2 mg/mL) for 5 minutes followed by washing.
mRNA Immobilization: Hybridize target mRNA with TYE563-LNA marker designed to block secondary SD sequences in bicistronic mRNAs. Incubate with biotinylated capture strand complementary to a region outside the area of interest. Immobilize on neutravidin-functionalized surface at low density (~100 molecules per field of view).
Data Acquisition: Flow in anti-SD probe (0.5-5 nM concentration) in appropriate buffer (typically 50 mM Tris-HCl, pH 7.5, 100 mM KCl, 5 mM MgCl₂). Image using total internal reflection fluorescence (TIRF) microscopy with alternating laser excitation (488 nm for positioning, 561 nm for TYE563, 640 nm for Cy5).
Data Analysis: Extract binding trajectories using Hidden Markov Model (HMM) analysis. Calculate dwell times in bound and unbound states (τbound and τunbound) across hundreds of individual mRNA molecules to determine accessibility parameters.
SiM-KARTS analysis of the preQ1 riboswitch revealed that individual mRNA molecules alternate between conformational states with different SD accessibilities, characterized by "bursts" of probe binding [6]. Ligand addition decreased the lifetime of high-accessibility states and prolonged intervals between bursts, demonstrating direct coupling between ligand sensing and SD availability.
In Vitro Translation Assays
Cell-free translation systems provide a controlled environment for quantifying the functional impact of SD sequences on protein synthesis efficiency.
Protocol: Competitive In Vitro Translation Assay
Template Design: Clone gene of interest downstream of SD variants into appropriate vectors. Include a reference gene (e.g., chloramphenicol acetyltransferase, CAT) with constitutive SD sequence as internal control.
mRNA Preparation: Transcribe mRNAs in vitro using T7 RNA polymerase. Purify using affinity-based methods to ensure integrity. Quantify by spectrophotometry and validate by gel electrophoresis.
Translation Reaction: Prepare E. coli S30 extract system according to manufacturer protocols. Include energy regeneration system (phosphoenolpyruvate, pyruvate kinase), amino acid mixture, and appropriate salts. Use mRNA ratio of 4:1 (test:control) to enable competition effects.
Product Detection: Incorporate ³⁵S-methionine or similar label during translation. Separate proteins by SDS-PAGE. Visualize by phosphorimaging or autoradiography. Quantify band intensities using image analysis software.
Data Normalization: Normalize test protein signals to internal control, accounting for differences in methionine content between proteins. Express results as relative translation efficiency compared to positive control.
This approach demonstrated approximately 40% decrease in translation of native Tte mRNA genes upon addition of saturating preQ1 ligand to a riboswitch-regulated SD sequence [6].
Ribosome Profiling and Toeprinting
Ribosome profiling (ribo-seq) provides genome-wide snapshot of ribosome positions at nucleotide resolution, while toeprinting assays offer precise mapping of translation initiation complexes.
Toeprinting Assay Protocol:
Complex Formation: Incubate mRNA template (0.5-1 pmol) with purified 30S ribosomal subunits (2-3 pmol) and initiator tRNA (3-5 pmol) in appropriate buffer at 37°C for 10 minutes.
Primer Extension: Add reverse transcription primer complementary to region 100-150 nt downstream of initiation site. Include dNTPs and reverse transcriptase. Incubate at 37°C for 15-30 minutes.
Reaction Termination: Extract nucleic acids and separate by denaturing PAGE. Include sequencing ladder for precise mapping.
Analysis: Identify reverse transcription stops corresponding to ribosome-protected regions. Intensity of toeprint signals correlates with initiation efficiency.
Biological Contexts and Functional Interpretation
Riboswitch-Regulated SD Sequences
Riboswitches represent a important biological context where SD accessibility is directly modulated by ligand binding. In translational riboswitches, ligand-induced structural changes sequester the SD sequence through alternative base pairing, inhibiting translation initiation [6]. Key characteristics include:
- Ligand-dependent accessibility bursts observed at single-molecule level
- Imperfect riboswitching where individual mRNA molecules show nuanced responses
- Dynamic equilibrium between accessible and inaccessible states rather than binary switching
The preQ1 riboswitch from T. tengcongensis demonstrates how sequestration of just the first two nucleotides of the SD sequence can substantially impact translation initiation, highlighting the sensitivity of the system to partial occlusion [6].
SD Sequences in Polycistronic Operons
In polycistronic mRNAs, translation initiation of internal cistrons often involves translational coupling mechanisms where upstream translation events influence downstream initiation efficiency. Two primary mechanisms operate:
- Ribosome-mediated unwinding where elongating ribosomes disrupt secondary structure blocking downstream RBS
- Translation re-initiation where terminating ribosomes directly transition to downstream start sites
The latter mechanism can involve 70S ribosomes scanning short intergenic regions and initiating with reduced dependence on SD-aSD pairing [8]. This context-dependent initiation mechanism enables differential expression of operon-encoded genes despite similar SD sequences.
Leaderless mRNA Translation
Leaderless (LS) mRNAs, which essentially lack 5' UTRs, represent an extreme case of SD-independent initiation. These mRNAs are particularly abundant in archaea and some bacterial species under specific conditions [8]. Key features include:
- Primary reliance on start codon recognition rather than SD-aSD pairing
- Capacity for direct 70S ribosome binding rather than standard 30S initiation
- Enhanced sensitivity to start codon mutations and 5' terminal modifications
The presence of LS mRNAs in a genome indicates species-specific adaptation of translation machinery and necessitates specialized detection approaches that do not presuppose upstream SD sequences.
Applications in Therapeutic Development
Understanding weak and atypical SD sequences has significant implications for drug development, particularly in targeting pathogenic bacteria and designing synthetic genetic systems.
Antibacterial Drug Targets
Riboswitch-regulated SD sequences represent promising targets for novel antibacterial agents. Ligands that stabilize the SD-occluded conformation can selectively inhibit essential gene expression in pathogens. Development strategies include:
- Analogue design based on natural riboswitch ligands (e.g., preQ1, TPP, FMN)
- High-throughput screening for compounds that modulate SD accessibility
- Structural optimization to improve binding affinity and specificity
The small size of the preQ1 riboswitch aptamer (~34 nucleotides) makes it particularly amenable to therapeutic targeting [6].
Synthetic Biology and Vaccine Design
Optimization of SD sequences is crucial for recombinant protein production and vaccine development. Key principles include:
- SD accessibility engineering through synonymous codon usage in early coding regions
- Anti-SD sequence avoidance to prevent unintended intramolecular pairing
- Regulatory integration through incorporation of ligand-responsive elements
Unexpectedly, full "optimization" of rare codons in endogenous E. coli genes can reduce protein expression by 20-fold or more due to impaired SD accessibility [62]. This highlights the importance of contextual factors beyond simple codon usage metrics.
Interpreting weak and atypical SD sequences requires integrated computational and experimental approaches that account for genomic context, structural accessibility, and evolutionary constraints. The framework presented in this guide enables researchers to move beyond simplistic sequence matching to functional characterization of translation initiation elements across diverse biological systems. As genomic databases continue to expand and single-molecule techniques become more accessible, our understanding of SD sequence diversity and its functional implications will continue to refine, offering new opportunities for basic research and therapeutic development.
Optimizing SD Sequences for Heterologous Gene Expression and Synthetic Biology
The Shine-Dalgarno (SD) sequence, a key component of the prokaryotic ribosome-binding site (RBS), is a purine-rich region typically located 5-10 nucleotides upstream of the start codon (AUG) on messenger RNA [1]. This sequence facilitates translation initiation by base-pairing with the anti-Shine-Dalgarno (aSD) sequence at the 3' end of the 16S ribosomal RNA (rRNA), which in Escherichia coli is 5'-CCUCCU-3' [1] [8]. The six-base consensus SD sequence is AGGAGG, though significant variation exists both within and between genomes, with the shorter GAGG motif dominating in certain systems like E. coli virus T4 early genes [1]. This molecular recognition mechanism serves to align the ribosome with the start codon, enabling accurate and efficient initiation of protein synthesis [1].
In synthetic biology and heterologous gene expression, optimizing the SD sequence is crucial for maximizing protein production. The efficiency of SD:aSD base pairing directly influences translation initiation rates, with mutations in the SD sequence capable of either reducing or increasing translation efficiency in prokaryotes [1]. Beyond mere sequence composition, the accessibility of the SD sequence—dictated by mRNA secondary structure—has emerged as a critical factor determining translation efficiency and consequent protein expression levels [62]. Recent research has revealed that bacterial genes have evolved to minimize intramolecular base pairing with their respective upstream SD sequences, underscoring the universal importance of this mechanism for optimizing gene expression [62].
SD Sequence Diversity and Recognition Mechanisms
Sequence Variation and Functional Implications
While the canonical SD sequence is well-defined, significant diversity exists in nature. Surveys across thousands of prokaryotic species reveal tremendous SD sequence variation both within and between genomes, while aSD sequences remain largely static [8]. This diversity has led to the identification of three broad classes of mRNA based on their 5' untranslated regions (UTRs) and SD characteristics:
Table 1: Classification of mRNA Types Based on 5' UTR and SD Sequence Characteristics
| mRNA Type | 5' UTR Status | SD:aSD Pairing Capacity | Primary Initiation Mechanism | Prevalence |
|---|---|---|---|---|
| SD(+) mRNA | Has 5' UTR | Capable of stable pairing | SD:aSD base-pairing dependent | Majority of bacteria, especially E. coli |
| SD(-) mRNA | Has 5' UTR | Lacks stable pairing capacity | SD:aSD independent; relies on unstructured regions | Varies by species |
| Leaderless (LS) mRNA | Lacks or has very short 5' UTR (<8 nt) | N/A | Direct 70S ribosome binding to start codon | Many archaea and some bacteria |
This classification reflects the evolutionary adaptation of translation initiation mechanisms to different environmental constraints and growth demands [8]. The SD diversity observed across prokaryotes is shaped by optimization of gene expression, ecological niche adaptation, and species-specific requirements of ribosomes to initiate translation [8].
Structural Basis of Recognition
Structural studies have confirmed the formation of an RNA duplex between the SD sequence and the aSD sequence at the mRNA channel of the 30S ribosomal subunit [8]. This base-pairing interaction serves two primary functions: stabilizing the mRNA-30S pre-initiation complex and positioning the 30S subunit correctly relative to the start codon. The limited base-pairing energy (typically 4-5 base pairs in E. coli) makes it thermodynamically challenging for free ribosomes to directly locate SD sequences buried in secondary structures, leading to the proposed "standby" model where the 30S subunit initially binds upstream of the RBS before sliding into position when mRNA structure transiently relaxes [8].
Ribosomal protein S1 plays a crucial role in this process by facilitating 30S subunit attachment to standby sites and unwinding secondary structures that occlude the SD region [8]. The region 13-22 nucleotides upstream of the translation start site in E. coli mRNA is consistently less structured than other regions, suggesting evolutionary optimization as a standby site for ribosome accommodation [8].
Optimization Parameters for SD Sequences
Key Determinants of Translation Efficiency
Several critical parameters influence the efficiency of translation initiation mediated by the SD sequence:
Table 2: Key Parameters for SD Sequence Optimization
| Parameter | Optimal Characteristics | Impact on Translation | Experimental Support |
|---|---|---|---|
| Spacing from Start Codon | ~8 bases upstream of AUG [1] | Critical for proper start codon alignment | Systematic spacing variants show dramatic effects on expression |
| Base Pairing Strength | 4-5 bp complementarity to aSD [8] | Moderate stability optimal; too weak poor initiation, too strong may cause ribosomal stalling | Compensatory mutations in 16S rRNA restore function |
| Sequence Accessibility | Minimal secondary structure occlusion [62] | Single-stranded accessibility crucial for ribosome binding | N-terminal synonymous mutations that occlude SD reduce expression 20-fold |
| Upstream Standby Site | Unstructured region 13-22 nt upstream of start codon [8] | Facilitates initial ribosome binding | Bioinformatics shows conserved low structure in this region |
| Sequence Composition | A/G-rich core (AGGAGG or variants) [1] | Determines base-pairing potential with aSD | Library screening identifies enrichment of A/G at positions -7 to -12 |
The accessibility of the SD sequence has been demonstrated to be particularly crucial. Research on synonymous substitutions in endogenous E. coli genes revealed that mutations reducing intracellular mRNA levels promote mRNA secondary structures that occlude the upstream SD sequence, thereby impairing translation initiation [62]. This effect is compounded in systems where transcription and translation are coupled, as impaired translation can lead to reduced mRNA levels through premature transcription termination [62].
Contextual Considerations in Different Species
The optimal SD sequence can vary significantly across different prokaryotic species. In the Deinococcus-Thermus phylum, for example, a significant proportion of genes are expressed as leaderless mRNAs, utilizing a -10 promoter region motif (TANNNT) immediately upstream of the ORF without classical SD sequences [63]. This alternative expression pattern highlights the importance of considering phylogenetic context when designing SD sequences for heterologous expression in non-model organisms.
The recognition that SD:aSD base pairing, while beneficial, is non-essential for translation initiation in all contexts [8] has important implications for synthetic biology. For SD(-) mRNAs, translation initiation proceeds through sequence-non-specific binding, with ribosomal protein S1 and initiation factor IF3 playing supportive roles [8]. These mRNAs typically display weaker secondary structure around the start codon and symmetrical nucleotide frequency bias in this region, features that help guide correct initiation site selection [8].
Experimental Analysis of SD Sequences
Systematic Mutagenesis Approaches
The functional importance of SD sequences can be systematically analyzed through targeted mutagenesis approaches. The following workflow outlines a comprehensive experimental protocol for SD sequence characterization:
Diagram 1: SD Optimization Workflow
In practice, this approach has yielded critical insights. For example, systematic codon replacements in endogenous E. coli genes (folA and adk) revealed that the first rare codon has a disproportionately large effect on mRNA levels, primarily through its influence on SD sequence accessibility [62]. Surprisingly, optimization of all rare codons in the folA gene resulted in a 20-fold decrease in soluble protein and a 4-fold drop in intracellular mRNA levels, contrary to what would be predicted by the "rare codon ramp" hypothesis [62].
Protocol: Assessing SD Sequence Accessibility
Objective: Determine how synonymous coding changes affect SD sequence accessibility and translation initiation.
Materials:
- Expression Vector with inducible promoter (e.g., pBAD arabinose-inducible system)
- Reporter Gene (e.g., GFP, luciferase, or enzymatic reporter)
- Host Strain (e.g., E. coli MG1655 or BL21 for prokaryotic systems)
- qPCR Equipment and reagents for mRNA quantification
- Western Blot equipment for protein quantification
- Secondary Structure Prediction Software (e.g., mfold, RNAfold)
Procedure:
- Clone the target gene with synonymous variants into the expression vector, ensuring identical promoter and regulatory elements.
- Transform constructs into the host organism and culture under standardized conditions.
- Induce expression and harvest samples at multiple time points for parallel mRNA and protein analysis.
- Isolate mRNA and quantify transcript levels using qPCR with standardized controls.
- Measure protein expression using Western blotting with quantitative detection or enzymatic activity assays.
- Predict mRNA secondary structure using computational tools, paying particular attention to the SD region and its pairing potential with downstream coding sequences.
- Correlate expression data with structural predictions to identify mutations that occlude the SD sequence.
Interpretation: Mutations that reduce both mRNA and protein levels suggest impaired translation initiation, often due to SD sequence occlusion. In systems with coupled transcription and translation, this can trigger Rho-dependent transcription termination, amplifying the negative effects on gene expression [62].
Table 3: Research Reagent Solutions for SD Sequence Optimization
| Reagent/Resource | Function/Application | Key Features | Examples/References |
|---|---|---|---|
| RBS Library Vectors | Generate SD sequence variants | Pre-designed with varying SD strength and spacing | Commercial synthetic biology kits |
| Secondary Structure Prediction Tools | Computational assessment of SD accessibility | Predicts mRNA folding and SD occlusion probability | mfold, RNAfold, RBSCalculator |
| Dual-Luciferase Reporter Systems | Quantify translation efficiency | Internal control for normalization; high sensitivity | Commercial reporter assays |
| aadA Selection Marker | Chloroplast transformation selection | Spectinomycin/streptomycin resistance; efficient selection | Svab et al., 1990 [64] |
| BioBricks Standardized Parts | Modular SD sequence components | Standardized restriction sites for assembly | Registry of Standard Biological Parts [65] |
| Ribosome Profiling Kits | Monitor ribosome positioning | Genome-wide snapshot of translation initiation | Commercial sequencing-based kits |
| Terminator Collection | Prevent transcriptional readthrough | Ensure defined transcript ends; modular | Synthetic biology part collections |
Computational Design and Prediction Tools
Modern computational approaches have significantly advanced our ability to predict and optimize SD sequences for heterologous expression. These tools incorporate multiple parameters beyond simple sequence complementarity:
Diagram 2: SD Efficiency Prediction
These computational models leverage both thermodynamic parameters (e.g., binding energies, secondary structure stability) and evolutionary information (e.g., conservation patterns, codon context preferences) to predict translation initiation efficiency [66] [8]. High-throughput characterization of RBS variants with randomized sequences has been particularly valuable for establishing quantitative relationships between sequence features and translation efficiency [8].
Advanced tools now incorporate relative synonymous di-codon usage frequencies (RSdCU) in Markov chain models to design "typical genes" that resemble the codon usage patterns of highly expressed endogenous genes [66]. This approach moves beyond simple codon adaptation index (CAI) optimization to consider the complex contextual factors that influence translation efficiency, including SD sequence accessibility.
Applications in Metabolic Engineering and Therapeutic Protein Production
Optimization of SD sequences plays a crucial role in metabolic engineering and therapeutic protein production. In these applications, precise control over translation initiation is essential for balancing metabolic pathways and maximizing product yield. The integration of well-characterized SD sequences into synthetic operons enables coordinated expression of multiple enzymes in biosynthetic pathways [67].
In chloroplast engineering, which has emerged as a powerful platform for producing pharmaceutical proteins and industrial enzymes, SD sequence optimization is particularly important [64]. Chloroplasts possess prokaryotic-type translation machinery, making SD sequence optimization a critical consideration for achieving high-level expression of foreign proteins. Successful chloroplast transformation has been demonstrated in more than 20 plant species, with SD sequence optimization contributing to the remarkable achievement of foreign protein accumulation up to 70% of total soluble protein in some cases [64].
For therapeutic protein production in prokaryotic systems, SD sequence optimization must consider factors beyond maximal expression, including proper folding, solubility, and biological activity. The implementation of standardized biological parts with well-characterized SD sequences, such as those in the BioBricks framework, facilitates the reproducible construction of expression systems with predictable behavior [65].
Future Perspectives and Emerging Technologies
The field of SD sequence optimization continues to evolve with several promising directions:
Integration with mRNA design: Emerging approaches consider the entire mRNA molecule as an integrated system, with SD sequence optimization performed in the context of 5' UTR design, coding sequence optimization, and synthetic 3' UTR elements.
Machine learning applications: Advanced algorithms trained on high-throughput expression data can predict optimal SD sequences for specific hosts and applications, moving beyond rule-based design principles.
Expansion to non-model organisms: As synthetic biology applications expand beyond traditional model organisms, understanding species-specific variations in SD sequence requirements becomes increasingly important.
Dynamic regulation: Engineering SD sequences that respond to cellular signals or environmental conditions enables dynamic control of gene expression in metabolic engineering and therapeutic applications.
The continued development of these technologies, coupled with a deeper understanding of the fundamental mechanisms of translation initiation, will further enhance our ability to harness the SD sequence for optimizing heterologous gene expression in synthetic biology applications.
Experimental Validation and Comparative Genomic Analysis
Laboratory Methods for Validating Computational Predictions
The accurate identification of Shine-Dalgarno (SD) sequences—ribosome binding sites upstream of prokaryotic start codons—is fundamental to understanding gene regulation and protein synthesis. Computational predictions of these elements have become increasingly sophisticated, yet they remain hypotheses until verified by empirical evidence. This guide details the essential laboratory methods used to validate computational SD sequence predictions, providing researchers with a framework for confirming bioinformatic insights with experimental data. The integration of these approaches ensures a comprehensive understanding of translation initiation mechanisms, which is critical for fields ranging from synthetic biology to antibiotic discovery.
Computational Prediction of SD Sequences
Before embarking on laboratory validation, researchers must first generate robust computational predictions. These predictions serve as the foundational hypotheses for all subsequent experimental work.
Free Energy Calculations: One powerful approach uses thermodynamic models to simulate the binding energy between the 3' tail of the 16S ribosomal RNA (rRNA) and candidate sequences in the mRNA translation initiation region (TIR). The Individual Nearest Neighbor Hydrogen Bond (INN-HB) model can identify SD sequences by locating regions of minimal free energy (ΔG°) upstream of start codons [18]. This method can pinpoint the exact location of the SD sequence based on hybridization stability rather than just sequence similarity.
Sequence-Based and Machine Learning Approaches: Beyond energy calculations, algorithms can search for motifs complementary to the anti-SD sequence of 16S rRNA. More advanced machine learning techniques, including neural networks and support vector machines, can extract common features from known functional RNA sequences to predict novel SD-led genes in unannotated genomic regions [68]. These methods help distinguish true SD sequences from spurious sites with incidental similarity.
Landscape Analysis: Recent high-throughput studies have systematically quantified how SD sequence composition affects translational efficiency, revealing that guanine content often predicts fitness better than the presence of a canonical AG-rich motif [52]. Such global fitness landscapes provide a quantitative framework for prioritizing computational predictions for experimental validation.
Table 1: Key Computational Methods for SD Sequence Prediction
| Method Type | Underlying Principle | Key Output | Considerations |
|---|---|---|---|
| Free Energy (INN-HB) [18] | Thermodynamics of mRNA-rRNA hybridization | ΔG° value; identifies location of most stable binding | Highly accurate for location; depends on correct rRNA tail sequence |
| Sequence Motif Search | Sequence complementarity to anti-SD (e.g., CCUCC) | Presence/absence of canonical SD motif | May miss non-canonical but functional SD sequences |
| Machine Learning [68] | Pattern recognition from known RNA genes | Probability score for a region being an SD-led gene | Requires a trained model; performance depends on quality of training data |
| Fitness Landscape [52] | High-throughput measurement of translation efficiency | Quantitative translation efficiency for thousands of genotypes | Provides a genotype-to-phenotype map for informed validation |
Laboratory Validation Methods
Once computational predictions are made, a suite of laboratory techniques is available for their experimental validation. The following methods provide direct evidence for the existence, functionality, and mechanistic role of predicted SD sequences.
Reporter Gene Assays
Reporter gene assays are a direct method for quantifying the translational efficiency mediated by a predicted SD sequence.
- Experimental Principle: The DNA fragment containing the predicted SD sequence and its downstream gene is fused to a reporter gene, such as cat (encoding chloramphenicol acetyltransferase, CAT) or gfp (encoding green fluorescent protein). The core premise is that the strength of the SD sequence will directly influence the translation rate of the reporter mRNA, which can be measured via enzyme activity (e.g., CAT activity) or fluorescence intensity (e.g., GFP) [69] [52].
- Detailed Protocol:
- Clone the Regulatory Sequence: Amplify the genomic region containing the predicted SD sequence and its associated start codon. Clone this fragment upstream of the promoterless reporter gene in a suitable expression vector.
- Generate Mutant Controls: Using site-directed mutagenesis, create derivative constructs where the predicted SD sequence is disrupted (e.g., by introducing point mutations into key nucleotides of the SD-like sequence) [69]. This control is crucial for confirming the specific contribution of the predicted sequence.
- Transform and Culture: Introduce the wild-type and mutant reporter constructs into the appropriate bacterial host (e.g., Escherichia coli or Streptomyces mutans). Grow cultures under defined conditions.
- Measure Reporter Activity:
- Quantify mRNA Levels: To confirm that differences in reporter protein levels stem from translation and not transcription, isolate total RNA from the same cultures and measure reporter mRNA levels using techniques like Northern blotting or RT-qPCR [69].
- Data Interpretation: A strong reduction in reporter activity in the mutant strain, coupled with unchanged mRNA levels, provides compelling evidence that the predicted sequence functions as a bona fide SD sequence. For example, mutations in a distal SD-like sequence in S. mutans resulted in an 83–98% decrease in CAT activity without correlative changes in cat mRNA [69].
Northern Blot Analysis
Northern blotting is used to visualize the transcripts originating from the operon containing the predicted SD sequence, providing information on transcript processing and stability.
- Experimental Principle: This technique involves separating RNA molecules by size via gel electrophoresis, transferring them to a membrane, and hybridizing them with labeled, sequence-specific probes. It can reveal whether the gene of interest is part of a polycistronic operon and if processing events generate smaller, more stable transcripts that might be subject to specific translational control [69].
- Detailed Protocol:
- RNA Isolation: Extract total RNA from bacterial cells under the physiological conditions of interest (e.g., heat shock vs. normal growth). Use rigorous methods to prevent RNA degradation.
- Electrophoresis and Transfer: Denature the RNA samples and separate them on a denaturing agarose gel. Transfer the separated RNA from the gel to a solid-support membrane.
- Probe Hybridization: Generate labeled DNA or RNA probes specific for the gene of interest (e.g., dnaK), its upstream region (e.g., igr66), or other genes in the putative operon (e.g., hrcA). Hybridize these probes to the membrane [69].
- Signal Detection: Detect the hybridized probes using chemiluminescence or fluorescence to visualize the RNA transcripts.
- Data Interpretation: The size and abundance of the detected transcripts indicate the operon structure and potential processing sites. For instance, Northern blotting of the S. mutans dnaK operon using an igr66-specific probe confirmed the absence of an internal promoter but revealed multiple processed transcripts, some of which were crucial for DnaK translation [69].
5'-RACE (Rapid Amplification of cDNA Ends)
5'-RACE is a PCR-based technique used to map the precise 5' termini of mRNA transcripts, which can identify processing sites within intergenic regions that create functional SD sequences.
- Experimental Principle: 5'-RACE identifies the exact start of an mRNA molecule. When transcript processing creates new 5' ends, 5'-RACE can map these termini to specific nucleotides, revealing whether processing events generate stable mRNAs with exposed SD sequences that were not apparent in the primary transcript [69].
- Detailed Protocol:
- Reverse Transcription: Use a gene-specific antisense primer to reverse transcribe the mRNA of interest into cDNA.
- cDNA Tailing and Amplification: Purify the cDNA and add a homopolymeric (e.g., poly-A) tail to its 3' end. Perform PCR amplification using a nested gene-specific primer and a primer complementary to the added tail.
- Cloning and Sequencing: Clone the resulting PCR products and sequence multiple clones to determine the 5' end nucleotide of the original mRNA transcript.
- Data Interpretation: The mapped 5' termini can reveal processed ends located just upstream of SD-like sequences. In S. mutans, 5'-RACE mapped transcript termini within the igr66 region just 5' to SD-like sequences located over 120 bp upstream of the dnaK start codon, providing mechanistic insight into how processing enhances translation [69].
Essential Research Reagents and Tools
Successful validation requires a toolkit of specialized reagents and materials.
Table 2: Key Research Reagent Solutions for SD Sequence Validation
| Reagent / Material | Critical Function | Application Examples |
|---|---|---|
| Reporter Plasmid Vectors | Provides a scaffold for cloning the SD sequence and a quantifiable reporter gene (e.g., CAT, GFP). | pBAD-TOPO vector for arabinose-inducible expression; specialized vectors for CAT or GFP fusions [69] [70]. |
| Stable RNA Controls | Serves as a robust, degradation-resistant internal control for RNA-based assays like RT-qPCR. | Armored RNA (MS2 viral-like particles) encapsulating specific RNA sequences protects from RNases [70]. |
| Strand-Specific Probes | Allows detection of specific mRNA strands in techniques like Northern blotting, crucial for antisense transcript analysis. | Biotin-labeled oligonucleotide probes for Northern blotting [69]. |
| Site-Directed Mutagenesis Kit | Enables the creation of precise mutations in the predicted SD sequence for functional knockout controls. | Kits for introducing point mutations into SD-like sequences to test their necessity [69]. |
Integrated Workflow for Validation
The following diagram illustrates the logical workflow integrating computational prediction and experimental validation of Shine-Dalgarno sequences.
Validating computational predictions of Shine-Dalgarno sequences requires a multifaceted experimental approach. Reporter gene assays provide functional evidence of translational control, Northern blotting reveals transcript architecture and stability, and 5'-RACE pinpoints the precise molecular consequences of transcript processing. By systematically applying this suite of laboratory methods, researchers can move beyond in silico predictions to achieve a definitive, mechanistic understanding of translation initiation in prokaryotic systems, thereby strengthening genome annotations and informing downstream applications in biotechnology and drug discovery.
Assessing Translation Efficiency Through Reporter Gene Assays
Reporter gene assays are powerful, sensitive, and specific tools for studying the regulation of gene expression, particularly translational efficiency [71]. In the context of identifying and characterizing Shine-Dalgarno (SD) sequences in genomes, these assays provide a functional readout on how effectively a ribosomal binding site facilitates the initiation of protein synthesis. The core principle involves linking a putative regulatory sequence, such as a SD sequence variant, to the coding region of an easily quantifiable reporter protein. By measuring the accumulation of the reporter protein, researchers can infer the translational efficiency programmed by the upstream sequence element. This approach is indispensable for high-throughput screening of genomic sequences, validating bioinformatic predictions of SD sites, and understanding the rules that govern ribosome binding and translation initiation in prokaryotes.
Core Principles and Mechanistic Workflows
The Competitive Co-Expression Reporter Assay
A pivotal methodological advancement is the competitive co-expression assay, which assesses translational efficiency without requiring direct quantification of the target protein itself. In this system, a reporter gene, such as that encoding superfolder green fluorescent protein (sfGFP), is co-expressed with a target gene in a single reaction mixture [72]. Both transcripts must compete for a finite pool of ribosomes. Consequently, the ribosome loading efficiency of the target mRNA indirectly influences the translation rate of the reporter mRNA. If the target mRNA has a high translational efficiency (e.g., due to a strong SD sequence), it will sequester a larger share of ribosomes, leading to a reduction in sfGFP synthesis. Conversely, a target mRNA with low translational efficiency will result in higher sfGFP fluorescence. The intensity of sfGFP fluorescence is therefore inversely proportional to the translational efficiency of the co-expressed target gene [72]. This correlation provides a rapid, convenient, and prognostic tool for assessing the relative strengths of different SD sequences.
The following workflow diagram illustrates the logical process and experimental setup for this competitive assay:
The Translational Repression Reporter Assay
Another versatile assay design is the translational repression system, which can be used to study interactions, such as those involving RNA-binding proteins, that occlude the SD sequence [73]. In this setup, the putative RBP binding site or other regulatory sequence is inserted into the 5' untranslated region (UTR) of the reporter mRNA, upstream of the SD sequence and the start codon of a reporter gene like TagBFP (Blue Fluorescent Protein). In the absence of a repressing factor, the ribosome accesses the SD sequence and translates the reporter protein normally. However, if a protein binds specifically to the inserted site in the 5' UTR, it can sterically hinder the ribosome from binding to the SD sequence, thereby repressing translation. The level of repression, measured as a decrease in TagBFP fluorescence, serves as a quantitative indicator of the binding event or the accessibility of the SD sequence [73]. This assay has been optimized to function with linear RNA sequences, making it highly adaptable for studying a wide variety of regulatory contexts relevant to genomic SD sequence analysis.
The workflow for this repression-based assay is as follows:
Quantitative Data and Experimental Parameters
The quantitative output from reporter assays provides critical data for comparing the translational efficiency driven by different sequences. The following table summarizes key measurement parameters and their significance from cited studies.
Table 1: Key Quantitative Parameters from Reporter Assays
| Parameter Measured | Experimental System | Significance & Correlation | Reported Wavelengths (Ex/Em) |
|---|---|---|---|
| sfGFP Fluorescence [72] | Cell-free co-expression | Inversely proportional to target gene translational efficiency | 485 nm / 510 nm [73] |
| TagBFP Fluorescence [73] | Bacterial translational repression | Direct measure of translation; decreases with effective repression | 402 nm / 457 nm [73] |
| Optical Density (OD600) [73] | Bacterial cell growth | Normalization factor for fluorescence, correcting for cell density | 600 nm |
Reporter assays are highly sensitive to sequence context. Optimization studies have shown that signal-to-noise ratio can be strongly improved by multiplying the consensus binding sequence and varying the distance between the inserted sequence and the SD sequence [73]. Furthermore, the relative expression levels of recombinant proteins estimated by the co-expression method are reliably reproduced in living cells, validating its use for prognostic assessment [72].
Detailed Experimental Protocols
Protocol 1: Cell-Free Competitive Co-Expression Assay
This protocol outlines the steps for assessing relative translational efficiencies using a cell-free protein synthesis system co-expressing sfGFP and a target gene [72].
Key Research Reagents:
- S30 Extract: E. coli-based extract providing the core translational machinery.
- Energy Solution: Contains ATP, GTP, UTP, CTP, creatine phosphate, and creatine kinase to fuel transcription and translation.
- Amino Acid Mixture: Includes all 20 natural amino acids, optionally with radiolabeled (e.g., L-[U-14C]leucine) or fluorescently-tagged amino acids for direct protein quantification.
- DNA Templates: Plasmid DNA or PCR products containing the target gene and the sfGFP reporter gene under compatible promoters.
- Total tRNA Mixture: From E. coli strain MRE600, ensures sufficient tRNA for efficient translation.
Procedure:
- Reaction Setup: Prepare the cell-free reaction mixture on ice. A standard mixture includes the following components:
- 6 µL of S30 extract
- 4 µL of amino acid mixture (2 mM)
- 5 µL of energy solution
- 1.5 µL of total tRNA mixture (from E. coli MRE600)
- 0.5 µg of target gene DNA template
- 0.5 µg of sfGFP reporter DNA template
- Nuclease-free water to a final volume of 25 µL.
- Incubation: Incubate the reaction mixture at 37°C for 1-2 hours to allow for simultaneous transcription and translation.
- Measurement: Terminate the reaction by placing it on ice. Dilute the reaction product if necessary. Transfer 100-200 µL of the solution to a black-walled, clear-bottom 96-well microplate.
- Quantification: Measure the sfGFP fluorescence intensity using a microplate reader (e.g., TECAN Spark) at excitation/emission wavelengths of 485/510 nm. Simultaneously measure the optical density at 600 nm (OD600) to normalize for any light-scattering effects.
- Analysis: The normalized fluorescence value (Fluorescence/OD600) is calculated. A lower normalized fluorescence indicates higher translational efficiency of the target gene.
Protocol 2: Bacterial Translational Repression Assay
This protocol describes a method for studying sequence-mediated repression in E. coli, adaptable for testing SD sequence accessibility [73].
Key Research Reagents:
- Reporter Plasmid: Contains the TagBFP gene under an inducible promoter (e.g., arabinose-inducible), with a multiple cloning site in the 5' UTR for inserting regulatory sequences upstream of the SD sequence.
- Expression Plasmid (Optional): For co-expressing an RNA-binding protein or other regulatory factor under a separate inducible promoter (e.g., IPTG-inducible).
- E. coli Strain: A suitable cloning and expression strain, such as Top10F'.
- Antibiotics: For plasmid selection (e.g., Kanamycin 50 µg/mL, Chloramphenicol 34 µg/mL).
- Inducers: Isopropyl β-D-1-thiogalactopyranoside (IPTG) and L-Arabinose.
- Growth Media: LB for pre-cultures, M9 minimal medium for the main assay to reduce background fluorescence.
Procedure:
- Transformation and Pre-culture: Co-transform E. coli Top10F' with the reporter and expression plasmids. Pick a single colony to inoculate a 1 mL pre-culture in LB medium with appropriate antibiotics. Grow overnight (~16 hours) at 37°C with shaking (160 rpm).
- Dilution and Induction: The next day, dilute the pre-culture 1:19 in M9 minimal medium with antibiotics in a black, clear-bottom 96-well plate. Monitor OD600 until it reaches approximately 0.2. Induce the assay by adding IPTG (to a final concentration of 1 mM for RBP expression) and arabinose (to a final concentration of 0-1% for reporter expression).
- Kinetic Measurement: Immediately place the plate in a temperature-controlled microplate reader (e.g., 30°C). Measure the TagBFP fluorescence (402/457 nm), optional sfGFP fluorescence (for RBP expression control, 485/510 nm), and OD600 every 20 minutes over a time course of ~7 hours.
- Analysis: Calculate the normalized fluorescence (Fluorescence/OD600) for each time point. Plot the kinetic curves. The degree of translational repression is indicated by a lower final yield and rate of TagBFP accumulation in induced samples compared to a control without the regulatory factor.
The Scientist's Toolkit: Essential Research Reagents
Successful implementation of reporter assays requires a set of key reagents and instruments. The following table catalogs essential solutions for these experiments.
Table 2: Key Research Reagent Solutions for Reporter Assays
| Reagent / Instrument | Function / Purpose | Specific Examples & Notes |
|---|---|---|
| Reporter Proteins | Provides a quantifiable signal (fluorescence, luminescence) correlated to translational activity. | sfGFP [72], TagBFP [73], Nanoluciferase [74]. Choice depends on sensitivity needs and equipment. |
| Cell-Free Synthesis System | Provides a flexible, open platform for rapid protein expression without cell viability constraints. | E. coli S30 Extract [72]. Pre-packaged systems are available from various commercial suppliers. |
| Expression Vectors | Carries the gene of interest and reporter gene, with regulatory elements for controlled expression. | Plasmids with inducible promoters (e.g., T7, araBAD), and appropriate antibiotic resistance. |
| Microplate Reader | Enables high-throughput, sensitive quantification of fluorescent or luminescent signals. | Fluorescence-capable reader (e.g., TECAN Spark [73], PHERAstar FSX [71]). |
| Inducing Agents | Triggers the transcription of the target and/or reporter genes in a controlled manner. | IPTG (for lac/T7 systems), Arabinose (for araBAD promoter) [73]. |
| Energy Regeneration System | Fuels the transcription and translation processes in cell-free systems. | Creatine Phosphate & Creatine Kinase; or Phosphoenolpyruvate (PEP) [72]. |
In prokaryotes, the Shine-Dalgarno (SD) sequence represents a fundamental genetic motif that facilitates translation initiation by enabling ribosomal binding to messenger RNA (mRNA). Discovered in 1974 by John Shine and Lynn Dalgarno, this purine-rich sequence is typically located approximately 8 nucleotides upstream of the start codon (AUG) on mRNA and functions through base-pairing interactions with the complementary anti-Shine-Dalgarno (aSD) sequence at the 3' end of 16S ribosomal RNA (rRNA) [1] [2]. This molecular recognition system properly positions the ribosome on the mRNA template, ensuring accurate start codon selection and efficient initiation of protein synthesis. The canonical SD sequence in Escherichia coli is AGGAGGU, while a shorter GAGG motif dominates in certain bacteriophages, with the six-base consensus sequence being AGGAGG across many bacterial species [1].
The SD sequence serves as a critical component in the regulation of gene expression, as the stability of the SD:aSD hybridization complex correlates with translation initiation rates and subsequent protein synthesis levels [18] [2]. While traditionally considered the primary mechanism for translation initiation in bacteria, contemporary research has revealed remarkable diversity in SD sequence utilization across different bacterial species, with some genomes exhibiting predominantly SD-led genes while others utilize alternative initiation mechanisms [12] [55]. This variation provides a rich landscape for comparative genomic analyses aimed at understanding evolutionary adaptations, ecological specialization, and the fundamental principles governing gene expression regulation in prokaryotes.
Methodological Approaches for SD Sequence Identification
Computational Detection Methods
Sequence-Based Motif Scanning
Traditional approaches for identifying SD sequences rely on scanning upstream regions of start codons for predefined nucleotide motifs with similarity to the canonical SD sequence. This method typically involves searching for sub-strings of at least three nucleotides complementary to the anti-SD sequence of 16S rRNA [18]. While straightforward to implement, motif-based approaches face significant limitations, including the absence of a universal similarity threshold that reliably distinguishes functional SD sequences from spurious matches and an inability to accurately pinpoint the exact location of the SD sequence relative to the start codon [18]. To address nucleotide composition biases across genomes with varying GC content, researchers often compare observed SD frequency against null expectations generated from randomly permuted sequences using the metric:
Δf~SD~ = f~SD,obs~ − f̄~SD,rand~
where f~SD,obs~ represents the observed fraction of SD-led genes and f̄~SD,rand~ denotes the expected fraction from randomized controls [12].
Free Energy Calculation Methods
Thermodynamic approaches based on free energy calculations overcome many limitations of sequence similarity methods by quantifying the binding stability between potential SD sequences and the 16S rRNA aSD sequence. The Individual Nearest Neighbor Hydrogen Bond (INN-HB) model provides a robust framework for calculating the Gibbs free energy change (ΔG°) of RNA-RNA hybridization, with more negative values indicating stronger binding interactions [18] [55]. Implementation typically involves:
- Sequence Preparation: Extract 5' untranslated regions (UTRs) from -20 to -1 relative to start codons of annotated genes.
- aSD Definition: Obtain the 3' tail sequence of 16S rRNA (typically 13 nucleotides) for the target species.
- Sliding Window Analysis: Compute ΔG° values for all possible alignments between the aSD sequence and mRNA regions using programs like
free_scan[55]. - Threshold Application: Classify genes with minimum ΔG° below specific thresholds (e.g., -4.5 kcal/mol) as SD-led [12] [5].
Table 1: Standard Free Energy Thresholds for SD Sequence Classification
| Classification | ΔG° Threshold (kcal/mol) | Interpretation |
|---|---|---|
| Strong SD | < -8.4 | Very stable binding, high initiation efficiency |
| Moderate SD | -8.4 to -4.5 | Moderate binding stability |
| Weak SD | -4.5 to -0.892 | Weak but significant binding |
| Non-SD | > -0.892 | No functional SD sequence |
The relative spacing (RS) metric provides an alternative approach that normalizes positional indexing relative to the start codon, enabling comparative analyses across genes and species with varying aSD lengths [18].
Information-Theoretic Approaches
Information content analysis offers a complementary method for detecting SD sequences without predefining specific motifs. This approach quantifies position-specific sequence conservation by calculating the reduction in entropy relative to background nucleotide frequencies:
I~obs~ = Σ (log~2~4 + Σ p~i,k~ log~2~p~i,k~)
where p~i,k~ represents the empirical frequency of base k at position i [12]. The deviation from randomized expectations (ΔI = I~obs~ - Ī~rand~) identifies regions with statistically significant sequence conservation indicative of functional SD sequences.
Experimental Validation Techniques
While computational predictions provide valuable insights, experimental validation remains essential for confirming functional SD sequences. Ribosome binding assays, including toeprinting and ribosome profiling, directly measure ribosomal positioning on mRNA templates. Additionally, mutational analyses assessing the impact of SD sequence modifications on translation efficiency and compensatory mutations in the 16S rRNA aSD sequence provide functional evidence for SD-mediated initiation [1] [2]. For high-throughput validation, reporter gene systems with systematically varied RBS sequences coupled with fluorescence-activated cell sorting (FACS) and deep sequencing enable quantitative assessment of thousands of potential SD sequences in parallel [12].
Figure 1: Computational workflow for identifying and validating Shine-Dalgarno sequences from genomic data, integrating multiple bioinformatic approaches with experimental verification.
Quantitative Analysis of SD Sequence Diversity Across Bacterial Species
Cross-Species Variation in SD Utilization
Comparative genomic analyses reveal striking differences in SD sequence utilization across bacterial taxa. The proportion of SD-led genes within a genome varies substantially, ranging from less than 10% to over 90% among different prokaryotic species [12] [55]. This diversity reflects evolutionary adaptations to specific ecological niches and life history strategies. For instance, approximately 90% of Bacillus subtilis genes contain SD sequences, while only about 50% of Caulobacter crescentus genes are SD-led [12]. These patterns demonstrate that SD-mediated translation initiation represents a continuum rather than a universal requirement across bacterial lineages.
Table 2: SD Sequence Utilization Across Representative Bacterial Species
| Species | % SD-Led Genes | Preferred SD Motif | Genomic GC% | Growth Rate |
|---|---|---|---|---|
| Escherichia coli | 65-75% | AGGAGG | ~50% | Fast |
| Bacillus subtilis | ~90% | AGGAGG | ~43% | Fast |
| Caulobacter crescentus | ~50% | AGGAGU | ~67% | Slow |
| Mycobacterium smegmatis | ~25% | GGAGG | ~67% | Slow |
| Halobacterium salinarum | <20% | Multiple variants | ~68% | Slow |
Correlates of SD Sequence Utilization
Phylogenetically informed comparative analyses have identified several factors associated with interspecific variation in SD sequence usage:
Growth Rate: Species capable of rapid growth typically contain higher proportions of SD-led genes throughout their genomes, suggesting optimization for efficient translation initiation during rapid proliferation [12].
Environmental Temperature: Thermophilic species contain significantly more SD-led genes than mesophiles, potentially reflecting adaptations to maintain translation efficiency under high-temperature conditions [12].
Genomic GC Content: The nucleotide composition of SD sequences often reflects overall genomic GC content, with AT-rich genomes exhibiting A/T-rich SD variants [55].
Ribosomal Protein S1 Presence: Species utilizing SD-independent initiation mechanisms frequently possess elongated forms of ribosomal protein S1, which facilitates unstructured mRNA binding [55] [8].
Statistical analyses controlling for phylogenetic non-independence have demonstrated that SD sequence utilization covaries with genomic features important for efficient translation initiation and elongation, including codon usage bias, tRNA gene copy number, and rRNA operon abundance [12].
Positional and Structural Characteristics
The precise positioning of SD sequences relative to start codons significantly influences translation efficiency. Although the canonical spacing is 5-10 nucleotides upstream of the initiation codon, functional SD sequences exhibit positional flexibility [18] [1]. Free energy profiling across translation initiation regions (TIRs) typically reveals a characteristic trough of negative ΔG° values upstream of start codons, with unexpected secondary troughs occasionally observed immediately after the first base of the initiation codon (designated RS+1 genes) [18]. Nucleotide frequency analyses further reveal symmetrical biases around start codons in non-SD genes, potentially minimizing secondary structure formation and facilitating alternative initiation mechanisms [55].
Advanced Research Protocols
Genome-Wide SD Sequence Analysis
Objective: Identify and characterize SD sequences across complete prokaryotic genomes.
Materials:
- Annotated genome sequences in GenBank or RefSeq format
- 16S rRNA gene sequences for target species
- Computational resources (Linux workstation or cluster)
- Software: free_scan for ΔG° calculations, R or Python for statistical analysis
Procedure:
Data Preparation
- Extract 5' UTR sequences (-40 to -1 relative to annotated start codons)
- Obtain 16S rRNA 3' terminal sequences (13 nucleotides) from databases such as RiboGrove [51]
- Generate randomized control sequences preserving nucleotide composition
Free Energy Calculation
Sequence Motif Analysis
- Scan 5' UTRs for canonical SD motifs (GGAGG, AGGAG, etc.) allowing up to 1 mismatch
- Compute observed versus expected motif frequencies (Δf~SD~) [12]
- Generate position weight matrices for species-specific SD motifs
Information Content Calculation
- Align 5' UTR sequences by start codon
- Compute position-specific nucleotide frequencies
- Calculate information content at each position using entropy-based metrics [12]
Statistical Analysis
- Correlate SD strength with genomic features (GC content, growth rate, habitat)
- Perform phylogenetic comparative analyses to account for evolutionary relationships
- Identify significantly overrepresented and underrepresented motifs
Expected Outcomes: Classification of genes into SD-led, non-SD, and leaderless categories; quantification of SD strength distribution; identification of species-specific SD motifs; correlation of SD usage with genomic traits.
Evolutionary Conservation Analysis
Objective: Determine evolutionary constraints on SD sequences within coding regions.
Materials:
- Homologous gene families from closely related species (e.g., Enterobacteriales)
- Multiple sequence alignments of coding sequences
- Substitution rate estimation software (e.g., LEISR)
- Custom scripts for synonymous site analysis
Procedure:
Identify SD-like Sequences
- Scan protein-coding regions for motifs complementary to 16S rRNA aSD
- Apply binding energy threshold (-4.5 kcal/mol) to define functional SD-like sequences
- Exclude 5' and 3' gene termini to avoid authentic SD sequences [5]
Calculate Substitution Rates
- Estimate nucleotide substitution rates at four-fold degenerate sites within SD-like sequences
- Select paired control sites from the same genes matching codon context and flanking nucleotides
- Compute ratio of substitution rates (SD-like sites vs. controls)
Assess Conservation
- Compare conservation strength between strong and weak SD-like sequences
- Analyze depletion of start codons downstream of internal SD-like sequences
- Test for association between SD-like sequences and protein domain boundaries
Expected Outcomes: Quantification of selective constraints on internal SD-like sequences; evidence for deleterious effects of strong internal SD motifs; understanding of evolutionary mechanisms minimizing spurious translation initiation.
Research Reagent Solutions
Table 3: Essential Research Reagents for SD Sequence Analysis
| Reagent / Resource | Specifications | Research Application | Key Features |
|---|---|---|---|
| free_scan Software | INN-HB model implementation | ΔG° calculation for SD:aSD hybridization | Individual Nearest Neighbor thermodynamics; sliding window analysis [18] |
| RiboGrove Database | Curated 16S rRNA sequences from complete genomes | Source of authentic aSD sequences | Full-length genes only; no partial sequences; RefSeq-derived [51] |
| Plasmid pTrS3 | Expression vector with tryptophan promoter | Foreign gene expression in E. coli | Defined SD spacing (13 bp upstream of ATG); SphI cloning site [75] |
| GTPS Database | Gene Trek in Prokaryote Space (DDBJ) | Genomic sequences and annotations | Protein-coding genes with alternative initiation codons; 16S rRNA data [55] |
| Ribosome Profiling Kit | Commercial library preparation reagents | Experimental validation of translation initiation | Genome-wide ribosomal positions; translation efficiency quantification |
Interpretation Guidelines and Technical Considerations
Analytical Caveats and Limitations
When interpreting results from SD sequence analyses, researchers should consider several methodological limitations:
Annotation Quality: Genome annotation errors significantly impact SD identification, particularly for genes with unusual start codon contexts. Strong SD-like sequences immediately surrounding annotated start codons may indicate misannotation, with studies suggesting approximately 15% of such cases represent genuine annotation errors [18].
Threshold Dependence: SD classification depends heavily on chosen energy thresholds, with different values substantially altering the proportion of genes designated as SD-led. Researchers should perform sensitivity analyses across threshold ranges rather than relying on single values [55] [5].
Phylogenetic Non-Independence: Cross-species comparisons violate statistical independence assumptions due to shared evolutionary history. Phylogenetically informed methods (e.g., phylogenetic generalized least squares) must be employed to avoid spurious correlations [12].
Alternative Initiation Mechanisms: Not all translation initiation depends on SD sequences. Leaderless mRNAs (lacking 5' UTRs) and structured mRNAs utilizing ribosomal protein S1 represent important alternative pathways that may be misclassified in standard analyses [55] [8].
Biological Significance Assessment
Determining the functional significance of identified SD sequences requires integrating multiple lines of evidence:
Conservation Patterns: Functional SD sequences typically exhibit evolutionary conservation beyond background genomic rates, while internal SD-like sequences within coding regions generally show reduced conservation indicative of selective avoidance [5] [76].
Strength-Expression Correlation: In SD-dependent species, stronger SD sequences (more negative ΔG° values) typically correlate with higher protein expression levels, particularly for highly expressed genes [12] [2].
Positional Constraints: Functional SD sequences display preferred spacing (typically 5-10 nucleotides) upstream of start codons, with deviations from this spacing associated with reduced translation efficiency [18] [1].
Structural Accessibility: Functional SD sequences typically reside in unstructured mRNA regions, with computational folding algorithms (e.g., RNAfold) providing accessibility assessments [8].
Comparative genomic analysis of Shine-Dalgarno sequences reveals remarkable diversity in translation initiation mechanisms across bacterial species. The integration of computational predictions using free energy calculations, motif scanning, and information content analysis with experimental validation provides a robust framework for identifying functional SD sequences and characterizing their evolutionary dynamics. The substantial variation in SD utilization between species—correlating with growth rate, environmental conditions, and genomic features—highlights the adaptive evolution of translation initiation mechanisms to optimize gene expression in diverse ecological contexts.
Future research directions include developing improved algorithms that incorporate mRNA secondary structure predictions, expanding analyses to underrepresented bacterial phyla, and integrating SD usage patterns with transcriptomic and proteomic data to establish quantitative relationships between sequence features and translation efficiency. Additionally, the engineering of synthetic SD sequences with precisely tuned binding strengths holds promise for biotechnology applications requiring optimized heterologous gene expression. As comparative genomics continues to illuminate the principles governing SD sequence diversity, our understanding of prokaryotic translation initiation will undoubtedly deepen, revealing new insights into the evolution of gene regulatory mechanisms.
Correlating SD Sequence Features with Protein Expression Levels
The Shine-Dalgarno (SD) sequence, a key regulatory element in prokaryotic translation initiation, exhibits significant correlations with protein expression levels through its complementary binding with the anti-Shine-Dalgarno (aSD) sequence at the 3' end of 16S ribosomal RNA. This technical analysis synthesizes current research quantifying how SD sequence features—including binding strength, accessibility, and positioning—influence translational efficiency and cellular protein abundance. We present a comprehensive framework for identifying SD sequences and interpreting their functional significance within genomic contexts, with particular emphasis on quantitative relationships established through comparative genomics, ribosome profiling, and single-molecule analyses. The findings demonstrate that while SD sequence characteristics substantially impact translation initiation efficiency, their relative contribution must be understood within the broader context of codon bias and mRNA structural considerations.
The Shine-Dalgarno sequence is a ribosomal binding site element found in bacterial and archaeal messenger RNA, generally located approximately 8 bases upstream of the start codon AUG [1]. This purine-rich sequence, typically exhibiting a consensus pattern of AGGAGG, functions primarily through complementary base pairing with the 3' end of the 16S ribosomal RNA (rRNA) component, facilitating proper ribosome positioning for translation initiation [1]. Since its initial characterization by John Shine and Lynn Dalgarno, research has extensively documented that variations in SD sequence properties—including nucleotide composition, binding free energy, and spatial relationship to the start codon—correlate significantly with differential protein expression outcomes across prokaryotic organisms.
The mechanistic role of SD-aSD interaction extends beyond simple ribosome recruitment to include precise start codon selection, distinguishing initiation sites from internal AUG sequences [1]. This review systematically examines the quantitative relationships between definable SD sequence features and protein expression levels, providing both computational and experimental frameworks for researchers investigating bacterial gene regulation, optimizing heterologous protein expression, or developing antibacterial therapeutics that target translational mechanisms.
Quantitative Relationships Between SD Features and Expression
SD Presence and Strength Correlations
Comparative genomic analyses across 30 complete prokaryotic genomes have established that the presence of a strong SD sequence positively correlates with predicted expression levels based on codon usage biases [77]. Specifically, genes predicted to be highly expressed demonstrate a significantly higher likelihood of possessing strong SD sequences compared to average genes, indicating evolutionary optimization of translation initiation elements for abundant proteins [77]. This relationship persists when examining start codon preferences, with AUG start codons more frequently associated with SD sequences than alternative initiation codons (GUG or UUG) [77].
Table 1: Correlation Between SD Sequence Features and Expression Levels
| SD Feature | Correlation with Expression | Genomic Evidence | Statistical Significance |
|---|---|---|---|
| Presence of SD sequence | Positive correlation with highly expressed genes | 30 prokaryotic genomes [77] | Significant (p < 0.05) |
| Binding free energy | Stronger binding associated with higher expression | E. coli and H. influenzae analysis [78] | Moderate correlation |
| AUG start codon | Higher SD presence with AUG vs. GUG/UUG | Multiple bacterial genomes [77] | Significant (p < 0.05) |
| Operon position | Genes in close proximity show higher SD presence | Comparative genomics [77] | Significant in most genomes |
The binding free energy between SD sequences and the aSD sequence of 16S rRNA serves as a quantitative predictor of translation initiation efficiency. Calculations using the Individual Nearest Neighbor Hydrogen Bond (INN-HB) model enable precise determination of hybridization stability, with more negative free energy values (indicating stronger binding) correlating with enhanced translational output [18]. Genome-wide studies in E. coli demonstrate that sequences with free energy releases below -8.4 kcal/mol typically associate with highly expressed genes, though this relationship exhibits context dependence [18].
Relative Contribution Among Translation Features
While SD sequence characteristics significantly influence protein expression, their relative importance must be contextualized among other sequence determinants. Quantitative analysis comparing the contribution of SD sequence binding, codon bias, and stop codon identity revealed that biased codon usage demonstrates the strongest association with protein expression levels in both E. coli and Haemophilus influenzae [78]. The base-pairing potential between mRNA SD sequence and rRNA appears to have a secondary effect, though remains a statistically significant contributor [78].
Table 2: Hierarchy of Sequence Features Affecting Protein Expression
| Sequence Feature | Relative Influence on Expression | Conservation Between Orthologs | Experimental Validation |
|---|---|---|---|
| Codon bias | Primary determinant | Highly conserved [78] | 2D-gel protein analysis [78] |
| Stop codon identity | Secondary influence | Moderately conserved [78] | Translation efficiency assays |
| SD-aSD binding strength | Tertiary influence | Variable conservation [78] | Ribosome profiling [3] |
This hierarchy persists in both intragenomic analyses (comparing highly and non-highly expressed proteins within a genome) and intergenomic analyses (examining feature conservation between orthologs), suggesting fundamental organizational principles of prokaryotic gene regulation [78]. The dependence on SD-mediated initiation varies substantially across genes, with some exhibiting strong SD-dependence while others utilize alternative initiation mechanisms.
Experimental Methodologies for SD Analysis
Computational Identification Using Free Energy Calculations
The Relative Spacing (RS) metric provides a normalized approach for identifying SD sequences by simulating binding interactions between mRNAs and the single-stranded 3' tail of 16S rRNA across the entire translation initiation region [18].
Protocol: RS Metric Implementation
- Sequence Extraction: Isolate nucleotide sequences spanning from -50 to +20 relative to annotated start codons.
- Energy Calculation: Implement INN-HB model to compute hybridization free energy between the 16S rRNA 3' tail (typically 12 nucleotides) and all possible binding sites within the translation initiation region.
- Position Normalization: Calculate Relative Spacing (RS) values to normalize nucleotide indexing relative to the start codon, enabling cross-gene comparisons.
- Minimum Identification: Identify positions with minimal free energy values, corresponding to most stable hybridization sites.
- Annotation Validation: Flag genes where strongest binding occurs at RS+1 (within start codon) for potential annotation errors, as these frequently represent mis-annotated start codons [18].
This methodology successfully identified 2,420 genes out of 58,550 across 18 prokaryotic genomes where the strongest binding occurred at the start codon position, with subsequent confirmation that 384 of these genes indeed contained start codon mis-annotations [18].
Single-Molecule Analysis of SD Accessibility
Single Molecule Kinetic Analysis of RNA Transient Structure (SiM-KARTS) enables direct investigation of SD sequence accessibility under different regulatory conditions [6]. This approach is particularly valuable for studying riboswitch-regulated mRNAs where ligand binding modulates SD availability.
Protocol: SiM-KARTS Implementation
- mRNA Preparation: Generate full-length mRNA molecules containing native 5' UTR and SD sequences.
- Surface Immobilization: Immobilize biotinylated mRNA molecules on streptavidin-coated quartz slides via complementary capture strands.
- Probe Design: Utilize fluorescently-labeled (Cy5) RNA probes complementary to the SD sequence (mimicking the 16S rRNA aSD sequence).
- Image Acquisition: Employ total internal reflection fluorescence microscopy (TIRFM) to monitor transient binding events between anti-SD probes and target mRNAs.
- Kinetic Analysis: Apply Hidden Markov Models to extract dwell times in bound and unbound states from fluorescence trajectories.
- Ligand Response: Quantify changes in SD accessibility by comparing binding kinetics in presence and absence of regulatory ligands [6].
Application of SiM-KARTS to the preQ1 riboswitch from T. tengcongensis revealed that ligand addition decreases the lifetime of the SD sequence's high-accessibility state and prolongs intervals between accessibility bursts, directly demonstrating how ligand-induced structural changes modulate translation initiation [6].
Figure 1: SiM-KARTS Workflow for Single-Molecule Analysis of SD Accessibility
Ribosome Profiling for Genome-Wide Assessment
Ribosome profiling provides a comprehensive approach for assessing SD-dependent translation efficiency across entire genomes [3]. This method is particularly valuable in organellar contexts like plastids, where SD functionality has been debated.
Protocol: Ribosome Profiling Implementation
- Ribosome Protection: Treat cells with cycloheximide to immobilize translating ribosomes.
- Nuclease Digestion: Digest unprotected mRNA regions with RNase I.
- Ribosome Isolation: Purify ribosome-protected mRNA fragments by size selection.
- Library Construction: Prepare sequencing libraries from protected fragments.
- Sequence Alignment: Map sequences to reference genomes to determine ribosome densities.
- SD Dependency Assessment: Compare ribosome densities for genes with varying SD strengths, particularly in systems with engineered aSD mutations [3].
Application of this methodology in tobacco plastids with mutated aSD sequences demonstrated a pronounced correlation between weakened SD-aSD interactions and reduced translation efficiency, definitively establishing SD functionality in chloroplast translation while simultaneously identifying genes with SD-independent initiation mechanisms [3].
Research Reagent Solutions
Table 3: Essential Research Reagents for SD Sequence Analysis
| Reagent/Category | Function/Application | Example Use Cases |
|---|---|---|
| INN-HB Model Software | Calculate hybridization free energy | Computational SD identification [18] |
| Anti-SD Fluorescent Probes | Monitor SD accessibility | SiM-KARTS experiments [6] |
| Specialized Ribosomes | Assess SD-aSD complementarity | aSD mutation studies [3] |
| Ribosome Profiling Kit | Genome-wide translation assessment | Plastid translation studies [3] |
| TIRF Microscopy System | Single-molecule imaging | SD accessibility bursts [6] |
| Plasmid-based rRNA Expression | Specialized ribosome generation | Bacterial SD function tests [3] |
Structural and Contextual Determinants
mRNA Accessibility and Secondary Structure
The accessibility of SD sequences, governed by local mRNA secondary structure, represents a critical determinant of translational efficiency. Research demonstrates that sequestration of SD sequences through intramolecular base pairing can effectively abolish translation initiation, even when the primary sequence exhibits perfect complementarity to the 16S rRNA aSD sequence [29]. Statistical analysis of the E. coli genome specifically implicates avoidance of intra-molecular base pairing with the SD sequence as an evolutionary constraint, highlighting the functional importance of maintaining SD accessibility [29].
The contextual dependence of SD functionality is further illustrated by findings that translation efficiency of mRNAs with strong secondary structures around the start codon shows greater dependence on the SD-aSD interaction than weakly structured mRNAs [3]. This relationship supports a model wherein SD-aSD binding energy contributes to unwinding of local secondary structure, facilitating start codon recognition and initiation complex stability.
Positional Effects and Start Codon Interactions
The spatial relationship between SD sequences and start codons significantly influences translational efficiency, with optimal spacing typically falling between 5-10 nucleotides upstream of the initiation codon [1]. Deviation from this optimal range reduces translation initiation efficiency, likely through improper positioning of the ribosome relative to the start codon. Research has identified the RS+1 phenomenon, wherein the strongest SD-like binding occurs within the start codon itself, which frequently indicates genome annotation errors rather than biological reality [18].
Analysis of RS+1 genes revealed an unusual bias in start codon usage, with the majority utilizing GUG rather than AUG, further supporting the interpretation of these cases as annotation artifacts [18]. This insight enables use of SD sequence analysis as a validation tool for genome annotation pipelines, with particular utility for identifying erroneous start codon assignments in prokaryotic genomes.
Figure 2: Optimal Spatial Configuration of SD Sequence and Start Codon
Applications and Implications
Genome Annotation and Validation
SD sequence analysis provides a powerful approach for validating and refining genome annotations, particularly for start codon assignment. The unexpected positioning of strong SD-like sequences within annotated start codons (RS+1 genes) has enabled identification of numerous annotation errors across multiple prokaryotic genomes [18]. This methodology offers particular value for automated annotation pipelines, serving as an independent validation check based on functional constraints rather than sequence similarity alone.
Implementation of SD-based annotation checking involves identifying genes where the strongest calculated binding between mRNA and 16S rRNA occurs at the start codon position, then manually inspecting these cases for potential mis-annotation. Application of this approach to 18 prokaryotic genomes identified 384 strong RS+1 genes with confirmed start codon mis-annotations, demonstrating the practical utility of SD analysis in genome finishing efforts [18].
Synthetic Biology and Expression Optimization
Understanding correlations between SD sequence features and protein expression enables rational design of expression constructs for metabolic engineering and recombinant protein production. Key design principles include:
- Free Energy Optimization: Engineering SD sequences with calculated binding free energies between -7 and -12 kcal/mol for balanced expression strength and cellular viability [18] [29].
- Accessibility Assurance: Eliminating secondary structure formation around SD sequences through synonymous codon substitutions in the early coding region [29].
- Context Appropriation: Mimicking SD sequence characteristics from highly expressed native genes within the target organism [77] [78].
These principles find application in heterologous expression systems, with bacteriophage-derived SD-containing 5' UTRs successfully enabling high-level transgene expression in both bacterial and plastid systems [3].
Antibacterial Drug Development
The essential nature of translation initiation in bacterial pathogens makes the SD-aSD interaction a potential target for novel antibacterial compounds. Research examining Mycobacterium tuberculosis MazF toxin (MazF-mt11) revealed a unique mechanism wherein this sequence-specific endoribonuclease cleaves 16S rRNA just before the aSD sequence, effectively removing the anti-Shine-Dalgarno sequence and inhibiting protein synthesis [7]. This targeted removal of the aSD sequence leads to nearly complete inhibition of translation, growth arrest, and potentially contributes to establishment of nonreplicating persistent states in tuberculosis infection [7].
Such findings validate the SD-aSD interaction as a vulnerable node in bacterial translation initiation, suggesting that small molecules disrupting this interaction could possess broad antibacterial activity. Development of high-throughput screening assays based on SD-aSD binding interference represents a promising approach for identifying novel antibacterial candidates targeting translation initiation.
This analysis establishes definitive correlations between quantifiable SD sequence features and protein expression levels, providing both computational and experimental frameworks for investigating these relationships. The presence, strength, and accessibility of SD sequences consistently demonstrate significant associations with translational output across prokaryotic organisms, though their relative importance is contextualized within broader translational features, particularly codon bias. The experimental methodologies reviewed—from genome-wide computational predictions to single-molecule kinetic analyses—offer complementary approaches for SD sequence identification and functional characterization. These insights find practical application in genome annotation validation, synthetic biology construct design, and emerging antibacterial strategies targeting the essential SD-aSD interaction in bacterial translation initiation.
Integrating SD Analysis with Broader Genomic and Transcriptomic Data
The Shine-Dalgarno (SD) sequence is a ribosomal binding site in prokaryotic messenger RNA, typically located 5-10 nucleotides upstream of the start codon [55] [18]. This sequence, with a consensus of 5'-GGAGG-3', facilitates translation initiation through base-pairing with the 3'-end of the 16S ribosomal RNA (anti-SD sequence) [18]. Accurate identification and analysis of SD sequences is fundamental to prokaryotic genomics, enabling researchers to predict translation initiation sites, quantify translation efficiency, and correct genome annotation errors [18]. The integration of SD sequence analysis with transcriptomic and proteomic data provides a powerful framework for understanding gene expression regulation in bacterial systems, with significant implications for basic research and drug development targeting bacterial pathogens.
Methodologies for SD Sequence Identification
Computational Prediction Using Free Energy Calculations
The Individual Nearest Neighbor Hydrogen Bond (INN-HB) model provides a thermodynamic approach for identifying SD sequences by calculating the Gibbs free energy (ΔG) of hybridization between the 3' tail of 16S rRNA and candidate mRNA sequences [55] [18].
Protocol:
- Obtain 16S rRNA Sequence: Extract the 13-nucleotide sequence from the 3' end of the 16S rRNA for the target organism [55].
- Define Search Region: For each gene, examine the region from -20 to +20 relative to the initiation codon (Translation Initiation Region) [55] [18].
- Calculate Minimum ΔG: Use sliding window analysis (e.g., with
free_scanor ViennaRNA Package) to compute hybridization energy without gaps [55] [15]. - Apply Threshold: Genes with ΔG greater than -0.8924 kcal/mol (mean energy of three-base SD-anti-SD interactions) are classified as non-SD genes [55].
Table 1: Free Energy Thresholds for SD Sequence Classification
| Classification | ΔG Threshold (kcal/mol) | Interpretation |
|---|---|---|
| Strong SD Sequence | < -8.4 | High-confidence SD-mediated translation |
| Typical SD Sequence | -8.4 to -0.8924 | SD-dependent translation likely |
| Non-SD Sequence | > -0.8924 | SD-independent translation mechanism |
Relative Spacing Metric for Enhanced Accuracy
The Relative Spacing (RS) metric normalizes indexing and enables comparison across species by localizing binding across the entire Translation Initiation Region (TIR) [18].
Formula: RS positions are calculated relative to the start codon, allowing identification of SD-like sequences that include the start codon region (RS+1 genes) [18]. This approach has exposed numerous genome annotation errors, particularly for genes using non-AUG start codons [18].
Figure 1: Workflow for Relative Spacing Analysis
Sequence-Based Identification and Motif Discovery
Beyond energy calculations, sequence similarity approaches identify SD sequences by searching for substrings complementary to the anti-SD sequence [18].
Protocol:
- Pattern Search: Scan 5'-UTR regions for subsequences matching 5'-GGAGG-3' or variants with at least 3 complementary nucleotides [18].
- Positional Analysis: Verify the SD sequence is positioned 5-10 nucleotides upstream of the start codon [55].
- Motif Discovery: Use tools like MEME to identify conserved motifs upstream of initiation codons [13].
Integration with Genomic and Transcriptomic Data
Correcting Genome Annotation Errors
SD sequence analysis has proven particularly valuable for identifying and correcting annotation errors in prokaryotic genomes [18]. Strong binding at RS+1 positions frequently indicates mis-annotated start codons, with approximately 61.5% of strong RS+1 genes (384 of 624) representing annotation errors across 18 prokaryotic genomes [18].
Table 2: SD Analysis for Genome Annotation Validation
| Organism Group | Genes Analyzed | RS+1 Genes Identified | Strong RS+1 Genes | Confirmed Mis-annotations |
|---|---|---|---|---|
| 18 Prokaryotes | 58,550 | 2,420 | 624 | 384 |
| D. radiodurans | ~3,000 | ~1,000 (-10 motif) | N/A | Significant reannotation needed [13] |
Relationship to Gene Expression and Translation Efficiency
SD sequence characteristics correlate with protein abundance measurements, enabling predictions of translation efficiency [15].
Analytical Framework:
- Quantify SD Strength: Calculate hybridization energy for all genes.
- Measure Expression: Obtain protein abundance data (e.g., from Pax-Db database) [15].
- Correlation Analysis: Establish relationship between SD strength and expression levels.
- Codon Adaptation: Account for codon usage biases that also affect translation elongation rates [15].
Genes with optimized SD sequences show approximately 2-3 fold higher expression compared to those with suboptimal SD motifs [15]. Highly expressed genes, particularly ribosomal proteins, show significant depletion of internal SD sequences within coding regions to prevent translational pausing [15].
Identification of Non-SD Translation Mechanisms
Approximately 9-97% of genes across prokaryotic species lack canonical SD sequences, utilizing alternative translation initiation mechanisms [55].
Leaderless mRNA Initiation:
- mRNAs lacking 5'-UTR initiate translation directly by 70S ribosome binding [55] [13]
- Prevalent in Archaea and specific bacterial phyla like Deinococcus-Thermus [55] [13]
- Characterized by -10 promoter region immediately upstream of ORF (TANNNT motif) [13]
RPS1-Mediated Initiation:
- Bacterial-specific mechanism using Ribosomal Protein S1 [55]
- Unfolds structured 5'-UTR regions without SD sequences [55]
- Important for genes with highly structured leaders [55]
Figure 2: Translation Initiation Mechanisms in Prokaryotes
Experimental Validation Protocols
In Vitro Verification of SD-Mediated Translation
Protocol: Reporter Gene Assay
- Construct Design: Clone candidate 5'-UTR regions with varying SD strengths upstream of a reporter gene (e.g., GFP, luciferase).
- Mutagenesis: Introduce point mutations in SD sequence and measure impact on expression.
- Expression Measurement: Quantify reporter protein levels and mRNA concentrations.
- Translation Efficiency Calculation: Normalize protein output to mRNA abundance.
Experimental validation has confirmed that SD sequence strength correlates with translation initiation rates, with ΔG values below -8.4 kcal/mol associated with high efficiency initiation [18].
Ribosome Profiling for Genome-Wide Translation Analysis
Ribosome profiling (ribo-seq) provides nucleotide-resolution mapping of translating ribosomes, enabling direct observation of SD-mediated pausing [15].
Protocol:
- Ribosome Protection: Treat cells with cycloheximide to stall translating ribosomes.
- Nuclease Digestion: Digest unprotected mRNA regions with RNase I.
- Library Construction: Isolate and sequence ribosome-protected fragments (∼28-30 nt).
- Data Analysis: Map fragment boundaries to identify ribosome positions.
- Pause Site Identification: Correlate ribosome density with SD sequence positions.
While some studies question whether SD-associated pauses represent artifacts, multiple independent datasets have confirmed SD-mediated pausing within coding sequences [15].
Research Reagent Solutions
Table 3: Essential Research Reagents for SD Sequence Analysis
| Reagent/Tool | Function | Application Note |
|---|---|---|
| ViennaRNA Package 2.0 | Calculate hybridization free energy | Uses RNA cofold method with default parameters; employs canonical aSD sequence 5'-CCUCCU-3' [15] |
| free_scan Program | Compute minimum ΔG for SD-anti-SD interaction | Implements Individual Nearest Neighbor Hydrogen Bond model; sliding window analysis without gaps [55] |
| MEME Suite | Identify conserved upstream motifs | Discovers -10 region-like motifs (TANNNT) in leaderless mRNAs [13] |
| Ribosome Profiling Kit | Map translating ribosomes | Identifies SD-mediated pausing sites within coding sequences [15] |
| Pax-Db Database | Protein abundance reference | Integrated protein abundance measurements across bacteria; correlates SD strength with expression [15] |
| GTPS Database | Prokaryotic genome sequences | Source of annotated protein-coding genes for multi-species comparative analysis [55] |
Conclusion
The accurate identification of Shine-Dalgarno sequences requires moving beyond simple pattern matching to embrace the complexity of translation initiation in prokaryotes. By integrating thermodynamic modeling, contextual genomic analysis, and experimental validation, researchers can reliably pinpoint functional SD sequences and correct annotation errors. The observed diversity in SD sequences and the existence of alternative initiation mechanisms highlight the need for organism-specific approaches. These advancements have significant implications for biomedical research, enabling more precise genetic engineering, optimized recombinant protein production for therapeutic agents, and deeper understanding of bacterial gene regulation in pathogenesis. Future directions will likely involve machine learning approaches that incorporate multi-omic data to predict translation initiation efficiency with even greater accuracy.
References
- 1. Shine–Dalgarno sequence [https://en.wikipedia.org/wiki/Shine%E2%80%93Dalgarno_sequence]
- 2. Shine-Dalgarno Sequence - an overview [https://www.sciencedirect.com/topics/biochemistry-genetics-and-molecular-biology/shine-dalgarno-sequence]
- 3. Shine-Dalgarno Sequences Play an Essential Role in the ... [https://pmc.ncbi.nlm.nih.gov/articles/PMC5757275/]
- 4. Shine-Dalgarno sequence - (Microbiology) [https://fiveable.me/key-terms/microbio/shine-dalgarno-sequence]
- 5. Within-Gene Shine–Dalgarno Sequences Are Not Selected for ... [https://pmc.ncbi.nlm.nih.gov/articles/PMC6188533/]
- 6. The Shine-Dalgarno sequence of riboswitch-regulated ... [https://www.nature.com/articles/ncomms9976]
- 7. Targeted removal of the 16S rRNA anti-Shine–Dalgarno ... [https://www.sciencedirect.com/science/article/pii/S0021925825021738]
- 8. The diversity of Shine-Dalgarno sequences sheds light on the ... [https://pmc.ncbi.nlm.nih.gov/articles/PMC8583243/]
- 9. Elucidating the 16S rRNA 3′ boundaries and defining ... [https://www.nature.com/articles/s41598-017-17918-6]
- 10. Translational initiation in E. coli occurs at the correct sites ... [https://elifesciences.org/articles/55002]
- 11. Comparative Analysis of anti-Shine- Dalgarno Function in ... [https://www.frontiersin.org/journals/molecular-biosciences/articles/10.3389/fmolb.2021.787388/full]
- 12. Diversity of Translation Initiation Mechanisms across ... [https://pmc.ncbi.nlm.nih.gov/articles/PMC5850609/]
- 13. The −10 region adjacent to open reading frames is a ... [https://pmc.ncbi.nlm.nih.gov/articles/PMC12340547/]
- 14. The Shine-Dalgarno sequence - the beginnings of ... [https://biology.anu.edu.au/news-events/news/shine-dalgarno-sequence-beginnings-biotechnology]
- 15. Depletion of Shine-Dalgarno Sequences Within Bacterial ... [https://pmc.ncbi.nlm.nih.gov/articles/PMC5100845/]
- 16. The diversity of Shine-Dalgarno sequences sheds light on ... [https://pubmed.ncbi.nlm.nih.gov/33349119/]
- 17. Predicting Shine-Dalgarno Sequence Locations Exposes ... [https://pubmed.ncbi.nlm.nih.gov/16710451/]
- 18. Predicting Shine–Dalgarno Sequence Locations Exposes ... [https://journals.plos.org/ploscompbiol/article?id=10.1371/journal.pcbi.0020057]
- 19. Regulation of Leaderless mRNA Translation in Bacteria [https://pmc.ncbi.nlm.nih.gov/articles/PMC9031893/]
- 20. Four translation initiation pathways employed by the ... [https://www.nature.com/articles/srep37905]
- 21. Quantitative profiling of human translation initiation reveals ... [https://www.sciencedirect.com/science/article/abs/pii/S1097276524009559]
- 22. Uncovering mRNA sequences that control translation ... [https://www.nature.com/articles/s41580-025-00862-z]
- 23. Influence of the spacer between the region - Shine box and... Dalgarno [https://pubmed.ncbi.nlm.nih.gov/32202698/]
- 24. The length of ribosomal binding site spacer controls the... sequence [https://microbialcellfactories.biomedcentral.com/articles/10.1186/s12934-020-01404-2]
- 25. Start Codon - an overview [https://www.sciencedirect.com/topics/agricultural-and-biological-sciences/start-codon]
- 26. Inference and visualization of complex genotype-phenotype ... [https://pmc.ncbi.nlm.nih.gov/articles/PMC11952336/]
- 27. Prokaryotic coding regions have little if any specific depletion ... [https://journals.plos.org/plosone/article?id=10.1371/journal.pone.0202768]
- 28. Within-Gene Shine-Dalgarno Sequences Are Not Selected for ... [https://pubmed.ncbi.nlm.nih.gov/30085185/]
- 29. Accessibility of the Shine-Dalgarno Sequence Dictates N ... [https://www.sciencedirect.com/science/article/pii/S1097276518303587]
- 30. Thermodynamic free energy [https://en.wikipedia.org/wiki/Thermodynamic_free_energy]
- 31. Guidelines for the analysis of free energy calculations - PMC [https://pmc.ncbi.nlm.nih.gov/articles/PMC4420631/]
- 32. Practical guidelines for optimising free energy calculations ... [https://www.sciencedirect.com/science/article/pii/S0009261425005378]
- 33. High-accuracy thermodynamic properties to the melting ... [https://www.nature.com/articles/s41524-022-00956-8]
- 34. Predicting thermodynamic stability of inorganic compounds ... [https://pmc.ncbi.nlm.nih.gov/articles/PMC11696921/]
- 35. Extending the spacing between the Shine-Dalgarno ... [https://pmc.ncbi.nlm.nih.gov/articles/PMC7387212/]
- 36. Precise genome-wide mapping of single nucleosomes and ... [https://genomebiology.biomedcentral.com/articles/10.1186/s13059-018-1398-0]
- 37. Genome-Wide Study of Colocalization between ... [https://pmc.ncbi.nlm.nih.gov/articles/PMC9598420/]
- 38. Understanding Success Criterion 1.4.3: Contrast (Minimum) [https://www.w3.org/WAI/WCAG21/Understanding/contrast-minimum.html]
- 39. Shine-Dalgarno_sequence [https://www.bionity.com/en/encyclopedia/Shine-Dalgarno_sequence.html]
- 40. Re-annotation of 12,495 prokaryotic 16S rRNA 3' ends and ... [https://journals.plos.org/plosone/article?id=10.1371/journal.pone.0202767]
- 41. Predicting Shine–Dalgarno Sequence Locations Exposes Genome Annotation Errors - PMC [https://www.ncbi.nlm.nih.gov/pmc/articles/PMC1463019/]
- 42. Shine-Dalgarno sequence - Knowledge and References | Taylor & Francis [https://taylorandfrancis.com/knowledge/Medicine_and_healthcare/Medical_genetics/Shine-Dalgarno_sequence/]
- 43. The consensus and derivative possible Shine-Dalgarno ... [https://plos.figshare.com/articles/dataset/The_consensus_and_derivative_possible_Shine-Dalgarno_sequences_that_are_the_default_in_ShineFind_/13179785]
- 44. Galaxy and Apollo as a biologist-friendly interface for high ... [https://pmc.ncbi.nlm.nih.gov/articles/PMC7660901/]
- 45. StartLink and StartLink+: Prediction of Gene Starts in ... [https://www.frontiersin.org/journals/bioinformatics/articles/10.3389/fbinf.2021.704157/full]
- 46. Molecular Biology and Sequence Analysis Tools [https://www.geneious.com/features/prime]
- 47. RNA-Seq Data Analysis | RNA sequencing software tools [https://www.illumina.com/informatics/sequencing-data-analysis/rna.html]
- 48. List of RNA-Seq bioinformatics tools [https://en.wikipedia.org/wiki/List_of_RNA-Seq_bioinformatics_tools]
- 49. High-Throughput Genomics | For large-scale studies [https://www.illumina.com/techniques/popular-applications/high-throughput-genomics.html]
- 50. GATK - Broad Institute [https://gatk.broadinstitute.org/hc/en-us]
- 51. RiboGrove: a database of full-length prokaryotic 16S rRNA ... [https://www.sciencedirect.com/science/article/pii/S0923250822000171]
- 52. Global fitness landscapes of the Shine-Dalgarno sequence [https://pmc.ncbi.nlm.nih.gov/articles/PMC7263185/]
- 53. Predicting Shine–Dalgarno Sequence Locations Exposes ... [https://pmc.ncbi.nlm.nih.gov/articles/PMC1463019/]
- 54. Software | IIT-Madras - iGEM 2023 [https://2023.igem.wiki/iit-madras/software]
- 55. Comparative genomic analysis of translation initiation ... [https://pmc.ncbi.nlm.nih.gov/articles/PMC5397173/]
- 56. RNA secondary structure prediction using deep learning ... [https://www.nature.com/articles/s41467-021-21194-4]
- 57. Welcome to the Predict a Secondary Structure Web Server [https://rna.urmc.rochester.edu/RNAstructureWeb/Servers/Predict1/Predict1.html]
- 58. RNAfold web server [http://rna.tbi.univie.ac.at/cgi-bin/RNAWebSuite/RNAfold.cgi]
- 59. A statistical sampling algorithm for RNA secondary ... [https://pmc.ncbi.nlm.nih.gov/articles/PMC297010/]
- 60. High-throughput in vivo mapping of RNA accessible ... [https://www.nature.com/articles/s41467-018-06207-z]
- 61. mRNA accessible site tagging (MAST): a novel high ... [https://pmc.ncbi.nlm.nih.gov/articles/PMC167646/]
- 62. Accessibility of the Shine-Dalgarno Sequence Dictates N ... [https://pmc.ncbi.nlm.nih.gov/articles/PMC6311106/]
- 63. The −10 region adjacent to open reading frames is a ... [https://www.life-science-alliance.org/content/8/11/e202503354]
- 64. Frontiers | Recent trends and advances in chloroplast engineering and... [https://www.frontiersin.org/journals/plant-science/articles/10.3389/fpls.2025.1526578/full]
- 65. A Guide in Synthetic Biology: Designing Genetic Circuits ... [https://www.mdpi.com/2674-0583/3/3/11]
- 66. Design of typical genes for heterologous gene expression [https://www.nature.com/articles/s41598-022-13089-1]
- 67. Synthetic biology: advancing the design of diverse genetic ... [https://pmc.ncbi.nlm.nih.gov/articles/PMC3773533/]
- 68. A computational approach to identify genes for functional ... [https://pmc.ncbi.nlm.nih.gov/articles/PMC60242/]
- 69. Post-transcriptional regulation by distal Shine-Dalgarno ... [https://pmc.ncbi.nlm.nih.gov/articles/PMC4666293/]
- 70. Development of a versatile and stable internal control ... [https://www.sciencedirect.com/science/article/abs/pii/S0166093414003000]
- 71. Gene reporter assays [https://www.bmglabtech.com/en/blog/gene-reporter-assays/]
- 72. Assessing translational efficiency by a reporter protein co- ... [https://www.sciencedirect.com/science/article/abs/pii/S000326971630402X]
- 73. A translational repression reporter assay for the analysis of ... [https://pmc.ncbi.nlm.nih.gov/articles/PMC10038052/]
- 74. Quantitative, titratable and high-throughput reporter assays to ... [https://pmc.ncbi.nlm.nih.gov/articles/PMC10899754/]
- 75. Vector Database - pTrS3 [https://www.addgene.org/vector-database/4435/]
- 76. Within-gene Shine–Dalgarno sequences are not selected for ... [https://amaral.northwestern.edu/publications/within-gene-shinedalgarno-sequences-are-not-selected-function/]
- 77. Correlations between Shine-Dalgarno sequences and gene ... [https://pubmed.ncbi.nlm.nih.gov/12270832/]
- 78. Hierarchy of Sequence-Dependent Features Associated ... [https://pmc.ncbi.nlm.nih.gov/articles/PMC403808/]