A Comprehensive Guide to Outlier Detection in RNA-Seq Analysis: Methods, Tools, and Best Practices
Outlier detection in RNA-Seq data is a critical quality control and discovery step for researchers in genomics and drug development.
A Comprehensive Guide to Outlier Detection in RNA-Seq Analysis: Methods, Tools, and Best Practices
Abstract
Outlier detection in RNA-Seq data is a critical quality control and discovery step for researchers in genomics and drug development. This article provides a complete overview of the field, from foundational concepts explaining why outliers occur and their impact on differential expression analysis, to a detailed examination of modern statistical and computational methods like OUTRIDER, OutSingle, and robust PCA. We offer a practical guide for implementing these algorithms, troubleshooting common issues, and validating results through benchmark comparisons. By synthesizing the latest methodologies, this resource empowers scientists to improve the reliability of their RNA-Seq data interpretation, enhance biomarker discovery, and advance precision medicine applications.
Understanding RNA-Seq Outliers: Why They Matter and Where They Come From
The identification of outliers in RNA-sequencing data represents a critical challenge in transcriptomic analysis, standing at the intersection of technical artifact detection and biological discovery. Traditionally treated as noise to be removed, extreme expression values are now recognized as potential signals of rare biological events, including pathogenic variants in Mendelian disorders or spontaneous transcriptional activation [1] [2]. This paradigm shift necessitates robust methodological frameworks that can distinguish technical artifacts from biologically significant outliers—a distinction vital for researchers and drug development professionals advancing precision medicine approaches for rare diseases and cancer [3] [4].
The fundamental challenge in outlier analysis resides in the confounding effects that can mask true biological signals. Technical variability, batch effects, and library preparation artifacts can create expression patterns that mimic biological outliers, while true pathological expressions may be obscured by these same confounders [1] [5]. This Application Note synthesizes current methodologies and protocols for outlier detection, emphasizing practical implementation within a broader thesis on RNA-seq analysis research.
Quantitative Landscape of RNA-Seq Outliers
Understanding the expected frequency and distribution of outliers provides crucial context for interpreting analytical results. The quantitative characteristics of outlier genes vary significantly across species, tissues, and experimental conditions.
Table 1: Prevalence of Outlier Genes Across Biological Systems
| Biological System | Sample Size | Outlier Threshold | Percentage of Outlier Genes | Key Observations |
|---|---|---|---|---|
| Mouse Populations (Outbred) | 48 individuals (5 organs) | Q3 + 5 × IQR | ~3-10% (350-1350 genes) | Similar patterns across tissues; declining frequency with increasing threshold [2] |
| Human (GTEx) | 51 individuals (3-4 tissues) | Q3 + 5 × IQR | Comparable to mouse models | Conserved patterns across mammals; spontaneous over-expression [2] |
| Drosophila Species | 19-27 individuals | Q3 + 5 × IQR | Comparable patterns | Evolutionary conservation of outlier phenomenon [2] |
| Pediatric Cancer (CARE) | 11,427 tumor profiles | Expression > 2 standard deviations | Varies by cancer type | Identified targetable oncogenes in ultra-rare malignancies [3] |
The selection of outlier thresholds significantly impacts the number and biological interpretation of identified outliers. At k = 3 (corresponding to 4.7 standard deviations above the mean), approximately 3-10% of all genes exhibit extreme outlier expression in at least one individual across multiple datasets [2]. This percentage declines continuously with increasing stringency without a natural cutoff, necessitating careful threshold selection based on research objectives.
Table 2: Impact of Statistical Thresholds on Outlier Detection
| Threshold (k) | Standard Deviation Equivalence | Theoretical P-value | Percentage of Outlier Genes | Recommended Use Case |
|---|---|---|---|---|
| 1.5 | 2.7 σ | 0.0069 | Higher sensitivity | Exploratory analysis, high sensitivity required |
| 3.0 | 4.7 σ | 2.6 × 10⁻⁶ | ~3-10% | Standard analysis with multiple testing correction |
| 5.0 | 7.4 σ | 1.4 × 10⁻¹³ | More conservative | High-confidence calls, clinical applications [2] |
Methodological Frameworks for Outlier Detection
The OutSingle Algorithm for Confounder-Controlled Detection
The OutSingle method addresses a critical limitation in RNA-seq outlier detection: the confounding effects that can obscure true biological signals. This approach utilizes a two-step process that combines log-normal transformation with advanced confounder control [1].
Experimental Protocol: OutSingle Implementation
Step 1: Log-Normal Z-score Calculation
- Input: Raw count matrix (J genes × N samples)
- Transformation: Log-transform count data using the formula:
log(kji + 1)where kji represents the count for gene j in sample i - Normalization: Calculate gene-specific z-scores based on the log-transformed data
- Output: Z-score matrix representing deviation of each gene expression from its expected distribution [1]
Step 2: Confounder Control via Optimal Hard Threshold (OHT)
- Input: Z-score matrix from Step 1
- Decomposition: Perform Singular Value Decomposition (SVD) on the z-score matrix
- Noise Reduction: Apply OHT to identify and retain significant singular values
- Reconstruction: Reconstruct confounder-corrected z-score matrix using thresholded singular values
- Output: De-noised outlier scores for each gene in each sample [1]
Performance Characteristics:
- Execution Time: Near-instantaneous compared to previous methods
- Advantage: Does not require parameter initialization or convergence monitoring
- Benchmarking: Outperforms OUTRIDER on real biological datasets with confounding effects [1]
Transcriptome-Wide Splicing Outlier Analysis
Beyond expression-level outliers, splicing abnormalities represent another critical dimension of transcriptional dysregulation. The FRASER/FRASER2 framework enables detection of aberrant splicing patterns across the transcriptome, particularly valuable for identifying spliceosome pathologies [4] [6].
Experimental Protocol: Splicing Outlier Detection
Sample Preparation and Sequencing
- Starting Material: Whole blood collected in PAXgene RNA tubes
- RNA Quality: RIN > 7-8 for all samples (assessed by Bioanalyzer or TapeStation)
- Library Preparation: Illumina TrueSeq Stranded mRNA or Tecan Universal Plus mRNA-seq with NuQUANT
- Depletion: Remove globin and ribosomal RNAs using AnyDeplete module
- Sequencing: 2×150bp paired-end reads on Illumina NovaSeq or NextSeq 550 platforms
- Quality Threshold: >80% bases with Q30 score [6]
Computational Analysis
- Input: FASTQ files from RNA-seq of whole blood
- Splicing Metric Calculation: Compute intron retention scores using FRASER and FRASER2
- Outlier Detection: Identify samples with excess intron retention outliers in minor intron-containing genes (MIGs)
- Pattern Recognition: Focus on transcriptome-wide signatures suggesting spliceosome dysfunction
- Validation: Sanger sequencing of candidate variants in minor spliceosome snRNAs (RNU4ATAC, RNU6ATAC) [4]
Clinical Utility: This approach successfully identified five individuals with excess intron retention outliers in MIGs from a cohort of 390 rare disease patients, all harboring rare biallelic variants in minor spliceosome components [4].
Comparative Analysis of RNA Expression (CARE) for Oncology
The CARE framework exemplifies the clinical translation of outlier analysis for precision oncology applications, particularly for rare pediatric cancers with limited treatment options [3].
Experimental Protocol: CARE Analysis
Comparator Cohort Construction
- Data Aggregation: Compile 11,427 tumor RNA-seq profiles from public repositories
- Uniform Processing: Implement standardized bioinformatic processing across all samples
- Cohort Definition: Create personalized comparator cohorts based on:
- Same diagnosis matches
- Molecularly similar profiles (Spearman correlation)
- First and second-degree molecular neighbors
- Diseases represented in most similar datasets [3]
Outlier Identification and Clinical Annotation
- Expression Comparison: Compute expression z-scores relative to personalized cohorts
- Thresholding: Identify overexpression outliers exceeding cohort-defined thresholds
- Pathway Analysis: Detect enriched oncogenic pathways among outlier genes
- Target Nomination: Map outlier genes to potentially targetable pathways
- IHC Validation: Confirm protein-level overexpression (e.g., CDK4 staining) [3]
Clinical Implementation: In a case study of myoepithelial carcinoma, CARE analysis identified CCND2 overexpression and FGFR/PDGF pathway activation, leading to successful treatment with ribociclib after pazopanib failure [3].
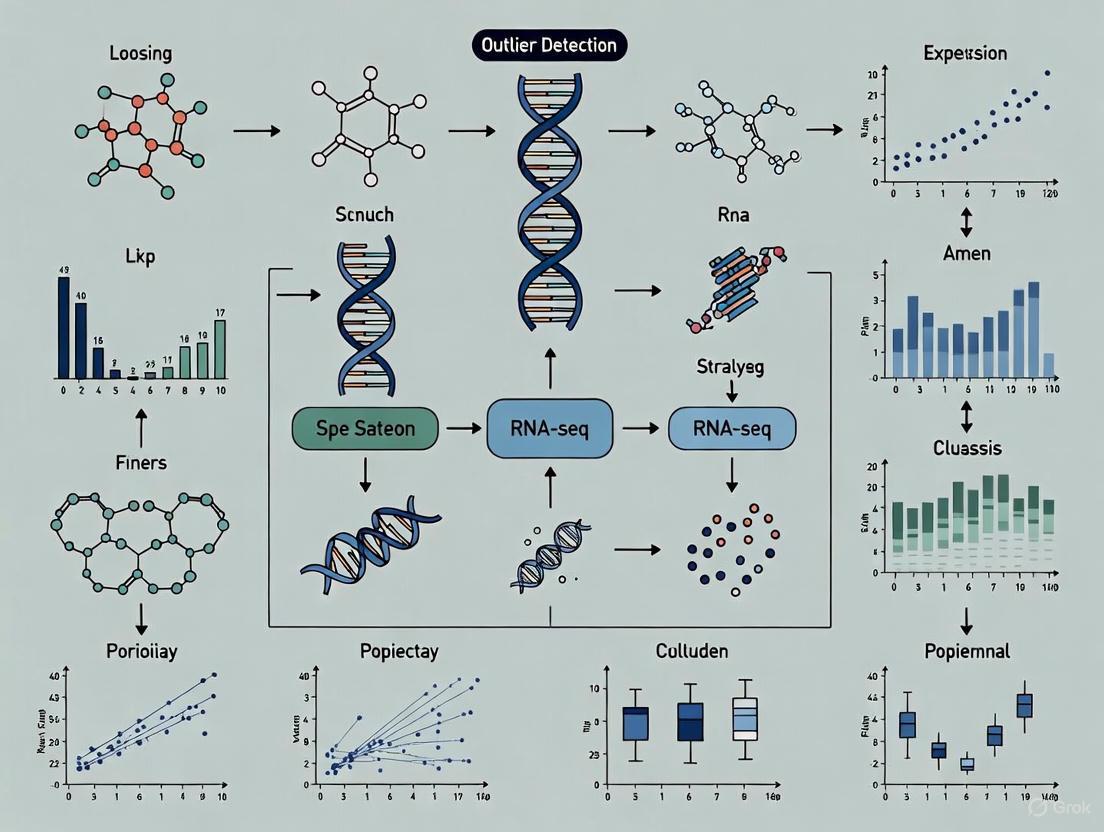
Visualizing Analytical Workflows
The following diagram illustrates the core decision process for interpreting and validating RNA-seq outliers, integrating both technical and biological considerations:
Diagram 1: A framework for distinguishing technical artifacts from biologically significant outliers in RNA-seq data analysis.
The experimental workflow for outlier detection and validation involves multiple coordinated steps from initial sequencing to biological interpretation:
Diagram 2: End-to-end experimental workflow for RNA-seq outlier detection studies.
Essential Research Reagents and Tools
Successful implementation of RNA-seq outlier detection requires specific research reagents and computational tools optimized for various aspects of the analytical pipeline.
Table 3: Research Reagent Solutions for Outlier Detection Studies
| Category | Specific Product/Tool | Function in Outlier Analysis | Key Features |
|---|---|---|---|
| RNA Stabilization | PAXgene Blood RNA Tubes | Preserves RNA integrity in whole blood samples | Maintains RIN >7 for reliable outlier detection [6] |
| rRNA Depletion | Illumina Ribo-Zero Plus rRNA Depletion Kit | Removes ribosomal RNA to enrich mRNA | Improves detection of low-abundance transcripts [6] |
| Library Preparation | Tecan Universal Plus mRNA-seq with NuQUANT | Prepares sequencing libraries with UMI incorporation | Reduces PCR duplicates, improves quantification accuracy [6] |
| Outlier Detection Algorithms | OutSingle [1] | Identifies expression outliers with confounder control | SVD/OHT-based, near-instantaneous execution |
| Splicing Outlier Tools | FRASER/FRASER2 [4] | Detects aberrant splicing patterns | Identifies intron retention outliers in rare diseases |
| Comparative Analysis | CARE Framework [3] | Identifies overexpression outliers in cancer | Uses large comparator cohorts (11,427 tumors) |
The distinction between technical artifacts and biologically significant outliers in RNA-seq data represents a critical challenge with profound implications for research and clinical applications. Methodologies such as OutSingle, FRASER/FRASER2, and the CARE framework provide robust approaches for confounder-controlled detection of meaningful transcriptional outliers. As these protocols demonstrate, rigorous experimental design, appropriate statistical thresholds, and validation through orthogonal methods are essential components for accurate outlier interpretation. The growing evidence for biological significance of extreme expression values—from spontaneous transcriptional activation in model organisms to pathological expression in rare diseases and cancer—supports the continued refinement of these analytical approaches for precision medicine applications.
In RNA sequencing (RNA-seq) analysis, outliers are data points that deviate significantly from the expected expression or splicing pattern of a gene. These outliers can stem from diverse sources, broadly categorized into biological outliers, which reveal genuine and often rare physiological or technical effects, and technical artifacts introduced during the library preparation and sequencing workflow. Historically, samples with numerous outliers were frequently excluded from analyses under the assumption that technical noise was the primary driver [7] [2]. However, emerging research demonstrates that these outliers can harbor critical biological insights, including the identification of rare genetic disorders and novel regulatory mechanisms [7] [2]. This document outlines the major sources of these outliers, providing a framework for their identification and interpretation within transcriptomic studies.
Biological outliers arise from genuine, often sporadic, changes in a cell's transcriptome. Dismissing them as noise can lead to a loss of significant biological discovery.
Genetic Variants Affecting Splicing
Rare genetic variants can cause transcriptome-wide aberrant splicing patterns, a hallmark of "spliceopathies." Pathogenic variants in components of the major or minor spliceosome can lead to hundreds of splicing outliers [7] [6].
- Minor Spliceosome Defects: The minor spliceosome, which removes only ~0.5% of all introns (approximately 800 minor introns), is particularly vulnerable. Bi-allelic pathogenic variants in minor spliceosome small nuclear RNAs (snRNAs) like RNU4ATAC and RNU6ATAC cause a specific and detectable pattern: excess intron retention outliers in minor intron-containing genes (MIGs) [7] [6]. This pattern has been used to diagnose rare diseases such as RNU4atac-opathy [7].
- Major Spliceosome Defects: Variants in genes encoding proteins of the major spliceosome (e.g., SNRNP40, PPIL1) also cause distinct outlier signatures. For instance, PPIL1 variants lead to the retention of short, high-GC-content introns, while SF3B1 variants are associated with the retention of large introns (>1kb) [6].
Spontaneous and Non-Inherited Expression Variation
Some outlier expression appears to be a biological reality of complex regulatory networks, not attributable to common genetic variants.
- Sporadic Over-expression: Analyses across multiple species (mice, humans, Drosophila) show that different individuals can harbor vastly different numbers of over-expression outlier genes. Longitudinal and family studies in mice indicate that most of this extreme over-expression is not inherited but spontaneously generated [2].
- Edge of Chaos Effect: These outlier patterns are consistent across tissues and species, suggesting they may reflect "edge of chaos" effects within gene regulatory networks. These are systems of non-linear interactions and feedback loops that can produce sporadic, co-regulated bursts of transcription in different individuals [2].
Table 1: Characteristics of Biological Outliers
| Source Category | Specific Mechanism | Key Genes/Pathways | Molecular Signature |
|---|---|---|---|
| Spliceopathies | Minor spliceosome dysfunction | RNU4ATAC, RNU6ATAC | Excess intron retention in minor intron-containing genes (MIGs) [7] [6] |
| Spliceopathies | Major spliceosome dysfunction | PPIL1, SF3B1, SNRNP40 | Retention of short, high-GC introns; retention of large introns (>1kb); hundreds of intron retention events [7] [6] |
| Regulatory Networks | Spontaneous co-activation | Prolactin, Growth hormone | Co-regulatory modules show extreme over-expression in single or few individuals, not inherited [2] |
Technical Artifacts and Workflow-Related Outliers
Technical artifacts are introduced during the experimental workflow, from sample preparation to sequencing. Vigilant quality control is required to identify and mitigate these sources.
Library Preparation
This initial stage is a major source of bias and outliers.
- RNA Quality: The RNA Integrity Number (RIN) is critical. Samples with RIN < 7 are often excluded from analysis, as RNA degradation leads to biased representation of transcripts and an increase in technical outliers [6].
- rRNA and Globin Depletion: Inefficient removal of highly abundant ribosomal RNA (rRNA) or, in blood samples, globin mRNAs, can consume a disproportionate share of sequencing reads. This reduces the library complexity and can mask the detection of true, lowly expressed transcripts, creating expression outliers [6].
- cDNA Synthesis and PCR Amplification: Biases during reverse transcription and the use of too many cycles during PCR amplification can lead to duplicated reads and over-representation of certain fragments, skewing expression estimates [8].
Sequencing and Data Preprocessing
Errors during the sequencing run and subsequent data handling can generate artifacts.
- Sequencing Depth: Inadequate sequencing depth (e.g., below 20-30 million reads per sample for standard differential expression) reduces the power to detect true expression differences and increases the variance of low-count genes, making them appear as outliers [8].
- Adapter Contamination and Low-Quality Bases: Leftover adapter sequences and bases with low Phred quality scores, if not properly trimmed, can prevent reads from mapping correctly or lead to misalignment, creating false splicing or expression outliers [8].
- Misalignment and Multi-Mapped Reads: Reads that originate from repetitive regions, paralogous genes, or multiple splice junctions can map to an incorrect location in the reference genome. If not filtered out, these reads artificially inflate the expression of the incorrect gene [8].
Diagram 1: Technical workflow of RNA-seq and potential sources of outliers at each stage.
Experimental Protocols for Outlier Detection and Validation
Transcriptome-Wide Splicing Outlier Analysis
This protocol is designed to identify individuals with rare spliceopathies by looking for global patterns of aberrant splicing [7] [6].
- RNA-Seq and Preprocessing: Perform RNA sequencing on whole blood or other clinically accessible tissues. Align reads to a reference genome using a splice-aware aligner like STAR [8] [6].
- Splicing Quantification and Outlier Callling: Use specialized outlier detection algorithms such as FRASER or FRASER2 to identify aberrant splicing events at the intron level across the entire transcriptome [7] [6].
- Pattern Recognition: Examine the results for an excess of a specific type of splicing outlier. For example, a significant enrichment of intron retention events in minor intron-containing genes (MIGs) is a strong indicator of a minor spliceosome defect [7].
- Genetic Validation: In individuals with a clear outlier signature, perform targeted analysis of genome or exome sequencing data to identify rare variants in spliceosome components (e.g., RNU4ATAC, RNU6ATAC) [7].
Inhibition of Nonsense-Mediated Decay (NMD) to Reveal Splice Defects
NMD can degrade transcripts with premature termination codons, masking the presence of aberrant splicing. This protocol uses cycloheximide (CHX) to inhibit NMD and reveal these hidden events [9].
- Cell Culture and Treatment: Culture peripheral blood mononuclear cells (PBMCs) or lymphoblastoid cell lines (LCLs). Split the culture and treat one aliquot with CHX (e.g., 100 µg/mL for 4-6 hours) to inhibit NMD. Leave an untreated aliquot as a control [9].
- RNA Extraction and Library Prep: Extract total RNA from both treated and untreated cells using a standard method (e.g., Qubit HS RNA kit, Bioanalyzer for RIN). Ensure RIN > 7. Prepare RNA-seq libraries, ideally with protocols that retain strand information and use unique molecular identifiers (UMIs) [9] [6].
- Validation of NMD Inhibition: Use an internal control to confirm NMD inhibition. Monitor the expression of the NMD-sensitive transcript of SRSF2, which should show increased expression in CHX-treated samples compared to untreated controls [9].
- Comparative Analysis: Compare RNA-seq data from CHX-treated and untreated samples. The treated sample will often reveal aberrant splice variants that were degraded and thus absent in the untreated sample, allowing for the confirmation of splicing-altering variants [9].
Table 2: Key Reagents and Tools for Outlier Analysis
| Category | Reagent/Tool | Function in Protocol |
|---|---|---|
| Computational Tools | FRASER / FRASER2 [7] | Identifies splicing outliers from RNA-seq data in a transcriptome-wide manner. |
| Computational Tools | STAR [8] | Splice-aware aligner for accurate mapping of RNA-seq reads. |
| Computational Tools | FastQC / MultiQC [8] | Performs initial quality control on raw and processed sequencing data. |
| Wet-Lab Reagents | Cycloheximide (CHX) [9] | Inhibits nonsense-mediated decay (NMD) to stabilize aberrant transcripts for detection. |
| Wet-Lab Reagents | Paxgene RNA Tubes [6] | Preserves RNA in whole blood samples for transport and storage. |
| Wet-Lab Reagents | Tecan Universal Plus / Illumina Stranded Prep [6] | Library preparation kits for constructing RNA-seq libraries, often with globin/rRNA depletion. |
Diagram 2: A decision workflow for analyzing and validating outliers from RNA-seq data.
The Critical Impact of Outliers on Differential Expression Analysis and Biomarker Discovery
In transcriptomic analysis, differential expression analysis serves as a foundational technique for identifying genes with significant expression changes between conditions. Traditional methods, predominantly based on comparisons of mean expression values (e.g., Student's t-statistic), perform effectively when expression changes homogeneously across sample groups [10]. However, in complex biological contexts such as cancer heterogeneity and rare genetic diseases, informative expression changes often occur only in a subset of samples, manifesting as statistical outliers that can be overlooked by mean-based approaches [10] [11]. The growing recognition of this limitation has spurred the development of specialized outlier-based methods to detect these atypical expression patterns, thereby enhancing biomarker discovery and diagnostic yields in precision medicine [11] [9].
Outlier-Based Methodologies in Transcriptomics
Conceptual Foundation and Key Methods
Outlier analysis in transcriptomics is predicated on the concept that biologically significant expression changes may not affect all samples uniformly. An outlier, defined as "an observation which deviates so much from the other observations as to arouse suspicions that it was generated by a different mechanism," can reveal crucial insights when systematically investigated [12]. In biomedical research, outliers may stem from various root causes, including errors, faults, natural deviations, or—most importantly for discovery—novelty-based mechanisms that represent previously uncharacterized biological phenomena [12].
Several statistical frameworks have been developed specifically for outlier detection in gene expression studies:
- Cancer Outlier Profile Analysis (COPA): Identifies genes with significant overexpression in a subset of samples by calculating robust measures of central tendency and dispersion, then flagging extreme values in the disease group [10].
- Outlier Sum (OS): Computes scores based on extreme values in the non-reference set relative to the reference distribution, effectively capturing outliers in one or both distribution tails [10].
- Bayesian Outlier Detection: Employs consensus background distributions derived from all available data to quantify overexpression in individual samples without requiring manual selection of comparison sets, making it particularly valuable for precision medicine applications [13].
When to Use Outlier-Based Approaches
Outlier-based methods demonstrate particular utility in specific biological contexts and data patterns:
Table 1: Scenarios Favoring Outlier-Based Differential Expression Analysis
| Scenario | Description | Example Application |
|---|---|---|
| Disease Heterogeneity | Only a subset of disease samples exhibits altered expression for a particular gene | Cancer subtypes with distinct oncogene activation patterns [10] |
| Rare Genetic Disorders | Causal variants with trans-acting effects on splicing transcriptome-wide | Minor spliceopathies caused by variants in minor spliceosome components [11] |
| Tissue-Specific Effects | Extreme expression patterns manifest in only one organ or tissue type | Sporadic over-expression observed in single organs of human and mouse models [2] |
| Composite Phenotypes | Samples with misidentified or mixed tissue origins | Cancer samples with ambiguous or composite tissue phenotypes [13] |
Simulation studies reveal that the performance advantage of outlier-based methods over mean-based approaches becomes pronounced when differential expression is strongly concentrated in the distribution tails. For sample sizes and effect sizes typical in proteomics and transcriptomics studies, the outlier pattern must be strong for these methods to provide meaningful benefits [10].
Quantitative Assessment of Outlier Impact
Prevalence and Patterns of Expression Outliers
Recent large-scale transcriptomic studies have quantified the prevalence and characteristics of extreme expression outliers across diverse biological systems:
Table 2: Prevalence of Extreme Expression Outliers Across Species and Tissues
| Dataset | Species | Tissues | Extreme Outlier Threshold | Genes with Outliers | Key Observation |
|---|---|---|---|---|---|
| Outbred Mice | M. m. domesticus | 5 organs | Q3 + 5 × IQR | 3-10% of genes (k=3) | Some individuals show extreme outlier numbers in only one organ [2] |
| GTEx Human | H. sapiens | Multiple tissues | Q3 + 5 × IQR | Comparable patterns | Outlier genes occur in co-regulatory modules, some corresponding to known pathways [2] |
| Drosophila | D. melanogaster, D. simulans | Head, trunk, whole fly | Q3 + 5 × IQR | Comparable patterns | Patterns consistent across evolutionarily divergent species [2] |
| Rare Disease | H. sapiens | PBMCs | Statistical outliers | Diagnostic in 6/46 individuals | Identified splicing defects in 6 of 9 individuals with splice variants [9] |
The biological significance of these outliers is underscored by their non-random distribution. Studies in mouse models demonstrate that extreme overexpression is typically not inherited but appears sporadically, suggesting these patterns may reflect edge of chaos effects inherent in complex gene regulatory networks with non-linear interactions and feedback loops [2].
Diagnostic Utility in Rare Diseases
In clinical diagnostics, transcriptome-wide outlier analysis has demonstrated significant value for identifying rare genetic disorders that evade detection by standard genomic approaches:
- In a study of 385 individuals from rare disease consortia, outlier analysis identified five individuals with excess intron retention outliers in minor intron-containing genes, all harboring rare, bi-allelic variants in minor spliceosome components ( [11]).
- Implementation of a minimally invasive RNA-seq protocol using peripheral blood mononuclear cells (PBMCs) enabled diagnostic resolution in six of nine individuals with splice variants, allowing reclassification of seven variants of uncertain significance [9].
- Global outlier analysis using methods like FRASER and OUTRIDER supported findings but did not yield new diagnoses beyond targeted approaches, suggesting complementary roles for hypothesis-driven and exploratory methods [9].
Experimental Protocols and Workflows
Transcriptome-Wide Outlier Analysis for Rare Disorder Diagnosis
Diagram 1: Rare Disorder Diagnostic Workflow
Protocol Steps:
Sample Preparation and RNA Sequencing
- Collect peripheral blood mononuclear cells (PBMCs) from patients and relevant family members
- Process samples with and without cycloheximide treatment to inhibit nonsense-mediated decay (NMD)
- Perform RNA sequencing using standard library preparation protocols [9]
Bioinformatic Processing
- Quality control: Assess sequence quality, adapter contamination, and potential sample swaps
- Read alignment and transcript quantification using standardized pipelines
- Normalization to account for technical variability (e.g., TPM, CPM) [2]
Outlier Detection
- Apply multiple outlier detection algorithms:
- FRASER/FRASER2: For detecting splicing outliers
- OUTRIDER: For identifying expression outliers
- Calculate expression thresholds using robust statistical measures (e.g., Q3 + 5 × IQR) [2]
- Focus on intron retention events in minor intron-containing genes [11]
- Apply multiple outlier detection algorithms:
Variant Interpretation and Validation
- Correlate outlier findings with genomic variants from exome or genome sequencing
- Perform functional validation of suspected splice variants
- Reclassify variants of uncertain significance based on transcriptomic evidence [9]
Diagnostic Decision Framework for Outlier Analysis
Diagram 2: Outlier Analysis Integration Framework
The Scientist's Toolkit: Essential Research Reagents and Computational Tools
Table 3: Key Reagents and Tools for Outlier Analysis in Transcriptomics
| Category | Specific Tool/Reagent | Function/Application | Considerations |
|---|---|---|---|
| Cell Culture | Peripheral Blood Mononuclear Cells (PBMCs) | Clinically accessible tissue for transcriptomics | ~80% of intellectual disability/epilepsy panel genes expressed; minimally invasive [9] |
| NMD Inhibition | Cycloheximide (CHX) | Inhibits nonsense-mediated decay to detect unstable transcripts | More effective than puromycin in PBMCs; use SRSF2 transcripts as internal control [9] |
| Computational Tools | FRASER/FRASER2 | Detects splicing outliers from RNA-seq data | Identifies aberrant splicing patterns; effective for splice variant interpretation [11] [9] |
| Computational Tools | OUTRIDER | Identifies expression outliers across samples | Useful for detecting aberrant expression patterns; requires appropriate normalization [9] |
| Statistical Framework | Bayesian Outlier Detection | Quantifies overexpression in individual samples | Uses consensus background distributions; does not require manually selected comparison sets [13] |
| Quality Control | SRSF2 NMD-sensitive transcripts | Endogenous control for NMD inhibition efficacy | Monitors effectiveness of CHX treatment; essential for quality assessment [9] |
Discussion and Future Perspectives
The integration of outlier analysis into transcriptomic workflows represents a paradigm shift in differential expression analysis, moving beyond mean-centered comparisons to embrace biological heterogeneity. The critical impact of this approach is evidenced by its growing diagnostic utility in rare diseases and its ability to reveal novel biological mechanisms that operate in subsets of samples or individuals [11] [9] [2].
Methodologically, future advances will likely focus on multi-optic integration, combining transcriptomic outliers with genomic, proteomic, and clinical data to distinguish functional outliers from technical artifacts. Similarly, temporal outlier analysis incorporating longitudinal sampling may help distinguish sporadic from persistent outlier expression, with implications for understanding disease dynamics and treatment response [2].
From a practical perspective, current evidence supports a hierarchical diagnostic approach that begins with targeted analysis of specific candidate variants but incorporates transcriptome-wide outlier analysis when initial tests are inconclusive. This balanced approach maximizes diagnostic yield while managing computational and interpretive complexity [9].
As transcriptomic technologies become increasingly accessible and analytical methods more sophisticated, outlier-based approaches will undoubtedly assume an increasingly central role in both basic research and clinical diagnostics, ultimately advancing biomarker discovery and personalized therapeutic development.
Connecting Outlier Detection to Rare Disease Research and Precision Medicine
Outlier detection has emerged as a powerful computational paradigm in the analysis of high-throughput biological data, particularly for diagnosing rare genetic diseases where traditional methods often fall short. This approach identifies unusual observations in genomic, transcriptomic, and proteomic data that deviate significantly from normal patterns—deviations that frequently harbor pathogenic significance. By framing clinical discovery as an outlier detection problem, researchers can systematically identify individuals with aberrant molecular phenotypes that might otherwise escape notice through standard variant-filtering approaches [12]. The integration of outlier detection into RNA-sequencing (RNA-seq) analysis represents a particularly promising advancement, enabling the identification of aberrant gene expression and splicing events across the entire transcriptome. This transcriptome-wide outlier approach has demonstrated remarkable potential for increasing diagnostic yields in rare diseases, providing functional evidence to interpret variants of uncertain significance (VUS) and uncovering novel disease mechanisms [11] [14].
Quantitative Evidence from Recent Studies
Recent large-scale studies have generated compelling quantitative evidence supporting the clinical utility of outlier detection in RNA-seq data for rare disease diagnosis. The following table summarizes key findings from major research initiatives:
Table 1: Diagnostic Yield of Outlier Detection in Rare Disease Cohorts
| Study / Cohort | Cohort Size | Previous Diagnostic Method | Outlier Detection Method | Additional Diagnostic Yield | Key Findings |
|---|---|---|---|---|---|
| 100,000 Genomes Project [15] | 4,400 individuals | Whole Genome Sequencing (WGS) | OUTRIDER (expression), LeafCutterMD (splicing) via DROP | Potential to diagnose ~25% of previously undiagnosed | ~5.4 expression and ~5.3 splicing outliers per person; ~0.2 relevant outliers after gene panel filtering |
| Neurodevelopmental Disorders (NDDs) [14] | 34 patients | Whole Exome Sequencing (WES) | DROP (RNA) + PROTRIDER (proteomics) | 32.4% (11/34 patients) diagnosed | Multi-omics guided exome reanalysis; 5 diagnoses directly from RNA/protein outliers |
| Minor Spliceopathies [11] | 385 individuals from GREGoR/UDN | Standard genomic analyses | FRASER/FRASER2 (splicing) | 5 individuals with rare, bi-allelic variants in minor spliceosome snRNAs | Identified excess intron retention in Minor Intron-containing Genes (MIGs) |
The quantitative evidence demonstrates that RNA-seq outlier analysis consistently provides substantial incremental diagnostic yield beyond DNA-based sequencing alone. The approach is particularly valuable for resolving variants of uncertain significance (VUS), which contribute to 18-28% of genetically undiagnosed cases [14]. By providing functional evidence at the transcript level, outlier detection helps reclassify these ambiguous variants, directly addressing one of the most significant challenges in rare disease genomics.
Experimental Protocols for Outlier Detection
Protocol 1: Transcriptome-Wide Splicing Outlier Analysis for Spliceopathy Detection
This protocol details the methodology for identifying individuals with splicing defects, particularly in minor spliceosome components, using the FRASER/FRASER2 framework [11].
- Sample Requirements: Whole blood RNA-seq data from patients with undiagnosed rare diseases and matched controls.
- Quality Control: Assess RNA integrity (RIN > 7), sequencing depth (>50 million reads), and alignment rates.
- Splicing Quantification: Process RNA-seq data through the DROP pipeline to calculate splice junctions and intron retention levels.
- Outlier Detection: Apply FRASER/FRASER2 to identify significant splicing outliers per sample. The model employs a denoising autoencoder to control for technical confounders and biological covariates.
- Pattern Recognition: Examine transcriptome-wide patterns, specifically focusing on excess intron retention outliers in Minor Intron-containing Genes (MIGs), which account for only 0.5% of human introns.
- Variant Correlation: Correlate splicing outlier signatures with rare, bi-allelic variants in minor spliceosome genes (e.g., RNU4ATAC, RNU6ATAC).
- Validation: Confirm suspected spliceosomal variants through orthogonal methods such as Sanger sequencing.
Protocol 2: Multi-Omics Integration for Neurodevelopmental Disorder Diagnosis
This protocol describes a comprehensive workflow integrating proteomics with RNA-seq to resolve undiagnosed Neurodevelopmental Disorder (NDD) cases [14].
- Sample Preparation: Collect patient-derived skin fibroblasts for RNA and protein extraction. Include control samples (e.g., in-house and from repositories like GTEx).
- Data Generation:
- RNA-seq: Perform standard RNA sequencing (e.g., Illumina). Target >30 million reads per sample.
- Proteomics: Conduct quantitative liquid chromatography-mass spectrometry (LC-MS) proteomics.
- Outlier Analysis:
- RNA Level: Process data through the DROP pipeline, which integrates:
- OUTRIDER: For detecting aberrant expression (AE) outliers.
- FRASER: For detecting aberrant splicing (AS) outliers.
- Monoallelic Expression (MAE): For detecting allelic imbalance.
- Protein Level: Analyze proteomics data with PROTRIDER to identify aberrant protein expression outliers.
- RNA Level: Process data through the DROP pipeline, which integrates:
- Data Integration and Prioritization:
- Filter all outlier events (AE, AS, MAE, protein) for genes associated with Mendelian disease (e.g., OMIM genes).
- Integrate the prioritized outlier list with reanalyzed exome data.
- Manually curate variants based on ACMG/AMP guidelines, incorporating functional evidence from RNA and protein outliers.
- Interpretation: Classify variants as pathogenic or likely pathogenic based on combined genomic, transcriptomic, and proteomic evidence.
Protocol 3: The OutSingle Algorithm for Confounder-Resistant Outlier Detection
This protocol outlines the use of the OutSingle tool, a rapid method for detecting outliers in RNA-seq gene expression data that is robust to confounding effects [1].
- Input Data: A J × N matrix of RNA-seq counts, where J is the number of genes and N is the number of samples.
- Step 1: Log-Normal Z-score Calculation:
- Log-transform the count data (e.g., log2(counts + 1)).
- For each gene, calculate Z-scores across samples based on the log-normal distribution assumption.
- Step 2: Confounder Control via SVD and Optimal Hard Threshold (OHT):
- Perform Singular Value Decomposition (SVD) on the Z-score matrix.
- Apply the Gavish-Donoho Optimal Hard Threshold (OHT) method to denoise the matrix by discarding non-significant singular values.
- Outlier Identification: Genes with absolute adjusted Z-scores beyond a defined threshold (e.g., |Z| > 3) in a given sample are flagged as outliers.
- Artificial Outlier Injection (Optional for Benchmarking): The model can be run in reverse to inject artificial outliers masked by confounders, enabling method validation and power calculations.
Visualizing Workflows and Signaling Pathways
Multi-Omics Outlier Detection Workflow
The following diagram illustrates the integrated multi-omics workflow for diagnosing rare neurological diseases, as implemented in recent studies [14].
Diagram 1: Multi-omics workflow for rare disease diagnosis.
Minor Spliceosome Dysfunction Pathway
This diagram outlines the biological pathway and analytical process connecting genetic variants in minor spliceosome components to disease, as identified through transcriptome-wide outlier analysis [11].
Diagram 2: Pathway from genetic variant to disease diagnosis.
The Scientist's Toolkit: Essential Research Reagents and Computational Tools
Successful implementation of outlier detection in a research or clinical setting requires specific computational tools and analytical frameworks. The following table catalogs key resources.
Table 2: Essential Tools and Resources for RNA-seq Outlier Detection
| Tool/Resource Name | Type | Primary Function | Application Context |
|---|---|---|---|
| DROP [14] [15] | Computational Pipeline | Modular workflow for RNA-seq outlier detection (AE, AS, MAE). | Comprehensive RNA analysis in rare disease cohorts. |
| OUTRIDER [1] [14] [15] | Algorithm / R Package | Detects aberrant gene expression outliers using autoencoders. | Identifying over/underexpressed genes in patient samples. |
| FRASER/FRASER2 [11] [14] | Algorithm / R Package | Detects aberrant splicing outliers from RNA-seq data. | Finding mis-splicing events in spliceopathies and other disorders. |
| PROTRIDER [14] | Computational Pipeline | Detects aberrant protein expression outliers from proteomics data. | Multi-omics integration for variants affecting protein stability. |
| OutSingle [1] | Algorithm | Rapid outlier detection using SVD and Optimal Hard Threshold. | Fast confounder-controlled analysis on gene expression counts. |
| LeafCutterMD [15] | Computational Tool | Identifies splicing outliers from RNA-seq data. | Splicing analysis in large cohorts (e.g., 100,000 Genomes). |
The integration of outlier detection methodologies into RNA-seq analysis represents a transformative advancement for rare disease research and precision medicine. By systematically identifying aberrant molecular phenotypes that elude conventional DNA-based analyses, these approaches significantly increase diagnostic yields—by 15-32% in recent studies—and provide a functional framework for interpreting the growing number of variants of uncertain significance. As the field progresses, the combination of transcriptomic, proteomic, and genomic data within unified outlier detection frameworks promises to further accelerate discovery, refine diagnostic precision, and ultimately deliver answers to an increasing number of patients and families affected by rare disorders.
The analysis of RNA sequencing (RNA-seq) data presents unique statistical challenges that must be adequately addressed to draw valid biological conclusions. Three fundamental concepts—confounding factors, overdispersion, and appropriate statistical distributions—form the bedrock of robust differential expression analysis. Confounding variables are unmeasured or uncontrolled factors that can unintentionally affect study outcomes, leading to spurious associations if not properly managed [16]. In RNA-seq data, overdispersion represents the empirical phenomenon where the variance of read counts exceeds the mean, violating the assumptions of simpler statistical models [17]. The choice of statistical distribution for modeling count data directly impacts the accuracy of differential expression testing and outlier detection [18]. Together, these concepts influence experimental design, analytical approaches, and interpretation of transcriptomic studies, particularly in the context of outlier detection methods for RNA-seq analysis.
Core Conceptual Foundations
Confounding Factors in Transcriptomics
A confounding variable is defined as an unmeasured factor that may unintentionally affect the outcome of a research study by creating spurious associations between variables [16]. In experimental design, independent variables represent manipulated conditions (e.g., genotype, treatment), while dependent variables represent measured outcomes (e.g., gene expression levels). Confounders can affect both independent and dependent variables, potentially reversing, eliminating, or obscuring true effects [16].
In RNA-seq experiments, confounding can occur when nuisance variables (factors not of direct interest) become associated with the primary factor under investigation. For example, if all knockout mouse samples are harvested in the morning while wild-type controls are harvested in the afternoon, time of collection becomes a confounding factor whose effects cannot be separated from the genetic effect [19]. Additional examples include having different laboratory technicians process different experimental groups, or using samples with systematically different RNA quality between conditions [19].
Overdispersion in Count Data
Overdispersion refers to the characteristic of RNA-seq data where the variance of read counts is larger than the mean, a phenomenon that contradicts the assumptions of traditional Poisson models [17]. This extra-Poisson variability arises from multiple sources including biological variability (natural variation between individuals or cells), technical noise (from sample processing and sequencing protocols), and measurement error [18] [2].
The practical implication of overdispersion is that it complicates the identification of differentially expressed genes. When overdispersion is not properly accounted for, statistical tests may produce artificially small p-values, leading to false discoveries. As noted in research on microglial RNA-seq datasets, "the main challenge... lies in the high and heterogeneous overdispersion in the read counts," where read counts are highly spread out with variances much larger than means [17].
Statistical Distributions for RNA-Seq Data
Several statistical distributions have been proposed to model RNA-seq count data, each with distinct characteristics and applications:
- Poisson Distribution: Defined by a single parameter (μ) where the variance equals the mean (E(Y) = Var(Y) = μ) [20]. While theoretically appealing for count data, the Poisson distribution is often inadequate for RNA-seq data due to its inability to model overdispersion [18].
- Negative Binomial Distribution: Characterized by mean (μ) and overdispersion parameter (θ), with variance defined as Var(Y) = μ + μ²/θ [17]. This distribution models variance as a quadratic function of the mean and has become a standard choice for many RNA-seq analysis tools.
- Quasi-Poisson Distribution: Another overdispersed alternative where E(Y) = μ and Var(Y) = θμ, modeling variance as a linear function of the mean [17].
Table 1: Statistical Distributions for RNA-Seq Count Data
| Distribution | Mean-Variance Relationship | Overdispersion Parameter | Common Applications |
|---|---|---|---|
| Poisson | Var = μ | None | Technical replicates [20] |
| Negative Binomial | Var = μ + μ²/θ | θ (smaller θ = higher dispersion) | DESeq2, EdgeR [17] |
| Quasi-Poisson | Var = θμ | θ (larger θ = higher dispersion) | DEHOGT method [17] |
Quantitative Characterization of Overdispersion
Empirical Evidence and Measurement
The high-replicate yeast RNA-seq experiment (48 biological replicates) provided robust empirical evidence for overdispersion in transcriptomic data [18]. This study demonstrated that observed gene read counts were consistent with both log-normal and negative binomial distributions, with the mean-variance relation following a constant dispersion parameter of approximately 0.01 [18].
The recently proposed DEHOGT (Differentially Expressed Heterogeneous Overdispersion Genes Testing) method addresses limitations in existing approaches by adopting a gene-wise estimation scheme that does not assume homogeneous dispersion levels across genes with similar expression strength [17]. This approach recognizes that "shrinking the estimates of gene-wise dispersion towards a common value might diminish the true differences in gene expression variability between different genes or conditions" [17].
Impact on Outlier Detection
Overdispersion directly influences outlier detection in RNA-seq analysis. Research has shown that 3-10% of all genes (approximately 350-1350 genes) exhibit extreme outlier expression in at least one individual when using conservative thresholds [2]. These outlier patterns appear to be biological realities rather than technical artifacts, occurring universally across tissues and species [2].
A study of multiple datasets including outbred and inbred mice, human GTEx data, and Drosophila species found that different individuals can harbor very different numbers of outlier genes, with some showing extreme numbers in only one out of several organs [2]. Longitudinal analysis revealed that most extreme over-expression is not inherited but appears sporadically, suggesting these patterns may reflect "edge of chaos" effects in gene regulatory networks characterized by non-linear interactions and feedback loops [2].
Table 2: Methods Addressing Overdispersion in RNA-Seq Analysis
| Method | Approach to Overdispersion | Advantages | Limitations |
|---|---|---|---|
| DESeq2 [17] | Shrinkage estimation of dispersions | Improved stability and interpretability | May overestimate true biological variability [17] |
| EdgeR [17] | Overdispersed Poisson model | Established methodology for replicated data | Assumes homogeneous dispersion for genes with similar expression [17] |
| DEHOGT [17] | Gene-wise heterogeneous overdispersion modeling | Enhanced power with limited replicates; accounts for dispersion heterogeneity | Computationally intensive for very large datasets |
| sctransform [21] | Regularized negative binomial model with residuals | Effectively removes relationship between UMI count and expression | Primarily designed for single-cell data |
Experimental Protocols for Addressing Confounding and Overdispersion
Robust Experimental Design Protocol
Objective: Design an RNA-seq experiment that minimizes confounding and accurately estimates biological variability.
Procedure:
- Define Factors of Interest: Clearly identify primary experimental factors (e.g., genotype, treatment) and potential nuisance variables (e.g., batch, sex, age) [19].
- Implement Randomization: Randomly assign samples to processing batches and sequencing lanes to prevent systematic confounding [16] [19].
- Balance Experimental Groups: Ensure equal distribution of potential confounding factors (e.g., age, sex) across experimental conditions [19].
- Include Adequate Replication: Include a minimum of 3 biological replicates per condition, with higher replication (10-15) for studies of subtle effects [19].
- Control Technical Variability: Keep testing environments, personnel, and protocols consistent throughout the study [16].
- Record Metadata: Document all potential sources of variation for use in statistical modeling [19].
Quality Control Considerations:
- Assess RNA Integrity Number (RIN) for all samples, ensuring consistency between conditions (RIN ≥ 8 recommended) [19].
- Perform sample correlation analysis to identify "bad" replicates with atypical expression profiles [18].
- Calculate outlier fractions by comparing each gene's expression in individual replicates to trimmed means across replicates [18].
Normalization and Quality Control Protocol
Objective: Account for library size differences and identify technical artifacts.
Procedure:
- Library Size Normalization: Apply appropriate normalization method based on data type:
Variance Stabilizing Transformation: Apply log2 transformation to normalized CPM/TPM values to address heteroskedasticity [21].
Quality Assessment:
Batch Effect Correction: If batches cannot be avoided, apply statistical methods (e.g., ComBat, limma removeBatchEffect) to adjust for batch effects during differential expression analysis.
Outlier Detection and Validation Protocol
Objective: Identify biological versus technical outliers in expression data.
Procedure:
- Normalization: Normalize raw count data using TMM normalization to account for sequencing depth and RNA composition [17].
- Distribution Fitting: For each gene, fit observed read counts to theoretical distributions (Poisson, negative binomial, quasi-Poisson) [17].
- Outlier Identification: Apply Tukey's fences method using interquartile ranges (IQR) around median expression values [2]:
- Calculate Q1 (25th percentile) and Q3 (75th percentile)
- Compute IQR = Q3 - Q1
- Identify outliers as values below Q1 - k×IQR or above Q3 + k×IQR
- Use k=5 for conservative detection of extreme outliers [2]
- Co-expression Analysis: Identify modules of co-regulated outlier genes using correlation networks [2].
- Biological Validation: Examine outlier genes for enrichment in known pathways and functional categories [2].
Visualization Frameworks
RNA-Seq Experimental Design and Confounding
Overdispersion in RNA-Seq Data Analysis
Research Reagent Solutions
Table 3: Essential Research Reagents and Materials for RNA-Seq Quality Control
| Reagent/Material | Function | Application Context |
|---|---|---|
| ERCC Spike-in Controls [18] | Synthetic RNAs of known concentration for technical variability assessment | Normalization and quality control in bulk RNA-seq |
| Unique Molecular Identifiers (UMIs) [22] | Molecular barcodes to correct for amplification biases | Single-cell RNA-seq experiments for absolute molecule counting |
| Ribosomal RNA Depletion Kits | Remove abundant ribosomal RNA to enrich for mRNA | Working with degraded samples or non-coding RNA analysis |
| Poly-A Selection Kits | Enrich for polyadenylated mRNA molecules | Standard mRNA sequencing from high-quality RNA |
| RNA Integrity Number (RIN) Standards | Quantify RNA degradation level using microfluidics | Sample quality assessment prior to library preparation |
| Quantitative PCR Assays | Validate expression of outlier genes | Technical confirmation of RNA-seq findings |
A Practical Guide to Key Outlier Detection Algorithms and Implementation
Outlier detection in RNA sequencing (RNA-seq) analysis is crucial for identifying aberrant gene expression events associated with rare diseases and other pathological conditions. Within this domain, distribution-based methods employing negative binomial models have emerged as powerful statistical frameworks for distinguishing biologically significant outliers from technical noise. The negative binomial distribution is particularly well-suited for modeling RNA-seq count data due to its ability to handle overdispersion—a common characteristic where the variance exceeds the mean in sequencing datasets [23]. This review focuses on two sophisticated implementations of negative binomial models: OUTRIDER (Outlier in RNA-Seq Finder) and ppcseq (Probabilistic Outlier Identification for RNA Sequencing Generalized Linear Models). OUTRIDER utilizes an autoencoder to control for confounders before identifying outliers within a negative binomial framework [24] [25], while ppcseq employs a Bayesian approach with posterior predictive checks to flag transcripts with outlier data points that violate negative binomial assumptions [26] [27]. Both methods address critical limitations in earlier approaches that either lacked proper statistical significance assessments or relied on subjective manual corrections for technical covariates.
Theoretical Foundations of Negative Binomial Models for RNA-Seq Data
The Negative Binomial Distribution in Count Data Modeling
The negative binomial distribution serves as a fundamental statistical framework for modeling RNA-seq count data due to its ability to accommodate overdispersion. The probability mass function (PMF) for a negative binomial random variable X, representing the number of failures before the s-th success in a sequence of Bernoulli trials, is given by:
[P(X=x) = \binom{s+x-1}{x} p^s (1-p)^x]
where (x = 0, 1, 2, \ldots), (s > 0), and (0 < p \leq 1) [23]. The mean and variance of the distribution are (\mu = s\frac{1-p}{p}) and (\sigma^2 = s\frac{1-p}{p^2}), respectively. The variance exceeding the mean ((\sigma^2 > \mu)) makes this distribution particularly suitable for RNA-seq data, which typically exhibits greater variability than would be expected under a Poisson sampling model [27] [23].
The negative binomial distribution can be reparameterized in terms of (\mu) and dispersion parameter (\theta), where (\theta = 1/s). This parameterization is more intuitive for biological applications where the mean expression level and degree of overdispersion are natural parameters of interest. As (\theta \rightarrow 0), the negative binomial distribution converges to the Poisson distribution, illustrating how the former generalizes the latter to account for extra-Poisson variation [23].
In RNA-seq experiments, overdispersion arises from multiple biological and technical sources. Biological replicates exhibit intrinsic variability in mRNA synthesis and degradation rates, even under controlled experimental conditions [27]. Technical variations stem from library preparation protocols, sequencing depth differences, and batch effects [24]. The negative binomial model captures these combined variability sources through its dispersion parameter, providing a more accurate statistical representation of RNA-seq count distributions compared to Poisson models.
OUTRIDER: Implementation of Negative Binomial Models with Autoencoder-Based Covariate Control
Statistical Framework and Algorithm
OUTRIDER implements a sophisticated statistical framework that combines negative binomial modeling with autoencoder-based normalization. The algorithm assumes that the read count (k_{ij}) of gene (j) in sample (i) follows a negative binomial distribution:
[P(k{ij}) = NB(k{ij}|\mu{ij} = c{ij}, \theta_j)]
where (\thetaj) represents the gene-specific dispersion parameter, and the expected count (c{ij}) is the product of a sample-specific size factor (si) and the exponential of the fitted value (y{ij}): (c{ij} = si \cdot \exp(y{ij})) [24]. The size factors (si) account for variations in sequencing depth across samples and are estimated using the median-of-ratios method as implemented in DESeq2 [24].
The key innovation in OUTRIDER is the use of an autoencoder to model the covariation structure (y_{ij}) across genes. The autoencoder, with encoding dimension (q) where (1 < q < \min(p,n)) for (p) genes and (n) samples, captures technical and biological confounders through the transformation:
[yi = hi W_d + b]
[hi = \tilde{x}i W_e]
where (We) is the (p \times q) encoding matrix, (Wd) is the (q \times p) decoding matrix, (h_i) is the encoded representation, and (b) is a bias term [24]. This approach automatically learns and controls for covariation patterns resulting from technical artifacts, environmental factors, or common genetic variations without requiring a priori specification of covariates.
Experimental Protocol for OUTRIDER Implementation
Software Installation and Data Preparation
- Install OUTRIDER from Bioconductor using the R command:
BiocManager::install("OUTRIDER")[28] - Prepare RNA-seq data as a SummarizedExperiment object containing raw count values
- Filter for expressed genes using OUTRIDER's built-in functions (e.g., retain genes with FPKM > 1 in at least 5% of samples) [24]
Model Fitting and Outlier Detection
- Compute size factors for count normalization using the median-of-ratios method
- Fit the autoencoder to estimate expected counts by controlling for covariation:
- Set the encoding dimension (q) using hyperparameter optimization
- Optimize parameters to maximize the recall of artificially corrupted data
- Estimate gene-specific dispersion parameters (\theta_j) constrained to [0.01, 1000] to prevent convergence issues
- Identify aberrantly expressed genes as read counts that significantly deviate from the fitted negative binomial distribution using false-discovery-rate-adjusted p-values [24]
Result Interpretation
- Visualize results using OUTRIDER's plotting functions
- Identify outlier samples with an excessive number of aberrantly expressed genes
- Prioritize candidate genes for further biological validation
Table 1: Key Parameters in OUTRIDER Implementation
| Parameter | Description | Recommended Setting |
|---|---|---|
| Encoding dimension (q) | Determines complexity of captured covariation | Optimized via cross-validation |
| Dispersion bounds | Constrains gene-specific dispersion estimates | [0.01, 1000] |
| FDR threshold | Controls false discoveries in outlier calls | 0.05 (default) |
| Minimum expression | Filters lowly expressed genes | FPKM > 1 in ≥5% samples |
Figure 1: OUTRIDER Analytical Workflow. The diagram illustrates the stepwise process from raw count data to outlier detection, highlighting the integration of autoencoder-based normalization with negative binomial modeling.
ppcseq: Bayesian Negative Binomial Models with Posterior Predictive Checks
Statistical Framework and Algorithm
ppcseq implements a Bayesian approach to outlier detection in differential expression analyses using negative binomial models with posterior predictive checks. The method addresses the limitation that traditional negative binomial models with thin-tailed gamma distributions are not robust against extreme outliers, which can disproportionately influence statistical inference [27].
The ppcseq framework employs a hierarchical negative binomial regression model that jointly accounts for three types of uncertainty: (1) the mean abundance and overdispersion of transcripts and their log-scale-linear association; (2) the effect of sequencing depth; and (3) the association between transcript abundance and the factors of interest [27]. The core innovation lies in its two-step iterative outlier detection process:
Discovery Step: The model is fitted to differentially expressed transcripts, and posterior predictive distributions are generated. Observed read counts falling outside the 95% posterior credible intervals are flagged as potential outliers.
Test Step: The model is refitted excluding the potential outliers using a truncated negative binomial distribution, and the observed read counts are tested against the refined theoretical distribution with more stringent criteria controlling the false positive rate [27].
This iterative approach prevents outliers from skewing parameter estimates and improves both the sensitivity and specificity of outlier detection.
Experimental Protocol for ppcseq Implementation
Software Installation and System Configuration
- For Linux systems, configure R for multi-threading by creating
~/.R/Makevarswith: - Install ppcseq from Bioconductor:
BiocManager::install("ppcseq")[26]
Data Preparation and Model Fitting
- Format input data as a tidy data frame with columns for sample, symbol (gene identifier), logCPM, LR (likelihood ratio), PValue, FDR, value (count), and experimental factors
- Pre-filter for statistically significant transcripts (e.g., FDR < 0.0001) to focus computational resources
- Implement the outlier identification workflow:
- For large datasets, consider using
approximate_posterior_inference = TRUEto reduce computation time [26]
Posterior Inference and Result Interpretation
- Extract posterior predictive check results and visualize using
plot_credible_intervals() - Identify transcripts with
tot_deleterious_outliers > 0as containing significant outliers - Examine the
ppc_samples_failedcolumn to assess the number of samples where the observed data significantly deviates from the model expectations
Table 2: Key Parameters in ppcseq Implementation
| Parameter | Description | Recommended Setting |
|---|---|---|
| percentfalsepositive_genes | Controls false positive rate in discovery phase | 1-5% |
| approximateposteriorinference | Uses variational Bayes approximation for speed | FALSE for accuracy, TRUE for large datasets |
| cores | Number of processing cores for parallelization | 1 to maximum available |
| .do_check | Logical vector indicating which transcripts to test | Pre-filtered significant transcripts |
Figure 2: ppcseq Iterative Outlier Detection Workflow. The two-stage process identifies potential outliers with relaxed criteria, then tests them against a refined model with stringent false positive control.
Comparative Analysis of Methodological Approaches
Technical Comparisons Between OUTRIDER and ppcseq
Table 3: Comparative Analysis of OUTRIDER and ppcseq
| Feature | OUTRIDER | ppcseq |
|---|---|---|
| Statistical Foundation | Frequentist with FDR control | Bayesian with posterior predictive checks |
| Primary Application | Rare disease diagnostics: identifying aberrant expression in individual samples | Differential expression quality control: flagging outlier-inflated statistics |
| Confounder Control | Autoencoder (unsupervised) | Experimental design factors (supervised) |
| Dispersion Estimation | Gene-specific with constraints | Hierarchical Bayesian shrinkage |
| Input Requirements | Raw counts from multiple samples | Differential expression results with raw counts |
| Computational Demand | Moderate (autoencoder training) | High (MCMC sampling) |
| Multiple Testing Correction | Benjamini-Hochberg FDR | Bayesian false positive rate control |
| Output | Significance-based outlier calls | Posterior probabilities of outlier status |
Practical Applications in Rare Disease Research
Both OUTRIDER and ppcseq have demonstrated significant utility in rare disease diagnostics and transcriptomic analysis. OUTRIDER has been successfully applied to identify aberrantly expressed genes in rare disease cohorts, serving as a complementary approach to genome sequencing for pinpointing regulatory variants that may escape detection in standard analyses [24] [25]. The method's ability to automatically control for technical and biological confounders makes it particularly valuable in diagnostic settings where a priori knowledge of relevant covariates may be limited.
ppcseq addresses a different but equally important challenge in transcriptomic studies: ensuring the reliability of differential expression results. By identifying and flagging transcripts whose statistics are inflated by outlier values, ppcseq improves the validity of downstream analyses and biological interpretations. Applied studies have revealed that 3-10% of differentially abundant transcripts across algorithms and datasets contain statistics inflated by outliers [27], highlighting the importance of this quality control step.
Recent research has further demonstrated the value of transcriptome-wide outlier approaches in identifying specific rare disease mechanisms. A 2025 study by Arriaga et al. utilized splicing outlier detection methods to identify individuals with minor spliceopathies, discovering five individuals with excess intron retention outliers in minor intron-containing genes who harbored rare variants in minor spliceosome components [7] [11]. This work illustrates how outlier detection methods can reveal novel disease mechanisms that would be missed by standard variant-centric approaches.
Table 4: Essential Research Reagents and Computational Resources for Implementation
| Resource | Type | Function/Purpose | Implementation Notes |
|---|---|---|---|
| OUTRIDER R Package | Software | Implements autoencoder-controlled negative binomial outlier detection | Available via Bioconductor; requires R>=3.6 [28] |
| ppcseq R Package | Software | Bayesian outlier detection with posterior predictive checks | Requires Stan and rstan dependencies [26] |
| DESeq2 | Software | Provides core negative binomial functionality and size factor estimation | Dependency for both OUTRIDER and ppcseq [24] [27] |
| Stan | Software | Probabilistic programming language for Bayesian inference | Required for ppcseq; enables Hamiltonian Monte Carlo sampling [27] |
| RNA-seq Count Data | Data Input | Raw read counts per gene across multiple samples | Essential input format for both methods |
| High-Performance Computing | Infrastructure | Parallel processing for computationally intensive steps | Multi-core systems significantly reduce runtime for both tools |
| Housekeeping Gene Set | Reference Data | Transcripts with stable expression for normalization | Used by ppcseq for inferring sequencing depth effects [27] |
Negative binomial models implemented in OUTRIDER and ppcseq represent sophisticated approaches to outlier detection in RNA-seq analysis, each with distinct strengths and applications. OUTRIDER's integration of autoencoder-based confounder control with negative binomial modeling provides a powerful framework for identifying aberrant expression in rare disease diagnostics, particularly when technical and biological covariates are unknown or complex. Meanwhile, ppcseq's Bayesian approach with iterative posterior predictive checks offers robust quality control for differential expression analyses by identifying transcripts with statistics inflated by outlier values. As RNA-seq continues to evolve as a diagnostic and research tool, these distribution-based methods will play an increasingly important role in ensuring the validity and biological interpretability of transcriptomic findings.
In the analysis of high-dimensional RNA sequencing (RNA-seq) data, the accurate detection of outlier samples is a critical preprocessing step. Outliers can arise from technical artifacts during complex multi-step protocols or from genuine but extreme biological variation [29]. Their presence can significantly skew downstream analyses, such as differential gene expression testing, leading to reduced accuracy and unreliable biological conclusions [29] [2]. This application note focuses on two powerful dimension-reduction-based approaches for outlier detection: OUTSINGLE, which utilizes Singular Value Decomposition and the Optimal Hard Threshold (SVD/OHT), and Robust PCA methods, specifically PcaGrid and PcaHubert. These methods are particularly suited for the high-dimensionality and small sample sizes typical of RNA-seq datasets [29] [30]. We detail their protocols, performance, and integration into a robust RNA-seq analysis workflow, providing a essential guide for researchers and drug development scientists.
Key Concepts and Methodologies
OutSingle: SVD and Optimal Hard Threshold (OHT)
OUTSINGLE is a Python tool designed to identify outliers in RNA-seq gene expression count data. Its core innovation lies in using SVD to decompose the gene expression matrix, followed by the application of an Optimal Hard Threshold to the singular values. This process effectively separates the signal from the noise, allowing for the calculation of robust outlier scores for each gene [30]. The method is classified as a backward search gene filtering approach, meaning it starts with the full gene set and removes those deemed uninformative or noisy [31]. OUTSINGLE has been benchmarked against other gene filtering methods and has shown proficiency in identifying genes with anomalous expression confined to specific samples, thereby reducing technical noise while preserving biologically relevant signals [31].
Robust PCA (PcaGrid and PcaHubert)
Classical Principal Component Analysis (cPCA) is highly sensitive to outliers, which can disproportionately influence the principal components and mask the true data structure. Robust PCA (rPCA) methods, such as PcaGrid and PcaHubert, address this limitation by employing robust statistical estimators that are less susceptible to extreme values [29]. These algorithms first fit the majority of the data before flagging deviant data points.
- PcaGrid: This method achieves a high breakdown point, meaning it can tolerate a large proportion of outliers without its estimates being significantly affected. It has demonstrated 100% sensitivity and specificity in tests with RNA-seq data containing positive control outliers [29] [32].
- PcaHubert: This approach combines robust covariance estimation with a projection-pursuit method to identify outliers effectively [29].
In comparative studies on real biological RNA-seq data, both rPCA methods successfully identified outlier samples that classical PCA failed to detect [29]. The application of rPCA for sample-level outlier detection is distinct from gene filtering and is a recommended quality control step prior to differential expression analysis [33].
Performance Comparison and Quantitative Data
The following tables summarize the key characteristics and performance metrics of the outlined outlier detection methods as reported in the literature.
Table 1: Method Overview and Key Features
| Method | Core Algorithm | Implementation | Primary Target | Key Advantage |
|---|---|---|---|---|
| OUTSINGLE | SVD with Optimal Hard Threshold | Python | Outlier Genes | Identifies sample-biased genes; reduces technical noise [30] [31] |
| PcaGrid | Robust PCA | R (rrcov package) | Outlier Samples | High breakdown point; 100% sens/spec in controlled tests [29] [34] |
| PcaHubert | Robust PCA (Projection Pursuit) | R (rrcov package) | Outlier Samples | Effective outlier flagging; robust covariance estimation [29] |
Table 2: Performance Benchmarks from Literature
| Method | Reported Sensitivity & Specificity | Use Case Evidence | Comparative Performance |
|---|---|---|---|
| PcaGrid | 100% sensitivity and specificity on simulated RNA-seq data with positive control outliers [29] [32] | Detection of two outlier samples in mouse cerebellum RNA-seq data; improved DEG analysis post-removal [29] | Superior to classical PCA, which failed to detect the outliers [29] |
| PcaHubert | High accuracy in outlier detection (specific metrics not provided) [29] | Detected the same two outlier samples as PcaGrid in a real mouse RNA-seq dataset [29] | Comparable to PcaGrid on real data [29] |
| OUTSINGLE | Effective identification of artificial outliers injected into real datasets [30] | Identification of outlier genes in TCGA cancer data and COVID-19 scRNA-seq data [31] | Proficiently identifies genes with expression anomalies in specific samples [31] |
Experimental Protocols
Protocol 1: Outlier Sample Detection with Robust PCA in R
This protocol details the steps for identifying outlier samples in an RNA-seq dataset using robust PCA methods, specifically PcaGrid, within the R statistical environment [29] [34].
1. Preprocessing and Data Preparation:
- Begin with a normalized count matrix, such as the one obtained from DESeq2's rlog or vst transformation. The matrix should be structured with genes as rows and samples as columns.
- Critical Step: Transpose the normalized count matrix so that samples are rows and genes are columns, as required by the PcaGrid function [34].
2. Execute Robust PCA:
- Utilize the rrcov package in R. Compute the robust PCA on the transposed matrix.
- Code Example:
3. Identify and Review Outlier Samples:
- The PcaGrid object contains a @flag slot where FALSE values indicate outliers.
- Code Example:
4. Downstream Analysis: - Remove the identified outlier samples from the original dataset or include the robust PCA components as covariates in subsequent differential expression models to control for their effects [29].
Protocol 2: Outlier Gene Detection with OUTSINGLE in Python
This protocol describes the process of detecting outlier genes using the OUTSINGLE tool from a Python command-line interface [30].
1. Environment and Data Setup:
- Clone the OUTSINGLE repository from GitHub and install its dependencies using pip install -r requirements.txt.
- Prepare your input data as a tab-separated CSV file. The file's first column should contain gene names, the first row should contain sample names, and all other cells should contain integer count data [30].
2. Z-score Estimation: - Run the initial z-score estimation on your dataset. - Code Example (execute in terminal):
3. Outsingle Score Calculation: - Calculate the final OUTSINGLE score, which produces several files with artificial outliers and corresponding outlier mask files for evaluation. - Code Example (execute in terminal):
4. Results Interpretation:
- The output includes files with suffixes indicating the parameters of the analysis (e.g., -f1-b-z6.00.txt signifies a frequency of 1 outlier per sample, both positive and negative outliers, and a z-score magnitude of 6.00).
- The outlier mask files (with omask in the name) contain matrices of zeros with 1 or -1 indicating the location and direction of outlier genes [30]. These coordinates can be used to filter the gene set before downstream analyses like differential expression.
Workflow Visualization
The following diagram illustrates the logical sequence and decision points for integrating these outlier detection methods into a standard RNA-seq analysis pipeline.
The Scientist's Toolkit: Research Reagent Solutions
Table 3: Essential Software and Packages for Implementation
| Tool Name | Language/Platform | Function/Purpose | Key Command/Function |
|---|---|---|---|
| rrcov | R | Provides implementations of robust PCA methods, including PcaGrid and PcaHubert. |
PcaGrid(), PcaHubert() [29] [34] |
| DESeq2 | R | Used for normalization and transformation of RNA-seq count data prior to outlier detection. | rlog(), vst() [34] |
| OUTSINGLE | Python | A dedicated package for finding outlier genes in RNA-seq count data using SVD and OHT. | fast_zscore_estimation.py, outsingle.py [30] |
| EIGENSOFT/smartpca | C++/Unix | A standard suite for population genetics, often used for PCA in genomics; can be complemented with robust methods. | smartpca [33] |
| PLINK | C++/Unix | Used for LD pruning and quality control of genetic data prior to PCA, a common step in GWAS. | --indep-pairwise [33] |
High-throughput RNA sequencing (RNA-Seq) has become a foundational tool for understanding gene expression in biological systems. The negative binomial model serves as the most frequently adopted framework for differential expression analysis. However, common methods based on this model lack robustness to extreme outliers, which have been shown to be abundant in public datasets [27]. These outliers can disproportionately influence statistical inference, inflating fold changes and deflating P-values, ultimately leading to both false positives and false negatives in differential expression analysis [27]. Within the context of a broader thesis on outlier detection in RNA-Seq research, this article explores two sophisticated probabilistic approaches: ppcseq, which employs posterior predictive checks, and an adaptation of Iterative Leave-One-Out (iLOO) cross-validation. These methods address a critical gap in the field, where rigorous, probabilistic outlier detection methods have been largely absent, leaving identification mostly to visual inspection [27].
Theoretical Foundations
The Challenge of Outliers in Negative Binomial Models
The negative binomial distribution models RNA-Seq count data by accounting for two types of variability: (i) biological variability in mRNA synthesis/degradation rates between replicates (modeled by a gamma distribution), and (ii) intrinsic variability from imperfect mRNA extraction and sequencing efficiency (modeled by a Poisson distribution) [27]. Although most gene counts are well-fitted by this distribution, the underlying gamma distribution has thin tails, making it non-robust to unmodeled large-scale biological variability. This results in some biological replicates having disproportionate influence on final inferences [27].
Bayesian Frameworks for Outlier Detection
Bayesian statistics provide a robust methodology for comparing observed data against its theoretical distribution within a statistical model. Recent computational advances in sampling multidimensional posterior distributions, including dynamic Hamiltonian Monte Carlo and variational Bayes, now enable efficient joint hierarchical modeling of large-scale RNA-Seq datasets [27]. These approaches allow for:
- Posterior Predictive Checks: Generating theoretical data distributions from fitted models and comparing them against observed data [27] [35].
- Probabilistic Outlier Identification: Flagging data points that fall outside credible intervals of their theoretical distributions [27].
- Model Comparison: Evaluating model fit through leave-one-out cross-validation and related techniques [36].
Table 1: Key Concepts in Probabilistic Outlier Detection
| Concept | Description | Application in RNA-Seq |
|---|---|---|
| Posterior Predictive Check | Method for validating a model by generating data from parameters drawn from the posterior [35]. | Compare theoretical distribution of RNA-Seq counts against observed data to identify outliers [27]. |
| Posterior Predictive P-value | Probability that a test statistic in replicated data exceeds that in the original data [36] [37]. | Quantifies mismatch between model and data; non-uniform distributions indicate poor fit [36]. |
| Credible Interval | Bayesian analogue of confidence intervals, representing the range where an unobserved parameter lies with a certain probability. | Identify read counts that fall outside the expected range given the negative binomial model [27]. |
| Variational Bayes | Method for approximating posterior distributions with multivariate normal distributions for computational efficiency [27]. | Enables large-scale RNA-Seq analysis by providing faster, approximate posterior inference [27]. |
The ppcseq Framework: Protocol and Application
ppcseq is a quality-control tool specifically designed for identifying transcripts that include outlier data points in differential expression analysis. It utilizes a Bayesian probabilistic framework to model raw read counts based on negative binomial regression [27] [26]. The method addresses the limitations of existing approaches like DESeq2, which uses Cook's distance but does not control for false positives in multiple inference and relies on a minimum biological replication [27].
Workflow and Implementation
The ppcseq workflow employs a two-step iterative approach for outlier identification [27]:
Step 1: Discovery Phase
- Fit the model to differentially abundant transcripts and housekeeping genes
- Generate theoretical data distributions from the fitted model
- Quarantine observed read counts outside the 95% posterior credible interval as potential outliers
Step 2: Test Phase
- Refit the model excluding deleterious outlier data points using a truncated negative binomial distribution
- Generate new theoretical data distributions from the second fitted model
- Test all observed read counts against these distributions using a user-selected false positive rate
Table 2: ppcseq Implementation Parameters
| Parameter | Function | Default Setting |
|---|---|---|
| Formula | Defines the experimental design model. | ~ Label (example) |
| Sample | Specifies the sample identifier column. | .sample |
| Transcript | Identifies the gene/transcript column. | .symbol |
| Abundance | Specifies the count data column. | .value |
| Significance | Indicates the statistical significance column. | PValue |
| False Positive Rate | Controls the percentage of false positive genes. | 5% |
| Inference Method | Selects between MCMC sampling or variational Bayes. | approximate_posterior_inference = FALSE |
The following diagram illustrates the iterative outlier detection workflow implemented in ppcseq:
Installation and Practical Usage
ppcseq is implemented as an R package available through Bioconductor. For Linux systems, multi-threading can be enabled by creating specific configuration files to share computation across multiple cores [26]. The basic implementation code structure is as follows:
Iterative Leave-One-Out (iLOO) Cross-Validation
Conceptual Framework
While not directly applied to RNA-Seq outlier detection in the searched literature, Iterative Leave-One-Out (iLOO) cross-validation represents a powerful approach that could be adapted for this purpose. Traditional LOOCV involves creating as many folds as there are data points, with each observation serving once as a single-point test set while all remaining observations form the training set [38]. In the context of Bayesian outlier detection, an iterative approach could be developed where:
- Models are repeatedly fitted with each data point excluded
- Posterior predictive distributions are generated from each reduced model
- The omitted data point is tested against its corresponding predictive distribution
- The process iterates until convergence or all points have been evaluated
Theoretical Advantages for RNA-Seq Data
The adaptation of iLOO principles to RNA-Seq analysis offers several theoretical benefits:
- Minimal Bias: The training set size (n-1) is almost as large as the full dataset (n), making performance estimates closely approximate true model performance [38].
- Maximum Data Utilization: Every observation serves as both training and test data, crucial for small-sample RNA-Seq studies.
- Comprehensive Assessment: Each data point can be evaluated for its influence on model parameters and its consistency with the model.
The following diagram illustrates how iLOO principles could be adapted for probabilistic outlier detection:
Comparative Analysis of Performance
Quantitative Assessment of ppcseq
Application of ppcseq to publicly available datasets reveals significant impacts of outliers on differential expression analysis. The method identified that from 3 to 10 percent of differentially abundant transcripts across algorithms and datasets had statistics inflated by the presence of outliers [27]. This inflation can lead to incorrect biological interpretations and affect downstream analyses such as gene enrichment studies.
Table 3: Performance Comparison of Outlier Detection Methods
| Method | Theoretical Basis | Outlier Detection Approach | Advantages | Limitations |
|---|---|---|---|---|
| ppcseq | Bayesian negative binomial regression | Posterior predictive checks with iterative refinement | - Probabilistic framework- Controls false positives- Identifies specific outlier points | - Computationally intensive- Requires Bayesian expertise |
| OUTRIDER | Negative binomial model with autoencoder | Deviation from expected expression based on autoencoder reconstruction | - Incorporates confounder control- Specifically designed for RNA-Seq | - Complex implementation- Relies on artificial noise injection |
| rPCA (PcaGrid) | Robust principal component analysis | Distance from robust principal components in multivariate space | - 100% sensitivity/specificity in tests- Objective detection- Fast computation | - Does not use probabilistic framework- May miss specific count outliers |
| Classical PCA | Standard principal component analysis | Visual inspection of PCA biplots for sample clustering | - Simple implementation- Widely available | - Subjective interpretation- Sensitive to outliers- No statistical justification |
Integration with Existing RNA-Seq Analysis Pipelines
Both ppcseq and iLOO approaches can be integrated into standard RNA-Seq analysis workflows:
- Quality Control and Normalization: Standard preprocessing of raw count data
- Differential Expression Analysis: Initial testing using established methods (e.g., DESeq2, edgeR)
- Outlier Detection: Application of ppcseq or iLOO to identify problematic transcripts/samples
- Model Refinement: Re-analysis excluding or downweighting identified outliers
- Biological Interpretation: Functional analysis of robust differentially expressed genes
The Scientist's Toolkit: Essential Research Reagents
Table 4: Key Research Reagents and Computational Tools
| Item | Function/Application | Implementation Notes |
|---|---|---|
| ppcseq R Package | Probabilistic outlier detection for RNA-Seq data | Available through Bioconductor; requires R installation and Stan backend [26]. |
| Stan Computational Framework | Bayesian statistical modeling and computation | Provides Hamiltonian Monte Carlo sampling and variational inference for posterior estimation [27]. |
| Housekeeping Gene Set | Reference for inferring sequencing depth effects | Curated set of highly conserved genes used in ppcseq for normalization [27]. |
| RNA-Seq Count Matrix | Input data for outlier detection | J × N matrix where J = genes and N = samples; should be in tidy format for ppcseq [26]. |
| High-Performance Computing Resources | Enable computationally intensive Bayesian inference | Multi-core processors and sufficient RAM for large datasets; essential for practical application. |
Probabilistic and Bayesian frameworks represent a significant advancement in outlier detection for RNA-Seq data analysis. The ppcseq method provides a rigorous, probabilistic approach to identifying transcripts with outlier data points that do not follow the expected negative binomial distribution, addressing a critical gap in current bioinformatics workflows [27]. While Iterative Leave-One-Out cross-validation remains less explored in this specific context, its principles offer promising avenues for future methodological development.
The integration of these approaches into standard RNA-Seq analysis pipelines will enhance the reliability of differential expression results and subsequent biological interpretations. As RNA-Seq technologies continue to evolve and dataset sizes increase, the development of computationally efficient yet statistically rigorous outlier detection methods will remain an important area of research in bioinformatics and computational biology.
The analysis of RNA sequencing (RNA-seq) data, particularly at the single-cell level (scRNA-seq), has revolutionized our ability to study gene expression and cellular heterogeneity [39]. A critical application of this technology is the identification of outlier events—samples or gene expressions that significantly deviate from the expected pattern. In the context of rare disease research and drug development, detecting these outliers is paramount for identifying pathogenic mutations, understanding disease mechanisms, and discovering novel therapeutic targets [1] [7]. Outliers can arise from technical artifacts, such as those introduced during multi-step library preparation, or represent true biological phenomena, such as the aberrant splicing caused by mutations in spliceosome components [7] [40]. This protocol provides a detailed, step-by-step framework for implementing robust outlier detection methods, from initial data preprocessing to the application of advanced algorithms, framed within the broader research objective of developing reliable diagnostic and research tools.
Data Preprocessing and Quality Control
From Raw Sequencing Data to Count Matrices
The initial stage of any RNA-seq analysis involves converting raw sequencing reads into a structured gene expression matrix. This process, often performed on high-performance computing clusters, involves several steps [41]:
- Read Alignment or Pseudo-alignment: Sequencing reads (typically in FASTQ format) must be mapped to a reference genome or transcriptome. Splice-aware aligners like STAR are commonly used for alignment-based workflows. Alternatively, for increased speed and efficiency, especially with large sample sizes, pseudo-alignment tools such as Salmon or kallisto can be employed. These tools probabilistically assign reads to transcripts without performing base-level alignment [41].
- Quantification and Count Matrix Generation: The mapped reads are then quantified to estimate transcript or gene abundance. Tools like Salmon and RSEM are designed to handle the uncertainty inherent in assigning reads to transcripts of origin, particularly for genes with multiple isoforms. The final output is a count matrix, where rows represent genes, columns represent samples or cells, and each value indicates the abundance of a specific gene in a specific sample [41].
Automated pipelines, such as the nf-core/rnaseq Nextflow workflow, can integrate these steps (e.g., STAR alignment followed by Salmon quantification) to ensure reproducibility and comprehensive quality control (QC) [41].
Quality Control of Samples and Cells
Before analysis, rigorous QC is essential to filter out low-quality samples or cells that could be mistaken for biological outliers or confound downstream analysis. For both bulk and single-cell RNA-seq data, QC is primarily based on a few key metrics, which should be assessed jointly rather than in isolation [42].
Table 1: Key Quality Control Metrics for RNA-seq Data
| QC Metric | Description | Indication of Low Quality |
|---|---|---|
| Count Depth | Total number of counts per cellular barcode or sample. | A very low count depth may indicate an empty droplet or a dead cell; an unexpectedly high count depth may signal a doublet (multiple cells) [42]. |
| Number of Genes | The number of genes detected per barcode or sample. | A low number suggests a poor-quality cell where mRNA has been degraded or lost [42]. |
| Mitochondrial Count Fraction | The fraction of counts originating from mitochondrial genes. | A high fraction is a hallmark of cells undergoing apoptosis or suffering from broken membranes, as cytoplasmic mRNA leaks out [42]. |
The workflow for data preparation and quality control is summarized in the diagram below.
Algorithm Application for Outlier Detection
Once a high-quality count matrix is obtained, the next step is to apply statistical algorithms to identify outliers. The choice of algorithm depends on the type of outlier being investigated.
Detecting Outlier Samples with Robust Principal Component Analysis (rPCA)
High-dimensional data with small sample sizes, common in RNA-seq studies, makes accurate outlier detection challenging. Visual inspection of classical PCA (cPCA) biplots is a common but subjective method. Robust PCA (rPCA) provides an objective and statistically sound alternative [40].
- Principle: rPCA methods, such as PcaGrid and PcaHubert, are designed to be resistant to the influence of outliers. They first fit the majority of the data and then flag data points that deviate significantly from this robust pattern [40].
- Implementation: The
rrcovR package provides functions for multiple rPCA algorithms. Studies have shown that PcaGrid achieves high sensitivity and specificity in detecting outlier samples in RNA-seq data, even with varying degrees of divergence from the baseline [40]. - Application: After generating the count matrix and performing basic normalization, researchers can apply an rPCA function like
PcaGrid(). Samples identified as outliers by these methods can then be scrutinized for potential technical failures or, if biologically justified, removed to improve downstream differential expression analysis [40].
Detecting Aberrant Splicing Events with FRASER
For identifying aberrant splicing outliers linked to rare diseases, specialized tools like FRASER (Find RAre Splicing Events in RNA-seq) are highly effective [7] [43].
- Principle: FRASER models multiple splicing metrics, including alternative acceptor/donor usage (ψ5 and ψ3) and splicing efficiency (θ), which can detect intron retention—a common pathogenic event often missed by other methods [43].
- Handling Confounders: A key strength of FRASER is its integrated approach to controlling for widespread technical and biological confounders (e.g., batch effects, RNA integrity) using a denoising autoencoder to estimate a low-dimensional latent space. This step is crucial for maintaining sensitivity [43].
- Statistical Testing: Unlike methods that rely on arbitrary z-score cutoffs, FRASER uses a beta-binomial count-based model to test for significant outlier events, providing false discovery rate (FDR) control and reducing the number of spurious calls [43].
Table 2: Comparison of Outlier Detection Algorithms
| Algorithm | Primary Use Case | Key Features | Considerations |
|---|---|---|---|
| rPCA (e.g., PcaGrid) | Detecting outlier samples in a dataset [40]. | Objective, robust to outliers, suitable for high-dimensional data with small sample sizes. | Identifies outlier samples but does not pinpoint the specific genes or splicing events causing the outlier signal. |
| FRASER | Detecting aberrant splicing events in individual samples [43]. | Captures alternative splicing and intron retention; controls for confounders; provides FDR-controlled p-values. | Requires a cohort of samples for comparative analysis; computationally intensive for very large cohorts. |
| OutSingle | Detecting outlier gene expression in a sample cohort [1]. | Fast, log-normal model with SVD-based confounder control; can also be used for artificial outlier injection. | Relies on a log-normal assumption for count data, which may not always be optimal for very low counts. |
The following diagram illustrates the logical workflow for applying these algorithms after quality control.
The Scientist's Toolkit: Research Reagent Solutions
Successful implementation of this protocol relies on a combination of software tools, reference data, and computational resources. The following table details the essential components.
Table 3: Essential Research Reagents and Tools for RNA-seq Outlier Analysis
| Item Name | Type | Function/Brief Explanation | Example/Reference |
|---|---|---|---|
| Reference Genome & Annotation | Data | Essential for aligning reads and assigning them to genomic features. | GENCODE human annotation (e.g., release 28) [43]; Ensembl (e.g., GRCm38/mm10 for mouse) [40]. |
| Alignment/Pseudo-alignment Tool | Software | Maps sequencing reads to a reference to determine their origin. | STAR (splice-aware aligner) [41]; Salmon or kallisto (pseudo-aligners for fast quantification) [41]. |
| Quantification Tool | Software | Estimates transcript/gene abundance from mapped reads. | Salmon [41]; RSEM [41]. |
| R/Bioconductor Environment | Software/Platform | Primary environment for statistical analysis and visualization of genomic data. | Packages: rrcov (for rPCA) [40], FRASER [43], limma (for differential expression) [41]. |
| High-Performance Computing (HPC) | Infrastructure | Necessary for computationally intensive steps like read alignment and processing large datasets. | University clusters (e.g., Harvard's Cannon) [41]; Cloud computing environments (AWS, Google Cloud). |
| Stranded RNA-seq Library Kit | Wet-lab Reagent | Determines whether the library preparation preserves the strand information of the RNA transcript, which is critical for accurate quantification. | Kits are specified during data preparation (e.g., in nf-core sample sheet as "strandedness") [41]. |
Case Study & Experimental Protocol
Case Study: Diagnosing Minor Spliceopathies
A compelling application of this workflow is in diagnosing rare "spliceopathies." A 2025 study analyzed whole-blood RNA-seq data from 385 individuals from rare-disease consortia [7]. The researchers used FRASER to identify splicing outliers across the transcriptome. They specifically looked for a pattern of excess intron retention outliers in minor intron-containing genes (MIGs). This targeted analysis successfully identified five individuals with this signature. Subsequent genetic analysis revealed that all five harbored rare, bi-allelic variants in components of the minor spliceosome (four in RNU4ATAC and one in RNU6ATAC), leading to a molecular diagnosis [7]. This case demonstrates how a hypothesis-free, transcriptome-wide outlier approach can uncover novel gene-disease associations and diagnose conditions that are phenotypically heterogeneous and difficult to identify through genetic analysis alone.
Detailed Protocol for an rPCA Outlier Detection Experiment
Objective: To identify and remove technical outlier samples from an RNA-seq dataset prior to differential expression analysis.
Materials:
- A high-quality count matrix (genes x samples) after initial QC.
- R statistical environment with the
rrcovpackage installed.
Procedure:
- Data Input and Preparation: Load the count matrix into R. Perform a variance-stabilizing transformation (e.g., log-transformation after adding a pseudocount) or work with normalized counts (e.g., TPM or FPKM) to ensure the analysis is not dominated by a few highly expressed genes.
- Apply Robust PCA: Execute the
PcaGrid()function from therrcovpackage on the transformed data matrix. - Outlier Identification: The
PcaGridmodel will assign an outlier flag to each sample. Extract the list of samples flagged as outliers. - Outlier Evaluation: Critically evaluate each flagged sample. Re-examine its QC metrics (count depth, number of genes, mitochondrial fraction) and any available metadata (e.g., batch information, RNA integrity number) to determine if the outlier status is likely due to a technical issue.
- Data Filtering (Conditional): If an outlier sample is deemed technically compromised, remove it from the count matrix. If it is a valid biological outlier, it should be retained, but its potential impact on downstream results should be acknowledged.
- Downstream Analysis: Proceed with differential expression testing (e.g., using
limma) or other analyses on the filtered dataset.
Validation: The performance of this outlier removal step can be validated by comparing the results of differential expression analysis before and after outlier removal against a set of genes validated by an orthogonal method, such as quantitative RT-PCR (qRT-PCR) [40].
Sample Size and Statistical Power in Experimental Design
Appropriate sample size is a critical determinant of success in RNA-seq studies, directly impacting the reliability of outlier detection and all subsequent biological interpretations.
Empirical Sample Size Recommendations for Bulk RNA-seq
Recent large-scale empirical studies in murine models provide concrete guidance for bulk RNA-seq experimental design. Evidence shows that experiments with a sample size (N) of 4 or fewer are highly misleading due to high false positive rates and failure to discover genes identified in larger cohorts [44].
Table 1: Sample Size Impact on Bulk RNA-seq Outcomes (Murine Models)
| Sample Size (N) | False Discovery Rate (FDR) | Sensitivity | Practical Recommendation |
|---|---|---|---|
| N ≤ 4 | High (>50% in some tissues) | Low; misses many true discoveries | Highly unreliable; fails to recapitulate true signature |
| N = 5 | Remains elevated | Fails to recapitulate full signature | Inadequate for reliable results |
| N = 6-7 | Consistently decreases to <50% | Increases above 50% | Minimum requirement for 2-fold expression differences |
| N = 8-12 | Significantly better, tapers to lower levels | Markedly improved; ~50% median sensitivity attained by N=8 | Significantly better; optimal range for many studies |
| N = 30 | Minimal | Near maximum | Gold standard benchmark; captures true biological effects |
Analysis reveals that increasing the fold-change cutoff is not an effective substitute for adequate sample size, as this strategy inflates effect sizes and substantially reduces detection sensitivity [44]. For a 2-fold expression difference cutoff, an N of 6-7 is required to consistently decrease the false positive rate below 50% and increase detection sensitivity above 50%. However, "more is always better" for both metrics, with N=8-12 performing significantly better in recapitulating results from the full N=30 experiment [44].
Sample Considerations for Single-Cell RNA-seq
For single-cell RNA-seq (scRNA-seq), the sample size consideration involves both the number of biological replicates and the number of cells sequenced per sample. While specific cell number recommendations are highly dependent on the biological context and heterogeneity of the system, scRNA-seq requires specialized computational tools to address its characteristic noisy, high-dimensional, and sparse data [45]. The choice between full-length transcript protocols (e.g., Smart-Seq2) and 3'/5' end counting protocols (e.g., Drop-Seq, 10x Genomics) also impacts the analytical goals achievable, with full-length methods being superior for isoform usage analysis and detecting low-abundance genes [45].
Tool Selection Framework for RNA-seq Analysis
Selecting appropriate bioinformatics tools requires matching the tool's capabilities to your experimental design, analytical goals, and sample type.
Differential Splicing and Outlier Detection Tools
For alternative splicing analysis, tools can be categorized by their statistical approaches and the level of biological features they analyze.
Table 2: Differential Splicing and Outlier Detection Tool Categories
| Tool Category | Statistical Foundation | Level of Analysis | Representative Tools | Best Application Context |
|---|---|---|---|---|
| Parametric Methods | Generalized Linear Models (GLM), Negative Binomial distribution | Exon, transcript | DEXSeq, DSGseq, JunctionSeq | Differential exon/transcript usage with complex designs |
| Non-Parametric Methods | Rank-based statistics | Splicing events | Certain tools from benchmarking reviews | When distribution assumptions are violated |
| Probabilistic Methods | Bayesian frameworks, probabilistic modeling | Transcript, splicing events | rMATS, FRASER, FRASER2 | Splicing event analysis with uncertainty quantification |
| Outlier Detection | Expression distribution comparison | Gene expression, splicing | FRASER, OUTRIDER, CARE | Rare disease diagnostics, tumor biomarker discovery |
Tools with high citation frequency and continued developer maintenance, such as DEXSeq and rMATS, are generally recommended for prospective researchers [46]. FRASER and FRASER2 have emerged as particularly valuable for identifying splicing outliers in rare disease diagnostics [7] [9].
End-to-End scRNA-seq Analysis Platforms
For single-cell RNA-seq analysis, integrated platforms can streamline the analytical workflow, especially for researchers without extensive programming expertise.
Table 3: Integrated scRNA-seq Analysis Platforms (2025)
| Platform | Best For | Key Features | Usability | Cost Model |
|---|---|---|---|---|
| Nygen | AI-powered insights, no-code workflows | Automated cell annotation, batch correction, Seurat/Scanpy integration | No-code interface, intuitive dashboards | Free-forever tier; Subscription from $99/month |
| BBrowserX | Large-scale dataset analysis | BioTuring Single-Cell Atlas access, customizable plots, GSEA | No-code interface, AI-assisted | Free trial; Pro version requires custom pricing |
| Omics Playground | Multi-omics collaboration | Handles bulk & scRNA-seq, pathway analysis, drug discovery | Accessible for multi-omics researchers | Free trial (limited size); contact for plans |
| Partek Flow | Modular, scalable workflows | Drag-and-drop workflow builder, local and cloud deployment | Flexible workflow management | Free trial; Subscriptions from $249/month |
| Pluto Bio | Team collaboration & reproducibility | Real-time collaboration, interactive reports, cross-dataset exploration | Collaborative interface | Free trial (limited size); contact for plans |
| Loupe Browser | 10x Genomics data visualization | Integrates with 10x pipelines, spatial analysis, t-SNE/UMAP | Desktop visualization | Free (requires 10x Genomics data) |
These platforms help overcome computational barriers by offering user-friendly interfaces for complex analyses like clustering, dimensionality reduction (UMAP, t-SNE), and differential expression analysis [47].
Experimental Protocols and Workflows
Bulk RNA-seq Differential Expression Analysis
The standard bulk RNA-seq workflow progresses from raw data to biological interpretation through several well-established stages.
Protocol 1: Bulk RNA-seq Differential Expression with nf-core/rnaseq
This protocol utilizes the nf-core/rnaseq workflow for reproducible, high-quality processing of bulk RNA-seq data [41].
Input Data Preparation:
- Prepare a sample sheet in nf-core format with columns:
sample,fastq_1,fastq_2, andstrandedness. - Collect paired-end RNA-seq FASTQ files. Avoid single-end layouts as paired-end reads provide more robust expression estimates [41].
- Obtain reference genome (FASTA) and annotation (GTF) files appropriate for your species.
- Prepare a sample sheet in nf-core format with columns:
Workflow Execution:
- Use the "STAR-salmon" option in nf-core/rnaseq for comprehensive quality control and accurate quantification.
- This option performs spliced alignment with STAR, projects alignments to the transcriptome, and performs alignment-based quantification with Salmon.
- Execute the workflow on a high-performance computing cluster or cloud environment.
Differential Expression Analysis:
- Use the generated gene-level count matrix for statistical analysis in R.
- Employ established packages like
limma,DESeq2, oredgeRto identify differentially expressed genes. - Perform multiple-testing correction and interpret results in biological context.
Clinical RNA-seq Outlier Detection for Rare Diseases
RNA-seq outlier analysis has emerged as a powerful diagnostic approach for rare Mendelian diseases, with specific clinical validation frameworks now available [48].
Protocol 2: Diagnostic RNA-seq Outlier Analysis
This protocol is adapted from clinically validated frameworks for identifying pathogenic outliers in rare disease cases [48].
Sample Selection and Processing:
- Tissue Selection: Use clinically accessible tissues (CATs) such as peripheral blood mononuclear cells (PBMCs) or fibroblasts. Assess expression of relevant disease genes in the chosen tissue, as approximately 80% of intellectual disability and epilepsy panel genes are expressed in PBMCs [9].
- RNA Extraction: Extract RNA using quality-controlled kits (e.g., RNeasy mini kit) with genomic DNA removal. Assess RNA integrity using appropriate methods (e.g., Qubit RNA HS assay).
- Library Preparation: Use stranded mRNA library prep kits. For blood samples, employ ribosomal RNA depletion kits (e.g., Illumina Stranded Total RNA Prep with Ribo-Zero Plus) to improve mRNA coverage.
Sequencing and Data Generation:
- Sequence on Illumina platforms (NovaSeqX) to a target depth of 150 million paired-end reads (150 bp) per sample.
- Include positive and negative control samples in each run for quality monitoring.
Bioinformatic Processing:
- Alignment: Align FASTQ data to reference genome (GRCh38) using STAR aligner.
- Quantification: Quantify gene expression using RNA-SeQC and isoform-level expression with RSEM.
- Quality Control: Perform comprehensive QC using FastQC and verify sample identity by comparing RNA-seq-called variants with DNA sequencing data.
Outlier Detection:
- Establish Reference Ranges: Generate gene and junction expression distributions from negative control samples (30+ recommended) processed with the same pipeline.
- Expression Outliers: Identify genes with expression levels falling outside the reference range (e.g., beyond mean ± 3 SD or using IQR methods).
- Splicing Outliers: Use specialized tools (FRASER, FRASER2) to detect aberrant splicing patterns through intron retention or splice junction ratio abnormalities [7].
Clinical Interpretation:
- Integrate RNA outliers with DNA sequencing findings.
- Classify variants based on ACMG guidelines with RNA evidence.
- Generate clinical reports for diagnostic purposes.
Comparative RNA Expression Analysis for Rare Cancers
The Comparative Analysis of RNA Expression (CARE) approach identifies therapeutic targets by comparing tumor expression profiles to large compendiums of existing tumor data [3].
Protocol 3: CARE Analysis for Oncology Applications
Data Collection:
- Obtain tumor RNA-seq data from the patient's sample.
- Access a large compendium of uniformly processed tumor RNA-seq profiles (10,000+ samples ideal).
Comparative Analysis:
- Pan-Cancer Analysis: Compare the patient's profile to the entire tumor compendium to identify extreme expression outliers across all cancer types.
- Pan-Disease Analysis: Create personalized comparator cohorts including: (1) same diagnosis tumors, (2) molecularly similar tumors (first-degree neighbors), and (3) expanded molecularly similar tumors (second-degree neighbors).
Target Identification:
- Identify overexpression outliers in potentially actionable genes (e.g., receptor tyrosine kinases, cell cycle regulators).
- Perform pathway enrichment analysis to identify coordinately upregulated biological pathways.
- Nominate targeted therapies based on overexpression patterns (e.g., CDK4/6 inhibitors for CCND2 overexpression, pazopanib for FGFR/PDGF pathway activation) [3].
Essential Research Reagents and Materials
Table 4: Key Research Reagents for RNA-seq Workflows
| Reagent / Material | Function | Application Examples |
|---|---|---|
| RNeasy Mini Kit (Qiagen) | RNA extraction with gDNA removal | High-quality RNA isolation from cells and tissues [48] |
| Illumina Stranded mRNA Prep Kit | Library preparation from high-quality RNA | mRNA sequencing from fibroblasts, LCLs [48] |
| Illumina Stranded Total RNA Prep with Ribo-Zero Plus | rRNA and globin RNA depletion | Whole-blood RNA sequencing [48] |
| PAXgene Blood RNA Tubes | RNA stabilization in whole blood | Clinical blood sample collection and storage [48] |
| Cycloheximide (CHX) | Nonsense-mediated decay (NMD) inhibition | Stabilization of PTC-containing transcripts for detection [9] |
| Unique Molecular Identifiers (UMIs) | Correction for PCR amplification biases | Quantitative scRNA-seq protocols [45] |
| GENCODE Annotations | Reference transcriptome | Standardized genome alignment and quantification [48] |
Effective RNA-seq analysis requires careful matching of experimental design, sample size, and analytical tools to specific research questions. Robust sample sizes (N≥8) for bulk RNA-seq, appropriate tool selection based on analytical goals, and implementation of validated protocols for specific applications like rare disease diagnostics or oncology are essential for generating reliable, interpretable results. The continued development of standardized workflows and validated clinical frameworks will further enhance the utility of RNA-seq across both basic research and clinical applications.
Solving Common Challenges in RNA-Seq Outlier Detection
In RNA sequencing (RNA-seq) studies, biological replicates are crucial for capturing natural biological variation and ensuring robust statistical inference. However, due to constraints in cost, sample availability, or ethical considerations—especially in studies involving mice or human clinical samples—researchers are often limited to small sample sizes (N) [44]. Underpowered experiments with too few replicates risk both false positives (type 1 errors) and false negatives (type 2 errors), and can systematically overstate effect sizes, a phenomenon known as the "winner's curse" [44]. Furthermore, the high-dimensionality of RNA-seq data (thousands of genes measured across few samples) makes the accurate detection of outliers—samples that deviate extremely due to technical artifacts or true biological differences—particularly challenging [40]. This Application Note provides targeted strategies and detailed protocols for mitigating the risks associated with small sample sizes, with a specific focus on robust outlier detection methods that are essential for maintaining data integrity in such settings.
The Impact of Sample Size: Quantitative Evidence from Empirical Data
Determining the appropriate sample size is a critical step in experimental design. A recent large-scale comparative analysis on murine models provides empirical data on how sample size affects key outcomes in RNA-seq experiments [44]. The study used a gold standard of N=30 wild-type versus N=30 heterozygous mice to establish true biological effects, then evaluated the performance of down-sampled subsets.
Table 1: Impact of Sample Size on False Discovery Rate (FDR) and Sensitivity in Murine RNA-Seq (Dchs1 Heterozygotes)
| Sample Size (N per group) | Median False Discovery Rate (FDR) | Median Sensitivity | Key Observations |
|---|---|---|---|
| N = 3 | 28% - 38% (depending on tissue) | Very Low | High variability in FDR across trials (e.g., 10-100% in lung). |
| N = 5 | Decreasing but elevated | Low | Performance is highly unreliable. |
| N = 6 - 7 | Falls below 50% | Rises above 50% | Consistent minimum to control FDR <50% and sensitivity >50%. |
| N = 8 - 12 | Tapers to near zero | Increases towards 100% | Significant improvement; recommended range for reliable results. |
| N = 30 (Gold Standard) | ~0% | ~100% | Captures the true underlying biological effects. |
The data demonstrates that while "more is always better," a sample size of 6-7 is the minimum required to consistently reduce the false positive rate below 50% and raise the sensitivity above 50% for a 2-fold expression difference [44]. The variability in results between trials is particularly high at low N, dropping markedly by N=6. Raising the fold-change cutoff is no substitute for increasing replicates, as this strategy inflates effect sizes and causes a substantial drop in detection sensitivity [44].
Experimental Protocols for Outlier Detection in Small Sample Studies
Accurate outlier detection is paramount in small-sample studies, where a single anomalous sample can disproportionately skew results. The following protocols detail methods for objective outlier sample detection and for identifying aberrantly expressed genes.
Protocol: Outlier Sample Detection using Robust Principal Component Analysis (rPCA)
Principle: Classical PCA (cPCA) is highly sensitive to outliers, which can attract the first components and mask the true variation of the regular observations. Robust PCA methods use robust statistics to first fit the majority of the data and then flag data points that deviate from it, providing an objective detection method superior to visual inspection of cPCA plots [40].
Materials:
- Input Data: A normalized RNA-seq count matrix (e.g., VST, TPM) with genes as rows and samples as columns.
- Software Environment: R statistical software.
- Required R Package:
rrcov(contains functions for rPCA).
Methodology:
- Data Preparation: Begin with a high-quality, normalized count matrix. Filter out genes with zero or very low counts across all samples. Apply a variance-stabilizing transformation (e.g., from DESeq2) or use TPM values for log-transformation.
- Function Application: Apply the
PcaGrid()function from therrcovpackage to the prepared data matrix. The function is well-suited for high-dimensional data with small sample sizes. - Outlier Identification: The
PcaGrid()function will compute robust principal components and assign anorthogonal distanceandscore distancefor each sample. Samples classified as outliers based on these distances are automatically flagged. - Validation and Action: Investigate the flagged outlier samples for potential technical failures (e.g., RNA degradation, low sequencing quality). If a sample is confirmed to be a technical outlier, it should be removed from downstream analysis. Re-run the rPCA on the cleaned dataset to confirm the absence of further outliers.
Notes: The PcaHubert function is another robust alternative available in the same package, though studies note that PcaGrid achieved 100% sensitivity and specificity in tests with positive control outliers and has a lower estimated false positive rate [40].
Protocol: Gene-Level Outlier Detection using OutSingle
Principle: The OutSingle algorithm detects aberrantly expressed genes in a sample-by-sample context. It uses a log-normal model for count data and employs Singular Value Decomposition (SVD) with an Optimal Hard Threshold (OHT) to control for confounders, making it significantly faster and more interpretable than negative-binomial-based methods [1].
Materials:
- Input Data: A raw RNA-seq count matrix (J genes x N samples).
- Software: Python implementation of OutSingle available from GitHub.
Methodology:
- Log-Normal Z-scores: Calculate gene-specific z-scores from log-transformed count data. This step identifies genes that deviate significantly from their typical expression across samples.
- Confounder Control via SVD/OHT: Perform SVD on the z-score matrix. Apply the recently discovered Optimal Hard Threshold (OHT) method to denoise the matrix by discarding non-informative singular values. This step removes variation due to technical or common biological confounders, leaving a residual matrix where true outliers are more prominent.
- Outlier Calling: Genes with absolute z-scores in the residual matrix exceeding a defined threshold (e.g., |Z| > 3) in a given sample are identified as outliers. P-values can be derived from the z-scores and adjusted for multiple testing using the False Discovery Rate (FDR).
Notes: OutSingle is an almost instantaneous method that outperforms the previous state-of-the-art (OUTRIDER) on benchmark datasets with real biological outliers masked by confounders [1]. Its "invertible" procedure also allows for the injection of artificial outliers for benchmarking purposes.
Workflow Visualization and Logical Framework
The following diagram illustrates the integrated workflow for RNA-seq analysis under limited replication, incorporating the critical steps of quality control, outlier detection, and differential expression analysis.
Integrated Workflow for Small-Sample RNA-Seq Analysis
The logical relationship between the challenge of small sample sizes and the corresponding strategic solutions is outlined below.
Logical Framework: Challenges and Strategic Solutions
The Scientist's Toolkit: Research Reagent Solutions
Table 2: Essential Computational Tools for RNA-Seq Analysis with Small N
| Tool / Resource | Function | Application Note |
|---|---|---|
| rrcov R Package | Provides robust statistical methods, including PcaGrid and PcaHubert for outlier sample detection. |
Essential for objective identification of outlier samples in high-dimensional data with small sample sizes [40]. |
| OutSingle Algorithm | Detects aberrantly expressed genes using a log-normal model and SVD/OHT for confounder control. | Offers a fast, interpretable, and powerful alternative to negative-binomial-based methods for gene-level outlier detection [1]. |
| DESeq2 / edgeR | Differential gene expression analysis using negative binomial generalized linear models. | Incorporate robust normalization techniques (median-of-ratios, TMM) to control for library composition and depth [8]. |
| FastQC / MultiQC | Quality control tools for raw sequencing reads and alignment results. | Critical first step to identify technical errors before statistical analysis [8]. |
| OUTRIDER | Detects aberrant expression using an autoencoder to model gene covariation and a negative binomial distribution. | A previously state-of-the-art method that provides a significance-based threshold for outlier calls [49]. |
The implementation of outlier detection methods in RNA-seq analysis presents a fundamental challenge in bioinformatics: balancing analytical precision with computational feasibility. As RNA sequencing transitions from a research tool to a clinical asset for rare disease diagnosis and cancer therapeutics, this balance becomes critical for practical application [7] [9] [3]. Current methodologies must process immense datasets—sometimes exceeding 1 billion reads—while delivering accurate, clinically actionable insights within reasonable timeframes [50]. This application note examines computational strategies that optimize this accuracy-efficiency trade-off, providing structured protocols and benchmarks for researchers and clinical scientists implementing RNA-seq outlier detection.
Computational Challenges in RNA-seq Outlier Detection
The Accuracy-Efficiency Paradox in Transcriptome Analysis
RNA-seq outlier detection encompasses multiple analytical dimensions, including splicing anomalies, expression outliers, and isoform quantification. Each dimension presents distinct computational challenges. Splicing outlier tools like FRASER must evaluate all potential intron excision events across thousands of samples, creating combinatorial complexity [7]. Similarly, expression outlier detection requires comparing expression distributions across genes with vastly different abundance levels, from highly expressed housekeeping genes to rare transcripts present at single-digit counts [2] [50].
The sequencing depth directly influences this complexity, with deeper sequencing revealing more true positives but increasing processing time and memory requirements exponentially [50]. Studies demonstrate that while 50 million reads may suffice for basic differential expression, detection of rare splicing events and low-abundance transcripts can require 200 million to 1 billion reads for reliable identification [50]. This creates substantial computational burdens that must be managed through optimized workflows.
Impact of Analysis Parameters on Performance
Parameter selection dramatically affects both accuracy and processing time. For example, interquartile range (IQR) multipliers for outlier definition create a direct trade-off between sensitivity and runtime. More stringent thresholds (e.g., k=5 versus k=1.5 in Tukey's method) reduce candidate outliers for processing but may miss biologically relevant signals [2]. Similarly, gene annotation complexity influences computational load; comprehensive annotations like AceView cover more junctions but require more processing than simpler references like RefSeq [51].
Experimental Protocols for Balanced RNA-seq Analysis
Protocol 1: Splicing Outlier Detection with FRASER/FRASER2
Purpose: Identify aberrant splicing patterns in rare disease diagnostics while managing computational load. Input: RNA-seq BAM files (whole blood, PBMCs, or fibroblasts) Tools: FRASER or FRASER2 for splicing outlier detection [7]
Step 1: Data Preparation and Quality Control
- Process raw FASTQ files through a standardized alignment workflow (e.g., STAR aligner) to generate BAM files sorted by coordinate.
- Perform quality assessment using FastQC and multiqc. Require Q30 score >85% and sequencing depth appropriate to application (50M reads for initial screening, 200M+ for diagnostic confirmation) [52] [50].
Step 2: Splicing Aberration Analysis
- Run FRASER on aligned BAM files using reference transcriptome (GENCODE recommended).
- Set minimal read count filter at 10-20 reads to reduce noise and computational burden on low-expression genes.
- For rare disease analysis, focus on intron retention outliers in minor intron-containing genes (MIGs) as these often signal spliceosome defects [7].
Step 3: Pattern-Based Prioritization
- Apply transcriptome-wide pattern recognition rather than single-gene outlier approach.
- Prioritize samples showing excess intron retention in MIGs (indicative of minor spliceopathies).
- Use hierarchical clustering to identify samples with similar splicing outlier profiles.
Step 4: Validation and Interpretation
- Confirm computational predictions through Sanger sequencing of cDNA or digital droplet PCR.
- For potential nonsense-mediated decay (NMD) targets, implement cycloheximide treatment to stabilize transcripts [9].
Protocol 2: Expression Outlier Analysis in Cancer Transcriptomics
Purpose: Identify therapeutic targets through expression outlier detection in tumor RNA-seq data. Input: Tumor RNA-seq data (TPM or FPKM normalized) Tools: Comparative Analysis of RNA Expression (CARE) methodology [3]
Step 1: Cohort Selection and Normalization
- Select appropriate comparator cohorts from large-scale repositories (e.g., 11,427 tumor profiles).
- Apply uniform normalization pipeline across all samples to minimize batch effects.
- For rare cancers, include molecularly similar tumors beyond histological classification.
Step 2: Outlier Detection and Pathway Analysis
- Calculate expression Z-scores for each gene relative to comparator cohort.
- Identify extreme overexpression outliers using conservative thresholds (Q3 + 5×IQR).
- Perform pathway enrichment analysis to distinguish driver outliers from passenger events.
Step 3: Target Prioritization
- Prioritize outliers with known druggability (e.g., receptor tyrosine kinases, cell cycle regulators).
- Integrate with DNA mutation data to identify expression outliers without genomic alterations.
- Validate protein-level overexpression via immunohistochemistry when tissue available.
Step 4: Clinical Correlation
- Correlate outlier targets with treatment response data when available.
- For pediatric cancers, consider FDA-approved agents with safety data in relevant age groups.
Quantitative Benchmarks for Computational Workflows
Performance Metrics Across Sequencing Depths
Table 1: Impact of Sequencing Depth on Detection Sensitivity and Computational Requirements
| Sequencing Depth (M reads) | Gene Detection Sensitivity | Splice Junction Detection | Processing Time (CPU hours) | Primary Applications |
|---|---|---|---|---|
| 50 | ~20,000 genes | ~60% of known junctions | 15-20 | Basic differential expression, screening |
| 100 | ~30,000 genes | ~80% of known junctions | 30-40 | Standard diagnostic RNA-seq |
| 200 | ~40,000 genes | ~90% of known junctions | 60-80 | Complex splicing analysis |
| 1000 | ~45,000 genes | ~98% of known junctions | 300-500 | Rare transcript discovery, isoform resolution |
Data adapted from ultra-deep RNA-seq evaluation studies [50] and SEQC consortium findings [51]. Processing time estimates based on typical high-performance computing infrastructure.
Tool Performance Characteristics
Table 2: Computational Profiles of RNA-seq Outlier Detection Methods
| Method | Primary Function | Memory Requirements | Relative Speed | Optimal Dataset Size | Key Applications |
|---|---|---|---|---|---|
| FRASER/FRASER2 | Splicing outlier detection | High | Medium | 100-500 samples | Rare disease diagnostics [7] |
| OUTRIDER | Expression outlier detection | Medium | Fast | 50-1000 samples | Batch effect correction, quality control [9] |
| rMATS | Alternative splicing | Medium | Slow | Small to medium | Differential splicing studies [52] |
| CARE | Expression outlier detection | High | Medium | Any size (uses reference) | Cancer target identification [3] |
Visualization of Computational Workflows
Experimental Design and Analysis Pipeline
RNA-seq Outlier Analysis Workflow
Computational Complexity Decision Framework
Computational Decision Framework
Table 3: Key Research Reagent Solutions for RNA-seq Outlier Detection
| Resource Category | Specific Tools/Reagents | Function | Implementation Considerations |
|---|---|---|---|
| Quality Control | fastp, Trim Galore, FastQC | Adapter trimming, quality assessment | Fastp offers speed advantage; Trim Galore provides integrated QC reports [52] |
| Alignment | STAR, HISAT2, Subread | Read mapping to reference genome | STAR provides sensitive splice junction detection; Subread offers faster processing [51] |
| Splicing Detection | FRASER, FRASER2, rMATS, SpliceWiz | Splicing outlier identification | FRASER2 improves on intron retention detection; rMATS remains optimal for alternative splicing [7] [52] |
| Expression Analysis | OUTRIDER, DESeq2, edgeR | Expression outlier detection, differential expression | OUTRIDER specifically designed for outlier detection; DESeq2/edgeR suited for differential expression [9] [2] |
| NMD Inhibition | Cycloheximide (CHX), Puromycin (PUR) | Stabilization of NMD-sensitive transcripts | CHX demonstrates higher efficacy than PUR in PBMCs and LCLs [9] |
| Reference Annotations | GENCODE, AceView, RefSeq | Transcriptome reference | AceView covers more known genes; GENCODE offers balanced completeness/accuracy [51] |
Managing computational complexity in RNA-seq outlier detection requires thoughtful balancing of analytical depth and processing requirements. As these methods increasingly inform clinical diagnostics and therapeutic development, standardized protocols that maintain this balance become essential. The frameworks presented here provide actionable guidance for implementing efficient yet accurate RNA-seq outlier detection. Future advancements will likely focus on machine learning approaches that further optimize this trade-off, potentially through predictive filtering of likely relevant outliers before full computational analysis. The continuing reduction in sequencing costs will also shift these balances, making currently intensive approaches like ultra-deep sequencing more accessible for routine clinical application.
Distinguishing Technical Outliers from True Biological Variation
In RNA sequencing (RNA-seq) analysis, an "outlier" is defined as an observation that lies outside the overall pattern of a distribution [40]. The challenge of distinguishing technical outliers from true biological variation represents a critical bottleneck in deriving meaningful conclusions from transcriptomic studies. Technical outliers arise from variations in reagents, supplies, instruments, and operators throughout the complex multi-step RNA-seq protocol, while biological outliers may reflect genuine rare biological phenomena or disease states [40]. The high-dimensionality of RNA-seq data with typically few biological replicates makes accurate detection particularly challenging [40]. This application note provides a structured framework and detailed protocols for distinguishing these outlier types, enabling researchers to minimize technical artifacts while preserving biologically relevant findings.
Fundamental Concepts and Implications
Defining Outlier Types in Transcriptomic Data
Technical outliers primarily stem from measurement errors and procedural inconsistencies. Studies have demonstrated that outlier expression values are fully reproducible in independent sequencing experiments, suggesting they should not be automatically dismissed as technical noise [2]. In single-cell RNA-seq, technical variability is further compounded by cell-specific measurement errors related to library size variation and the high frequency of zero counts resulting from technical dropout events [53].
Biological outliers may represent rare but meaningful phenomena, including spontaneous extreme expression in specific individuals [2], or pathogenic variants with trans-acting effects on splicing transcriptome-wide [7] [11]. Research has identified that different individuals can harbor very different numbers of outlier genes, with some individuals showing extreme numbers in only one out of several organs [2]. For example, outlier patterns in minor intron-containing genes can reveal rare genetic disorders known as spliceopathies [7].
Consequences of Misclassification
Misclassifying outlier types has significant implications. Inappropriately removing biological outliers may eliminate meaningful signals, potentially obscuring rare disease mechanisms [7] [11]. Conversely, failing to remove technical outliers can introduce unnecessary variance, reduce statistical power, and compromise downstream analyses including differential expression, co-expression networks, and subtype identification [54] [40]. The presence of unwanted variation has been shown to significantly compromise various downstream analyses, including cancer subtype identification, association between gene expression and survival outcomes, and gene co-expression analysis [54].
Table 1: Characteristics of Technical vs. Biological Outliers
| Feature | Technical Outliers | Biological Outliers |
|---|---|---|
| Origin | Protocol variations, reagent batches, sequencing depth | Genuine biological phenomena, rare cell types, disease states |
| Reproducibility | Not reproducible across independent experiments | Reproducible in biological replicates |
| Expression Patterns | Random across genes | Often occur in co-regulatory modules or pathways |
| Impact | Increases unnecessary variance, reduces statistical power | May reveal important biological mechanisms |
| Recommended Action | Removal or correction | Further investigation and characterization |
Computational Methods for Outlier Detection
Sample-Level Outlier Detection
Robust Principal Component Analysis (rPCA) methods provide objective alternatives to visual PCA inspection for detecting outlier samples. The PcaGrid method has demonstrated 100% sensitivity and specificity in tests using positive control outliers with varying degrees of divergence [40]. Compared to classical PCA, rPCA methods are less influenced by outlying observations, preventing the first components from being attracted toward outlying points, thus capturing the variation of regular observations more reliably [40].
For scRNA-seq data, the ZILLNB framework integrates zero-inflated negative binomial regression with deep generative modeling to address technical variability while preserving biological variation [53]. This approach employs an ensemble architecture combining Information Variational Autoencoder and Generative Adversarial Networks to learn latent representations at cellular and gene levels, systematically decomposing technical variability from intrinsic biological heterogeneity [53].
Gene Expression Outlier Detection
The OutSingle algorithm provides an efficient method for detecting outliers in RNA-seq gene expression data using a log-normal approach for count modeling and singular value decomposition with optimal hard threshold for confounder control [1]. This method offers advantages in computational efficiency compared to negative binomial distribution-based models while effectively handling outliers masked by confounding effects [1].
For splicing outlier detection, FRASER and FRASER2 identify aberrant splicing events transcriptome-wide [7] [11]. These methods can detect individuals with excess intron retention outliers in minor intron-containing genes, revealing rare genetic disorders even when causal variants are in non-coding regions that may be deprioritized by standard analysis pipelines [7].
Normalization and Batch Effect Correction
The RUV-III method with pseudo-replicates of pseudo-samples provides a comprehensive approach to remove unwanted variation due to library size, tumor purity, and batch effects [54]. This strategy creates pseudo-samples derived from small groups of samples that are roughly homogeneous with respect to unwanted variation and biology, enabling estimation and removal of technical artifacts [54].
Table 2: Computational Methods for Outlier Detection and Processing
| Method | Application | Key Features | Reference |
|---|---|---|---|
| PcaGrid | Sample outlier detection | 100% sensitivity/specificity in validation tests | [40] |
| OutSingle | Gene expression outlier detection | Log-normal approach with SVD/OHT confounder control | [1] |
| FRASER/FRASER2 | Splicing outlier detection | Identifies transcriptome-wide aberrant splicing patterns | [7] [11] |
| RUV-III with PRPS | Normalization/batch correction | Handles library size, tumor purity, and batch effects | [54] |
| ZILLNB | scRNA-seq denoising | ZINB regression with deep generative modeling | [53] |
Experimental Protocols
Protocol 1: Systematic Outlier Detection Workflow
This protocol provides a comprehensive approach for distinguishing technical from biological outliers in bulk RNA-seq data.
Step 1: Initial Quality Control and Normalization
- Begin with raw count data. Calculate quality metrics including library sizes, gene counts, and proportion of zeros.
- Perform initial normalization using the RUV-III method with PRPS to account for library size variations [54]. For studies without known factors of unwanted variation, use the standard median-by-ratio normalization.
- Generate relative log expression (RLE) plots; deviations from zero indicate potential unwanted variation [54].
Step 2: Sample-Level Outlier Detection
- Apply robust PCA (PcaGrid method) to detect outlier samples [40].
- Calculate distances in the robust PCA space and flag samples with Mahalanobis distances exceeding the 95% quantile of the Chi-square distribution.
- Compare with classical PCA to identify samples where influence differs between methods.
Step 3: Gene Expression Outlier Detection
- Implement the OutSingle algorithm to identify outlier gene expression values [1].
- Use a conservative threshold (k=5 in Tukey's method, corresponding to ~7.4 standard deviations in normal distribution) to minimize false positives [2].
- For splicing analysis, apply FRASER/FRASER2 to detect aberrant splicing outliers [7].
Step 4: Distinguish Technical from Biological Outliers
- Technical Assessment: Check for associations with known technical covariates (library size, batch, RNA quality metrics).
- Biological Consistency: Evaluate if outliers cluster in specific pathways or co-regulated modules [2].
- Reproducibility Check: If possible, check if outlier patterns replicate in independent samples.
Step 5: Decision and Documentation
- Remove samples with clear technical artifacts.
- Retain and annotate biological outliers for further investigation.
- Document all decisions and thresholds for reproducibility.
Protocol 2: Biological Validation of Suspected Outliers
This protocol outlines experimental approaches to confirm biological significance of suspected outliers.
Expression Validation
- For gene expression outliers, perform quantitative RT-PCR on original RNA samples.
- For splicing outliers, conduct RT-PCR with gel electrophoresis to visualize alternative isoforms.
Replication Studies
- Process independent replicates from the same biological source.
- For patient samples, analyze multiple tissues when available [2].
Functional Characterization
- For pathway-enriched outliers, perform relevant functional assays.
- For disease-associated outliers, consider model system validation.
The Scientist's Toolkit
Table 3: Research Reagent Solutions for Outlier Investigation
| Reagent/Resource | Function | Application Context |
|---|---|---|
| RU V-III with PRPS | Normalization method removing library size, tumor purity, and batch effects | Bulk RNA-seq studies with complex confounding factors [54] |
| FRASER/FRASER2 | Splicing outlier detection algorithms | Identifying rare diseases with trans-acting splicing effects [7] [11] |
| PcaGrid | Robust PCA for sample outlier detection | Objective outlier sample identification in high-dimensional data [40] |
| OutSingle | Gene expression outlier detection with SVD | Rapid identification of aberrant expression masked by confounders [1] |
| ZILLNB | Deep learning-based denoising for scRNA-seq | Addressing technical noise and dropout in single-cell data [53] |
Analytical Framework for Decision Making
The decision framework above provides a systematic approach for outlier classification. When applying this framework, consider that some biological outlier patterns may represent spurious findings if they are not reproducible or lack biological context [2]. Studies of extreme outlier gene expression have shown that most over-expression is not inherited but appears sporadically, which may reflect "edge of chaos" effects in gene regulatory networks [2]. True biological outliers often cluster in specific pathways - for example, outliers in minor spliceosome components can indicate rare genetic disorders [7].
Distinguishing technical artifacts from genuine biological variation remains challenging yet essential in RNA-seq analysis. The integration of robust computational methods, systematic validation protocols, and structured decision frameworks enables researchers to confidently identify technical outliers while preserving biologically meaningful variation. As transcriptomic technologies evolve and study complexity increases, these approaches will become increasingly critical for deriving accurate biological insights from RNA-seq data, particularly in rare disease research and precision medicine applications.
In RNA sequencing (RNA-seq) analysis, the accurate detection of outliers is a critical step that directly impacts the reliability of downstream differential expression results. Outliers—samples or observations that deviate significantly from the majority of the data—can arise from technical artifacts, sample processing errors, or genuine biological variation. The process of identifying these outliers relies heavily on the selection of appropriate statistical thresholds and cutoffs, which balance sensitivity against the risk of false positives. This application note provides a structured overview of the primary methodologies for threshold selection in RNA-seq outlier detection, complete with quantitative guidelines, experimental protocols, and visual workflows to support researchers in implementing these approaches effectively.
Thresholding Methodologies and Quantitative Guidelines
The selection of statistical thresholds varies by methodological approach, each with distinct strengths and considerations. The table below summarizes the primary frameworks, their associated parameters, and typical applications.
Table 1: Key Thresholding Methods for Outlier Detection in RNA-Seq
| Method Category | Specific Method/Algorithm | Key Parameters & Thresholds | Statistical Equivalents & Notes | Primary Application Context |
|---|---|---|---|---|
| Probabilistic & Model-Based | iLOO (Iterative Leave-One-Out) [55] | ( p(y_{g,k}) < 1/\hat{d} ), where (\hat{d}) is the estimated sequencing depth. | Threshold is sample-specific, based on the minimum empirical probability of observing a read. | Univariate outlier detection for individual read counts within a treatment group. |
| OUTRIDER (Outlier in RNA-Seq Finder) [49] | FDR-adjusted p-value (e.g., < 0.05 or 0.01). | Uses a negative binomial model after autoencoder-based normalization for confounders. | Identifying aberrantly expressed genes in rare disease diagnostics, correcting for technical covariation. | |
| Robust Statistics & IQR-Based | Tukey's Fences [2] | Extreme outlier: Value > Q3 + 5 × IQR or < Q1 - 5 × IQR. | For a normal distribution, ~7.4 standard deviations from the mean (P ≈ 1.4 × 10⁻¹³). | Conservative, non-parametric identification of extreme expression values in population-level transcriptome data. |
| Moderate outlier: Value > Q3 + 1.5 × IQR or < Q1 - 1.5 × IQR. | For a normal distribution, ~2.7 standard deviations from the mean (P ≈ 0.069). | General outlier screening where a less stringent cutoff is acceptable. | ||
| Sample-Level Detection | rPCA (PcaGrid) [40] | Statistical cutoff based on robust Mahalanobis distance and Q-statistic. | Objective, statistically justified cutoff replacing subjective visual inspection of PCA plots. | Multivariate detection of outlier samples in high-dimensional data with small sample sizes. |
Experimental Protocols for Key Methodologies
Protocol: Iterative Leave-One-Out (iLOO) for Count Data
This protocol is designed to identify outlier read counts for individual features within a homogeneous treatment group [55].
- Estimate Sequencing Depth: Calculate the average total number of reads across all samples in the group: ( \hat{d} = \frac{1}{n}\sum{i=1}^{n}\sum{g=1}^{G} Y{g,i} ), where ( Y{g,i} ) is the read count for feature ( g ) in sample ( i ), ( n ) is the number of samples, and ( G ) is the total number of features.
- Iterate Over Features: For each feature ( g ), perform the following steps on the count vector ( Y_g ).
- Leave-One-Out Cross-Validation: For each observation ( k ) in the sample: a. Construct a LOO Vector: Create a vector ( X^g{k*} = Y{g,-k} ), which contains all observations for feature ( g ) except the ( k )-th one. b. Fit a Distribution: Calculate the sample mean (( \bar{x} )) and variance (( s^2 )) of ( X^g{k*} ). - If ( s^2 > \bar{x} ), fit a Negative Binomial (NB) distribution to the data and estimate parameters ( \hat{\mu} ) (mean) and ( \hat{\phi} ) (dispersion). - Otherwise, fit a Poisson distribution and estimate the parameter ( \hat{\lambda} ). c. Compute Probability: Calculate the probability ( p(y{g,k}) ) of observing the left-out count ( y_{g,k} ) under the fitted model from step 3b.
- Classify Outliers: Flag any observation ( y{g,k} ) where ( p(y{g,k}) < 1/\hat{d} ) as an outlier.
- Iterate to Convergence: Remove all outliers identified in Step 4 from ( Y_g ) and repeat Steps 2 through 4 until no new outliers are detected.
Protocol: Robust Principal Component Analysis (rPCA) for Outlier Sample Detection
This protocol uses the PcaGrid function from the rrcov R package to objectively identify outlier samples [40].
- Data Input and Preprocessing: a. Input a normalized count matrix (e.g., TPM, CPM, or variance-stabilized counts) with genes as rows and samples as columns. b. Filter out lowly expressed genes to reduce noise.
- Execute rPCA: Run the
PcaGridfunction on the preprocessed data matrix. This algorithm is based on grid search for robust subspaces and provides a high breakdown point, making it suitable for high-dimensional data. - Outlier Identification: The function returns a list of outlier samples based on robust Mahalanobis distances and Q-statistics derived from the principal components. Samples exceeding the statistically defined cutoffs are flagged.
- Validation and Downstream Analysis: a. Compare the list of detected outliers with any available sample metadata (e.g., batch, RNA quality metrics) to investigate potential technical causes. b. Perform differential expression analysis with and without the flagged outliers to assess their impact on the results.
Protocol: Defining Extreme Outliers using Tukey's Fences on Population Data
This protocol is applied to normalized expression data (e.g., TPM) across a population of samples to identify genes with extreme outlier expression in one or a few individuals [2].
- Data Preparation: Use a normalized expression matrix (e.g., TPM) for a single tissue or cell type across multiple individuals. Do not log-transform the data if the goal is to identify extreme absolute values.
- Gene-Wise Calculation: For each gene, calculate the first quartile (Q1, 25th percentile) and the third quartile (Q3, 75th percentile) of its expression across all samples.
- Compute Interquartile Range (IQR): For each gene, calculate ( IQR = Q3 - Q1 ).
- Apply Extreme Outlier Cutoff: Define the upper and lower bounds for extreme outliers:
- Upper Bound: ( Q3 + k \times IQR )
- Lower Bound: ( Q1 - k \times IQR ) where ( k = 5 ) is recommended for a conservative, high-confidence call [2].
- Flag Outliers: Any expression value that falls above the upper bound or below the lower bound is classified as an extreme "over-outlier" (OO) or "under-outlier" (UO), respectively. A gene exhibiting at least one OO or UO is considered an "outlier gene."
Workflow Visualization
The following diagram illustrates the logical relationship and decision path for selecting and applying the different thresholding methodologies described in this note.
Diagram: Decision workflow for selecting outlier detection thresholds.
The Scientist's Toolkit: Essential Research Reagents and Computational Solutions
Successful implementation of the protocols above relies on specific computational tools and resources.
Table 2: Key Research Reagent Solutions for Outlier Detection
| Item Name | Provider/Source | Function in Analysis |
|---|---|---|
| rrcov R Package | CRAN Repository | Provides the PcaGrid and PcaHubert functions for robust principal component analysis, enabling multivariate outlier sample detection [40]. |
| iLOO R Code | Supplementary Material of George et al., 2015 (PLoS One) | Implements the iterative leave-one-out algorithm for identifying outlier read counts within a homogeneous group [55] [56]. |
| OUTRIDER | Bioconductor / GitHub | An integrated statistical method that uses an autoencoder to control for confounders and a negative binomial model to detect significant aberrant expression outliers [49] [57]. |
| Polyester R Package | Bioconductor | Simulates RNA-seq count data for method validation and power analysis; can be used to generate datasets with known outliers to test detection protocols [40]. |
| SRSF2 NMD-Sensitive Transcript | Endogenous control | Serves as a positive control for experiments involving nonsense-mediated decay (NMD) inhibition, helping to validate the efficacy of inhibitors like cycloheximide in functional assays [58]. |
Integrating Outlier Detection with Standard RNA-Seq QC Pipelines
Quality control (QC) is fundamental to RNA sequencing (RNA-seq) analysis, yet performing rigorous QC remains challenging despite the technology's ubiquity in biomedical research [59]. Traditional RNA-seq QC pipelines focus on technical metrics such as sequencing depth, alignment rates, and ribosomal RNA content, but currently lack community standards for defining low-quality samples [59]. The integration of statistical outlier detection methods with these standard QC pipelines represents a paradigm shift in RNA-seq analysis, enabling researchers to systematically identify problematic samples that might otherwise obscure biological insights or lead to erroneous conclusions in downstream analyses. This approach is particularly valuable for clinical diagnostics and rare disease research, where RNA-seq is increasingly used to complement genomic findings [9] [7].
Outlier analysis frameworks redefine clinical and molecular discoveries as contextual deviations measured through information-based approaches with novelty-based root causes [12]. When applied to RNA-seq data, these frameworks facilitate the identification of samples with technical artifacts as well as those with genuine biological anomalies that may represent rare conditions or novel biological mechanisms. The implementation of such approaches requires careful consideration of both experimental and computational factors that contribute to variation in RNA-seq data [60].
Theoretical Framework and Key Metrics
Essential RNA-seq QC Metrics
Effective integration of outlier detection begins with understanding the core QC metrics generated throughout the RNA-seq pipeline. These metrics span multiple processing stages and provide complementary information about sample quality.
Table 1: Essential RNA-Seq QC Metrics for Outlier Detection
| Processing Stage | QC Metric | Interpretation | Outlier Significance |
|---|---|---|---|
| Sequencing Depth | # Sequenced Reads | Total data generated | Identifies insufficient sequencing depth |
| Trimming | % Post-trim Reads | Proportion retained after adapter/quality trimming | Flags excessive adapter content or poor quality |
| Alignment | % Uniquely Aligned Reads | Proportion mapping uniquely to reference | Detects contamination or poor library prep |
| Quantification | % Mapped to Exons | Proportion aligned to exonic regions | Identifies genomic DNA contamination |
| Contamination | % rRNA reads | Proportion ribosomal RNA | Detects rRNA depletion failures |
| Library Complexity | # Detected Genes | Genes above expression threshold | Indicates degraded RNA or failed amplification |
| RNA Integrity | Area Under Gene Body Coverage (AUC-GBC) | Evenness of 5'-3' coverage | Flags RNA degradation |
These metrics collectively provide a multidimensional view of sample quality, with no single metric being sufficient alone [59]. The percent of uniquely aligned reads, while commonly used, has limitations—a sample with low aligned reads may still be usable if it has a high absolute number of aligned reads, while a sample with high aligned reads may still suffer from ribosomal contamination or low library complexity [59].
Outlier Detection Methodologies
Outlier detection methods for RNA-seq QC can be categorized into several approaches, each with distinct strengths and applications.
Table 2: Outlier Detection Methods for RNA-Seq QC
| Method Category | Specific Methods | Mechanism | RNA-Seq Application |
|---|---|---|---|
| Statistical | Z-score, Modified Z-score, IQR, Grubbs' Test | Deviation from central tendency | Univariate metric analysis [61] [62] |
| Machine Learning | Isolation Forest, One-Class SVM | Anomaly isolation in multivariate space | Multivariate QC pattern recognition [63] [64] |
| Density-Based | Local Outlier Factor (LOF), DBSCAN | Local density deviation | Identifying rare cell types or technical anomalies [63] [62] |
| Deep Learning | Autoencoders, OUTRIDER | Reconstruction error-based detection | Aberrant expression detection [25] |
| Splicing-Focused | FRASER, FRASER2 | Splicing anomaly detection | Spliceopathy identification [7] |
The OUTRIDER algorithm exemplifies a specialized approach for RNA-seq, using an autoencoder to model read-count expectations according to gene covariation resulting from technical, environmental, or common genetic variations [25]. Given these expectations, RNA-seq read counts are assumed to follow a negative binomial distribution with gene-specific dispersion, and outliers are identified as read counts that significantly deviate from this distribution [25].
Integrated Experimental Protocol
This protocol describes a comprehensive workflow for integrating outlier detection with standard RNA-seq QC pipelines, suitable for both research and clinical diagnostic applications.
Sample Preparation and Library Construction
RNA Extraction and Quality Assessment
- Extract total RNA using preferred methodology (e.g., column-based or magnetic bead purification)
- Assess RNA quality using Agilent Bioanalyzer or TapeStation to determine RNA Integrity Number (RIN) [59]
- Note: RIN cannot be calculated on low concentration inputs, requiring alternative assessment methods for precious samples [59]
Library Preparation with QC Spike-ins
- Spike in ERCC RNA controls at defined ratios to enable downstream QC assessment [60]
- Perform ribosomal RNA depletion or poly-A selection based on experimental needs
- Use stranded library preparation protocols to preserve strand information
- Note: mRNA enrichment method and strandedness emerge as primary sources of technical variation [60]
Sequencing
- Sequence libraries on preferred platform (Illumina recommended for consistency)
- Aim for minimum 30 million reads per sample for standard bulk RNA-seq
- Include technical replicates across sequencing batches to assess technical variability
Computational QC Pipeline Implementation
Primary Sequencing Data QC
- Process BCL files to FASTQ using bcl2fastq with sample demultiplexing
- Assess raw read quality using FastQC for metrics including:
- Per base sequence quality
- Adapter content
- GC content
- Overrepresented sequences [59]
Read Processing and Alignment
- Perform adapter trimming and quality filtering using Trimmomatic, BBDuk, or TrimGalore [59]
- Align reads to reference genome using splice-aware aligners (STAR, HISAT2) [59]
- Generate alignment statistics including:
- Total aligned reads
- Uniquely aligned reads
- Ribosomal RNA alignment percentage
- Duplicate read rates
Quantification and Metric Generation
Outlier Detection Implementation
Multi-dimensional QC Space Analysis
Expression-based Outlier Detection
Result Integration and Sample Classification
- Integrate outputs from multiple outlier detection methods
- Classify samples into categories: high-quality, borderline, and failure
- Generate comprehensive QC report with visualization of outlier samples
Applications in Rare Disease Diagnostics
The integration of outlier detection with RNA-seq QC has proven particularly valuable in rare disease diagnostics, where it enables identification of pathological splicing events and aberrant expression patterns that might be missed by standard analysis approaches.
Detecting Spliceopathies
Transcriptome-wide outlier analysis can identify individuals with minor spliceopathies caused by variants in spliceosome components. This approach has successfully diagnosed patients with RNU4atac-opathy by detecting excess intron retention outliers in minor intron-containing genes (MIGs) [7]. The methodology includes:
Sample Processing
- Use peripheral blood mononuclear cells (PBMCs) as clinically accessible tissue
- Consider cycloheximide treatment to inhibit nonsense-mediated decay (NMD) when analyzing transcripts with premature termination codons [9]
- Process samples within 24 hours of collection to preserve RNA integrity
Data Analysis
Validation
- Confirm splicing defects using targeted cDNA analysis
- Note: RNA-seq may detect complex splicing events missed by targeted approaches [9]
Technical Considerations for Diagnostic Applications
Implementing RNA-seq outlier detection in clinical diagnostics requires additional technical considerations:
Cross-laboratory Reproducibility
Quality Thresholds
- Set thresholds based on intended application (research vs. clinical)
- For clinical diagnostics: use stricter thresholds and multiple concordance methods
- Implement signal-to-noise ratio (SNR) assessments using principal component analysis [60]
The Scientist's Toolkit
Table 3: Essential Research Reagents and Computational Tools
| Category | Item | Function | Implementation Notes |
|---|---|---|---|
| Wet Lab Reagents | ERCC RNA Spike-in Mix | Technical controls for quantification accuracy | Spike in at defined ratios before library prep [60] |
| Ribosomal Depletion Kits | Remove ribosomal RNA | Choice impacts gene detection sensitivity [60] | |
| Cycloheximide (CHX) | Nonsense-mediated decay inhibitor | Preserve transcripts with PTCs for detection [9] | |
| Agilent Bioanalyzer/TapeStation | RNA quality assessment | Provides RIN for initial QC [59] | |
| Reference Materials | Quartet Reference Materials | Multi-omics reference samples | Assess subtle differential expression detection [60] |
| MAQC Reference Samples | Large biological difference samples | Benchmarking against established standards [60] | |
| Computational Tools | QC-DR | Comprehensive QC visualization | Compares metrics against reference dataset [59] |
| OUTRIDER | Aberrant expression detection | Autoencoder-based, FDR-controlled [25] | |
| FRASER/FRASER2 | Splicing outlier detection | Identifies aberrant splicing events [7] | |
| HybridQC | ML-augmented QC | Combines threshold and Isolation Forest methods [64] |
Trouble-shooting and Best Practices
Common Challenges and Solutions
High Inter-laboratory Variation
- Challenge: Significant technical variations across sequencing facilities [60]
- Solution: Implement standardized protocols and regular benchmarking using reference materials
- Quality Monitoring: Use signal-to-noise ratio (SNR) assessments to detect quality issues at subtle differential expression levels [60]
Handling Low-quality Samples
- Challenge: Precious clinical samples with suboptimal RNA quality
- Solution: Apply multi-metric assessment rather than single threshold filtering
- Consideration: Samples with low aligned reads may still be usable if they have high absolute numbers of aligned reads [59]
Distinguishing Technical from Biological Outliers
- Challenge: Determining if outliers represent technical artifacts or genuine biological findings
- Solution: Implement orthogonal validation and consider biological context
- Framework: Characterize outliers by root cause (error, fault, natural deviation, or novelty) [12]
Quality Threshold Recommendations
Based on multi-center benchmarking studies, the following thresholds provide reasonable starting points for outlier flagging:
- Sequencing Depth: Minimum 20 million reads for standard analyses, 30 million for subtle differential expression
- Alignment Rate: <70% uniquely aligned reads warrants investigation
- rRNA Contamination: >10% rRNA reads suggests ribosomal depletion issues
- Library Complexity: <60% of expected genes detected indicates potential problems
Note that thresholds should be established based on specific experimental contexts and updated using reference dataset performance [59] [60].
Integrating outlier detection with standard RNA-seq QC pipelines represents a significant advancement in transcriptomic analysis, particularly for clinical applications where accurate detection of subtle anomalies is critical. This approach moves beyond traditional threshold-based filtering to embrace multidimensional, context-aware assessment of sample quality. The implementation of specialized algorithms like OUTRIDER for expression outliers and FRASER for splicing anomalies, combined with machine learning approaches like Isolation Forest for technical QC metrics, provides a robust framework for identifying both technical artifacts and biologically significant outliers.
As RNA-seq continues to evolve as a clinical diagnostic tool, the integration of sophisticated outlier detection methods with standard QC pipelines will be essential for realizing its full potential in personalized medicine and rare disease diagnosis. The protocols and guidelines presented here provide a foundation for implementing these approaches in both research and clinical settings.
Benchmarking Outlier Detection Methods: Performance and Validation Strategies
The integration of RNA sequencing (RNA-seq) into clinical and pharmaceutical research necessitates robust bioinformatics pipelines capable of distinguishing true biological signals from technical artifacts. Outlier detection has emerged as a critical component in this workflow, enabling researchers to identify samples that may skew analytical results, leading to inaccurate biological interpretations. Within transcriptomics, outliers can arise from multiple sources, including technical variations in library preparation, sequencing depth, batch effects, or genuine biological extremes such as rare cell populations or unusual disease subtypes. The accurate identification of these outliers is paramount for ensuring the reliability of downstream analyses, including differential expression testing, biomarker discovery, and classifier development.
The challenges associated with outlier detection in RNA-seq data are compounded by the high-dimensional nature of transcriptomic datasets, where thousands of gene expression measurements are collected across relatively few samples. Traditional statistical methods often struggle with this "curse of dimensionality," leading to increased false positive and negative rates. Furthermore, the growing application of single-cell RNA-sequencing (scRNA-seq) introduces additional complexities through data sparsity, technical noise, and cellular heterogeneity. As RNA-seq technologies advance toward clinical diagnostics and drug development applications, establishing standardized frameworks for evaluating outlier detection methods becomes increasingly critical for ensuring reproducible and translatable research findings.
Methodological Landscape of Outlier Detection
Algorithmic Approaches and Their Underlying Principles
Outlier detection methods for transcriptomic data can be broadly categorized into several computational paradigms, each with distinct theoretical foundations and implementation considerations. Statistical-based methods typically assume an underlying distribution model (e.g., Gaussian) and flag observations that deviate significantly from expected values. While conceptually straightforward, these methods often face challenges with high-dimensional RNA-seq data where distributional assumptions may not hold. Distance-based approaches quantify the dissimilarity between samples in multidimensional space, identifying outliers as points that are distant from their nearest neighbors. These methods, including classical algorithms like k-nearest neighbors, become computationally intensive as dimensionality increases.
More recently, fluctuation-based outlier detection (FBOD) has emerged as an efficient alternative that operates without explicit distance calculations. This method leverages the concept that outliers, being few in number and deviating significantly from majority patterns, exhibit distinctive fluctuations when their feature values are aggregated with those of neighbors. FBOD first constructs graph relationships through random links, propagates feature values across this graph, then compares fluctuation values between objects and their neighbors to identify outliers with higher deviation scores. This approach achieves linear time complexity, making it particularly suitable for large-scale transcriptomic datasets [65].
Deep learning-based methods represent another evolving paradigm, utilizing autoencoders, generative adversarial networks (GANs), or graph neural networks to learn complex data representations for outlier identification. These methods typically assume that outliers are more difficult to reconstruct from learned representations or appear as anomalies in the feature space defined by the neural network. While offering powerful pattern recognition capabilities, deep learning approaches often require substantial computational resources and large training datasets to achieve optimal performance [65].
Integration with RNA-seq Analysis Pipelines
The practical implementation of outlier detection methods requires careful consideration of their integration within established RNA-seq analytical workflows. For bulk RNA-seq data, outlier detection typically occurs during quality control phases, where samples exhibiting extreme global expression patterns are identified before differential expression analysis. In single-cell RNA-seq pipelines, outlier detection operates at both the sample level (identifying low-quality libraries) and the cell level (identifying rare cell types or aberrant cells). The DROP pipeline exemplifies a specialized framework for detecting aberrant expression and splicing outliers in rare disease diagnostics, incorporating statistical models to flag transcriptomic deviations relative to reference populations [66].
The selection of appropriate outlier detection methods must align with specific analytical goals and data characteristics. For clinical diagnostics, where interpretability is crucial, simpler statistical methods may be preferred over complex black-box algorithms. In discovery-phase research, where novel biological phenomena may manifest as outliers, more sensitive detection methods with higher recall rates may be appropriate despite potential increases in false positives. This methodological decision-making process should be guided by systematic evaluation frameworks that assess performance across multiple metrics including accuracy, sensitivity, specificity, and computational efficiency.
Quantitative Comparison of Outlier Detection Methods
Performance Metrics Across Method Categories
Table 1: Comparative Performance of Outlier Detection Algorithms on Transcriptomic Data
| Method Category | Representative Algorithms | Reported Accuracy Range | Sensitivity to Rare Outliers | Specificity (Low FP Rate) | Computational Complexity | Scalability to Large Datasets |
|---|---|---|---|---|---|---|
| Fluctuation-based | FBOD | 0.82-0.94 (F1-score) | High | Moderate | O(n) | Excellent |
| Distance-based | KNN, LOF | 0.75-0.89 (F1-score) | Moderate | Moderate | O(n²) | Poor |
| Statistical-based | PCA-based, Z-score | 0.70-0.85 (F1-score) | Low | High | O(n) | Good |
| Deep Learning | Autoencoders, SO-GAAL | 0.80-0.91 (F1-score) | High | Moderate | O(n) (after training) | Moderate |
| Ensemble-based | Isolation Forest, Feature Bagging | 0.78-0.90 (F1-score) | Moderate | High | O(n log n) | Good |
The performance evaluation of outlier detection methods reveals significant trade-offs between different algorithmic approaches. Fluctuation-based methods demonstrate particularly strong performance in terms of computational efficiency, achieving linear time complexity with a small constant factor, which enables application to large-scale transcriptomic datasets. In comparative studies, FBOD achieved execution times representing just 5% of the fastest competitor algorithm while maintaining competitive detection accuracy across eight real-world tabular datasets and three video datasets [65]. This efficiency advantage becomes increasingly important as RNA-seq studies grow in sample size and dimensionality.
Sensitivity and specificity profiles vary considerably across method categories. Statistical-based approaches typically exhibit high specificity (low false positive rates) but may lack sensitivity for detecting subtle outliers, particularly in high-dimensional spaces where the "curse of dimensionality" dilutes distance metrics. Deep learning methods generally achieve high sensitivity for complex outlier patterns but may generate more false positives without careful regularization. Ensemble methods often provide a favorable balance between sensitivity and specificity by aggregating multiple detection strategies, though at increased computational cost. The optimal method selection depends heavily on the specific analytical context, with clinical diagnostic applications typically prioritizing specificity to minimize false referrals, while exploratory research may favor sensitivity to ensure comprehensive outlier capture.
Impact on Downstream Analytical Performance
The effectiveness of outlier detection methods must ultimately be evaluated through their impact on downstream transcriptomic analyses. In classifier development, the presence of outliers in training or test sets can substantially alter estimated performance metrics, leading to either overly optimistic or pessimistic accuracy assessments. Studies evaluating classifier performance with and without outlier removal have demonstrated notable improvements in accuracy, sensitivity, and specificity following appropriate outlier detection and handling [67]. This effect is particularly pronounced in clinical diagnostic applications, where classifier reliability directly impacts patient care decisions.
In differential expression analysis, outlier samples can disproportionately influence statistical estimates, potentially leading to both false positive and false negative findings. The robustness of differential expression methods like DESeq2, voom+limma, edgeR, EBSeq, and NOISeq varies considerably in the presence of outliers, with non-parametric approaches such as NOISeq generally demonstrating greater resilience to outlier effects [68]. For rare disease diagnostics utilizing blood RNA-seq, outlier detection for aberrant expression and splicing has proven critical for identifying pathogenic mechanisms, contributing to diagnostic uplift rates of 2.7-60% depending on prior genetic evidence [66]. These findings underscore the foundational importance of effective outlier detection for ensuring analytical validity across diverse RNA-seq applications.
Experimental Protocols for Method Evaluation
Benchmarking Framework for Outlier Detection Performance
Objective: To systematically evaluate the performance of multiple outlier detection algorithms across defined RNA-seq datasets with known outlier status.
Materials:
- RNA-seq datasets with validated outlier status (e.g., Quartet reference materials with spike-in controls [60])
- Computing infrastructure with sufficient memory and processing capabilities
- Implementation of outlier detection algorithms (FBOD, isolation forest, autoencoders, statistical methods)
- Evaluation metrics calculator (precision, recall, F1-score, AUC-ROC)
Procedure:
- Data Preparation: Obtain or generate RNA-seq datasets with known outlier status. The Quartet project reference materials provide well-characterized transcriptomic samples with built-in ground truth through ERCC spike-in controls and predefined sample mixtures [60]. Alternatively, synthetic RNA-seq data with predetermined outliers can be generated using specialized frameworks [69].
- Data Preprocessing: Apply standard RNA-seq preprocessing steps including quality control, normalization, and batch effect correction. For sequencing data, implement appropriate normalization techniques such as TPM for bulk RNA-seq or more specialized approaches for single-cell data to address sparsity [39].
- Algorithm Configuration: Implement and parameterize outlier detection methods according to their specifications. For FBOD, set the neighborhood size (k) through systematic testing. For distance-based methods, define appropriate distance metrics and thresholds. For deep learning approaches, establish network architecture and training parameters.
- Outlier Detection Execution: Apply each configured algorithm to the preprocessed datasets. For methods requiring training (e.g., deep learning approaches), implement proper cross-validation to prevent data leakage and overfitting.
- Performance Assessment: Compare algorithm outputs against known outlier status using quantitative metrics including accuracy, sensitivity, specificity, precision, recall, F1-score, and area under the receiver operating characteristic curve (AUC-ROC).
- Computational Efficiency Measurement: Record execution time and memory usage for each method under standardized hardware and software conditions.
- Statistical Analysis: Perform significance testing to determine whether performance differences between methods are statistically significant using appropriate multiple testing corrections.
Troubleshooting:
- If algorithms demonstrate consistently poor performance across metrics, revisit data preprocessing steps and consider alternative normalization strategies.
- If computational requirements exceed available resources, implement dimensionality reduction techniques such as PCA or feature selection prior to outlier detection.
- If results show high variance across cross-validation folds, increase sample size or adjust algorithm parameters to improve stability.
Classifier Performance Assessment with Outlier Probabilities
Objective: To evaluate the impact of outlier removal on classifier performance in transcriptomic data.
Materials:
- Transcriptomic dataset with predefined class labels
- Computing environment with R and Python installations
- Required software packages: 'limma' for differential expression, 'e1071' for SVM, 'randomForest' for RF, 'MASS' for LDA, 'aplpack' for bagplots
Procedure:
- Feature Selection: Conduct differential expression analysis using the 'limma' package to identify significantly differentially expressed genes between classes. Rank genes by significance and perform incremental feature selection from 10 to 200 genes in steps of 10 [67].
- Classifier Training: Implement three classification algorithms (Support Vector Machine, Random Forest, and Linear Discriminant Analysis) using default parameters as established in the literature [67].
- Bootstrap Validation: Perform bootstrap validation by repeatedly (100 iterations) sampling without replacement, using 2/3 of samples for training and the remaining 1/3 for testing. Calculate performance metrics (accuracy, sensitivity, specificity, predictive values, Brier score) for each iteration.
- Outlier Probability Assessment: Implement a separate bootstrap procedure with 100 resampled datasets with replacement. Apply outlier detection methods (bagplot algorithm and PCA-Grid approach) to each resampled dataset to identify outliers in the two-dimensional principal component space [67].
- Outlier Probability Calculation: For each sample, calculate the relative outlier frequency across bootstrap iterations as the proportion of datasets in which the sample was identified as an outlier.
- Comparative Performance Assessment: Evaluate classifier performance under three conditions: (A) retaining all samples including outliers, (B) removing all simulated outliers (in synthetic data), and (C) removing samples identified as significant outliers based on calculated outlier probabilities.
- Result Interpretation: Compare performance metrics across the three conditions to quantify the impact of outlier removal on classifier performance.
Troubleshooting:
- If outlier detection identifies too many samples as outliers, adjust the bagplot factor or PCA-Grid parameters to increase specificity.
- If classifier performance deteriorates after outlier removal, investigate whether outliers represent meaningful biological variation rather than technical artifacts.
- If computational requirements are excessive, reduce the number of bootstrap iterations or implement parallel processing.
Figure 1: Experimental Workflow for Outlier Detection Method Evaluation
Table 2: Key Research Reagent Solutions for Outlier Detection in RNA-seq Studies
| Category | Item | Specification/Function | Example Applications |
|---|---|---|---|
| Reference Materials | Quartet RNA Reference Materials | Well-characterized RNA samples with small biological differences for subtle differential expression assessment | Method benchmarking, accuracy validation [60] |
| ERCC Spike-in Controls | Synthetic RNA controls with known concentrations for technical performance assessment | Normalization, quality control, accuracy calibration [60] | |
| Library Preparation | PAXgene Blood RNA Tube | Stabilizes RNA in whole blood samples for consistent pre-analytical processing | Clinical RNA-seq studies, rare disease diagnostics [66] |
| NEBNext Globin and rRNA Depletion Kit | Removes globin and ribosomal RNA to improve mRNA sequencing efficiency | Blood transcriptomics, low-input samples [66] | |
| Computational Tools | DROP Pipeline | Specialized framework for detecting aberrant expression and splicing outliers | Rare disease diagnostics, clinical RNA-seq [66] |
| FBOD Implementation | Fluctuation-based outlier detection algorithm for efficient large-scale analysis | High-dimensional transcriptomic data, large cohort studies [65] | |
| Software Packages | Limma | Differential expression analysis for feature selection in classifier development | Biomarker discovery, molecular signature identification [67] |
| PCA-Grid | Robust principal component analysis for multivariate outlier detection | Quality control, batch effect detection [67] |
The effective implementation of outlier detection strategies requires both wet-lab and computational resources carefully selected for specific research contexts. For method development and benchmarking, well-characterized reference materials like the Quartet RNA samples provide essential ground truth for evaluating detection accuracy, particularly for subtle differential expression patterns that challenge conventional approaches [60]. Spike-in controls, including ERCC synthetic RNAs, enable technical performance assessment and normalization, critical for distinguishing biological outliers from technical artifacts.
Specialized library preparation reagents play a crucial role in minimizing technical variation that can manifest as outliers in downstream analyses. RNA stabilization systems like PAXgene tubes maintain RNA integrity from sample collection through processing, while ribosomal and globin RNA depletion kits enhance sequencing efficiency for challenging sample types like whole blood. These reagents are particularly important for clinical applications where sample quality directly impacts diagnostic accuracy [66].
Computational tools for outlier detection span from comprehensive pipelines like DROP, specifically designed for detecting aberrant expression and splicing in rare disease diagnostics, to specialized algorithms like FBOD that offer efficient processing of large-scale datasets. Complementary software packages for differential expression analysis (e.g., Limma) and dimension reduction (e.g., PCA-Grid) provide essential supporting functionality for comprehensive outlier detection workflows. The selection of appropriate tools should be guided by specific research objectives, with clinical diagnostics prioritizing interpretability and validation, while discovery research may emphasize sensitivity and computational efficiency.
Figure 2: Decision Framework for Outlier Detection Method Selection
The comparative analysis of outlier detection methods presented in this framework reveals distinct performance profiles across algorithmic categories, with significant implications for research and clinical applications in transcriptomics. Fluctuation-based methods demonstrate particular promise for large-scale studies where computational efficiency is paramount, while statistical approaches offer advantages in clinical settings where interpretability and specificity are prioritized. Deep learning methods provide powerful pattern recognition capabilities for complex outlier detection but require substantial computational resources and training data. Ensemble approaches often represent a balanced solution, mitigating limitations of individual methods through strategic combination.
Implementation recommendations must consider specific research contexts and constraints. For clinical diagnostics and regulatory applications, where false positives carry significant consequences, statistical methods with high specificity are generally preferred. In exploratory research and biomarker discovery, where sensitivity to detect novel biological phenomena is crucial, fluctuation-based or deep learning approaches may be more appropriate. For large-scale population studies and biobank-scale analyses, computational efficiency becomes a dominant concern, favoring methods with linear time complexity like FBOD. Across all applications, rigorous validation using reference materials and standardized performance metrics remains essential for ensuring reliable outlier detection and maintaining analytical validity in RNA-seq research.
Outlier detection in RNA-sequencing (RNA-seq) analysis has emerged as a powerful approach for identifying aberrant gene expression events associated with rare diseases, particularly Mendelian disorders. When standard whole-genome sequencing fails to identify pathogenic variants, RNA-seq can reveal outliers—genes with abnormal expression levels that may point to underlying genetic causes [1] [24]. The statistical challenge lies in distinguishing true biological outliers from technical artifacts and confounding variations, which has led to the development of specialized computational methods.
Three prominent approaches have demonstrated significant capability in this domain: OUTRIDER (Outlier in RNA-Seq Finder), OutSingle (Outlier detection using Singular Value Decomposition), and robust Principal Component Analysis (rPCA) methods. OUTRIDER employs an autoencoder-based approach within a negative binomial framework to model expected read counts and identify significant deviations [24]. OutSingle utilizes a log-normal transformation combined with singular value decomposition and optimal hard thresholding for confounder control [1]. rPCA methods, particularly PcaGrid and PcaHubert, apply robust statistics to detect outlier samples in high-dimensional RNA-seq data [70].
This application note provides a comprehensive performance comparison of these three methodologies across both simulated and real datasets, offering researchers in genomics and drug development practical guidance for method selection and implementation within the broader context of RNA-seq outlier detection research.
Methodological Frameworks
OUTRIDER: Autoencoder-Based Outlier Detection
OUTRIDER combines an autoencoder with a formal statistical test for outlier detection. The method assumes that RNA-seq read counts follow a negative binomial distribution with gene-specific dispersion parameters. The expected counts are modeled as the product of sample-specific size factors and the exponential of a factor capturing covariations across genes [24].
The autoencoder, with encoding dimension q (where 1 < q < min(p,n) for p genes and n samples), learns a low-dimensional representation of the data to control for technical and biological confounders. The model parameters are automatically fitted to optimize recall of artificially corrupted data, and outliers are identified as read counts that significantly deviate from the expected distribution based on false-discovery-rate-adjusted p-values [24].
OutSingle: SVD-Based Approach with Optimal Thresholding
OutSingle employs a two-step process that first calculates gene-specific z-scores from log-transformed count data, then applies confounder control using singular value decomposition (SVD) and optimal hard threshold (OHT) for noise reduction. This method uses a log-normal approximation for count modeling rather than the negative binomial distribution, significantly reducing computational complexity [1].
A key advantage of OutSingle is the invertibility of its procedure, enabling not only outlier detection but also the injection of artificial outliers masked by confounders. This capability facilitates comprehensive benchmarking and method validation, which is more challenging with the more complex OUTRIDER model [1].
rPCA: Robust Sample Outlier Detection
rPCA methods, including PcaGrid and PcaHubert, utilize robust statistics to identify outlier samples in RNA-seq data. Unlike classical PCA, which is sensitive to outliers that can distort component estimation, rPCA methods first fit the majority of the data before flagging deviant observations [70].
These methods are particularly valuable for high-dimensional RNA-seq data with small sample sizes, where visual inspection of PCA plots may introduce subjective biases. Among various rPCA algorithms, PcaGrid has demonstrated perfect sensitivity and specificity in detecting outlier samples across multiple simulated and biological datasets [70].
Performance Benchmarking
Computational Efficiency
Table 1: Computational Performance Comparison
| Method | Computational Complexity | Execution Time | Scalability | Key Factors Affecting Speed |
|---|---|---|---|---|
| OUTRIDER | High (Autoencoder training) | Slow | Moderate | Dataset size, autoencoder dimensions, convergence criteria |
| OutSingle | Low (Matrix decomposition) | Almost instantaneous | High | Number of samples and genes, SVD computation |
| rPCA | Moderate (Robust estimation) | Fast | High | Sample size, robust algorithm selection |
OutSingle demonstrates superior computational efficiency, operating in an "almost instantaneous" manner compared to OUTRIDER's more computationally demanding autoencoder training [1]. The log-normal approximation and deterministic SVD/OHT approach avoid the iterative optimization and artificial noise injection required by OUTRIDER [1] [71]. rPCA methods strike a balance between efficiency and robustness, with PcaGrid generally faster than PcaHubert for typical RNA-seq datasets [70].
Detection Accuracy
Table 2: Detection Performance Across Datasets
| Method | Real Biological Outliers | Underexpressed Outliers | Overexpressed Outliers | Confounder Control |
|---|---|---|---|---|
| OUTRIDER | High | High | Moderate | Effective (autoencoder) |
| OutSingle | Higher than OUTRIDER | High | High | Effective (SVD/OHT) |
| rPCA | Sample-level detection | Sample-level detection | Sample-level detection | Varies by implementation |
In direct comparisons on datasets with real biological outliers masked by confounders, OutSingle outperformed OUTRIDER, the previous state-of-the-art method [1]. OUTRIDER shows particular strength in detecting underexpressed outliers, while OutSingle demonstrates more balanced performance across outlier types [1]. rPCA specializes in sample-level outlier detection rather than gene-level outliers, achieving 100% sensitivity and specificity in controlled tests using PcaGrid [70].
Robustness to Confounders
Both OUTRIDER and OutSingle explicitly address confounding factors, though through different approaches. OUTRIDER's autoencoder learns to represent technical and biological covariation, while OutSingle's SVD/OHT method separates signal from noise in the z-score matrix [1] [24]. The optimal hard thresholding in OutSingle provides a deterministic approach to confounder control without requiring the complex training procedures of OUTRIDER's denoising autoencoder [1].
rPCA methods intrinsically handle confounders through robust estimation, making them less sensitive to outlier contamination when identifying the main data structure [70]. This makes them particularly valuable for quality control in RNA-seq experiments where technical artifacts may dominate.
Experimental Protocols
Protocol 1: Implementing OUTRIDER for Outlier Detection
Application: Identifying aberrant gene expression in rare disease cohorts.
Materials and Reagents:
- RNA-seq count data (HT-seq format recommended)
- OUTRIDER package (available through Bioconductor)
- R statistical environment (version 4.0 or higher)
Procedure:
- Data Preparation: Load raw count data and filter for expressed genes (genes with counts >1 in at least 5% of samples).
- Parameter Optimization: Determine optimal encoding dimension using artificial noise injection with mean of log(3) and standard deviation of log(1.6) at frequency of 10−2.
- Model Fitting: Implement the autoencoder to model read-count expectations controlling for covariation.
- Statistical Testing: Identify outliers as read counts significantly deviating from the negative binomial distribution using FDR-adjusted p-values (< 0.05).
- Result Interpretation: Filter outlier genes per sample and prioritize based on functional relevance to disease phenotype.
Troubleshooting Tips:
- Monitor parameter values during training to prevent convergence issues
- Manual initialization may be required for unstable optimization
- Adjust encoding dimension if model fails to capture data structure
Protocol 2: OutSingle for Rapid Outlier Detection and Injection
Application: Fast outlier detection and artificial outlier generation for method validation.
Materials and Reagents:
- RNA-seq count matrix
- OutSingle package (available at https://github.com/esalkovic/outsingle)
- Python environment (3.7 or higher) with NumPy and SciPy
Procedure:
- Data Transformation: Log-transform raw count data and compute gene-specific z-scores.
- Confounder Control: Apply singular value decomposition to z-score matrix and implement optimal hard thresholding for noise reduction.
- Outlier Detection: Flag outliers based on significance thresholds in de-noised z-scores.
- Outlier Injection (Optional): Use invertible property to inject artificial outliers with controlled magnitude and confounder masking.
- Validation: Benchmark performance using injected outliers with known ground truth.
Troubleshooting Tips:
- Ensure sufficient sample size for stable SVD estimation
- Verify OHT selection matches data characteristics
- Validate artificial outliers reflect biological plausible effect sizes
Protocol 3: rPCA for Sample Quality Control
Application: Detecting outlier samples in RNA-seq quality control.
Materials and Reagents:
- Normalized gene expression matrix (e.g., rlog-transformed counts)
- rrcov R package
- R statistical environment
Procedure:
- Data Preparation: Normalize raw counts using rlog transformation (e.g., from DESeq2).
- Transposition: Transpose expression matrix so samples are rows and genes are columns.
- rPCA Implementation: Execute PcaGrid or PcaHubert on transposed matrix:
pcaG <- PcaGrid(t(assay(rlog(dds))), k=2) - Outlier Identification: Identify outlier samples using
which(pcaG@flag=='FALSE') - Visualization: Generate outlier maps using
plot(pcaG)
Troubleshooting Tips:
- Transpose matrix correctly to avoid analyzing genes as samples
- Adjust k parameter based on data dimensionality
- Compare multiple rPCA methods for consensus outlier detection
Workflow Diagrams
The Scientist's Toolkit
Table 3: Essential Research Reagents and Computational Tools
| Item | Function | Implementation Considerations |
|---|---|---|
| RNA-seq Count Data | Input data for outlier detection | Format as gene × sample matrix; ensure appropriate sample size |
| Reference Materials (e.g., Quartet, MAQC) | Benchmarking and quality assessment | Enable performance evaluation with ground truth [60] |
| OUTRIDER R Package | Autoencoder-based outlier detection | Requires Bioconductor; computationally intensive for large datasets |
| OutSingle Python Package | SVD-based rapid outlier detection | GitHub installation; minimal computational requirements |
| rrcov R Package | Robust PCA methods (PcaGrid, PcaHubert) | Comprehensive implementation of robust multivariate methods |
| ERCC Spike-in Controls | Technical validation | Assess accuracy of expression measurements [60] |
| DESeq2 or edgeR | Data normalization and preprocessing | Provides robust normalization for count data |
The performance comparison of OUTRIDER, OutSingle, and rPCA reveals distinct strengths and optimal applications for each method. OUTRIDER provides a comprehensive, statistically rigorous framework for gene-level outlier detection with robust confounder control through its autoencoder approach [24]. OutSingle offers exceptional computational efficiency and the unique capability of artificial outlier injection, making it particularly valuable for rapid screening and method validation [1]. rPCA methods excel at sample-level quality control, demonstrating perfect sensitivity and specificity in detecting outlier samples under controlled conditions [70].
For research focused on identifying pathogenic expression outliers in rare disease diagnostics, OUTRIDER remains a strong choice despite its computational demands, particularly when analyzing underexpressed outliers [1] [24]. In scenarios requiring rapid processing of large datasets or artificial outlier generation for benchmarking, OutSingle provides a compelling alternative with competitive performance [1] [71]. For quality control applications aimed at identifying problematic samples in RNA-seq datasets, rPCA methods, particularly PcaGrid, offer robust, statistically justified outlier detection superior to visual inspection of classical PCA plots [70] [34].
Future developments in RNA-seq outlier detection will likely focus on improving computational efficiency while maintaining statistical rigor, better integration of multi-omics data, and enhanced methods for distinguishing technical artifacts from true biological outliers. The benchmarking efforts using reference materials like the Quartet and MAQC samples will be crucial for validating these advances and translating RNA-seq outlier detection into clinical applications [60].
The identification of outliers in RNA sequencing (RNA-Seq) gene expression data is a critical step in pinpointing the genetic causes of rare Mendelian disorders [1]. Outlier detection algorithms are designed to identify genes that exhibit aberrant expression levels, which can signal pathogenic events. However, the development of these methods is hampered by a significant challenge: the need for robust validation techniques to assess their performance accurately. A primary obstacle is that the "ground truth"—or known aberrantly expressed genes—is often limited or unknown in real biological datasets [1] [49]. Furthermore, the presence of technical and biological confounders, such as batch effects, population structure, or variations in RNA integrity, can mask true outliers and complicate their detection [1] [43]. To address these challenges, researchers have developed two complementary validation paradigms: the use of real biological datasets with previously identified aberrant expressions, and the technique of artificial outlier injection, where synthetic outliers are introduced into real datasets to create a controlled benchmark [1]. This application note details the protocols for implementing these validation strategies, providing a framework for the rigorous evaluation of outlier detection methods within the broader context of a thesis on RNA-Seq analysis.
Key Outlier Detection Methods and Their Validation
Several statistical methods have been developed for outlier detection in RNA-Seq data, each with distinct approaches to modeling gene expression and controlling for confounders. The table below summarizes the core methodologies and their respective validation strategies as reported in the literature.
Table 1: Key Outlier Detection Methods and Their Validation Approaches
| Method Name | Core Algorithm & Modeling | Confounder Control | Primary Validation Strategy | Reported Performance |
|---|---|---|---|---|
| OutSingle [1] | Log-normal distribution of counts; Z-scores | Singular Value Decomposition (SVD) with Optimal Hard Threshold (OHT) | Artificial outlier injection & real biological datasets (Kremer et al. dataset) | Outperformed OUTRIDER on 16/18 injected datasets; faster execution |
| OUTRIDER [49] | Negative Binomial Distribution (NBD) | Denoising Autoencoder (AE) | Artificial corruption of data & real biological datasets | Effective recall of artificially corrupted data; identified 6/6 validated pathogenic events |
| FRASER [43] | Beta-binomial distribution of splicing metrics | Denoising Autoencoder (AE) | Artificial outlier injection on GTEx data & real rare disease datasets | Controls FDR; doubles detection by capturing intron retention |
| rPCA (PcaGrid) [40] | Robust Principal Component Analysis | Robust covariance estimation | Simulation of outlier samples & real data with qRT-PCR validation | 100% sensitivity and specificity in tests with positive control outliers |
| DeCOr-MDS [72] | Robust Multidimensional Scaling | Geometry of simplices for orthogonal outlier detection | Synthetic datasets & real biological data (single-cell RNA-seq, microbiome) | Improved visualization and quality control by mitigating outlier influence |
Comparative Analysis of Validation Use
As illustrated in the table, artificial outlier injection is a widely adopted strategy for benchmarking methods like OutSingle, OUTRIDER, and FRASER [1] [49] [43]. This approach allows for a controlled assessment of a method's sensitivity and precision. For instance, OutSingle's superior performance was demonstrated by testing it on 18 datasets generated from three real datasets using its own injection procedure [1]. Conversely, validation with real biological datasets provides evidence of a method's utility in practical diagnostic or research scenarios. OUTRIDER's validation on a dataset with six previously validated pathogenic events is a prime example, proving its effectiveness in a real-world context [1] [49]. Furthermore, independent verification using techniques like quantitative RT-PCR (qRT-PCR), as employed in rPCA validation, offers a gold-standard confirmation of the biological relevance of the detected outliers and the ensuing differential expression analysis [40].
Protocols for Validation Using Artificial Outlier Injection
Artificial outlier injection is a powerful technique for benchmarking outlier detection methods when true positives are unknown. It involves computationally "spiking" a real dataset with synthetic outliers that mimic the characteristics of true biological aberrations. The following protocol is adapted from the implementation in the OutSingle algorithm [1].
Detailed Experimental Protocol
Principle: The procedure leverages the invertibility of the OutSingle algorithm's steps. After fitting the model to a real dataset and removing latent confounders, artificial outliers with a specified magnitude are injected into the residual space. These outliers are then transformed back into the original count space, resulting in a synthetic dataset where the location and nature of outliers are known [1].
Table 2: Research Reagent Solutions for Artificial Outlier Injection
| Item Name | Specification / Function | Implementation Example |
|---|---|---|
| Base Dataset | A real, high-quality RNA-Seq count matrix (J genes x N samples). | Genotype-Tissue Expression (GTEx) project data [43]; any in-house dataset from healthy controls or a large cohort. |
| Injection Algorithm | The computational procedure for introducing outliers. | The inverse OutSingle procedure or the injection scheme used by OUTRIDER/FRASER [1] [43]. |
| Outlier Type | Defines the direction and nature of the aberration. | Underexpression (downward shift), Overexpression (upward shift), or Splicing outlier (shift in ψ or θ metrics) [1] [43]. |
| Outlier Magnitude | The strength or deviation size of the injected outlier. | Z-scores of 2, 3, 4, etc. [1], or deviations of 0.2 up to the maximum possible value for a metric [43]. |
| Outlier Frequency | The proportion of data points to be altered. | e.g., (10^{-2}) (1% of counts) [1], or a 5% injection rate in measurements [73]. |
| Confounder Modeling | Method to ensure outliers are masked by the same technical variations as real data. | Using SVD/OHT (OutSingle) or an Autoencoder (OUTRIDER, FRASER) to model and re-introduce confounders [1] [43]. |
Step-by-Step Workflow:
- Input: Begin with a normalized RNA-Seq count matrix (e.g., reads per million) that has passed standard quality control checks.
- Log-Transform and Z-score Normalization: Transform the count matrix, ( K ), to a matrix of Z-scores, ( Z ), on a per-gene basis. ( Z{ji} = \frac{log2(K{ji} + 1) - \muj}{\sigmaj} ) where ( \muj ) and ( \sigmaj ) are the mean and standard deviation of the log-transformed counts for gene ( j ) [1].
- Confounder Removal with SVD/OHT: Perform Singular Value Decomposition (SVD) on the Z-score matrix: ( Z = U \Sigma V^T ). Apply the Optimal Hard Threshold (OHT) to determine the number of significant components, ( r ), that represent confounders. Remove these confounders to obtain a residual matrix: ( Z{res} = Z - U{.,1:r} \Sigma{1:r,1:r} V{.,1:r}^T ) [1].
- Inject Artificial Outliers: For a selected subset of data points (determined by the desired frequency), add an outlier signal, ( \delta ), to the residual matrix. The value of ( \delta ) is chosen to achieve the target outlier magnitude (e.g., a Z-score shift of 3 or 4). ( Z{res,ji}^{(outlier)} = Z{res,ji} + \delta ) [1].
- Re-introduce Confounders: Add the previously removed confounder signal back to the modified residual matrix to create a synthetic Z-score matrix with outliers that are masked by the same technical variations as the original data. ( Z^{(synthetic)} = Z{res}^{(outlier)} + U{.,1:r} \Sigma{1:r,1:r} V{.,1:r}^T ) [1].
- Inverse Transformation: Transform the synthetic Z-score matrix back into a count matrix by reversing the log-transformation and Z-score normalization. This creates the final benchmark dataset with known ground truth.
- Output: A synthetic RNA-Seq count matrix visually and statistically similar to the original data, but with known aberrantly expressed genes.
The performance of an outlier detection method is then evaluated by its ability to recover these known, injected outliers, typically measured by metrics like precision, recall, and the area under the precision-recall curve [1] [43].
Workflow Visualization
The following diagram illustrates the logical flow of the artificial outlier injection protocol.
Protocols for Validation Using Real Biological Datasets
Validation with real biological datasets provides critical evidence for the practical utility of an outlier detection method. This approach tests the algorithm's performance on data containing genuine, biologically verified aberrant expressions.
Detailed Experimental Protocol
Principle: This method involves applying the outlier detection algorithm to a publicly available or in-house dataset where some aberrantly expressed genes or aberrant splicing events have been previously identified and validated through independent biological assays (e.g., qRT-PCR, functional studies) [49] [40].
Table 3: Research Reagent Solutions for Validation with Real Biological Datasets
| Item Name | Specification / Function | Implementation Example |
|---|---|---|
| Positive Control Dataset | A RNA-Seq dataset from a disease cohort with known genetic causes. | Dataset from Kremer et al. (2017) or Cummings et al. (2017) with validated pathogenic outliers [1] [49]. |
| Negative Control Dataset | A RNA-Seq dataset from a healthy cohort, assumed to have few rare disease outliers. | Genotype-Tissue Expression (GTEx) project data [43]. |
| Validation Assay | An orthogonal, gold-standard method to confirm aberrant expression. | qRT-PCR for gene expression [40]; Sanger sequencing or functional assays for splicing variants [43]. |
| Reference Method | An established outlier detection algorithm for benchmarking. | OUTRIDER, z-score based approaches, or FRASER (for splicing) [1] [43]. |
| Cohort Metadata | Detailed sample information for covariate adjustment. | Sex, age, sequencing batch, RIN (RNA Integrity Number), genotyping principal components [43]. |
Step-by-Step Workflow:
- Dataset Curation: Identify and download a suitable positive control dataset. A classic example is the dataset from Kremer et al. (2017), which contains samples from individuals with rare mitochondrial disorders and includes validated aberrant expressions [1] [49].
- Data Preprocessing: Prepare the dataset according to the requirements of the method under test. This typically includes:
- Filtering: Remove genes with low counts across samples.
- Normalization: Apply a normalization method (e.g., TPM, DESeq2's median-of-ratios) to correct for library size and other technical biases.
- Model Fitting and Outlier Calling: Execute the outlier detection algorithm on the preprocessed dataset. For methods like OUTRIDER or FRASER, this involves automatically fitting the model (e.g., autoencoder) to the data and optimizing its hyperparameters to achieve the best recall of the underlying signal [49] [43].
- Result Extraction and Multiple Testing Correction: Obtain raw p-values for each gene in each sample. Apply a multiple testing correction (e.g., Benjamini-Hochberg) to control the False Discovery Rate (FDR). A common significance threshold is FDR < 0.05 or < 0.1 [49] [43].
- Performance Assessment:
- Recall/Sensitivity: Calculate the proportion of known, validated pathogenic events that are successfully identified as outliers by the method. For example, OUTRIDER detected 6 out of 6 validated events in its benchmark [49].
- Specificity/Precision: When using a large negative control dataset like GTEx, the number of significant outlier calls can be interpreted as an estimate of the false positive rate, as true pathogenic outliers are expected to be extremely rare in a healthy population [43].
- Independent Validation: For novel findings or to confirm the method's results in a new dataset, perform experimental validation using qRT-PCR for gene expression levels or targeted sequencing for splicing events [40].
Workflow Visualization
The following diagram outlines the protocol for validating an outlier detection method using a real biological dataset.
The rigorous validation of outlier detection methods is paramount for their successful application in rare disease diagnostics and research. The two complementary techniques detailed in this application note—artificial outlier injection and validation with real biological datasets—form a robust framework for this purpose. Artificial injection provides a controlled, scalable environment for benchmarking and comparing the sensitivity and precision of different algorithms. In contrast, validation with real datasets offers critical evidence of a method's performance on genuine, biologically complex cases. For a comprehensive thesis on outlier detection in RNA-Seq analysis, employing both strategies is highly recommended. This dual approach ensures that a method is not only statistically sound in theory but also effective and reliable in practice, ultimately accelerating the discovery of the genetic underpinnings of rare diseases.
The analysis of RNA sequencing (RNA-Seq) data has revolutionized our understanding of genetic disorders and cancer biology. Within this domain, outlier detection methodologies have emerged as powerful computational tools for identifying aberrant gene expression patterns that often underlie disease pathogenesis. In Mendelian disorders, which are caused by mutations in single genes, RNA-Seq outlier analysis helps resolve variants of uncertain significance (VUSs) by detecting their functional consequences on transcription [50]. Similarly, in cancer transcriptomics, systematic outlier analysis enables the identification of both overexpressed and underexpressed genes that can reveal tumor-specific vulnerabilities and potential therapeutic targets [74]. The fundamental premise underlying these approaches is that samples exhibiting extreme expression values—deviating significantly from the normal distribution—may harbor biologically significant abnormalities worthy of further investigation.
The clinical implementation of these methods is particularly valuable for rare diseases where traditional diagnostic approaches often fail. For instance, in pediatric cancers and ultra-rare Mendelian conditions, outlier detection pipelines can nominatetherapeutic targets when standard DNA profiling yields no actionable findings [3]. Furthermore, as large-scale RNA-Seq compendia continue to expand, the power of comparative outlier analysis increases accordingly, enabling more robust identification of truly aberrant expression events against diverse background populations. This case study analysis examines the technical methodologies, applications, and implementation protocols for RNA-Seq outlier detection across both Mendelian disorder research and cancer transcriptomics.
Methodological Approaches to Outlier Detection in RNA-Seq Data
Statistical Foundations and Algorithms
Outlier detection in RNA-Seq data employs multiple statistical paradigms, each with distinct strengths and applications. The Z-score method operates under the assumption that expression values follow a normal or approximately normal distribution, identifying outliers as data points falling below mean-3σ or above mean+3σ [75]. For non-normally distributed data, the Interquartile Range (IQR) method defines outliers as observations below Q1 - 1.5×IQR or above Q3 + 1.5×IQR, where Q1 and Q3 represent the 25th and 75th percentiles respectively [75]. More sophisticated approaches include Singular Value Decomposition (SVD) combined with Optimal Hard Thresholding (OHT), as implemented in the OutSingle algorithm, which effectively controls for confounders while detecting outliers in count data [1].
Machine learning techniques further expand the methodological toolbox. Isolation Forest operates by randomly selecting features and split values to "isolate" observations, with anomalous points requiring fewer partitions for isolation [76]. The Local Outlier Factor (LOF) algorithm measures the local deviation of a data point's density compared to its neighbors, effectively identifying samples that lie in low-density regions [76]. For novelty detection, One-Class SVM learns a frontier that delimits the initial observation distribution, classifying new observations that fall outside this boundary as abnormal [76]. The selection of an appropriate method depends on data distribution, sample size, and the specific biological question being addressed.
Computational Tools and Implementations
Several specialized computational tools have been developed specifically for transcriptomic outlier detection. OUTRIDER (Outlier in RNA-Seq Finder) employs an autoencoder-based approach to control for confounders while detecting aberrantly expressed genes, though it requires computationally demanding parameter inference [1]. The recently developed OutSingle method provides a faster alternative using a simple log-normal approach with SVD-based confounder control, demonstrating superior performance in detecting outliers masked by confounding effects [1]. For clinical diagnostics, the CARE (Comparative Analysis of RNA Expression) framework compares a patient's tumor RNA-Seq profile against large compendia of uniformly analyzed tumor profiles (e.g., >11,000 samples) to identify overexpression biomarkers [3].
Additional implementations include PCA-based approaches coupled with bagplots for multi-group outlier detection [77] and bootstrap procedures for estimating outlier probabilities for each sample [77]. The scikit-learn library offers comprehensive implementations of general-purpose outlier detection algorithms adaptable to RNA-Seq data, including IsolationForest, LocalOutlierFactor, and OneClassSVM [76]. These tools collectively enable researchers to identify expression outliers across diverse contexts, from rare disease diagnosis to cancer biomarker discovery.
Table 1: Comparison of Outlier Detection Methods for RNA-Seq Data
| Method | Statistical Foundation | Strengths | Limitations | Primary Application Context |
|---|---|---|---|---|
| Z-score | Normal distribution | Simple, fast | Assumes normality; sensitive to outliers | Initial screening; normally distributed data |
| IQR | Non-parametric | Robust to non-normal distributions | Less powerful for small sample sizes | Skewed distributions; exploratory analysis |
| OutSingle | SVD with OHT | Fast; handles confounders | Log-normal assumption | Large datasets with technical artifacts |
| OUTRIDER | Autoencoder | Models count data | Computationally intensive | RNA-seq count data with complex confounding |
| Isolation Forest | Ensemble learning | No distributional assumptions | May miss low-magnitude outliers | High-dimensional data; novelty detection |
| CARE | Comparative cohort analysis | Leverages large reference datasets | Dependent on reference data quality | Clinical diagnostics; rare tumors |
Application in Mendelian Disorder Diagnostics
Case Study: Molecular Diagnosis of Mitochondriopathy
RNA-Seq outlier analysis has proven particularly valuable for diagnosing Mendelian disorders with heterogeneous genetic causes. A landmark study on 105 fibroblast cell lines from patients with suspected mitochondrial disease demonstrated the power of systematic outlier detection [78]. The analysis pipeline prioritized genes using three complementary strategies: (1) aberrant expression levels (Z-score > 3, adjusted p-value < 0.05), (2) aberrant splicing events detected through annotation-free algorithms, and (3) mono-allelic expression of rare variants [78]. This approach yielded a molecular diagnosis for 10% (5 of 48) of previously undiagnosed mitochondriopathy patients and identified candidate genes for 36 others [78].
Notably, this study identified two significantly downregulated genes encoding mitochondrial proteins—MGST1 and TIMMDC1—in three separate patients [78]. For patient #73804, who presented with infantile-onset neurodegenerative disorder, MGST1 expression was reduced to approximately 2% of control levels, impairing oxidative stress defense mechanisms [78]. For two patients (#35791 and #66744) with muscular hypotonia, developmental delay, and neurological deterioration, TIMMDC1 was nearly undetectable at both RNA and protein levels, causing isolated complex I deficiency [78]. Functional validation through TIMMDC1 re-expression rescued complex I subunit levels, confirming pathogenicity and establishing TIMMDC1 as a novel disease-associated gene [78]. This case exemplifies how expression outlier analysis can resolve previously undiagnosable cases.
Technical Validation and Clinical Implementation
The translation of RNA-Seq outlier analysis from research to clinical diagnostics requires rigorous validation. A recent study established a CLIA-certified RNA-Seq test for Mendelian disorders, validating it on 150 samples including benchmark, negative, and positive controls [79]. The test analyzes RNA from clinically accessible tissues (fibroblasts or blood), detecting outliers in both gene expression and splicing patterns against established reference ranges [79]. Analytical sensitivity and specificity exceeded 99% against benchmark datasets, while clinical validation correctly identified 19 of 20 positive findings with previously established diagnoses from the Undiagnosed Diseases Network [79].
Sequencing depth represents a critical parameter for optimal outlier detection in diagnostic applications. Ultra-deep RNA-Seq (up to ~1 billion reads) substantially improves detection of low-abundance transcripts and rare splicing events that are missed at standard depths (50-150 million reads) [50]. In two probands with VUSs, pathogenic splicing abnormalities were undetectable at 50 million reads but emerged clearly at 200 million reads, becoming more pronounced at 1 billion reads [50]. This has led to the development of resources like MRSD-deep, which provides gene- and junction-level guidelines for minimum required sequencing depth to achieve desired coverage thresholds in clinical applications [50].
Diagram 1: Mendelian Disorder Diagnostic Workflow (76 characters)
Application in Cancer Transcriptomics
Case Study: Colorectal Cancer Cell Line Analysis
In cancer research, transcriptome-wide gene expression outlier analysis enables systematic identification of both overexpression and underexpression events that may represent therapeutic targets. A comprehensive study of 226 colorectal cancer (CRC) cell lines applied a novel computational workflow to RNA-Seq data, with parallel molecular characterization through whole-exome sequencing and DNA methylation profiling [74]. This multi-omics approach identified cell models with abnormally high or low expression for 3,533 and 965 genes, respectively [74]. The resulting atlas of CRC gene expression outliers facilitates the discovery of novel drug targets and biomarkers by associating expression abnormalities with genetic and epigenetic alterations.
A key finding from this study validated the clinical utility of the outlier detection approach. CRC cell lines lacking expression of the MTAP gene demonstrated heightened sensitivity to treatment with the PRMT5-MTA inhibitor MRTX1719 [74]. This exemplifies the concept of synthetic lethality, where loss of a specific gene creates a dependency on another pathway, representing a promising therapeutic strategy. Similarly, the systematic identification of positive outliers (overexpression) for receptor tyrosine kinases and other druggable genes provides a prioritized list of candidate targets for further functional validation [74]. This approach is particularly valuable for cancers like CRC that exhibit high inter-patient heterogeneity and have proven resistant to targeted therapy development.
Integration with Multi-Omics Data
The power of expression outlier analysis in cancer transcriptomics is greatly enhanced through integration with complementary data types. By correlating outlier expression events with copy number variations, somatic mutations, and epigenetic alterations, researchers can distinguish driver events from passenger events [74]. For instance, HER2 overexpression in breast and colorectal cancers often results from gene amplification, while loss of MLH1 expression in sporadic CRC frequently stems from promoter hypermethylation [74]. These integrated analyses help establish mechanistic links between genetic alterations and transcriptional outliers, strengthening the biological rationale for targeting specific outliers.
The CARE framework exemplifies this integrated approach in clinical oncology. In a case of pediatric myoepithelial carcinoma—an ultra-rare tumor with no standard targeted treatments—DNA profiling revealed only INI-1 deficiency (SMARCB1 deletion) without immediately actionable findings [3]. CARE analysis of the tumor RNA-Seq profile compared against 11,427 tumor samples identified overexpression of multiple receptor tyrosine kinases (FGFR1, FGFR2, PDGFRA) and CCND2, suggesting susceptibility to pazopanib and ribociclib, respectively [3]. Although pazopanib failed, ribociclib—selected based on CCND2 overexpression and pathway support—produced a durable clinical response with prolonged stable disease [3]. This case highlights how outlier analysis can identify effective targeted therapies even for extremely rare cancers.
Table 2: Cancer Transcriptomics Outlier Analysis: Key Applications and Findings
| Cancer Type | Sample Size | Outlier Detection Method | Key Findings | Clinical/Translational Impact |
|---|---|---|---|---|
| Colorectal cancer | 226 cell lines | Tukey's rule (1.5×IQR beyond quartiles) | 3,533 overexpressed and 965 underexpressed genes | MTAP loss confers sensitivity to PRMT5 inhibition |
| Myoepithelial carcinoma | 1 case (index patient) | CARE framework vs. 11,427 tumors | CCND2 overexpression with pathway support | Durable response to ribociclib (CDK4/6 inhibitor) |
| Various solid tumors | 151 CRC cell lines + others | Thresholds based on deviation from median | Kinase outliers drive resistance to EGFR blockade | Identified kinases as therapeutic targets |
| Pediatric cancers | Multiple cases | CARE framework with personalized cohorts | Overexpressed oncogenes and receptor tyrosine kinases | Informed targeted therapy selection for rare cancers |
Experimental Protocols
Protocol 1: RNA-Seq Outlier Detection Using OutSingle
Purpose: To detect aberrantly expressed genes in RNA-Seq count data while controlling for confounding factors.
Reagents and Materials:
- RNA-Seq count matrix (genes × samples)
- High-quality RNA samples (RIN > 8)
- Computational resources (Python/R environment)
Procedure:
- Data Preprocessing: Log-transform the count data using the formula:
log2(counts + 1)to approximate a normal distribution [1]. - Z-score Calculation: Compute gene-wise z-scores across samples using the formula:
z = (x - μ) / σ, where x is the expression value, μ is the mean expression, and σ is the standard deviation [1]. - Confounder Control via SVD:
a. Perform Singular Value Decomposition (SVD) on the z-score matrix:
Z = U × Σ × V^T[1]. b. Apply Optimal Hard Threshold (OHT) to determine the number of significant components to retain, removing technical noise [1]. c. Reconstruct the confounder-corrected z-score matrix using only the significant components. - Outlier Detection: Identify outliers in the corrected matrix where |z-score| > 3, corresponding to p < 0.0013 under normal distribution [1].
- Validation: Perform artificial outlier injection using the inverse procedure to validate detection sensitivity and specificity [1].
Notes: OutSingle requires J ≫ N (genes >> samples) for reliable SVD estimation. The implementation is available at https://github.com/esalkovic/outsingle [1].
Protocol 2: CARE Framework for Clinical Oncology
Purpose: To identify targetable overexpression outliers in tumor RNA-Seq data through comparison to large reference compendia.
Reagents and Materials:
- Tumor RNA-Seq data (minimum 50M reads, 100M recommended)
- Uniformly processed reference compendium (>10,000 tumor RNA-Seq profiles)
- High-performance computing infrastructure
Procedure:
- Data Processing: Process both patient tumor and reference samples using identical alignment (STAR) and quantification (RSEM) pipelines to ensure comparability [3].
- Comparator Cohort Selection: a. Pan-cancer analysis: Compare against the entire reference compendium (11,000+ tumors) [3]. b. Pan-disease analysis: Create personalized cohorts including: (i) same diagnosis tumors, (ii) molecularly similar tumors (first-degree neighbors), (iii) expanded molecularly similar tumors (first and second-degree neighbors), and (iv) tumors from diseases most similar to the patient profile [3].
- Outlier Threshold Definition: For each gene, establish outlier thresholds based on expression distribution in the comparator cohort (typically Z-score > 3 or 99th percentile) [3].
- Pathway Analysis: Identify enriched pathways among outlier genes to distinguish biologically coherent signals from random outliers [3].
- Target Prioritization: Prioritize outliers involving druggable genes (kinases, receptors) with consistent pathway support and biological plausibility [3].
Notes: Molecular similarity is assessed by Spearman correlation. Clinical implementation requires CLIA-certified wet lab and computational processes [79].
Diagram 2: Cancer Outlier Analysis Framework (67 characters)
Table 3: Key Research Reagent Solutions for RNA-Seq Outlier Detection Studies
| Resource Category | Specific Examples | Function and Application | Implementation Notes |
|---|---|---|---|
| Reference Data Compendia | Treehouse Childhood Cancer Initiative (11,427 tumors); GTEx; TCGA | Provides normative expression distributions for outlier detection | Must undergo uniform processing; cohort selection critical for sensitivity [3] |
| Computational Tools | OutSingle; OUTRIDER; CARE framework; scikit-learn anomaly detection | Implements statistical and ML algorithms for outlier identification | Tool choice depends on data structure and confounding factors [1] [76] |
| Clinically Accessible Tissues | Skin fibroblasts; peripheral blood; LCLs; iPSCs | Source of RNA when disease tissue is inaccessible | Expression profiles differ from disease tissues; validation required [50] [78] |
| Sequencing Technologies | Illumina (standard-depth); Ultima Genomics (ultra-deep) | Generates transcriptome data for outlier analysis | Ultra-deep sequencing (1B reads) enhances low-abundance transcript detection [50] |
| Multi-omics Integration Tools | Whole-exome sequencing; DNA methylation arrays; proteomics | Correlates expression outliers with genetic/epigenetic alterations | Strengthens biological plausibility of candidate outliers [74] [78] |
| Functional Validation Systems | Cell line models; patient-derived xenografts; CRISPR editing | Confirms biological and therapeutic relevance of identified outliers | Essential for establishing causal relationships [74] [3] |
Outlier detection methods in RNA-Seq analysis have matured into powerful approaches for uncovering the molecular basis of both Mendelian disorders and cancer. The case studies examined herein demonstrate how systematic outlier analysis can identify novel disease genes, resolve variants of uncertain significance, and nominate targeted therapies—particularly valuable for rare conditions where traditional diagnostic approaches fail. As reference compendia continue to expand and sequencing costs decrease, the power and accessibility of these methods will increase accordingly.
The future trajectory of this field points toward several key developments: increased adoption of ultra-deep sequencing in clinical diagnostics to detect rare splicing events and low-abundance transcripts; tighter integration of multi-omics data to distinguish driver from passenger outliers; and continued refinement of confounder control methods to improve specificity. Furthermore, the establishment of CLIA-certified RNA-Seq tests marks a critical step toward routine clinical implementation. As these trends converge, outlier detection in RNA-Seq data will undoubtedly play an increasingly central role in precision medicine, enabling more comprehensive molecular diagnoses and expanding the repertoire of actionable therapeutic targets across the spectrum of human disease.
Best Practices for Method Selection Based on Dataset Characteristics and Research Goals
The selection of appropriate analytical methods is a cornerstone of robust RNA-sequencing (RNA-Seq) analysis, particularly in the critical domain of outlier detection. Methodological choices directly impact the identification of genetically aberrant genes responsible for Mendelian disorders and other pathological states [1]. Research design must navigate the fundamental distinction between exploratory investigations, which seek to generate hypotheses from data without pre-defined hypotheses, and confirmatory research, which tests specific, pre-defined hypotheses [80]. This initial framing is essential, as it dictates the entire analytical pathway. Furthermore, the inherent characteristics of RNA-Seq data—such as its composition of raw count matrices representing molecules or reads per barcode (cell) and transcript, and its typical "large p, small n" problem (many genes, few samples)—demand methods specifically designed for such discrete, high-dimensional data structures [81] [82]. Ignoring these foundational aspects can lead to irreproducible results and faulty biological conclusions, underscoring that proper method selection is not merely a technical step, but a fundamental research integrity issue [80].
Foundational Principles for Selecting Research Methods
A rigorous approach to research methodology establishes a framework for making informed decisions throughout the analytical lifecycle. This begins with a precise research question. In clinical and biological research, frameworks like PICOT (Population, Intervention, Comparator, Outcome, and Time frame) can help refine a vague idea into a testable question [80]. The subsequent choice between qualitative and quantitative methodologies is paramount. Quantitative methods, which deal with numbers, statistics, and confirmatory testing, are the primary mode for RNA-Seq outlier detection [83] [84].
Adherence to good research practices (GRPs) significantly enhances the validity and credibility of findings. Rule 2: Write and register a study protocol is critical. Registering a protocol, which details the research question, hypothesis, design, and planned analyses, reduces bias and safeguards honest research by providing a transparent record of the initial plan [80]. Similarly, Rule 3: Justify your sample size is vital for ensuring statistical robustness. An underpowered study, with too small a sample size, has a high risk of false negatives and often overestimates effect sizes [80]. Finally, Rule 4: Write a data management plan is indispensable in the data-intensive field of genomics, ensuring that data is organized, stored, and protected throughout its life cycle, which is a key outcome of research alongside the publication itself [80].
A Structured Workflow for Method Selection in Outlier Detection
The following workflow provides a step-by-step guide for selecting and applying outlier detection methods in RNA-Seq analysis. This process ensures that decisions are made systematically, based on the specific characteristics of the dataset and the overarching research goals.
Figure 1: A generalized workflow for selecting and applying outlier detection methods in RNA-Seq analysis.
Assess Data Characteristics and Research Objectives
The initial phase involves a thorough characterization of your dataset and a clear definition of what you aim to achieve. This assessment directly informs all subsequent choices. Key considerations include:
- Data Type and Distribution: Confirm that the data is in a count matrix format (barcodes x transcripts) and recognize that it may follow a negative binomial or log-normal distribution rather than a normal distribution [1] [82].
- Sample Size (n) vs. Dimensionality (p): Evaluate the "large p, small n" problem. Methods that perform well with a small number of samples are crucial for many RNA-Seq studies [1] [82].
- Presence of Confounders: Determine if technical artifacts or batch effects are present that could mask biological outliers. This is a primary challenge in real-world datasets [1].
- Research Goal: Explicitly state whether the analysis is confirmatory (testing a specific hypothesis about outlier genes) or exploratory (searching for novel candidate biomarkers without a pre-defined hypothesis) [80].
Implement Quality Control and Preprocessing
Quality control (QC) is a non-negotiable step to ensure that downstream analyses are not distorted by technical noise. The starting point is a single-cell data count matrix, and the goal is to remove barcodes that do not represent intact, viable cells [81]. As shown in Figure 1, this involves:
- Filtering Low-Quality Cells: Typical QC metrics include the number of counts per barcode (count depth), the number of genes per barcode, and the fraction of counts from mitochondrial genes. Cells with a low count depth, few genes, and a high fraction of mitochondrial counts are often dying or broken and should be removed [81].
- Automated Thresholding: For large datasets, automatic thresholding using robust statistics like the Median Absolute Deviation (MAD) is recommended. A common practice is to mark cells as outliers if they differ by 5 MADs from the median, providing a permissive filtering strategy that helps retain rare cell populations [81].
Following QC, data preprocessing prepares the count data for outlier detection. Log-transformation is a critical and widely used step (e.g., calculating xgik = log(ygik + 1) where ygik is the raw count). This transformation helps make the data more continuous and reduces the influence of low-level outliers, making it more amenable to methods that assume normally distributed data [1] [82].
Select and Apply an Outlier Detection Method
The core of the workflow is the selection of an outlier detection algorithm. The choice hinges on the assessment performed in Step 3.1, particularly the sample size and the presence of confounders. The table below summarizes key methods and their optimal use cases.
Table 1: Comparison of RNA-Seq Outlier Detection Methods
| Method Name | Underlying Principle | Optimal Dataset Characteristics | Handling of Confounders | Key Advantages |
|---|---|---|---|---|
| OutSingle [1] | Log-normal modeling with SVD/OHT for confounder control. | Data with strong confounding effects; requires confounder control. | Excellent, via deterministic SVD and Optimal Hard Thresholding. | Almost instantaneous; straightforward to interpret; allows for artificial outlier injection. |
| OUTRIDER [1] | Negative binomial distribution with Autoencoder (AE). | Data with confounding effects where a simpler model fails. | Good, via a denoising autoencoder. | State-of-the-art performance, especially for underexpressed outliers. |
| Median Control Chart [82] | Robust statistical process control using median and MAD. | Small-sample datasets prone to high-level outliers. | Not a primary focus. | High robustness to outliers; effective for small sample sizes. |
| Z-score Approach [1] | Simple log-normal z-scores. | Preliminary analysis on simple datasets without major confounders. | None. | Simple and fast to compute; good for a first pass. |
A Protocol for Confounder-Controlled Outlier Detection with OutSingle
For a typical scenario involving confounding effects, the OutSingle method provides a robust and efficient protocol.
- Research Question: Are there aberrantly expressed genes in this RNA-Seq dataset from patients with a rare Mendelian disease, after controlling for technical batch effects and other confounders?
- Experimental Protocol:
- Input: A J x N RNA-Seq count matrix (J genes, N samples) that has undergone quality control [81].
- Transformation: Calculate gene-specific z-scores from the log-transformed count data [1].
- Confounder Control: Apply Singular Value Decomposition (SVD) to the z-score matrix. Use the Optimal Hard Threshold (OHT) method to denoise the matrix by discarding insignificant singular values, effectively removing confounding variation [1].
- Outlier Calling: Genes with absolute z-scores exceeding a defined threshold (e.g., 3 or 4) in the denoised matrix are flagged as potential outliers [1].
- Validation: The list of outlier genes should be validated through functional annotation and KEGG pathway analysis to assess biological relevance [82].
A Protocol for Robust Outlier Detection in Small Samples
For datasets with a small number of samples where traditional methods struggle with parameter estimation, a robust method is required.
- Research Question: Which genes are significant biomarkers (differentially expressed) between two experimental conditions when our dataset has a small sample size and is potentially influenced by outliers?
- Experimental Protocol:
- Input: A raw RNA-Seq count matrix
ygikfor gene g, condition i, and replicate k [82]. - Transformation: Perform a logarithmic transformation:
xgik = log(ygik + 1)[82]. - Outlier Detection & Modification: For each gene in each condition, calculate the median (
MEDg,(i)) and Median Absolute Deviation (MADg,(i)). Identify and replace any outlying observations (those falling outsideMEDg,(i) ± 3*MADg,(i)) with the group median [82]. - Analysis: Apply traditional biomarker selection methods (e.g., DESeq2, edgeR, limma) to this Modified RNA-Seq (MRS) dataset to identify differentially expressed genes with improved reliability [82].
- Input: A raw RNA-Seq count matrix
Data Presentation and Visualization Strategies
Effectively communicating the results of an outlier detection analysis is as important as the analysis itself. Choosing the right visualizations allows researchers and stakeholders to quickly grasp key findings.
Table 2: Selecting Data Visualizations for RNA-Seq Outlier Analysis
| Goal of Communication | Recommended Visualization | Rationale and Best Practices |
|---|---|---|
| Compare final outlier lists(e.g., genes per method) | Bar Chart [85] [86] [87] | Simplest chart for comparing quantities across categories (e.g., methods). The bar length is proportional to the number of outliers detected. |
| Show trends over time or conditions | Line Chart [85] [87] | Ideal for displaying the progression of a continuous variable, such as the expression level of a gene across a time series. |
| Display distribution of a QC metric(e.g., counts per cell) | Histogram [85] [81] | Shows the frequency distribution of continuous data, helping to identify the overall distribution and potential outliers in QC metrics. |
| Show detailed, precise values(e.g., raw counts of top outliers) | Table [87] [88] | Superior when the audience needs exact numerical values for detailed analysis and reference. Best for technical audiences. |
| Illustrate the entire analysis workflow | Flowchart / Diagram [88] | Provides a high-level overview of the complex, multi-step process, making the methodology clear and accessible (as in Figure 1). |
Figure 2: A decision guide for selecting the most effective data visualization based on your audience and the message you need to convey.
Successful execution of an RNA-Seq outlier detection project relies on a suite of computational "reagents" and resources.
Table 3: Research Reagent Solutions for RNA-Seq Outlier Analysis
| Tool / Resource | Category | Primary Function | Application in Workflow |
|---|---|---|---|
| Scanpy [81] | Software Library | Single-cell RNA-seq data analysis in Python. | Environment setup, data loading, QC metric calculation (e.g., sc.pp.calculate_qc_metrics), and filtering. |
| OutSingle [1] | Algorithm / Software | Outlier detection and injection using SVD/OHT. | The core method for confounder-controlled outlier detection after preprocessing. |
| edgeR / DESeq2 [1] [82] | Differential Expression Tool | Identify differentially expressed genes using NB models. | Used as the final analysis step on a dataset preprocessed with a robust method like the Median Control Chart. |
| Median Absolute Deviation (MAD) [81] | Statistical Metric | Robust measure of data variability. | Used for automatic thresholding during quality control to filter low-quality cells. |
| Singular Value Decomposition (SVD) [1] | Mathematical Technique | Matrix factorization to identify latent factors. | The core mechanism in OutSingle for isolating and removing confounding variation from the data. |
| KEGG / GO Databases [82] | Biological Database | Functional annotation and pathway information. | Used for the validation and biological interpretation of the final list of outlier genes. |
Conclusion
Effective outlier detection is no longer optional but essential for robust RNA-Seq analysis, directly impacting the validity of downstream results in both basic research and clinical applications. This comprehensive review demonstrates that method selection should be guided by specific experimental contexts—with OUTRIDER excelling in confounder control, OutSingle offering computational efficiency, and robust PCA providing objective detection. As RNA-Seq applications expand into single-cell sequencing and multi-omics integration, future developments must focus on scalable algorithms that can distinguish biological outliers representing novel biology from technical artifacts. Embracing these sophisticated outlier detection methods will significantly enhance biomarker discovery for drug development, improve diagnostic accuracy in rare diseases, and ultimately advance the frontiers of precision medicine.
References
- 1. a novel method of detecting and injecting outliers in RNA ... [https://pmc.ncbi.nlm.nih.gov/articles/PMC10089674/]
- 2. Patterns of extreme outlier gene expression suggest an edge ... [https://genomebiology.biomedcentral.com/articles/10.1186/s13059-025-03709-0]
- 3. Comparative analysis of RNA expression identifies ... [https://www.nature.com/articles/s41698-025-00918-5]
- 4. Transcriptome-wide outlier approach identifies individuals ... [https://www.medrxiv.org/content/10.1101/2025.01.02.24318941v1]
- 5. A survey of best practices for RNA-seq data analysis [https://genomebiology.biomedcentral.com/articles/10.1186/s13059-016-0881-8]
- 6. Transcriptome-wide outlier approach identifies individuals ... [https://pmc.ncbi.nlm.nih.gov/articles/PMC11722475/]
- 7. Transcriptome-wide outlier approach identifies individuals ... [https://www.sciencedirect.com/science/article/pii/S0002929725003507]
- 8. a practical guide to RNA sequencing data analysis [https://pmc.ncbi.nlm.nih.gov/articles/PMC12599993/]
- 9. Cracking rare disorders: a new minimally invasive RNA- ... [https://www.nature.com/articles/s41525-025-00502-7]
- 10. Outlier-Based Differential Expression Analysis in Proteomics ... [https://pmc.ncbi.nlm.nih.gov/articles/PMC3179374/]
- 11. Transcriptome-wide outlier approach identifies individuals ... [https://pubmed.ncbi.nlm.nih.gov/40975062/]
- 12. Outlier analysis for accelerating clinical discovery [https://pmc.ncbi.nlm.nih.gov/articles/PMC11111092/]
- 13. Bayesian Framework for Detecting Gene Expression Outliers ... [https://pubmed.ncbi.nlm.nih.gov/32097024/]
- 14. An outlier approach: advancing diagnosis of neurological ... [https://www.nature.com/articles/s41525-025-00493-5]
- 15. RNA Sequencing Can Increase Diagnostic Rate for Rare ... [https://www.insideprecisionmedicine.com/news-and-features/rna-sequencing-can-increase-diagnostic-rate-for-rare-diseases/]
- 16. Confounding Variables in Quantitative Studies [https://www.nngroup.com/articles/confounding-variables-quantitative-ux/]
- 17. Differentially expressed heterogeneous overdispersion ... [https://pmc.ncbi.nlm.nih.gov/articles/PMC11253971/]
- 18. Statistical models for RNA-seq data derived from a two- ... [https://pmc.ncbi.nlm.nih.gov/articles/PMC4754627/]
- 19. - RNA Experimental Design - MBITE Tutorials seq [https://mbite.org/tutorials/rna_seq_exp_design/rna_seq_experimental_design/]
- 20. Introduction to Sequencing: Working with RNA-seq count data [https://statomics.github.io/SGA/sequencing_countData.html]
- 21. 7 Normalization, confounders and batch correction | Analysis of single... [https://biocellgen-public.svi.edu.au/mig_2019_scrnaseq-workshop/normalization-confounders-and-batch-correction.html]
- 22. Computational and analytical challenges in... | Nature Reviews Genetics [https://www.nature.com/articles/nrg3833?error=cookies_not_supported&code=e6742b9f-7b17-41da-836c-9e5168879114]
- 23. Negative Binomial Distribution - an overview [https://www.sciencedirect.com/topics/mathematics/negative-binomial-distribution]
- 24. OUTRIDER: A Statistical Method for Detecting Aberrantly ... [https://pmc.ncbi.nlm.nih.gov/articles/PMC6288422/]
- 25. OUTRIDER – a statistical method for detecting aberrantly ... [https://www.rna-seqblog.com/outrider-a-statistical-method-for-detecting-aberrantly-expressed-genes-in-rna-sequencing-data/]
- 26. Probabilistic Outlier Identification for RNA Sequencing ... [https://www.bioconductor.org/packages/devel/bioc/vignettes/ppcseq/inst/doc/introduction.html]
- 27. Probabilistic outlier identification for RNA sequencing ... [https://pmc.ncbi.nlm.nih.gov/articles/PMC7936652/]
- 28. OUTRIDER (development version) [https://bioconductor.org/packages/devel/bioc/html/OUTRIDER.html]
- 29. Robust principal component analysis for accurate outlier ... [https://pubmed.ncbi.nlm.nih.gov/32600248/]
- 30. OutSingle - A Python tool for finding outliers in RNA-Seq ... [https://github.com/esalkovic/outsingle]
- 31. Denoiseit: denoising gene expression data using rank based ... [https://bmcbioinformatics.biomedcentral.com/articles/10.1186/s12859-024-05899-z]
- 32. Robust principal component analysis for accurate outlier sample ... [https://www.omicsdi.org/dataset/biostudies-literature/S-EPMC7324992]
- 33. PCA QC for GWAS: Outlier & Stratification Detection Guide [https://www.cd-genomics.com/pop-genomics/resources/pca-qc-outlier-detection.html]
- 34. Deseq2 output and robust PCA (PcaGrid and PcaHubert) [https://www.biostars.org/p/9585376/]
- 35. Prior and Posterior Predictive Checks - PyMC [https://www.pymc.io/projects/docs/en/v5.10.2/learn/core_notebooks/posterior_predictive.html]
- 36. The Expected Behaviors of Posterior Predictive Tests and ... [https://pmc.ncbi.nlm.nih.gov/articles/PMC10946647/]
- 37. 26.3 Posterior ``p-values'' | Stan User's Guide [https://mc-stan.org/docs/2_26/stan-users-guide/posterior-p-values.html]
- 38. Leave-One-Out Cross-Validation Explained [https://medium.com/@pacosun/one-out-all-in-leave-one-out-cross-validation-explained-409df5ff6385]
- 39. Navigating single-cell RNA-sequencing: protocols, tools ... [https://pmc.ncbi.nlm.nih.gov/articles/PMC12085826/]
- 40. Robust principal component analysis for accurate outlier ... [https://bmcbioinformatics.biomedcentral.com/articles/10.1186/s12859-020-03608-0]
- 41. [Tutorial] Bulk RNA-seq DE analysis [https://informatics.fas.harvard.edu/resources/tutorials/differential-expression-analysis/]
- 42. Current best practices in single‐cell RNA‐seq analysis [https://pmc.ncbi.nlm.nih.gov/articles/PMC6582955/]
- 43. Detection of aberrant splicing events in RNA-seq data ... [https://www.nature.com/articles/s41467-020-20573-7]
- 44. Optimized murine sample sizes for RNA sequencing ... [https://www.nature.com/articles/s41467-025-65022-5]
- 45. Navigating single-cell RNA-sequencing: protocols, tools ... [https://genomicsinform.biomedcentral.com/articles/10.1186/s44342-025-00044-5]
- 46. Selecting differential splicing methods - PubMed Central - NIH [https://pmc.ncbi.nlm.nih.gov/articles/PMC12308171/]
- 47. Powerful scRNA-seq Data Analysis Tools in 2025 [https://www.nygen.io/resources/blog/single-cell-scrna-seq-multi-omics-data-analysis-tools]
- 48. Clinical validation of RNA sequencing for Mendelian ... [https://pmc.ncbi.nlm.nih.gov/articles/PMC12081282/]
- 49. OUTRIDER: A Statistical Method for Detecting Aberrantly ... [https://www.sciencedirect.com/science/article/pii/S0002929718304014]
- 50. The utility of ultra-deep RNA sequencing in Mendelian ... [https://www.sciencedirect.com/science/article/pii/S0002929725003696]
- 51. A comprehensive assessment of RNA-seq accuracy ... [https://pmc.ncbi.nlm.nih.gov/articles/PMC4321899/]
- 52. A comprehensive workflow for optimizing RNA-seq data analysis [https://bmcgenomics.biomedcentral.com/articles/10.1186/s12864-024-10414-y]
- 53. Denoising single-cell RNA-seq data with a deep learning- ... [https://pmc.ncbi.nlm.nih.gov/articles/PMC12629073/]
- 54. Removing unwanted variation from large-scale RNA ... [https://www.nature.com/articles/s41587-022-01440-w]
- 55. An Iterative Leave-One-Out Approach to Outlier Detection ... [https://pmc.ncbi.nlm.nih.gov/articles/PMC4454687/]
- 56. An Iterative Leave-One-Out Approach to Outlier Detection ... [https://www.rna-seqblog.com/an-iterative-leave-one-out-approach-to-outlier-detection-in-rna-seq-data/]
- 57. How Machine Learning and Statistical Models Advance ... [https://www.frontiersin.org/journals/molecular-biosciences/articles/10.3389/fmolb.2021.647277/full]
- 58. Cracking rare disorders: a new minimally invasive RNA ... [https://pmc.ncbi.nlm.nih.gov/articles/PMC12120114/]
- 59. Integration of Bulk RNA-seq Pipeline Metrics for Assessing ... [https://pmc.ncbi.nlm.nih.gov/articles/PMC12236924/]
- 60. A real-world multi-center RNA-seq benchmarking study ... [https://www.nature.com/articles/s41467-024-50420-y]
- 61. Taming outliers in biomedical research: A handy guide - Editage [https://www.editage.com/insights/taming-outliers-in-biomedical-research-a-handy-guide]
- 62. 3.2 Outlier Detection and Handling in Health Data [https://book.datascience.appliedhealthinformatics.com/docs/Ch3/outliers]
- 63. Outlier Detection System: An Essential Tool for Data ... [https://medium.com/@tarangds/outlier-detection-system-an-essential-tool-for-data-integrity-and-analytics-e6fa59875a5d]
- 64. HybridQC: Machine Learning-Augmented Quality Control ... [https://arxiv.org/html/2507.08058v1]
- 65. Fluctuation-based outlier detection | Scientific Reports [https://www.nature.com/articles/s41598-023-29549-1]
- 66. Blood RNA-seq in rare disease diagnostics: a comparative ... [https://translational-medicine.biomedcentral.com/articles/10.1186/s12967-025-06609-w]
- 67. Assessing Outlier Probabilities in Transcriptomics Data ... [https://www.mdpi.com/2073-4425/14/2/387]
- 68. Robustness of differential gene expression analysis ... [https://www.sciencedirect.com/science/article/pii/S200103702100221X]
- 69. A Framework for Comparison and Assessment of Synthetic ... [https://www.mdpi.com/2073-4425/13/12/2362]
- 70. Robust principal component analysis for accurate outlier ... [https://pmc.ncbi.nlm.nih.gov/articles/PMC7324992/]
- 71. saseR: Juggling offsets unlocks RNA-seq tools for fast and ... [https://pmc.ncbi.nlm.nih.gov/articles/PMC11507730/]
- 72. Orthogonal outlier detection and dimension estimation for ... [https://www.frontiersin.org/journals/bioinformatics/articles/10.3389/fbinf.2023.1211819/full]
- 73. New approaches and technical considerations in detecting ... [https://bmcmedresmethodol.biomedcentral.com/articles/10.1186/s12874-023-02045-w]
- 74. Transcriptome‐wide gene expression outlier analysis ... [https://pmc.ncbi.nlm.nih.gov/articles/PMC11161737/]
- 75. Guide on Outlier Detection Methods [https://www.analyticsvidhya.com/blog/2021/05/feature-engineering-how-to-detect-and-remove-outliers-with-python-code/]
- 76. 2.7. Novelty and Outlier Detection [https://scikit-learn.org/stable/modules/outlier_detection.html]
- 77. Assessing Outlier Probabilities in Transcriptomics Data ... [https://pmc.ncbi.nlm.nih.gov/articles/PMC9956321/]
- 78. Genetic diagnosis of Mendelian disorders via RNA ... [https://www.nature.com/articles/ncomms15824]
- 79. Clinical validation of RNA sequencing for Mendelian ... [https://www.medrxiv.org/content/10.1101/2024.08.15.24312057v1]
- 80. Ten simple rules for good research practice - PMC [https://pmc.ncbi.nlm.nih.gov/articles/PMC9223329/]
- 81. 6. Quality Control — Single-cell best practices [https://www.sc-best-practices.org/preprocessing_visualization/quality_control.html]
- 82. Robust and efficient identification of biomarkers... | F1000Research [https://f1000research.com/articles/8-7]
- 83. Choosing the Right Research Methodology: A Guide [https://scientific-publishing.webshop.elsevier.com/research-process/choosing-the-right-research-methodology-a-guide-for-researchers/]
- 84. Selecting Research Methods | Teaching + Learning Lab - MIT [https://tll.mit.edu/research-evaluation/selecting-research-methods/]
- 85. 7 Best Comparison Charts for Effective Data Visualization [https://ninjatables.com/types-of-comparison-charts/?srsltid=AfmBOor4bH5D5sS20HmMQ56yW9l4sYrn6TW_mN3FXWIA_7nMgFLg2RPb]
- 86. 80 types of charts & graphs for data visualization (with ... [https://www.datylon.com/blog/types-of-charts-graphs-examples-data-visualization]
- 87. Charts vs. Tables: When to Use One Over the Other? [https://wpdatatables.com/charts-vs-tables/]
- 88. Utilizing tables, figures, charts and graphs to enhance the ... [https://pmc.ncbi.nlm.nih.gov/articles/PMC10394528/]