A Comprehensive Guide to RNA-Seq Alignment with STAR: From Basics to Advanced Optimization for Biomedical Research
This article provides a complete roadmap for researchers and drug development professionals to implement and optimize the STAR (Spliced Transcripts Alignment to a Reference) aligner for RNA-seq data analysis.
A Comprehensive Guide to RNA-Seq Alignment with STAR: From Basics to Advanced Optimization for Biomedical Research
Abstract
This article provides a complete roadmap for researchers and drug development professionals to implement and optimize the STAR (Spliced Transcripts Alignment to a Reference) aligner for RNA-seq data analysis. Covering foundational principles, step-by-step methodologies, advanced troubleshooting, and validation techniques, this guide translates complex computational procedures into actionable knowledge. Readers will learn to construct genome indices, execute alignment commands, interpret results, and integrate STAR into robust pipelines for reliable gene expression quantification, forming a critical foundation for downstream differential expression and functional analysis in biomedical research.
Understanding STAR: The Principles of RNA-seq Read Alignment
Why STAR? Addressing the Unique Challenges of RNA-seq Alignment
RNA sequencing (RNA-seq) has become an indispensable tool in transcriptomics, enabling researchers to analyze the continuously changing cellular transcriptome at unprecedented resolution and depth [1]. Unlike DNA sequencing, RNA-seq data presents unique computational challenges primarily due to the processed nature of RNA transcripts. Eukaryotic cells reorganize genomic information by splicing together non-contiguous exons, creating mature transcripts that do not exist as single contiguous segments in the genome [2]. This biological reality means that RNA-seq reads often span splice junctions, requiring aligners to map sequences to non-adjacent genomic locations—a task that conventional DNA aligners cannot perform effectively.
The critical importance of accurate alignment extends throughout the entire analytical pipeline. Alignment serves as the foundational step for all subsequent analyses, including differential expression testing, novel isoform discovery, and fusion gene detection. Inaccurate alignment can propagate errors downstream, potentially leading to false positives or incorrect biological conclusions [3]. This challenge is particularly acute in clinical research settings, where transcriptomics of Formalin-Fixed Paraffin-Embedded (FFPE) samples has become a vanguard of precision medicine, making the choice of bioinformatics tools critical for reliable results [3].
STAR's Algorithmic Innovation
Core Algorithmic Principles
STAR (Spliced Transcripts Alignment to a Reference) employs a novel two-step algorithm specifically designed to address the fundamental challenges of RNA-seq mapping [4] [2]. This approach represents a significant departure from earlier methods that were often extensions of DNA short read mappers.
The first phase, seed searching, utilizes a concept called Maximal Mappable Prefix (MMP) [2]. For each read, STAR identifies the longest substring starting from the read's beginning that exactly matches one or more locations in the reference genome. When a splice junction is encountered, the algorithm sequentially searches for the next MMP in the unmapped portion of the read. This sequential application of MMP search exclusively to unmapped regions makes the STAR algorithm extremely efficient compared to methods that perform full-length exact match searches [2]. The implementation uses uncompressed suffix arrays (SAs), which provide logarithmic scaling of search time with reference genome size, enabling fast performance even with large genomes [2].
The second phase involves clustering, stitching, and scoring [4]. The separately aligned seeds are clustered based on proximity to "anchor" seeds, which are preferentially selected from seeds with unique genomic locations. A dynamic programming algorithm then stitches these seeds together, allowing for mismatches, insertions, deletions, and, crucially, large gaps representing introns [2]. The final alignments are scored based on user-defined penalties for mismatches and indels, with the highest-scoring alignment selected as optimal.
Advantages for Spliced Alignment
STAR's algorithmic design provides several distinct advantages for spliced alignment. Unlike methods that rely on pre-defined junction databases, STAR performs unbiased de novo detection of both canonical and non-canonical splices in a single alignment pass [2]. This capability enables discovery of novel splice junctions without prior knowledge. The approach also naturally accommodates various read lengths with moderate error rates, making it scalable for emerging sequencing technologies [5]. Furthermore, STAR can identify chimeric (fusion) transcripts by clustering and stitching seeds from distal genomic loci, different chromosomes, or different strands [2].
Table 1: Key Algorithmic Advantages of STAR for RNA-seq Alignment
| Feature | Technical Approach | Benefit |
|---|---|---|
| Spliced Alignment | Sequential Maximal Mappable Prefix (MMP) search | Accurate mapping across splice junctions without prior knowledge |
| Speed | Uncompressed suffix arrays with logarithmic search time | 50x faster than other aligners [4] |
| Novel Junction Detection | Single-pass genome alignment without junction databases | Unbiased discovery of canonical and non-canonical splices |
| Fusion Detection | Clustering of seeds from distal genomic loci | Identification of chimeric transcripts |
| Multimapping Reads | Recording all distinct genomic matches for each MMP | Comprehensive handling of reads with multiple mapping locations |
Comparative Performance Analysis
Benchmarking Against Other Aligners
Multiple studies have systematically evaluated STAR's performance against other RNA-seq aligners. In a comprehensive comparison focusing on sensitivity and accuracy, STAR demonstrated superior alignment precision, particularly when analyzing challenging samples such as early neoplasia from FFPE specimens [3]. The study revealed that HISAT2, while efficient, was prone to misaligning reads to retrogene genomic loci, whereas STAR generated more precise alignments across all sample types [3].
The most notable advantage of STAR is its exceptional mapping speed. Benchmarking tests demonstrate that STAR outperforms other aligners by a factor of more than 50, enabling it to align approximately 550 million 2×76 bp paired-end reads per hour on a modest 12-core server [2]. This extraordinary efficiency does not come at the expense of accuracy, as STAR simultaneously improves both alignment sensitivity and precision compared to other tools [2].
Table 2: Performance Comparison of RNA-seq Aligners
| Aligner | Mapping Speed | Memory Usage | Splice Detection | Best Use Case |
|---|---|---|---|---|
| STAR | ~550 million PE reads/hour (12 cores) [2] | High [4] | Annotation-free novel junction discovery [2] | Large datasets, novel isoform discovery |
| HISAT2 | Moderate | Moderate | Uses known splice sites | Standard differential expression analysis |
| Kallisto | Very high (pseudoalignment) | Low | Reference-based only [6] | Rapid quantification of known transcripts |
| TopHat2 | Slow | Moderate | Limited novel junction discovery | Legacy datasets |
Impact on Downstream Analyses
The choice of aligner significantly influences downstream differential expression results. Studies comparing bioinformatics pipelines have found that alignment differences propagate to gene expression counts and consequently affect the lists of differentially expressed genes identified [3]. When using the same differential expression tool (edgeR or DESeq2), aligner choice resulted in substantially different gene lists, with STAR-generated alignments producing more reliable and conservative results, especially for FFPE samples [3].
STAR's comprehensive output options facilitate diverse downstream analyses. In addition to standard SAM/BAM files, STAR can generate signals useful for visualization, junction files for splice junction analysis, and transcriptome BAM files for streamlined quantification [5]. This flexibility makes STAR suitable for various applications beyond standard gene expression quantification, including novel isoform reconstruction and detection of non-canonical splicing events.
Experimental Protocols and Implementation
STAR Alignment Workflow
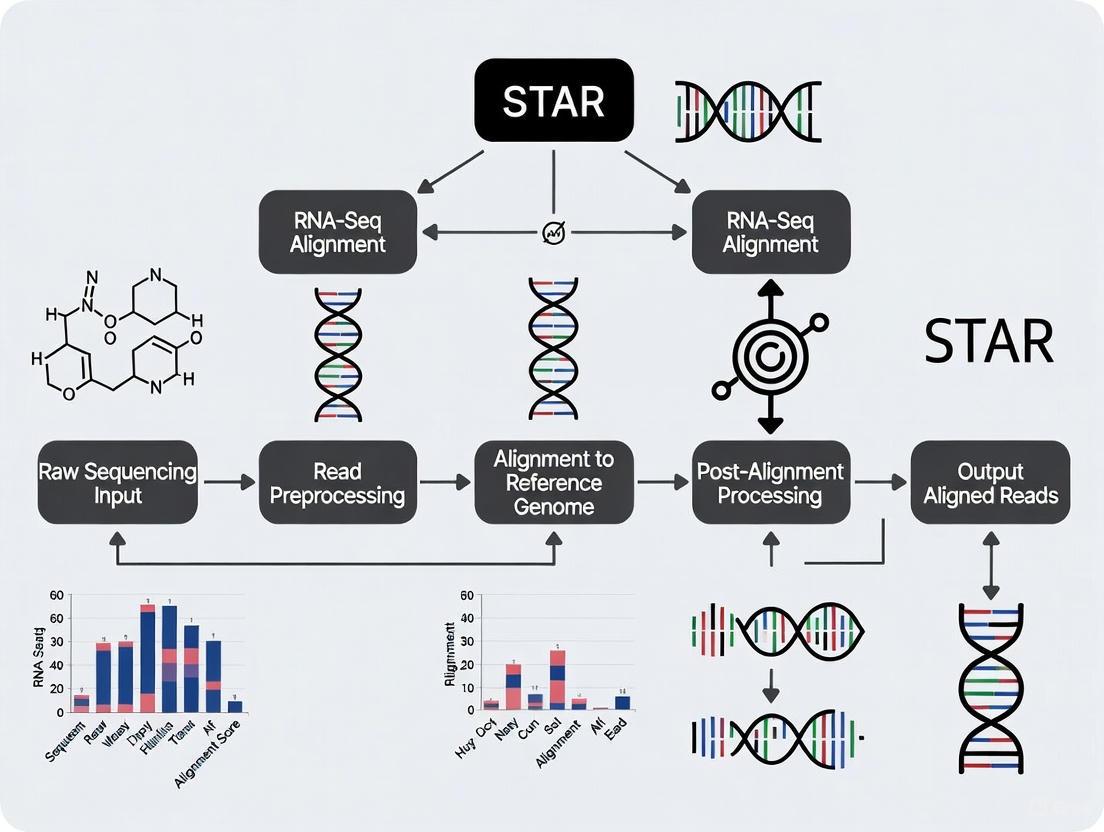
The following diagram illustrates the complete RNA-seq analysis workflow using STAR, from raw sequencing data to read count quantification:
Genome Index Generation
Creating a comprehensive genome index is the critical first step in STAR alignment. Proper index generation ensures optimal mapping performance and accuracy.
Protocol:
- Obtain reference sequences: Download genome FASTA files and corresponding annotation GTF files from authoritative sources like ENSEMBL or UCSC.
- Configure computing resources: Allocate sufficient memory (typically 32GB for mammalian genomes) and multiple CPU cores to accelerate the process.
- Execute indexing command: Run STAR in genomeGenerate mode with appropriate parameters.
Example Code:
Critical Parameters:
--runThreadN: Number of parallel threads to use (increases speed)--genomeDir: Directory to store genome indices--sjdbOverhang: Read length minus 1; critical for junction detection--genomeSAindexNbases: Adjust for small genomes (e.g., 10 for yeast)
Read Alignment Protocol
Once the genome index is prepared, actual read alignment can proceed efficiently.
Protocol:
- Quality assessment: Examine raw FASTQ files with FastQC to identify potential issues.
- Adapter trimming: Remove adapter sequences, poly-A tails, and low-quality bases using tools like Cutadapt [7].
- Alignment execution: Run STAR with parameters optimized for your experimental design.
- Output processing: Convert results to sorted BAM files for downstream analysis.
Example Code:
Troubleshooting Tips:
- Low alignment rates may indicate poor RNA quality or adapter contamination [7]
- Increase
--outFilterMultimapNmaxfor genomes with high repeat content - Adjust
--alignIntronMinand--alignIntronMaxfor non-mammalian species - Use
--twopassMode Basicfor novel junction discovery in complex genomes
Successful RNA-seq analysis requires both wet-lab reagents and computational resources. The following table details essential components for a complete STAR-based RNA-seq workflow:
Table 3: Essential Research Reagents and Computational Resources for STAR RNA-seq Analysis
| Item | Function | Examples/Specifications |
|---|---|---|
| RNA Extraction Kit | Isolate high-quality RNA from samples | Column-based or magnetic bead systems |
| RNA Quality Assessment | Evaluate RNA integrity | Bioanalyzer RNA Integrity Number (RIN) > 8 |
| Library Prep Kit | Prepare sequencing libraries | Illumina TruSeq Stranded mRNA |
| Reference Genome | Genomic sequence for alignment | ENSEMBL GRCh38 (human), GRCm39 (mouse) |
| Gene Annotation | Genomic feature coordinates | ENSEMBL GTF format, release-specific |
| Computing Server | Alignment and analysis | 16+ cores, 64GB+ RAM, SSD storage |
| STAR Software | RNA-seq alignment | Latest version from GitHub [5] |
| SAMtools | BAM file processing | Version 1.17 or higher [1] |
| FeatureCounts | Read quantification | Part of Subread package [3] [1] |
STAR represents a significant advancement in RNA-seq alignment technology, specifically addressing the unique challenges posed by spliced transcripts through its innovative two-step algorithm. Its exceptional speed, accuracy, and capability for novel junction detection make it particularly suitable for modern transcriptomics studies, especially those involving large datasets or exploratory analyses where prior knowledge of splicing events is limited. The implementation protocols and troubleshooting guidance provided in this article will enable researchers to effectively incorporate STAR into their RNA-seq workflows, generating reliable alignment results that form a solid foundation for downstream differential expression and splicing analyses.
As RNA-seq technologies continue to evolve toward longer reads and higher throughput, STAR's alignment strategy—with its focus on comprehensive spliced alignment and efficient handling of large volumes of data—positions it as a robust solution capable of meeting the evolving demands of transcriptomics research in both basic science and drug development contexts.
RNA sequencing (RNA-seq) has become the primary method for transcriptome analysis, providing unprecedented detail about the RNA landscape and gene expression regulation [8]. A critical and challenging step in RNA-seq analysis is read alignment, where sequenced fragments are mapped to a reference genome. This process is complicated by the non-contiguous structure of eukaryotic transcripts, where exons are spliced together to form mature mRNA [2]. The Spliced Transcripts Alignment to a Reference (STAR) software was developed specifically to address these challenges through a novel two-step algorithm that enables accurate spliced alignment while maintaining exceptional speed [2] [9].
STAR was designed to analyze large-scale RNA-seq datasets, such as the ENCODE Transcriptome project which contained >80 billion reads [2]. Traditional aligners developed for DNA sequencing struggled with RNA-seq data because they could not efficiently handle reads spanning splice junctions. STAR's algorithm fundamentally differs from these earlier approaches by performing direct RNA-seq alignment to the genome without relying on pre-defined splice junction databases [2]. This report details STAR's two-step methodology and provides practical protocols for implementation within RNA-seq workflows.
The STAR Algorithm: Core Components
The STAR algorithm employs a structured two-phase approach to align RNA-seq reads. The table below summarizes the key stages:
Table 1: The Two-Step STAR Alignment Algorithm
| Step | Process | Key Operation | Output |
|---|---|---|---|
| 1. Seed Searching | Identifies exactly matching sequences between reads and reference | Sequential Maximal Mappable Prefix (MMP) search using uncompressed suffix arrays | Individual "seed" alignments for portions of each read |
| 2. Clustering, Stitching & Scoring | Combines seeds into complete read alignments | Clusters seeds by genomic proximity, stitches with dynamic programming | Complete alignments, including spliced junctions |
Seed Searching with Maximal Mappable Prefixes
The seed searching phase identifies the longest sequences from reads that exactly match the reference genome. For each read, STAR searches sequentially for Maximal Mappable Prefixes - the longest substring starting from read position i that matches one or more locations in the reference genome exactly [2]. When STAR encounters a read containing a splice junction, it cannot map the entire read contiguously. The algorithm finds the first MMP up to the donor splice site (seed1), then searches the unmapped portion of the read to find the next MMP starting from the acceptor splice site (seed2) [4].
This sequential searching of only unmapped portions represents a key innovation that makes STAR extremely efficient compared to aligners that perform full read searches before splitting reads [4]. STAR implements MMP search through uncompressed suffix arrays, which enable logarithmic-time searching against large reference genomes [2]. The suffix array approach provides significant speed advantages over compressed suffix arrays used in other aligners, though it trades off increased memory usage [2] [10].
Figure 1: STAR's Sequential Seed Search Process. The algorithm repeatedly finds Maximal Mappable Prefixes until the entire read is mapped.
Clustering, Stitching, and Scoring
In the second phase, STAR builds complete alignments by combining the seeds identified during seed searching. The process begins with clustering, where seeds are grouped by proximity to selected "anchor" seeds - typically those with unique genomic mappings [2]. Seeds clustering within user-defined genomic windows (which determine maximum intron size) are considered for stitching.
The stitching process uses a frugal dynamic programming algorithm to connect seed pairs, allowing for mismatches but typically only one insertion or deletion [2]. For paired-end reads, STAR processes mates concurrently as a single sequence, increasing alignment sensitivity as correct alignment of one mate can guide proper alignment of the entire fragment [2].
Finally, the algorithm performs scoring to evaluate alignment quality based on mismatches, indels, and gaps. STAR can also identify chimeric alignments where different read parts map to distal genomic loci, enabling detection of fusion transcripts [2].
Figure 2: Clustering, Stitching, and Scoring Phase. Seeds are combined into complete alignments through a three-stage process.
Performance and Comparative Analysis
Performance Benchmarks
STAR's algorithm provides significant advantages in both speed and accuracy compared to earlier RNA-seq aligners:
Table 2: STAR Performance Metrics
| Metric | Performance | Context |
|---|---|---|
| Mapping Speed | >50x faster than other aligners [2] | 550 million 2×76 bp paired-end reads/hour on 12-core server |
| Splice Junction Precision | 80-90% validation rate [2] | Experimental validation of 1,960 novel junctions |
| Read Length Flexibility | Capable of mapping both short and long reads [2] | Suitable for emerging third-generation sequencing |
| Alignment Rate | High performance across diverse datasets [10] | Compared against Bowtie2, HISAT2, BWA, TopHat2 |
STAR achieves its exceptional speed through efficient MMP searching in uncompressed suffix arrays, avoiding the computational overhead of converting compressed indices back to reference sequences [2] [10]. This speed advantage comes with higher memory requirements than FM-index-based aligners, making STAR particularly suitable for systems with sufficient RAM [10].
Comparative Analysis with Other Aligners
When evaluated against other commonly used aligners (Bowtie2, BWA, HISAT2, TopHat2), STAR demonstrates excellent performance in alignment rate and gene coverage, particularly for longer transcripts (>500 bp) [10]. HISAT2, which superseded TopHat2, runs approximately 3-fold faster than the next fastest aligner, though runtime is generally considered secondary to alignment accuracy for most applications [10].
Different aligners show variations in performance across species, underscoring the importance of selecting alignment tools appropriate for specific research contexts [8]. For plant pathogenic fungi data analysis, comprehensive testing of 288 pipelines revealed that optimal tool selection significantly impacts result accuracy [8].
Practical Implementation Protocols
Research Reagent Solutions
Table 3: Essential Research Reagents and Computational Resources for STAR Alignment
| Resource Type | Specific Example | Function in STAR Workflow |
|---|---|---|
| Reference Genome | GRCh38 (human), GRCm39 (mouse), or species-specific | Provides sequence reference for read alignment [4] |
| Annotation File | GTF/GFF3 file from Ensembl, RefSeq, or GENCODE | Defines gene models for alignment and quantification [4] [11] |
| Computational Resources | 16-32 GB RAM, multiple CPU cores | Enables efficient genome indexing and alignment [4] [11] |
| Quality Control Tools | FastQC, fastp, Trim Galore | Assesses and improves read quality before alignment [8] |
| Sequence Data | FASTQ files (paired-end recommended) | Input data for alignment process [12] |
STAR Alignment Protocol
Genome Index Generation
Creating a custom genome index is required before read alignment:
Protocol Note: The --sjdbOverhang parameter should be set to read length minus 1. For reads of varying length, the ideal value is max(ReadLength)-1, though the default value of 100 works similarly in most cases [4].
Read Alignment
Once genome indices are prepared, perform read alignment:
This command generates a sorted BAM file with coordinate-sorted alignments and a file containing read counts per gene, which can be used for downstream differential expression analysis [4] [11].
Workflow Integration
STAR aligns effectively into comprehensive RNA-seq workflows. The nf-core RNA-seq pipeline implements a "STAR-salmon" approach that performs spliced alignment with STAR, projects alignments to the transcriptome, and performs quantification with Salmon [12]. This hybrid approach leverages STAR's alignment accuracy while benefiting from Salmon's sophisticated quantification model.
For optimal results, paired-end reads are recommended over single-end layouts as they provide more robust expression estimates [12]. Additionally, appropriate quality control procedures using tools like fastp or Trim Galore should precede alignment to remove adapter sequences and low-quality bases [8].
STAR's two-step algorithm of seed searching followed by clustering/stitching represents a significant advancement in RNA-seq alignment technology. By employing maximal mappable prefix searching with uncompressed suffix arrays, STAR achieves unprecedented alignment speed while maintaining high precision, especially for splice junction detection. The algorithm's efficiency with large datasets and flexibility across sequencing platforms make it particularly valuable for contemporary transcriptomics research. When integrated into comprehensive RNA-seq workflows with appropriate quality control and downstream quantification, STAR provides researchers with a robust solution for accurate transcriptome characterization across diverse biological systems and research applications.
Maximal Mappable Prefixes (MMPs) and Splice-Aware Alignment
In reference-based RNA-Seq analysis, a fundamental challenge is accurately aligning sequencing reads back to the genome, despite the fact that these reads are derived from spliced messenger RNA (mRNA) where introns have been removed. Standard DNA-to-DNA aligners fail because they cannot account for the large genomic gaps (introns) that occur between exons in the original genome [13]. This necessitates the use of splice-aware aligners, specialized tools designed to detect these discontinuities. The Spliced Transcripts Alignment to a Reference (STAR) aligner addresses this challenge through a novel strategy based on Maximal Mappable Prefixes (MMPs), enabling it to perform highly accurate spliced alignments at unprecedented speeds, outperforming other aligners by more than a factor of 50 in mapping velocity [4] [2].
STAR's algorithm is engineered to handle the key complexities of RNA-seq data, including the non-contiguous transcript structure, mismatches from sequencing errors or polymorphisms, and the need to identify both canonical and non-canonical splice junctions [2]. Its design is particularly crucial for large-scale consortium efforts like ENCODE, where it was used to align over 80 billion reads, as computational throughput becomes a significant bottleneck with massive datasets [2]. Furthermore, unlike some earlier tools, STAR is capable of aligning long-read sequences from third-generation sequencing technologies, making it a versatile choice for evolving experimental methods [2].
Core Algorithmic Concepts: MMPs and Splice-Aware Alignment
The Concept of Maximal Mappable Prefixes (MMPs)
The cornerstone of STAR's alignment strategy is the Maximal Mappable Prefix (MMP), a concept related to the Maximal Exact Match used in whole-genome alignment tools [2]. Formally, given a read sequence ( R ), a read location ( i ), and a reference genome sequence ( G ), the ( \text{MMP}(R, i, G) ) is defined as the longest substring starting at position ( i ) of the read (( Ri, R{i+1}, ..., R_{i+MML-1} )) that matches exactly one or more substrings of the reference genome ( G ), where ( MML ) is the maximum mappable length [2].
In practical terms, for every read it aligns, STAR performs a sequential search to find the longest sequence from the start of the (unmapped portion of the) read that matches one or more locations on the reference genome exactly [4]. These MMPs are called "seeds." The algorithm begins by finding the first MMP (seed 1) from the 5' end of the read. If the entire read is not mapped, STAR repeats the search only on the unmapped portion to find the next longest MMP (seed 2), and so on [4] [2]. This sequential searching of unmapped read portions is a key factor in STAR's efficiency, distinguishing it from aligners that search the entire read sequence before splitting or perform iterative mapping rounds [4].
The Mechanics of Splice-Aware Alignment
A "splice-aware" aligner specifically accounts for the fact that mature mRNA sequences do not contain introns, and thus, reads spanning two exons cannot be aligned contiguously to the reference genome [13]. As illustrated in the diagram below, STAR's two-step process transforms these MMP seeds into full, spliced alignments.
Seed Searching with Suffix Arrays: STAR implements the search for MMPs using uncompressed suffix arrays (SA) [4] [2]. Suffix arrays allow for extremely fast string search operations. The binary search nature of this method scales logarithmically with the length of the reference genome, enabling rapid alignment even against large mammalian genomes [2]. A significant advantage of using uncompressed SAs is the computational speed gained, traded off against higher memory usage [2]. For each MMP found, the SA search can identify all distinct genomic match locations with minimal overhead, which is essential for accurately handling reads that map to multiple genomic loci (multimapping reads) [2].
Clustering, Stitching, and Scoring: In the second phase, the separately aligned seeds are combined into a complete read alignment [4]. First, seeds are clustered together based on their proximity to a set of reliable "anchor" seeds (e.g., seeds that are not multi-mapping) [2]. Subsequently, a frugal dynamic programming algorithm stitches the seeds within a user-defined genomic window, allowing for any number of mismatches but typically only one insertion or deletion (gap) between seeds [2]. The size of this genomic window effectively determines the maximum intron size the aligner can detect [14]. This stitching process scores the potential alignments based on mismatches, indels, and other factors to select the best possible alignment for the read [4].
The STAR RNA-Seq Alignment Protocol
This section provides a detailed, step-by-step protocol for performing RNA-seq read alignment using STAR, from data preparation to assessing the final output.
Pre-alignment Data and Resource Preparation
Input Data Requirements:
- Sequencing Reads: In FASTQ format (either plain-text or compressed
.gz). The user must specify whether the data is single-end or paired-end [14]. For paired-end data, filename patterns (e.g.,_1and_2) must be correctly defined to match upstream and downstream read files [14]. - Reference Genome: A FASTA file containing the genome reference sequences. It is strongly recommended to include all major chromosomes as well as unplaced and unlocalized scaffolds, as substantial numbers of reads (e.g., ribosomal RNA) may map to these regions. Excluding them can lead to falsely unmapped reads or misalignments. Patches and alternative haplotypes should generally be excluded [14].
- Annotation File (Highly Recommended): A file in GTF or GFF format (GTF is recommended) containing annotated genes and transcripts. STAR will extract known splice junctions from this file to create a database, which dramatically improves the accuracy of aligning reads across known junctions [4] [14]. Chromosome names must match between the GTF and FASTA files.
Computational Resources:
STAR is memory-intensive. Mapping to mammalian genomes typically requires at least 16 GB of RAM, ideally 32 GB [15] [16]. The number of CPU cores used ( --runThreadN ) can be adjusted based on available resources to speed up the computation [4].
Step-by-Step Alignment Methodology
Step 1: Generating the Genome Index STAR requires a genome index to be generated before the read alignment step. This is a one-time process for each combination of genome and annotation.
Table 1: Key Parameters for Genome Index Generation with STAR
| Parameter | Typical Value / Example | Explanation |
|---|---|---|
--runMode |
genomeGenerate |
Directs STAR to run in genome index generation mode [4]. |
--genomeDir |
/path/to/index/directory/ |
Path to the directory where the genome indices will be stored [4]. |
--genomeFastaFiles |
/path/to/genome.fa |
Path to the reference genome FASTA file(s) [4]. |
--sjdbGTFfile |
/path/to/annotations.gtf |
Path to the annotation file in GTF format [4]. |
--sjdbOverhang |
99 |
Specifies the length of the genomic sequence around annotated junctions. Ideally set to ReadLength - 1 [4]. |
--runThreadN |
6 |
Number of CPU threads to use for the indexing process [4]. |
Example command for genome index generation [4]:
Step 2: Mapping Reads to the Genome Once the index is built, the read alignment step can be performed for each sample.
Table 2: Essential Parameters for Read Alignment with STAR
| Parameter | Typical Value / Example | Explanation |
|---|---|---|
--readFilesIn |
sample_1.fastq (or sample_1.fastq sample_2.fastq) |
Path to the FASTQ file(s) for single-end or paired-end reads [4]. |
--genomeDir |
/path/to/index/directory/ |
Path to the directory with the pre-generated genome index [4]. |
--outSAMtype |
BAM SortedByCoordinate |
Requests output in BAM format, sorted by genomic coordinate, which is ready for downstream tools [4]. |
--outSAMunmapped |
Within |
Keeps information about unmapped reads within the output BAM file [4]. |
--outSAMattributes |
Standard |
Includes a standard set of alignment attributes in the output SAM/BAM file [4]. |
--outFilterMultimapNmax |
10 |
Maximum number of multiple alignments allowed for a read (default is 10). Reads exceeding this are not aligned [4]. |
--limitBAMsortRAM |
e.g., 20000000000 |
Recommended to set if sorting BAMs for large genomes to avoid memory issues. |
Example command for read alignment [4]:
Advanced Mapping Options:
- 2-pass Mapping: Enabling the
--twopassMode Basicoption allows for a more sensitive discovery of novel splice junctions. The basic idea is that STAR performs a first alignment pass to collect junctions from the data. These newly discovered junctions are then included in the second pass of alignment, improving the mapping sensitivity for subsequent reads [14]. - Stranded Libraries: If using stranded RNA-seq libraries (e.g., Illumina TruSeq), the
--outSAMstrandFieldparameter must be set appropriately (e.g.,intronMotif) to correctly infer strand information from the alignment, which is critical for accurate transcript assembly and quantification [17].
Output Analysis and Interpretation
STAR generates several output files that are critical for downstream analysis and quality control.
Primary Alignment Output: The main output is a BAM file ( Aligned.sortedByCoord.out.bam ) containing the aligned reads sorted by genomic coordinate. This file follows the standard SAM/BAM format specifications [14].
Table 3: Key Fields in the STAR BAM/SAM Output
| SAM Field | Name | Description & Relevance |
|---|---|---|
| FLAG | Flag | Bitwise flag summarizing read properties (e.g., paired, mapped, strand). Use a SAM flag translator for interpretation [14]. |
| RNAME | Reference | Name of the chromosome/contig where the read aligns [14]. |
| POS | Position | 1-based leftmost mapping position of the first CIGAR operation [14]. |
| CIGAR | CIGAR String | Compact string describing the alignment (e.g., 50M1000N50M denotes a 1000bp intron). The N operator specifically indicates a skipped region (intron) [14]. |
| MAPQ | Mapping Quality | Phred-scaled probability the alignment is wrong. A value of 255 indicates it is not available [14]. |
Splice Junction Output: STAR produces a tab-delimited file ( SJ.out.tab ) containing high-confidence collapsed splice junctions [14]. The columns include:
- Column 1-3: Chromosome, intron start (1-based), intron end (1-based).
- Column 4: Strand (0=undefined, 1=+, 2=-).
- Column 5: Intron motif (e.g., 1=GT/AG, 0=non-canonical).
- Column 6: Annotation (0=unannotated, 1=annotated - only if annotation was used).
- Column 7-9: Various counts of uniquely and multi-mapping reads supporting the junction.
Alignment Statistics: The Log.final.out file provides a comprehensive summary of the alignment run, including the percentages of reads that mapped uniquely, to multiple loci, were chimeric, or remained unmapped. This is the first file to check for quality control of the alignment step.
The Scientist's Toolkit: Research Reagent Solutions
Table 4: Essential Materials and Reagents for a STAR RNA-Seq Alignment Workflow
| Item | Specification / Function |
|---|---|
| Reference Genome Sequence | FASTA file for the target organism (e.g., GRCh38 for human). Must be downloaded from a trusted source like ENSEMBL or UCSC. Critical for creating the alignment reference [4] [14]. |
| Gene Annotation File | GTF/GFF3 file containing known gene models and transcript structures. Used by STAR to create a database of known splice junctions, drastically improving alignment accuracy to annotated features [4] [14]. |
| High-Performance Computing | Server with sufficient RAM (≥16GB for mammals), multiple CPU cores, and adequate temporary storage (/n/scratch2/-type space). Essential for handling the memory-intensive genome indexing and alignment process [4] [16]. |
| STAR Software | Standalone C++ aligner, available under GPLv3 license. Can be compiled from source or installed via package managers like conda [1] [16]. |
| Sequence Read Files | Input RNA-seq data in FASTQ format. Can be single-end or paired-end. Quality control (e.g., with FastQC) and adapter trimming (e.g., with Cutadapt) are recommended pre-processing steps [1]. |
| SAMtools | Utility software for processing and indexing SAM/BAM files. Required for handling the sorted BAM output from STAR for downstream analysis [1]. |
Experimental Workflow and Data Flow Visualization
The entire RNA-seq analysis pipeline, from raw data to aligned reads, involves several interconnected steps. The following diagram outlines the complete experimental workflow, highlighting STAR's role within the broader context.
Critical Considerations and Troubleshooting
- Intron Size Limits: Be aware of the
--alignIntronMinand--alignIntronMaxparameters. The default maximum intron size is suitable for mammals but may need to be reduced for organisms with smaller introns [4] [14]. A genomic gap is considered an intron only if its length falls within this defined range; otherwise, it might be treated as a deletion [14]. - Detection of Indels and Variations: While STAR is excellent for splice junction detection, users focused on identifying small insertions and deletions (indels) within exonic regions should be aware that its primary alignment strategy is optimized for splicing. Tuning parameters or using specialized variant callers on the BAM output may be necessary for sensitive indel discovery [18].
- Handling Multimapping Reads: RNA-seq reads originating from repetitive regions or multi-copy genes can map to multiple locations. The
--outFilterMultimapNmaxparameter controls the maximum number of alignments reported for a read. Understanding how your downstream analysis tool handles these multi-mapping reads is crucial for accurate gene expression quantification [4] [14].
RNA sequencing (RNA-seq) has become the primary method for transcriptome analysis, enabling detailed investigation of gene expression, regulatory networks, and signaling pathways [8]. The Spliced Transcripts Alignment to a Reference (STAR) aligner represents a critical component in bulk RNA-seq analysis workflows, providing unprecedented capability for detecting spliced transcripts, non-canonical splices, and chimeric transcripts [2]. However, STAR's computational intensity presents significant challenges for researchers designing RNA-seq experiments. This application note provides a comprehensive assessment of STAR's memory, processing, and infrastructure requirements, framed within the context of a complete RNA-seq alignment workflow to support researchers, scientists, and drug development professionals in optimizing their computational approaches for efficient and cost-effective analysis.
Computational Hardware Requirements
Memory and Processing Specifications
STAR alignment is computationally intensive, particularly for large genomes such as human and mouse. The algorithm uses uncompressed suffix arrays for efficient maximal mappable prefix (MMP) search, which provides significant speed advantages but requires substantial memory resources [2]. Based on experimental data and user reports, the hardware requirements vary depending on genome size and sample throughput.
Table 1: Hardware Requirements for STAR Alignment with Human/Genomes
| Component | Minimum Specification | Recommended Specification | Large-Scale Deployment |
|---|---|---|---|
| RAM | 30+ GB free RAM | 32-64 GB | 128+ GB |
| Processor | Modern multi-core CPU | 6-8 cores per sample | 12+ cores per node |
| Storage | SSD with sufficient space for temporary files | High-throughput disk subsystem | Performant network block storage (10G ethernet/Infiniband) |
| Infrastructure | Single server | High-performance compute node | Compute cluster with parallel processing |
For human genome alignment, STAR typically requires 30+ GB of free RAM, with this requirement increasing when using multiple threads [19]. The alignment process scales with core count, but efficiency diminishes with excessive parallelization due to software limitations and I/O constraints. A balance of 6-8 cores per sample typically provides optimal performance without resource contention.
Infrastructure Considerations
The choice between local hardware, high-performance computing (HPC) clusters, and cloud infrastructure depends on project scale and throughput requirements. For individual samples or small batches (≤20 samples), a powerful local server with adequate RAM and SSD storage may suffice. For medium to large studies (dozens to hundreds of samples), HPC clusters or cloud computing environments provide necessary scalability.
Recent optimizations in cloud-based STAR implementation demonstrate that careful instance selection and configuration can significantly reduce computational time and cost [20]. The early stopping optimization alone can reduce total alignment time by approximately 23%, while appropriate instance selection and spot instance usage can further enhance cost efficiency for large-scale transcriptomic projects [20].
STAR Alignment Methodology
Algorithmic Workflow
STAR employs a novel two-phase alignment strategy that fundamentally differs from traditional DNA aligners. The algorithm consists of seed searching followed by clustering, stitching, and scoring phases [2] [4].
Detailed Experimental Protocol
Genome Index Generation
Creating a genome index is the critical first step for STAR alignment. The following protocol outlines the complete process for generating genome indices:
Prerequisite Data Preparation:
- Download reference genome FASTA files for your target species (e.g., from Ensembl, UCSC, or NCBI)
- Obtain genome annotation files in GTF or GFF format matching the reference genome version
- Ensure adequate storage space (approximately 30-40 GB for human genome)
Compute Environment Setup:
- Allocate a compute node with minimum 32 GB RAM and 8 cores
- Ensure sufficient scratch storage space (≥50 GB free space)
- Load required software modules: STAR, GCC
Index Generation Command:
Parameter Optimization:
--sjdbOverhang: Set to read length minus 1 (e.g., 99 for 100bp reads)--genomeSAsparseD: Adjust for large genomes to reduce memory usage--genomeChrBinNbits: Minimize for genomes with many small chromosomes
Table 2: Key Parameters for STAR Genome Index Generation
| Parameter | Recommended Setting | Function |
|---|---|---|
--runThreadN |
6-8 cores | Number of parallel threads to use |
--genomeDir |
User-defined directory | Path to store generated genome indices |
--genomeFastaFiles |
Reference genome FASTA | Path to reference genome sequence |
--sjdbGTFfile |
Genome annotation GTF | Path to gene annotation file |
--sjdbOverhang |
ReadLength - 1 | Overhang length for splice junctions |
--genomeSAindexNbases |
14 for human | Length of SA pre-index for small genomes |
Read Alignment Protocol
Once genome indices are prepared, the read alignment process can begin:
Input Data Preparation:
- Perform quality control on FASTQ files using FastQC or similar tools
- Execute adapter trimming and quality filtering using tools like fastp or Trim_Galore [8]
- Verify read length and quality metrics post-trimming
Alignment Execution:
Output Management:
- Sorted BAM files are generated for downstream analysis
- Junction files contain splice junction information for transcript assembly
- Log files provide alignment statistics and quality metrics
Infrastructure Optimization Strategies
Cloud-Based Deployment
Recent advances in cloud-native architecture for STAR alignment demonstrate significant improvements in cost efficiency and processing throughput. A scalable, cloud-native architecture can process tens to hundreds of terabytes of RNA-seq data efficiently [20].
Key optimization strategies include:
- Instance Selection: Identify cost-efficient EC2 instance types balanced for CPU, memory, and I/O requirements
- Spot Instance Usage: Leverage spot instances for alignment tasks where possible to reduce costs
- Early Stopping: Implement checkpointing to reduce total alignment time by 23% [20]
- Parallelization Optimization: Determine optimal thread count per instance to maximize resource utilization
Hybrid and HPC Deployment
For institutional deployments, HPC clusters provide robust infrastructure for STAR alignment:
Storage Architecture:
- Implement high-performance parallel file systems (Lustre, GPFS) for temporary file handling
- Configure shared reference genome directories to minimize storage duplication
- Allocate sufficient scratch space for intermediate alignment files
Job Scheduling:
- Configure SLURM or similar job schedulers with appropriate memory and CPU allocations
- Implement array jobs for parallel sample processing
- Set reasonable runtime limits based on sample size and genome complexity
The Scientist's Toolkit
Table 3: Essential Research Reagent Solutions for RNA-seq Alignment
| Tool/Resource | Function | Application Notes |
|---|---|---|
| STAR Aligner | Spliced alignment of RNA-seq reads to reference genome | Primary alignment tool; requires significant computational resources [2] |
| Reference Genome | Genomic sequence for read alignment | Species-specific FASTA files from Ensembl, UCSC, or NCBI |
| Genome Annotation | Gene model information in GTF/GFF format | Must match reference genome version; provides splice junction information |
| FastQC | Quality control for raw sequencing data | Assess read quality, adapter contamination, and sequence biases |
| fastp/Trim Galore | Adapter trimming and quality filtering | Pre-processing to remove low-quality sequences and adapters [8] |
| SRA Toolkit | Access and conversion of SRA files from NCBI | Required for public dataset analysis; prefetch and fasterq-dump utilities [20] |
| SAMtools | Processing and indexing of BAM files | Post-alignment processing, indexing, and format conversion |
Performance Optimization and Troubleshooting
Computational Bottlenecks
Common performance limitations in STAR alignment include:
Memory Constraints: Insufficient RAM leads to alignment failures or excessive runtime
- Solution: Allocate adequate memory (≥30GB for human genomes) and adjust
--limitGenomeGenerateRAMif needed
- Solution: Allocate adequate memory (≥30GB for human genomes) and adjust
I/O Limitations: Disk throughput bottlenecks impact alignment speed
- Solution: Use high-throughput local SSDs for temporary files and genome indices
CPU Underutilization: Improper thread allocation reduces efficiency
- Solution: Benchmark optimal thread count (typically 6-12 cores per instance)
Quality Assessment
Critical metrics to evaluate alignment performance:
- Total Alignment Rate: Should typically exceed 70-80% for high-quality libraries
- Unique vs. Multi-Mapping Reads: Varies by library type and genome complexity
- Splice Junction Detection: Number of novel and annotated junctions identified
- Insert Size Distribution: Concordance with expected fragment size distribution
STAR alignment provides unparalleled capability for RNA-seq read mapping but demands substantial computational resources that must be carefully considered in experimental planning. Successful implementation requires appropriate hardware allocation, parameter optimization, and infrastructure design tailored to project scale. The protocols and specifications outlined in this application note provide researchers with a comprehensive framework for deploying STAR in diverse computational environments, from individual workstations to large-scale cloud infrastructures. As RNA-seq applications continue to expand in drug development and biomedical research, optimized STAR implementation ensures efficient, cost-effective analysis while maintaining the high-quality standards required for reproducible research.
Hands-On Guide: Implementing a STAR Alignment Workflow from FASTQ to BAM
Within an RNA-Seq alignment workflow using STAR (Spliced Transcripts Alignment to a Reference), the selection and acquisition of appropriate reference genomic resources constitute the foundational step that critically influences all subsequent analyses [4] [2]. The STAR aligner operates by mapping sequencing reads to a reference genome, utilizing annotation files to guide the accurate identification of splice junctions and gene structures [21] [2]. This protocol provides detailed methodologies for obtaining, validating, and formatting these essential resources, ensuring researchers can establish a robust basis for reliable transcriptomic studies in drug development and basic research.
Understanding the Required Files
Reference Genome (FASTA)
The reference genome is a complete set of DNA sequences for a species, stored in FASTA format. It serves as the coordinate system against which RNA-seq reads are aligned [4]. The quality and completeness of the genome assembly directly impact mapping accuracy and the discovery of novel transcripts.
Genome Annotation (GTF/GFF3)
Annotation files in GTF (Gene Transfer Format) or GFF3 (General Feature Format version 3) describe the locations and structures of genomic features such as genes, transcripts, exons, and coding sequences (CDS) [21]. For RNA-seq analysis, these files are indispensable for STAR to recognize known splice junctions and for downstream quantification of gene expression [4].
File Acquisition Protocols
Protocol: Sourcing Reference Genomes from Public Repositories
This protocol outlines the steps for obtaining high-quality reference genome sequences.
Procedure:
- Identify Appropriate Source: Navigate to a primary genome database:
- ENSEMBL (ensembl.org): Often preferred for eukaryotic organisms, provides well-annotated genomes.
- NCBI GenBank (ncbi.nlm.nih.gov/genome): Comprehensive resource for a wide taxonomic range.
- UCSC Genome Browser (genome.ucsc.edu): Provides reference genomes for many species.
- Select Species and Assembly: Choose the target species and select the most current and stable genome assembly version (e.g., GRCh38 for human, GRCm39 for mouse). Using the latest assembly is recommended, but consistency across research projects should be considered.
- Download FASTA File: Download the "primary assembly" genome sequence file. The file is typically named as
[Species].[Assembly].dna.primary_assembly.fa.gz. - Decompress the File: Use command-line tools to decompress the downloaded file.
Protocol: Sourcing Genome Annotation Files (GTF)
This protocol describes the acquisition of a GTF file that corresponds to the selected reference genome.
Procedure:
- Navigate to the Same Repository: Use the same database from which the reference genome was downloaded (e.g., ENSEMBL, NCBI).
- Ensure Version Matching: Select the annotation file (GTF or GFF3 format) that corresponds to the exact same genome assembly version used in Protocol 3.1. Mismatched versions will cause critical errors in alignment and quantification.
- Download GTF File: The file is typically named as
[Species].[Assembly].[Version].gtf.gz. - Decompress the File:
Protocol: Validation and Preprocessing of Downloaded Files
Before use, verify the integrity and format of the downloaded files.
Procedure:
- Verify File Integrity: Check that files are not corrupted and are in the expected format.
- Check Sequence Headers (Critical): Ensure the sequence names (chromosomes) in the FASTA file are consistent with those used in the GTF file. Inconsistent naming is a common source of failure.
Decision Support and Resource Tables
The choice of reference files depends on the research organism and question. For well-established model organisms, use the consensus "reference sequence" (RefSeq) from NCBI or the primary assembly from ENSEMBL. For non-model organisms, the most contiguous and complete assembly available should be selected, with a preference for those generated using long-read sequencing technologies where available [22].
The following table summarizes the key characteristics and recommendations for the required genomic files.
Table 1: Specification and sourcing of reference genome and annotation files
| File Type | Standard Format | Critical Content | Recommended Source | Version Matching Rule |
|---|---|---|---|---|
| Reference Genome | FASTA (.fa, .fasta) |
All nuclear chromosomes, mitochondria | ENSEMBL, NCBI GenBank | The assembly version of the GTF must exactly match the FASTA. |
| Genome Annotation | GTF (.gtf) / GFF3 (.gff3) |
Gene models, exon boundaries, splice sites | ENSEMBL, NCBI RefSeq |
Integrated Workflow for File Preparation
The following diagram illustrates the logical sequence and decision points involved in obtaining and preparing reference files for a STAR alignment workflow.
The Scientist's Toolkit
Table 2: Essential research reagents and computational resources for obtaining and handling genomic references
| Item/Resource | Function in the Workflow | Example/Note |
|---|---|---|
| ENSEMBL Database | Primary source for eukaryotic reference genomes and annotations. | Provides the Homo_sapiens.GRCh38.dna.primary_assembly.fa and corresponding .gtf files [4]. |
| NCBI GenBank/RefSeq | Comprehensive source for genome sequences across all taxa. | An alternative to ENSEMBL, especially for non-model organisms. |
| UCSC Genome Browser | Provides reference sequences and powerful data visualization tools. | |
| Command-Line Tools (gzip, awk) | Essential for file decompression, validation, and format checking. | gzip -d for decompression; awk or grep for checking file content and consistency. |
| High-Speed Internet | Required for downloading large genome files (can be several gigabytes). | |
| Institutional HPC Access | Needed for file storage and subsequent STAR genome indexing steps. | The genome index generation is computationally intensive and requires significant memory [2]. |
In an RNA-seq alignment workflow, the initial generation of a genome index is a critical, prerequisite step that fundamentally determines the success of all subsequent analyses. The STAR (Spliced Transcripts Alignment to a Reference) aligner uses this index to rapidly and accurately map sequencing reads to a reference genome, a process that is especially complex for RNA-seq data due to the presence of spliced transcripts [23]. A properly constructed index enables STAR to efficiently identify sequence matches while correctly handling reads that span exon-intron junctions. This protocol outlines the essential parameters and best practices for generating an optimized genome index, providing a robust foundation for a reliable RNA-seq research workflow.
Critical Indexing Parameters and Configuration
The performance and accuracy of STAR alignment are highly dependent on the parameters selected during genome index generation. The following table summarizes the core parameters that require careful consideration, along with their recommended configurations.
Table 1: Critical Parameters for STAR Genome Index Generation
| Parameter | Function & Impact on Indexing | Recommendation & Best Practice |
|---|---|---|
--genomeFastaFiles |
Specifies the path to the reference genome file in FASTA format. The quality and version of this file are foundational. | Use a comprehensive, high-quality genome assembly from a reliable source (e.g., ENSEMBL, UCSC, RefSeq). Ensure consistency with the annotation file version [12]. |
--sjdbGTFfile |
Provides the genome annotation file in GTF or GFF format. This is crucial for informing STAR about known splice junctions. | Use an annotation file that corresponds to the same genome assembly as the FASTA file. This dramatically improves the accuracy of aligning spliced reads [1] [24]. |
--sjdbOverhang |
Defines the length of the genomic sequence around annotated junctions to be included in the index. | For paired-end reads, set to ReadLength - 1. For example, with 100bp paired-end reads, use --sjdbOverhang 99. This is a commonly applied best practice [12]. |
--genomeSAindexNbases |
Controls the length of the SA (Suffix Array) index. Must be scaled appropriately for the genome size. | For large genomes (e.g., human, mouse), a value of 14 is standard. For small genomes (e.g., yeast, bacteria), this must be reduced. The rule of thumb is min(14, log2(GenomeLength)/2 - 1) [23]. |
--genomeChrBinNbits |
Adjusts memory allocation for chromosome bins, impacting indexing efficiency for genomes of varying sizes. | For genomes with many small chromosomes or scaffolds (e.g., plants), this parameter might need to be reduced (e.g., --genomeChrBinNbits 18) to prevent excessive RAM usage [23]. |
Experimental Protocol: Genome Index Generation
This section provides a detailed, step-by-step methodology for generating a STAR genome index.
Research Reagent Solutions
Table 2: Essential Materials and Reagents
| Item | Specification / Function |
|---|---|
| Reference Genome (FASTA) | Species-specific genomic sequence file. Source: ENSEMBL, UCSC, or NCBI. Must be decompressed (e.g., .fa format) [1]. |
| Annotation File (GTF/GFF) | File containing coordinates of known genes, transcripts, and exons. Must match the genome assembly version [12]. |
| STAR Aligner Software | Version 2.7.10b or newer. Download from GitHub and compile for your system [23] [20]. |
| High-Performance Computing (HPC) | A 64-bit Linux or macOS system. Minimum 8 CPU cores; 16+ recommended. At least 32 GB of RAM for mammalian genomes [23] [15]. |
Step-by-Step Procedure
- Data Preparation: Obtain the reference genome (FASTA) and annotation (GTF) files. Ensure they are from the same build and decompress the FASTA file if necessary [1].
- Create Output Directory: Generate a dedicated directory for the genome index files to maintain an organized workspace.
Execute the Indexing Command: Run the following STAR command. This is a resource-intensive process that may take several hours for a large mammalian genome.
Key Command-Line Arguments:
--runMode genomeGenerate: Directs STAR to operate in index generation mode.--genomeDir: Path to the output directory created in Step 2.--runThreadN: Number of CPU threads to use for parallel processing. Adjust based on available cores.
Verification: Upon successful completion, the output directory will contain numerous files (e.g.,
Genome,SA,SAindex). Do not modify these files. Verify the integrity of the index by running a test alignment with a single sample before processing the entire dataset [23].
The following workflow diagram visualizes the key steps and logical relationships in the genome index generation process.
Troubleshooting and Optimization
- Memory (RAM) Errors: Indexing large genomes requires substantial RAM. For a human genome, ensure at least 32 GB is available [23] [15]. If memory is insufficient, try reducing the
--genomeChrBinNbitsparameter (e.g., to 16 or 18). - Long Processing Time: The indexing process is computationally intensive. Utilize more CPU cores by increasing the
--runThreadNparameter to accelerate the process, provided sufficient cores are available. - Ensuring Consistency: A common source of alignment failure is a mismatch between the genome FASTA file and the annotation GTF file. Always cross-reference the source and version numbers for both files to ensure compatibility [12].
The Spliced Transcripts Alignment to a Reference (STAR) software package performs ultra-fast and accurate alignment of RNA-seq reads to a reference genome, serving as a critical component in modern transcriptomic research [25] [23]. Its fundamental importance stems from specialized capability to map spliced RNA sequences that derive from non-contiguous genomic regions, presenting significantly more challenges than genomic DNA read alignment [25]. STAR efficiently detects both annotated and novel splice junctions, enabling comprehensive transcriptome characterization that is essential for gene expression quantification, differential expression analysis, and isoform reconstruction [4] [25].
STAR's algorithm employs a novel two-step process that differentiates it from conventional aligners. The process begins with seed searching, where STAR searches for the longest sequence that exactly matches one or more locations on the reference genome, known as Maximal Mappable Prefixes (MMPs) [4]. This is followed by clustering, stitching, and scoring, where separate seeds are stitched together based on proximity to anchor seeds and optimal alignment scoring [4]. This efficient strategy allows STAR to outperform other aligners by more than a factor of 50 in mapping speed while maintaining high accuracy, though it is relatively memory-intensive compared to some alternatives [4].
For researchers in pharmaceutical development and basic research, STAR's ability to discover complex RNA sequence arrangements—including chimeric transcripts and circular RNAs—provides valuable insights into gene regulation and potential therapeutic targets [25] [23]. Its scalability supports emerging sequencing technologies, making it a versatile tool for diverse experimental designs from single-cell studies to large-scale clinical investigations [25].
Experimental Setup and Computational Requirements
Hardware and Software Specifications
Successful execution of STAR alignment requires appropriate computational resources. For optimal performance with mammalian genomes, 32GB of RAM is recommended, though a minimum of 16GB may suffice for smaller genomes [23] [24]. The memory requirement typically approximates 10 times the genome size, meaning the human genome (~3 gigabases) requires approximately 30GB of RAM [25]. Multi-core processors significantly enhance performance, with 6-12 CPU cores recommended for efficient parallel processing [4] [25]. Substantial disk space (>100 GB) is essential for storing reference genomes, indices, and output alignment files [25].
STAR operates exclusively on Unix-based systems (Linux or Mac OS X) and requires a modern C++ compiler for installation [25] [23]. The software is available for download from the official GitHub repository, where users can obtain source code for compilation or precompiled binaries for immediate use [23].
Research Reagent Solutions
The following reagents and computational materials represent essential components for conducting STAR alignment in RNA-seq experiments:
Table: Essential Research Reagents and Materials for STAR Alignment
| Item Name | Specification | Function in Experiment |
|---|---|---|
| Reference Genome | FASTA format (e.g., GRCh38, dm6) | Genomic sequence for read alignment [1] [4] |
| Gene Annotation | GTF/GFF format (e.g., ENSEMBL, GENCODE) | Defines exon-intron structures for splice-aware alignment [1] [4] |
| RNA-seq Reads | FASTQ format (single or paired-end) | Input sequencing data for alignment [1] [24] |
| STAR Aligner | Version 2.7.10b or higher | Primary alignment software [1] [25] |
| SAMtools | Version 1.17 or higher | Processes SAM/BAM alignment files [1] [24] |
Genome Index Generation
Theoretical Basis for Genome Indexing
STAR requires a genome index to execute its efficient alignment algorithm. This index consists of a suffix array and a hash table that stores splice junction information, enabling rapid sequence matching during the alignment process [23]. The indexing process incorporates both the reference genome sequence and gene annotation file, allowing STAR to identify and correctly map spliced alignments across known exon-intron boundaries [4] [25]. This preparatory step is computationally intensive and memory-demanding, but only needs to be performed once for each reference genome and annotation combination [24].
Genome Preparation Protocol
To generate a genome index, researchers must first obtain reference genome sequences in FASTA format and corresponding gene annotations in GTF or GFF format from reputable sources such as ENSEMBL, UCSC, or RefSeq [23]. The annotation file must include comprehensive splice junction information to enhance alignment accuracy [23]. The following protocol details the indexing procedure:
- Create a dedicated directory for storing genome indices using the
mkdircommand (e.g.,mkdir /path/to/genome_index) [4]. - Execute the genome generation command with appropriate parameters as shown in the code block below.
- Verify index integrity by checking for the successful completion of the process and the generation of necessary index files in the output directory [23].
Critical Parameters for Index Generation
Table: Essential Parameters for Genome Index Generation
| Parameter | Value | Explanation |
|---|---|---|
--runThreadN |
6 | Number of parallel threads to use [4] |
--runMode |
genomeGenerate | Specifies genome indexing mode [4] |
--genomeDir |
/path/to/genome_index | Path to output directory for indices [4] |
--genomeFastaFiles |
reference.fa | Input genome sequence file [4] |
--sjdbGTFfile |
annotations.gtf | Gene annotation file [4] |
--sjdbOverhang |
ReadLength-1 | Specifies the length of the genomic sequence around annotated junctions; typically set to read length minus 1 [4] [25] |
The --sjdbOverhang parameter requires special consideration; for reads of varying length, the ideal value is max(ReadLength)-1, though the default value of 100 works similarly to the ideal value in most cases [4]. For standard 100bp sequencing, a value of 99 is recommended [4].
Read Alignment Protocol
Alignment Methodology
STAR's alignment methodology employs a sequential maximum mappable seed search that efficiently handles spliced transcripts [4] [23]. For each read, STAR identifies the longest sequence that exactly matches the reference genome (Maximal Mappable Prefix), then searches the unmapped portion for subsequent MMPs [4]. These seeds are clustered based on proximity to non-multi-mapping "anchor" seeds, then stitched together to form complete alignments using scoring that accounts for mismatches, indels, and gaps [4]. This approach allows STAR to accurately align across splice junctions without relying exclusively on pre-annotated junction databases, enabling discovery of novel splicing events [23].
Basic Alignment Command Structure
The fundamental STAR alignment protocol requires minimal parameters when appropriate genome indices and annotations are available. The following command represents the basic syntax for aligning paired-end RNA-seq reads:
For single-end reads, specify only one FASTQ file in the --readFilesIn parameter. If FASTQ files are uncompressed, remove the --readFilesCommand zcat option [25].
Essential Alignment Parameters
Table: Critical Parameters for RNA-seq Read Alignment
| Parameter Category | Parameter | Recommended Setting | Function |
|---|---|---|---|
| Input/Output | --genomeDir |
/path/to/genome_index | Path to genome indices [4] |
--readFilesIn |
read1.fastq [read2.fastq] | Input FASTQ file(s) [4] | |
--outFileNamePrefix |
samplename | Prefix for output files [4] | |
--outSAMtype |
BAM SortedByCoordinate | Output sorted BAM file [4] | |
| Performance | --runThreadN |
6-12 | Number of parallel threads [4] [25] |
| Splicing | --sjdbGTFfile |
annotations.gtf | Gene annotation file [4] |
--sjdbOverhang |
100 | Overhang length for splice junctions [25] | |
| Read Handling | --outSAMunmapped |
Within | Keep unmapped reads in output [4] |
--outSAMattributes |
Standard | Standard set of SAM attributes [4] |
Advanced Mapping Strategies
For enhanced detection of novel splice junctions, particularly in applications like somatic mutation identification or fusion gene detection, the two-pass mapping strategy is recommended [26] [25]. This approach involves:
- First pass: Performing alignment with standard parameters to identify novel junctions.
- Second pass: Re-running alignment while incorporating the novel junctions discovered in the first pass.
To implement two-pass mode, add --twopassMode Basic to your alignment command [26]. For fusion or chimeric transcript detection, additional parameters such as --chimSegmentMin 12 --chimJunctionOverhangMin 12 --chimOutType Junctions enhance sensitivity [26]. When working with formalin-fixed paraffin-embedded (FFPE) samples or other degraded RNA sources, consider adjusting filtering parameters and increasing mismatch allowances [27].
Output Files and Quality Assessment
STAR Output File Specifications
STAR generates multiple output files during the alignment process, each serving distinct purposes in downstream analysis. The following table characterizes these essential output files:
Table: STAR Output Files and Their Applications in Downstream Analysis
| File Name | Format | Content Description | Downstream Applications |
|---|---|---|---|
Aligned.sortedByCoord.out.bam |
BAM (sorted) | Primary alignments sorted by coordinate | Gene quantification, visualization [4] |
Log.final.out |
Text | Summary mapping statistics | Quality control assessment [4] [24] |
Log.progress.out |
Text | Progress statistics during alignment | Runtime monitoring [25] |
SJ.out.tab |
Tab-delimited | High-confidence splice junctions | Splice junction analysis [25] |
Chimeric.out.junction |
Tab-delimited | Chimeric (fusion) alignments | Fusion transcript detection [25] |
Quality Assessment and Interpretation
The Log.final.out file provides critical quality metrics for assessing alignment success. Key metrics include:
- Uniquely mapped reads %: Values >60-70% are generally considered acceptable, with significantly lower values indicating potential issues with RNA quality or genomic contamination [24].
- Mapping speed: Reported in million reads per hour, dependent on available computational resources [25].
- Mismatch rate: Typically <0.5% for high-quality alignments [25].
- Splice junctions: Number of detected known and novel splice junctions [25].
During execution, STAR updates the Log.progress.out file every minute, enabling real-time monitoring of mapping progress and preliminary statistics [25]. This allows researchers to identify potential issues early in the alignment process.
Post-Alignment Processing
Following STAR alignment, BAM files typically require additional processing before downstream quantification:
Sort and index BAM files using SAMtools:
Generate read counts using featureCounts or similar tools:
These processed files serve as input for differential expression analysis using tools such as DESeq2 or limma, enabling comprehensive transcriptomic profiling [12] [24].
Troubleshooting and Optimization Guidelines
Common Alignment Issues and Solutions
- Low unique mapping rates: Potential causes include RNA degradation, genomic DNA contamination, or incorrect genome version. Verify RNA quality metrics and ensure reference genome matches the correct species and assembly [24].
- Excessive multimapping: Common in genomes with high repeat content. Consider adjusting
--outFilterMultimapNmaxto reduce multiple alignments, though this may decrease sensitivity [4]. - Memory allocation errors: Particularly during genome indexing. Allocate sufficient RAM (approximately 10× genome size) and adjust
--genomeChrBinNbitsfor large genomes [25] [23]. - Unmapped reads due to splicing: Ensure gene annotations are provided during genome indexing and alignment to enable splice-aware mapping [25].
Parameter Optimization for Specific Applications
Different research objectives may require parameter customization beyond default settings:
- Differential splicing analysis: Enable two-pass mode (
--twopassMode Basic) and consider adjusting--outSAMstrandField intronMotifto enhance unannotated junction detection [26]. - Fusion transcript detection: Implement chimeric alignment parameters (
--chimSegmentMin 12 --chimJunctionOverhangMin 12 --chimOutType Junctions) with potential reduction of--chimScoreMinfor increased sensitivity [26] [25]. - Variant calling: For somatic mutation identification, stricter alignment parameters may be beneficial, followed by specialized tools like GATK's SplitNCigarReads for processing RNA-seq alignments [26].
When optimizing parameters, balance sensitivity and specificity by comparing results against validated datasets or using simulated data where available [8]. Document all parameter modifications to ensure reproducibility of analysis workflows.
The transition from microarrays to RNA sequencing (RNA-Seq) has established it as the primary method for transcriptome analysis, offering unprecedented detail about the RNA landscape and gene expression networks [28]. However, the analysis of RNA-Seq data involves multiple complex steps, including read trimming, alignment, quantification, and differential expression analysis. For researchers, constructing a complete and efficient analysis workflow from the array of available tools presents a significant challenge [28]. High-throughput screening software, which automates complex processes and manages large-scale experiments, is revolutionizing laboratory research by making these processes faster, more efficient, and less prone to human error [29]. In the context of RNA-Seq, workflow automation directly impacts the efficiency, reproducibility, and scalability of analyses, allowing for the standardized application of protocols across large sample sets and ensuring data integrity [30].
The need for automation is particularly acute when using tools like the STAR aligner (Spliced Transcripts Alignment to a Reference), a popular genome aligner for RNA-Seq data [31]. A robust automated workflow for STAR alignment and downstream processing enables researchers to rapidly process large datasets, maintain consistency across analyses, and generate reproducible results—key requirements for both academic research and drug development [12] [30]. This Application Note provides a detailed protocol for building such an automated, high-throughput analysis workflow centered on STAR, framed within a broader RNA-Seq research context.
Workflow Design and Key Components
Core Automation Principles for RNA-Seq
Effective automation of an RNA-Seq workflow is built on several key pillars, which ensure the system is robust, scalable, and maintainable. The foundational principle is modularity, where each analytical step (e.g., quality control, alignment, quantification) is encapsulated within a distinct, reusable module. This design allows for individual components to be updated, tested, or replaced without disrupting the entire workflow. Furthermore, data integrity must be maintained through comprehensive metadata management, capturing all relevant experimental conditions, reagent concentrations, and processing parameters to ensure the traceability and reproducibility of results [30]. Finally, the workflow must be designed for scalability, enabling it to handle increasing volumes of data and expanded assay complexity without significant performance degradation, a critical feature for growing research projects [30].
The STAR-Aligner in an Automated Context
STAR performs splice-aware alignment of RNA-Seq reads to a reference genome, a computationally intensive process that benefits greatly from automation. In a high-throughput setting, an automated script manages STAR's execution across multiple samples, handles job scheduling on high-performance computing (HPC) clusters, and processes the resulting alignment (BAM) files for downstream quantification [12]. While STAR alignment provides base-level precision and facilitates extensive quality checks, the subsequent step of expression quantification—converting read assignments into counts—introduces a second layer of uncertainty. To address this robustly, a hybrid, automated approach is recommended: using STAR for initial alignment and then leveraging the statistical model of a tool like Salmon (in its alignment-based mode) to handle uncertainty in transcript origin and produce accurate expression estimates [12]. The nf-core/rnaseq Nextflow workflow is an example of an automated pipeline that implements this exact "STAR-salmon" combination, ensuring a seamless, end-to-end process from raw sequencing data to a count matrix suitable for differential expression analysis [12].
Performance Benchmarking of Automated Tools
Quantitative Comparison of Quantification Tools
The selection of tools for integration into an automated workflow should be informed by empirical performance data. Benchmarking studies using simulated and experimental data from well-studied organisms like Homo sapiens, Arabidopsis thaliana, and Mus musculus provide critical metrics for comparison. The table below summarizes the performance of various long-read RNA-seq quantification tools, which can guide the selection of modules for long-read workflows or provide a benchmark for short-read tool development.
Table 1: Performance Benchmarking of Long-RNA-seq Quantification Tools on Simulated ONT Direct RNA Data
| Tool | Spearman's Correlation (SCC) Mean | Pearson's Correlation (PCC) Mean | Root Mean Squared Error (RMSE) Mean |
|---|---|---|---|
| TranSigner (psw) | 0.91 | 0.95 | 1504.10 |
| Oarfish (cov) | 0.91 | 0.95 | 1559.05 |
| Bambu (quant-only) | 0.85 | 0.91 | 2411.93 |
| IsoQuant (quant-only) | 0.78 | 0.87 | 1663.45 |
| FLAIR (quant-only) | 0.76 | 0.86 | 2045.60 |
| NanoCount | 0.67 | 0.80 | 2924.77 |
Data adapted from benchmark results comparing quantification-only modes of tools on simulated Oxford Nanopore Technologies (ONT) direct RNA reads [32].
Tools such as TranSigner and Oarfish, which implement sophisticated expectation-maximization algorithms and use coverage information, achieve state-of-the-art accuracy in transcript abundance estimation, as reflected in their high correlation coefficients and lower error rates [32]. It is also important to note that tools can exhibit varying performance across different species, underscoring the value of benchmarking against relevant data types for a given research project [28].
Beyond Quantification: Variant Calling from RNA-Seq
A comprehensive automated workflow can be extended beyond standard expression analysis. For example, VarRNA is a computational approach that classifies single nucleotide variants and insertions/deletions from tumor RNA-Seq data as germline, somatic, or artifact using two XGBoost machine learning models [33]. This tool demonstrates the potential of RNA-Seq not only for expression profiling but also for uncovering clinically relevant genetic variants and offering a deeper understanding of allele-specific expression dynamics in cancer pathogenesis [33]. Integrating such specialized tools into a larger automated framework can significantly expand the biological insights generated from a single RNA-Seq dataset.
Experimental Protocol: Automated STAR and Differential Expression Workflow
This protocol details the steps for automating a high-throughput RNA-Seq analysis workflow from raw sequencing reads to a count matrix, utilizing STAR for alignment and integrating with downstream quantification tools.
Prerequisites and Data Preparation
Research Reagent Solutions and Essential Materials
Table 2: Key Research Reagents and Computational Tools for RNA-Seq Workflow
| Item | Function / Description | Example / Source |
|---|---|---|
| Paired-End RNA-seq FastQ Files | Raw sequencing data for each sample. Provides more robust expression estimates than single-end layouts [12]. | NCBI SRA (e.g., Accession SRR1576457) |
| Reference Genome Fasta File | The DNA sequence of the target organism for read alignment. | Drosophila melanogaster (FlyBase) |
| Genome Annotation File (GTF/GFF) | File containing genomic feature coordinates (genes, transcripts, exons) used for alignment and quantification. | Ensembl |
| STAR Aligner | Spliced Transcripts Alignment to a Reference; a splice-aware aligner for mapping RNA-Seq reads to a genome [31]. | https://github.com/alexdobin/STAR |
| Salmon | A tool for transcript quantification that leverages a statistical model to handle read assignment uncertainty [12]. | https://github.com/COMBINE-lab/Salmon |
| Nextflow | A workflow language for automating and scaling data analysis pipelines, ideal for HPC and cloud environments [12]. | https://www.nextflow.io/ |
| nf-core/rnaseq Pipeline | A community-built, curated Nextflow workflow that automates the entire RNA-Seq analysis process [12]. | https://nf-co.re/rnaseq |
Input Data Configuration:
The workflow requires a sample sheet in the nf-core format, which is a comma-separated file with the columns: sample, fastq_1, fastq_2, and strandedness. The sample column is the unique identifier that will become the column header in the final count matrix. The fastq_1 and fastq_2 columns provide the paths to the paired-end read files. The strandedness can be set to "auto" to allow the quantification tool to automatically detect the library strandedness [12].
Automated Scripting and Execution Protocol
The following steps are automated within a Nextflow workflow, such as nf-core/rnaseq, but are described here to elucidate the underlying process.
Step 1: Read Trimming and Quality Control (QC)
- Tool Options:
fastporTrim_Galore. - Methodology: The automated script executes the chosen tool to remove adapter sequences and low-quality bases from the raw FastQ files.
fastpis noted for its rapid analysis and simplicity, whileTrim_GaloreintegratesCutadaptandFastQCto perform trimming and generate a QC report in a single step [28]. - Automation Cue: The script runs this step in parallel for all samples, using the input paths specified in the sample sheet.
Step 0: Genome Indexing (One-Time Setup)
- Tool:
STAR - Methodology: Before alignment, the reference genome must be indexed. This is a one-time, computationally intensive step.
- Automation Script Snippet:
Step 2: Spliced Alignment with STAR
- Tool:
STAR - Methodology: The script executes STAR in a two-pass alignment mode for each sample, which is beneficial for novel junction discovery.
- Automation Script Snippet (for one sample):
- Key Parameters:
--quantMode TranscriptomeSAMis crucial, as it outputs alignments projected onto the transcriptome in a separate BAM file, which is used as input for Salmon [12].
Step 3: Expression Quantification with Salmon
- Tool:
Salmon - Methodology: Using the transcriptome BAM file from STAR, Salmon performs alignment-based quantification, employing its statistical model to account for uncertainty in read assignments to transcripts.
- Automation Script Snippet (for one sample):
- Automation Cue: The workflow automatically collects the output from all samples and aggregates them into a single gene-level count matrix, the required input for differential expression analysis.
Step 4: Differential Expression Analysis
- Tool:
limma(in R) - Methodology: The count matrix is loaded into R. After normalization and transformation, the
limmapackage, which is built on a linear-modeling framework, is used to perform statistical tests to identify genes differentially expressed between conditions [12]. - Automation Cue: While this step is often performed interactively in R, the entire process, from count matrix to results table, can be scripted for full automation and reproducibility.
The logical flow of data and processes between these components is visualized in the following workflow diagram.
The automation of the RNA-Seq analysis workflow, from raw sequencing data to biological insights, is no longer a luxury but a necessity for ensuring efficiency, reproducibility, and scalability in modern research. By leveraging robust aligners like STAR within automated, modular pipelines—such as those built with Nextflow—researchers and drug development professionals can standardize their analytical processes, minimize human error, and focus on the interpretation of results. As the field advances, the integration of ever-more sophisticated tools for tasks like long-read quantification and RNA variant calling into these automated frameworks will continue to unlock deeper and more comprehensive biological insights from transcriptomic data.
Within an RNA-Seq alignment workflow using STAR, the successful mapping of sequencing reads is an intermediate step. The true value of this data is realized only after the aligned reads are quantified and analyzed by downstream tools for differential expression, isoform usage, and functional annotation. This application note details the protocols for preparing the files generated by the STAR aligner for robust and accurate read quantification, a critical process for researchers and drug development professionals building reliable gene expression models.
Key STAR Output Files for Downstream Quantification
The STAR aligner generates several output files, each serving a distinct purpose in downstream analysis. The table below summarizes the primary files used for read quantification and quality assessment.
Table 1: Essential STAR Output Files for Downstream Processing
| File Suffix | Format | Primary Content | Role in Downstream Quantification |
|---|---|---|---|
Aligned.sortedByCoord.out.bam |
BAM (Binary) | Read alignments sorted by genomic coordinate. | Primary input for quantification tools like featureCounts; used for visualization. |
SJ.out.tab |
Tab-delimited | High-confidence splice junctions detected. | Informs on splice-aware alignment; used for transcriptome assembly & junction quantification. |
Log.final.out |
Text | Summary statistics (e.g., % uniquely mapped reads). | Quality Control (QC); indicates technical success of alignment. |
Log.progress.out |
Text | Time-course progress of the mapping job. | QC for troubleshooting performance and resource use. |
The coordinate-sorted BAM file is the most critical output, as it contains the genomic locations of every read and is the direct input for most quantification software [34]. The accompanying log files are essential for quality control; for instance, a low percentage of uniquely mapped reads in the Log.final.out file can indicate potential issues with library quality or reference genome mismatch, undermining the validity of subsequent quantification [34].
Experimental Protocol: From STAR Alignment to Read Count Matrix
This protocol assumes completion of a STAR alignment step, resulting in a BAM file sorted by coordinate. The subsequent steps involve generating a count matrix ready for statistical analysis in tools like DESeq2 or edgeR.
Quantification of Gene-Level Counts with featureCounts
Purpose: To aggregate reads aligned to each gene feature, generating a count matrix for differential expression analysis.
Materials:
- STAR output:
Aligned.sortedByCoord.out.bamfile(s). - Reference annotation: Gene Transfer Format (GTF) file corresponding to the genome build used for alignment.
- Software: featureCounts (from the Subread package) [1].
Methodology:
- Software Activation: Ensure the computational environment has featureCounts installed and accessible.
Execute featureCounts Command: Run featureCounts on a single BAM file or in batch mode. Key parameters are detailed below.
Output Interpretation: The primary output
gene_counts.txtis a tab-delimited file where columns represent samples and rows represent genes. The count matrix from this file, excluding the initial annotation columns, is used as input for differential expression analysis packages.
Workflow Visualization: From FASTQ to Count Matrix
The following diagram illustrates the complete workflow from raw sequencing data to a final count matrix, highlighting the integration point between STAR and quantification tools.
The Scientist's Toolkit: Essential Research Reagents and Materials
Successful execution of the RNA-seq workflow from alignment to quantification depends on several key bioinformatics reagents and their precise use.
Table 2: Essential Research Reagent Solutions for RNA-Seq Quantification
| Reagent / Resource | Function | Critical Notes for Preparation |
|---|---|---|
| Reference Genome (FASTA) | Template for aligning sequencing reads. | Must be the same version used for generating the STAR genome index. |
| Gene Annotation (GTF/GFF3) | Defines genomic coordinates of genes, exons, and other features. | Use a comprehensive, well-curated source (e.g., Ensembl, GENCODE). Ensure compatibility with the reference genome version. |
| STAR Aligner | Splice-aware aligner for RNA-seq reads. | Pre-compiled binaries are available; ensure adequate RAM (≥32 GB for human) [34]. |
| Quantification Tool (e.g., featureCounts) | Counts reads overlapping genomic features. | For gene-level counts, specify -t exon and -g gene_id to correctly group exons [1]. |
| Synthetic Spike-in RNA Controls | External controls for normalization and QC. | Added during library preparation, they provide a standard curve to assess technical performance and sensitivity [35]. |
| BAM File | Binary, compressed format for aligned reads. | The coordinate-sorted BAM from STAR is the standard input for quantification. |
Advanced Application: Utilizing Splice Junctions for Isoform Analysis
For investigations into alternative splicing, the SJ.out.tab file is a vital resource. This tab-separated file contains data on high-confidence splice junctions, including genomic coordinates, strand information, and the number of uniquely mapping reads spanning the junction [34]. These junctions can be used with transcriptome assembly tools like StringTie or Cufflinks to reconstruct and quantify full-length transcript isoforms, moving beyond simple gene-level counts.
Quality Control and Troubleshooting
Systematic quality control is mandatory. The Log.final.out file must be consulted to flag samples with poor performance. Key metrics include:
- Uniquely Mapped Reads: Ideally >70-80% for standard bulk RNA-seq [34].
- Mapping Speed and Resource Use: Monitored via
Log.progress.out. - Splice Junction Detection: The total number of splices from the log file and the
SJ.out.tabfile should be consistent with the organism and tissue type.
A failure to detect a significant number of splice junctions may indicate an issue with the --sjdbOverhang parameter during genome indexing, which should be set to (read length - 1) [34]. Furthermore, the use of synthetic spike-in RNAs can help distinguish true biological variation from technical artifacts during the quantification step, providing an objective measure of assay accuracy and dynamic range [35].
Beyond the Basics: Troubleshooting Common Issues and Enhancing Performance
Within the framework of a comprehensive RNA-Seq alignment workflow using STAR (Spliced Transcripts Alignment to a Reference), efficient resource allocation is a critical determinant of success. The STAR aligner, while offering high accuracy and exceptional mapping speed, is known for its significant memory consumption and computational demands [4] [2]. These challenges are amplified when processing large-scale datasets, such as those generated by consortia like ENCODE, which can comprise billions of reads [2]. For researchers and drug development professionals, optimizing memory and runtime is not merely a technical concern but a practical necessity to accelerate discovery, reduce computational costs, and ensure the feasibility of transcriptomic studies. This application note provides detailed, actionable strategies for allocating resources effectively to overcome these bottlenecks, thereby enhancing the robustness and efficiency of STAR alignment in RNA-Seq research.
Understanding the Resource Bottleneck in STAR
The resource intensity of STAR stems from its alignment algorithm, which employs a two-step process: seed searching and clustering/stitching/scoring [4] [2]. The seed searching phase identifies the longest sequences from reads that exactly match the reference genome, known as Maximal Mappable Prefixes (MMPs). This process leverages uncompressed suffix arrays (SAs) to enable rapid searching against large genomes, a design choice that trades memory usage for speed [2]. The subsequent clustering and stitching phase integrates these seeds into complete alignments, a step that is computationally intensive, especially when handling spliced transcripts and multimapping reads.
For the human genome, the memory requirement is substantial. The genome index alone can consume approximately 30 GB of RAM, and the alignment process itself requires significant additional memory, particularly when using multiple threads [19]. Runtime can be protracted, with a single sample containing 20-50 million reads potentially taking several hours to align on a standard desktop computer [19]. In cloud or high-performance computing (HPC) environments, these constraints are multiplied across many concurrent samples, making strategic resource allocation essential for cost-effective and timely analysis [20].
Strategic Resource Optimization Approaches
Optimizing resource allocation for STAR involves a multi-faceted strategy that addresses memory, processor, and I/O operations. The following sections outline proven techniques to mitigate bottlenecks.
Memory Management and Allocation
- Sufficient RAM Provisioning: The primary rule is to ensure adequate physical memory. For aligning human RNA-seq data, a minimum of 32 GB of free RAM is recommended, with 64 GB or more providing comfortable headroom for parallel execution and other concurrent tasks [19]. Insufficient RAM will lead to intensive swapping to disk, drastically increasing runtime.
- Control BAM Sorting Memory: The
--limitBAMsortRAMparameter is critical for controlling memory spikes during the BAM sorting phase, which is part of generating sorted alignment files. This parameter should be set to the amount of RAM (in bytes) available for this operation. For example, on a node with 64 GB of RAM, setting--limitBAMsortRAM 60000000000(approximately 60 GB) reserves adequate memory without risking system instability [4] [36]. - Optimize Genome Loading: The
--genomeLoadparameter dictates how the genome index is loaded into memory. TheLoadAndKeepoption can be beneficial in a multi-sample batch alignment scenario, as it loads the genome index into shared memory once and keeps it there for subsequent jobs, avoiding the overhead of repeated loading and unloading [36].
Computational Processing and Parallelization
- Optimal Core Utilization: STAR is designed to leverage multiple CPU cores. The
--runThreadNparameter specifies the number of parallel threads. While increasing threads generally reduces runtime, the relationship is not linear and diminishes beyond a certain point due to increased I/O and memory bus contention. For a typical server, using 6-12 cores often provides an excellent balance of speed and efficiency [4] [20]. Profiling should be done to find the sweet spot for a specific system. - Parallelize at the Sample Level: For large studies with hundreds of samples, the most effective strategy is to parallelize at the sample level rather than solely relying on multi-threading a single sample. This approach involves running multiple independent STAR alignment jobs concurrently on a computing cluster or in the cloud, each with an optimized thread count. This maximizes overall throughput and is more scalable [20] [19].
Input/Output (I/O) and Storage Optimization
- High-Throughput Storage: STAR performs intensive read and write operations. Using high-performance local Solid State Drives (SSDs) or high-speed network-attached storage (e.g., via 10G Ethernet or Infiniband) is crucial for preventing I/O from becoming the limiting factor [19]. Avoid using standard hard disk drives (HDDs) for large-scale alignment work.
- Cloud and HPC Considerations: In cloud environments, selecting instance types with high I/O performance is key. Furthermore, distributing the pre-computed STAR genome index to worker instances efficiently is a common challenge that must be addressed to avoid startup delays [20].
Algorithmic and Parameter Tuning
Strategic adjustment of alignment parameters can significantly reduce computational load without sacrificing meaningful accuracy.
- Limit Multimapping Reads: The
--outFilterMultimapNmaxparameter sets the maximum number of alignments allowed for a read. The default is 10, but for certain analyses focusing on uniquely mapped reads, setting this to 1 can reduce computational complexity and output file size [37]. - Adjust Mismatch Tolerance: Tightening the
--outFilterMismatchNmaxand related parameters like--outFilterMismatchNoverLmax(the ratio of mismatches to mapped length) can reduce the number of potential alignments considered, speeding up the process, especially with high-quality reads [37] [36]. - Set Biological Intron Limits: The
--alignIntronMinand--alignIntronMaxparameters should be set to biologically plausible values for the organism (e.g.,--alignIntronMin 20and--alignIntronMax 1000000). Restricting the search space for introns prevents STAR from spending time on unrealistic splice junctions [37].
Table 1: Summary of Key STAR Parameters for Resource Optimization
| Parameter | Function | Recommended Setting | Impact |
|---|---|---|---|
--runThreadN |
Number of parallel processing threads | 6-12 cores | Increases alignment speed, but with diminishing returns. |
--limitBAMsortRAM |
RAM for BAM sorting | ~90% of available RAM (e.g., 60GB on a 64GB node) | Prevents memory exhaustion during the sorting step. |
--genomeLoad |
Genome index loading mode | LoadAndKeep (for batch runs) |
Reduces reloading overhead in multi-sample workflows. |
--outFilterMultimapNmax |
Max loci a read can map to | 1 (for unique maps) or 10 (default) | Lower values reduce computation and output for repetitive regions. |
--outFilterMismatchNoverLmax |
Mismatch ratio to mapped length | 0.05 - 0.1 | Tighter values can speed up alignment with high-quality data. |
--alignIntronMin / --alignIntronMax |
Min/Max intron sizes | Organism-specific (e.g., 20-1000000) | Limits spurious alignment across unrealistic genomic gaps. |
Experimental Protocol for Benchmarking STAR Performance
This protocol provides a step-by-step methodology to empirically determine the optimal resource allocation for a specific computing environment and dataset.
Table 2: Research Reagent Solutions for STAR Alignment
| Item | Function / Description | Example / Note |
|---|---|---|
| STAR Aligner | Spliced alignment of RNA-seq reads to a reference genome. | Version 2.7.10b or newer [20]. |
| Reference Genome | FASTA file of the organism's genome sequence. | e.g., Human (GRCh38) from Ensembl [4]. |
| Annotation File | GTF file with gene model annotations. | Used during index generation and alignment [4]. |
| RNA-seq Reads | Input data in FASTQ format. | Can be sourced from public repositories like NCBI SRA [20]. |
| High-Performance Compute Node | Server with sufficient CPU, RAM, and fast storage. | Minimum 8 cores, 32 GB RAM; 64+ GB RAM and SSDs recommended [19]. |
| SRA Toolkit | Utilities for accessing data in the SRA format. | Uses prefetch and fasterq-dump [20]. |
Step-by-Step Procedure
- Infrastructure Setup: Provision a compute node with a known configuration (CPU model, number of cores, amount of RAM, and storage type). Ensure STAR and necessary dependencies are installed.
- Genome Index Generation: Generate a STAR genome index using a representative reference genome and annotation file.
- Design the Benchmarking Experiment: Select a representative RNA-seq sample (e.g., 20-30 million reads). Plan a series of alignment runs where one variable is changed at a time:
- CPU Scaling: Run alignment with
--runThreadNset to 2, 4, 6, 8, 12, 16, and 24, while keeping all other parameters constant. Monitor the total wall-clock runtime and CPU usage. - Memory Profiling: Execute an alignment with a high thread count and use system monitoring tools (e.g.,
top,htop,time) to record peak memory usage.
- CPU Scaling: Run alignment with
- Execute Alignment Runs: For each configuration in the experimental design, run the STAR alignment command.
- Data Collection and Analysis: For each run, record: a) Total execution time, b) Peak memory usage, and c) Alignment statistics from the
Log.final.outfile. Plot runtime and memory versus the number of threads to identify the point of optimal scaling.
The workflow below illustrates the key stages and decision points in the resource optimization process.
Validation and Performance Metrics
To validate the effectiveness of resource allocation strategies, researchers should track specific performance and output metrics.
- Runtime Efficiency: The total wall-clock time to complete alignment is the primary measure of efficiency. A successful optimization should show a significant reduction in time, such as the 23% reduction in total alignment time demonstrated through "early stopping" optimizations in a cloud-based study [20].
- Memory Utilization: Peak memory usage should remain consistently below the available physical RAM to avoid swapping. Monitoring tools should confirm that memory usage is stable and efficient.
- Alignment Statistics: The alignment metrics reported in STAR's
Log.final.outfile must be reviewed to ensure optimization has not compromised quality. Key metrics include:- Uniquely Mapped Reads %: This should remain stable or improve.
- Mapping Quality: The distribution of mapping scores should not be adversely affected.
- Splice Junction Detection: The number of novel and annotated junctions should be consistent with expectations.
- Cost-Efficiency (Cloud): In cloud environments, the total compute cost (instance cost × runtime) is a critical metric. The goal is to achieve the fastest runtime with the most cost-effective instance type, potentially leveraging spot instances for further cost reduction [20].
Effective resource allocation is foundational to executing efficient and scalable RNA-Seq analyses with the STAR aligner. By understanding the computational bottlenecks and systematically applying strategies for memory management, parallel processing, I/O optimization, and parameter tuning, researchers can dramatically accelerate their workflows. The experimental protocol provided herein serves as a template for empirically determining the optimal configuration for any given computational environment. As transcriptomic datasets continue to grow in size and complexity, mastering these resource allocation strategies will be indispensable for researchers and drug developers aiming to derive timely and biologically meaningful insights from their data.
RNA sequencing has become an indispensable tool across biological disciplines, yet the computational analysis of resulting data presents significant challenges, particularly for non-mammalian organisms. The Spliced Transcripts Alignment to a Reference (STAR) software package performs this task with high levels of accuracy and speed [2]. However, STAR's default parameters are specifically optimized for mammalian genomes [4], creating a critical need for parameter fine-tuning when working with non-mammalian species.
The fundamental challenge lies in the substantial variation in genomic architecture across the tree of life. Parameters governing intron length, gap distances, and splicing signals must be adjusted to reflect biological reality for organisms ranging from fruit flies to fungi. Failure to customize these settings can result in poor mapping rates, inaccurate splice junction detection, and ultimately, compromised biological conclusions. This protocol provides a comprehensive framework for adapting STAR's alignment parameters to diverse non-mammalian genomes, ensuring optimal performance regardless of study organism.
Key Parameter Adjustments for Non-Mammalian Genomes
Critical Parameters Requiring Modification
For non-mammalian genomes, the most important STAR parameters to adjust are those controlling intron size and alignment gaps [38]. The developer of STAR, Alexander Dobin, explicitly recommends tweaking these parameters when working with non-mammalian organisms [38]. The following table summarizes the core parameters that require adjustment and their typical values for different taxonomic groups.
Table 1: Essential STAR Parameters for Non-Mammalian Genomes
| Parameter | Mammalian Default | Non-Mammalian Typical Range | Biological Significance |
|---|---|---|---|
--alignIntronMin |
21 | 5-20 [38] | Minimum intron length; smaller for compact genomes |
--alignIntronMax |
0 (unlimited) | 1000-5000 [38] | Maximum intron length; critical for organisms with shorter introns |
--alignMatesGapMax |
0 (unlimited) | 1000-5000 [38] | Maximum gap between mate pairs; should reflect expected transcript sizes |
--seedSearchStartLmax |
50 | 12-30 | Controls seed search sensitivity for smaller genomes |
--outFilterScoreMinOverLread |
0.66 | 0.75-0.90 | Increases alignment stringency for more divergent species |
--outFilterMatchNminOverLread |
0.66 | 0.75-0.90 | Prevents spurious alignments in gene-dense genomes |
The --alignIntronMin and --alignIntronMax parameters are particularly critical as they define the allowable intron sizes during splice junction detection. Mammalian introns can span hundreds of kilobases, while many non-mammalian organisms have significantly more compact intronic regions. Setting appropriate bounds for these parameters dramatically improves splice junction detection accuracy and reduces computational overhead by limiting the search space.
Organism-Specific Parameter Recommendations
Based on empirical observations and community usage patterns, the following organism-specific guidelines have emerged:
Table 2: Organism-Specific Parameter Recommendations
| Organism Group | --alignIntronMin |
--alignIntronMax |
--alignMatesGapMax |
Additional Considerations |
|---|---|---|---|---|
| Insects (Drosophila) | 5-10 | 2000-3000 | 2000-3000 | High gene density; short introns |
| Fungi/Yeast | 5-15 | 1000-1500 | 1000-1500 | Very compact genomes; few/long genes |
| Plants (Arabidopsis) | 10-20 | 3000-5000 | 3000-5000 | Moderate intron lengths |
| Avian Species | 15-25 | 50000-100000 | 50000-100000 | Longer introns but generally shorter than mammals |
| Fish (Zebrafish) | 10-20 | 50000-200000 | 50000-200000 | Variable intron lengths |
For organisms with extremely compact genomes, such as yeast and many fungi, reducing --seedSearchStartLmax to values between 12-30 can improve mapping accuracy without excessive computational burden [23]. Additionally, increasing the --outFilterScoreMinOverLread and --outFilterMatchNminOverLread parameters to 0.75-0.90 provides stricter alignment thresholds that help mitigate the challenges of gene-dense genomic regions.
Experimental Protocol for Parameter Optimization
Comprehensive Two-Pass Alignment Workflow
The following workflow diagram illustrates the complete parameter optimization process for non-mammalian genomes:
Diagram 1: Parameter optimization workflow for non-mammalian genomes
Detailed Step-by-Step Methodology
Step 1: Reference Genome and Annotation Preparation
Begin by obtaining high-quality reference genome sequences (FASTA format) and annotation files (GTF format) from authoritative sources such as Ensembl, RefSeq, or UCSC [23]. For non-mammalian organisms, pay particular attention to:
- Genome Assembly Quality: Prefer chromosomal-level assemblies over scaffold-level when available
- Annotation Completeness: Ensure comprehensive gene models with validated splice junctions
- Sequence Type: Use primary assembly files (e.g.,
*dna.primary.fain Ensembl) that exclude haplotypes and patches for most applications [38]
Step 2: Initial Genome Index Generation with Organism-Informed Parameters
Generate the initial genome index using organism-appropriate parameters. This example demonstrates parameters suitable for insect genomes:
Critical indexing parameters for non-mammalian genomes include:
--genomeSAindexNbases: Reduce for smaller genomes (min(14, log2(GenomeLength)/2 - 1))--genomeChrBinNbits: Adjust based on genome size (min(18, log2(GenomeLength/NumberOfReferences)))--sjdbOverhang: Set to read length minus 1 (100 is generally suitable for reads up to 101bp) [38]
Step 3: First Alignment Pass for Novel Junction Discovery
Execute the first alignment pass to identify novel splice junctions not present in the original annotation:
The --outFilterType BySJout option is particularly recommended as it reduces spurious alignments using information from the splice junction output [38].
Step 4: Novel Junction Collection and Second Index Generation
Extract novel junctions from the SJ.out.tab file generated in the first pass and incorporate them into an enhanced genome index:
Step 5: Final Optimized Alignment
Execute the final alignment using the enhanced genome index:
Quality Control and Validation Metrics
Assessment of Alignment Performance
Following alignment, comprehensive quality assessment is essential to validate parameter choices. The following metrics should be evaluated:
Table 3: Key Quality Control Metrics for Non-Mammalian Alignment
| Metric Category | Specific Metric | Target Value | Interpretation |
|---|---|---|---|
| Mapping Efficiency | Uniquely Mapped Reads | >70% [39] | Indicates overall alignment success |
| Multi-Mapped Reads | <20% | Suggests specificity of alignments | |
| Unmapped Reads | <10% | May indicate contamination or poor reference | |
| Splice Junction Detection | Annotated Junctions | High recovery rate | Measures annotation completeness |
| Novel Junctions | Moderate number | Indicates discovery potential | |
| Junction Read Support | ≥3 reads per junction [25] | Confirms junction reliability | |
| Coverage Distribution | 5'-3' Bias | Minimal bias | Suggests RNA integrity |
| Exonic vs Intronic | >70% exonic [39] | Confirms RNA enrichment | |
| GC Content | Sample-appropriate | Detects technical biases |
Troubleshooting Common Issues
Common alignment problems and their solutions for non-mammalian genomes include:
- Low mapping rates: Relax
--outFilterScoreMinand--outFilterMatchNminparameters; verify reference genome quality and completeness - Excessive multimapping: Increase stringency of
--outFilterScoreMinOverLreadand--outFilterMatchNminOverLread; consider using--outFilterMultimapNmaxto limit multimappers - Poor splice junction detection: Adjust
--alignIntronMinand--alignIntronMaxto better match biological reality; verify strand-specificity settings for library type - Long runtime: Increase
--seedSearchStartLmaxto reduce search space; utilize more threads with--runThreadN
Table 4: Essential Research Reagent Solutions for STAR Alignment
| Resource Category | Specific Tool/Resource | Function/Purpose | Availability |
|---|---|---|---|
| Reference Genomes | Ensembl genomes | Comprehensive genome sequences & annotations | https://www.ensembl.org |
| NCBI RefSeq | Curated reference sequences | https://www.ncbi.nlm.nih.gov/refseq | |
| UCSC Genome Browser | Genome sequences & annotation tracks | https://genome.ucsc.edu | |
| Quality Control Tools | FastQC | Raw read quality assessment | https://www.bioinformatics.babraham.ac.uk/projects/fastqc |
| MultiQC | Aggregate QC reports across samples | https://multiqc.info | |
| Qualimap | Alignment quality assessment | https://qualimap.conesalab.org | |
| Downstream Analysis | featureCounts | Read counting for genes/exons | https://subread.sourceforge.net |
| DESeq2 | Differential expression analysis | https://bioconductor.org/packages/DESeq2 | |
| StringTie | Transcript assembly & quantification | https://ccb.jhu.edu/software/stringtie | |
| Computational Resources | High-performance computing cluster | Memory-intensive genome indexing & alignment | Institutional resources |
| Conda environments | Reproducible software management | https://docs.conda.io |
Parameter optimization for non-mammalian genomes in STAR aligner is not merely a technical exercise but a critical component of biologically informed computational analysis. By systematically adjusting intron size parameters, alignment stringency thresholds, and genome indexing options, researchers can achieve dramatic improvements in mapping accuracy and splice junction detection.
The two-pass alignment method outlined in this protocol represents a robust framework for maximizing discovery potential while maintaining computational efficiency. This approach is particularly valuable for non-model organisms where annotation completeness may be limited. By implementing these guidelines and leveraging the quality control metrics provided, researchers can ensure that their RNA-seq analyses yield biologically meaningful results regardless of their chosen study organism.
As sequencing technologies continue to evolve and reference genomes for diverse species improve, these parameter optimization principles will remain essential for extracting the full biological signal from transcriptomic datasets.
In a robust RNA-Seq alignment workflow using the STAR aligner, validating alignment success through rigorous quality control (QC) metrics is not merely a supplementary step but a fundamental requirement for generating biologically meaningful data. The alignment process, which determines where in the genome sequenced reads originated, is a critical juncture where biases and errors can be introduced, potentially compromising all subsequent analyses, including differential expression and transcript discovery [4]. The STAR (Spliced Transcripts Alignment to a Reference) aligner is widely adopted due to its speed and accuracy in handling spliced transcripts [15]. However, its output must be systematically evaluated using a framework of QC metrics to assess the technical quality of the data, identify potential issues, and confirm that the results are reliable and suitable for addressing the intended biological questions [39]. This application note details the essential QC checkpoints and protocols for researchers and drug development professionals to validate STAR alignment success effectively.
Key Alignment Metrics and Their Interpretation
Following STAR alignment, a suite of metrics is generated, providing a quantitative overview of the mapping exercise. These metrics, often found in summary files and detailed in log outputs, should be interrogated to evaluate the efficiency and accuracy of the alignment process.
Library-Level Alignment Metrics
Library-level metrics offer a high-level summary of the alignment performance across the entire sample. The table below catalogs critical metrics, their descriptions, and benchmarks for interpretation.
Table 1: Key Library-Level STAR Alignment Metrics and Their Interpretation
| Metric Name | Description | Interpretation & Benchmark |
|---|---|---|
| Reads Mapped to Genome: Unique | Fraction of reads that mapped uniquely to a single locus in the genome [40]. | High values (e.g., 70-90% for human) indicate successful alignment. Significantly lower values may suggest contamination, poor RNA quality, or incorrect reference genome [39]. |
| Reads Mapped to Genome: Multiple | Fraction of reads that mapped to multiple loci in the genome [40]. | Expected in repetitive regions. Moderately high values are normal for RNA-seq, but extreme values may indicate a high level of repeats or technical artifacts. |
| Reads Mapped to Genes: Unique | Fraction of uniquely mapped reads that align to annotated genomic features (genes) as defined by the --soloFeatures parameter [40]. |
A primary indicator of success. High values (e.g., >60%) suggest good annotation and library quality. Low values can point to incomplete annotation, high intronic/intergenic reads, or ribosomal RNA contamination [41]. |
| Reads with Valid Barcodes | Fraction of reads containing a cell barcode that matched the whitelist (critical for single-cell RNA-seq) [40]. | For single-cell protocols, this should be very high (>80%). Low values indicate issues with the library preparation or an incorrect whitelist. |
| Mismatch Rate per Base | Average number of mismatches per base between the read and the reference. | Should be low (<0.05/bi). Elevated rates can indicate poor sequencing quality, excessive PCR cycles, or genetic differences from the reference strain. |
| Sequencing Saturation | Proportion of unique molecular identifiers (UMIs) that have been sequenced at least once [40]. | Measures library complexity. High saturation (>50%) indicates that deeper sequencing would yield diminishing returns for detecting new molecules [40]. |
Exon/Intron Mapping and Strandedness Metrics
The distribution of reads across genomic features provides deeper insights into RNA integrity and library construction.
Table 2: Genomic Feature Mapping Metrics
| Metric | Description | Interpretation |
|---|---|---|
| Exonic Reads | Number of reads mapping to annotated exons [40]. | Should be the dominant fraction in high-quality mRNA-seq from intact RNA. |
| Intronic Reads | Number of reads mapping to annotated introns [40]. | High levels can indicate significant pre-mRNA (nuclear RNA) contamination, which is common in total RNA-seq or with degraded samples [40]. |
| Intergenic Reads | Reads mapping outside any annotated gene. | High levels may suggest genomic DNA contamination, the presence of unannotated transcripts, or an incomplete reference annotation. |
| Strandedness | Whether the library protocol preserves the strand of origin of the transcript [41]. | Critical for accurate quantification of overlapping genes and antisense transcripts. Tools like RSeQC can calculate this from the aligned BAM file. A mis-specified strandedness parameter will lead to incorrect quantification [39]. |
Experimental Protocol for Post-Alignment QC
This protocol outlines the steps for generating and analyzing QC metrics following a STAR alignment run, applicable to both bulk and single-cell RNA-seq data.
Pre-Alignment Prerequisites
- Input Data: Aligned reads in BAM format, generated by STAR [4].
- Reference Files: The same genome reference FASTA and annotation GTF files used during STAR genome index generation and alignment [4].
- Software Tools: The following tools should be installed and available in your
PATH:- SAMtools: For indexing and manipulating BAM files [39].
- Qualimap 2: A comprehensive tool for next-generation sequencing alignment data quality assessment [39].
- RSeQC: A toolset for RNA-seq quality control [39].
- MultiQC: Aggregates results from multiple tools and samples into a single HTML report, essential for multi-sample studies [42].
Step-by-Step Procedure
BAM File Preparation:
- Sort and index the BAM file produced by STAR. This is required by most downstream QC tools.
Run Qualimap RNASeq Analysis:
- Execute Qualimap to calculate a wide array of RNA-seq specific metrics, including reads genomic origin, 5'-3' bias, and coverage profiles.
- Inspect the generated
rnaseq_qc_results.htmlreport. Pay close attention to the "Genomic Origin of Reads" plot and the "5'-3' Coverage Plot" for signs of bias.
Run RSeQC for Strandedness and Saturation:
- Use the
infer_experiment.pyscript to verify the library's strandedness. - Use the
read_distribution.pyscript to see the breakdown of reads across feature types.
- Use the
Aggregate Reports with MultiQC:
- In the parent directory containing all your sample results, run MultiQC. It will automatically scan for outputs from STAR, Qualimap, RSeQC, FastQC, and others.
- The resulting
multiqc_report.htmlprovides a consolidated view, allowing for easy cross-sample comparison to identify outliers.
STAR-Specific Metrics Analysis:
- Manually inspect the STAR log file (
Log.final.out) for key statistics like mapping rates, mismatch rates, and splicing events. MultiQC will also visualize these.
- Manually inspect the STAR log file (
Data Interpretation and Decision Point
- Pass: Proceed to downstream analysis if metrics meet all criteria (e.g., high unique mapping rate, correct strandedness, expected exon/intron ratio).
- Investigate: If metrics are borderline (e.g., slightly low mapping rate), consult the raw read QC from FastQC and the STAR log for clues. The issue may lie in sample quality or adapter contamination.
- Fail: If critical metrics fail (e.g., very low gene mapping due to rRNA contamination, incorrect strandedness), the sample may need to be re-sequenced, or the analysis must be re-run with corrected parameters or a ribosomal depletion-aware workflow [41].
Workflow Visualization
The following diagram illustrates the logical flow of the post-alignment quality control process, from initial alignment to the final decision point.
The Scientist's Toolkit: Essential Research Reagents and Materials
Successful execution of the RNA-Seq workflow, from sample to sequence, relies on a foundation of high-quality reagents and computational resources. The following table details the essential components.
Table 3: Essential Research Reagent Solutions and Materials
| Item | Function / Purpose | Specifications & Notes |
|---|---|---|
| PAXgene Blood RNA Tube | Stabilizes intracellular RNA in whole blood samples at the point of collection, preserving the transcriptome profile [43]. | Critical for clinical biobanking. Ensures RNA integrity (RIN > 7) for reliable results, especially in biomarker discovery studies [43]. |
| Stranded mRNA-Seq Kit | Library preparation that preserves strand information, allowing determination of the transcript's originating DNA strand [41]. | Preferable for most applications. The dUTP-based method is widely used. Essential for identifying overlapping genes and antisense transcription [41]. |
| Ribosomal RNA Depletion Kit | Selectively removes abundant ribosomal RNA (rRNA) to increase the sequencing depth of informative mRNA and non-coding RNA [41]. | Used for total RNA sequencing or with degraded samples (e.g., FFPE). More variable than poly-A selection; requires careful QC to assess efficiency [41]. |
| STAR Aligner Software | A splice-aware aligner that accurately maps RNA-seq reads to a reference genome, accounting for introns [4]. | Requires significant RAM (~32GB for mammalian genomes). Its speed and accuracy make it a standard in the field [44] [4]. |
| Reference Genome & Annotation | The species-specific genomic DNA sequence and curated gene model file (GTF/GFF) used for alignment and quantification [4]. | Must be matched and from the same source (e.g., Ensembl, GENCODE). Quality and completeness of the annotation directly impact mapping and detection rates. |
| High-Performance Computing (HPC) | Provides the computational resources (CPU, RAM, storage) necessary for processing large sequencing datasets [44]. | STAR alignment is resource-intensive. Cloud platforms (e.g., AWS, GCP) or local clusters are often required. Serverless options are emerging but have limitations [44]. |
The accurate alignment of RNA sequencing reads to a reference genome presents a unique computational challenge, primarily due to the presence of spliced transcripts. During transcription, eukaryotic cells remove introns and splice together non-contiguous exons, generating mature messenger RNA. Consequently, a significant proportion of RNA-seq reads derived from these transcripts span these splice junctions, making them impossible to align contiguously to the reference genome. The STAR (Spliced Transcripts Alignment to a Reference) aligner was designed specifically to address this challenge using a novel two-step algorithm involving seed searching followed by clustering, stitching, and scoring [2]. A critical component of its accuracy is the incorporation of known splice junction information from annotation files, a process governed by the --sjdbOverhang parameter and its interaction with other key options. Proper configuration of these parameters is essential for constructing a robust, sensitive, and efficient RNA-seq alignment workflow, which forms the foundational step for downstream analyses like differential expression and transcript isoform discovery in both academic research and drug development contexts.
A Deep Dive into the --sjdbOverhang Parameter
Conceptual Foundation and Definition
The --sjdbOverhang option is used exclusively during the genome indexing step of a STAR workflow. Its primary function is to instruct the aligner on how to construct reference sequences for known splice junctions obtained from an annotation file (GTF or GFF). For every annotated junction, STAR extracts a sequence segment comprising N exonic bases from the donor site and N exonic bases from the acceptor site, and then splices these two segments together to create an artificial "junction" sequence that is added to the genome index [45]. The parameter N is precisely the value specified by --sjdbOverhang.
The "ideal" value for this parameter, as defined in the STAR manual and confirmed by its developer, is matelength - 1 [46] [4]. For single-end reads, "matelength" is simply the read length. For paired-end reads, it is the length of one mate. This ideal value ensures that even if a read aligns with a single base on one side of the junction and the remainder on the other, the entire junction sequence is present in the index, enabling a full-length alignment [46].
Practical Configuration and Recommendations
While the ideal is mate_length - 1, practical considerations often come into play, especially when dealing with multiple datasets of varying read lengths. The following table summarizes the recommended strategies for different scenarios.
Table 1: Recommended --sjdbOverhang Values for Various Experimental Scenarios
| Scenario | Recommended --sjdbOverhang | Rationale | Source |
|---|---|---|---|
| Standard Single Dataset (e.g., 100 bp reads) | 99 | Ideal value: Optimizes for the maximum possible overhang for the given read length. | [46] [4] |
| Multiple Datasets with Varying Read Lengths | 100 (Default) | A value of 100 works practically the same as a larger ideal value for longer reads and is generally safe. | [4] [45] |
| Very Short Reads (< 50 bp) | mate_length - 1 |
For short reads, using the ideal value is strongly recommended for optimal sensitivity. | [45] |
| Trimmed Reads of Variable Length | max(ReadLength) - 1 |
Using the maximum read length ensures the index is sufficient for all reads. The default of 100 is often adequate. | [4] [45] |
A critical technical point is that the value of --sjdbOverhang specified during the initial genome generation is "baked in" to the index. If you need to change it, you must re-run the genome generation step. However, note that when using the two-pass mapping method, STAR can incorporate novel junctions discovered in the first pass on the fly, which mitigates some dependence on the initial index's --sjdbOverhang value for unannotated junctions.
Interaction with Other Critical STAR Options
The performance of STAR is not determined by a single parameter but by the interplay of several. Understanding the relationship between --sjdbOverhang and other key options is crucial for advanced optimization.
--alignSJDBoverhangMin: It is vital to distinguish this from--sjdbOverhang. While--sjdbOverhangis used at the genome generation stage,--alignSJDBoverhangMinis used at the mapping stage. It defines the minimum allowable number of bases that a read must align on either side of an annotated (SJDB) splice junction. The default value is 3, which would filter out alignments with overhangs of only 1 or 2 bases [46]. This is a key filtering parameter for controlling the precision of junction alignments.--seedSearchStartLmax: This parameter controls the maximum length of the sequence "seeds" used in the initial MMP (Maximal Mappable Prefix) search. The developer notes that even if a read is longer than the--sjdbOverhangvalue, it can still be mapped to the spliced reference as long as--sjdbOverhang > --seedSearchStartLmax[45]. This is because the read is split into smaller seeds for alignment. For most standard applications, the default value for--seedSearchStartLmax(50) works well. However, for challenging mappings, such as those with high divergence or low quality, reducing this value can increase sensitivity by forcing the aligner to consider more, smaller seeds.
Table 2: Key Differentiating Features of --sjdbOverhang and --alignSJDBoverhangMin
| Feature | --sjdbOverhang |
--alignSJDBoverhangMin |
|---|---|---|
| Usage Stage | Genome Generation | Read Alignment |
| Primary Function | Defines junction sequence length in the index. | Sets a filter for the minimum overhang on annotated junctions in final alignments. |
| Impact | Affects the potential for a read to be aligned across a junction. | Affects which junction alignments are reported in the final output. |
| Ideal Value | mate_length - 1 (or 100 for generality) |
Application-dependent; default is 3. |
Figure 1: A simplified workflow showing the distinct stages at which --sjdbOverhang and --alignSJDBoverhangMin are applied.
Experimental Protocols for Robust Alignment
Protocol 1: Genome Index Generation for a Single Dataset
This protocol is designed for generating a STAR genome index tailored to a specific read length, which is the optimal scenario for sensitivity [4] [47].
Prerequisites:
- Reference genome sequence in FASTA format (uncompressed).
- Gene annotation in GTF format (uncompressed).
- Determine the read length of your sequencing dataset (e.g., 100 bp).
Command Line Execution:
Explanation of Key Options:
--runMode genomeGenerate: Sets the mode for index creation.--genomeDir: Path to the directory where the indices will be stored.--genomeFastaFiles&--sjdbGTFfile: Paths to the reference and annotation files.--sjdbOverhang 99: The ideal value for 100 bp reads.--runThreadN 12: Number of CPU threads to use for parallelization.
Protocol 2: Alignment of RNA-Seq Reads
This protocol details the read mapping step, which utilizes the pre-generated index [4] [1].
Prerequisites:
- Generated genome index (from Protocol 1).
- RNA-seq reads in FASTQ format (can be gzipped).
Command Line Execution:
Explanation of Key Options:
--genomeDir: Points to the directory of the pre-generated index.--readFilesIn: Specifies the input read files.--readFilesCommand "zcat": Indicates that the input files are compressed and specifies the command to read them.--outSAMtype BAM SortedByCoordinate: Outputs alignments as a coordinate-sorted BAM file, ready for use by many downstream tools.--quantMode GeneCounts: Directs STAR to output read counts per gene, a crucial first step for differential expression analysis.--outFileNamePrefix: Defines the path and prefix for all output files.
Protocol 3: Handling Multiple Datasets with Mixed Read Lengths
This protocol provides a strategy for a common scenario in meta-analyses or when utilizing public data, where different batches have different read lengths [48] [45].
Strategy: Use a single, universally applicable index. The developer recommends using the default value of
--sjdbOverhang 100for this purpose, as it works well for a wide range of read lengths.Index Generation Command:
- Alignment: The alignment command (Protocol 2) remains identical for all datasets, regardless of their original read length, simplifying the workflow.
The Scientist's Toolkit: Research Reagent Solutions
Table 3: Essential Materials and Reagents for an RNA-seq Alignment Workflow with STAR
| Item | Function / Purpose | Example / Specification |
|---|---|---|
| Reference Genome (FASTA) | The foundational sequence against which reads are aligned. Provides the coordinate system. | Homosapiens.GRCh38.dna.primaryassembly.fa |
| Gene Annotation (GTF) | Contains coordinates of known genes, exons, and splice junctions. Used by STAR to build the splice junction database (SJDB). | Homo_sapiens.GRCh38.109.gtf |
| High-Performance Computing Node | STAR is memory and CPU intensive. Adequate resources are required for efficient execution. | >= 32 GB RAM, 8-16 CPU cores, SSD storage recommended. |
| STAR Aligner Software | The core software tool that performs the spliced alignment of RNA-seq reads. | Version 2.7.10b or later. |
| RNA-seq Read Files (FASTQ) | The raw input data from the sequencing facility, containing the nucleotide sequences and quality scores. | Paired-end (e.g., 2x100 bp) or Single-end. |
| SAMtools | A suite of utilities for post-processing alignments. Used for indexing, sorting, and manipulating BAM files. | Version 1.17 or later. |
Figure 2: Logical flow of data and software dependencies in a standard STAR alignment workflow, culminating in key output files.
Ensuring Accuracy: How STAR Stacks Up in the RNA-seq Toolbox
Within the standard RNA-sequencing (RNA-seq) analysis workflow, the alignment of sequencing reads to a reference genome is a critical foundational step. The Spliced Transcripts Alignment to a Reference (STAR) software package is a widely adopted tool designed to address the unique challenges of RNA-seq data mapping, particularly the accurate alignment of reads across splice junctions [4] [2]. This application note provides a detailed benchmark of STAR's performance, evaluating its precision, accuracy, and speed within the context of a robust RNA-seq alignment workflow. As a key component of large-scale consortia like ENCODE, STAR's ability to rapidly and accurately process vast datasets—over 80 billion reads in the case of ENCODE—has been proven in production environments [2]. We present both quantitative performance comparisons with other common workflows and detailed protocols for implementing STAR in a reproducible research pipeline.
Performance Benchmarking
Speed and Throughput
STAR was designed with a novel RNA-seq alignment algorithm that provides a significant advantage in processing speed. In its original publication, STAR was demonstrated to outperform other contemporary aligners by more than a factor of >50 in mapping speed [2]. This high efficiency enables STAR to align to the human genome at a rate of 550 million 2 × 76 bp paired-end reads per hour on a modest 12-core server [2]. This exceptional throughput makes STAR particularly valuable for large-scale projects where computational efficiency is paramount.
Accuracy and Precision in Expression Quantification
Multiple independent studies have benchmarked STAR's accuracy against gold-standard validation methods. When compared to whole-transcriptome RT-qPCR expression data across 18,080 protein-coding genes, the STAR-HTSeq workflow demonstrated high fold-change correlation with qPCR measurements (R² = 0.933) [49]. This indicates excellent performance in differential expression analysis, which is crucial for most RNA-seq studies.
A comprehensive benchmarking study evaluating multiple RNA-seq workflows revealed that alignment-based algorithms like STAR-HTSeq showed a lower fraction of non-concordant genes (15.1%) compared to pseudoalignment methods when comparing RNA-seq and qPCR fold-changes [49]. This suggests more reliable detection of differentially expressed genes.
STAR's precision is further evidenced by experimental validation of novel splice junctions. Using Roche 454 sequencing of RT-PCR amplicons, researchers validated 1,960 novel intergenic splice junctions discovered by STAR with an 80-90% success rate, corroborating the high precision of its mapping strategy [2].
Table 1: Benchmarking STAR against Other RNA-Seq Workflows
| Workflow | Expression Correlation with qPCR (R²) | Fold-Change Correlation with qPCR (R²) | Key Characteristics |
|---|---|---|---|
| STAR-HTSeq | 0.821 [49] | 0.933 [49] | Fast alignment, high splice junction accuracy, memory-intensive |
| Tophat-HTSeq | 0.827 [49] | 0.934 [49] | Lower mapping speed, good accuracy |
| Tophat-Cufflinks | 0.798 [49] | 0.927 [49] | Transcript-level quantification, more complex workflow |
| Kallisto | 0.839 [49] | 0.930 [49] | Pseudoalignment, very fast, lightweight |
| Salmon | 0.845 [49] | 0.929 [49] | Pseudoalignment, fast, lightweight |
Performance in Long-Read RNA-Seq Context
While newer long-read sequencing technologies present different challenges, STAR's algorithm shows relevance in this evolving landscape. The LRGASP Consortium, a comprehensive benchmarking effort for long-read RNA-seq methods, noted that pipelines utilizing STAR for alignment (such as those employing FLAIR, LyRic, and other tools) were among those evaluated for transcript identification and quantification [50]. Although performance varied across tools, this inclusion in a major long-read benchmarking effort underscores STAR's ongoing relevance in the transcriptomics field.
The STAR Alignment Algorithm and Workflow
Core Algorithmic Strategy
STAR utilizes a novel two-step algorithm specifically designed for the challenges of RNA-seq data [4] [2]:
Seed Searching: STAR employs sequential maximum mappable prefix (MMP) search. For each read, it searches for the longest sequence that exactly matches one or more locations on the reference genome. The MMP search is implemented through uncompressed suffix arrays (SAs), allowing for fast searching against large genomes with logarithmic scaling of search time relative to genome size [2].
Clustering, Stitching, and Scoring: In the second phase, seeds are clustered by genomic proximity and stitched together based on a local linear transcription model. A dynamic programming algorithm stitches seed pairs, allowing for mismatches and indels [4] [2].
This two-step process enables unbiased de novo detection of canonical and non-canonical splices, chimeric transcripts, and full-length RNA sequences without prior annotation of splice junctions [2].
Comprehensive Experimental Protocol
Computational Requirements and Setup
STAR is memory-intensive, requiring significant RAM for the reference genome indices. For the human genome, approximately 32GB of RAM is recommended. The following protocol assumes a high-performance computing (HPC) environment using a job scheduler like SLURM [4].
Table 2: Research Reagent Solutions: Computational Components
| Component | Specification | Function |
|---|---|---|
| Computational Server | 12+ cores, 32+ GB RAM | Provides sufficient resources for parallel processing and genome indexing |
| Reference Genome | FASTA file (e.g., GRCh38) | Genomic sequence for read alignment |
| Gene Annotation | GTF file (e.g., Ensembl 92) | Known gene models for guiding alignment and quantification |
| STAR Software | Version 2.5.2b or newer | Core alignment algorithm |
| Sequence Read Files | FASTQ format | Raw input data from sequencing facility |
Protocol Part 1: Generating Genome Indices
Objective: Create a genome index for efficient read alignment.
Materials:
- Reference genome FASTA file (
Homo_sapiens.GRCh38.dna.chromosome.1.fa) - Gene annotation GTF file (
Homo_sapiens.GRCh38.92.gtf) - STAR software (module load gcc/6.2.0 star/2.5.2b)
Method:
- Create a directory for genome indices:
mkdir -p /n/scratch2/username/chr1_hg38_index - Create a job submission script (
genome_index.run) with the following content:
- Submit the job:
sbatch genome_index.run
Critical Parameters:
--runThreadN 6: Number of parallel threads to use--genomeDir: Path to store genome indices--sjdbOverhang 99: Specifies the length of the genomic sequence around annotated junctions, ideally set to read length minus 1 [4]
Protocol Part 2: Read Alignment
Objective: Map RNA-seq reads to the reference genome.
Materials:
- Generated genome indices
- FASTQ file containing RNA-seq reads (
Mov10_oe_1.subset.fq) - STAR software
Method:
- Navigate to the directory containing FASTQ files:
cd ~/unix_lesson/rnaseq/raw_data - Create an output directory:
mkdir ../results/STAR - Execute the alignment command:
Critical Parameters:
--readFilesIn: Specifies input FASTQ file--outSAMtype BAM SortedByCoordinate: Outputs alignments as coordinate-sorted BAM--outSAMunmapped Within: Keeps information about unmapped reads- Default maximum multiple alignments per read is 10 (adjustable with
--outFilterMultimapNmax) [4]
Discussion and Integration into Research Pipelines
STAR represents a robust solution for RNA-seq alignment, particularly when balanced performance in speed, accuracy, and splice junction detection is required. Its exceptional mapping speed makes it ideal for large-scale studies, while its high validation rates for novel junctions support its precision [2]. The integration of STAR into broader RNA-seq workflows (typically STAR-HTSeq or STAR-Cufflinks) provides researchers with a reliable foundation for transcriptome analysis.
When implementing STAR, researchers should consider:
- The trade-off between speed and memory usage, as STAR's uncompressed suffix arrays require substantial RAM [2]
- Parameter optimization for non-mammalian organisms, as default settings are optimized for mammalian genomes and may require adjustment for species with smaller introns [4]
- Complementary tool selection for quantification (e.g., HTSeq, featureCounts) or transcript assembly (Cufflinks, StringTie) to complete the analysis pipeline
STAR's continued use in contemporary benchmarking studies, including those focused on long-read RNA-seq [50], demonstrates its enduring value to the research community. As sequencing technologies evolve, STAR's fundamental algorithm provides a proven foundation for RNA-seq alignment that continues to support rigorous scientific discovery in genomics and drug development research.
The accurate alignment of RNA sequencing (RNA-seq) reads to a reference genome is a critical foundational step in transcriptomic analysis, influencing all downstream interpretations of gene expression, alternative splicing, and novel transcript discovery [51]. Within the context of a robust STAR research workflow, understanding the comparative strengths and weaknesses of available tools is essential for experimental success. The choice of aligner involves navigating key trade-offs between computational resource requirements, analytical speed, and the specific biological questions being addressed, such as the need for sensitive splice junction detection versus rapid transcript quantification [52]. This document provides a detailed technical comparison focusing on three widely used tools: the splice-aware aligner STAR, its efficient counterpart HISAT2, and the pseudoaligner/pseudo-mapper Salmon, which can operate in either alignment-based or lightweight mapping-based modes [53] [6]. We frame this comparison within the practical constraints of a research environment, offering structured data, optimized protocols, and decision frameworks to guide researchers and drug development professionals in selecting and implementing the most appropriate tool for their RNA-seq projects.
Technical Comparison of Aligner Methodologies
Core Algorithmic Approaches
The fundamental differences between STAR, HISAT2, and Salmon stem from their distinct algorithmic approaches to determining the origin of RNA-seq reads.
STAR (Spliced Transcripts Alignment to a Reference) employs a sequential, seed-and-extend strategy that first searches for Maximal Mappable Prefixes (MMPs) of a read against the reference genome before clustering and stitching these regions to span introns [20]. This method is highly sensitive for detecting canonical and non-canonical splice junctions, making it a comprehensive but computationally intensive solution. Its design prioritizes the accuracy of splice-aware genome alignment over speed, requiring significant memory resources to hold its entire genome index during operation [52].
HISAT2 (Hierarchical Indexing for Spliced Alignment of Transcripts) utilizes a hierarchical FM-index built from the global genome and tens of thousands of local genomic indices. This sophisticated indexing strategy allows HISAT2 to rapidly narrow the search space for a read's potential location, efficiently balancing the demands of high sensitivity for spliced alignments with substantially reduced memory and computation time compared to STAR [51]. It represents an evolution in efficiency for traditional alignment-based quantification.
Salmon operates on a different principle known as "lightweight alignment" or "selective alignment." Instead of generating a base-by-base alignment for every read, it rapidly assesses the compatibility of reads with target transcripts using a k-mer matching strategy (quasi-mapping) and then employs a sophisticated statistical model to infer transcript abundances [53] [6]. This approach bypasses the computationally costly steps of precise alignment and quality scoring, focusing computational effort on probabilistic quantification. Salmon can also function in a traditional alignment-based mode when provided with a BAM file, offering flexibility in workflow design [53].
Performance and Resource Benchmarking
The algorithmic differences translate directly into practical performance characteristics, which are critical for project planning and resource allocation. The following table summarizes key benchmarking data for these tools.
Table 1: Performance and Resource Benchmarking of RNA-seq Aligners
| Aligner | Core Methodology | Typical RAM Usage (Human Genome) | Relative Speed (for 10M reads) | Key Strengths |
|---|---|---|---|---|
| STAR | Seed-and-extend genome alignment | ~30 GB [52] | 850 seconds [54] | High splice junction sensitivity, novel junction discovery, comprehensive alignment output |
| HISAT2 | Hierarchical genome indexing | ~5 GB [52] | 700 seconds [54] | Balanced speed and accuracy, memory efficiency, excellent for standard splicing analysis |
| Salmon | Lightweight mapping to transcriptome | Varies by mode; generally lower than STAR | Faster than alignment-based methods [6] | Extremely fast quantification, high accuracy for expression estimation, low resource footprint |
The data in Table 1 reveals a clear trade-off. STAR provides the most comprehensive and sensitive alignment but at the cost of high memory consumption, making it suitable for well-resourced computing environments. HISAT2 offers a compelling middle ground, providing robust splice awareness with a memory footprint that is manageable on standard workstations or high-performance computing (HPC) nodes. Salmon, by operating directly on the transcriptome, achieves the highest speed and often the most accurate transcript-level quantification for differential expression analysis, as it avoids potential biases introduced by multi-mapped reads during the alignment stage [6].
Experimental Protocols and Application Notes
A Standardized STAR Alignment Workflow
The following protocol details a robust and optimized workflow for aligning RNA-seq data using STAR, incorporating best practices for cloud and HPC environments.
Protocol 1: RNA-seq Alignment Using STAR
Research Reagent Solutions:
- Reference Genome & Annotation: A FASTA file for the reference genome (e.g., GRCh38 for human) and its corresponding GTF annotation file from a source like GENCODE or Ensembl.
- RNA-seq Reads: Paired-end or single-end reads in FASTQ format. For paired-end, files are designated
*_1.fastq(left) and*_2.fastq(right). - Computing Infrastructure: A server or cloud instance with sufficient RAM (≥32 GB recommended for human genome) and multiple CPU cores.
Methodology:
Genome Index Generation: Before alignment, a reference genome index must be generated. This step is performed once for a given genome and annotation combination.
Note:
--sjdbOverhangshould be set to the read length minus 1. The--runThreadNparameter specifies the number of threads to use.Read Alignment: Map the RNA-seq reads to the genome using the pre-computed index.
Note: The
--quantMode GeneCountsoption instructs STAR to output read counts per gene, which can be used directly for differential expression analysis. TheSortedByCoordinateoutput is compatible with many downstream visualization tools.Optimization Notes:
- Cloud Cost & Throughput: For large-scale analyses, using spot instances in cloud environments (e.g., AWS EC2) and the "early stopping" optimization can reduce total alignment time by up to 23% and significantly lower costs [20].
- Parallelization: STAR efficiently utilizes multiple cores. Allocating 8-12 threads often yields optimal performance, though performance gains may diminish with higher thread counts due to I/O bottlenecks [20].
Addressing Alignment Errors with EASTR
A critical consideration in STAR research is the potential for erroneous spliced alignments in repetitive regions. The following protocol integrates EASTR, a tool designed to identify and remove such artifacts.
Protocol 2: Post-Alignment Filtering with EASTR
Research Reagent Solutions:
- EASTR Software: The EASTR tool, available from the original publication [51].
- Alignment Files: A BAM file generated by STAR or HISAT2.
- Reference Genome: The same reference genome FASTA file used for alignment.
Methodology:
Run EASTR: Execute EASTR on the alignment file to detect spurious junctions.
Impact and Interpretation: EASTR improves alignment accuracy by detecting splice junctions with high sequence similarity between their flanking regions, which are likely artifacts [51]. In human brain RNA-seq data, EASTR was shown to remove 2.7-3.4% of all spliced alignments, the vast majority ( >99.7% ) of which were non-reference junctions, thereby substantially reducing false positive introns and exons prior to transcript assembly [51]. This step is particularly crucial when working with data rich in repetitive elements or when the goal is novel isoform discovery.
A Salmon Quantification Workflow
For projects where the primary goal is accurate transcript quantification, the following Salmon protocol provides a fast and reliable alternative.
Protocol 3: Transcript Quantification Using Salmon
Research Reagent Solutions:
- Transcriptome: A FASTA file containing the nucleotide sequences of all known transcripts (e.g., from Ensembl or GENCODE).
- RNA-seq Reads: The raw reads in FASTQ format.
Methodology:
Salmon Indexing: Build a Salmon index from the transcriptome. For best practices, it is recommended to use a decoy-aware transcriptome.
Quantification: Quantify the reads against the index.
Note: The
-l Aflag tells Salmon to automatically infer the library type. The primary output filequant.sfin the output directory contains transcript abundance estimates in TPM and estimated counts.
Integrated Workflow for Comprehensive Analysis
For a holistic analysis that leverages the strengths of both alignment and quantification tools, a hybrid workflow is often most effective. The diagram below illustrates this integrated strategy.
Diagram 1: Integrated RNA-seq analysis workflow, showing parallel paths for STAR alignment and Salmon quantification.
Discussion and Strategic Selection Guide
Navigating the Trade-offs for Research Goals
The choice between STAR, HISAT2, and Salmon is not one of absolute superiority but of strategic fit. Each tool excels in different scenarios, and the optimal choice depends heavily on the primary research objective, the quality of the reference genome, and the available computational resources [8] [6].
Choose STAR when your research requires the most comprehensive and sensitive detection of splicing events, novel splice junctions, or complex genomic rearrangements. Its high memory requirement is justified for studies of alternative splicing, long non-coding RNA characterization, or when generating data for visualization in genome browsers. Furthermore, its high sensitivity makes it a strong candidate for projects where the goal is to build or refine transcriptome annotations [52] [20].
Choose HISAT2 when you need a robust, splice-aware aligner for standard differential expression analysis but are constrained by computational resources. Its significantly lower memory footprint ( ~5 GB vs. ~30 GB for human) allows it to run effectively on standard workstations, making it an excellent choice for individual labs or for educational purposes where computing power is limited [52]. It provides a good balance of accuracy and efficiency for routine RNA-seq analyses.
Choose Salmon when the primary goal is to obtain the most accurate and computationally efficient estimate of transcript abundance for differential expression testing. Its speed is a major advantage in large-scale studies involving hundreds of samples [6]. However, because it typically maps to a transcriptome rather than a genome, its ability to discover novel transcripts or splicing events not present in the provided annotation is limited unless used in a special de-novo mode.
The Critical Role of Benchmarking and Validation
Large-scale, real-world benchmarking studies, such as those conducted by the Quartet project, underscore that both experimental protocols and bioinformatics pipelines are major sources of variation in RNA-seq results [55]. These studies highlight that no single tool provides perfect performance across all metrics. Therefore, for critical applications, especially in clinical or diagnostic contexts where detecting subtle differential expression is key, empirical validation is essential. Researchers are encouraged to run a subset of their data through multiple pipelines (e.g., both a STAR-based and a Salmon-based workflow) to compare the robustness of their core findings. Integrating tools, as shown in Diagram 1, can also provide a more comprehensive view, using STAR for discovery and Salmon for high-confidence quantification. Ultimately, a carefully considered alignment strategy, tailored to the specific biological question and technical constraints, forms the bedrock of a reliable and insightful RNA-seq study.
RNA Sequencing (RNA-Seq) has become the primary method for transcriptome analysis, enabling the large-scale inspection of mRNA levels in living cells and the identification of differentially expressed genes (DEGs) [56]. The STAR (Spliced Transcripts Alignment to a Reference) aligner represents a widely adopted solution for processing RNA-seq data, particularly for large datasets requiring high accuracy [20]. However, like all high-throughput techniques, RNA-Seq findings require independent validation to confirm biological significance, especially when intended to inform drug development or clinical applications.
Quantitative reverse transcription PCR (qRT-PCR) remains the gold standard for gene expression validation due to its superior sensitivity, specificity, and reproducibility [57] [58]. This application note establishes a rigorous framework for using qRT-PCR to confirm RNA-Seq results, with particular emphasis on the critical selection and validation of housekeeping genes (HKGs) for reliable data normalization. Proper validation ensures that observed expression differences reflect true biological changes rather than technical artifacts, thereby strengthening conclusions drawn from transcriptomic studies.
The Critical Importance of Housekeeping Gene Validation
Understanding Housekeeping Genes and Their Pitfalls
Housekeeping genes, sometimes termed "maintenance genes," are constitutively expressed across tissues and conditions to maintain basic cellular functions [59]. In qRT-PCR, they serve as essential internal controls to normalize target gene expression against sample-to-sample variations in RNA quality, concentration, and reverse transcription efficiency [58]. The fundamental assumption is that HKGs demonstrate stable expression regardless of experimental conditions—an assumption that frequently fails in practice.
Many traditionally used HKGs show significant expression variability under different experimental conditions. Glyceraldehyde-3-phosphate dehydrogenase (GAPDH), for instance, participates in numerous cellular processes beyond glycolysis, including apoptosis, transcriptional regulation, and DNA repair [59]. Its expression varies with developmental stage, cell cycle phase, and in response to stimuli including insulin, growth hormone, and oxidative stress [59]. Similarly, β-actin (ACTB) expression can fluctuate widely in response to experimental manipulations [59]. Using such variable genes for normalization can introduce substantial errors, potentially leading to inaccurate conclusions about target gene expression.
Stability Assessment of Candidate Reference Genes
Comprehensive evaluation of HKG stability requires testing candidate genes across all specific experimental conditions and tissues under investigation. As demonstrated in sweet potato studies, proper validation involves analyzing candidate genes across different tissues (e.g., fibrous roots, tuberous roots, stems, and leaves) and using multiple algorithms to assess expression stability [57]. Similar approaches in Vigna mungo across 17 developmental stages and 4 abiotic stress conditions identified optimal reference gene combinations for each context [58].
Table 1: Most Stable Housekeeping Genes Across Different Plant Species
| Species | Experimental Conditions | Most Stable HKGs | Validation Method | Citation |
|---|---|---|---|---|
| Sweet potato (Ipomoea batatas) | Multiple tissues (roots, stems, leaves) | IbACT, IbARF, IbCYC | RefFinder (geNorm, NormFinder, BestKeeper, ΔCt) | [57] |
| Vigna mungo (Blackgram) | 17 developmental stages, 4 abiotic stresses | RPS34, RHA (development)ACT2, RPS34 (stress) | RefFinder | [58] |
Experimental Framework for HKG Selection and qRT-PCR Validation
Protocol for Systematic Housekeeping Gene Validation
Step 1: Select Candidate Reference Genes Begin by identifying 8-10 candidate reference genes from literature and genomic resources. Include both traditional HKGs (e.g., GAPDH, ACTB, 18S rRNA) and newer candidates specific to your study system. For sweet potato research, this included both previously validated genes (IbCYC, IbARF, IbTUB, IbUBI, IbCOX, IbEF1α) and commonly used plant reference genes (IbPLD, IbACT, IbRPL, IbGAP) [57].
Step 2: Design Primer Sets
- Design primers with amplicons of 80-150 bp
- Verify specificity using BLAST against the appropriate genome
- Ensure primer efficiency between 90-110%
- Include at least one intron-spanning primer pair to detect genomic DNA contamination
Step 3: RNA Extraction and cDNA Synthesis
- Use high-quality RNA with RIN (RNA Integrity Number) >7.0
- Include DNase treatment to remove genomic DNA
- Use consistent amounts of RNA for all reverse transcription reactions
- Use the same reverse transcriptase and reaction conditions for all samples
Step 4: qRT-PCR Run
- Perform technical triplicates for each biological sample
- Include no-template controls for each primer pair
- Use consistent cycling conditions across all runs
- Determine Cq (quantification cycle) values using the exponential phase of amplification
Step 5: Stability Analysis with Multiple Algorithms
- Analyze results using geNorm, NormFinder, BestKeeper, and comparative ΔCt methods [57] [58]
- Calculate comprehensive stability rankings using RefFinder [57]
- Select the 2-3 most stable genes for normalization
Step 6: Validate Selected HKGs
- Confirm stability of selected genes across your specific experimental conditions
- Verify that expression levels are similar to your target genes
- Use at least two HKGs for more reliable normalization [59]
Integration with STAR RNA-Seq Workflow
The validation framework integrates systematically with STAR-based RNA-Seq analysis. After processing raw FASTQ files through quality control, trimming, and STAR alignment, researchers identify candidate DEGs [20] [8]. These candidates then undergo confirmation using the qRT-PCR validation framework described herein.
Table 2: Research Reagent Solutions for qRT-PCR Validation
| Reagent/Category | Specific Examples | Function/Purpose | Considerations |
|---|---|---|---|
| RNA Extraction | TRIzol, column-based kits | High-quality RNA isolation | Ensure RIN >7.0; DNase treatment essential |
| Reverse Transcriptase | M-MLV, AMV | cDNA synthesis from RNA | Use consistent enzyme across all samples |
| qPCR Master Mix | SYBR Green, TaqMan | Fluorescent detection | SYBR Green requires specificity validation |
| Reference Genes | Species-specific stable HKGs | Data normalization | Require experimental validation; use ≥2 genes |
| Primers | Intron-spanning designs | Target amplification | Verify specificity; efficiency 90-110% |
qRT-PCR Data Analysis and Interpretation
Calculating PCR Efficiency
PCR efficiency dramatically affects quantification cycle (Cq) values and subsequent conclusions. Calculate efficiency using a standard curve from serial dilutions (e.g., 1:10, 1:100, 1:1000, 1:10000) of a pooled cDNA sample [60].
Procedure:
- Prepare at least four serial dilutions of your template
- Run qPCR in technical triplicates for each dilution
- Plot average Cq values against log₁₀(dilution factor)
- Calculate slope from the linear regression
- Determine efficiency using: Efficiency (%) = (10^(-1/slope) - 1) × 100
Acceptable efficiency ranges from 85-110%. Values outside this range require troubleshooting primer design or reaction conditions [60].
Relative Quantification Methods
For most validation studies, relative quantification suffices to compare gene expression between experimental conditions. Two primary methods exist:
Livak Method (2^(-ΔΔCt)):
- Assumes PCR efficiencies of target and reference genes are approximately equal (90-100%)
- Calculate ΔCt = Ct(target) - Ct(reference) for each sample
- Calculate ΔΔCt = ΔCt(treated) - ΔCt(control)
- Fold change = 2^(-ΔΔCt)
Pfaffl Method:
- Accounts for different amplification efficiencies between target and reference genes
- Uses efficiency-corrected calculation
- More accurate when efficiency differences exist
Application Example: Validating RNA-Seq Results
Case Study: Confirming Differential Expression in Stress Response
Consider a STAR-based RNA-Seq experiment identifying 150 differentially expressed genes in sweet potato under drought stress. To validate these findings:
- Select Candidate Genes: Choose 10-15 DEGs with varying fold-changes and expression levels
- Validate HKGs: Identify the most stable reference genes (e.g., IbACT, IbARF) under drought conditions using the protocol in Section 3.1
- Perform qRT-PCR: Analyze expression of target genes using validated HKGs for normalization
- Correlate Results: Compare RNA-Seq and qRT-PCR fold-change values
Successful validation typically shows strong correlation (R² > 0.80) between RNA-Seq and qRT-PCR results, confirming the technical and biological validity of the transcriptomic findings.
Robust validation of RNA-Seq results through qRT-PCR requires meticulous attention to housekeeping gene selection and experimental design. The framework presented herein—incorporating multi-algorithm stability assessment, proper efficiency calculations, and appropriate quantification methods—ensures reliable confirmation of transcriptomic findings. By implementing these protocols, researchers can confidently translate STAR-based RNA-Seq discoveries into validated biological insights with enhanced reproducibility, particularly crucial for drug development and clinical applications.
Adherence to this validation framework strengthens the reliability of gene expression studies, prevents misinterpretation due to improper normalization, and ultimately advances the rigor of transcriptomic research.
Contextualizing STAR's Role in the Broader RNA-seq Analysis Pipeline
RNA sequencing (RNA-seq) has become a fundamental tool in transcriptomics, enabling researchers to probe gene expression, alternative splicing, fusion genes, and novel transcripts at a single nucleotide resolution. A critical foundational step in this process is the alignment (mapping) of millions of high-throughput sequencing reads to a reference genome. This step is crucial for gene discovery, gene quantification, splice variant analysis, and variant calling [34] [61]. Unlike DNA-seq alignment, RNA-seq read mapping presents unique challenges due to RNA splicing, where sequences are derived from non-contiguous genomic regions [25]. The Spliced Transcripts Alignment to a Reference (STAR) software package is a highly accurate and ultra-fast splice-aware aligner specifically designed to address these challenges, making it a recommended and widely used tool in RNA-seq data analysis [34] [4].
STAR's algorithm allows it to detect both annotated and novel splice junctions, as well as more complex RNA sequence arrangements like chimeric and circular RNA [25]. Its high precision in identifying canonical and non-canonical splice junctions, combined with its superior mapping speed compared to other aligners like TopHat2, has established STAR as a cornerstone in modern RNA-seq workflows, including those recommended by the GATK best practices for variant identification [34].
Methodological Protocols for STAR Alignment
Computational Requirements and Installation
STAR is an Open Source software that can be run on Unix, Linux, or Mac OS X systems. A key consideration for using STAR is its computational intensity, particularly regarding memory (RAM). It is recommended to have at least 10 x GenomeSize bytes of RAM; for a human genome (~3 GigaBases), this translates to ~30 GigaBytes, with 32 GB often recommended [34] [25]. Sufficient disk space (over 100 GB) is also required for storing output files. The alignment speed benefits significantly from multiple execution threads (cores), with the --runThreadN parameter typically set to the number of available physical cores [25].
Installation can be performed by downloading pre-compiled binaries or compiling from the source code available on GitHub [34].
A Two-Step Alignment Workflow
The process of mapping reads with STAR involves two primary steps: building a reference genome index and then mapping the reads to the indexed genome [34].
Building Genome Indices
Creating a genome index is a prerequisite for the alignment step. This process requires a reference genome file in FASTA format and, highly recommended, a gene annotation file in GTF or GFF3 format. The annotation file provides known splice junction information, which greatly improves mapping accuracy [34] [25].
Table 1: Key Parameters for Building STAR Genome Indices
| Parameter | Description |
|---|---|
--runThreadN |
Number of threads (processors) for the computation. |
--runMode genomeGenerate |
Specifies the mode for building genome indices. |
--genomeDir |
Path to the directory where genome indices will be stored. |
--genomeFastaFiles |
Reference genome file(s) in FASTA format. |
--sjdbGTFfile |
Gene annotation file in GTF or GFF3 format. |
--sjdbOverhang |
Length of the genomic sequence around the annotated splice junction. Ideally, this should be read length minus 1 [34] [4]. |
The following command provides a protocol for building a genome index using Arabidopsis thaliana data:
If using a GFF3 annotation file, an additional parameter, --sjdbGTFtagExonParentTranscript Parent, is required to define the parent-child relationship [34].
Mapping Reads to the Genome
Once the genome indices are created, single-end or paired-end RNA-seq reads can be mapped. STAR's default is a 1-pass mapping, which is sufficient for many applications [34].
Table 2: Key Parameters for Mapping Reads with STAR
| Parameter | Description |
|---|---|
--readFilesIn |
Path to the FASTQ file(s). For paired-end reads, provide read1 and read2 files. |
--genomeDir |
Path to the directory containing the built genome indices. |
--outSAMtype |
Specifies the output format. BAM SortedByCoordinate is useful for downstream analyses. |
--outFileNamePrefix |
Prefix for all output files. |
--readFilesCommand |
Command to read compressed files, e.g., zcat for *.gz files. |
For paired-end reads, the mapping command is as follows:
For studies aiming to identify novel splice junctions with high sensitivity, such as in differential splicing analysis, a 2-pass mapping strategy is recommended. This involves re-building the genome indices using the splice junctions detected from an initial 1-pass mapping, thereby incorporating novel junctions into the final mapping step for improved accuracy [34].
The following diagram illustrates the complete RNA-seq analysis workflow with STAR alignment as a central component:
STAR's Algorithmic Strategy and Output Interpretation
Core Alignment Algorithm
STAR employs a novel two-step strategy that accounts for spliced alignments and contributes to its high speed and accuracy [4].
- Seed Searching: For each read, STAR searches for the longest sequence that exactly matches one or more locations on the reference genome, known as the Maximal Mappable Prefix (MMP). The unmapped portion of the read is then searched for the next MMP. This sequential searching of unmapped portions is a key efficiency factor. STAR uses an uncompressed suffix array (SA) to facilitate rapid searching against large genomes [4].
- Clustering, Stitching, and Scoring: The separate seeds (MMPs) are stitched together to form a complete read. This is done by first clustering seeds based on proximity to non-multi-mapping "anchor" seeds. The seeds are then stitched together based on the best alignment score for the read, considering mismatches, indels, and gaps [4].
The following diagram illustrates this two-step mapping process:
Output Files and Quality Control Metrics
After successful mapping, STAR generates several output files essential for downstream analysis and quality control (QC) [34] [62].
Table 3: Principal Output Files from STAR Alignment
| Output File | Description |
|---|---|
Log.final.out |
A summary file containing vital mapping statistics. This is a key file for quality control. |
Aligned.sortedByCoord.out.bam |
The alignments in BAM format, sorted by coordinate. This is the primary input for many downstream tools. |
Log.progress.out |
A periodically updated log file reporting job progress statistics, useful for monitoring long runs. |
SJ.out.tab |
A file containing high-confidence collapsed splice junctions detected from the alignment. |
ReadsPerGene.out.tab |
Read counts per gene, which can be used for differential expression analysis. |
The Log.final.out file is particularly important for assessing the quality of the RNA-seq experiment. It provides a comprehensive summary, including:
- Number of input reads: The total number of reads processed.
- Uniquely mapped reads %: The percentage of reads that mapped to a unique location in the genome. A high percentage (e.g., >80-90%) is typically desirable and indicates low contamination or ambiguity [34].
- % of reads mapped to multiple loci: Reads that align to multiple locations.
- % of reads unmapped: Reads that could not be aligned.
- Mismatch rate per base: The average rate of mismatches per base, which can indicate sequencing error or genetic variation.
- Number of splices: Breakdown of total, annotated, and novel splices, including splice junction types (e.g., GT/AG, GC/AG, AT/AC) [34].
Other critical RNA-seq metrics that can be derived from STAR outputs or complementary analyses include the mapping rate (percentage of reads mapped to the reference), the percentage of residual ribosomal RNA (rRNA) reads (indicative of the effectiveness of rRNA depletion or poly-A selection), and the number of genes detected, which reflects library complexity [63].
Comparative Analysis and Integration in Broader Pipelines
STAR in Comparison to Other Aligners
STAR holds a distinct position among RNA-seq aligners. Benchmarks and comparative analyses have shown that STAR has a better overall mapping rate compared to other splice-aware aligners like HISAT2 and TopHat2, and is significantly faster than TopHat2 [34] [64]. Its primary drawback is that it is memory (RAM) intensive, requiring high-end computers for analyses, particularly for large mammalian genomes [34]. In contrast, aligners like Bowtie and BWA, while fast, are not splice-aware and struggle with RNA-seq data due to splicing, making them unsuitable for standalone RNA-seq alignment [64].
Table 4: Comparison of RNA-seq Alignment Tools
| Aligner | Key Features | Considerations |
|---|---|---|
| STAR | Ultra-fast, splice-aware, detects novel junctions & chimeric RNA. | High memory usage. |
| HISAT2 | Fast, splice-aware, low memory footprint. Part of the updated Tuxedo suite. | May have lower mapping rates compared to STAR [34] [62]. |
| TopHat2 | One of the first widely used splice-aware aligners. | Slower than STAR and HISAT2 [34] [64]. |
| RUM | Combines genome and transcriptome alignment for high accuracy. | Complex pipeline; slower than STAR [64]. |
| GSNAP | Robust to polymorphisms and sequencing errors. | |
| BLAT | Sensitive for mapping across junctions; can be used in pipelines like RUM. | Slow for tens of millions of reads without modification [64]. |
Downstream Analyses in the RNA-seq Workflow
The aligned BAM files generated by STAR serve as the foundation for a wide array of downstream biological analyses. Key subsequent steps include:
- Transcript Assembly and Quantification: Tools like StringTie use the coordinate-sorted BAM file to assemble transcripts and quantify their abundance in Fragments Per Kilobase of transcript per Million mapped reads (FPKM) or Transcripts Per Million (TPM) [62].
- Differential Expression Analysis: Read counts per gene (from STAR's
ReadsPerGene.out.tabor tools like featureCounts) are used as input for packages like DESeq2, edgeR, or Ballgown to identify statistically significant changes in gene expression between conditions [61] [62]. - Variant Calling: STAR's alignments can be used in specialized pipelines, such as the GATK best practices for RNA-seq, to identify single nucleotide polymorphisms (SNPs) and insertions/deletions (INDELs) [34].
- Detection of Complex Events: STAR's inherent capabilities allow for the detection of novel splice junctions, chimeric (fusion) transcripts, and circular RNAs, which are crucial for studies in cancer and genetic diseases [25] [65].
- Visualization: The sorted BAM files can be loaded into genome browsers like IGV for visual inspection of alignment quality and specific gene loci.
Advanced Applications and Protocol Variations
Specialized Applications in Biomedical Research
STAR's accuracy and feature set make it suitable for advanced and specialized applications in biomedical research and drug development. In cancer genomics, integrated DNA/RNA pipelines like the nf-core/oncoanalyser use STAR as the dedicated aligner for RNA reads to facilitate transcript analysis, fusion gene detection, neoantigen prediction, and mutational signature analysis [65]. Furthermore, STAR's ability to handle long reads (several Kbp from platforms like PacBio) ensures its scalability and relevance for emerging sequencing technologies [34] [25].
Essential Research Reagent and Computational Toolkit
Table 5: Essential Research Reagent and Computational Toolkit for STAR RNA-seq Analysis
| Item | Function |
|---|---|
| Reference Genome (FASTA) | The genomic sequence for the target organism against which reads are aligned. |
| Gene Annotation (GTF/GFF3) | Provides coordinates of known genes and transcripts, greatly improving splice junction detection. |
| High-Performance Computer (HPC) | A Linux/Unix server with substantial RAM (≥32 GB for human) and multiple cores for efficient computation. |
| STAR Aligner Software | The splice-aware aligner software itself. |
| RNA-seq Reads (FASTQ) | The raw input data from the sequencer, which can be single-end or paired-end. |
| Sequence Read Archive (SRA) | A public repository (e.g., NCBI SRA) to access datasets for method validation and comparison. |
| Downstream Analysis Tools (e.g., StringTie, DESeq2) | Software packages that use STAR's BAM output for biological interpretation. |
Conclusion
The STAR aligner represents a powerful, precision-focused solution for RNA-seq read alignment, particularly valued for its accuracy in handling spliced transcripts and generating data suitable for sophisticated downstream expression analysis. Mastering its two-step process—from genome indexing to read alignment—and understanding its computational demands are fundamental for generating reliable results. As RNA-seq applications continue to expand in drug development and clinical research, robust and well-optimized alignment with STAR provides the critical foundation upon which all subsequent biological interpretations are built. Future directions will likely involve deeper integration with cloud-based workflows, enhanced scalability for single-cell RNA-seq, and continued algorithm refinements to keep pace with evolving sequencing technologies, further solidifying its role in the functional genomics toolkit.
References
- 1. Transcriptomics / RNA-seq Alignment with STAR / Hands-on [https://training.galaxyproject.org/training-material/topics/transcriptomics/tutorials/rna-seq-bash-star-align/tutorial.html]
- 2. STAR: ultrafast universal RNA-seq aligner - PubMed Central [https://pmc.ncbi.nlm.nih.gov/articles/PMC3530905/]
- 3. Comparison of RNA Sequencing Data Alignment ... [https://pmc.ncbi.nlm.nih.gov/articles/PMC6617288/]
- 4. Alignment with STAR | Introduction to RNA-Seq using high ... [https://hbctraining.github.io/Intro-to-rnaseq-hpc-O2/lessons/03_alignment.html]
- 5. Optimizing RNA-Seq Mapping with STAR [https://www.rna-seqblog.com/optimizing-rna-seq-mapping-with-star/]
- 6. Kallisto vs. STAR: Alignment and Quantification of Bulk ... [https://www.elucidata.io/blog/kallisto-vs-star-alignment-and-quantification-of-bulk-rna-seq-data]
- 7. sudden change in STAR alignment of RNA-seq data [https://help.galaxyproject.org/t/sudden-change-in-star-alignment-of-rna-seq-data/13703]
- 8. A comprehensive workflow for optimizing RNA-seq data analysis [https://bmcgenomics.biomedcentral.com/articles/10.1186/s12864-024-10414-y]
- 9. STAR: ultrafast universal RNA-seq aligner - PubMed [https://pubmed.ncbi.nlm.nih.gov/23104886/]
- 10. Comparison of Short-Read Sequence Aligners Indicates ... [https://www.frontiersin.org/journals/plant-science/articles/10.3389/fpls.2021.657240/full]
- 11. Alignment of RNA Seq data with STAR [https://research.stowers.org/cws/CompGenomics/Projects/star.html]
- 12. [Tutorial] Bulk RNA-seq DE analysis [https://informatics.fas.harvard.edu/resources/tutorials/differential-expression-analysis/]
- 13. Splice aware aligner - what does it mean? [https://www.biostars.org/p/175454/]
- 14. RNA-Seq STAR - OmicsBox User Manual [https://docs.omicsbox.biobam.com/latest/RNA-Seq-STAR/]
- 15. oicr-gsi/star: Workflow for STAR RNAseq aligner [https://github.com/oicr-gsi/star]
- 16. alexdobin/STAR: RNA-seq aligner [https://github.com/alexdobin/STAR]
- 17. Reference-based RNAseq data analysis (long) [https://training.galaxyproject.org/training-material/topics/transcriptomics/tutorials/rb-rnaseq/tutorial.html]
- 18. RNA alignment not detecting indels - transcriptomics [https://help.galaxyproject.org/t/rna-alignment-not-detecting-indels/12646]
- 19. Hardware requirements for bowtie2/STAR RNA-seq ... [https://www.biostars.org/p/482847/]
- 20. Performance Analysis and Optimization of the STAR ... [https://arxiv.org/html/2506.12611v1]
- 21. [Tutorial] Genome annotation [https://informatics.fas.harvard.edu/resources/tutorials/how-to-annotate-a-genome/]
- 22. The Principles and Applications of High-Throughput ... [https://pmc.ncbi.nlm.nih.gov/articles/PMC10703097/]
- 23. Star Aligner Manual: Your Guide to Perfect Alignment [https://san1tar1um.com/star-aligner-manual/]
- 24. A Quick Start Guide to RNA-Seq Data Analysis [https://blog.genewiz.com/a-quick-start-guide-to-rna-seq-data-analysis]
- 25. Mapping RNA-seq Reads with STAR - PMC [https://pmc.ncbi.nlm.nih.gov/articles/PMC4631051/]
- 26. What are the best set of options to use while aligning ... [https://www.biostars.org/p/384844/]
- 27. RNA-Seq Expression Classification - St. Jude Cloud Docs [https://docs.stjude.cloud/genomics-platform/workflow-guides/rnaseq-expression-classification]
- 28. A comprehensive workflow for optimizing RNA-seq data analysis [https://pmc.ncbi.nlm.nih.gov/articles/PMC11197194/]
- 29. Top High Throughput Screening Software for Labs | Trends [https://www.scispot.com/blog/top-high-throughput-screening-software-for-labs]
- 30. 9+ Best High Throughput Screening Software Tools [https://ddg.wcroc.umn.edu/high-throughput-screening-software/]
- 31. RNA-Seq Analysis with STAR [https://www.rna-seqblog.com/rna-seq-analysis-with-star/]
- 32. Enhancing transcriptome expression quantification through ... [https://pmc.ncbi.nlm.nih.gov/articles/PMC12392579/]
- 33. Variant calling from RNA-Seq data reveals allele-specific ... [https://www.nature.com/articles/s43856-025-00901-y]
- 34. Mastering RNA - seq Read Alignment With STAR [https://www.reneshbedre.com/blog/star-aligner.html]
- 35. Synthetic spike-in standards for RNA-seq experiments - PMC [https://pmc.ncbi.nlm.nih.gov/articles/PMC3166838/]
- 36. How to improve STAR alignment parameters? [https://www.lifescienceshub.ai/guides/how-to-improve-star-alignment-parameters-step-by-step-guide]
- 37. STAR mapping parameters · Issue #460 · alexdobin/STAR [https://github.com/alexdobin/STAR/issues/460]
- 38. Getting started with STAR and single-ended reads [https://groups.google.com/g/rna-star/c/5mazzwVEoJ4]
- 39. A survey of best practices for RNA-seq data analysis [https://genomebiology.biomedcentral.com/articles/10.1186/s13059-016-0881-8]
- 40. STAR Aligner Metrics | WARP - Broad Institute [https://broadinstitute.github.io/warp/docs/Pipelines/Optimus_Pipeline/starsolo-metrics]
- 41. Commentary: a review of technical considerations for planning ... [https://bmcgenomics.biomedcentral.com/articles/10.1186/s12864-025-12094-8]
- 42. a practical guide to RNA sequencing data analysis [https://pmc.ncbi.nlm.nih.gov/articles/PMC12599993/]
- 43. Development of an End-to-End Total RNA Sequencing ... [https://www.sciencedirect.com/science/article/abs/pii/S1525157825001436]
- 44. Serverless Approach to Running Resource-Intensive STAR ... [https://arxiv.org/html/2504.05078v1]
- 45. Confused about sjdbOverhang [https://groups.google.com/g/rna-star/c/h9oh10UlvhI/m/BfSPGivUHmsJ]
- 46. Sjdboverhang Option In Star [https://www.biostars.org/p/93883/]
- 47. Mapping with STAR [https://biocorecrg.github.io/RNAseq_course_2019/alnpractical.html]
- 48. Size for sjdbOverhang for multiple read length datasets #931 [https://github.com/alexdobin/STAR/issues/931]
- 49. Benchmarking of RNA-sequencing analysis workflows ... [https://www.nature.com/articles/s41598-017-01617-3]
- 50. Systematic assessment of long-read RNA-seq methods for ... [https://www.nature.com/articles/s41592-024-02298-3]
- 51. EASTR: Identifying and eliminating systematic alignment ... [https://www.nature.com/articles/s41467-023-43017-4]
- 52. STAR, HISAT2, BWA for RNA or DNA Sequencing [https://www.linkedin.com/posts/bulut-hamali_bioinformatics-ngs-genomics-activity-7348357499135107073-0_ja]
- 53. Salmon 1.10.2 documentation [https://salmon.readthedocs.io/en/latest/salmon.html]
- 54. Speed Comparison of Alignment Algorithms [https://www.quickbiology.com/news/benchmarking-study-speed-comparison-alignment-algorithms.html]
- 55. A real-world multi-center RNA-seq benchmarking study ... [https://www.nature.com/articles/s41467-024-50420-y]
- 56. A Guide to Basic RNA Sequencing Data Processing and ... [https://pmc.ncbi.nlm.nih.gov/articles/PMC12067304/]
- 57. Evaluation and validation of reference genes for RT-qPCR ... [https://www.nature.com/articles/s41598-025-22650-7]
- 58. Identification of best housekeeping gene for normalization ... [https://pubmed.ncbi.nlm.nih.gov/41006375/]
- 59. Selecting Optimal Housekeeping Genes for RT-qPCR in ... [https://www.mdpi.com/1422-0067/26/17/8610]
- 60. How To Interpret RT-qPCR Results [https://www.goldbio.com/blogs/articles/how-to-interpret-rt-qpcr-results?srsltid=AfmBOor8BjfXtDAriNGFdN-H1SrJ4317SbPk7NY6U9BzHRysxlpe6eO9]
- 61. A Beginner's Guide to Analysis of RNA Sequencing Data [https://pmc.ncbi.nlm.nih.gov/articles/PMC6096346/]
- 62. - RNA Tutorial- seq , StringTie and DESeq2* - 1 Learning... STAR [https://cyverse.atlassian.net/wiki/spaces/TUT/pages/258736307/RNA-seq+Tutorial-+STAR+StringTie+and+DESeq2]
- 63. Essential RNA-seq Metrics: Part 1 [https://www.rna-seqblog.com/essential-rna-seq-metrics-part-1/]
- 64. Comparative analysis of RNA-Seq alignment algorithms ... [https://pmc.ncbi.nlm.nih.gov/articles/PMC3167048/]
- 65. oncoanalyser: Output [https://nf-co.re/oncoanalyser/latest/docs/output/]