A Researcher's Guide to Validating RNA-Seq Results with qPCR: Strategies, Protocols, and Best Practices
This article provides a comprehensive framework for researchers and drug development professionals to design and execute robust validation of RNA-Seq data using qPCR.
A Researcher's Guide to Validating RNA-Seq Results with qPCR: Strategies, Protocols, and Best Practices
Abstract
This article provides a comprehensive framework for researchers and drug development professionals to design and execute robust validation of RNA-Seq data using qPCR. It covers the foundational principles explaining when and why validation is critical, detailed methodological protocols for reference gene selection and assay optimization, strategies for troubleshooting common pitfalls, and a systematic approach for comparative analysis between the two technologies. By synthesizing current methodologies and software tools, this guide aims to enhance the reliability and reproducibility of gene expression studies in biomedical and clinical research.
The Why and When: Establishing the Need for RNA-Seq Validation with qPCR
Table of Contents
- Introduction to the Technologies
- Quantifying the Concordance: A Data-Driven Perspective
- Experimental Protocols for Method Comparison
- Factors Influencing Concordance and Discordance
- A Practical Guide for Validation Experiments
- The Scientist's Toolkit: Essential Reagents and Solutions
In the field of transcriptomics, RNA sequencing (RNA-seq) and quantitative polymerase chain reaction (qPCR) are foundational techniques for gene expression analysis. RNA-seq provides an unbiased, genome-wide view of the transcriptome, enabling the discovery of novel transcripts and the quantification of known genes across a wide dynamic range [1] [2]. In contrast, qPCR is a targeted, highly sensitive method used to precisely measure the abundance of a select number of pre-defined genes, and it is often considered the gold standard for gene expression validation due to its maturity and well-understood workflow [3] [4]. The central question this guide addresses is: when these two powerful techniques are used to measure the same biological phenomenon, how closely do their results agree? Understanding the degree and drivers of this concordance is critical for researchers, scientists, and drug development professionals who rely on these data for making scientific conclusions and clinical decisions.
Quantifying the Concordance: A Data-Driven Perspective
Overall, numerous independent studies report a strong correlation between gene expression measurements obtained from RNA-seq and qPCR. However, the concordance is not perfect, and the level of agreement can be significantly influenced by the specific bioinformatic tools used and the characteristics of the genes being studied.
The table below summarizes key performance metrics from several benchmarking studies that compared various RNA-seq analysis workflows against qPCR.
Table 1: Performance Metrics of RNA-seq Analysis Workflows vs. qPCR
| Metric / Study | Everaert et al. (as cited in [3]) | Soneson et al. [5] | Kumar et al. [1] |
|---|---|---|---|
| General Concordance | ~80-85% of genes show concordant differential expression (DE) status. | High fold-change correlation (Pearson R² ~0.93) across 5 workflows. | Varies significantly with the DEG tool. |
| Non-Concordant Genes | ~15-20% of genes show non-concordant DE; ~1.8% are severely non-concordant (fold change >2). | 15.1% (Tophat-HTSeq) to 19.4% (Salmon) of genes non-concordant. | High false-positive rate for Cuffdiff2; high false-negative rates for DESeq2 and TSPM. |
| Characteristics of Discordant Genes | Typically lower expressed and shorter. | Smaller, fewer exons, and lower expressed. | Not specified. |
| Tool Performance | Not the primary focus. | All five workflows showed highly similar performance. | edgeR showed the best balance: 76.67% sensitivity, 90.91% specificity. |
These findings highlight that while overall agreement is high, a small but consistent subset of genes may yield discrepant results. The following diagram illustrates the primary factors that lead to this discordance.
Factors Leading to Discordance Between RNA-seq and qPCR
Experimental Protocols for Method Comparison
To objectively benchmark RNA-seq results against qPCR, a rigorous and standardized experimental approach is required. The following workflow, derived from established validation studies, outlines the key steps.
Table 2: Key Steps for a Robust RNA-seq and qPCR Comparison Study
| Phase | Step | Description & Rationale |
|---|---|---|
| 1. Experimental Design | Biological Replication | Use a sufficient number of biological replicates (not technical) to capture true biological variation. This is critical for statistical power [1] [4]. |
| Sample Selection | Ideally, use independent biological samples for the RNA-seq and qPCR validation to confirm both the technology and the underlying biology [4]. | |
| 2. RNA-seq Wet Lab | RNA Extraction & QC | Extract high-quality, DNA-free RNA. Assess integrity (e.g., RIN score >9) and quantity using spectrophotometry or bioanalyzer [6]. |
| Library Preparation & Sequencing | Use a standardized, high-throughput protocol (e.g., Illumina). Be aware that different library prep kits can introduce bias [2]. | |
| 3. RNA-seq Dry Lab | Read Alignment & Quantification | Process raw reads (FASTQ) using a benchmarked workflow. Common choices include STAR-HTSeq (alignment-based) or Kallisto/Salmon (pseudoalignment) [5]. |
| Differential Expression Analysis | Apply statistical models (e.g., from edgeR, DESeq2) to identify differentially expressed genes (DEGs), using an adjusted p-value (e.g., FDR < 0.05) and a minimum fold-change threshold [1]. | |
| 4. qPCR Wet Lab | Gene Selection | Select ~10-20 genes for validation. Include a mix of significantly up-/down-regulated DEGs, genes with varying expression levels and fold-changes, and genes relevant to the study's hypothesis [7]. |
| Reverse Transcription & qPCR | Use the same RNA samples (or independent ones) for cDNA synthesis. Perform qPCR in technical replicates using optimized, efficient primers. Adhere to MIQE guidelines [3] [6]. | |
| Reference Gene Validation | Use a robust statistical approach (e.g., NormFinder) to select stable reference genes from a panel of candidates for reliable normalization. Do not assume stability [6]. | |
| 5. Data Comparison | Correlation Analysis | Calculate the Pearson correlation coefficient between the log₂ fold changes obtained from RNA-seq and qPCR. A correlation of ≥0.7 is generally considered good agreement [7]. |
| Concordance Assessment | Classify genes based on their differential expression status in both methods to determine the percentage of concordant and non-concordant genes, as shown in Table 1 [5]. |
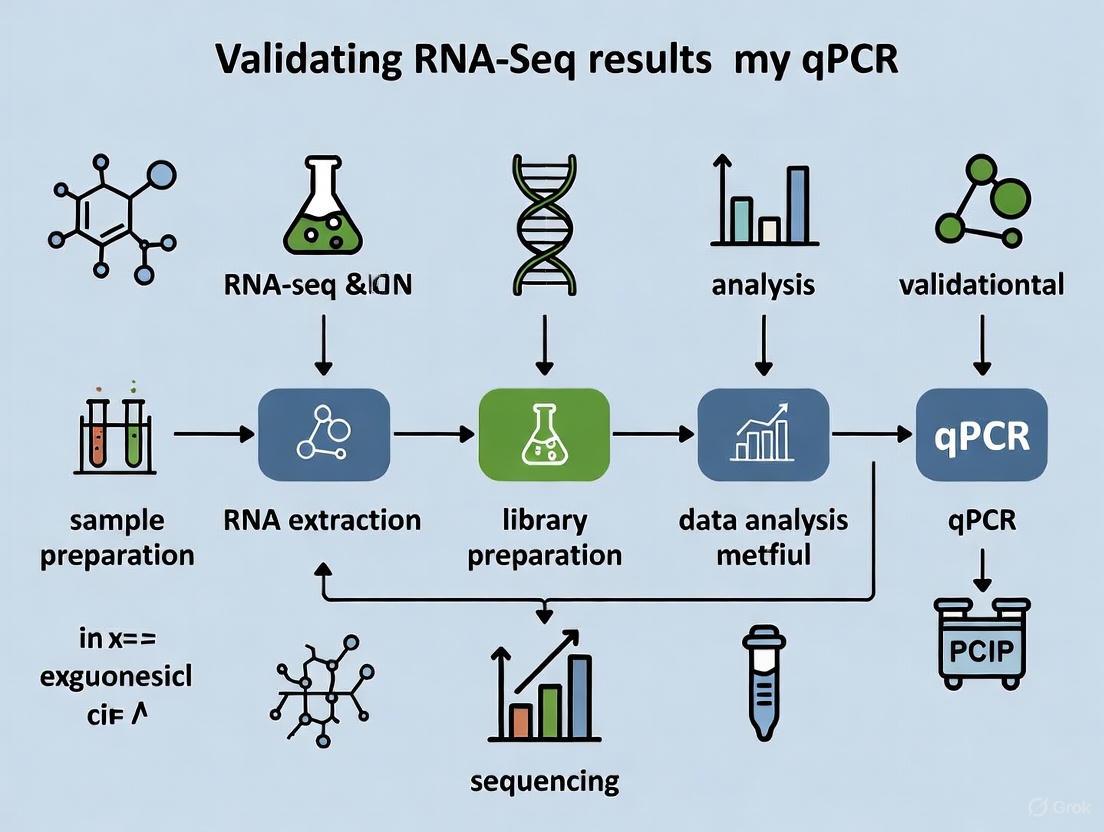
The entire workflow, from sample preparation to data interpretation, is summarized in the following diagram.
Experimental Workflow for RNA-seq and qPCR Comparison
Factors Influencing Concordance and Discordance
As indicated by the data in Table 1, concordance is not universal. Key factors that influence agreement include:
Bioinformatic Tools: The choice of software for differential expression analysis can dramatically impact the results. One study found that the false-positivity rate of Cuffdiff2 and false-negativity rates of DESeq2 were high, whereas edgeR demonstrated a more optimal balance of sensitivity (76.67%) and specificity (90.91%) when validated against qPCR [1]. Normalization methods are also critical, especially in experiments with global expression shifts, where standard assumptions can break down [8].
Gene Features: Discrepancies are not random. Genes that are shorter, have fewer exons, and are expressed at low levels are consistently overrepresented among non-concordant results [3] [5]. For these genes, small absolute changes can lead to large, and potentially unreliable, fold-changes in RNA-seq data.
Complex Loci: Genes with high sequence similarity, such as those in the Human Leukocyte Antigen (HLA) family, present a particular challenge. Standard RNA-seq alignment methods struggle with their extreme polymorphism, leading to mapping errors. While specialized pipelines have been developed, a 2023 study still found only a moderate correlation (0.2 ≤ rho ≤ 0.53) between RNA-seq and qPCR for HLA class I genes [9].
Experimental Design: Perhaps the most critical factor is the use of an adequate number of biological replicates. Studies with low replication have low statistical power and are more likely to produce unreliable DEG lists that fail validation. Sample pooling strategies, intended to save costs, have been shown to introduce pooling bias and suffer from very low positive predictive value, making them a poor substitute for increasing biological replication [1].
A Practical Guide for Validation Experiments
The question of whether qPCR validation is necessary does not have a universal answer. The following guidance, synthesized from the literature, helps determine the best path for your research.
qPCR Validation is Recommended When:
- The core biological conclusion of a study rests on the expression changes of only a few key genes [3] [4].
- The RNA-seq experiment was conducted with a small number of biological replicates, limiting statistical power [4].
- You need to confirm findings in an independent cohort of samples, thus validating both the technical result and the broader biological relevance [10] [4].
- You are studying genes known to be problematic, such as low-expressed, short, or highly polymorphic genes [3] [9].
qPCR Validation May Be Unnecessary When:
- The RNA-seq data is of high quality, based on a sufficient number of biological replicates, and has been processed with a robust, modern analysis pipeline [3] [10].
- The RNA-seq results are used as a hypothesis-generating screen that will be followed up with functional studies (e.g., at the protein level) [4].
- The chosen validation path is to perform a second, independent RNA-seq experiment on a new set of samples to confirm reproducibility [4].
The Scientist's Toolkit: Essential Reagents and Solutions
The following table lists key reagents and materials required for conducting the experiments described in this guide.
Table 3: Research Reagent Solutions for RNA-seq and qPCR Studies
| Reagent / Material | Function | Key Considerations |
|---|---|---|
| RNA Extraction Kit | Isolate high-quality, intact total RNA from biological samples. | Select kits optimized for your sample type (e.g., tissue, cells). Must include a DNase step to remove genomic DNA contamination [6]. |
| RNA Integrity Number (RIN) Analyzer | Assess the quality and degradation level of RNA samples. | A RIN score of ≥9 is generally required for reliable RNA-seq and qPCR results [6]. |
| RNA-seq Library Prep Kit | Prepare sequencing libraries from RNA by converting it to cDNA, fragmenting, and adding platform-specific adapters. | Different kits (e.g., Illumina TruSeq) have varying performance; be consistent within a study. Be aware of biases in amplification and fragmentation [2]. |
| Reverse Transcription Kit | Synthesize complementary DNA (cDNA) from RNA templates for qPCR. | Use a consistent protocol and the same amount of input RNA across samples to ensure comparability. |
| qPCR Master Mix | Provides the enzymes, nucleotides, and buffer necessary for the PCR amplification and fluorescence detection. | Use a reagent compatible with your detection chemistry (e.g., SYBR Green or TaqMan). Verify primer amplification efficiency [6]. |
| Validated qPCR Primers | Specifically amplify the target and reference genes. | Primers must be designed to be highly specific and efficient. Amplicons should be relatively small (80-150 bp). Sequences should be provided in publications [6]. |
| Stable Reference Genes | Used for normalization of qPCR data to account for technical variation. | Critical: Genes must be empirically validated for stability under your specific experimental conditions (e.g., using NormFinder or GeNorm). Do not rely on presumed "housekeeping" genes [6]. |
In the evolving landscape of molecular biology, RNA sequencing (RNA-Seq) has become the cornerstone for comprehensive transcriptome analysis, enabling genome-wide quantification of RNA abundance with extensive coverage and fine resolution [11]. However, this powerful technology generates discoveries that require confirmation through independent methods. Reverse transcription quantitative PCR (RT-qPCR) remains the gold standard for validating transcriptional biomarkers due to its superior sensitivity, reproducibility, and cost-effectiveness [12]. The reliability of molecular diagnostics and drug development pipelines depends on recognizing when this validation is most critical—particularly when confronting the challenges of low expression levels and small fold changes where technical artifacts and biological variability most severely compromise data interpretation.
This guide objectively compares validation approaches and provides a structured framework for identifying and addressing critical pitfalls in transcriptional biomarker development.
Why RNA-Seq Requires Validation: Technical Limitations and Biases
While RNA-Seq provides unprecedented transcriptional coverage, its workflow introduces multiple potential biases that can distort expression measurements. Understanding these limitations is fundamental to recognizing when validation becomes essential.
Table 1: Key Technical Challenges in RNA-Seq Affecting Expression Accuracy
| Technical Challenge | Impact on Expression Data | Consequences for Low Expression/Small FCs |
|---|---|---|
| Sequencing Depth Variation | Samples with more total reads show artificially higher counts [11] | Small true differences can be masked or exaggerated |
| GC Content Bias | Variable amplification based on nucleotide composition [11] | Particularly affects already low-count genes |
| Ambiguous Read Mapping | Reads mapping to multiple genomic locations inflate counts [11] | False positives for genes with homologous family members |
| PCR Amplification Artifacts | Uneven amplification during library preparation [11] | Introduces noise that overwhelms small biological signals |
| RNA Quality Degradation | 3' bias in degraded samples alters transcript representation [11] | Creates systematic errors across experimental groups |
The multi-step RNA-Seq workflow—from RNA extraction to cDNA conversion, sequencing, and bioinformatic processing—accumulates technical variations that normalization strategies cannot fully eliminate [11]. These issues are particularly problematic for genes with low baseline expression or when expecting subtle transcriptional changes (typically fold changes below 1.5), where the signal-to-noise ratio is inherently unfavorable.
When Validation Becomes Critical: Identifying High-Risk Scenarios
The Challenge of Low Expression Genes
Genes with low transcript abundance pose significant detection challenges in RNA-Seq. With limited sequencing depth, the stochastic sampling of rare transcripts leads to high quantitative variability and unreliable fold-change estimates [11]. The minimal information for publication of quantitative real-time PCR experiments (MIQE) guidelines emphasizes that low-copy targets require rigorous validation due to their susceptibility to technical noise [12]. In diagnostic applications, where liquid biopsies often contain minimal RNA, this becomes particularly crucial for avoiding false positives.
The Perils of Small Fold Changes
Biologically relevant but subtle expression differences (typically below 1.5-fold) frequently occur in physiological responses, early disease states, and pharmacodynamic effects. These small effects hover near the technical variability threshold of RNA-Seq, making them highly susceptible to normalization artifacts and batch effects [11]. Without qPCR confirmation, these findings risk representing statistical noise rather than biological reality. The Pfaffl model for relative quantification specifically addresses this by incorporating target-specific amplification efficiencies, providing more accurate measurements of subtle changes [13].
Complex Experimental Conditions
Studies comparing multiple tissue types, time courses, or treatment conditions introduce additional variability that complicates RNA-Seq analysis. Reference genes stable in one condition may vary significantly in another, as demonstrated in sunflower senescence studies where expression stability differed across leaf ages and treatments [14]. Validation becomes critical when biological variability intersects with technical variability, requiring careful reference gene selection across all experimental conditions.
qPCR Validation Approaches: A Comparative Guide
Multiple mathematical approaches exist for relative quantification in RT-qPCR, each with distinct strengths and limitations for addressing validation challenges.
Table 2: Comparison of Relative Quantification Methods for qPCR Validation
| Method | Key Principle | Efficiency Handling | Best Application Context | Reported Limitations |
|---|---|---|---|---|
| Comparative Cq (2-ΔΔCq) | Assumes optimal and equal efficiency for all amplicons [13] | Fixed at 2 (100% efficiency) [13] | High-abundance targets with validated primer efficiency | Underestimates true expression when efficiency <2 [13] |
| Pfaffl Model | Efficiency-corrected calculation based on standard curves [13] | Incorporates experimentally-derived efficiency values [13] | Small fold changes and low expression targets | Requires dilution series for each amplicon [13] |
| LinRegPCR | Determines efficiency from the exponential phase of individual reactions [13] | Uses mean fluorescence increase per cycle per sample [13] | Situations with reaction inhibition or variable quality | Sensitive to threshold setting in exponential phase [13] |
| qBase Software | GeNorm algorithm with multiple reference gene normalization [14] [13] | Combines efficiency correction with reference gene stability | Complex experimental conditions with variable stability | Requires specific software and multiple reference genes [14] |
Each method demonstrates good correlation in general application, but their performance diverges significantly when applied to low expression or small fold changes [13]. The Liu and Saint method has shown particularly high variability without careful optimization, while efficiency-corrected models like Pfaffl provide more reliable quantification for critical validation scenarios [13].
Experimental Design for Robust Validation
Reference Gene Selection and Stability Assessment
The foundation of reliable qPCR validation rests on proper reference gene selection. Early studies assumed constant expression of housekeeping genes, but research has demonstrated that stability must be empirically proven for each experimental context [14] [13]. As demonstrated in poplar gene expression studies, multiple evaluation approaches (geNorm, BestKeeper, NormFinder) should be employed as they may identify different genes as most stable [14] [13].
For sunflower senescence research, geNorm identified α-TUB1 as most stable, BestKeeper selected β-TUB, while a linear mixed model preferred α-TUB and EF-1α [14]. This condition-specific variation underscores why using multiple reference genes—rather than a single one—significantly improves normalization reliability [14] [13]. The optimal approach validates candidate reference genes across all experimental conditions using dedicated algorithms like NormFinder before final selection [13].
Efficiency Calculations: The Cornerstone of Accurate Quantification
Amplification efficiency dramatically impacts quantification accuracy, particularly for low expression genes and small fold changes. While the comparative Cq method assumes perfect efficiency, this condition is rarely achieved in practice [13]. Efficiency determination through serial dilutions provides a standard approach, but may be influenced by inhibitor dilution [13]. Alternative methods calculating efficiency from the exponential phase of individual reactions (LinRegPCR) offer advantages for problematic reactions [13].
Sample Size and Replication Strategy
Robust validation requires appropriate biological replication. While three replicates per condition is often considered the minimum standard, studies with high biological variability or seeking small effect sizes require greater replication [11]. With only two replicates, the ability to estimate variability and control false discovery rates is greatly reduced, and single replicates do not allow for statistical inference [11]. Power analysis tools like Scotty can help determine optimal sample sizes based on pilot data and expected effect sizes [11].
Research Reagent Solutions for Validation Experiments
Table 3: Essential Reagents and Materials for qPCR Validation Studies
| Reagent/Material | Function in Validation | Critical Selection Criteria | Application Notes |
|---|---|---|---|
| Reverse Transcriptase | Converts RNA to cDNA for amplification [12] | High efficiency, minimal RNase H activity, uniform representation | Critical for low-input samples; affects all downstream results |
| DNA-Specific Fluorescent Dyes | Detects PCR product accumulation during amplification [13] | Specificity, minimal PCR inhibition, broad dynamic range | SYBR Green requires post-amplification melt curve analysis |
| Target-Specific Primers | Amplifies gene of interest with high specificity [13] | Minimal secondary structure, high efficiency (90-110%), specificity验证 | Require validation of single amplification product |
| Reference Gene Assays | Normalizes technical variation between samples [14] [13] | Stable expression across experimental conditions | Multiple genes (≥3) recommended; stability requires validation |
| RNA Quality Assessment Tools | Evaluates RNA integrity before cDNA synthesis [12] | Accurate quantification of degradation and purity | RIN >7.0 generally required for reliable results |
Successful validation of RNA-Seq results, particularly for challenging scenarios involving low expression or small fold changes, requires a comprehensive strategy addressing multiple potential pitfalls. Key elements include: (1) selecting stable, condition-appropriate reference genes; (2) precisely measuring amplification efficiencies using appropriate mathematical models; (3) implementing sufficient biological replication to detect small effects; and (4) applying efficiency-correct quantification methods like the Pfaffl model rather than assuming optimal amplification. By adopting this rigorous framework and adhering to MIQE guidelines, researchers can confidently translate transcriptomic discoveries into reliable biomarkers for diagnostic and therapeutic applications [12].
The normalization of gene expression data, whether from quantitative PCR (qPCR) or RNA sequencing (RNA-seq), is a critical step that directly impacts the validity of research conclusions. For decades, scientists have relied on a limited set of presumed "housekeeping" genes—such as ACTB (β-actin), GAPDH, and 18S rRNA—as internal controls, operating under the assumption that their expression remains constant across all experimental conditions. However, a growing body of evidence reveals that this assumption is fundamentally flawed, as the expression of these traditional reference genes can vary significantly under different physiological, pathological, and experimental conditions. This guide objectively compares the traditional paradigm of using presumed housekeeping genes against the emerging approach of using experimentally validated controls, providing researchers with data-driven insights to enhance the rigor and reproducibility of their gene expression studies.
The Problem with Traditional Housekeeping Genes
Traditional housekeeping genes encode proteins essential for basic cellular functions, leading to their historical selection as normalization controls for qPCR and other gene expression technologies. The core issue with this approach is that no gene is universally stable across all cell types, developmental stages, or experimental treatments.
Documented Instability of Traditional Controls
Numerous studies have demonstrated that classical reference genes can exhibit significant expression variability, potentially leading to erroneous results:
- ACTB (β-actin) was shown to be downregulated in RNA-seq data following specific experimental treatments, making it invalid for normalization in those contexts [15]. Furthermore, actin is upregulated in chronic allograft dysfunction, compromising its utility in transplantation studies [16].
- 18S rRNA has been identified as a biomarker associated with acute rejection in transplant patients, indicating its variable expression in disease states [16].
- TUBB (β-tubulin) is directly targeted by pharmacological agents like colchicine, which disrupts its function and expression, rendering it unsuitable for drug studies [16].
This evidence underscores a critical limitation: relying on a single or small set of a priori selected genes introduces substantial risk of normalization bias.
Underlying Causes of Variability
The expression instability of traditional housekeeping genes stems from several factors:
- Cellular Context Dependence: Basic cellular maintenance requirements differ across tissue types, disease states, and developmental stages.
- Experimental Perturbations: Treatments that affect cell proliferation, metabolism, or cytoskeleton integrity directly impact genes like GAPDH and ACTB.
- Lack of Systematic Validation: Traditional controls were often adopted based on convention rather than rigorous, condition-specific stability testing.
The Emergence of Experimentally Validated Controls
The paradigm is shifting toward identifying normalization genes through empirical testing rather than presumption. This approach leverages high-throughput technologies like RNA-seq to systematically evaluate gene expression stability across specific experimental conditions.
Methodological Framework for Identification
The process for identifying validated controls typically follows this workflow, which can be adapted for various biological systems:
Key Advantages of Empirically Derived Controls
- Condition-Specific Optimization: Controls are tailored to the exact experimental system being studied.
- Multi-Gene Panels: Utilization of gene sets with complementary stability profiles enhances normalization robustness.
- Reduced Bias: Minimizes the risk of normalizing with genes that respond to experimental treatments.
- Enhanced Reproducibility: Improves the consistency and reliability of gene expression measurements.
Quantitative Comparison: Traditional vs. Validated Controls
The superiority of empirically validated controls is demonstrated through multiple quantitative metrics compared to traditional approaches.
Performance Metrics for Reference Genes
Table 1: Comparative Performance of Traditional vs. Experimentally Validated Control Genes
| Metric | Traditional Controls | Experimentally Validated Controls |
|---|---|---|
| Expression Stability (CV) | Highly variable (e.g., GAPDH CV 52.9%, EF1α CV 41.6% in tomato-Pseudomonas pathosystem) [17] | Significantly more stable (e.g., ARD2, VIN3 with CV 12.2%-14.4% in same system) [17] |
| Condition Dependency | High - expression alters in specific diseases, treatments, and developmental stages [16] | Low - systematically selected for stability across target conditions |
| Number of Genes | Typically 1-3 genes | Often 3+ genes combined as normalization factor |
| Biological Validation | Limited - often based on historical use | Comprehensive - includes stability algorithms (geNorm, NormFinder, BestKeeper) [17] |
| Impact on Differential Expression Results | Higher risk of false positives/negatives due to inappropriate normalization | More accurate identification of truly differentially expressed genes |
Concordance Between RNA-seq and qPCR with Proper Normalization
Table 2: Impact of Normalization Strategy on Transcriptome Validation
| Parameter | Traditional Normalization | Experimentally Validated Normalization |
|---|---|---|
| RNA-seq vs. qPCR Concordance | ~80-85% overall agreement [18] | Improved concordance through appropriate control selection |
| Non-Concordant Genes | 15-20% of genes show discrepancies [19] | Reduced discrepancy rate through optimized normalization |
| Severely Non-Concordant Genes | ~1.8% (typically low-expressed, shorter genes) [19] | Better handling of challenging gene classes |
| Differential Expression Validation | Higher false positive rates with traditional controls [1] | Improved validation rates through stable normalization |
Experimental Protocols and Case Studies
Protocol: Identification of Experimental Controls from RNA-seq Data
Principle: Leverage RNA-seq datasets to identify genes with minimal expression variation across target experimental conditions [16] [17].
Step-by-Step Methodology:
Experimental Design
- Include a minimum of 5-8 biological replicates per condition
- Encompass all expected experimental variations in the test dataset
- For human kidney allograft study: include biopsies representing normal function, acute rejection, interstitial nephritis, interstitial fibrosis/tubular atrophy, and polyomavirus nephropathy [16]
RNA Sequencing
- Library Preparation: Use standardized kits (e.g., Ion Ampliseq Transcriptome Human Gene Expression Kit)
- Sequencing Platform: Illumina HiSeq 2000, SOLiD 5500, or similar
- Sequencing Depth: Minimum 10-20 million reads per sample
- Quality Control: Assess RNA integrity (RIN >7), adapter contamination, and mapping rates
Bioinformatic Analysis
- Alignment: Map reads to reference genome (e.g., hg19) using STAR or TopHat2
- Quantification: Generate read counts or FPKM/RPKM values per gene
- Normalization: Apply multiple algorithms (library size, TMM, RPKM, TPM, DESeq) [16]
- Stability Calculation: Compute coefficient of variation (CV) for each gene across all samples
- CV = (Standard Deviation / Mean) × 100%
- Gene Selection: Identify genes with CV below the 2nd percentile across all transcripts
Validation
- Select top 8-12 candidate genes with lowest CV values
- Design qPCR primers with efficiency 90-110%
- Validate expression stability using algorithms (geNorm, NormFinder, BestKeeper)
- Establish optimal normalization factor from combination of top stable genes
Case Study: Tomato-Pseudomonas Pathosystem
A comprehensive study compared traditional and RNA-seq derived reference genes in the tomato-Pseudomonas interaction model [17]:
Experimental Design:
- Evaluated 37 different treatment/time-point conditions
- Included Pseudomonas syringae infections, MAMP elicitors, and mock treatments
- Analyzed 34,725 tomato genes from RNA-seq data
Results:
- Traditional genes (GAPDH, EF1α) showed high variability (CV 41.6-52.9%)
- Nine newly identified genes demonstrated superior stability (CV 12.2-14.4%)
- ARD2 and VIN3 emerged as optimal references for this pathosystem
- Validation across multiple immune response conditions confirmed consistent performance
Case Study: Human Kidney Allograft Biopsies
Research on renal allograft biopsies established condition-specific reference genes [16]:
Methodology:
- Analyzed 47,613 transcripts from 30 biopsies spanning multiple pathologies
- Applied nine normalization methods to identify stable genes
- Defined housekeeping genes as those with CV in the lowest 2nd percentile
Key Findings:
- Universal set of 42 housekeeping transcripts common to all normalization methods
- Pathway analysis revealed enrichment in cell morphology maintenance, pyrimidine metabolism, and intracellular protein signaling
- Traditional controls (18S RNA, actin, tubulin) showed significant variability across pathologies
- Established robust normalization framework for transplant immunology studies
The Scientist's Toolkit: Essential Research Reagents
Table 3: Key Reagent Solutions for Reference Gene Validation Studies
| Reagent/Category | Specific Examples | Function in Experimental Workflow |
|---|---|---|
| RNA Isolation Kits | RNeasy Plus Mini Kit (Qiagen) [20] | High-quality RNA extraction with genomic DNA removal |
| cDNA Synthesis Kits | iScript Advanced cDNA Synthesis (Bio-Rad) [20] | Efficient reverse transcription with optimized priming |
| RNA-seq Library Prep | Ion Ampliseq Transcriptome Human Gene Expression Kit [16] | Targeted whole-transcriptome library construction |
| qPCR Master Mixes | SYBR Green or TaqMan-based chemistries | Sensitive and specific amplification detection |
| Stability Analysis Software | geNorm, NormFinder, BestKeeper [17] | Algorithmic assessment of candidate reference genes |
| RNA-seq Alignment Tools | STAR, TopHat2, HISAT2 [18] | Accurate read mapping to reference genome |
| Expression Quantification | HTSeq, featureCounts, Kallisto, Salmon [18] | Transcript abundance estimation from mapped reads |
| Reference Gene Panels | Custom-designed primer sets for candidate genes | Multiplex validation of expression stability |
The evidence overwhelmingly supports a transition from presumed housekeeping genes to experimentally validated controls for gene expression normalization. Key findings from comparative analyses indicate:
Traditional housekeeping genes exhibit significant condition-dependent variability that compromises their utility as normalization factors across diverse experimental contexts.
RNA-seq enabled discovery approaches identify more stable control genes with 3-4 fold lower coefficients of variation compared to traditional references.
Multi-gene normalization factors derived from empirically validated controls enhance the accuracy and reproducibility of both qPCR and RNA-seq data analysis.
Field-specific validated controls are emerging for model organisms, pathological conditions, and experimental treatments, providing researchers with optimized tools for their specific applications.
To ensure robust gene expression quantification, researchers should implement systematic validation of reference genes for their specific experimental systems, leveraging high-throughput transcriptomic data where possible. This evidence-based approach to normalization represents a critical advancement in molecular methodology that will enhance the reliability of gene expression studies across biological and biomedical research domains.
In the evolving landscape of genomic research, high-throughput technologies like RNA sequencing (RNA-seq) have become cornerstone methods for comprehensive gene expression profiling. Despite their power to simultaneously measure thousands of transcripts, these discovery-based platforms introduce analytical challenges that necessitate confirmation through more targeted methods. Within this context, quantitative polymerase chain reaction (qPCR) maintains its position as the gold standard for gene expression validation, combining precision, sensitivity, and reliability that remains unmatched for focused gene expression studies. This guide objectively examines the performance of qPCR as a validation tool alongside alternative technologies, providing researchers with experimental data and methodological frameworks to strengthen their genomic studies.
The Technological Landscape: A Comparative Analysis of Expression Platforms
How qPCR, Microarrays, and RNA-Seq Stack Up
Understanding the relative strengths and limitations of each gene expression technology is crucial for appropriate experimental design and interpretation of results.
Table 1: Platform Comparison for Gene Expression Analysis
| Feature | qPCR | Microarrays | RNA-Seq |
|---|---|---|---|
| Throughput | Low to medium (typically <50 genes) | High (thousands of genes) | Very high (entire transcriptome) |
| Dynamic Range | Widest (up to 10⁷-fold) [21] | Constrained [21] [4] | Broad [21] |
| Sensitivity | Highest (can detect single copies) [22] | Moderate | High |
| Cost per Sample | Low for limited targets | Moderate | High |
| Sample Input | Low [21] | Moderate | Moderate to high |
| Background | Well-established, standardized protocols | Established but being phased out | Rapidly evolving, complex analysis |
| Primary Application | Target validation, focused studies | Whole transcriptome profiling (with reference) | Discovery, splicing, novel transcripts |
Quantitative Performance Benchmarks
Independent studies have directly compared the expression measurements obtained from different platforms, providing empirical evidence for their correlation and discrepancies.
Table 2: Cross-Platform Correlation Data from Comparative Studies
| Comparison | Correlation Level (Gene Level) | Correlation Level (Isoform Level) | Key Findings |
|---|---|---|---|
| RNA-seq vs qPCR | High (R² = 0.82-0.93) [23] | Not typically measured by qPCR | ~85% of genes show consistent fold-changes between MAQCA and MAQCB samples [23] |
| NanoString vs RNA-seq | Moderate (Median Rₛ = 0.68-0.82) [24] | Lower (Median Rₛ = 0.55-0.63) [24] | Consistency varies significantly between gene and isoform quantification |
| Exon-array vs RNA-seq | Moderate to high | Moderate (Median Rₛ = 0.62-0.68) [24] | Agreement on isoform expressions is lower than agreement on gene expressions [24] |
The Validation Paradigm: When and Why qPCR Confirmation is Essential
Establishing Biological Truth Through Multi-Method Confirmation
The principle of validation rests on confirming findings using a method with different technical principles and potential biases. While RNA-seq provides an unprecedented comprehensive view of the transcriptome, several factors justify qPCR confirmation for critical findings:
- Technical Complementarity: qPCR and RNA-seq employ fundamentally different detection principles—targeted amplification versus hybridization and sequencing—reducing the likelihood that the same technical artifacts would affect both methods [4].
- Measurement Precision: For a limited number of targets, qPCR provides superior quantitative accuracy with a wider dynamic range and lower limit of detection compared to sequencing-based methods [21].
- Statistical Reinforcement: When RNA-seq studies use limited biological replicates to reduce costs, qPCR validation on additional samples provides greater confidence in the observed effects [4].
Decision Framework for Validation Experiments
The following workflow outlines a systematic approach for determining when qPCR validation is warranted in high-throughput studies:
Methodological Excellence: Implementing Rigorous qPCR Validation
Experimental Design Considerations
Robust qPCR validation requires careful planning at each experimental stage to ensure biologically meaningful results:
- Biological Replication: Include multiple biological replicates (ideally ≥3) to account for natural variation, with technical replicates (typically 2-3) to assess assay precision [25].
- Control Selection: Implement no-template controls (NTC) to detect contamination, no-reverse-transcription controls (-RT) to assess genomic DNA contamination, and positive controls to confirm assay functionality [25] [22].
- Reference Genes: Select multiple validated reference genes with stable expression across experimental conditions, as unstable references can substantially distort results [26].
Sample Preparation and Quality Assessment
Proper sample handling and quality control are foundational to reliable qPCR data:
- RNA Integrity: Preserve RNA integrity through rapid sample processing, snap-freezing in liquid nitrogen, and proper storage at -80°C [26]. While mishandling (≤10 minutes) before extraction may not critically compromise RNA quality, consistent handling is recommended [26].
- Extraction Methodology: For human skeletal muscle samples, TRIzol-based extraction with 2-propanol precipitation provides higher yields compared to ethanol precipitation [26]. Column-based purifications offer higher purity suitable for sequencing applications [26].
- Quality Assessment: Evaluate RNA purity using spectrophotometric ratios (A260/A280 of 1.8-2.1 indicates pure RNA), with additional integrity assessment through methods like the RNA Integrity Number (RIN) [26].
Assay Design and Validation
Primer and probe design critically impact assay specificity and efficiency:
- Design Parameters: Aim for amplicons of 70-200 bp, primer TM values of 60-62°C (±2°C), and GC content of 35-65%. The probe should have a TM 4-10°C higher than primers without runs of consecutive Gs [25].
- Specificity Verification: Utilize BLAST analysis against species-specific databases to ensure primer/probe specificity and avoid cross-reactivity with related sequences [25] [27].
- SNP Considerations: Design assays to avoid known single nucleotide polymorphisms (SNPs), particularly at the 3' ends of primers, as a single SNP can cause Cq shifts representing >1000-fold expression errors [25].
- Performance Validation: Establish PCR efficiency (90-110% ideal), dynamic range (3-6 log orders), and limit of detection (theoretically 3 molecules with 95% confidence) through serial dilutions [22] [27].
High-Throughput qPCR Implementation
Advanced platforms like the SmartChip Real-Time PCR System enable medium-to-high throughput validation studies using nanoliter reaction volumes (100-200 nL), significantly reducing reagent costs while maintaining sensitivity [28]. These systems support flexible configurations from 6-768 samples and 12-768 targets per run, with data generation for over 10,000 samples per day [28].
Analytical Framework: From Raw Data to Biological Interpretation
Quality Assessment and Normalization
Implement stringent quality control measures before analyzing expression data:
- MIQE Compliance: Adhere to Minimum Information for Publication of Quantitative Real-Time PCR Experiments (MIQE) guidelines, reporting critical parameters including PCR efficiency, confidence intervals, and normalization methods [22] [26] [27].
- Data Normalization: Apply appropriate normalization strategies using multiple reference genes or cDNA content (with complete RNA removal from samples) to control for technical variation [26].
- Quality Scoring: Utilize systematic scoring methods like the "dots in boxes" approach that simultaneously evaluates PCR efficiency, dynamic range, specificity, and precision in a single visualization [22].
Analysis Methodologies for Validation Studies
Different analytical approaches can be employed to confirm high-throughput findings:
- Fold-Change Correlation: Compare expression fold changes between experimental conditions across platforms, with high-performing RNA-seq workflows showing Pearson correlations of R²=0.93-0.94 with qPCR data [23].
- Differential Expression Concordance: Assess the agreement in differentially expressed gene calls, recognizing that approximately 15% of genes may show inconsistent results between RNA-seq and qPCR [23].
- Troubleshooting Discrepancies: Investigate genes with inconsistent results for specific features—they tend to be smaller, have fewer exons, and lower expression compared to genes with consistent measurements [23].
Essential Research Reagent Solutions
Successful implementation of qPCR validation requires specific reagent systems optimized for different experimental needs:
Table 3: Key Research Reagent Solutions for qPCR Validation
| Reagent Category | Specific Examples | Function & Application |
|---|---|---|
| Nucleic Acid Extraction | TRIzol/reagents, RNeasy Plus kits | RNA isolation with DNA elimination, optimized for different sample types [26] |
| Reverse Transcription | Oligo(dT) primers, random hexamers, gene-specific primers | cDNA synthesis with different priming strategies affecting transcript representation [25] |
| qPCR Master Mixes | PrimeTime Mini, Luna qPCR kits | Optimized reaction components for intercalating dyes or probe-based detection [25] [22] |
| Assay Systems | PrimeTime predesigned assays, ZEN Double Quenched Probes | Prequalified primers and probes with modifications enhancing signal-to-noise [25] |
| Quality Assessment | RiboGreen dye, Agilent Bioanalyzer | Precise RNA quantification and integrity assessment [25] [26] |
Within the comprehensive workflow of genomic discovery, qPCR maintains an indispensable role as a validation tool that bridges high-throughput screening and biological confirmation. While RNA-seq and other comprehensive platforms excel at hypothesis generation and transcriptome-wide exploration, qPCR provides the precise, targeted quantification necessary to verify critical findings before drawing biological conclusions. The most robust experimental approaches strategically leverage the complementary strengths of both technologies—using RNA-seq for unbiased discovery and qPCR for focused confirmation—therely maximizing both the breadth of discovery and confidence in results. This integrated approach ensures that genomic studies produce reliable, reproducible findings that can effectively advance scientific understanding and therapeutic development.
From Data to Assay: A Step-by-Step Protocol for qPCR Validation
In the field of gene expression analysis, RNA sequencing (RNA-seq) has become the capstone technology for comprehensive transcriptome profiling. However, real-time quantitative PCR (RT-qPCR) remains the gold standard for validating RNA-seq findings due to its high sensitivity, specificity, and reproducibility [29] [4]. This validation process is particularly crucial when RNA-seq data is based on a small number of biological replicates or when a second methodological confirmation is necessary for scientific publication [4]. The reliability of RT-qPCR results fundamentally depends on using appropriate reference genes—genes with highly stable expression across the biological conditions being studied [29]. Traditional selection methods often rely on supposedly stable "housekeeping" genes, but evidence shows these can be unpredictably modulated under different experimental conditions [29]. The Gene Selector for Validation (GSV) software addresses this critical bottleneck by providing a systematic, data-driven approach for selecting optimal reference and validation candidate genes directly from RNA-seq datasets.
What is GSV Software? Purpose and Development
GSV is a specialized software tool designed to identify the most stable reference genes and the most variable validation candidate genes from transcriptomic data for downstream RT-qPCR experiments [29] [30]. Developed by researchers at the Instituto Oswaldo Cruz using the Python programming language, GSV features a user-friendly graphical interface built with Tkinter, allowing entire analyses without command-line interaction [29] [30]. The tool accepts common file formats (.xlsx, .txt, .csv) containing transcript expression data, making it accessible to biologists and researchers without advanced bioinformatics training [29].
The software's algorithm implements a filtering-based methodology that uses Transcripts Per Million (TPM) values to compare gene expression across RNA-seq samples [29]. This approach was adapted from methodologies established by Yajuan Li et al. for systematic identification of reference genes in scallop transcriptomes [29]. A key innovation of GSV is its ability to filter out genes with stable but low expression, which might fall below the detection limit of RT-qPCR assays—a critical limitation of existing selection methods [29]. By ensuring selected genes have sufficient expression for reliable detection, GSV improves the accuracy and efficiency of the transcriptome validation process.
How GSV Works: Algorithm and Workflow
The GSV algorithm employs a sophisticated multi-step filtering process to identify optimal reference and validation genes based on their expression stability and level across samples. The workflow branches to select two distinct types of candidate genes: stable reference genes and variable validation genes.
Reference Gene Selection Criteria
For identifying reference genes, GSV applies five sequential filters to the TPM values from RNA-seq data [29]:
- Expression Presence: Genes must have TPM > 0 in all analyzed libraries [29].
- Low Variability: Standard deviation of Log₂(TPM) across samples must be < 1 [29].
- Expression Consistency: No exceptional expression in any library (|Log₂(TPM) - Average(Log₂(TPM))| < 2) [29].
- High Expression: Average Log₂(TPM) > 5 [29].
- Stability: Coefficient of variation < 0.2 [29].
Validation Gene Selection Criteria
For identifying variable genes suitable for validation of differential expression, GSV applies a different set of filters [29]:
- Expression Presence: TPM > 0 in all libraries [29].
- High Variability: Standard deviation of Log₂(TPM) > 1 [29].
- High Expression: Average Log₂(TPM) > 5 [29].
The following diagram illustrates GSV's complete logical workflow for candidate gene selection:
GSV Software Gene Selection Workflow
Tuning and Customization
Despite providing recommended standard cutoff values for optimal gene selection, GSV allows users to modify these thresholds through its software interface [29]. This flexibility enables researchers to loosen or tighten selection criteria based on specific experimental needs or particular characteristics of their transcriptomic data.
Performance Comparison: GSV vs. Alternative Tools
Comparative Advantages of GSV
When evaluated against other gene selection software using synthetic datasets, GSV demonstrated superior performance by effectively removing stable low-expression genes from the reference candidate list while simultaneously creating robust variable-expression validation lists [29]. The table below compares GSV's capabilities with other commonly used tools:
Table 1: Feature Comparison Between GSV and Alternative Gene Selection Tools
| Software Tool | Accepts RNA-seq Data | Filters Low-expression Genes | Selects Reference Genes | Selects Validation Genes | Command-line Interaction | Graphical Interface |
|---|---|---|---|---|---|---|
| GSV | Yes [29] | Yes [29] | Yes [29] | Yes [29] | No [29] | Yes [29] |
| GeNorm | Limited [29] | No [29] | Yes [29] | No [29] | No | Yes |
| NormFinder | Limited [29] | No [29] | Yes [29] | No [29] | Yes (R package) [29] | No |
| BestKeeper | Limited [29] | No [29] | Yes [29] | No [29] | No | Yes |
| OLIVER | Limited (microarrays) [29] | No [29] | Yes [29] | No [29] | Yes [29] | No |
Experimental Validation Data
GSV's performance has been validated through multiple experiments, including application to an Aedes aegypti transcriptome [29] [30]. In this case study, GSV identified eiF1A and eiF3j as the most stable reference genes, which were subsequently confirmed through RT-qPCR analysis [29]. The tool also revealed that traditional mosquito reference genes were less stable in the analyzed samples, highlighting the risk of inappropriate gene selection using conventional approaches [29].
The software has demonstrated scalability in processing large datasets, successfully analyzing a meta-transcriptome with over ninety thousand genes [29]. The quantitative results from performance testing are summarized below:
Table 2: Experimental Performance Metrics of GSV Software
| Performance Metric | Synthetic Dataset Testing | Aedes aegypti Case Study | Meta-transcriptome Analysis |
|---|---|---|---|
| Removal of low-expression stable genes | Effective [29] | Confirmed [29] | Successful [29] |
| Identification of stable references | Superior to alternatives [29] | eiF1A, eiF3j confirmed [29] | Scalable to >90,000 genes [29] |
| Creation of variable validation lists | Effective [29] | Available [29] | Successful [29] |
| Processing time and efficiency | Time-effective [29] | Time-effective [29] | Successful [29] |
Experimental Protocols for GSV Implementation
Step-by-Step GSV Workflow Protocol
- Data Preparation: Compile TPM (Transcripts Per Kilobase Million) values for all genes across all RNA-seq samples into a single file (.xlsx, .txt, or .csv format) [29].
- Software Setup: Download and install GSV from the official GitHub repository (https://github.com/rdmesquita/GSV) [30].
- Parameter Configuration: Input TPM data file and set filtering criteria (standard values recommended: TPM>0, SD<1, |Log2TPM-Mean|<2, Mean>5, CV<0.2 for reference genes) [29].
- Execution: Run analysis through the graphical interface without command-line interaction [29].
- Result Interpretation: Review output tables listing reference candidates (most stable) and validation candidates (most variable) [29].
- Experimental Validation: Select top candidate reference genes for stability confirmation via RT-qPCR using different biological samples [29].
Case Study: Aedes aegypti Transcriptome Analysis
Researchers applied GSV to an Aedes aegypti transcriptome to identify reference genes for studying development and insecticide resistance [29]. The traditional reference genes (e.g., ribosomal proteins) were found to be less stable compared to eiF1A and eiF3j identified by GSV [29]. RT-qPCR validation confirmed the superior stability of GSV-selected genes across different biological conditions, demonstrating the practical utility of the software in real research scenarios [29].
Essential Research Reagent Solutions
The following table details key reagents and materials required for implementing the complete RNA-seq to RT-qPCR validation workflow supported by GSV software:
Table 3: Essential Research Reagents for RNA-seq Validation Workflow
| Reagent/Material | Function/Purpose | Application Stage |
|---|---|---|
| RNA Extraction Kit | Isolation of high-quality RNA from biological samples | Sample Preparation |
| RNA-seq Library Prep Kit | Preparation of sequencing libraries (strand-specific, barcoded) | RNA-seq |
| TPM Quantification Software | Generate transcripts per million values from sequence reads | Data Processing |
| GSV Software | Selection of optimal reference and validation candidate genes | Gene Selection |
| Reverse Transcriptase | Synthesis of cDNA from RNA templates for qPCR | RT-qPCR |
| qPCR Master Mix | Amplification and detection of specific transcripts | RT-qPCR |
| Primer Sets | Gene-specific amplification of target and reference genes | RT-qPCR |
GSV represents a significant advancement in the field of gene expression analysis by providing a systematic, data-driven approach for selecting reference and validation genes from RNA-seq data. By filtering for both stability and adequate expression levels, GSV addresses a critical limitation of traditional methods that often rely on presumptive housekeeping genes without empirical validation [29]. The software's ability to process large datasets efficiently, combined with its user-friendly interface, makes it a valuable tool for researchers validating RNA-seq results through RT-qPCR [29] [30]. As transcriptomic studies continue to expand across diverse biological fields, tools like GSV that enhance the accuracy and reliability of gene expression validation will play an increasingly important role in ensuring robust and reproducible research outcomes.
In the framework of validating RNA-Seq results with qPCR experimental methods, the selection of appropriate genes is a cornerstone for accurate data interpretation. While RNA-Seq provides an unbiased, genome-wide view of the transcriptome, quantitative PCR (qPCR) remains the gold standard for validating specific gene expression changes due to its high sensitivity, specificity, and reproducibility [29] [31]. The reliability of qPCR data, however, hinges on proper normalization using reference genes that demonstrate stable expression across all experimental conditions [6] [32]. The misuse of traditional housekeeping genes without proper validation remains a prevalent issue that can compromise data integrity and lead to biological misinterpretations [29] [32].
The emergence of Transcripts Per Million (TPM) as a standardized unit for RNA-Seq quantification has provided researchers with a robust starting point for identifying candidate genes [33]. TPM values account for both sequencing depth and gene length, enabling more accurate cross-sample comparisons than raw counts alone [33]. This article systematically compares computational approaches for selecting stable reference and variable candidate genes directly from TPM data, providing researchers with evidence-based protocols for strengthening the connection between high-throughput discovery and targeted validation.
Understanding TPM Data and Its Applications in Gene Selection
TPM as a Quantification Measure
TPM (Transcripts Per Million) represents a normalized expression unit that facilitates comparison of transcript abundance both within and between samples. The calculation involves two sequential normalizations: first for gene length, then for sequencing depth. This dual normalization makes TPM particularly valuable for cross-sample comparisons, as the sum of all TPM values in each sample is always constant (1 million), creating a consistent scale across libraries [33]. This property is especially important when selecting reference genes, as it minimizes technical variability that could obscure true biological stability.
Compared to other quantification units, TPM provides distinct advantages. While FPKM (Fragments Per Kilobase of transcript per Million mapped fragments) applies similar normalizations, it lacks the consistent per-million sum across samples. Normalized counts from tools like DESeq2 effectively handle cross-sample comparison for differential expression but don't intrinsically account for gene length variations [33]. Research comparing quantification measures has demonstrated that TPM offers a balanced approach for initial candidate gene screening from RNA-Seq datasets, though some studies suggest normalized counts may provide slightly better reproducibility in certain contexts [33].
The Critical Distinction Between Reference and Variable Genes
In transcriptomics validation workflows, researchers must identify two distinct classes of genes with opposing expression characteristics:
- Stable Reference Genes: These maintain consistent expression levels across experimental conditions, serving as internal controls for qPCR normalization. They control for technical variations in RNA quality, reverse transcription efficiency, and cDNA loading [6] [32].
- Variable Candidate Genes: These demonstrate significant expression changes between conditions and represent primary targets for biological interpretation and validation. They typically show strong responsiveness to experimental manipulations or disease states [29].
Proper selection of both gene classes is essential for robust validation. Reference genes ensure technical accuracy, while appropriately chosen variable genes confirm biological hypotheses. The MIQE (Minimum Information for Publication of Quantitative Real-Time PCR Experiments) guidelines emphasize that reference gene utility must be experimentally validated for specific tissues, cell types, and experimental designs rather than assumed from historical precedent [32].
Computational Methods for Selecting Genes from TPM Data
The GSV Software Workflow
The Gene Selector for Validation (GSV) software provides a specialized tool for identifying both stable reference and variable candidate genes directly from TPM data [29]. Developed in 2024, this Python-based application implements a filtering-based methodology adapted from Li et al. that systematically processes transcriptome quantification tables to identify optimal candidates [29].
The software's algorithm employs distinct criteria for reference versus variable gene selection. For reference genes, GSV applies five sequential filters requiring that genes must: (I) have expression >0 in all libraries; (II) demonstrate low variability between libraries (standard deviation of log₂(TPM) <1); (III) show no exceptional expression in any library (expression at most twice the average of log₂ expression); (IV) maintain high expression levels (average log₂(TPM) >5); and (V) exhibit low coefficient of variation (<0.2) [29]. For variable genes, GSV uses modified criteria that prioritize high variability (standard deviation of log₂(TPM) >1) while maintaining detectable expression [29].
The following workflow diagram illustrates the complete GSV filtering process:
Figure 1: GSV Software Filtering Workflow for Gene Selection
Alternative Statistical Approaches
Beyond dedicated software tools, researchers can implement statistical methods directly to identify candidate genes from TPM data. The coefficient of variation (CV) provides a straightforward metric for assessing gene stability, calculated as the standard deviation divided by the mean of TPM values across samples [6] [33]. Genes with lower CV values represent stronger reference candidates, while those with higher CV values are potential variable genes.
More sophisticated algorithms include NormFinder, which estimates expression variation using analysis of variance models, and GeNorm, which evaluates gene stability through pairwise comparisons [6] [32]. A comprehensive comparison of statistical approaches published in 2022 demonstrated that with a robust statistical workflow, conventional reference gene candidates can perform as effectively as genes preselected from RNA-Seq data [6]. This finding suggests that methodological rigor in statistical validation may outweigh the source of candidate genes.
A particularly innovative approach published in 2024 demonstrated that a stable combination of non-stable genes can outperform individual reference genes for qPCR normalization [32]. This method identifies a fixed number of genes whose individual expressions balance each other across experimental conditions, creating a composite reference with superior stability compared to single genes [32].
Comparison of Computational Methods
Table 1: Comparative Analysis of Gene Selection Methods from TPM Data
| Method | Key Features | Advantages | Limitations | Best Use Cases |
|---|---|---|---|---|
| GSV Software | Automated filtering based on TPM thresholds; identifies both reference and variable genes [29] | User-friendly interface; standardized criteria; efficient processing of large datasets | Limited customization options; fixed expression thresholds | High-throughput screening; researchers with limited bioinformatics expertise |
| Coefficient of Variation | Simple calculation of variation relative to mean expression [6] | Easy to implement; intuitive interpretation; works with any statistical software | Does not account for expression level; sensitive to outliers | Initial screening; small datasets; preliminary candidate identification |
| GeNorm | Pairwise comparison of candidate genes; determines optimal number of reference genes [32] | Established validation method; determines minimal number of required genes | Requires predefined candidate set; not for initial screening from TPM data | Final validation of candidate reference genes |
| NormFinder | Model-based approach considering intra- and inter-group variation [6] [32] | Accounts for sample subgroups; robust against co-regulated genes | Requires predefined candidate set; more complex implementation | Experimental designs with distinct sample groups or treatments |
| Gene Combination Method | Identifies optimal combinations of genes that balance each other's expression [32] | Can outperform single-gene normalizers; creates composite reference standards | Computationally intensive; requires large TPM dataset for discovery | Maximizing normalization accuracy; organisms with comprehensive transcriptome databases |
Experimental Protocols for Gene Validation
From TPM Selection to qPCR Validation
The transition from computational selection to experimental validation requires careful experimental design. For reference gene validation, researchers should select 3-5 top candidate stable genes from TPM analysis plus 1-2 traditionally used reference genes for comparison [32]. These candidates are then measured by qPCR across all experimental conditions, with multiple biological replicates that reflect the full scope of the study design.
The validation process typically employs statistical algorithms like GeNorm, NormFinder, and BestKeeper to rank candidate stability based on qPCR data [32]. These tools evaluate expression consistency and help determine the optimal number of reference genes required for accurate normalization. Studies consistently show that using multiple reference genes significantly improves normalization accuracy compared to single-gene approaches [32].
For variable genes, selected candidates should represent a range of effect sizes and biological functions. Including both strongly and moderately differentially expressed genes from TPM data helps assess the sensitivity of validation across expression magnitudes. This approach also controls for potential biases in RNA-Seq quantification of lowly expressed genes [6].
qPCR Experimental Design and Execution
The following workflow illustrates the complete experimental pipeline from computational selection to final validation:
Figure 2: Complete Workflow from TPM Analysis to qPCR Validation
Troubleshooting Common Validation Issues
When discordance appears between RNA-Seq and qPCR results, researchers should investigate several potential sources. Genes with shorter transcript lengths and lower expression levels frequently show poorer correlation between platforms due to technical limitations of both methods [6]. RNA-Seq normalization strategies can exhibit transcript-length bias where longer transcripts receive more counts regardless of actual expression levels [6].
For reference genes that demonstrate unexpected variability during qPCR validation, consider experimental factors beyond transcriptional regulation. RNA integrity, reverse transcription efficiency, and primer specificity can all contribute to measured variation. Including RNA quality assessment (e.g., RIN scores) and cDNA quality controls strengthens validation conclusions [34].
When validation fails for variable genes, examine the statistical power of both original RNA-Seq and validation experiments. Small sample sizes in RNA-Seq studies increase false positive rates, necessitating more stringent significance thresholds or additional replication in qPCR validation [4].
Research Reagent Solutions for Gene Expression Validation
Table 2: Essential Research Reagents and Tools for Gene Validation Studies
| Reagent/Tool | Function | Selection Criteria | Quality Control Measures |
|---|---|---|---|
| RNA Isolation Kits | Extract high-quality RNA from samples | Compatibility with sample type (cells, tissues, FFPE); yield and purity guarantees | RNA integrity number (RIN) >8.0; clear 260/280 and 260/230 ratios [34] |
| Reverse Transcription Kits | Convert RNA to cDNA for qPCR | High efficiency; minimal bias; ability to process difficult templates | Include genomic DNA removal; verify efficiency with spike-in controls |
| qPCR Master Mixes | Enable quantitative amplification | Efficiency, sensitivity, specificity, and reproducibility across targets | Validate with standard curves; ensure efficiency between 90-110% |
| Primer Sets | Gene-specific amplification | High specificity; minimal secondary structure; appropriate amplicon size (70-150 bp) | Verify single amplification product with melt curve analysis [32] |
| Reference Gene Panels | Pre-validated normalization genes | Evidence of stability in similar biological systems; include multiple genes | Confirm stability in your specific experimental system [32] |
| RNA-Seq Quantification Tools | Generate TPM values from raw sequencing data | Accuracy, reproducibility, compatibility with reference annotations | Use standardized pipelines; verify with spike-in controls when available [33] |
| Stability Analysis Software | Evaluate candidate reference genes (GeNorm, NormFinder, BestKeeper) | Established validation record; transparent algorithms; appropriate for experimental design | Apply multiple complementary methods for consensus [32] |
The integration of TPM-based computational selection with rigorous qPCR validation represents a powerful framework for transcriptomics research. Through comparative analysis of current methodologies, several best practices emerge. First, leverage TPM data from RNA-Seq as a valuable resource for identifying candidate genes, but always confirm computational predictions with experimental validation. Second, implement multiple statistical approaches rather than relying on a single method, as each offers complementary insights into gene stability. Third, recognize that context matters—the ideal reference genes for one experimental system may perform poorly in another.
The evolving consensus suggests that future directions will focus increasingly on combinatorial approaches rather than single-gene normalizers [32]. As transcriptomic databases expand across diverse biological contexts, researchers will gain unprecedented power to identify optimal gene sets for specific experimental paradigms. By adhering to the rigorous criteria and methodologies outlined in this guide, researchers can maximize the accuracy and reproducibility of their gene expression studies, strengthening the vital connection between high-throughput discovery and targeted validation.
In the rigorous pipeline of validating RNA-Seq results with qPCR, primer design transcends a mere preliminary step to become a fundamental determinant of experimental success. The central challenge in this process involves designing oligonucleotides that achieve perfect specificity when distinguishing between nearly identical sequences—whether differentiating between homologous gene family members or accurately genotyping single nucleotide polymorphisms (SNPs). The exponential growth of cataloged genetic variations, with the human genome now containing a SNP approximately every 22 bases, has dramatically intensified this challenge [35]. In diagnostic assays, drug development, and functional genomics research, the failure to account for these factors can produce misleading validation data, compromising downstream conclusions and applications.
This guide provides a systematic comparison of strategies and tools for designing primers that effectively incorporate homologous sequences and manage SNPs. We present supporting experimental data and detailed methodologies to equip researchers with protocols that enhance specificity, ensuring that qPCR validation of RNA-Seq experiments yields biologically accurate and reproducible results.
Understanding the Specificity Challenge
The Impact of SNPs on Primer Binding and Amplification Efficiency
Single nucleotide polymorphisms underlying primer or probe binding sites can destabilize oligonucleotide binding and reduce target specificity through several mechanisms. The positional effect of a mismatch is paramount: SNPs located in the interior of a primer-template duplex are most disruptive, potentially reducing the melting temperature (Tm) by as much as 5–18°C [35]. This destabilization directly impacts qPCR amplification efficiency, particularly when mismatches occur within the last five bases of the primer's 3' end. Experimental data demonstrates that terminal 3' mismatches can alter quantification cycle (Cq) values by as much as 5–7 cycles—equivalent to a 32- to 128-fold difference in apparent template concentration depending on the master mix used [35].
The base composition of the mismatch further influences its impact. Reactions containing purine/purine (e.g., A/G) and pyrimidine/pyrimidine (e.g., C/C) mismatches at the 3' terminal position produce the largest Cq value differences compared to perfect matches [35]. When using primers for SNP detection in genotyping experiments, the strategic introduction of additional mismatches at the penultimate position (N-2) can increase specificity by further destabilizing amplification of the non-target allele [36].
Table 1: Impact of Mismatch Position on qPCR Amplification Efficiency
| Mismatch Position from 3' End | Expected ΔCq Value | Effect on Amplification Efficiency | Recommended Action |
|---|---|---|---|
| Terminal (N-1) | +5 to +7 cycles | Severe reduction (32-128 fold) | Avoid in design |
| Penultimate (N-2) | +3 to +5 cycles | Significant reduction | Avoid in design |
| Within last 5 bases | +1 to +3 cycles | Moderate reduction | Avoid if possible |
| Central region (>5 bases from end) | 0 to +2 cycles | Mild reduction | Potentially acceptable |
| 5' end | Minimal effect | Negligible reduction | Generally acceptable |
Homologous Gene Families and Sequence Conservation
Beyond SNPs, homologous gene families present a distinct challenge for primer design. These families contain conserved regions that can serve as potential off-target binding sites, leading to co-amplification of related gene members and compromising quantification accuracy. This problem is particularly acute when designing primers for qPCR validation of RNA-Seq data, where distinguishing between paralogous transcripts with high sequence similarity is often necessary.
The risk extends to pseudogenes—non-functional genomic sequences homologous to functional genes—which can be co-amplified if primers bind to shared conserved regions. Research indicates that approximately 20% of spliced human genes lack at least one constitutive intron, further complicating the design of transcript-specific assays [37]. Effective strategies to address these challenges include targeting alternative splicing junctions, exploiting unique 3' untranslated regions (UTRs), or focusing on exonic sequences that flank long intronic regions not present in mature mRNA or processed pseudogenes.
Comparative Analysis of Primer Design Strategies
SNP-Informed Design Approaches
Avoidance Strategy: The most straightforward approach involves designing primers that avoid known SNP positions entirely. This requires up-to-date knowledge of variation databases such as NCBI dbSNP. Before finalizing designs, researchers should visually inspect their target region using NCBI's BLAST Graphical interface with the "Variation" track enabled to identify documented polymorphisms [35]. The minor allele frequency (MAF) should be considered relative to the study population, as low-frequency SNPs may not warrant design modification in homogeneous populations.
Incorporation Strategy: When avoiding a SNP is impossible due to sequence constraints, strategic incorporation becomes necessary. For genotyping experiments where relevant SNPs occur adjacent to the SNP of interest, using mixed bases (Ns) or inosines in the primer or probe can cover adjacent sites [35]. When a SNP must underlie a primer sequence, positional management becomes critical—positioning the SNP toward the 5' end of the primer minimizes its impact on polymerase extension efficiency [35]. Tools like IDT's OligoAnalyzer enable researchers to predict the Tm of mismatched probe sequences, allowing for informed design decisions [35].
Amplification Refractory Mutation System (ARMS): For applications requiring active discrimination between alleles, the ARMS approach employs primers whose 3' terminal nucleotide is complementary to either the wild-type or mutant sequence. The efficiency of amplification is dramatically reduced when a mismatch occurs at the 3' end. Enhanced specificity can be achieved by introducing an additional deliberate mismatch at the N-2 or N-3 position, which further destabilizes the non-target allele [36]. Experimental data indicates that optimal destabilization varies by mismatch type, with G/A, C/T, and T/T mismatches providing the strongest discriminatory effect [36].
Table 2: SNP-Specific Primer Design Solutions Comparison
| Design Strategy | Best Use Case | Specificity Mechanism | Limitations | Experimental Validation Required |
|---|---|---|---|---|
| SNP Avoidance | High-frequency SNPs in study population | Eliminates mismatch destabilization | Limited by target sequence flexibility | Moderate |
| 5' Positioning | Unavoidable SNPs in primer binding site | Minimizes polymerase binding disruption | Reduced but not eliminated SNP effects | Moderate |
| Mixed Bases/Inosines | Flanking SNPs adjacent to target site | Accommodates sequence variation | Potential reduction in overall binding affinity | High |
| ARMS Primers | Active allele discrimination | 3' terminal mismatch blocks extension | Requires precise optimization | High |
| Modified ARMS (N-2) | Enhanced allele discrimination needed | Additional mismatch increases specificity | More complex design process | High |
Strategies for Managing Homologous Sequences
Constitutive Exon Targeting: For gene-level expression analysis that aims to be blind to alternative splicing, targeting constitutive exons—those present in all transcript variants—provides an effective strategy. This approach involves identifying introns present in every isoform and designing primers within the flanking exonic segments [37]. Such designs ensure that the expression readout reflects overall gene expression rather than being influenced by drug effects that might alter isoform proportions without changing primary mRNA expression levels.
Exon-Exon Junction Spanning: To prevent amplification of genomic DNA contaminants and increase transcript specificity, designing primers that span exon-exon junctions is highly effective. Since intronic sequences are absent from mature mRNA, this approach ensures that only properly spliced transcripts are amplified. The junction site should be positioned near the primer's center rather than at the 3' end to maintain binding stability. For maximum specificity, the 3' end should extend at least 4-6 bases into the downstream exon.
Unique Region Identification: When constitutive exons are not available or practical, identifying unique sequence regions through comprehensive homology searches becomes essential. Tools such as NCBI Primer-BLAST allow researchers to automatically check candidate primers against the entire genome or transcriptome to identify potential off-target binding sites [38]. This bioinformatic pre-screening is particularly crucial for gene families with high sequence conservation, such as actin or GAPDH paralogs, where traditional design parameters may insufficiently guarantee specificity.
Experimental Protocols and Data Analysis
Protocol for Validating Primer Specificity in Homologous Regions
Step 1: In Silico Specificity Analysis
- Retrieve reference sequences for all homologous genes from Ensembl or NCBI.
- Perform multiple sequence alignment using ClustalOmega or MUSCLE to identify conserved and variable regions.
- Design candidate primers using Primer-BLAST with exon-junction spanning constraints where applicable.
- Set specificity checking parameters to include the relevant organism's reference mRNA and genome databases.
- Select primer pairs with no significant off-target hits, particularly avoiding stable 3' complementarity to non-target genes.
Step 2: Experimental Validation by Gel Electrophoresis
- Amplify using standardized qPCR conditions: 95°C for 3 min, 40 cycles of 95°C for 15s, and 60°C for 1 min.
- Include melt curve analysis: 65°C to 95°C with 0.5°C increments every 5s.
- Resolve PCR products on a 2.5% agarose gel stained with SYBR Safe.
- Validate single amplicons of expected size; multiple bands indicate off-target amplification.
- Sequence any secondary bands to identify cross-amplification sources.
Step 3: Efficiency and Dynamic Range Assessment
- Prepare five 10-fold serial dilutions of template cDNA covering the expected experimental concentration range.
- Amplify each dilution in triplicate using the candidate primers.
- Calculate amplification efficiency from the slope of the standard curve: Efficiency = [10^(-1/slope) - 1] × 100%.
- Accept primers with efficiency between 90-110% (R² > 0.98) for precise quantification.
- Compare efficiency across homologous gene templates to confirm discrimination capability.
Protocol for SNP-Specific Primer Validation
Step 1: Allele-Specific Primer Design
- For ARMS primer design, place the allele-discriminatory base at the 3' terminus.
- Incorporate an additional intentional mismatch at the N-2 or N-3 position to enhance specificity [36].
- Balance primer Tm between 65-67°C with ΔTm < 1°C between forward and reverse primers.
- Include a positive control primer set that amplifies both alleles in a separate reaction.
Step 2: Optimization of Annealing Temperature
- Perform gradient qPCR with annealing temperatures from 55°C to 70°C.
- Use genomic DNA or cDNA samples with known genotype as templates.
- Identify the temperature that maximizes ΔCq between matched and mismatched templates.
- Typically, the optimal annealing temperature will be 2-5°C above the lower Tm of the primer pair [39].
Step 3: Specificity Assessment and Limit of Detection
- Test primers against templates of known genotype (wild-type, heterozygous, mutant).
- Calculate ΔCq values between matched and mismatched amplification for each genotype.
- Establish the limit of detection for minor alleles in mixed samples by spiking experiments.
- Validate with Sanger sequencing of a subset of samples to confirm genotyping accuracy.
Table 3: Performance Metrics for SNP-Specific Primer Validation
| Validation Parameter | Acceptance Criterion | Typical Result for Optimized ARMS Primers |
|---|---|---|
| ΔCq (matched vs. mismatched) | >5 cycles | 7-10 cycles difference |
| Amplification Efficiency | 90-110% | 95-105% for matched template |
| Specificity | >95% correct genotype calls | >98% concordance with sequencing |
| Limit of Detection | <5% minor allele in mixture | 1-2% minor allele detection |
| Inter-assay CV | <5% for Cq values | 2-4% coefficient of variation |
Essential Tools and Reagent Solutions
The successful implementation of specificity-focused primer design requires both sophisticated bioinformatic tools and quality-controlled reagents. The following solutions have demonstrated utility in challenging design scenarios:
Table 4: Research Reagent Solutions for Specific Primer Applications
| Reagent/Tool | Function | Specificity Consideration |
|---|---|---|
| IDT OligoAnalyzer | Thermodynamic analysis of oligonucleotides | Predicts Tm reduction from SNPs; analyzes dimer formation [35] [38] |
| NCBI Primer-BLAST | Integrated design with specificity checking | Automatically screens primers against genomic background [38] |
| BatchPrimer3 | High-throughput primer design | Designs primers for multiple targets simultaneously [38] |
| Proofreading Polymerases | High-fidelity amplification | Reduces misincorporation but requires optimization for SNP genotyping |
| Hot Start Taq Polymerase | Nonspecific amplification prevention | Improves specificity by inhibiting activity at low temperatures |
| GC-Rich Enhancers | Stabilization of difficult templates | Aids amplification through GC-rich SNP regions |
| Locked Nucleic Acids (LNAs) | Increased binding affinity | Enhances allele discrimination in SNP detection [35] |
Workflow Visualization
Primer Design Decision Workflow
The perfection of primer design for validating RNA-Seq data demands meticulous attention to genetic variations and homologous sequences. As the catalog of known SNPs continues to expand—increasing nearly 20-fold over the past decade—and our understanding of gene family complexity deepens, the paradigm for assay design must evolve accordingly [35]. The strategies and protocols presented here provide a framework for developing specific, robust qPCR assays that yield biologically meaningful validation data.
Future developments in primer design will likely incorporate more sophisticated machine learning approaches to predict hybridization efficiency in polymorphic regions and manage complex homology landscapes. As personalized medicine advances, the ability to design specific primers for individual variants will become increasingly important. Regardless of technological advancements, the fundamental principles outlined here—understanding positional effects of mismatches, employing strategic SNP incorporation, and conducting thorough in silico and experimental validation—will remain essential for researchers committed to primer design perfection in the critical task of RNA-Seq validation.
Quantitative real-time PCR (qPCR) remains a cornerstone technique for validating gene expression data obtained from high-throughput RNA sequencing (RNA-seq). While RNA-seq provides an unbiased, genome-wide view of the transcriptome, qPCR offers unparalleled sensitivity and precision for quantifying expression levels of a smaller subset of genes. The reliability of qPCR data, however, is critically dependent on rigorous assay optimization to achieve optimal amplification efficiency and linearity. This guide details a systematic workflow for achieving an optimal qPCR validation with an R² ≥ 0.9999 and a PCR efficiency of 100% ± 5%, serving as a gold-standard method for confirming RNA-seq findings.
The Critical Role of qPCR in Validating RNA-Seq Data
The question of whether RNA-seq data requires validation by an orthogonal method like qPCR is a subject of ongoing discussion. Evidence suggests that with state-of-the-art experimental and bioinformatic practices, RNA-seq results are generally robust [3]. However, qPCR validation remains crucial in specific scenarios:
- When the biological conclusion hinges on a few genes: If a story is based on the differential expression of only a small number of genes, especially those with low expression levels or small fold-changes, independent verification is essential [3].
- When RNA-seq data is derived from a small number of biological replicates: Using few replicates to save costs can limit statistical power. qPCR can then be used to validate key targets across a larger sample set [4].
- To confirm findings in additional biological contexts: qPCR is ideal for rapidly measuring the expression of genes identified by RNA-seq in new conditions, strains, or patient samples [3].
- To satisfy journal reviewer expectations: Many reviewers in the biological sciences expect to see key RNA-seq findings confirmed by a different, well-established technology [4].
A comprehensive benchmarking study revealed that while overall correlation between RNA-seq and qPCR is high, a small but consistent fraction of genes (approximately 1.8%) show severe non-concordant results, often being lower expressed and shorter [23]. This underscores the value of qPCR validation for critical gene targets.
A Stepwise Optimization Protocol for Robust qPCR
Achieving high-quality qPCR results is a sequential process where each parameter must be meticulously optimized. The following protocol, adapted from an optimized approach for plant genomes, ensures maximum specificity, sensitivity, and efficiency [40].
Step 1: Sequence-Specific Primer Design
The foundation of a successful qPCR assay is specific primer design. Computational tools are a good starting point but often ignore sequence similarities between homologous genes.
- Identify Homologous Sequences: Retrieve all homologous gene sequences for your target from a genomic database.
- Conduct Multiple Sequence Alignment: Align these sequences to identify unique single-nucleotide polymorphisms (SNPs).
- Design Primers Across SNPs: Place sequence-specific primers such that the 3'-end nucleotides cover SNPs unique to your target gene. This leverages the ability of DNA polymerase to differentiate SNPs at the 3'-end under optimized conditions [40].
- Standard Design Parameters: Ensure amplicons are 85–125 bp in length, with appropriate GC content and minimal self-complementarity to avoid dimer formation [40].
Step 2: Optimize Annealing Temperature
A temperature gradient PCR should be performed to identify the annealing temperature that yields the lowest Ct value (indicating highest yield) and a single, specific peak in the melt curve (confirming a single amplicon).
Step 3: Determine Optimal Primer Concentration
Test a range of primer concentrations (e.g., 50-900 nM) to find the concentration that provides the lowest Ct and highest fluorescence (ΔRn) without promoting primer-dimer formation.
Step 4: Validate Primer Efficiency with a Standard Curve
This is the most critical step for achieving accurate quantification.
- Prepare a Dilution Series: Create a minimum 5-point, 10-fold serial dilution of your cDNA template. Some protocols recommend 5-10 points for a robust curve [41] [42].
- Run qPCR in Replicate: Amplify each dilution point in at least triplicate to ensure statistical reliability [41].
- Generate the Standard Curve: Plot the log of the starting template concentration against the resulting Ct value for each dilution.
- Calculate Efficiency: The slope of the linear regression line through these points is used to calculate PCR efficiency (E) using the formula: E = -1 + 10^(-1/slope) [42].
- Target Values: The optimized assay should achieve an efficiency (E) of 100% ± 5% and a standard curve R² ≥ 0.9999 [40]. An ideal slope of -3.32 corresponds to 100% efficiency [42].
Table 1: Interpretation of Standard Curve Parameters
| Parameter | Ideal Value | Acceptable Range | Interpretation of Sub-Optimal Values |
|---|---|---|---|
| Efficiency (E) | 100% | 90% - 110% [42] | <90%: Inhibition or poor reactivity. >110%: Piperror, inhibitors, or primer dimers [43]. |
| Slope | -3.32 | -3.6 to -3.1 [41] | A slope of -3.1 ≈ 110% efficiency; -3.6 ≈ 90% efficiency [42]. |
| Correlation (R²) | 1.000 | >0.990 [41] | <0.990 indicates poor reproducibility or pipetting errors. |
Troubleshooting qPCR Efficiency
Even with careful design, efficiency can fall outside the desired range. The table below outlines common problems and solutions.
Table 2: Troubleshooting Guide for qPCR Efficiency
| Problem | Potential Causes | Recommended Solutions |
|---|---|---|
| Low Efficiency (<90%) | Poor primer design, PCR inhibitors, suboptimal reagent concentrations, or secondary structures [43]. | Redesign primers. Purify template DNA/RNA (A260/280 ~1.8-2.0). Adjust Mg²⁺ concentration. Use a hot-start polymerase. |
| High Efficiency (>110%) | Presence of PCR inhibitors in concentrated samples, primer-dimer formation, contamination, or inaccurate dilution series [43] [42]. | Dilute the template to reduce inhibition. Check for primer-dimers with melt curve analysis. Improve pipetting accuracy. Use a no-template control (NTC) to check for contamination. |
| Poor Standard Curve Linear (R² <0.99) | Pipetting errors, degradation of template in dilute samples, or high variability between replicates. | Calibrate pipettes. Prepare fresh dilution series. Use at least three replicates per dilution. |
A successful qPCR validation experiment relies on high-quality reagents and computational tools.
Table 3: Key Research Reagent Solutions for qPCR Validation
| Item | Function/Description | Examples / Notes |
|---|---|---|
| High-Fidelity DNA Polymerase | For initial amplification of template for standard curve. Ensures accurate cDNA synthesis. | Various commercial kits. |
| SYBR Green qPCR Master Mix | Provides all components (enzyme, dNTPs, buffer, dye) for efficient qPCR. | Choose mixes with inhibitor-resistant polymers. |
| Nuclease-Free Water | A critical solvent for all dilutions; must be free of contaminants. | |
| Primer Design Tools | Computational tools for designing sequence-specific primers. | Primer-BLAST, BatchPrimer3 [40]. |
| qPCR Efficiency Calculator | Online tools to compute efficiency and standard curve parameters from Ct values. | Cosmomath, Omni Calculator [41] [42]. |
Visualizing the Workflows
The following diagrams illustrate the logical relationship between RNA-seq and qPCR, as well as the stepwise qPCR optimization protocol.
Diagram 1: The RNA-Seq to qPCR Validation Pathway. This diagram shows how RNA-seq acts as a discovery tool to identify candidate differentially expressed genes (DEGs), which are then confirmed using the precision of an optimized qPCR assay.
Diagram 2: The Stepwise qPCR Assay Optimization Workflow. This flowchart outlines the sequential process of optimizing a qPCR assay, from initial primer design through to final validation. The cyclic arrow indicates that failure to meet the key parameters requires re-optimization, often starting again at the primer design stage.
The workflow for achieving R² ≥ 0.9999 and PCR efficiency of 100% ± 5% is a rigorous but attainable standard. It requires a methodical approach to primer design, grounded in an understanding of genome homology, followed by systematic optimization of reaction conditions. This level of precision transforms qPCR from a simple verification tool into a powerful, stand-alone method for definitive gene expression analysis. When applied to the validation of RNA-seq data, this optimized qPCR protocol provides the highest level of confidence, ensuring that key biological conclusions are supported by robust and reproducible experimental evidence.
Reverse Transcription Quantitative Polymerase Chain Reaction (RT-qPCR) remains the gold standard technique for gene expression analysis and is extensively used for validating results obtained from high-throughput transcriptomic studies like RNA sequencing (RNA-seq). Its superior sensitivity, specificity, and reproducibility make it an indispensable tool for researchers and drug development professionals focused on accurate gene quantification [29] [17]. The reliability of RT-qPCR data, however, is critically dependent on a meticulously optimized workflow—from initial cDNA synthesis to final data analysis using methods like the 2−ΔΔCq. This guide provides a detailed, evidence-based comparison of key methodological choices within the RT-qPCR pipeline, framing them within the context of validating RNA-seq findings to ensure robust and interpretable biological conclusions.
Core RT-qPCR Workflow: A Comparative Analysis of One-Step vs. Two-Step Methods
The foundational decision in any RT-qPCR experiment is choosing between a one-step or a two-step protocol. This choice has far-reaching implications for workflow efficiency, flexibility, and data accuracy, particularly when validating a limited number of targets from an RNA-seq experiment.
The diagram below illustrates the key procedural differences between these two approaches.
The table below provides a detailed comparison of these two methods to guide your selection.
| Parameter | One-Step RT-qPCR | Two-Step RT-qPCR |
|---|---|---|
| Workflow & Process | Reverse transcription (RT) and qPCR are combined in a single tube. [44] | RT and qPCR are performed in separate, sequential reactions. [44] |
| Key Advantages | • Minimal sample handling; reduced pipetting steps and risk of contamination. [45]• Faster setup; ideal for high-throughput screening of a few targets. [44] [45] | • Generates a stable cDNA archive usable for multiple PCRs. [44] [45]• Flexible priming (oligo(dT), random hexamers, gene-specific). [44]• Independent optimization of RT and qPCR reactions. [45] |
| Key Limitations & Considerations | • No cDNA archive: Must return to original RNA for new targets. [45]• Compromised reaction conditions can reduce efficiency. [45]• Higher risk of primer-dimer formation. [45] | • More hands-on time and greater risk of contamination from extra pipetting. [44]• Generally requires more total reagent volume. [45] |
| Ideal Application in RNA-seq Validation | Validating a small, predefined set of target genes across many RNA samples. [45] | Profiling a large number of target genes from a limited RNA source; provides material for future validation. [45] |
Critical Considerations for Experimental Design and Execution
Reverse Transcription and Primer Design
The reverse transcription step requires careful planning. Using total RNA is often recommended over mRNA for relative quantification because it involves fewer purification steps, ensures more quantitative recovery, and avoids skewed results from differential mRNA enrichment. [44] For priming the cDNA synthesis, a mixture of oligo(dT) and random primers is often optimal, as it can diminish the generation of truncated cDNAs and improve the efficiency for a broad range of transcripts. [44]
For the qPCR step, primers should be designed to span an exon-exon junction, with one primer potentially spanning the exon-intron boundary. This design is a critical control measure, as it prevents the amplification of contaminating genomic DNA. [44] Essential experimental controls include a no-reverse-transcriptase control (-RT control), which helps identify amplification from contaminating DNA. [44]
The Imperative of Normalization and Stable Reference Genes
Normalization is arguably the most critical factor for obtaining accurate and reproducible RT-qPCR data. It accounts for technical variations across samples (e.g., in RNA input, cDNA synthesis efficiency, and sample loading). The use of unstable reference genes for normalization is a primary source of unreliable results and misinterpretation of gene expression data. [29] [17]
Traditionally, housekeeping genes (e.g., GAPDH, ACTB, 18S rRNA) were used as reference genes. However, numerous studies have demonstrated that their expression can vary significantly under different experimental conditions, making them poor choices. [29] [17] Instead, reference genes must be validated for stability within the specific biological system and conditions under investigation. [17]
Strategies for Identifying Stable Normalizers
Multiple strategies exist for selecting appropriate normalizers, and their performance can vary.
- RNA-seq Data-Driven Selection: RNA-seq data itself is a powerful resource for identifying novel, stably expressed genes. A study on the tomato-Pseudomonas pathosystem used RNA-seq to identify genes with low variation coefficients across 37 conditions, leading to the discovery of ARD2 and VIN3 as superior normalizers compared to traditional genes like EF1α and GAPDH. [17]
- Bioinformatics Tools: The GSV (Gene Selector for Validation) software uses RNA-seq data (TPM values) to systematically identify optimal reference genes based on criteria including high expression and low variation across samples, effectively filtering out low-expression stable genes that are unsuitable for RT-qPCR. [30] [29]
- Comparative Performance of Normalization Methods: A 2025 study comparing normalization methods for circulating miRNA in non-small cell lung cancer (NSCLC) found that methods based on the mean (general or exclusive) and functional groups showed lower efficiency. In contrast, pairwise normalization and strategies using miRNA triplets and quadruplets provided the most robust results, with high accuracy, model stability, and minimal overfitting. [46]
The following diagram outlines a decision pathway for selecting a normalization strategy, incorporating these findings.
The 2–ΔΔCq Method and RNA-seq Validation
Framework for Validating RNA-seq with RT-qPCR
The 2–ΔΔCq method is a cornerstone of relative quantification in RT-qPCR, used to calculate the fold change in gene expression between experimental and control groups. [47] Its correct application is paramount when using RT-qPCR to validate RNA-seq results. The following framework outlines when this validation is most appropriate.
- When Validation is Recommended:
- To Satisfy Journal Reviewers: Confirming a key observation with an orthogonal technique like RT-qPCR is often necessary for manuscript publication, as it increases confidence in the findings. [4]
- When RNA-seq Data is from Few Replicates: If the original RNA-seq study had a low number of biological replicates, limiting statistical power, RT-qPCR on a larger sample set can robustly validate the expression changes of selected targets. [4]
- When Validation is Less Critical:
- When RNA-seq is a Discovery Tool: If the RNA-seq data is primarily used for hypothesis generation that will be tested further with functional assays (e.g., at the protein level), qPCR validation may be an unnecessary intermediate step. [4]
- When Follow-up RNA-seq is Planned: The most suitable validation for RNA-seq data can sometimes be a new, larger RNA-seq experiment on a fresh set of samples. [4]
For a rigorous validation, it is highly recommended to perform RT-qPCR on a new, independent set of RNA samples with proper biological replication, rather than just the same samples used for sequencing. This practice validates not only the technology but also the underlying biological response. [4]
Technology Comparison: RT-qPCR vs. Alternative Platforms
While RT-qPCR is a benchmark, other technologies exist for mRNA quantitation. A 2025 study provides a direct comparison between RT-qPCR and Branched DNA (bDNA) assay for quantifying mRNA lipid nanoparticle (mRNA-LNP) drug products in human serum. [48]
| Assay Characteristic | RT-qPCR (with purification) | Branched DNA (bDNA) |
|---|---|---|
| Quantitative Bias | Consistent negative bias (lower measured concentrations) [48] | Used as the reference method [48] |
| Concordance (R²) | 0.878 with bDNA [48] | 1 (Self) |
| Workflow | Requires RNA purification; more complex steps [48] | Simplified, direct measurement on sample [48] |
| Key Finding | Despite quantitative differences, derived pharmacokinetic (PK) parameters were comparable to bDNA, supporting its suitability for clinical mRNA quantification. [48] | The study established a cross-platform comparability, supporting RT-qPCR as a viable alternative. [48] |
Detailed Experimental Protocols
Protocol: Identification of Reference Genes from RNA-seq Data using GSV
This protocol is adapted from de Brito et al. (2024) in BMC Genomics. [29]
- Input Data Preparation: Prepare a file (.xlsx, .txt, or .csv) containing the gene expression matrix from your RNA-seq analysis. The expression values should be in TPM (Transcripts Per Million) format.
- Software Input: Load the TPM matrix into the GSV software.
- Apply Filtering Criteria: The software algorithm will apply the following sequential filters to identify reference candidate genes:
- Equation 1: TPM > 0 in all libraries. This ensures the gene is expressed in all samples.
- Equation 2: Standard Deviation (Log₂(TPM)) < 1. This selects genes with low expression variability.
- Equation 3: |Log₂(TPM) – Average(Log₂(TPM))| < 2. This removes genes with exceptionally high expression in any single library.
- Equation 4: Average(Log₂(TPM)) > 5. This ensures the gene has a high enough expression level for reliable detection by RT-qPCR.
- Equation 5: Coefficient of Variation (CV) < 0.2. This final filter selects genes with the most stable expression.
- Output: GSV generates a list of genes ranked as the most stable reference candidates, ready for experimental validation by RT-qPCR.
Protocol: Validating Normalizers and Performing the 2–ΔΔCq Calculation
This protocol is standard practice, as reflected in multiple sources. [44] [17] [47]
- cDNA Synthesis & Assay Validation:
- Synthesize cDNA from your RNA samples (using a two-step approach is recommended for flexibility).
- For each candidate reference gene and target gene, run a standard curve with serial dilutions of cDNA to determine amplification efficiency (E). The efficiency is calculated as E = 10^(–1/slope). An ideal efficiency is 100% (a slope of –3.32), with acceptable ranges typically between 90% and 110%.
- Stability Analysis of Candidate Reference Genes:
- Amplify your candidate reference genes across all experimental samples.
- Input the resulting Cq values into stability calculation algorithms such as GeNorm, NormFinder, or BestKeeper. These programs will rank the genes based on their expression stability, allowing you to select the most stable one or the optimal combination of two. [17] [47]
- Calculate Fold Change using the 2–ΔΔCq Method:
- Calculate the ΔCq for each sample: ΔCq = Cq (target gene) – Cq (reference gene).
- Calculate the ΔΔCq: ΔΔCq = ΔCq (test sample) – ΔCq (calibrator sample, e.g., control group average).
- Calculate the Fold Change: Fold Change = 2^(–ΔΔCq).
- If amplification efficiencies between the target and reference gene are not similar and close to 100%, use an efficiency-corrected formula for more accurate results.
The Scientist's Toolkit: Essential Research Reagent Solutions
| Reagent / Tool | Function / Description | Key Considerations |
|---|---|---|
| GSV Software [30] [29] | Identifies optimal reference and variable candidate genes from RNA-seq (TPM) data. | Filters genes based on expression level and stability; superior for removing low-expression stable genes compared to other tools. |
| One-Step RT-qPCR Master Mix | All-in-one reagent for combining reverse transcription and qPCR. | Ideal for high-throughput, limited target studies. Compromised conditions may reduce efficiency. [44] [45] |
| Two-Step RT-qPCR Reagents | Separate optimized kits for cDNA synthesis and qPCR. | Provides flexibility, allows creation of a cDNA archive, and enables independent reaction optimization. [44] [45] |
| Stability Analysis Algorithms (e.g., NormFinder, GeNorm, BestKeeper, BestmiRNorm) | Statistical tools to determine the most stable reference genes from Cq data. | BestmiRNorm allows assessment of more normalizers (up to 11) with user-defined weighting of evaluation criteria. [47] |
| Spike-in Controls (e.g., synthetic miRNAs) [47] | Exogenous controls added to the sample to monitor efficiency of RNA isolation and reverse transcription. | Crucial for standardizing pre-analytical steps, especially in circulating miRNA studies or when using complex sample matrices. |
Solving Common Challenges: Ensuring Accuracy and Reproducibility in Your Validation
The validation of RNA-Seq results through quantitative real-time PCR (RT-qPCR) is a critical step in gene expression analysis. This process, however, hinges on a fundamental component: the selection of appropriate reference genes for data normalization. Traditionally, reference genes are selected based on their presumed stable expression across biological conditions. The prevalent challenge has been the automatic selection of genes that exhibit stable expression patterns but at low expression levels, making them unsuitable for RT-qPCR validation due to the technique's detection limits. This article explores how the Gene Selector for Validation (GSV) software addresses this specific issue through its sophisticated filtering methodology, providing a more reliable foundation for transcriptome validation.
The Critical Role of Reference Genes in RNA-Seq Validation
RT-qPCR remains the gold standard for validating RNA-Seq data due to its high sensitivity, specificity, and reproducibility [49] [29]. The accuracy of this technique is profoundly dependent on using reference genes that are both highly expressed and stable across the biological conditions being studied [49]. Historically, researchers often selected reference genes based on their conventional status as housekeeping genes (e.g., actin, GAPDH) or ribosomal proteins, assuming consistent expression [49] [29]. However, substantial evidence now shows that the expression of these traditional reference genes can vary significantly under different biological conditions, leading to potential misinterpretation of gene expression data [49] [50].
The problem is particularly acute when stable but low-expression genes are selected as references. While these genes may demonstrate consistent expression patterns across samples, their low transcript abundance makes them difficult to detect reliably via RT-qPCR, potentially compromising assay sensitivity and accuracy [49]. This underscores the necessity for systematic approaches that consider both expression stability and abundance when selecting reference genes for validation studies.
GSV's Methodological Solution to the Reference Gene Problem
GSV addresses the reference gene problem through a sophisticated, criteria-based filtering system that specifically eliminates low-expression genes from consideration while identifying optimal candidates for RT-qPCR validation. The software operates on Transcripts Per Million (TPM) values derived from RNA-Seq data, providing a standardized metric for cross-sample comparison [49] [51].
Algorithmic Workflow and Filtering Criteria
The GSV algorithm implements a multi-stage filtering process adapted from methodologies established by Eisenberg and Levanon and later modified by Yajuan Li et al. [49] [52]. For reference gene identification, GSV applies these specific criteria sequentially:
Table 1: GSV Filtering Criteria for Reference Gene Selection
| Criterion | Mathematical Expression | Purpose | Threshold Value |
|---|---|---|---|
| Ubiquitous Expression | (TPMi)i=an > 0 | Ensures expression across all samples | > 0 |
| Low Variability | σ(log2(TPMi)i=an) < 1 | Selects genes with stable expression | < 1 |
| No Exceptional Expression | |log2(TPMi)i=an - log2TPM| < 2 | Eliminates genes with outlier expression | < 2 |
| High Expression Level | log2TPM > 5 | Prevents selection of low-expression genes | > 5 |
| Low Coefficient of Variation | σ(log2(TPMi)i=an) / log2TPM < 0.2 | Ensures consistent expression relative to mean | < 0.2 |
The fourth criterion (average log2TPM > 5) is particularly crucial as it establishes a minimum expression threshold that effectively filters out stable genes expressed at low levels, ensuring selected reference genes have sufficient transcript abundance for reliable RT-qPCR detection [49].
The logical workflow of GSV's filtering process for both reference and validation genes can be visualized as follows:
Diagram 1: GSV's sequential filtering workflow for identifying reference genes. The critical step excluding low-expression genes is highlighted in red.
Comparative Performance: GSV vs. Alternative Tools
To validate its effectiveness, GSV has been systematically compared against established reference gene selection tools such as GeNorm, NormFinder, and BestKeeper [49]. These comparative analyses reveal distinct advantages in GSV's approach, particularly regarding its handling of RNA-Seq data and exclusion of low-expression genes.
Key Differentiating Factors
Unlike traditional tools, GSV is specifically designed to process RNA-Seq quantification data (TPM values), while alternatives like GeNorm and BestKeeper were developed for RT-qPCR data and can only analyze limited gene sets [49]. More importantly, GSV is unique in implementing automatic filtering of stable low-expression genes, a critical feature absent in other software [49]. This prevents the selection of genes that, while stable, would be unsuitable for RT-qPCR due to detection limitations.
Table 2: Software Comparison for Reference Gene Selection
| Software | Input Data Type | Maximum Gene Set | Filters Low-Expression Genes | Primary Analysis Method |
|---|---|---|---|---|
| GSV | RNA-Seq (TPM values) | Unlimited | Yes | Filtering-based algorithm |
| GeNorm | RT-qPCR (Cq values) | Limited | No | Pairwise comparison |
| NormFinder | RT-qPCR (Cq values) | Limited | No | Model-based approach |
| BestKeeper | RT-qPCR (Cq values) | Limited | No | Correlation analysis |
| OLIVER | Microarray/RT-qPCR | Unlimited | No | Pairwise comparison |
The performance superiority of GSV was demonstrated using synthetic datasets, where it effectively removed stable low-expression genes from reference candidate lists while successfully generating variable-expression validation lists [49].
Experimental Validation: Case Study in Aedes aegypti
The practical utility of GSV was demonstrated through application to a real-world Aedes aegypti transcriptome dataset [49] [29]. In this experimental validation:
Methodology
GSV processed transcriptome quantification tables containing TPM values for the mosquito species. The software applied its standard filtering criteria to identify optimal reference genes. The top-ranked reference candidates selected by GSV were subsequently validated using RT-qPCR analysis to confirm their expression stability.
Results and Findings
GSV identified eiF1A and eiF3j as the most stable reference genes in the analyzed samples [49]. Traditional mosquito reference genes, including ribosomal proteins commonly used in prior studies, demonstrated inferior stability compared to GSV's selections. This finding highlights the risk of inappropriate reference gene choices when using traditional selection methods and validates GSV's capacity to identify more reliable normalization genes.
The successful application to a meta-transcriptome dataset with over 90,000 genes further demonstrated GSV's computational efficiency and scalability [49].
Implementation and Research Applications
Practical Implementation
GSV is implemented in Python using the Pandas, Numpy, and Tkinter libraries, with a user-friendly graphical interface that eliminates command-line interaction [49] [51]. The software accepts multiple input formats (.csv, .xls, .xlsx, .sf) and provides both reference genes (stable, high-expression) and validation genes (variable, high-expression) as outputs [51].
For researchers, GSV is available as a pre-compiled executable for Windows 10 systems, requiring no Python installation or computational expertise [51]. While the software recommends standard cutoff values for optimal performance, users can adjust these parameters through the interface to accommodate specific research requirements [49].
Integration in the Research Workflow
The broader context of RNA-Seq validation necessitates specialized tools for different stages of the experimental process. The following diagram illustrates how GSV integrates with other specialized tools in a complete validation workflow:
Diagram 2: Integrated workflow showing GSV's role in selecting reference genes for RT-qPCR validation, with OLIVER processing the resulting expression data.
Essential Research Reagents and Tools
Table 3: Key Research Reagents and Computational Tools for RNA-Seq Validation
| Tool/Reagent | Function/Purpose | Implementation Notes |
|---|---|---|
| GSV Software | Selects optimal reference/validation genes from RNA-Seq data | Python-based with GUI; processes TPM values |
| OLIVER Software | Analyzes RT-qPCR and microarray results for variable expression | Complementary tool for processing experimental results |
| Salmon | Quantifies transcript abundance from RNA-Seq data | Generates .sf files compatible with GSV |
| RT-qPCR Assays | Validates gene expression patterns | Requires reference genes with sufficient expression |
| TPM Normalization | Standardizes gene expression across samples | Preferred over RPKM for cross-sample comparison |
The selection of appropriate reference genes remains a critical challenge in the validation of RNA-Seq data using RT-qPCR. The GSV software effectively addresses the prevalent issue of selecting stable but low-expression genes through its sophisticated filtering methodology, which incorporates both expression stability and abundance criteria. By automatically excluding genes with insufficient expression levels, GSV ensures selected reference candidates are suitable for RT-qPCR detection, thereby enhancing the reliability of gene expression validation studies. Its demonstrated performance in comparative analyses and real-world applications positions GSV as a valuable tool for researchers seeking to improve the accuracy of their transcriptomic studies, particularly in the context of drug development and molecular biology research where validation rigor is paramount.
The validation of RNA sequencing (RNA-Seq) results has long represented a significant bottleneck in transcriptomic studies. Quantitative PCR (qPCR) traditionally serves as the orthogo nal validation method, but conventional experimental designs often necessitate separate assays for standard curves and technical replicates, consuming valuable resources. Within this context, the dilution-replicate experimental design emerges as a powerful yet underutilized methodology that simultaneously reduces experimental costs and minimizes technical errors. This guide provides an objective comparison of this innovative approach against traditional qPCR validation protocols, supported by experimental data and detailed methodologies for implementation in research and drug development settings.
The Critical Role of qPCR in Validating RNA-Seq Findings
Despite RNA-Seq's status as the gold standard for transcriptome-wide expression profiling, independent validation remains crucial, particularly for genes with low expression levels or subtle fold-changes where RNA-Seq may produce unreliable results.
Key Reasons for Validation
- Technical Verification: RNA-Seq and qPCR exhibit excellent correlation for most genes, but a small fraction (approximately 1.8%) show severe non-concordance, particularly among lower-expressed and shorter transcripts [19].
- Biological Confirmation: qPCR enables testing identified expression differences in additional biological samples, confirming generalizability beyond the original RNA-Seq cohort [10].
- Methodological Limitations: Studies have documented high false-positivity rates with Cuffdiff2 and high false-negativity rates with DESeq2 and TSPM in RNA-Seq analysis, highlighting the need for verification [1].
Table 1: Correlation Between RNA-Seq and qPCR Expression Measurements
| Metric | Correlation Range | Factors Influencing Concordance |
|---|---|---|
| Expression Intensity | R² = 0.798-0.845 (Pearson) [23] | Lower for genes with minimal expression |
| Fold Change | R² = 0.927-0.934 (Pearson) [23] | Discrepancies most common with ΔFC < 2 |
| Non-Concordant Genes | 15.1-19.4% of tested genes [23] | Typically low-expressed or short transcripts |
The Dilution-Replicate Design: Principles and Advantages
The dilution-replicate method represents a significant departure from traditional qPCR experimental designs, integrating efficiency determination directly into the experimental samples rather than relying on separate standard curves.
Core Methodology
The dilution-replicate approach requires preparing three tubes with serial dilutions (typically fivefold) of each cDNA preparation. Each biological replicate/primer pair combination requires three wells on a qPCR plate containing step-wise reduced cDNA amounts from these dilutions. This design eliminates the need for separate standard curve wells while guaranteeing that sample Cq values fall within the linear dynamic range of the dilution-replicate standard curves [53].
Comparative Workflow Analysis
Diagram Title: Traditional vs. Dilution-Replicate qPCR Workflow Comparison
Efficiency and Cost Analysis
The dilution-replicate design offers substantial advantages in resource utilization. A single 96-well plate can accommodate 32 biological replicate/primer pair combinations (3 wells each) without dedicating wells to separate standard curves. This represents a 25-30% increase in throughput compared to traditional designs that typically require 20-25% of wells for standard curves and additional wells for technical replicates [53].
Experimental Protocol: Implementing the Dilution-Replicate Design
Sample Preparation
- RNA Extraction and Quality Control: Extract total RNA using appropriate kits (e.g., RNeasy Universal kit). Verify RNA quality using spectrophotometry (A260/A280 ≈ 2.0) and analyze integrity (RIN score ≥ 9 recommended) [6].
- cDNA Synthesis: Perform reverse transcription with validated enzymes and protocols.
- Serial Dilution Preparation: Prepare three tubes with fivefold serial dilutions of each cDNA preparation using properly calibrated pipettes to prevent introduction of bias.
qPCR Setup and Run Parameters
- Plate Setup: For each biological replicate/primer pair combination, allocate three wells containing the different cDNA dilutions.
- Control Reactions: Include no-template controls (NTC), no-reverse transcription controls, and genomic DNA controls with identical replication.
- Amplification Parameters: Use manufacturer-recommended cycling conditions with a common threshold setting for all genes being compared.
Data Analysis with repDilPCR
The repDilPCR tool automates the analysis of dilution-replicate data through multiple linear regression of standard curves derived from experimental samples [53].
Table 2: Key Software Tools for Dilution-Replicate Analysis
| Tool | Primary Function | Advantages |
|---|---|---|
| repDilPCR | Automated analysis of dilution-replicate data | Implements multiple linear regression; supports multiple reference genes |
| Standard Curve Methods | Efficiency determination from separate dilutions | Familiar to most researchers; widely implemented in instrument software |
| Linear/Non-linear Models | Curve fitting on individual amplification curves | Does not require separate standard curves; complex implementation |
Performance Comparison: Dilution-Replicate vs. Traditional Designs
Accuracy and Precision Metrics
Studies comparing the dilution-replicate method to traditional approaches have demonstrated equivalent or superior performance in several key areas:
- Efficiency Determination: The dilution-replicate method determines efficiency from all experimental samples, increasing precision with sample number, whereas traditional methods rely on a single standard curve [53].
- Dynamic Range Assurance: The design guarantees that sample Cq values fall within the linear dynamic range of the standard curves, eliminating the need for repeat experiments with different dilutions.
- Technical Variance Control: The dilution series inherently controls for technical variance while simultaneously determining amplification efficiency.
Resource Utilization
Diagram Title: Plate Space Utilization Comparison
The Scientist's Toolkit: Essential Research Reagents and Materials
Table 3: Key Research Reagent Solutions for Dilution-Replicate Experiments
| Reagent/Material | Function | Implementation Notes |
|---|---|---|
| High-Quality RNA Extraction Kit (e.g., RNeasy) | Isolation of intact RNA from biological samples | Critical for obtaining reliable cDNA; verify RIN scores |
| Reverse Transcriptase Enzyme | cDNA synthesis from RNA templates | Use consistent batches across experiments |
| qPCR Master Mix with Intercalating Dye | Fluorescence-based amplification detection | SYBR Green provides cost-effective option for multiple targets |
| Validated Primer Pairs | Target-specific amplification | Verify efficiency and specificity before experimental use |
| Calibrated Precision Pipettes | Accurate serial dilution preparation | Critical for preventing introduction of bias in dilution steps |
| Optical qPCR Plates and Seals | Reaction vessel for amplification | Ensure compatibility with thermal cycler and detection system |
| repDilPCR Software | Automated data analysis | Implements multiple linear regression for efficiency calculation |
Integration with RNA-Seq Validation Workflows
The dilution-replicate method fits strategically within comprehensive RNA-Seq validation pipelines, particularly when researchers need to verify multiple candidate genes across numerous samples.
Strategic Implementation
- Candidate Gene Verification: When RNA-Seq identifies tens to hundreds of differentially expressed genes, the dilution-replicate design enables cost-effective verification across multiple biological replicates.
- Reference Gene Validation: While RNA-Seq has been proposed to identify stable reference genes, robust statistical approaches applied to conventional candidate genes often yield equivalent results without the need for sequencing [6].
- Power Considerations: RNA-Seq studies benefit more from additional biological replicates than deeper sequencing once sufficient depth (~10M reads) is achieved [54]. The dilution-replicate design aligns with this principle by enabling more biological replication within fixed resource constraints.
Experimental Design Considerations
For researchers planning RNA-Seq validation studies, several factors warrant consideration:
- Sample Size Planning: Ensure sufficient biological replicates (independent RNA extracts) rather than technical replication to address biological variability.
- Gene Selection Priority: Focus validation efforts on genes with shorter transcript lengths, lower expression levels, or subtle fold-changes where RNA-Seq may produce less reliable results.
- Resource Allocation: The cost savings from dilution-replicate designs can be redirected toward increased biological replication, enhancing statistical power.
The dilution-replicate experimental design represents a significant advancement in qPCR methodology that directly addresses the efficiency and accuracy challenges inherent in RNA-Seq validation. By integrating standard curve generation directly into experimental samples, this approach reduces resource consumption while simultaneously improving technical reliability. For researchers and drug development professionals validating transcriptomic findings, adopting this methodology enables more biologically robust verification within practical resource constraints. As the field continues to emphasize reproducibility and efficiency, the dilution-replicate design stands as a powerful tool for optimizing gene expression validation workflows.
Accurate gene expression quantification is foundational to modern biological research and drug development. While RNA sequencing (RNA-seq) provides a comprehensive, high-throughput platform for transcriptome analysis, its results require rigorous validation, particularly for complex gene families. Quantitative PCR (qPCR) has long served as the trusted method for this confirmation. However, the process is not straightforward. This guide objectively compares the performance of these technologies, focusing on a critical challenge: the accurate quantification of polymorphic genes. Such genes, including the highly variable Human Leukocyte Antigen (HLA) family, are prone to technology-specific biases in RNA-seq due to cross-alignment and reference mapping issues. Understanding these biases and implementing robust validation protocols is essential for generating reliable data to support scientific and regulatory decisions.
Performance Comparison: RNA-seq vs. qPCR for Expression Quantification
Overall, RNA-seq and qPCR show strong concordance for quantifying the expression of standard protein-coding genes. However, this correlation weakens significantly for specific gene types, notably polymorphic genes and small RNAs.
| Performance Metric | RNA-seq Performance | qPCR Performance | Supporting Data |
|---|---|---|---|
| Overall Correlation | High correlation with qPCR for most genes (e.g., R² ≈ 0.82-0.93 for fold-changes) [5]. | Considered the benchmark for validation [5] [1]. | MAQC/SEQC consortium data; comparison of Tophat-HTSeq, STAR, Kallisto, Salmon [5] [55]. |
| Performance with Polymorphic HLA Genes | Moderate correlation with qPCR (e.g., Spearman's rho 0.2–0.53 for HLA-A, -B, -C) [9]. Lower accuracy due to cross-alignment and reference bias. | High specificity and accuracy when allele-specific primers/probes are used [56] [27]. | Direct comparison of RNA-seq (HLA-tailored pipeline) and qPCR on PBMCs from 96 individuals [9]. |
| Performance with Short/Low-Abundance RNAs | Accuracy decreases for short and lowly-expressed genes; alignment-free tools (Salmon, Kallisto) are particularly affected [57]. | High sensitivity and accuracy, not dependent on transcript length for quantification [58] [57]. | Benchmarking using total RNA-seq data enriched for small non-coding RNAs [57]. |
| Differential Expression Analysis | Varies by software; edgeR showed higher sensitivity & specificity (76.7% and 91.0%) in one study. Cuffdiff2 had high false-positivity (60.8%) [1]. | Used as the validation standard. High positive predictive value when methods are optimized [1]. | Experimental validation of Cuffdiff2, edgeR, DESeq2, and TSPM on mouse amygdalae samples [1]. |
| Key Limitations | Cross-alignment in gene families, reference genome bias, underestimation of fold-changes, difficulty with small RNAs [9] [57]. | Limited multiplexing, requires prior knowledge of sequences, sensitive to primer/probe design [27] [58]. |
Experimental Protocols for Benchmarking and Validation
To ensure the accuracy of RNA-seq data, especially for problematic gene sets, a rigorous experimental workflow for qPCR validation is essential. The following protocols are based on established methods from the cited literature.
Protocol 1: QPCR Validation of RNA-Seq Results for Polymorphic Genes
This protocol is adapted from studies comparing HLA gene expression between RNA-seq and qPCR [9].
- Sample Preparation: Use the same RNA sample for both RNA-seq and qPCR assays to eliminate biological variation. For the HLA study, RNA was extracted from freshly isolated Peripheral Blood Mononuclear Cells (PBMCs) using the RNeasy Universal kit (Qiagen) and treated with DNase [9].
- Primer and Probe Design for Polymorphic Genes:
- Design Strategy: Employ an allele-specific approach, such as the Amplification Refractory Mutation System (ARMS) [56] [27]. Design primers such that the 3'-terminal nucleotide is complementary to the specific allele variant you wish to detect.
- Specificity Check: Use tools like NCBI's Primer-BLAST to check specificity against the host genome. For genes like HLA, targeting a unique exon-exon junction or the junction between the transgene and a vector-specific untranslated region can confer specificity [27].
- Empirical Validation: Test at least three candidate primer/probe sets and validate their specificity empirically by running qPCR on naïve genomic DNA and relevant biological matrices to ensure no off-target amplification [27] [9].
- qPCR Setup and Execution:
- Reaction: Use a hydrolysis probe (TaqMan) chemistry for higher specificity. Each reaction should include the allele-specific forward primer, a common reverse primer, and a common dual-labeled probe [56].
- Quantification Method: Use the standard ΔΔCt method for relative quantification. Include a locus-individualized reference system for accurate quantification [56].
- Data Correlation Analysis: Compare the log fold-change values obtained from RNA-seq and qPCR for the genes of interest. A moderate correlation (e.g., rho ~0.2-0.53) may indicate persistent technical biases in RNA-seq for highly polymorphic genes, even with improved pipelines [9].
Protocol 2: Benchmarking RNA-seq Workflows with qPCR
This broader protocol is derived from large-scale benchmarking efforts like the MAQC/SEQC projects [5] [55].
- Reference Samples: Utilize well-characterized reference RNA samples. The MAQC/SEQC project used Universal Human Reference RNA (UHRR, Sample A) and Human Brain Reference RNA (HBRR, Sample B), spiked with synthetic RNA controls (ERCC) [5] [55].
- RNA-seq Data Processing: Process raw sequencing data through multiple workflows for comparison. Common workflows include:
- Data Normalization and Alignment: For a fair comparison, align the transcripts detected by qPCR with those quantified by RNA-seq. For transcript-level workflows (Cufflinks, Kallisto, Salmon), aggregate transcript-level TPM values to the gene level. Filter genes based on a minimal expression threshold (e.g., >0.1 TPM) in all samples and replicates [5].
- Concordance Analysis:
- Expression Correlation: Calculate Pearson correlation between log-transformed RNA-seq values (TPM) and normalized qPCR Cq-values [5].
- Fold-Change Correlation: Calculate gene expression fold changes between two distinct samples (e.g., MAQCA vs. MAQCB) and evaluate the correlation of these fold changes between RNA-seq and qPCR. This is the most relevant metric for most research applications [5].
Visualizing the Workflow and Technical Challenges
The following diagrams illustrate the core experimental workflow for method validation and the specific technical challenges of quantifying polymorphic genes.
Experimental Workflow for RNA-seq and qPCR Comparison
Technical Challenges in Polymorphic Gene Quantification
The Scientist's Toolkit: Key Research Reagent Solutions
Successful execution of these validation experiments requires careful selection of reagents and tools. The following table details essential materials and their functions.
Table 2: Essential Research Reagents and Tools
| Item | Function/Description | Example Use Case |
|---|---|---|
| Reference RNA Samples | Standardized, well-characterized RNA samples (e.g., UHRR, HBRR) for cross-platform and cross-laboratory benchmarking [5] [55]. | MAQC/SEQC project benchmarking; internal workflow validation [5]. |
| ERCC Spike-In Controls | Synthetic RNA transcripts with known concentrations spiked into samples to assess technical accuracy, dynamic range, and fold-change recovery of the RNA-seq workflow [55]. | Assessing pipeline performance in differential expression analysis [55] [57]. |
| Allele-Specific qPCR Primers/Probes | Primers designed with the 3' end matching a specific SNP/allele, enabling highly specific amplification of polymorphic targets within a gene family using ARMS technology [56] [27]. | Quantifying specific HLA allelic expression or vector-derived transgenes against an endogenous background [27] [9]. |
| HLA-Tailored Bioinformatics Pipelines | Specialized computational tools (e.g., from Boegel et al., Lee et al., Aguiar et al.) that account for HLA diversity during alignment, minimizing reference bias and cross-mapping for more accurate expression estimation [9]. | Generating RNA-seq expression estimates for HLA genes that are more comparable to qPCR data [9]. |
| DNase Treatment Kit | Removes contaminating genomic DNA from RNA samples prior to qPCR, preventing false positive amplification and ensuring that signal derives only from cDNA [9]. | Standard step in RNA purification for qPCR, as used in HLA expression study [9]. |
The comparison between RNA-seq and qPCR is not about declaring a universal winner but about understanding their complementary strengths and limitations. For the vast majority of protein-coding genes, RNA-seq workflows show excellent concordance with qPCR data, validating their use for transcriptome-wide discovery. However, for specific challenges—most notably the quantification of polymorphic gene families like HLA—technology-specific biases in RNA-seq remain a significant hurdle. These biases, stemming from cross-alignment and reference mapping issues, can lead to inaccurate expression estimates.
Therefore, the key takeaway is that the choice of technology and the necessity for validation are highly context-dependent. For researchers working with polymorphic genes or requiring the highest possible accuracy for a limited set of targets, qPCR with carefully designed allele-specific assays remains the gold standard. The experimental protocols and toolkit provided here offer a roadmap for rigorously benchmarking performance and ensuring that genomic data, which forms the basis for critical research and drug development decisions, is both robust and reliable.
While the MIQE (Minimum Information for Publication of Quantitative Real-Time PCR Experiments) guidelines provide an essential foundation for reporting qPCR experiments, researchers validating RNA-Seq data face the complex challenge of implementing practical checks to ensure assay specificity and sensitivity. The MIQE guidelines were established to standardize reporting and ensure reproducibility, yet a significant guidance void remains for the daily development and validation of robust assays supporting critical applications in drug development [59] [60]. This gap is particularly evident in the field of cell and gene therapy, where regulatory documents specify required sensitivity for preclinical biodistribution assays but leave criteria for accuracy, precision, and repeatability undefined [59]. This article explores practical strategies that go beyond MIQE checklists to address the nuanced technical challenges in qPCR assay validation, providing a framework for researchers to generate reliable, reproducible data that stands up to regulatory scrutiny.
Establishing a Fit-for-Purpose Validation Framework
Understanding Context of Use and Fit-for-Purpose Principles
The foundation of any robust qPCR validation strategy begins with understanding its Context of Use (COU) and implementing fit-for-purpose principles [61] [27]. The COU is a structured framework that defines what aspect of a biomarker is measured, the clinical purpose of the measurements, and how the results will be interpreted for decision-making [61]. Fit-for-purpose validation means the level of analytical rigor is sufficient to support the specific COU, whether for research use only, clinical research, or in vitro diagnostics [61].
For RNA-Seq validation, the COU typically falls into the clinical research category, requiring more rigorous validation than basic research but not necessarily reaching the level of FDA-approved in vitro diagnostics. This intermediate level demands careful consideration of which MIQE elements require stricter adherence and additional checks to ensure results are biologically meaningful and technically reproducible [61].
Defining Analytical Performance Metrics
Practical assay validation requires moving beyond theoretical definitions to implementable metrics for key analytical parameters:
- Analytical Specificity: The ability of an assay to distinguish target from non-target analytes [61]. In practice, this extends beyond primer design to comprehensive testing against related sequences and potential interferents.
- Analytical Sensitivity: Typically defined as the limit of detection (LOD), or the minimum detectable concentration of the analyte [61]. Practical validation requires establishing this with statistical confidence across multiple experiments.
- Accuracy and Precision: Accuracy (closeness to true value) and precision (closeness of repeated measurements) form the foundation of reliable quantification [61]. While MIQE mentions these concepts, practical implementation requires protocol-specific acceptance criteria.
- PCR Efficiency: A critical parameter affecting quantification accuracy, with optimal ranges between 90%-110% [59] [27]. Practical validation requires testing efficiency in the presence of actual sample matrix, which can profoundly impact performance.
Table 1: Fit-for-Purpose Validation Levels Based on Context of Use
| Validation Parameter | Research Use Only | Clinical Research | In Vitro Diagnostics |
|---|---|---|---|
| Specificity Testing | Against basic genomic DNA | Against full panel of related sequences | Regulatory-approved panels |
| LOD Determination | Single experiment | Statistical with confidence levels | FDA/EMA prescribed methods |
| Precision Requirements | <25% CV | <20-30% CV depending on analyte | <15-20% CV with strict criteria |
| Sample Size | Minimal replicates | 3-5 independent experiments | Large-scale multi-site studies |
| Documentation | Laboratory notebook | Comprehensive study reports | Regulatory submission packages |
Practical Strategies for Specificity Verification
Enhanced Primer and Probe Design Considerations
While MIQE recommends reporting primer and probe sequences, practical specificity assurance begins during design. Probe-based qPCR (e.g., TaqMan) offers superior specificity compared to dye-based methods (e.g., SYBR Green) due to reduced false-positive signaling from non-specific amplification [59]. For regulated bioanalysis, designing at least three unique primer-probe sets and empirically testing them provides insurance against failed optimization [59] [27].
Practical strategies for specificity assurance include:
- Junction-Targeting Designs: For distinguishing vector-derived transcripts from endogenous genes, target primer or probe sequences to exon-exon junctions or the junction between the transgene and vector-specific elements (e.g., promoter/UTR regions) [27].
- In Silico Specificity Screening: Using tools like NCBI Primer-BLAST to check specificity against host genome/transcriptome, with empirical confirmation in naïve host tissues [27].
- Multiplexing Capability: Probe-based qPCR enables multiplexing with different fluorophores, allowing simultaneous detection of multiple targets in the same reaction while conserving sample material [59].
Comprehensive Experimental Specificity Testing
Beyond design, practical specificity validation requires experimental evidence:
- Cross-Reactivity Testing: Test amplification against a panel of related sequences, including isoforms, family members, and processed pseudogenes [27].
- Matrix Interference Assessment: Test specificity in the presence of biological matrix (e.g., gDNA or total RNA from naïve tissues) to identify non-specific amplification in relevant backgrounds [59].
- Melting Curve Analysis: For dye-based qPCR, perform melting curve analysis to ensure primer dimerization isn't occurring and a single specific product is amplified [59].
- No-Template and Minus-RT Controls: Include robust negative controls to detect contamination or genomic amplification [62].
The following workflow illustrates a comprehensive specificity validation approach:
Advanced Sensitivity and Limit of Detection Determination
Practical LOD Establishment
While MIQE recommends establishing detection limits, practical LOD determination requires a statistical approach. The limit of detection represents the lowest concentration at which the analyte can be reliably detected with specified confidence [61]. Practical approaches include:
- Dilution Series with Statistical Confidence: Prepare serial dilutions of the target (typically 5-10 replicates per dilution) and determine the concentration where 95% of replicates test positive [27].
- Matrix-Matched Standards: Dilute standards in the same matrix as samples (e.g., naïve tissue gDNA) to account for potential inhibition effects on sensitivity [59].
- Multi-Day Validation: Establish LOD across multiple experiments and operators to determine inter-assay variability and ensure robustness.
Addressing Sensitivity Challenges in Complex Matrices
Sensitivity claims based on buffer-spiked samples often fail in real-world applications. Practical sensitivity verification requires:
- Inhibition Testing: Include an internal control to monitor PCR inhibition in each reaction, especially when using complex matrices [59] [63].
- Sample Quality Impact Assessment: Evaluate how RNA integrity (e.g., RIN values) impacts detection sensitivity, establishing minimum quality thresholds for reliable results [62].
- Platform Comparison: Consider digital PCR (dPCR) for absolute quantification when maximal sensitivity is required, as dPCR is less affected by PCR efficiency variations and can provide more precise low-copy number quantification [27].
Table 2: Sensitivity and Precision Acceptance Criteria for Fit-for-Purpose Validation
| Performance Characteristic | Experimental Approach | Acceptance Criteria |
|---|---|---|
| Limit of Detection (LOD) | 10 replicates of dilution series | ≥95% detection at LOD |
| Limit of Quantification (LOQ) | 5 replicates across 3 runs | CV ≤25-30% at LOQ |
| Precision (Repeatability) | 5 replicates within run | CV ≤20% for high copies, ≤25% for mid, ≤30% near LOQ |
| Precision (Intermediate Precision) | 3 runs, 2 operators, 3 days | CV ≤25% for high copies, ≤30% for mid, ≤35% near LOQ |
| PCR Efficiency | Standard curve with 5-6 points | 90-110% with R² ≥0.98 |
| Dynamic Range | Serial dilutions spanning expected concentrations | 3-5 logs with consistent efficiency |
Implementing Robust Reference Genes for Normalization
Moving Beyond Traditional Housekeeping Genes
A critical vulnerability in RNA-Seq validation is inappropriate reference gene selection. Traditional housekeeping genes (e.g., GAPDH, ACTB, 18S rRNA) demonstrate significant expression variability across different biological conditions, potentially compromising quantification accuracy [49] [64]. Practical approaches include:
- RNA-Seq Informed Selection: Use RNA-Seq data itself to identify stably expressed genes specific to your experimental system, as demonstrated in tomato-Pseudomonas pathosystem studies [65].
- Multi-Gene Normalization: Employ at least three validated reference genes instead of relying on a single gene, using geometric mean averaging for improved accuracy [64].
- Algorithmic Validation: Utilize tools like geNorm, NormFinder, and BestKeeper to statistically evaluate reference gene stability in specific experimental conditions [49] [65].
Computational Tools for Reference Gene Selection
Emerging computational tools leverage RNA-Seq data to systematically identify optimal reference genes:
- GSV (Gene Selector for Validation): Specifically designed to identify reference candidates from transcriptome data using criteria including expression stability (standard variation <1), absence of exceptional expression patterns, and sufficient expression levels (average log2 expression >5) [49].
- Stability Ranking: Algorithms that rank genes by coefficient of variation, selecting those with lowest variation across experimental conditions [65].
The following workflow illustrates the integration of RNA-Seq data with reference gene validation:
Experimental Protocols for Validation
Standard Curve and PCR Efficiency Protocol
Purpose: To establish quantitative range, PCR efficiency, and linear dynamic range [59] [27].
Materials:
- Reference standard DNA (typically plasmid containing target sequence)
- Biological matrix (gDNA or total RNA from naïve tissue)
- qPCR master mix (probe-based recommended)
- Sequence-specific primers and probe
- Real-time PCR instrument (e.g., QuantStudio 7 Flex)
Procedure:
- Prepare serial dilutions of reference standard (typically 10^1-10^8 copies) in matrix DNA (1000 ng) to mimic sample conditions [59].
- Include 1000 ng of matrix DNA in each standard and QC sample reaction to account for potential inhibition [59].
- Run qPCR reactions with thermal cycling: 10 min at 95°C (enzyme activation), followed by 40 cycles of 15 sec at 95°C (denaturation) and 30-60 sec at 60°C (annealing/extension) [59].
- Calculate PCR efficiency using the slope of the standard curve: Efficiency = [10^(-1/slope)] - 1 [59].
- Accept runs with efficiency between 90-110% and R² ≥0.98 [27].
Specificity Verification Protocol
Purpose: To experimentally verify assay specificity and absence of cross-reactivity [27] [66].
Materials:
- Test samples containing potential cross-reactants (related sequences, isoforms)
- Naïve biological matrices from relevant species
- No-template controls (NTC) and minus-RT controls
Procedure:
- Test amplification against genomic DNA from naïve host tissues (species-specific for non-clinical and clinical applications) [27].
- Include closely related sequences (e.g., gene family members, processed pseudogenes) in specificity panel.
- For RNA assays, include minus-RT controls to detect genomic DNA contamination.
- Analyze melt curves for dye-based qPCR to verify single amplification product.
- For probe-based assays, verify no amplification in NTC and specific amplification in positive controls.
Research Reagent Solutions
Table 3: Essential Reagents and Solutions for qPCR Validation
| Reagent Category | Specific Examples | Function in Validation |
|---|---|---|
| qPCR Master Mixes | TaqMan Universal Master Mix II, SYBR Green Master Mix | Provides optimized reaction components for efficient amplification |
| Reference Standards | Plasmid DNA, in vitro transcribed RNA, synthetic gBlocks | Enables absolute quantification and standard curve generation |
| Primer/Probe Design Tools | PrimerQuest, Primer Express, Geneious, Primer3 | Facilitates in silico design and specificity prediction |
| RNA Quality Assessment | Agilent Bioanalyzer, TapeStation, Qubit Fluorometer | Determines RNA integrity and quantity for reliable reverse transcription |
| Reverse Transcription Kits | High-Capacity cDNA Reverse Transcription Kit | Converts RNA to cDNA with high efficiency and minimal bias |
| Digital PCR Platforms | Bio-Rad QX200, Thermo Fisher QuantStudio 3D | Provides absolute quantification without standard curves for comparison |
| Reference Gene Validation Software | geNorm, NormFinder, BestKeeper, GSV | Statistically evaluates candidate reference gene stability |
Effective validation of qPCR assays for RNA-Seq confirmation requires moving beyond MIQE's reporting framework to implement practical, comprehensive checks for specificity and sensitivity. By adopting a fit-for-purpose approach that includes rigorous experimental specificity testing, statistical LOD determination, RNA-Seq informed reference gene selection, and standardized experimental protocols, researchers can generate reliable, reproducible data that stands up to both scientific and regulatory scrutiny. The practical strategies outlined herein provide a roadmap for developing robust validation workflows that ensure qPCR results accurately reflect biological reality rather than technical artifacts, ultimately strengthening the conclusions drawn from RNA-Seq validation studies.
Measuring Success: A Framework for Correlating RNA-Seq and qPCR Results
RNA sequencing (RNA-seq) has become the gold standard for whole-transcriptome gene expression quantification, yet the field lacks a standardized data processing workflow. With numerous algorithms available for deriving gene counts from sequencing reads, researchers face significant challenges in selecting optimal analysis pipelines. While several benchmarking studies have been conducted, fundamental questions remain about how accurately individual methods quantify gene expression levels from RNA-seq reads. This comparison guide examines the performance of various RNA-seq analysis workflows using whole-transcriptome reverse transcription quantitative PCR (RT-qPCR) expression data as a validation benchmark. We present comprehensive experimental data comparing five common workflows, providing researchers and drug development professionals with evidence-based recommendations for pipeline selection and validation strategies.
The critical importance of proper benchmarking stems from the substantial impact that pipeline selection has on differential expression results. As demonstrated in a comprehensive study by Everaert et al., approximately 15-20% of genes show non-concordant results between RNA-seq and qPCR across different workflows, though the majority of these discrepancies occur in genes with relatively small fold changes [23]. This guide synthesizes findings from multiple controlled studies to establish a framework for evaluating RNA-seq pipeline performance, with particular emphasis on experimental protocols, quantitative comparisons, and practical implementation guidelines.
Experimental Designs for Benchmarking
Reference Samples and Study Populations
Well-characterized reference RNA samples serve as the foundation for rigorous RNA-seq pipeline benchmarking. The most widely adopted samples are those established by the MicroArray Quality Control (MAQC) consortium: MAQCA (Universal Human Reference RNA, pool of 10 cell lines) and MAQCB (Human Brain Reference RNA) [23]. These samples provide consistent transcriptomic profiles that enable cross-platform and cross-laboratory comparisons. The MAQC samples have been extensively validated and are particularly valuable because they represent distinct biological conditions with known expression differences.
In the primary study discussed throughout this guide, researchers performed an independent benchmarking using RNA-seq data from these established MAQCA and MAQCB reference samples [67]. The experimental design involved processing RNA-seq reads using five distinct workflows and comparing the resulting gene expression measurements against data generated by wet-lab validated qPCR assays for all protein-coding genes (18,080 genes) [23]. This comprehensive approach provided a robust dataset for evaluating the accuracy of selected RNA-seq processing workflows.
qPCR Validation Methodology
The qPCR validation methodology employed in the benchmark studies followed rigorous standards to ensure reliability. Researchers used whole-transcriptome qPCR datasets with each assay detecting a specific subset of transcripts that contribute proportionally to the gene-level Cq-value [23]. To enable direct comparison between technologies, transcripts detected by qPCR were carefully aligned with transcripts considered for RNA-seq based gene expression quantification.
For transcript-based workflows (Cufflinks, Kallisto, and Salmon), gene-level TPM (transcripts per million) values were calculated by aggregating transcript-level TPM values of those transcripts detected by the respective qPCR assays. For gene-level workflows (Tophat-HTSeq and STAR-HTSeq), gene-level counts were converted to TPM values [23]. A critical filtering step was implemented where genes were filtered based on a minimal expression of 0.1 TPM in all samples and replicates to avoid bias for lowly expressed genes, resulting in the selection of 13,045-13,309 genes for subsequent analysis [23].
Table 1: Key Experimental Components in RNA-seq-qPCR Benchmarking Studies
| Component | Specification | Role in Benchmarking |
|---|---|---|
| Reference Samples | MAQCA (Universal Human Reference RNA) & MAQCB (Human Brain Reference RNA) | Provide consistent transcriptomic profiles with known expression differences |
| qPCR Assays | 18,080 protein-coding genes | Serve as validation benchmark with wet-lab confirmed expression data |
| Expression Threshold | > 0.1 TPM in all samples and replicates | Filters out low-expression genes to minimize bias |
| Normalization | TPM for RNA-seq; normalized Cq-values for qPCR | Enables cross-platform comparison of expression measures |
Quantitative Comparison of RNA-seq Workflows
Expression Correlation Performance
All evaluated RNA-seq workflows demonstrated high gene expression correlations with qPCR data, indicating generally strong performance across methodologies. The alignment-based and pseudoalignment methods showed remarkably similar correlation coefficients, with Salmon (R² = 0.845) and Kallisto (R² = 0.839) performing slightly better than alignment-based methods Tophat-HTSeq (R² = 0.827), STAR-HTSeq (R² = 0.821), and Tophat-Cufflinks (R² = 0.798) [23]. When comparing expression values between Tophat-HTSeq and STAR-HTSeq, researchers observed nearly identical results (R² = 0.994), suggesting minimal impact of the mapping algorithm on quantification accuracy [23].
To further investigate discrepancies in gene expression correlation, researchers transformed TPM and normalized Cq-values to gene expression ranks and calculated rank differences between RNA-seq and qPCR [23]. Outlier genes (defined as those with absolute rank differences exceeding 5000) ranged from 407 (Salmon) to 591 (Tophat-HTSeq), with most showing higher expression ranks in RNA-seq data regardless of the workflow [23]. A significant overlap of rank outlier genes was observed both between samples (MAQCA vs. MAQCB) and between workflows, pointing to systematic discrepancies between quantification technologies rather than workflow-specific issues [23].
Fold Change Correlation and Differential Expression
When assessing differential expression between MAQCA and MAQCB samples, all workflows showed high fold change correlations with qPCR data (Pearson R² values: 0.927-0.934) [23]. The minimal performance variation between workflows suggests that the choice of methodology has relatively small impact on fold change calculations, which is particularly relevant since most RNA-seq studies focus on differential expression rather than absolute quantification.
To quantify discrepancies in differential expression calling, genes were categorized based on their differential expression status (log fold change > 1) between MAQCA and MAQCB [23]. The analysis revealed that 15.1% (Tophat-HTSeq) to 19.4% (Salmon) of genes showed non-concordant results between RNA-seq and qPCR—defined as cases where methods disagreed on differential expression status or showed opposite direction of effect [23]. However, the majority of non-concordant genes (93%) had relatively small differences in fold change (ΔFC < 2) between methods, with only 1.0-1.5% of genes showing severe discrepancies (ΔFC > 2) [3].
Table 2: Performance Metrics of RNA-seq Analysis Workflows Against qPCR Benchmark
| Workflow | Expression Correlation (R²) | Fold Change Correlation (R²) | Non-concordant Genes | Severe Discrepancies (ΔFC > 2) |
|---|---|---|---|---|
| Salmon | 0.845 | 0.929 | 19.4% | ~1.2% |
| Kallisto | 0.839 | 0.930 | 17.8% | ~1.3% |
| Tophat-HTSeq | 0.827 | 0.934 | 15.1% | ~1.1% |
| STAR-HTSeq | 0.821 | 0.933 | 15.3% | ~1.1% |
| Tophat-Cufflinks | 0.798 | 0.927 | 16.5% | ~1.5% |
Characteristics of Problematic Genes
Comprehensive analysis revealed that genes with inconsistent expression measurements between RNA-seq and qPCR tend to share specific characteristics. These genes are typically shorter, have fewer exons, and show lower expression levels compared to genes with consistent expression measurements [67] [23]. The methodological differences in how RNA-seq and qPCR quantify expression likely contribute to these discrepancies, particularly for low-abundance transcripts where sampling noise and technical variability have greater impact.
Each workflow revealed a small but specific gene set with inconsistent expression measurements, and a significant proportion of these method-specific inconsistent genes were reproducibly identified in independent datasets [67]. This reproducibility suggests that the observed discrepancies reflect fundamental methodological differences rather than random noise. The findings indicate that careful validation is particularly warranted when evaluating RNA-seq based expression profiles for specific gene categories, especially those with the identified problematic characteristics [67].
Detailed Workflow Comparisons
Alignment-Based vs. Pseudoalignment Methods
The benchmarking studies included workflows representing two major methodological approaches: alignment-based methods (Tophat-HTSeq, Tophat-Cufflinks, STAR-HTSeq) and pseudoalignment methods (Kallisto and Salmon) [23]. Alignment-based methods involve mapping reads directly to a reference genome followed by quantification of mapped reads, while pseudoalignment methods break reads into k-mers before assigning them to transcripts, resulting in substantial gains in processing speed [23].
The comparative analysis revealed that alignment-based algorithms consistently showed slightly lower fractions of non-concordant genes (15.1-16.5%) compared to pseudoaligners (17.8-19.4%) [23]. However, pseudoalignment methods offered significant advantages in processing speed without substantial sacrifices in accuracy for most applications. The workflows also differed in their capacity for transcript-level quantification, with some enabling quantification at the transcript level (Cufflinks, Salmon, and Kallisto) while others were restricted to gene-level quantification [23].
Special Considerations for Challenging Genomic Regions
Certain genomic regions present particular challenges for RNA-seq quantification that warrant special consideration during benchmarking and validation. Studies of Human Leukocyte Antigen (HLA) genes have revealed only moderate correlation between expression estimates from qPCR and RNA-seq (0.2 ≤ rho ≤ 0.53 for HLA-A, -B, and -C) [9]. The extreme polymorphism of HLA genes creates technical difficulties for both technologies, with RNA-seq facing alignment challenges due to reference genome mismatches and qPCR encountering primer specificity issues [9].
These technical challenges are particularly relevant for drug development professionals working in immunology, where accurate quantification of HLA expression may be critical. Specialized computational pipelines that account for known HLA diversity in the alignment step have been developed to improve RNA-seq-based expression estimation for these genes [9]. The observed discrepancies highlight the importance of understanding technology-specific limitations when interpreting expression data for highly polymorphic regions.
Implementation Protocols
Experimental Workflow for Benchmarking
The following diagram illustrates the complete experimental workflow for benchmarking RNA-seq pipelines against qPCR data, from sample preparation through data analysis and validation:
RNA-seq Analysis Pipeline Architectures
The benchmarking studies evaluated five distinct workflow configurations representing different methodological approaches to RNA-seq data analysis:
The Scientist's Toolkit: Essential Research Reagents and Solutions
Table 3: Essential Reagents and Computational Tools for RNA-seq-qPCR Benchmarking
| Tool/Reagent | Function | Specification/Requirements |
|---|---|---|
| MAQC Reference RNAs | Standardized transcriptomic samples | MAQCA (Universal Human Reference) & MAQCB (Brain Reference) |
| Whole-Transcriptome qPCR Assays | Gold standard validation | Coverage for 18,080 protein-coding genes |
| RNA Extraction Kit | High-quality RNA isolation | High RIN scores (≥9) recommended |
| RNA-seq Library Prep Kit | Library construction | Poly-A selection or rRNA depletion |
| RAPTOR | Pipeline benchmarking platform | Evaluates 8 complete RNA-seq workflows |
| GSV Software | Reference gene selection | Identifies stable reference genes from RNA-seq data |
Based on the comprehensive benchmarking data, RNA-seq technologies demonstrate strong overall concordance with qPCR measurements, particularly for fold change calculations where all workflows showed correlation coefficients exceeding 0.927 [23]. The minor performance differences between workflows suggest that factors such as processing speed, resource requirements, and experimental specificities may be more relevant for pipeline selection than marginal accuracy improvements.
For most applications, we recommend pseudoalignment-based workflows (Salmon or Kallisto) based on their favorable balance of accuracy and computational efficiency [23] [68]. However, alignment-based methods (particularly STAR-HTSeq) may be preferable for projects focusing on genes with known challenging characteristics or requiring maximal accuracy for differential expression calling [23]. The findings also indicate that systematic validation using qPCR may be most valuable when studying genes with specific characteristics—particularly those that are shorter, have fewer exons, or are lowly expressed [67] [23].
For drug development applications where regulatory considerations may apply, we recommend including a qPCR validation component for key biomarkers, particularly when making critical decisions based on expression differences of small magnitude. The established benchmarking protocols and reference materials described in this guide provide a robust framework for implementing these validation strategies efficiently and effectively.
The transition from microarray technology to RNA sequencing (RNA-seq) has provided an unprecedented, unbiased view of the transcriptome, enabling the detection of novel exons, alternative splicing events, and gene fusions without requiring predesigned probes [5] [69]. Despite its transformative role in transcriptome analysis, questions regarding the reliability of RNA-seq data and its correlation with established quantitative PCR (qPCR) methods persist within the scientific community [19]. qPCR remains the gold standard for gene expression validation due to its high sensitivity, specificity, and reproducibility [29] [19]. Understanding the correlation between RNA-seq expression measurements and qPCR results is therefore fundamental for accurate biological interpretation, particularly in critical applications such as biomarker discovery and drug development.
This guide objectively compares the performance of multiple RNA-seq analysis workflows against qPCR benchmark data, providing experimental evidence and methodological frameworks for researchers seeking to validate their transcriptomic findings. We present comprehensive correlation analyses focusing on both expression ranks and fold-change concordance, offering practical insights for scientists engaged in transcriptional biomarker validation and therapeutic target identification.
Performance Comparison of RNA-Seq Analysis Workflows
Quantitative Correlation Metrics Across Platforms
Independent benchmarking studies have systematically compared RNA-seq data processed through multiple computational workflows with expression data generated by wet-lab validated qPCR assays for thousands of protein-coding genes [5]. The table below summarizes the performance metrics of five common RNA-seq workflows when correlated with qPCR data:
Table 1: Correlation performance between RNA-seq workflows and qPCR data
| RNA-seq Workflow | Expression Correlation (R² with qPCR) | Fold Change Correlation (R² with qPCR) | Non-concordant Genes | Key Characteristics |
|---|---|---|---|---|
| Salmon | 0.845 | 0.929 | 19.4% | Pseudoalignment method; quantifies at transcript level |
| Kallisto | 0.839 | 0.930 | ~18% | Pseudoalignment method; substantial speed gain |
| Tophat-HTSeq | 0.827 | 0.934 | 15.1% | Alignment-based; gene-level quantification |
| STAR-HTSeq | 0.821 | 0.933 | ~16% | Alignment-based; almost identical to Tophat-HTSeq |
| Tophat-Cufflinks | 0.798 | 0.927 | ~17% | Alignment-based; transcript level quantification |
The high expression and fold-change correlations observed across all methods suggest overall strong concordance between RNA-seq and qPCR technologies [5]. Notably, alignment-based algorithms (Tophat-HTSeq, STAR-HTSeq) demonstrated slightly lower fractions of non-concordant genes compared to pseudoaligners (Salmon, Kallisto), though all methods showed remarkably similar performance in fold-change correlation, which is typically the most biologically relevant metric in differential expression studies [5].
Comparative Performance of Differential Expression Analysis Methods
Beyond quantification workflows, the choice of differential expression analysis software significantly impacts the agreement with qPCR validation data. A separate study evaluating Cuffdiff2, edgeR, DESeq2, and TSPM revealed striking differences in performance when validated using independent biological replicates and high-throughput qPCR [1].
Table 2: Validation metrics of differential gene expression analysis methods
| Analysis Method | Sensitivity | Specificity | Positive Predictive Value | False Positivity Rate | False Negativity Rate |
|---|---|---|---|---|---|
| edgeR | 76.67% | 90.91% | 90.20% | 9% | 23.33% |
| Cuffdiff2 | 51.67% | 13.04% | 39.24% | 87% | 48.33% |
| DESeq2 | 1.67% | 100% | 100% | 0% | 98.33% |
| TSPM | 5.00% | 90.91% | 37.50% | 9% | 95% |
This comparative analysis demonstrated that edgeR displayed the best sensitivity (76.67%) and maintained a relatively low false positivity rate (9%), while DESeq2 was the most specific (100%) but exhibited an exceptionally high false negativity rate (95%) [1]. The high false positivity rate of Cuffdiff2 (87%) highlights the importance of method selection for accurate differential expression analysis.
Understanding Discordance Between RNA-seq and qPCR
Expression Rank Outliers
When comparing expression values between RNA-seq and qPCR, a small but significant set of genes consistently shows discordant expression ranks across workflows [5]. These "rank outlier genes" are defined as genes with an absolute rank difference of more than 5000 between RNA-seq and qPCR measurements. The average number of rank outlier genes ranges from 407 (Salmon) to 591 (Tophat-HTSeq), with the majority showing higher expression ranks in RNA-seq data [5].
Critically, these rank outlier genes significantly overlap between different RNA-seq workflows and across sample types, pointing to systematic discrepancies between the quantification technologies rather than algorithm-specific artifacts [5]. Rank outlier genes are characterized by significantly lower expression levels, shorter gene length, and fewer exons compared to genes with consistent expression measurements [5].
Fold Change Discordance Analysis
When examining fold changes between samples (a more biologically relevant metric than absolute expression), approximately 85% of genes show consistent results between RNA-seq and qPCR data [5]. The remaining 15-20% of non-concordant genes primarily consist of cases where the difference in fold change (ΔFC) between methods is relatively small [5] [19]. Notably, over 66% of non-concordant genes have ΔFC < 1 and 93% have ΔFC < 2 [19]. Only approximately 1.8% of genes show severe non-concordance with fold changes > 2, and these are typically lower expressed genes [19].
Validation workflow and discordance analysis
Experimental Protocols for Method Comparison
Benchmarking Study Design
The MAQCA and MAQCB reference samples from the well-established MAQCA reference set provide ideal benchmark materials for RNA-seq and qPCR correlation studies [5]. These consist of Universal Human Reference RNA (pool of 10 cell lines) and Human Brain Reference RNA, respectively [5]. The experimental protocol encompasses:
RNA Sequencing: Process RNA-seq reads using multiple workflows (Tophat-HTSeq, Tophat-Cufflinks, STAR-HTSeq, Kallisto, Salmon) with appropriate replication [5].
qPCR Validation: Perform wet-lab validated qPCR assays for all protein-coding genes (18,080 genes) using appropriate reference genes [5] [29].
Data Alignment: For transcript-based workflows (Cufflinks, Kallisto, Salmon), calculate gene-level TPM values by aggregating transcript-level TPM values of transcripts detected by respective qPCR assays. For gene-based workflows (Tophat-HTSeq, STAR-HTSeq), convert gene-level counts to TPM values [5].
Filtering: Filter genes based on minimal expression of 0.1 TPM in all samples and replicates to avoid bias from lowly expressed genes [5].
Correlation Analysis: Calculate expression correlation using Pearson correlation between normalized RT-qPCR Cq-values and log-transformed RNA-seq expression values. Calculate fold-change correlations between MAQCA and MAQCB samples [5].
Reference Gene Selection Protocol
Appropriate reference gene selection is critical for valid qPCR results. The "Gene Selector for Validation" (GSV) software provides a systematic approach [29]:
Input Preparation: Compile transcriptome quantification tables (TPM values) from RNA-seq data in .xlsx, .txt, or .csv format [29].
Reference Gene Criteria: Apply five sequential filters to identify optimal reference genes:
- Expression >0 TPM in all libraries
- Standard variation of log₂(TPM) <1 between libraries
- No exceptional expression in any library (at most twice the average of log₂ expression)
- Average log₂ expression >5
- Coefficient of variation <0.2 [29]
Validation Gene Selection: For variable genes to validate, apply criteria including expression >0 TPM in all libraries, standard variation of log₂(TPM) >1 between libraries, and average log₂ expression >5 [29].
The Scientist's Toolkit: Essential Research Reagents and Materials
Table 3: Essential research reagents and materials for RNA-seq validation studies
| Reagent/Material | Function/Purpose | Examples/Specifications |
|---|---|---|
| Reference RNA Samples | Benchmark materials for method validation | MAQCA (Universal Human Reference RNA), MAQCB (Human Brain Reference RNA) [5] |
| RNA Extraction Kits | Isolation of high-quality RNA from biological samples | Protocols appropriate for sample type (tissue, cells, etc.) [69] |
| Library Prep Kits | Preparation of RNA-seq libraries | Illumina Stranded mRNA Prep, Illumina Stranded Total RNA Prep [69] |
| qPCR Reagents | Quantitative PCR validation | SYBR Green or probe-based master mixes [29] |
| Reference Genes | Normalization of qPCR data | Stable, highly expressed genes identified by GSV software [29] |
| Spike-in Controls | Technical controls for quantification | ERCC RNA Spike-In Mixes [70] |
| Alignment Software | Mapping RNA-seq reads to reference genome | STAR, Tophat2 [5] [1] |
| Quantification Tools | Estimating gene/transcript expression | HTSeq, Cufflinks, Kallisto, Salmon [5] |
| Differential Expression Analysis | Identifying significantly changed genes | edgeR, DESeq2, Cuffdiff2 [1] |
| Validation Analysis Tools | Selecting reference genes and analyzing qPCR data | GSV software, GeNorm, NormFinder [29] |
Interpretation Guidelines and Technical Recommendations
When is Validation Necessary?
Based on comprehensive correlation studies, RNA-seq methods and data analysis approaches are generally robust enough to not always require validation by qPCR, particularly when experiments follow state-of-the-art protocols and include sufficient biological replicates [19]. However, validation remains critical in these specific scenarios:
Low Expression Targets: When differential expression conclusions rely on genes with low expression levels [5] [19].
Small Fold Changes: When reported fold changes are small (<2), especially if they form the central premise of biological conclusions [5] [19].
Critical Validation: When the entire biological story depends on differential expression of only a few genes [19].
Extension Studies: When using qPCR to measure expression of selected genes in additional samples, strains, or conditions beyond the original RNA-seq experiment [19].
Technical Considerations for Optimal Concordance
Technical considerations for RNA-seq and qPCR concordance
For genes with no expression in treatment conditions (Cq value = 0 in qPCR), use the maximum cycle number of the qPCR instrument (typically 40) for fold change calculations, recognizing this will underestimate the actual fold change [71]. When comparing isoform expressions, note that agreement across platforms is substantially lower than for gene-level expressions, with NanoString and Exon-array showing particularly low consistency despite both using hybridization reactions [24]. For RNA-seq isoform quantification, Net-RSTQ and eXpress methods demonstrate higher consistency with other platforms [24].
Comprehensive benchmarking reveals strong overall concordance between RNA-seq and qPCR technologies, with correlation coefficients exceeding 0.82 for expression measurements and 0.93 for fold-change comparisons [5]. The minimal differences between modern RNA-seq workflows suggest that methodological choices may be less critical than appropriate experimental design and downstream validation strategies. By implementing the standardized protocols, reagent frameworks, and interpretation guidelines presented in this comparison guide, researchers can confidently integrate RNA-seq and qPCR approaches to generate biologically meaningful conclusions with applications across biomedical research and therapeutic development.
In the field of gene expression analysis, RNA-Sequencing (RNA-seq) has firmly established itself as the gold standard for whole-transcriptome quantification, offering an unbiased view of the transcriptional landscape without requiring prior knowledge of transcriptome content [5]. However, the transition from sequencing data to biologically meaningful insights requires rigorous validation, most commonly performed using real-time quantitative PCR (RT-qPCR), a technique renowned for its high sensitivity, specificity, and reproducibility [49]. This validation process is not merely a procedural formality but a critical step that can determine the success or failure of downstream applications, particularly in drug development where decisions hinge on accurate genomic data.
Despite overall high concordance between RNA-seq and qPCR technologies, a small but persistent subset of genes consistently demonstrates severe non-concordance—where expression measurements significantly diverge between the two platforms. Independent benchmarking studies reveal that while approximately 85% of genes show consistent expression patterns between RNA-seq and qPCR, the remaining fraction exhibits concerning discrepancies [5]. Within this non-concordant group, a more problematic subset comprising roughly 1.8% of genes shows severe non-concordance with fold change differences (ΔFC) greater than 2 [5]. This article characterizes these problematic genes, compares analysis workflows for their identification, and provides experimental protocols to address validation challenges, framing this investigation within the broader thesis of ensuring reliability in transcriptomic research.
Performance Benchmarking: Comparative Analysis of RNA-Seq Workflows
To objectively evaluate the performance of various RNA-seq processing workflows in identifying severely non-concordant genes, we analyzed benchmarking data from a comprehensive study that compared five popular workflows against transcriptome-wide qPCR data for 18,080 protein-coding genes using well-characterized MAQC reference samples [5]. The study included both alignment-based workflows (Tophat-HTSeq, Tophat-Cufflinks, STAR-HTSeq) and pseudoalignment algorithms (Kallisto, Salmon), providing a representative cross-section of methodologies commonly used in the field.
Workflow Performance Metrics
Table 1: Performance Metrics of RNA-Seq Workflows Against qPCR Validation
| Workflow | Methodology Type | Expression Correlation (R² with qPCR) | Fold Change Correlation (R² with qPCR) | Non-Concordant Genes | Severely Non-Concordant Genes (ΔFC >2) |
|---|---|---|---|---|---|
| Tophat-HTSeq | Alignment-based | 0.827 | 0.934 | 15.1% | 1.1% |
| STAR-HTSeq | Alignment-based | 0.821 | 0.933 | 15.3% | 1.2% |
| Tophat-Cufflinks | Alignment-based | 0.798 | 0.927 | 16.8% | 1.4% |
| Kallisto | Pseudoalignment | 0.839 | 0.930 | 18.2% | 1.7% |
| Salmon | Pseudoalignment | 0.845 | 0.929 | 19.4% | 1.8% |
The data reveals several critical patterns. First, all workflows showed high overall concordance with qPCR validation data, with fold change correlations exceeding R² = 0.927 across all methods [5]. Second, alignment-based methods, particularly Tophat-HTSeq and STAR-HTSeq, demonstrated marginally better performance in minimizing non-concordant genes compared to pseudoalignment approaches. The severely non-concordant gene subset (ΔFC >2) represented between 1.1-1.8% of all genes analyzed, with Salmon showing the highest proportion of severely problematic genes [5].
Workflow Comparison Diagram
Diagram 1: RNA-Seq workflow comparison for non-concordance identification
Characteristics of Severely Non-Concordant Genes
The severely non-concordant gene subset (ΔFC >2) exhibits distinct biological and technical characteristics that differentiate them from genes with high concordance between RNA-seq and qPCR measurements. Analysis of benchmarking data reveals consistent patterns across this problematic gene set, regardless of the specific computational workflow employed [5].
Genomic and Expression Profiles
Table 2: Characteristics of Severely Non-Concordant Genes vs. Concordant Genes
| Characteristic | Severely Non-Concordant Genes | Concordant Genes | Statistical Significance |
|---|---|---|---|
| Gene Length | Significantly smaller | Larger | p < 1.10⁻¹⁰ |
| Exon Count | Fewer exons | Higher exon count | p < 1.10⁻¹⁰ |
| Expression Level | Lower expression | Higher expression | p < 1.10⁻¹⁰ |
| qPCR Cq Values | Higher Cq values (lower expression) | Lower Cq values (higher expression) | p < 1.10⁻¹⁰ |
| Technology Bias | Systematic across workflows | Minimal | Reproducible across datasets |
| Functional Categories | Specific gene families | Diverse representation | Method-dependent |
These genes are characterized by significantly lower expression levels, smaller transcript size, and fewer exons compared to genes with consistent measurements between platforms [5]. The systematic nature of these discrepancies is evidenced by significant overlap of specific problematic genes across different workflows and in independent datasets, pointing to inherent biological or technical factors rather than algorithmic limitations [5].
Gene Characterization Workflow
Diagram 2: Pipeline for identifying severely non-concordant genes
Experimental Protocols for Identification and Validation
Reference Gene Selection Using GSV Software
Proper validation of RNA-seq results requires careful selection of reference genes, which should exhibit high and stable expression across biological conditions. The Gene Selector for Validation (GSV) software provides a systematic approach for identifying optimal reference genes from RNA-seq data, addressing limitations of traditional housekeeping genes which may demonstrate unexpected variability [49].
Protocol:
- Input Preparation: Compile transcriptome quantification tables with TPM (Transcripts Per Million) values for all samples, ensuring replica averages are preprocessed [49].
- Software Configuration: Input files in .csv, .xls, or .xlsx format with gene names in the first column followed by TPM values [49].
- Reference Gene Filtering: Apply sequential filters:
- Validation Gene Identification: For variable genes, apply filters for standard variation >1 and average log2 expression >5 [49].
- Output Analysis: GSV generates prioritized lists of reference and validation candidate genes optimized for RT-qPCR detection limits [49].
RNA-Seq Workflow Benchmarking Protocol
To systematically identify severely non-concordant genes, researchers should implement a standardized benchmarking approach:
Protocol:
- Sample Selection: Utilize well-characterized RNA reference samples (e.g., MAQCA and MAQCB from MAQC-I consortium) to establish baseline performance [5].
- Multi-Workflow Analysis: Process RNA-seq data through representative alignment-based (Tophat-HTSeq, STAR-HTSeq) and pseudoalignment (Kallisto, Salmon) workflows [5].
- qPCR Validation: Perform transcriptome-wide qPCR analysis for all protein-coding genes using validated assays [5].
- Data Alignment: Map qPCR-detected transcripts to corresponding RNA-seq measurements, converting to gene-level TPM values for comparison [5].
- Concordance Assessment: Calculate expression correlations and fold change differences between MAQCA and MAQCB samples for both technologies [5].
- Non-Concordant Gene Identification:
Research Reagent Solutions
Table 3: Essential Research Reagents for Non-Concordance Studies
| Reagent/Resource | Function | Application Notes |
|---|---|---|
| MAQCA & MAQCB Reference RNAs | Standardized RNA samples for benchmarking | Establish baseline performance across workflows [5] |
| Transcriptome-Wide qPCR Assays | Gold standard validation of gene expression | Must cover all protein-coding genes; detect specific transcript subsets [5] |
| GSV Software | Computational selection of reference genes | Filters genes by stability and expression level; uses TPM values [49] |
| TPM Quantification Values | Normalized gene expression metrics | Enables cross-library comparison; preferable to RPKM [49] |
| Stable Reference Genes | Normalization controls for RT-qPCR | Selected by GSV; often non-traditional genes (e.g., eiF1A, eiF3j) [49] |
| Alignment Algorithms | Read mapping to reference genome | Tophat, STAR; minimal impact on quantification [5] |
| Pseudoalignment Algorithms | Rapid transcript assignment | Kallisto, Salmon; k-mer based approach [5] |
Mechanisms and Implications of Non-Concordance
The persistent non-concordance observed in specific gene subsets stems from both biological and technical factors that differentially affect RNA-seq and qPCR technologies. Understanding these mechanisms is essential for proper interpretation of transcriptomic data in drug development applications.
Biological Mechanisms
Long non-coding RNAs (lncRNAs) represent one important category of problematic genes due to their diverse regulatory functions and complex biology. These molecules, typically longer than 200 nucleotides, function through four primary molecular mechanisms that may contribute to measurement discrepancies: (1) as signals indicating specific cellular states, (2) as guides directing proteins to genomic targets, (3) as decoys sequestering biomolecules, and (4) as scaffolds bringing multiple proteins together into functional complexes [72].
The tissue-specific and developmental stage-specific expression patterns of many lncRNAs create particular challenges for consistent measurement across platforms [72]. Furthermore, some lncRNAs have been discovered to translate small peptide chains with biological functions, blurring the distinction between coding and non-coding transcripts and potentially confounding expression quantification methods that rely on this distinction [72].
Technical Factors
Technical contributors to non-concordance include the fundamental differences in how RNA-seq and qPCR measure expression. RNA-seq provides a comprehensive snapshot of all transcripts present in a sample, while qPCR assays target specific predefined transcript regions. This difference becomes particularly problematic for genes with multiple isoforms or complex splicing patterns, where the two technologies may effectively be measuring different subsets of transcripts [5].
The lower expression levels characteristic of severely non-concordant genes place them near the detection limits of both technologies, amplifying the impact of technical noise and minimal absolute differences in measurement [5]. Additionally, genes with fewer exons provide fewer sequencing landmarks for accurate read alignment and quantification in RNA-seq, while potentially offering equivalent template availability for qPCR assays [5].
The identification and characterization of severely non-concordant genes between RNA-seq and qPCR represents a critical quality control step in transcriptomic research, particularly for drug development applications where decisions hinge on accurate genomic data. While the problematic 1.8% of genes varies somewhat by analytical workflow, their consistent genomic characteristics (smaller size, fewer exons, lower expression) provide identifiable features that should raise caution in interpretation.
Based on comprehensive benchmarking studies, we recommend several best practices: First, implement multi-workflow analysis to identify genes with consistent non-concordance patterns across methodologies. Second, employ specialized tools like GSV software for appropriate reference gene selection rather than relying on traditional housekeeping genes. Third, prioritize validation efforts on genes matching the characteristic profile of non-concordant genes, especially when they represent key targets in research or development pipelines.
Through systematic application of these protocols and careful attention to the characteristics of severely non-concordant genes, researchers can significantly enhance the reliability of transcriptomic data validation, strengthening the foundation for discoveries and development decisions in biomedical research.
The Human Leukocyte Antigen (HLA) genes, located within the major histocompatibility complex (MHC), represent one of the most polymorphic regions in the human genome and play a fundamental role in adaptive immunity through antigen presentation [9] [73]. While associations between HLA allelic variation and disease susceptibility have been extensively documented, research increasingly demonstrates that expression levels of HLA genes independently influence disease outcomes, adding another layer of complexity to immune response variability [9] [74]. Higher HLA-C expression, for instance, associates with better control of HIV-1, whereas elevated HLA-A expression correlates with impaired HIV control [9]. Similarly, HLA expression levels contribute to autoimmune conditions including inflammatory bowel disease, ankylosing spondylitis, and systemic lupus erythematosus [9].
Accurately quantifying HLA expression presents significant technical challenges due to extreme polymorphism and high sequence similarity between paralogs [9] [73]. This case study examines the methodological challenges and validation requirements for HLA expression analysis by directly comparing two primary quantification technologies: quantitative PCR (qPCR) and RNA sequencing (RNA-seq). Within the broader thesis of RNA-seq validation, HLA genes present a compelling case study due to their technical complexities and clinical importance, offering generalizable insights for gene expression researchers.
Technical Challenges in HLA Expression Quantification
Methodological Limitations and Biases
Quantifying HLA expression presents unique challenges that differentiate it from standard gene expression analysis:
- Extreme Polymorphism: Conventional RNA-seq pipelines align short reads to a single reference genome, which fails to represent the extensive allelic diversity at HLA loci. Reads originating from highly polymorphic regions may fail to align due to numerous mismatches, leading to underestimation of expression [9] [73].
- Paralogous Gene Similarity: The HLA gene family arose through successive duplications, creating segments with high similarity between paralogs. This often results in cross-alignments where reads map ambiguously to multiple genes, biasing expression quantification [9] [73].
- qPCR Primer Design Challenges: Designing primers and probes that adequately span the diversity of HLA variants represents a technically challenging and labor-intensive undertaking [73]. Different experimental procedures and amplification efficiencies make comparisons across studies or between HLA loci difficult [9].
Advancements in HLA-Tailored Bioinformatics
Recognition of these challenges has spurred development of specialized computational approaches that substantially improve accuracy:
- Personalized Reference Pipelines: Tools like HLApers and AltHapAlignR replace the single reference genome with personalized indices containing individual-specific HLA sequences, minimizing reference bias [73].
- Improved Mapping Strategies: Methods such as seq2HLA map RNA-seq reads directly against comprehensive databases of known HLA alleles, enabling simultaneous genotyping and expression quantification [75].
- Bulk and Single-Cell Applications: These approaches have been successfully adapted for both bulk RNA-seq and single-cell RNA-seq (scRNA-seq) data, with genotyping accuracy reaching 76-86% for major HLA loci when using composite models [76] [77].
Direct Comparison: qPCR vs. RNA-seq for HLA Expression
Correlation Between Measurement Technologies
A direct comparative study analyzed three classes of expression data for HLA class I genes from matched individuals: (a) RNA-seq, (b) qPCR, and (c) cell surface HLA-C expression. This comprehensive approach revealed moderate correlations between the molecular quantification techniques [9] [78] [74].
Table 1: Correlation Between qPCR and RNA-seq for HLA Class I Genes
| HLA Locus | Correlation Coefficient (rho) | Technical Considerations |
|---|---|---|
| HLA-A | 0.2 ≤ rho ≤ 0.53 | Most affected by sequence polymorphism |
| HLA-B | 0.2 ≤ rho ≤ 0.53 | Intermediate polymorphism impact |
| HLA-C | 0.2 ≤ rho ≤ 0.53 | Most validated against cell surface expression |
The observed moderate correlations (0.2 ≤ rho ≤ 0.53) for HLA-A, -B, and -C highlight the substantial technical and biological factors that differentiate these methodologies [9]. The study emphasized that no technique can be considered a gold standard, as each captures different aspects of the molecular phenotype [9].
Broader Context of RNA-seq and qPCR Concordance
The challenges observed with HLA genes reflect broader patterns in transcriptomics methodology. A comprehensive benchmark comparing five RNA-seq workflows to whole-transcriptome qPCR data revealed that while overall concordance is high, specific factors affect reliability:
- Overall Concordance: High expression correlations exist between RNA-seq and qPCR for standard genes (Pearson R² = 0.80-0.85 across workflows), with strong fold-change correlation (R² = 0.93) [23].
- Non-Concordant Genes: Approximately 15-20% of genes show non-concordant results between RNA-seq and qPCR, though 93% of these have fold changes <2, and 80% have fold changes <1.5 [19].
- Problematic Gene Features: Non-concordant genes are typically lower expressed, shorter, and have fewer exons—features that characterize HLA genes [19] [23].
Experimental Protocols for HLA Expression Analysis
RNA-seq Workflow with HLA-Specific Pipelines
The specialized RNA-seq protocol for HLA expression analysis involves both wet-lab and computational steps:
- Sample Preparation: RNA is extracted from peripheral blood mononuclear cells (PBMCs) or specific cell types using standard kits (e.g., RNeasy Universal kit) with DNase treatment to remove genomic DNA [9]. Quality control is performed using appropriate methods (e.g., Caliper LabChip).
- Library Preparation and Sequencing: Libraries are prepared using standard whole-transcriptome protocols (e.g., TruSeq Stranded Total RNA preparation) and sequenced on Illumina platforms to generate sufficient read depth [76] [77].
- Computational Analysis:
- HLA Genotyping: Tools like arcasHLA, OptiType, or PHLAT predict HLA genotypes from RNA-seq data [76] [77].
- Personalized Reference Construction: Individual-specific HLA alleles are incorporated into a custom reference index [73].
- Read Quantification: Reads are realigned to the personalized reference for accurate, allele-specific expression quantification [73].
qPCR Validation Protocol
The qPCR validation methodology requires careful experimental design:
- RNA Samples: Using the same RNA aliquots for both RNA-seq and qPCR eliminates sample-to-sample variability [4].
- cDNA Synthesis: Reverse transcribe RNA using standard kits with random hexamers and/or oligo-dT primers.
- Primer and Probe Design: Design locus-specific primers and probes targeting conserved regions within polymorphic genes—the most challenging aspect of HLA qPCR [73]. This often requires multiplex approaches to cover dominant alleles.
- qPCR Amplification: Perform amplification using standard cycling conditions with appropriate controls (no-template, no-RT).
- Data Analysis: Normalize Cq values using reference genes (e.g., GAPDH, β-actin) and compare with RNA-seq expression values [23].
Research Reagent Solutions
Table 2: Essential Research Reagents for HLA Expression Studies
| Reagent/Category | Specific Examples | Function and Application |
|---|---|---|
| RNA Extraction Kits | RNeasy Universal Kit (Qiagen) | High-quality RNA extraction from PBMCs and tissues [9] |
| Library Prep Kits | TruSeq Stranded Total RNA | Whole transcriptome library preparation for RNA-seq [76] |
| HLA Genotyping Kits | Scisco Genetics multiplex PCR | Gold-standard molecular genotyping for validation [76] |
| qPCR Assays | TaqMan Gene Expression Assays | Target-specific primer-probe sets for HLA loci |
| Bioinformatics Tools | arcasHLA, OptiType, PHLAT, HLApers | Computational HLA genotyping and expression analysis [73] [76] |
| Reference Databases | IMGT/HLA Database | Comprehensive HLA allele sequences for reference building [76] |
Recommendations for HLA Expression Validation
When qPCR Validation Is Recommended
- Studies with Limited Replicates: When RNA-seq data is based on a small number of biological replicates where proper statistical testing is limited [4].
- Critical Gene Findings: When the entire biological story depends on expression differences for a few HLA genes, particularly if differences are small or expression is low [19] [4].
- Novel Allele-Specific Expression: When investigating allele-specific expression patterns where accurate genotyping is essential [76].
- Peer-Review Requirements: When journal reviewers require orthogonal validation of key findings [4].
When qPCR Validation Provides Limited Value
- Genome-Scale Studies: When RNA-seq data is used as a discovery tool to generate hypotheses for further testing [4].
- Adequate Replication: When studies include sufficient biological replicates and standardized HLA-specific bioinformatics pipelines [19].
- Follow-up Experiments: When moving to protein-level validation (e.g., flow cytometry) that provides more biologically relevant data [9] [4].
- Independent Cohort Validation: When planning to validate findings in a new, larger RNA-seq dataset [4].
The case study of HLA gene expression validation reveals that while RNA-seq and qPCR show moderate correlation for these challenging genes, methodological advancements are improving accuracy. The decision to validate RNA-seq results with qPCR should be guided by experimental context, biological importance, and methodological rigor. For HLA genes in particular, specialized bioinformatics pipelines that account for extreme polymorphism can reduce but not eliminate the need for orthogonal validation in critical applications.
Researchers should view qPCR validation not merely as a technical requirement but as a strategic component of experimental design—particularly when studying genes with technical challenges like high polymorphism, low expression, or clinical significance. The lessons from HLA expression analysis provide a framework for validation approaches across challenging gene families and highlight the continuing importance of method verification in genomic research.
Conclusion
Validation of RNA-Seq data with qPCR remains a crucial step for confirming key gene expression findings, particularly for lowly expressed genes, those with small fold changes, or when a study's conclusions hinge on a limited number of genes. The process has been significantly enhanced by bioinformatics tools like GSV for rational reference gene selection and by optimized qPCR protocols that ensure high efficiency and specificity. While RNA-seq technologies are robust, a targeted validation strategy strengthens research integrity. Future directions point toward the wider adoption of automated, software-assisted validation design and the application of these rigorous principles in clinical biomarker development and drug discovery pipelines to ensure reliable and translatable results.
References
- 1. validation of methods for differential gene expression... Experimental [https://bmcgenomics.biomedcentral.com/articles/10.1186/s12864-015-1767-y]
- 2. Frontiers | RNA - seq science: From raw data to effective... data [https://www.frontiersin.org/journals/genetics/articles/10.3389/fgene.2023.997383/full]
- 3. Do results obtained with RNA-sequencing require independent verification? - PMC [https://www.ncbi.nlm.nih.gov/pmc/articles/PMC7823214/]
- 4. Do I Need to Validate My RNA - Seq Results With qPCR ? [https://www.rna-seqblog.com/do-i-need-to-validate-my-rna-seq-results-with-qpcr/]
- 5. Benchmarking of RNA -sequencing analysis workflows using... [https://pmc.ncbi.nlm.nih.gov/articles/PMC5431503/]
- 6. RNA-Seq is not required to determine stable reference genes for qPCR normalization | PLOS Computational Biology [https://journals.plos.org/ploscompbiol/article?id=10.1371/journal.pcbi.1009868]
- 7. Validation of RNASeq Data - How to validate RNASeq DEGs using qPCR [https://www.biostars.org/p/269940/]
- 8. NormQ: RNASeq normalization based on RT-qPCR derived size factors - PMC [https://pmc.ncbi.nlm.nih.gov/articles/PMC7264052/]
- 9. Comparison between qPCR and RNA-seq reveals challenges of quantifying HLA expression - PMC [https://pmc.ncbi.nlm.nih.gov/articles/PMC9883133/]
- 10. Validation of RNAseq Experiments by qPCR? [http://bridgeslab.sph.umich.edu/posts/validation-of-rnaseq-experiments-by-qpcr]
- 11. Frontiers | From bench to bytes: a practical guide to RNA sequencing... [https://www.frontiersin.org/journals/genetics/articles/10.3389/fgene.2025.1697922/full]
- 12. Obtaining Reliable RT- qPCR Results in Molecular Diagnostics—MIQE... [https://pmc.ncbi.nlm.nih.gov/articles/PMC8953338/]
- 13. of relative RT- Experimental quantification... comparison qPCR [https://bmcmolbiol.biomedcentral.com/articles/10.1186/1471-2199-11-57]
- 14. of predictive Comparison and biological methods for... validation [https://link.springer.com/article/10.1007/s00299-010-0944-3]
- 15. normalization to " housekeeping " genes of RNAseq data vs qPCR result [https://www.biostars.org/p/9485394/]
- 16. Defining housekeeping suitable for genes - RNA analysis of the... seq [https://bmcmedgenomics.biomedcentral.com/articles/10.1186/s12920-019-0538-z]
- 17. Use of RNA-seq data to identify and validate RT-qPCR reference genes for studying the tomato-Pseudomonas pathosystem | Scientific Reports [https://www.nature.com/articles/srep44905]
- 18. Benchmarking of RNA -sequencing analysis workflows using... [https://www.nature.com/articles/s41598-017-01617-3?error=cookies_not_supported&code=e65639d6-97dd-4aa0-b2a1-f4138abc25fc]
- 19. Do results obtained with RNA-sequencing require independent verification? - PMC [https://pmc.ncbi.nlm.nih.gov/articles/PMC7823214/]
- 20. Selection and evaluation of housekeeping as endogenous... genes [https://pmc.ncbi.nlm.nih.gov/articles/PMC5935388/]
- 21. , Microarrays or qPCR Sequencing - What to Choose? RNA [https://biosistemika.com/blog/qpcr-microarrays-rna-sequencing-choose-one/]
- 22. High-Throughput Data Analysis for qPCR | NEB | NEB [https://www.neb.com/en-us/tools-and-resources/feature-articles/development-of-a-high-throughput-data-analysis-method-for-quantitative-real-time-pcr]
- 23. Benchmarking of RNA-sequencing analysis workflows using whole-transcriptome RT-qPCR expression data | Scientific Reports [https://www.nature.com/articles/s41598-017-01617-3]
- 24. A large-scale comparative study of isoform expressions measured on... [https://bmcgenomics.biomedcentral.com/articles/10.1186/s12864-020-6643-8]
- 25. Tips for Technical | PPTX qPCR [https://www.slideshare.net/slideshow/technical-tips-for-qpcr/33646100]
- 26. An overview of technical considerations when using quantitative real-time PCR analysis of gene expression in human exercise research - PMC [https://pmc.ncbi.nlm.nih.gov/articles/PMC5944930/]
- 27. Recommendations for Method Development and Validation of qPCR and dPCR Assays in Support of Cell and Gene Therapy Drug Development | The AAPS Journal [https://link.springer.com/article/10.1208/s12248-023-00880-9]
- 28. High-throughput real-time PCR [https://www.takarabio.com/applications/molecular-diagnostics/solutions/high-throughput-real-time-pcr]
- 29. - RNA validation: seq for software of reference and variable... selection [https://bmcgenomics.biomedcentral.com/articles/10.1186/s12864-024-10511-y]
- 30. RNA-seq validation – software for selection of reference and variable candidate genes for RT-qPCR | RNA-Seq Blog [https://www.rna-seqblog.com/rna-seq-validation-software-for-selection-of-reference-and-variable-candidate-genes-for-rt-qpcr/]
- 31. Choosing the Right RNA Analysis Method: RNA - Seq , NanoString, or... [https://www.eurofins-viracorbiopharma.com/resource-library/posts/2025/june/blog-choosing-the-right-rna-analysis-method-rna-seq-nanostring-or-qpcr/]
- 32. A stable combination of non-stable genes outperforms standard reference genes for RT-qPCR data normalization | Scientific Reports [https://www.nature.com/articles/s41598-024-82651-w]
- 33. , FPKM, or Normalized Counts? A Comparative Study of... TPM [https://translational-medicine.biomedcentral.com/articles/10.1186/s12967-021-02936-w]
- 34. Systematic comparison and assessment of RNA-seq procedures for gene expression quantitative analysis | Scientific Reports [https://www.nature.com/articles/s41598-020-76881-x]
- 35. Consider SNPs when designing and PCR assays | IDT qPCR [https://eu.idtdna.com/page/support-and-education/decoded-plus/considering-snps-when-designing-pcr-and-qpcr-assays/]
- 36. / PCR /dPCR Assay qPCR Design [https://www.sigmaaldrich.com/CY/en/technical-documents/protocol/genomics/pcr/pcr-qpcr-dpcr-assay-design]
- 37. How to design qPCR primers to validate - RNA experiment? seq [https://www.biostars.org/p/337763/]
- 38. Four Free and Easy-To-Use Online Primer Design Tools [https://bitesizebio.com/42836/four-free-and-easy-to-use-online-primer-design-tools/]
- 39. Primer design guide - 5 tips for best PCR results [https://the-dna-universe.com/2022/09/05/primer-design-guide-the-top-5-factors-to-consider-for-optimum-performance/]
- 40. An optimized protocol for stepwise optimization of real-time RT- PCR ... [https://pmc.ncbi.nlm.nih.gov/articles/PMC8325682/]
- 41. Efficiency Calculator - Primer Efficiency & Curve Analysis qPCR [https://cosmomath.com/biology/qpcr-efficiency-calculator/]
- 42. Calculator qPCR Efficiency [https://www.omnicalculator.com/biology/qpcr-efficiency]
- 43. Understanding qPCR and Why It Exceeds Efficiency % 100 [https://biosistemika.com/blog/qpcr-efficiency-over-100/]
- 44. Basic Principles of RT - qPCR | Thermo Fisher Scientific - US [https://www.thermofisher.com/us/en/home/brands/thermo-scientific/molecular-biology/molecular-biology-learning-center/molecular-biology-resource-library/spotlight-articles/basic-principles-rt-qpcr.html]
- 45. Starting with RNA—One-step or two -step RT - qPCR ? | IDT [https://www.idtdna.com/page/support-and-education/decoded-plus/one-step-two-step/]
- 46. of Normalization Methods for Selecting... | Preprints.org Comparison [https://www.preprints.org/manuscript/202511.1273]
- 47. Optimized RT - qPCR and a novel normalization method for validating... [https://www.nature.com/articles/s41598-023-47971-3?error=cookies_not_supported&code=5dbe4a11-3364-4307-acf6-4e21226ab4b8]
- 48. of Branched DNA to Comparison - RT Technology for the... qPCR [https://link.springer.com/article/10.1208/s12248-025-01126-6]
- 49. RNA-seq validation : software for selection of reference and variable... [https://pmc.ncbi.nlm.nih.gov/articles/PMC11251314/]
- 50. of Conventional and Comparative - Validation ... | PLOS One RNA Seq [https://journals.plos.org/plosone/article?id=10.1371/journal.pone.0150651]
- 51. GitHub - rdmesquita/ GSV : Gene Selector for Validation [https://github.com/rdmesquita/GSV]
- 52. Systematic identification and validation of the reference genes from 60... [https://bmcgenomics.biomedcentral.com/articles/10.1186/s12864-019-5661-x]
- 53. repDilPCR: a tool for automated analysis of qPCR assays by the... [https://bmcbioinformatics.biomedcentral.com/articles/10.1186/s12859-024-05954-9]
- 54. - RNA differential expression studies: more sequence or more... seq [https://pubmed.ncbi.nlm.nih.gov/24319002/]
- 55. A comprehensive assessment of RNA-seq accuracy, reproducibility and information content by the Sequencing Quality Control consortium - PMC [https://pmc.ncbi.nlm.nih.gov/articles/PMC4321899/]
- 56. Single Nucleotide Polymorphism-Based System Improves the Applicability of Quantitative PCR for Chimerism Monitoring - PMC [https://www.ncbi.nlm.nih.gov/pmc/articles/PMC2607568/]
- 57. Limitations of alignment-free tools in total RNA-seq quantification | BMC Genomics | Full Text [https://bmcgenomics.biomedcentral.com/articles/10.1186/s12864-018-4869-5]
- 58. RNA-Seq is not required to determine stable reference genes for qPCR normalization - PMC [https://pmc.ncbi.nlm.nih.gov/articles/PMC8912902/]
- 59. qPCR and qRT-PCR analysis: Regulatory points to consider when conducting biodistribution and vector shedding studies - PMC [https://pmc.ncbi.nlm.nih.gov/articles/PMC7786041/]
- 60. The MIQE : minimum information for publication of... guidelines [https://pubmed.ncbi.nlm.nih.gov/19246619/]
- 61. Consensus guidelines for the validation of qRT-PCR assays in clinical research by the CardioRNA consortium - PMC [https://pmc.ncbi.nlm.nih.gov/articles/PMC8792405/]
- 62. MISEV and MIQE : integrating domain-specific and general standards to... [https://www.oaepublish.com/articles/evcna.2025.68]
- 63. The Ultimate qPCR Experiment: Producing Publication Quality, Reproducible Data the First Time - ScienceDirect [https://www.sciencedirect.com/science/article/pii/S0167779918303421]
- 64. Top 11 qPCR Papers Every Researcher Should Know [https://bitesizebio.com/62143/qpcr-papers/]
- 65. Use of RNA - seq data to identify and validate RT- qPCR reference... [https://www.nature.com/articles/srep44905?error=cookies_not_supported]
- 66. Analytical Sensitivity and Specificity of Two RT-qPCR Protocols for SARS-CoV-2 Detection Performed in an Automated Workflow - PubMed [https://pubmed.ncbi.nlm.nih.gov/33053675/]
- 67. Benchmarking of RNA-sequencing analysis workflows using... [https://pubmed.ncbi.nlm.nih.gov/28484260/]
- 68. GitHub - AyehBlk/RAPTOR: RNA - seq Analysis Pipeline Testing and... [https://github.com/AyehBlk/RAPTOR]
- 69. RNA Sequencing | RNA - Seq & workflows methods [https://emea.illumina.com/techniques/sequencing/rna-sequencing.html]
- 70. Gene Ranking of RNA - Seq Data via Discriminant... | PLOS One [https://journals.plos.org/plosone/article?id=10.1371/journal.pone.0137782]
- 71. Analyzing fold when Cq value in treatment condition is 0 (not...) change [https://www.biostars.org/p/338812/]
- 72. Frontiers | Long Non -coding RNAs: Mechanisms, Experimental , and... [https://www.frontiersin.org/journals/genetics/articles/10.3389/fgene.2021.649619/full]
- 73. Expression estimation and eQTL mapping for HLA genes with a personalized pipeline | PLOS Genetics [https://journals.plos.org/plosgenetics/article?id=10.1371/journal.pgen.1008091]
- 74. between Comparison and qPCR - RNA reveals challenges of... seq [https://link.springer.com/article/10.1007/s00251-023-01296-7]
- 75. HLA typing from RNA-Seq sequence reads | Genome Medicine | Full Text [https://genomemedicine.biomedcentral.com/articles/10.1186/gm403]
- 76. Prediction of HLA genotypes from single-cell transcriptome data - PMC [https://pmc.ncbi.nlm.nih.gov/articles/PMC10167300/]
- 77. Frontiers | Prediction of HLA genotypes from single-cell transcriptome data [https://www.frontiersin.org/journals/immunology/articles/10.3389/fimmu.2023.1146826/full]
- 78. Comparison between qPCR and RNA-seq reveals challenges of quantifying HLA expression - PubMed [https://pubmed.ncbi.nlm.nih.gov/36707444/]