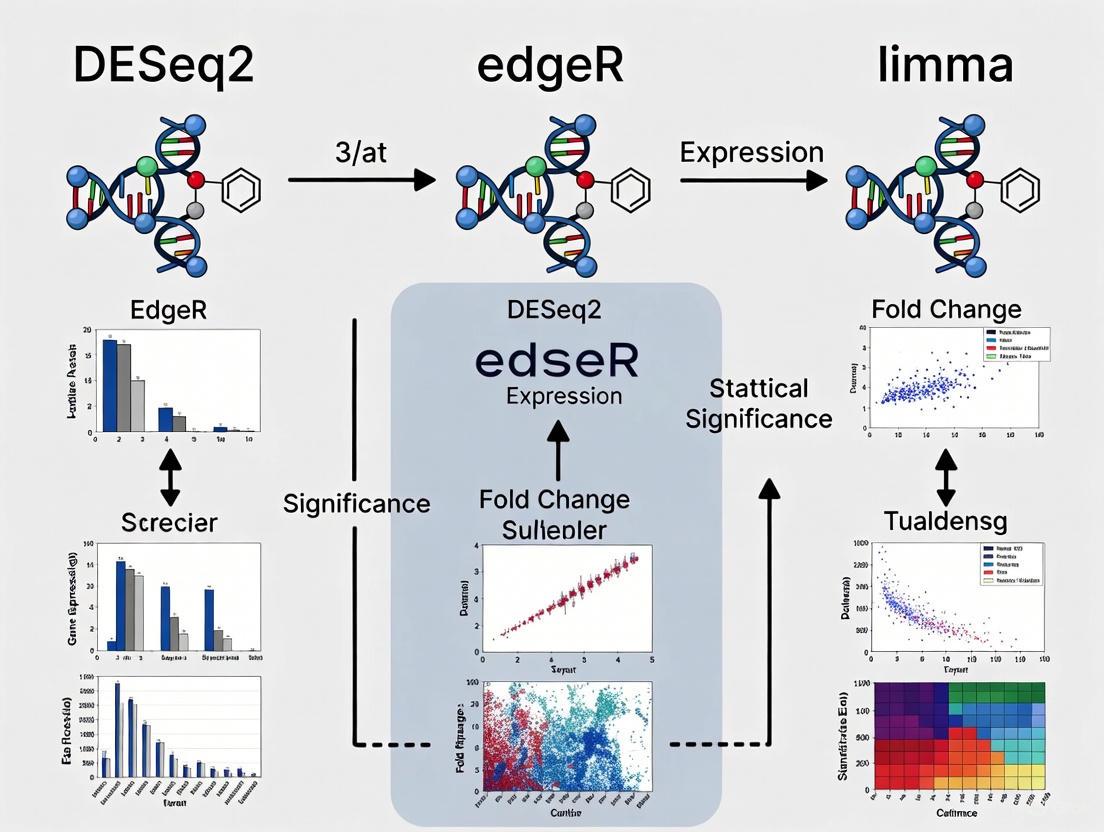
Benchmarking Differential Expression Tools: A Practical Guide to Choosing Between DESeq2, edgeR, and limma
Selecting the optimal tool for differential expression (DE) analysis is a critical decision in RNA-seq studies, directly impacting the biological insights gained.
Benchmarking Differential Expression Tools: A Practical Guide to Choosing Between DESeq2, edgeR, and limma
Abstract
Selecting the optimal tool for differential expression (DE) analysis is a critical decision in RNA-seq studies, directly impacting the biological insights gained. This article provides a comprehensive, evidence-based guide for researchers and bioinformaticians on the three most widely used DE tools: DESeq2, edgeR, and limma (voom). We synthesize findings from recent benchmarking studies to explain the core statistical foundations of each method, provide practical workflows for implementation, address common challenges like small sample sizes and batch effects, and offer direct performance comparisons. Our goal is to empower you to make an informed tool selection for your specific experimental design and data characteristics, thereby ensuring robust, reliable, and interpretable results in biomedical and clinical research.
Understanding the Core Statistical Engines: How DESeq2, edgeR, and limma Work
In the field of genomics research, particularly in differential gene expression (DGE) analysis from RNA-sequencing (RNA-seq) data, the choice of statistical model fundamentally shapes the reliability and interpretation of results. Next-generation sequencing technologies generate complex count-based data that require specialized statistical approaches to distinguish biological signals from technical noise and natural variability. The core methodological division in this domain lies between negative binomial regression and linear modeling frameworks, each with distinct theoretical foundations and practical implications.
RNA-seq data analysis presents unique challenges that demand robust statistical solutions. The data are characterized by their high dimensionality, with tens of thousands of genes measured across typically limited sample sizes, and inherent technical variability introduced during library preparation and sequencing. Furthermore, count-based expression measurements often exhibit overdispersion—where the variance exceeds the mean—violating key assumptions of traditional parametric tests. These characteristics have spurred the development of specialized tools, primarily DESeq2, edgeR, and limma, which implement different statistical approaches to address these challenges while optimizing for power, false discovery control, and computational efficiency.
Theoretical Foundations
Negative Binomial Distribution and Regression
The negative binomial distribution is a discrete probability distribution that models the number of failures in a sequence of independent and identically distributed Bernoulli trials before a specified number of successes occurs. In the context of RNA-seq data analysis, it serves as a flexible extension to the Poisson distribution for modeling count data where the variance exceeds the mean.
The probability mass function of the negative binomial distribution is defined as:
$$f(k; r, p) = \binom{k + r - 1}{k} (1-p)^k p^r$$
Where k is the number of failures, r is the number of successes, and p is the probability of success in each trial. For RNA-seq applications, the distribution is reparameterized in terms of the mean μ and dispersion parameter, providing a more intuitive framework for modeling count data [1].
The key advantage of the negative binomial distribution for genomic applications is its ability to model overdispersed count data through the dispersion parameter, which accommodates the extra-Poisson variation commonly observed in sequencing experiments. The variance of a negative binomial random variable Y is given by:
$$var(Y) = \mu + \mu^2/k$$
where k is the dispersion parameter. As k approaches infinity, the variance converges to the mean, and the negative binomial distribution reduces to the Poisson distribution. This relationship makes the negative binomial model a generalized form that can adapt to the degree of overdispersion present in the data [2].
Negative binomial regression extends this distribution to a regression framework, allowing researchers to model count outcomes as functions of predictor variables while accounting for overdispersion. This approach is particularly valuable in genomics because it explicitly models the mean-variance relationship in count data, providing more accurate inference compared to Poisson regression when overdispersion is present.
Linear Modeling with Empirical Bayes Moderation
Linear models form the foundation of many statistical approaches, assuming a continuous, normally distributed response variable. For RNA-seq data analysis, the limma package employs a modified linear modeling approach that incorporates specific adaptations to handle count-based expression data.
The core linear model can be represented as:
$$Y = X\beta + \epsilon$$
Where Y is the response vector, X is the design matrix of predictors, β is the coefficient vector, and ε represents normally distributed errors with constant variance.
The fundamental challenge in applying linear models to RNA-seq data is the violation of normality and homoscedasticity assumptions. Count data are inherently discrete and often exhibit variance that depends on the mean expression level. To address these limitations, limma employs a voom transformation that converts count data to log-counts per million (log-CPM) values and estimates mean-variance relationships to compute precision weights for each observation. This transformation allows the application of linear modeling frameworks while accounting for heteroscedasticity [3].
A key innovation in limma is the application of empirical Bayes moderation, which borrows information across genes to stabilize variance estimates. This approach is particularly powerful in genomics experiments with small sample sizes, where gene-specific variance estimates would otherwise be unreliable. By shrinking extreme variance estimates toward a common value, limma improves the reliability of statistical inference and increases power to detect differentially expressed genes [3].
Direct Comparative Analysis
Core Methodological Differences
Table 1: Fundamental Differences Between Negative Binomial and Linear Modeling Approaches
| Aspect | Negative Binomial Approach | Linear Modeling Approach |
|---|---|---|
| Theoretical Foundation | Discrete probability distribution for overdispersed count data | Continuous probability distribution with normality assumptions |
| Variance Handling | Explicit modeling via dispersion parameter: $var(Y) = \mu + \mu^2/k$ | Precision weights based on mean-variance relationship (voom) |
| Data Type | Raw counts | Transformated counts (log-CPM) |
| Dispersion Estimation | Gene-specific dispersion with empirical Bayes shrinkage | Mean-variance trend with empirical Bayes moderation |
| Distributional Assumptions | Negative binomial distribution | Normal distribution after transformation |
The negative binomial and linear modeling approaches differ fundamentally in their treatment of count data. Negative binomial models, as implemented in DESeq2 and edgeR, treat RNA-seq counts as realizations of a negative binomial process, explicitly modeling the mean and variance through parameters that capture both expression level and overdispersion. This approach maintains the discrete nature of the data throughout the analysis pipeline, with dispersion parameters estimated through sophisticated shrinkage methods that balance gene-specific and global information [2] [4].
In contrast, the linear modeling approach implemented in limma transforms count data to continuous values that better satisfy normality assumptions. The voom transformation not only converts counts to log-CPM values but also calculates precision weights for each observation based on the predicted mean-variance relationship. These weights ensure that observations with lower expected variability (typically low-count genes) receive less influence in the model fitting process, while observations with higher expected variability receive more weight. This approach effectively handles heteroscedasticity while leveraging the computational efficiency and flexibility of linear model frameworks [3].
Performance Characteristics
Table 2: Performance Comparison of RNA-seq Differential Expression Tools
| Tool | Core Method | Ideal Sample Size | Strengths | Limitations |
|---|---|---|---|---|
| DESeq2 | Negative binomial regression with empirical Bayes shrinkage | ≥3 replicates, performs better with more | Robust with high biological variability, strong FDR control, automatic outlier detection | Computationally intensive for large datasets, conservative fold change estimates |
| edgeR | Negative binomial regression with flexible dispersion estimation | ≥2 replicates, efficient with small samples | Excellent with low-count genes, multiple testing strategies, technical replicates | Requires careful parameter tuning, common dispersion may miss gene-specific patterns |
| limma-voom | Linear modeling with voom transformation and empirical Bayes moderation | ≥3 replicates per condition | Handles complex designs elegantly, computational efficiency, integrates with other omics | May not handle extreme overdispersion well, requires careful QC of voom transformation |
Benchmarking studies have revealed nuanced performance differences between these approaches. A comprehensive evaluation of five DGE models (DESeq2, voom+limma, edgeR, EBSeq, NOISeq) found that while all methods showed reasonable performance, their relative robustness followed specific patterns. Overall, the non-parametric method NOISeq was most robust, followed by edgeR, voom, EBSeq, and DESeq2. These patterns proved dataset-agnostic and reliable for drawing conclusions when sample sizes were sufficiently large [5].
Another independent benchmarking study comparing StringTie2, bambu, DESeq2, edgeR and limma-voom found that DESeq2, edgeR and limma-voom performed best among differential transcript expression tools tested [6]. The specific advantages of each tool often depend on experimental conditions—limma demonstrates remarkable versatility and computational efficiency, particularly with large-scale datasets, while edgeR excels in analyzing genes with low expression counts where its flexible dispersion estimation better captures variability in sparse count data [3].
Experimental Protocols and Workflows
Negative Binomial Regression Implementation
The implementation of negative binomial regression in RNA-seq analysis follows a structured workflow with specific steps for normalization, dispersion estimation, and statistical testing. DESeq2 and edgeR, while sharing a common theoretical foundation, differ in their specific algorithmic approaches.
DESeq2 Workflow:
- Data Input: Raw count matrix with genes as rows and samples as columns
- Normalization: Median-of-ratios method to correct for library size and RNA composition biases
- Dispersion Estimation: Gene-wise dispersion estimates followed by empirical Bayes shrinkage toward a fitted trend
- Model Fitting: Generalized linear model with negative binomial family and logarithmic link function
- Hypothesis Testing: Wald tests or likelihood ratio tests with Benjamini-Hochberg multiple testing correction
edgeR Workflow:
- Data Input: Raw count matrix organized as a DGEList object
- Normalization: Trimmed Mean of M-values (TMM) method to account for compositional differences
- Dispersion Estimation: Common, trended, or tagwise dispersion estimates using empirical Bayes methods
- Model Fitting: Generalized linear models with quantile-adjusted conditional maximum likelihood
- Hypothesis Testing: Exact tests, likelihood ratio tests, or quasi-likelihood F-tests
The following workflow diagram illustrates the key steps in negative binomial-based RNA-seq analysis:
Linear Modeling with Voom Transformation
The limma-voom approach implements a different workflow that transforms count data to enable the application of linear models:
Limma-voom Workflow:
- Data Input: Raw count matrix with genes as rows and samples as columns
- Filtering: Remove lowly expressed genes (e.g., requiring minimum counts per million in a minimum number of samples)
- Normalization: Between-sample normalization using TMM or quantile methods
- Voom Transformation: Convert counts to log-CPM values with precision weights
- Linear Modeling: Fit linear models to transformed data
- Empirical Bayes Moderation: Shrink gene-wise variances toward a common value
- Hypothesis Testing: Moderated t-statistics with Benjamini-Hochberg multiple testing correction
The workflow for limma-voom analysis can be visualized as follows:
Benchmarking Results and Experimental Data
Quantitative Performance Metrics
Multiple benchmarking studies have evaluated the performance of negative binomial and linear modeling approaches using both real and synthetic datasets. These evaluations typically assess methods based on sensitivity, false discovery rate control, computational efficiency, and robustness to varying experimental conditions.
Table 3: Benchmarking Results from Comparative Studies
| Study | Dataset Characteristics | Top Performing Methods | Key Findings |
|---|---|---|---|
| Sciencedirect (2022) [5] | Breast cancer data; full and reduced sample sizes | NOISeq > edgeR > voom > EBSeq > DESeq2 | Pattern of robustness was dataset-agnostic; performance consistent with sufficient sample sizes |
| RNA-seq Blog (2022) [6] | Human lung adenocarcinoma cell lines with spike-ins | DESeq2, edgeR, limma-voom | All three methods performed best for differential transcript expression; no clear front-runner |
| BMC Genomics (2024) [7] | Plant pathogenic fungi, animal, and plant data | Tool performance varied by species | No single tool performed optimally across all species; recommendations should be species-specific |
A rigorous evaluation of DGE methods using controlled analyses of fixed count matrices from breast cancer datasets found distinct patterns of robustness across methods. The study evaluated performance at different expression levels (high and low) and used unbiased metrics including test sensitivity estimated as relative false discovery rate (FDR) and concordance between model outputs. The overall robustness pattern showed NOISeq as the most robust, followed by edgeR, voom, EBSeq, and DESeq2. These patterns proved consistent across datasets when sample sizes were sufficiently large [5].
Another benchmarking experiment using human lung adenocarcinoma cell lines with synthetic spike-in RNAs (sequins) created in silico mixture samples to assess performance in the absence of true positives or true negatives. The results demonstrated that DESeq2, edgeR and limma-voom were the best performers among the five differential transcript expression tools tested [6].
Concordance Across Methods
Despite their methodological differences, studies have shown remarkable agreement between the DEGs identified by negative binomial-based tools (DESeq2, edgeR) and linear modeling approaches (limma-voom). One analysis reported substantial overlap in significant DEGs identified by all three methods, strengthening confidence in results when different statistical approaches converge on similar biological conclusions [3].
The agreement between methods tends to be higher for genes with large fold changes and strong statistical support, while discrepancies often occur for genes with subtle expression differences or unusual expression characteristics. This concordance pattern underscores the complementary nature of these approaches and supports the practice of using multiple methods to increase confidence in identified DEGs, particularly for follow-up experimental validation.
Practical Implementation Guidelines
Research Reagent Solutions
Table 4: Essential Tools and Packages for Differential Expression Analysis
| Tool/Package | Function | Implementation |
|---|---|---|
| DESeq2 | Negative binomial-based DGE analysis | R/Bioconductor |
| edgeR | Negative binomial-based DGE analysis | R/Bioconductor |
| limma | Linear modeling framework | R/Bioconductor |
| voom | Mean-variance transformation for count data | Part of limma package |
| FastQC | Quality control of raw sequencing reads | Java application |
| Trimmomatic | Adapter trimming and quality filtering | Java application |
| Salmon | Transcript quantification | C++ application |
| tximport | Import transcript-level estimates | R/Bioconductor |
Selection Criteria for Method Choice
The choice between negative binomial and linear modeling approaches depends on multiple factors related to experimental design, data characteristics, and research objectives:
Sample Size Considerations:
- For very small sample sizes (n < 5 per group), edgeR's robust dispersion estimation often provides advantages
- For moderate to large sample sizes (n > 10 per group), all three methods perform well, with DESeq2 offering strong FDR control
- For complex experimental designs with multiple factors, limma's flexible linear modeling framework excels
Data Characteristics:
- For data with extreme overdispersion, negative binomial approaches (particularly edgeR) may be more appropriate
- For data with strong batch effects or technical artifacts, limma's integration with combat or other batch correction methods is advantageous
- For experiments focusing on low-abundance transcripts, edgeR's handling of low-count genes provides benefits
Computational Considerations:
- For large-scale datasets (thousands of samples), limma offers superior computational efficiency
- For standard-sized experiments (10-100 samples), all three tools have reasonable computational requirements
- For pipeline automation, DESeq2's automated outlier detection and independent filtering can streamline analysis
The field continues to evolve with emerging methodologies that blend aspects of both approaches. Recent developments include improved shrinkage estimators for dispersion parameters in negative binomial models and enhanced variance modeling in transformed linear models. As single-cell RNA-seq technologies become more prevalent, adaptations of both frameworks are being developed to handle the additional zero-inflation and technical variability characteristic of these data.
In RNA sequencing (RNA-seq) analysis, the data generated are not absolute measurements but relative abundances [8]. The total number of sequenced reads (library size) is a technical constraint, meaning the count for an individual gene is only interpretable relative to the counts of all other genes in that sample [8]. Normalization is the critical computational process that removes these technical artifacts, such as differences in sequencing depth and RNA composition, to enable accurate biological comparisons [9].
Within the context of benchmarking differential expression tools like DESeq2, edgeR, and limma, the choice of data transformation and normalization method is foundational. These tools employ distinct core strategies: DESeq2 uses the Median of Ratios method, edgeR uses the Trimmed Mean of M-values (TMM), and limma, when applied to RNA-seq data, typically uses the voom transformation. Understanding these methodologies is essential for researchers, scientists, and drug development professionals to select the appropriate tool and interpret results reliably for robust biomarker discovery and diagnostic development.
Core Methodologies and Statistical Foundations
The three methods—TMM, Median of Ratios, and voom—represent different philosophical and statistical approaches to preparing RNA-seq count data for differential expression analysis.
Trimmed Mean of M-values (TMM) - edgeR
TMM normalization is designed to be robust against highly expressed genes and differences in RNA composition between samples [9]. The method operates under the assumption that most genes are not differentially expressed (DE) [10].
- Core Protocol: TMM calculates scaling factors between a test sample and a reference sample (often an actual sample chosen from the dataset). It considers the log-fold-changes (M-values) and absolute expression levels (A-values) for all genes.
- Key Steps:
- M-value Calculation: For each gene, compute the log2 ratio of expression between the test and reference sample ( M = \log2(\frac{test}{reference}) ).
- A-value Calculation: Compute the average log expression ( A = \frac{1}{2} \times \log2(test \times reference) ).
- Trimming: Genes with extreme M-values (differential expression) and extreme A-values (very high or low expression) are trimmed.
- Weighted Average: A weighted average of the remaining M-values is calculated, with weights derived from the inverse of the approximate asymptotic variances. This final average is the TMM scaling factor for that test sample [10].
Median of Ratios - DESeq2
The Median of Ratios method, used by DESeq2, is also predicated on the assumption that the majority of genes are not DE [10]. It is considered a robust method that can handle large variations in expression levels [9].
- Core Protocol: The method computes a scaling factor for each sample by finding the median of the ratios of a gene's count to its geometric mean across all samples.
- Key Steps:
- Geometric Mean Calculation: For each gene, calculate its geometric mean across all samples.
- Ratio Calculation: For each gene in a sample, compute the ratio of its count to the gene's geometric mean.
- Scaling Factor: The scaling factor for a given sample is the median of all gene ratios for that sample, excluding genes with a geometric mean of zero [10].
voom - limma
The voom method differs fundamentally from TMM and Median of Ratios. Rather than being a pure normalization method, it is a data transformation and weighting procedure that adapts the mature empirical Bayes linear modeling framework of limma—originally developed for microarray data—for RNA-seq count data [11].
- Core Protocol: voom estimates the mean-variance relationship of the log-counts and generates a precision weight for each observation, which are then fed into the limma analysis pipeline [11].
- Key Steps:
- Log-Transformation: Counts are converted to log-counts per million (log-cpm) to account for sequencing depth.
- Linear Modeling: A linear model is fitted to the log-cpm values for each gene.
- Mean-Variance Trend: The square-root of the residual standard deviation of each gene is plotted against its average log-count.
- Precision Weights: A smoothed curve is fitted to this mean-variance trend, which is used to assign a precision weight to every single observed log-cpm value. These weights are used in the downstream linear modeling in limma to account for heteroscedasticity [11].
The following diagram illustrates the core logical workflow of the voom method:
Comparative Analysis and Benchmarking
A systematic comparison of these methods reveals their relative strengths, ideal use cases, and performance characteristics, which is crucial for informed tool selection.
Method Comparison Table
The table below summarizes the key characteristics of the normalization and transformation methods used by the three primary differential expression tools.
| Aspect | DESeq2 (Median of Ratios) | edgeR (TMM) | limma (voom) |
|---|---|---|---|
| Core Statistical Approach | Negative binomial modeling with empirical Bayes shrinkage [3] | Negative binomial modeling with flexible dispersion estimation [3] | Linear modeling with empirical Bayes moderation and precision weights (voom) [3] [11] |
| Normalization Philosophy | Geometric-based scaling factor [10] | Weighted trimmed mean of log ratios [10] | Precision weights for log-transformed counts (log-cpm) [11] |
| Key Assumption | Most genes are not differentially expressed [10] | Most genes are not differentially expressed [10] | Correct mean-variance relationship is key, even if exact distribution isn't normal [11] |
| Ideal Sample Size | ≥3 replicates, performs well with more [3] | ≥2 replicates, efficient with small samples [3] | ≥3 replicates per condition [3] |
| Handling of Library Size Variation | Accounts for it via size factors. | Accounts for it via scaling factors for library sizes [10]. | voom is the clear best performer when sequencing depths are substantially different [11]. |
| Computational Efficiency | Can be intensive for large datasets [3] | Highly efficient, fast processing [3] | Very efficient, scales well with large datasets [3] |
Experimental Protocols for Benchmarking
To objectively compare the performance of DESeq2, edgeR, and limma-voom, a standardized benchmarking protocol can be employed. The following methodology, drawn from experimental comparisons, provides a framework for a robust appraisal.
1. Data Acquisition and Preparation:
- Obtain publicly available RNA-seq datasets with a relatively large number of biological replicates to establish a "ground truth" [5]. Two such datasets were used in a 2021 robustness study.
- From the full datasets, create subsets with progressively reduced sample sizes (e.g., n=8, 6, 4 per group) to evaluate performance with limited replication [5].
2. Differential Expression Analysis:
- Run DESeq2, edgeR, and limma-voom on the full and reduced datasets, following established protocols for each tool [3] [12].
- For DESeq2: Create a
DESeqDataSetfrom the count matrix and metadata, then run theDESeq()function. Results are extracted using theresults()function with a specified false discovery rate (FDR) threshold (e.g., 5%) and fold-change threshold (e.g., 2-fold) [3]. - For edgeR: Create a
DGEListobject, normalize usingcalcNormFactors(which implements TMM), estimate dispersion withestimateDisp, and perform testing usingglmQLFTest(quasi-likelihood F-test) [3]. - For limma-voom: The
voom()function is applied to the count data to transform it and calculate weights. The output is then fed intolmFitfor linear modeling, followed byeBayesfor empirical Bayes moderation [3] [11].
3. Performance Evaluation Metrics:
- Concordance: Assess the overlap of differentially expressed genes (DEGs) identified by the different methods using Venn diagrams and Jaccard indices [13].
- Robustness/Sensitivity: Estimate the relative False Discovery Rate (FDR) across different library sizes. Generate a 'population' of slopes from linear regressions of relative FDRs against sequencing depth; flatter slopes indicate greater robustness [5].
Benchmarking Results and Comparative Performance
Empirical studies provide insights into how these methods perform in practice. A key finding is that while there is a core set of DEGs identified by all methods, each tool also detects a unique subset of genes, reflecting their different statistical models [13].
Reported Findings:
- Concordance: A comparative analysis showed that DESeq2 and edgeR, both based on negative binomial models, have high overlap. DESeq2 often appears less stringent, calling more DEGs, while edgeR may be more conservative. Limma-voom can be more "transversal," identifying a substantial core of common genes but also a unique set not detected by the other methods [13].
- Robustness: A 2021 study investigating robustness to sequencing alterations and sample size found that the pattern of method performance was consistent across datasets. The non-parametric method NOISeq was the most robust, followed by edgeR, voom, and then DESeq2 [5].
- Error Control: A key advantage of the limma pipelines (both voom and limma-trend) is their accurate control of the Type I error rate (false positives) even with very small sample sizes. Methods based on the negative binomial distribution can sometimes be overly liberal or conservative when sample sizes are small [11].
The diagram below visualizes the typical relationship and overlapping results from the three tools, as often revealed by a Venn diagram of their outputs.
The Scientist's Toolkit: Essential Research Reagents and Computational Tools
The following table details key software solutions and their functions essential for conducting differential expression analysis with DESeq2, edgeR, and limma.
| Tool / Resource | Function in Analysis |
|---|---|
| R Statistical Environment | The open-source software platform in which all three packages (DESeq2, edgeR, limma) are run and integrated. |
| Bioconductor Project | A repository for bioinformatics R packages, providing the installation and maintenance framework for DESeq2, edgeR, and limma. |
| DESeq2 Package | Performs differential expression analysis using the Median of Ratios normalization and negative binomial generalized linear models. |
| edgeR Package | Performs differential expression analysis using TMM normalization and negative binomial models with multiple dispersion estimation options. |
| limma Package | Provides the core linear modeling and empirical Bayes moderation framework; when combined with the voom function, it is applied to RNA-seq data. |
| VennDiagram Package | An R tool used to visualize the overlap and differences in DEG lists generated by the different methods, facilitating comparative interpretation [3]. |
The choice between TMM (edgeR), Median of Ratios (DESeq2), and voom (limma) is not a matter of one being universally superior, but rather of selecting the right tool for the specific experimental context and data characteristics.
- For very small sample sizes (n=2-3), edgeR is highly efficient and specifically developed for such scenarios [3].
- For moderate to large sample sizes or data with high biological variability, DESeq2 is a strong choice, known for its robust normalization and careful control of false positives [3] [5].
- For complex experimental designs (e.g., multiple factors, time series) or when sequencing depths vary substantially, limma with voom is highly recommended. Its access to the mature limma pipeline allows for sophisticated modeling, and it provides excellent error control [3] [11].
- For maximum confidence in results, a robust strategy is to use two different methods (e.g., DESeq2 and edgeR) and focus on the intersecting set of DEGs, acknowledging that this may increase false negatives while reducing false positives [13].
In the broader thesis of benchmarking these tools, the evidence indicates that while the results from DESeq2, edgeR, and limma-voom are partly overlapping, each has its own strengths. The decision on which method to use should be informed by the data itself and the specific questions being asked [12].
Accurately estimating variance is a fundamental challenge in the analysis of RNA sequencing data. Unlike microarray data, RNA-seq data consists of count-based readings that exhibit over-dispersion—where variance exceeds the mean—making traditional Poisson models inadequate. The negative binomial model has emerged as the standard approach, as it incorporates a dispersion parameter to account for this extra variance. However, with typically few biological replicates in experiments, estimating gene-specific dispersion reliably becomes statistically problematic. This is where Empirical Bayes shrinkage methods play a crucial role, improving variance estimation by borrowing information across all genes to stabilize dispersion estimates.
Within the context of benchmarking differential expression tools, the approaches taken by DESeq2, edgeR, and limma to handle dispersion estimation represent a core differentiator in their performance. This guide objectively compares their methodologies, supported by experimental data, to inform researchers and drug development professionals in selecting the appropriate tool for their experimental context.
Theoretical Foundations of Variance Estimation
The Negative Binomial Model and the Dispersion Parameter
In RNA-seq data analysis, the count of reads mapped to a gene in a given sample is modeled using a negative binomial (NB) distribution. This model is characterized by a mean parameter (μ), representing expected expression, and a dispersion parameter (ϕ), which quantifies the variance relative to the mean. The relationship is defined as Variance = μ + ϕμ² [14]. The first term (μ) represents the variance from Poisson sampling error, while the second term (ϕμ²) represents the variance from biological replication [14]. A key challenge is that in studies with limited replicates, direct gene-specific dispersion estimates are highly unstable.
The Role of Empirical Bayes Shrinkage
Empirical Bayes (EB) shrinkage addresses this problem by partially pooling data across genes. Instead of estimating each gene's dispersion in isolation, the method shrinks gene-specific estimates toward a common prior or a trended value based on the mean expression [14] [15]. This approach stabilizes estimates, particularly for genes with low counts or few replicates, and balances specificity with sensitivity in differential expression detection. Shrinkage prevents false positives from dispersion underestimation and maintains power by avoiding overestimation [16] [15].
Comparative Analysis of DESeq2, edgeR, and limma
Core Methodologies and Dispersion Handling
Table 1: Core Statistical Approaches to Variance Estimation
| Tool | Core Statistical Approach | Dispersion Estimation Strategy | Shrinkage Intensity |
|---|---|---|---|
| DESeq2 | Negative binomial GLM with EB shrinkage | Shrinks dispersions toward a trend (mean-expression dependent) [3] | Moderate |
| edgeR | Negative binomial GLM with EB shrinkage | Offers common, trended, and tagwise dispersion; robust options for complex designs [3] | Moderate to flexible |
| limma (voom) | Linear modeling of log-CPM with precision weights | Transforms counts via voom and applies EB moderation of gene variances [3] |
Moderate |
DESeq2 utilizes a parametric curve that models dispersion as a function of the mean expression. It then shrinks gene-wise dispersion estimates toward this predicted trend. This method provides stable estimates even with minimal replicates [14].
edgeR offers a more flexible suite of options. It can estimate a common dispersion for all genes, a trended dispersion dependent on the mean, or gene-specific (tagwise) dispersions that are shrunk toward the overall trend. Its weighted conditional maximum likelihood approach allows for a tunable degree of shrinkage [15].
limma, traditionally used for microarray data, was adapted for RNA-seq through the voom transformation. The voom method converts count data into log-counts per million (log-CPM) and estimates a mean-variance relationship to calculate precision weights for each observation. Subsequently, EB moderation is applied to the gene-level variances, not the dispersions directly, making it a uniquely effective hybrid approach [3].
Performance and Benchmarking Data
Benchmarking studies consistently reveal that no single tool is universally superior; performance is highly dependent on experimental design, sample size, and the underlying biological context.
Table 2: Performance Comparison Based on Benchmarking Studies
| Performance Metric | DESeq2 | edgeR | limma (voom) |
|---|---|---|---|
| Small Sample Sizes (n < 5) | Good, conservative | Excellent, highly efficient [3] | Requires ≥3 replicates for powerful moderation [3] |
| Large Sample Sizes | Excellent, strong FDR control [3] | Excellent, fast processing [3] | Very efficient, scales well [3] |
| Handling Low-Count Genes | Good | Excellent, flexible dispersion estimation helps [3] | May not handle extreme over-dispersion as well [3] |
| Computational Efficiency | Can be intensive for large datasets [3] | Highly efficient, fast processing [3] | Very efficient, scales well [3] |
| Concordance with Other Tools | High agreement with edgeR and limma in real datasets [3] [17] | High agreement with DESeq2 and limma in real datasets [3] [17] | High agreement with DESeq2 and edgeR in real datasets [3] [17] |
A large-scale, multi-center benchmarking study using the Quartet and MAQC reference materials demonstrated that while inter-laboratory variations exist, there is a remarkable level of agreement in the differentially expressed genes identified by limma, edgeR, and DESeq2. This concordance strengthens confidence in results, as each tool uses distinct statistical approaches yet arrives at similar biological conclusions [17].
Another study highlighted that the choice of dispersion estimation method directly impacts the power and error rate of differential expression tests. Methods employing a moderate degree of shrinkage, such as those in edgeR and DESeq2, were found to maximize test performance, striking an optimal balance between false discoveries and detection power [15].
Experimental Protocols and Workflows
Typical Differential Expression Analysis Workflow
The following diagram illustrates the standard workflow for a differential expression analysis, highlighting the key steps where variance estimation occurs.
Detailed Protocols for Key Experiments
Objective: To assess the accuracy and reproducibility of DEG detection by different tools using samples with known "ground truth."
Materials: Quartet reference materials (samples with small biological differences) and MAQC reference materials (samples with large biological differences), spiked-in ERCC RNA controls.
Methodology:
- Sample Preparation and Sequencing: Distribute reference materials to multiple participating laboratories. Each laboratory prepares libraries using their in-house protocols and sequences them on their chosen platform.
- Data Processing: Obtain raw sequencing reads (FASTQ files) from all laboratories.
- Quality Assessment: Use metrics like Signal-to-Noise Ratio (SNR) based on Principal Component Analysis (PCA) to gauge data quality and the ability to distinguish biological signals from technical noise.
- Differential Expression Analysis: Process the high-quality data through fixed and tool-specific pipelines (DESeq2, edgeR, limma-voom) to identify DEGs between sample groups.
- Performance Evaluation:
- Accuracy: Compare the list of DEGs generated by each tool to the established reference datasets and built-in truths (e.g., ERCC spike-in ratios, known sample mixing ratios).
- Reproducibility: Assess the consistency of DEG lists across different laboratories and pipelines.
Objective: To evaluate the impact of different dispersion estimation methods on the performance of tests for differential expression.
Methodology:
- Parameter Estimation from Real Data: Use a large, well-replicated RNA-seq dataset (e.g., the Cheung data with 41 individuals [14]) to estimate realistic gene-specific mean expressions and dispersions.
- Data Simulation: Generate pseudo-datasets by drawing counts from a negative binomial distribution using the parameters obtained in the previous step. The simulation should include a set of genes that are truly differentially expressed between two groups and a set that is not.
- Dispersion Estimation and Testing: Apply multiple dispersion estimation methods (e.g., DESeq2's and edgeR's EB methods, simple gene-wise MLE) to the simulated data. Then, perform differential expression testing using the respective dispersions.
- Performance Metrics Calculation:
- Calculate the False Discovery Rate (FDR) and the True Positive Rate (TPR) for each method.
- Plot Receiver Operating Characteristic (ROC) curves to visualize the trade-off between sensitivity and specificity.
The Scientist's Toolkit
Table 3: Essential Research Reagents and Computational Tools
| Item Name | Type | Primary Function | Relevance to Variance Estimation |
|---|---|---|---|
| Reference Materials | Biological Sample | Provide "ground truth" for benchmarking | Enables empirical assessment of tool accuracy using samples like Quartet and MAQC [17]. |
| ERCC Spike-In Controls | Synthetic RNA | Act as internal controls with known concentrations | Allows for accuracy assessment of absolute gene expression and variance modeling [17]. |
| FastQC | Software | Quality control of raw sequencing reads | Identifies sequencing artifacts and biases that can contribute to unwanted variance [18]. |
| Trimmed Mean of M-values (TMM) | Algorithm | Normalizes for library composition differences | Corrects for compositional biases across samples, a prerequisite for accurate dispersion estimation [3] [18]. |
| DESeq2 | R/Bioconductor Package | Differential expression analysis | Implements trend-based EB shrinkage for dispersion parameters [3]. |
| edgeR | R/Bioconductor Package | Differential expression analysis | Offers flexible EB shrinkage for dispersion (common, trended, tagwise) [3] [15]. |
| limma-voom | R/Bioconductor Package | Differential expression analysis | Applies EB moderation to gene variances after a count data transformation [3]. |
The handling of variance through Empirical Bayes shrinkage is a sophisticated statistical solution to a fundamental problem in RNA-seq analysis. DESeq2, edgeR, and limma-voom have all integrated this principle into their cores, albeit through different technical implementations.
For researchers and drug development professionals, the choice of tool should be guided by the specific experimental context:
- For studies with very small sample sizes (n=2-5), edgeR is often the most powerful and efficient choice.
- For analyses requiring complex experimental designs or integration with other omics data types, limma-voom provides exceptional flexibility and performance, provided there are at least three replicates.
- For general use with moderate to large sample sizes, and when strong false discovery rate control is a priority, DESeq2 is an excellent and robust option.
Ultimately, the high concordance often observed between these tools in well-controlled experiments is a testament to the maturity and effectiveness of the EB shrinkage framework. Adhering to best practices in experimental design, normalization, and quality control remains just as critical as the choice of software for achieving reliable biological insights.
Ideal Use Cases and Sample Size Requirements for Each Tool
Differential expression (DE) analysis represents a fundamental step in understanding how genes respond to different biological conditions using RNA sequencing data. When researchers perform RNA sequencing, they essentially take a snapshot of all genes expressed in samples at a given moment, but the real biological insights come from understanding how these expression patterns change between conditions, time points, or disease states. The power of DE analysis lies in its ability to identify these changes systematically across thousands of genes simultaneously while accounting for biological variability and technical noise inherent in RNA-seq experiments [3].
Several sophisticated tools have been developed for DE analysis, each addressing specific challenges in RNA-seq data, including count data overdispersion, small sample sizes, complex experimental designs, and varying levels of biological and technical noise. Among these, DESeq2, edgeR, and limma have emerged as three of the most widely-used and robust methods. DESeq2 and edgeR share a common foundation in negative binomial modeling, while limma utilizes linear modeling with empirical Bayes moderation on transformed count data [3] [19]. Understanding their unique approaches, optimal use cases, and sample size requirements helps researchers select the most appropriate tool for specific research questions and experimental designs.
This guide provides an objective comparison of these three popular differential expression analysis tools, focusing on their ideal use cases and sample size requirements based on current literature and benchmarking studies. We present comparative performance data, detailed methodological protocols, and practical recommendations to inform researchers, scientists, and drug development professionals in their analytical decisions.
Statistical Foundations and Methodological Comparisons
Core Statistical Approaches
Each differential expression tool employs distinct statistical frameworks tailored to handle the characteristics of RNA-seq count data:
DESeq2 utilizes negative binomial modeling with empirical Bayes shrinkage for both dispersion and fold change estimates. This approach improves stability and interpretability of estimates, enabling a more quantitative analysis focused on the strength rather than the mere presence of differential expression. DESeq2 incorporates internal normalization based on geometric means and adaptive shrinkage for dispersion estimates and fold changes [20] [3].
edgeR employs negative binomial modeling with flexible dispersion estimation options. It offers multiple testing strategies, including quasi-likelihood options and fast exact tests. edgeR typically uses TMM (trimmed mean of M-values) normalization by default and provides flexible options for common, trended, or tagged dispersion estimation [3] [21].
limma applies linear modeling with empirical Bayes moderation to log-transformed count data. For RNA-seq analysis, limma uses the voom transformation that converts counts to log-CPM (counts per million) values and estimates the mean-variance relationship to generate precision weights. These weights are incorporated into the linear modeling process, allowing the same empirical Bayes moderation framework developed for microarrays to be applied to RNA-seq data [19] [3].
Key Technical Components
Table 1: Core Components of Each Differential Expression Tool
| Component | DESeq2 | edgeR | limma |
|---|---|---|---|
| Normalization | Median-of-ratios method | TMM normalization by default | voom transformation to log-CPM |
| Dispersion Estimation | Empirical Bayes shrinkage | Flexible dispersion options | Precision weights from mean-variance trend |
| Statistical Testing | Wald test or LRT | Exact test or GLM/QLF | Empirical Bayes moderated t-tests |
| Handling of Small Samples | Information sharing across genes | Empirical Bayes moderation | Information borrowing through variance shrinkage |
| Fold Change Estimation | Shrunken log2 fold changes | Raw or moderated estimates | Model-based coefficients |
Workflow Diagrams
Diagram 1: Comparative workflows for DESeq2, edgeR, and limma showing distinct analytical approaches with shared input and output stages.
Sample Size Requirements and Performance
Minimum Sample Size Recommendations
Sample size substantially impacts the performance and reliability of differential expression analysis. Based on comprehensive benchmarking studies:
DESeq2 typically requires at least 3 replicates per condition for reliable results, though it performs better with moderate to large sample sizes (≥6 per group) [3] [22]. With very small sample sizes (n=3), DESeq2 may show slightly conservative behavior, but its performance improves markedly as sample size increases.
edgeR functions efficiently with very small sample sizes, technically working with as few as 2 replicates per condition, though ≥3 replicates are recommended for more reliable results [3] [21]. edgeR demonstrates particular strength when analyzing genes with low expression counts, where its flexible dispersion estimation better captures inherent variability in sparse count data.
limma with voom transformation requires at least 3 biological replicates per condition to reliably estimate the mean-variance relationship [3] [23]. The empirical Bayes moderation in limma effectively borrows information between genes to overcome the problem of small sample sizes, but this approach still requires sufficient data points to estimate variance reliably.
Performance Across Sample Sizes
Table 2: Performance Characteristics by Sample Size Based on Benchmarking Studies
| Sample Size (per group) | DESeq2 | edgeR | limma |
|---|---|---|---|
| n = 2-3 | Moderate power, conservative FDR control | Good power, reasonable FDR control | Requires n≥3, good FDR control with sufficient replicates |
| n = 6 | Good power, well-controlled FDR | Good power, well-controlled FDR | Good power, well-controlled FDR |
| n = 12+ | High power, stable results | High power, stable results | High power, stable results |
| Large populations (n>50) | FDR inflation concerns in population studies [24] | FDR inflation concerns in population studies [24] | Maintains better FDR control in large samples [24] |
Recent evaluations indicate that for RNA-seq count data with negative binomial distribution, EBSeq (not covered in this guide) performed better than other methods when sample size was as small as 3 in each group, while DESeq2 performed slightly better than other methods when sample sizes increased to 6 or 12 in each group [22]. All methods show improved performance when sample size increases to 12 per group.
Impact of Sample Size on Detection Power
Diagram 2: Relationship between sample size and methodological performance showing how optimal tool selection changes with experimental scale.
Extensive benchmark studies have provided valuable insights into the relative strengths of these tools with varying sample sizes. Research has demonstrated that increasing sample size is more effective for increasing statistical power than increasing sequencing depth, especially when sequencing depth already reaches 20 million reads [25]. This highlights the importance of adequate biological replication rather than excessive sequencing depth in experimental design.
Ideal Use Cases and Application Scenarios
Optimal Applications for Each Tool
Each differential expression method has particular strengths that make it ideally suited for specific research scenarios:
DESeq2 excels in experiments with moderate to large sample sizes and high biological variability. Its robust approach provides strong false discovery rate control and handles subtle expression changes effectively. DESeq2 is particularly valuable when researchers need stable, interpretable fold change estimates through its shrinkage approach [20] [3]. The automatic outlier detection and independent filtering features make it suitable for analyses requiring minimal manual intervention.
edgeR performs optimally with very small sample sizes and in studies focusing on low-abundance transcripts. Its efficient processing makes it suitable for large datasets, and it offers flexibility in handling technical replicates [3] [21]. edgeR provides multiple testing strategies (exact tests, quasi-likelihood F-tests) that can be selected based on experimental design, giving experienced users more analytical options.
limma demonstrates remarkable versatility and robustness across diverse experimental conditions, particularly excelling in handling complex designs and outliers. Its computational efficiency becomes especially valuable when processing large-scale datasets containing thousands of samples [3] [19]. limma integrates well with other omics data types and maintains consistent performance in population-level studies with large sample sizes where other methods may show FDR inflation [24].
Performance in Specific Research Contexts
Table 3: Recommended Tools by Research Scenario
| Research Scenario | Recommended Tool | Rationale | Key Considerations |
|---|---|---|---|
| Small pilot studies (n=2-3) | edgeR | Designed for small samples, efficient with minimal replicates | Consider non-parametric methods if distribution assumptions are violated |
| Complex multi-factor designs | limma | Handles complex designs elegantly, flexible model specification | voom transformation must be carefully quality checked |
| Population-level studies (n>50) | limma or non-parametric methods | Maintains FDR control where DESeq2/edgeR may inflate false positives | Wilcoxon rank-sum test recommended for large population studies [24] |
| Studies focusing on low-count genes | edgeR | Better captures variability in sparse count data | Flexible dispersion estimation beneficial for low-expression features |
| Time-series experiments | limma | Handles correlated measurements and complex time dependencies | Linear modeling framework naturally accommodates time series |
| Experiments requiring stable fold changes | DESeq2 | Shrunken fold changes improve interpretability | More conservative for low-count genes |
Specialized Applications and Limitations
limma demonstrates particular strength in multi-factorial experimental designs where researchers need to account for multiple batch effects or covariates. Its linear modeling framework naturally accommodates complex experimental structures that are common in clinical studies or integrated omics analyses [19]. However, limma may not handle extreme overdispersion as effectively as the negative binomial-based methods and requires careful quality control of the voom transformation.
DESeq2 and edgeR share many performance characteristics given their common foundation in negative binomial modeling. Both perform well in benchmark studies using real experimental data and simulated datasets where true differential expression is known [3] [22]. However, recent research has raised concerns about FDR control for both DESeq2 and edgeR in large-sample population studies, where actual false discovery rates sometimes exceeded 20% when the target FDR was 5% [24].
edgeR offers both exact tests and generalized linear model approaches, providing flexibility for different experimental designs. The quasi-likelihood approach in edgeR is particularly useful for data with complex mean-variance relationships or for experiments with multiple factors [21]. However, edgeR requires more careful parameter tuning compared to other methods, and its common dispersion approach may sometimes miss gene-specific patterns.
Experimental Protocols and Benchmarking Data
Standardized Analysis Workflow
To ensure fair comparisons between methods, researchers should follow standardized processing workflows:
Data Preprocessing Protocol:
- Start with a raw count matrix filtered to remove low-expressed genes (typically keeping genes with counts >10 in at least 80% of samples per group)
- Create a metadata data frame with sample information and experimental conditions
- For each method, follow package-specific object creation:
- DESeq2:
DESeqDataSetFromMatrix()with appropriate design formula - edgeR:
DGEList()followed bycalcNormFactors() - limma:
voom()transformation on DGEList object
- DESeq2:
Differential Expression Analysis:
- DESeq2 protocol: Run
DESeq()function on DESeqDataSet object, then extract results usingresults()with independent filtering enabled - edgeR protocol: Estimate dispersions using
estimateDisp(), then conduct testing with eitherexactTest()orglmQLFTest()for complex designs - limma protocol: Apply
voom()transformation, then fit linear model withlmFit(), followed by empirical Bayes moderation witheBayes()
Results Extraction:
- Extract significantly differentially expressed genes using adjusted p-value threshold (typically FDR < 0.05)
- Apply optional fold change threshold if biological significance is a consideration
- Compare results across methods using Venn diagrams or overlap analysis
Benchmarking Methodologies
Comprehensive evaluations of differential expression tools typically employ multiple approaches:
Simulation Studies: Generate count data with known differentially expressed genes using parameters estimated from real datasets. This approach allows precise calculation of false discovery rates and statistical power [25] [22]. The polyester R package provides a widely-used framework for such simulations.
Permutation Analysis: In large-sample studies, randomly permute condition labels to create negative control datasets where no true differential expression should exist. This approach enables empirical FDR estimation without relying on model assumptions [24].
Semi-Synthetic Data: Spike in known differentially expressed genes into real experimental data to create benchmarks with authentic background characteristics while maintaining knowledge of true positives.
Research Reagent Solutions
Table 4: Essential Computational Tools for Differential Expression Analysis
| Tool/Resource | Function | Application Context |
|---|---|---|
| DESeq2 | Differential expression analysis using negative binomial distribution | Primary DE analysis for moderate to large datasets |
| edgeR | Differential expression analysis with robust small-sample performance | DE analysis with limited replicates or for low-count genes |
| limma with voom | Differential expression using linear models on transformed counts | Complex experimental designs or large-sample studies |
| sva/biocParallel | Batch effect correction and parallel processing | Handling technical covariates and improving computational efficiency |
| tximport/tximeta | Transcript-level import and summarization | Preparing count data from transcript-level quantifications |
| IGV/UCSC Genome Browser | Visualization of expression patterns in genomic context | Exploratory analysis and result validation |
Based on comprehensive benchmarking studies and methodological evaluations:
For studies with very small sample sizes (n=2-3 per group), edgeR is generally recommended due to its efficient handling of minimal replicates and good performance with low-count genes. EBSeq also shows excellent performance with small sample sizes but was not the focus of this comparison.
For standard experiments with moderate sample sizes (n=6-12 per group), DESeq2 performs slightly better than other methods in terms of FDR control and power when data follow the negative binomial distribution.
For complex experimental designs or large-scale population studies (n>50), limma with voom transformation maintains better FDR control compared to DESeq2 and edgeR, which may show inflated false discovery rates in these contexts. For very large population studies, non-parametric methods like the Wilcoxon rank-sum test may be most appropriate.
For maximum reliability, many benchmarking studies recommend using multiple methods and focusing on genes identified consistently across pipelines. This consensus approach helps mitigate method-specific biases and provides more robust biological insights.
Tool selection should also consider the biological context, distribution characteristics of the data, and analytical requirements beyond simple two-group comparisons. As sequencing technologies evolve and sample sizes continue to grow in many research domains, understanding these methodological tradeoffs becomes increasingly important for generating valid, reproducible results in transcriptomics research.
From Counts to Insights: Step-by-Step Analysis Workflows
Within the broader objective of benchmarking differential expression tools like DESeq2, edgeR, and limma, the critical importance of data preparation and quality control cannot be overstated. The accuracy of all downstream statistical comparisons is fundamentally dependent on the quality of the input read count data. This guide objectively compares three foundational tools—FastQC, Trimmomatic, and Salmon—that constitute essential stages in a robust RNA-seq preprocessing workflow, synthesizing performance data from recent large-scale pipeline evaluations to inform optimal software selection.
Tool-Specific Analysis and Performance
FastQC: Raw Read Quality Assessment
FastQC is the universal standard for initial quality control of raw sequence data, providing a comprehensive profile of potential issues prior to any downstream processing [26].
- Function: Provides an initial quality check on raw sequence data from high-throughput sequencing pipelines, generating a holistic view of potential problems [26].
- Key Metrics: Assesses per-base sequence quality, sequence length distribution, GC content, sequence duplication levels, overrepresented sequences, and adapter contamination [27] [26].
- Performance Note: While FastQC applies stringent criteria that may frequently generate "warnings" or "failures," these results require careful biological interpretation and are not necessarily a death sentence for the dataset [26].
Trimmomatic: Read Trimming and Filtering
Trimmomatic performs adapter removal and quality trimming to enhance downstream mapping rates and quantification accuracy. Systematic comparisons highlight its utility in standardized workflows.
- Function: A flexible, precise tool for removing adapter sequences and low-quality bases from sequencing reads [28] [26].
- Core Methodology: Employs a pipeline-based approach where each processing step (e.g., adapter removal, quality trimming) is applied sequentially. For paired-end data, it ensures both reads are processed simultaneously to maintain pair integrity [26].
- Typical Parameters: Includes sliding window trimming (e.g., 4-base window, average quality threshold of 15-20) and minimum read length enforcement (e.g., 20-36 bases) [28].
- Performance Context: While a benchmark noted Trimmomatic's "complex parameter setup" and lack of speed advantage compared to some alternatives [7], it remains widely implemented in major community-endorsed pipelines such as nf-core/rnaseq [29].
Salmon: Transcript Quantification
Salmon represents a paradigm shift in RNA-seq quantification, using fast, alignment-free algorithms to estimate transcript abundances.
- Function: Performs "wicked-fast" transcript quantification from RNA-seq data using a pseudoalignment approach, bypassing traditional base-by-base alignment to a reference genome [29].
- Core Methodology: Leverages k-mer matching and a complex statistical model to quantify the likelihood of reads originating from specific transcripts, incorporating considerations for GC content bias, sequence bias, and positional bias [27] [29].
- Key Advantage: Speed and efficiency without significant sacrifice in accuracy; recent benchmarks often classify Salmon as a top-performing quantification tool [27].
- Workflow Integration: In integrated pipelines like nf-core/rnaseq, Salmon can operate either on raw reads (with alignment information optionally generated for QC) or on reads pre-filtered by alignment tools like STAR [29].
Comparative Performance Data
The table below summarizes key experimental findings from comprehensive pipeline comparisons.
Table 1: Experimental Performance Comparison of RNA-seq Tools
| Tool | Performance Metric | Experimental Finding | Benchmark Context |
|---|---|---|---|
| Trimmomatic | Operational Complexity | Parameter setup is complex with no speed advantage [7]. | Comparison of 288 pipelines for fungal RNA-seq data [7]. |
| fastp | Quality Improvement | Significantly enhanced processed data quality (1-6% Q20/Q30 base improvement) [7]. | Alternative trimmer showing superior speed and integrated reporting [7] [29]. |
| Salmon | Quantification Accuracy | Classified as a high-accuracy, fast tool for transcript quantification [27]. | Part of a benchmark studying 192 alternative methodological pipelines [28]. |
| STAR + Salmon | Workflow Integration | Default alignment/quantification combination in nf-core/rnaseq pipeline [29]. | Community-standard workflow for comprehensive analysis [29]. |
Integrated Workflow and Best Practices
The synergy between quality control, read trimming, and quantification creates a foundational preprocessing pipeline that directly influences the reliability of differential expression results with DESeq2, edgeR, or limma.
Standardized Workflow
A typical integrated workflow proceeds through well-defined stages [26]:
- Raw Read QC: FastQC on untrimmed FASTQ files.
- Read Trimming: Trimmomatic or fastp performs adapter and quality trimming.
- QC Validation: FastQC is re-run on trimmed reads to confirm quality improvements.
- Quantification: Salmon performs transcript-level quantification (optionally with STAR alignment for QC).
- Gene-Level Summarization: Tximport converts transcript abundances to gene-level counts for DESeq2/edgeR.
This process is encapsulated in the following workflow diagram:
Experimental Protocols from Benchmarking Studies
Large-scale evaluations provide validated methodologies for tool assessment:
- Comprehensive Pipeline Comparison (2024): Researchers analyzed 288 distinct pipelines on five fungal RNA-seq datasets. Performance was evaluated based on simulated data, establishing a standardized approach for objectively assessing the accuracy of differential gene expression results produced by different tool combinations [7].
- Systematic Tool Assessment (2020): A study applied 192 alternative methodological pipelines to 18 human cell line samples. Gene expression signals were quantified using non-parametric statistics to measure precision and accuracy, and pipeline performance was validated against qRT-PCR measurements on the same samples [28].
Essential Research Reagent Solutions
The table below catalogs key computational tools and resources required for implementing the described RNA-seq preprocessing workflow.
Table 2: Essential Research Reagents and Computational Tools
| Item Name | Function in Workflow | Specific Application |
|---|---|---|
| FastQC | Initial and post-trimming quality control | Generates quality metrics for raw and processed reads [27] [26]. |
| Trimmomatic | Adapter and quality trimming | Preprocessing of single-end and paired-end reads [28] [26]. |
| Salmon | Transcript-level quantification | Fast, alignment-free quantification of gene expression [27] [29]. |
| STAR | Splice-aware genome alignment | Optional alignment for QC or for use in alignment-based pipelines [29]. |
| MultiQC | Aggregate QC reporting | Summarizes results from multiple tools and samples into a single report [29]. |
| Reference Transcriptome | Sequence and annotation reference | FASTA file of known transcripts required for Salmon quantification [29]. |
The selection of preprocessing tools is a critical, non-trivial decision that directly impacts the validity of downstream differential expression analysis. Evidence from large-scale benchmarks indicates that while Trimmomatic is a robust and widely adopted trimming tool, faster and simpler alternatives like fastp can offer comparable or superior performance in certain contexts. Salmon consistently demonstrates high accuracy and exceptional speed for quantification. Integrating these tools into a standardized workflow, with rigorous quality control checkpoints using FastQC, establishes a reliable foundation for a meaningful benchmarking study of differential expression tools such as DESeq2, edgeR, and limma.
For researchers embarking on a benchmarking study to compare differential expression (DE) tools like DESeq2, edgeR, and limma, a properly configured R environment is the critical first step. This guide provides the essential code and methodologies to install and load the necessary packages, ensuring a reproducible and robust foundation for your analysis.
Package Installation and Management
An efficient R environment setup involves correctly installing packages and managing their dependencies. The following sections detail the primary methods.
Installing from Official Repositories
Most R packages are hosted on the Comprehensive R Archive Network (CRAN) or Bioconductor. The install.packages() function is the standard workhorse for CRAN packages [30] [31].
To install a single package, use:
For a benchmarking study, you will need multiple packages. Install them simultaneously using a character vector for greater efficiency [30] [31]:
Since DESeq2 and edgeR are Bioconductor packages, they require a different installer [3]:
Advanced Installation Methods
For a more modern and streamlined installation process that automatically handles dependencies, consider the pak package [30]:
Alternatively, the pacman package offers an efficient way to install and load packages in a single step [31]:
Loading Packages into Your R Session
After installation, packages must be loaded into your R session to make their functions available. Use the library() function for this purpose [30] [32].
Remember: A package needs to be installed only once, but it must be loaded with library() at the beginning of every new R session where you intend to use it [30].
Experimental Setup for Tool Benchmarking
A rigorous benchmark of DE tools requires a standardized experimental protocol. The following workflow outlines the key stages, from data preparation to performance assessment.
Data Preparation and Quality Control
The initial phase involves preparing a high-quality count matrix for downstream analysis [3].
Key Research Reagent Solutions
Table 1: Essential Software Tools for RNA-seq Differential Expression Benchmarking
| Tool Name | Type | Primary Function | Statistical Foundation |
|---|---|---|---|
| DESeq2 | Bioconductor Package | DE analysis for RNA-seq data | Negative binomial model with empirical Bayes shrinkage [3] |
| edgeR | Bioconductor Package | DE analysis for RNA-seq data | Negative binomial model with flexible dispersion estimation [3] |
| limma | Bioconductor Package | DE analysis for various data types | Linear modeling with empirical Bayes moderation on voom-transformed counts [3] |
| performance | CRAN Package | Model performance assessment and comparison | Computes R², AIC, BIC, RMSE, ICC, and other indices [33] |
| FastQC | External Tool | Quality control of raw sequencing reads | Provides quality metrics and visualizations [18] |
| Salmon | External Tool | Transcript quantification from RNA-seq data | Lightweight, alignment-free quantification [18] |
Statistical Foundations of Differential Expression Tools
Understanding the core statistical approaches of each DE tool is crucial for interpreting benchmarking results.
Performance Assessment Methodology
The performance package provides a unified framework for evaluating and comparing statistical models, which is essential for benchmarking DE tools [33].
Computing Model Performance Indices
After running differential expression analyses with each tool, extract results and compute performance metrics.
Key Performance Metrics for DE Tools
The r2(), icc(), and model_performance() functions from the performance package calculate crucial indices for model assessment [33].
Table 2: Key Performance Metrics for Differential Expression Tool Evaluation
| Performance Metric | Interpretation | Relevance to DE Analysis |
|---|---|---|
| R-squared (R²) | Proportion of variance explained by the model | Indicates how well the model explains expression variability [33] |
| Akaike Information Criterion (AIC) | Relative model quality considering complexity | Useful for model selection; lower values indicate better fit [34] |
| Bayesian Information Criterion (BIC) | Similar to AIC with stronger penalty for complexity | Prefers simpler models; lower values better [34] |
| Root Mean Square Error (RMSE) | Measure of prediction error | Assesses model accuracy in predicting expression [33] |
| Intraclass Correlation Coefficient (ICC) | Measure of reliability or agreement | Quantifies consistency in repeated measurements [33] |
| False Discovery Rate (FDR) | Proportion of false positives among significant results | Critical for multiple testing correction in DE analysis [21] |
Comparative Analysis of Differential Expression Tools
Benchmarking studies have systematically evaluated the performance of DE tools across various experimental conditions.
Tool Performance Across Experimental Conditions
Table 3: Comparative Performance of DESeq2, edgeR, and limma Based on Benchmarking Studies
| Performance Aspect | DESeq2 | edgeR | limma |
|---|---|---|---|
| Optimal Sample Size | ≥3 replicates, performs well with more [3] | ≥2 replicates, efficient with small samples [3] | ≥3 replicates per condition [3] |
| Handling of Low-Count Genes | Good, with independent filtering | Excellent, flexible dispersion estimation [3] | Moderate, depends on voom transformation |
| Biological Variability Handling | Excellent with empirical Bayes shrinkage [3] | Good with multiple dispersion options [3] | Good with precision weights [3] |
| Computational Efficiency | Can be intensive for large datasets [3] | Highly efficient, fast processing [3] | Very efficient, scales well [3] |
| Complex Experimental Designs | Good | Good | Excellent, handles multi-factor designs elegantly [3] |
| False Discovery Rate Control | Strong, conservative fold change estimates [3] | Good, with multiple testing strategies [3] | Good, with empirical Bayes moderation [3] |
Practical Implementation of DE Tools
The following code demonstrates how to run each DE tool using the same filtered count data, enabling fair comparisons.
The selection of an appropriate differential expression tool depends on your specific experimental context. DESeq2 and edgeR, sharing a foundation in negative binomial modeling, generally show comparable performance in benchmarks, with edgeR having a slight advantage for low-count genes [3]. Limma, with its voom transformation, excels in complex experimental designs and demonstrates remarkable computational efficiency for large datasets [3].
For comprehensive benchmarking, ensure consistent data preprocessing across all tools and utilize the performance package to calculate standardized metrics. This approach facilitates objective comparisons and strengthens the conclusions of your research on differential expression analysis methods.
Differential expression (DE) analysis is a fundamental step in RNA-sequencing studies, enabling researchers to identify genes whose expression changes significantly between different biological conditions. Among the numerous methods developed for this purpose, DESeq2, edgeR, and limma have emerged as three of the most widely used and cited tools [35]. Each employs distinct statistical approaches to handle the challenges inherent to RNA-seq data, including overdispersion, varying library sizes, and small sample sizes.
DESeq2 and edgeR both model count data using a negative binomial distribution to account for overdispersion, but they differ in their normalization and parameter estimation strategies [3]. In contrast, limma (when used with its voom transformation) applies linear modeling to continuous log-counts-per-million values, using precision weights to account for heteroscedasticity and empirical Bayes methods to stabilize variance estimates across genes [3] [36]. Understanding these foundational statistical approaches is crucial for selecting the appropriate tool for a given experimental context and correctly interpreting the results.
Tool Comparison: Statistical Approaches and Performance Characteristics
Core Methodologies and Normalization Strategies
Table 1: Core Statistical Foundations of DESeq2, edgeR, and limma
| Aspect | DESeq2 | edgeR | limma (with voom) |
|---|---|---|---|
| Core Statistical Approach | Negative binomial modeling with empirical Bayes shrinkage | Negative binomial modeling with flexible dispersion estimation | Linear modeling with empirical Bayes moderation of log-CPM values |
| Data Transformation | Internal normalization based on geometric mean | TMM normalization by default | voom transformation converts counts to log-CPM values |
| Variance Handling | Adaptive shrinkage for dispersion estimates and fold changes | Flexible options for common, trended, or tagged dispersion | Empirical Bayes moderation improves variance estimates for small sample sizes |
| Key Components | Normalization, dispersion estimation, GLM fitting, hypothesis testing | Normalization, dispersion modeling, GLM/QLF testing, exact testing option | voom transformation, linear modeling, empirical Bayes moderation, precision weights |
DESeq2 employs a normalization technique based on the geometric mean, calculating a "median of ratios" between samples to account for differences in sequencing depth and RNA composition [35]. edgeR typically uses the Trimmed Mean of M-values method, which assumes most genes are not differentially expressed and scales library sizes accordingly [35]. Limma, when processing RNA-seq data, first transforms count data to log2-counts per million using the voom function, which also computes precision weights for each observation to account for the mean-variance relationship in the data [3] [36].
Performance Characteristics and Ideal Use Cases
Table 2: Performance Comparison and Recommended Use Cases
| Characteristic | DESeq2 | edgeR | limma (with voom) |
|---|---|---|---|
| Ideal Sample Size | ≥3 replicates, performs well with more | ≥2 replicates, efficient with small samples | ≥3 replicates per condition |
| Best Use Cases | Moderate to large sample sizes, high biological variability, subtle expression changes, strong FDR control | Very small sample sizes, large datasets, technical replicates, flexible modeling needs | Small sample sizes, multi-factor experiments, time-series data, integration with other omics |
| Computational Efficiency | Can be computationally intensive for large datasets | Highly efficient, fast processing | Very efficient, scales well |
| Limitations | Computationally intensive for large datasets, conservative fold change estimates | Requires careful parameter tuning, common dispersion may miss gene-specific patterns | May not handle extreme overdispersion well, requires careful QC of voom transformation |
Performance benchmarking studies have revealed important nuances in how these tools behave under different conditions. A 2022 study highlighted that DESeq2 and edgeR can exhibit exaggerated false positives when analyzing human population samples with large sample sizes, with actual false discovery rates sometimes exceeding 20% when the target was 5% [24]. In these large-sample scenarios, non-parametric methods like the Wilcoxon rank-sum test demonstrated more robust FDR control [24]. However, for standard studies with smaller sample sizes, parametric methods like DESeq2, edgeR, and limma generally perform well, with limma demonstrating particular robustness across diverse experimental conditions and handling outliers effectively [3].
Experimental Protocols and Benchmarking Data
Key Benchmarking Findings from Comparative Studies
Multiple independent studies have systematically compared the performance of DESeq2, edgeR, and limma under various experimental conditions. A 2020 comprehensive benchmarking study evaluated 192 analysis pipelines and 17 differential expression methods, providing robust performance comparisons across multiple metrics [28]. The study found that while all three methods generally performed well, their relative strengths depended on specific experimental parameters.
A particularly insightful 2022 study published in Genome Biology revealed crucial limitations of parametric methods when applied to large population-level RNA-seq datasets [24]. Through permutation analysis of 13 population-level RNA-seq datasets with sample sizes ranging from 100 to 1,376, the researchers discovered that DESeq2 and edgeR frequently failed to control false discovery rates at the target 5% threshold, with actual FDRs sometimes exceeding 20% [24]. In these large-sample scenarios, the non-parametric Wilcoxon rank-sum test demonstrated superior FDR control, though with reduced power at very small sample sizes [24].
For complex experimental designs involving correlated data, such as longitudinal studies or paired samples, a 2022 benchmark evaluated 11 different methods [36]. The study found that linear mixed modeling using transformed data offered the best FDR control while maintaining relatively high power, though it suffered from model non-convergence issues at small sample sizes [36].
Sample Size Considerations and Concordance Between Methods
The agreement between DE tools varies significantly based on sample size and experimental design. A comparative analysis observed that DESeq2 often appears as a less stringent caller than edgeR, with substantial but not complete overlap in identified DEGs [13]. Limma tends to identify a core set of genes common to both DESeq2 and edgeR, plus an additional subset unique to its statistical approach [13].
Notably, a 2021 study investigating the robustness of differential gene expression analysis found that patterns of relative robustness between methods proved dataset-agnostic and reliable for drawing conclusions when sample sizes were sufficiently large [5]. In this analysis, the non-parametric method NOISeq was the most robust, followed by edgeR, limma-voom, and DESeq2 [5].
Table 3: Key Research Reagents and Computational Tools for DE Analysis
| Tool/Resource | Function/Purpose | Implementation |
|---|---|---|
| DESeq2 | Identifies differentially expressed genes using negative binomial generalized linear models | R/Bioconductor package |
| edgeR | Differential expression analysis of digital gene expression data | R/Bioconductor package |
| limma-voom | Linear modeling of RNA-seq data using precision weights | R/Bioconductor package |
| DElite | Integrates and combines results from DESeq2, edgeR, limma, and dearseq | R package |
| TMM Normalization | Corrects for differences in library size and RNA composition between samples | edgeR's calcNormFactors() function |
| Geometric Mean Normalization | Normalizes gene counts using the "median of ratios" method | DESeq2's internal normalization |
| Voom Transformation | Converts counts to log-CPM values with precision weights | limma's voom() function |
| qRT-PCR Validation | Experimental validation of RNA-seq findings by measuring expression of selected genes | Laboratory technique |
Practical Implementation Guide
Data Preparation and Quality Control
Proper data preparation is essential for robust differential expression analysis. The initial steps involve:
- Reading the Count Matrix: Load the raw count data, typically from featureCounts or HTSeq output, into R with genes as rows and samples as columns [3].
- Filtering Low-Expressed Genes: Remove genes with minimal expression across samples to reduce multiple testing burden and improve power. A common approach is to keep genes with counts above a minimum threshold in a certain percentage of samples (e.g., counts > 0 in ≥80% of samples) [3].
- Creating Metadata: Prepare a sample information data frame that links sample identifiers to experimental conditions and any relevant covariates.
DESeq2 Analysis Pipeline
DESeq2 employs a comprehensive workflow that integrates normalization, dispersion estimation, and statistical testing:
edgeR Analysis Pipeline
edgeR offers multiple testing approaches, including likelihood ratio tests, quasi-likelihood F-tests, and exact tests:
limma-voom Analysis Pipeline
Limma with voom transformation applies linear modeling to RNA-seq data with precision weights:
Comparing and Integrating Results Across Methods
Comparing results from multiple DE tools can increase confidence in findings and identify method-specific artifacts:
For researchers seeking to integrate results from multiple tools, the DElite R package provides a unified framework that runs DESeq2, edgeR, limma, and dearseq with a single command and offers statistical methods for combining p-values across tools [37].
Based on extensive benchmarking studies and practical implementation experience, we can provide the following recommendations for tool selection:
For standard experiments with small to moderate sample sizes (3-10 replicates per condition), all three tools perform well, with the choice depending on specific experimental factors. DESeq2 provides conservative fold change estimates and handles complex designs robustly, edgeR offers computational efficiency and flexibility for very small sample sizes, while limma demonstrates particular strength in multi-factor experiments and integration with other omics data types [3].
For population-level studies with large sample sizes (dozens to hundreds of samples), researchers should be cautious of potential FDR inflation with DESeq2 and edgeR [24]. In these scenarios, non-parametric approaches like the Wilcoxon rank-sum test or limma-voom may provide more reliable error control [24].
For complex experimental designs involving correlated data (longitudinal studies, paired samples, or repeated measures), specialized methods that properly account for correlation structures, such as linear mixed models or limma with correlated sample handling, are recommended over standard implementations of DESeq2 or edgeR [36].
For maximum reliability, particularly in clinical or diagnostic contexts, employing multiple methods and focusing on the consensus genes identified across tools can reduce false positives and increase confidence in results [13] [37].
As RNA-seq technologies continue to evolve and sample sizes increase, the differential expression landscape will likely see further methodological refinements. Researchers should remain informed about benchmarking studies and consider validating critical findings with orthogonal experimental methods when possible.
Interpreting the output of differential expression (DE) analysis is a critical step in RNA-sequencing (RNA-seq) studies. The log fold changes (logFCs), p-values, and false discovery rates (FDRs) generated by tools like DESeq2, edgeR, and limma are the fundamental metrics that guide biological conclusions. However, a growing body of benchmarking evidence reveals that the reliability of these metrics is not uniform across methods and can be significantly influenced by experimental design. This guide provides an objective comparison of these popular tools, focusing on how they control false positives and the practical implications for interpreting their output.
Core Concepts in Differential Expression Output
Before comparing the tools, it is essential to understand what these key metrics represent:
- Log Fold Change (logFC): This estimates the magnitude of expression change between conditions. A logFC of 1 indicates a 2-fold increase, while -1 indicates a 2-fold decrease. It is a measure of effect size.
- P-value: This assesses the statistical significance of the observed expression change, representing the probability that the observed data (or more extreme data) would occur if the null hypothesis (no differential expression) were true.
- False Discovery Rate (FDR): In a typical DE analysis, thousands of genes are tested simultaneously. The FDR, often reported as an adjusted p-value, estimates the proportion of false positives among the genes declared significant. An FDR cutoff of 5% means that among all genes called differentially expressed, 5% are expected to be false leads.
Benchmarking Performance: False Discovery Rate Control
The most critical aspect of a DE tool is its ability to control the FDR at the advertised level. A method that reports a 5% FDR but has a true FDR of 20% is severely anticonservative, leading to wasted validation efforts and misguided biological hypotheses.
A landmark 2022 study specifically investigated this issue with large sample sizes common in modern population-level studies (e.g., 100 to 1,376 samples). Using permutation analyses on real RNA-seq datasets, where no true differences should exist, the researchers evaluated how often these methods falsely declared genes as significant [24].
The table below summarizes the key findings on FDR control:
| Method | Underlying Model | FDR Control in Large Samples | Key Strengths | Key Weaknesses |
|---|---|---|---|---|
| DESeq2 | Negative Binomial | Poor (Actual FDR can exceed 20% when target is 5%) [24] | Robust in small-sample studies; widely adopted [38]. | Exaggerated false positives in large-sample population studies; sensitive to model violations and outliers [24]. |
| edgeR | Negative Binomial | Poor (Actual FDR can exceed 20% when target is 5%) [24] | Good power and performance in various simulation studies [38]. | Similar FDR inflation issues as DESeq2 in large samples; performance can vary with different algorithm variants [24] [38]. |
| limma-voom | Linear Model + Precision Weights | Variable | High performance in bulk and single-cell RNA-seq benchmarks; speed and flexibility for complex designs [38] [39]. | Can fail to control FDR in some large-sample scenarios, though often to a lesser degree than DESeq2/edgeR [24]. |
| Wilcoxon Rank-Sum Test | Non-parametric | Good (Robustly controls FDR in large samples) [24] | Highly robust to outliers and violations of distributional assumptions [24]. | Low statistical power with very small sample sizes (e.g., n < 8 per condition) [24]. |
A striking example from an immunotherapy dataset (109 patients) highlights this problem: when condition labels were permuted, DESeq2 and edgeR had a ~85% and ~79% chance, respectively, of identifying more "significant" DEGs in the randomized data than in the original dataset [24]. Furthermore, genes with large estimated fold changes in the original data were more likely to be flagged as false positives in the permuted data, contradicting the common biological intuition that large fold-changes are more reliable [24].
Experimental Protocols for Benchmarking
To objectively assess the performance of DE tools, researchers employ rigorous benchmarking workflows. The methodologies below, drawn from key studies, reveal how conclusions about tool reliability are reached.
Protocol 1: Permutation Analysis for FDR Evaluation on Real Data
This protocol uses real RNA-seq data to evaluate false positive rates without relying on simulated data [24].
- Dataset Selection: Obtain a population-level RNA-seq dataset with a large sample size (e.g., dozens to hundreds of samples per condition) from sources like GTEx or TCGA [24].
- Define Conditions: Select two conditions for comparison (e.g., pre-treatment vs. post-treatment).
- Run Original Analysis: Perform DE analysis with the tools of interest (DESeq2, edgeR, etc.) on the original dataset to get a list of candidate DEGs.
- Generate Permuted Datasets: Randomly shuffle the condition labels across all samples to create a "negative control" dataset where no true differential expression should exist. Repeat this process 1000 times to create many permuted datasets [24].
- Analyze Permuted Data: Run the same DE analysis on each of the 1000 permuted datasets.
- Calculate Empirical FDR: For a given FDR threshold (e.g., 5%), the empirical FDR is calculated as the average number of significant genes found in the permuted datasets divided by the number found in the original analysis. An empirical FDR much higher than 5% indicates poor false positive control.
The following diagram illustrates this permutation workflow:
Protocol 2: Semi-Synthetic Data for Power and FDR
This approach uses real data as a base but artificially spikes in known differentially expressed genes, allowing for simultaneous evaluation of power (true positive rate) and FDR [24].
- Base Data: Start with a real RNA-seq count matrix from a large study (e.g., GTEx) [24].
- Spike-in True DEGs: Select a set of genes to be "true positives." For a portion of these genes, artificially inflate or decrease their counts in one condition to create a known, simulated fold change.
- Create Dataset Mix: Create a semi-synthetic dataset by combining the "spiked-in" DEGs with the non-modified genes, which serve as true negatives.
- Benchmark Analysis: Run multiple DE tools on this semi-synthetic dataset.
- Performance Calculation:
- Power: Calculate the proportion of known true positive DEGs that are correctly identified as significant.
- True FDR: Calculate the proportion of identified significant genes that are, in fact, from the set of true negatives.
The Scientist's Toolkit
The table below lists key reagents, software, and data resources essential for conducting and benchmarking differential expression analyses.
| Tool / Resource | Type | Primary Function |
|---|---|---|
| DESeq2 [24] [38] | R Software Package | Differential expression analysis based on a negative binomial generalized linear model. |
| edgeR [24] [38] | R Software Package | Differential expression analysis for RNA-seq read count data. |
| limma-voom [24] [38] [40] | R Software Package | Linear modeling of RNA-seq data after voom transformation to model the mean-variance relationship. |
| GTEx Dataset [24] | Data Resource | A public resource of human transcriptome data from multiple tissues, useful for large-sample benchmarks. |
| TCGA Dataset [24] | Data Resource | A cancer genomics dataset containing RNA-seq from tumor and normal samples. |
| Salmon [18] | Software Tool | Fast and accurate quantification of transcript abundances from RNA-seq data. |
| FastQC [18] | Software Tool | Quality control tool for high-throughput sequencing data. |
| Trimmed Mean of M-values (TMM) [38] [40] | Algorithm | A normalization method implemented in edgeR to correct for compositional differences between samples. |
| Wilcoxon Rank-Sum Test [24] | Statistical Test | A non-parametric DE method recommended for large-sample studies due to its robust FDR control. |
Key Recommendations for Practice
Based on the collective benchmarking evidence, the following recommendations can guide your analytical choices:
- For Large Population-Level Studies (n > 50-100): Exercise caution with DESeq2 and edgeR. The evidence strongly suggests using the Wilcoxon rank-sum test for robust FDR control in these scenarios [24]. If using limma-voom, validate your findings with permutation tests.
- For Studies with Small Sample Sizes (n < 10): DESeq2 and edgeR, which are designed for low replication, are generally preferred. The Wilcoxon test lacks power here [24].
- For Single-Cell RNA-Seq Data: Standard bulk tools are not ideal. Instead, use pseudobulk approaches (aggregating counts per sample and cell type before using limma-voom or edgeR) or dedicated single-cell methods like MAST [39] [41].
- For Continuous Exposures: Linear regression-based methods (including limma-voom) have been shown to offer better control of false detections compared to DESeq2 and edgeR, which were primarily designed for discrete groups [40].
- Always Perform Sensitivity Analyses: Do not rely on a single method. Try multiple approaches (e.g., a parametric tool like DESeq2 and a non-parametric tool like Wilcoxon) and check for consistency in your top results. Inconsistent findings may indicate a false positive.
Interpreting the log fold changes, p-values, and FDRs from a differential expression analysis requires a clear understanding of the tools that generate them. Benchmarks reveal that the most popular methods, DESeq2 and edgeR, can suffer from exaggerated false positive rates in large-sample studies, a common design in modern genomics. While limma-voom is a strong and flexible performer, the Wilcoxon test emerges as the most robust for FDR control when sample sizes are sufficiently large. The optimal choice of tool is not one-size-fits-all but depends critically on your sample size, data type, and experimental design. By selecting the appropriate tool and critically evaluating its output, researchers can ensure their biological conclusions are built on a solid statistical foundation.
Solving Common Challenges: Batch Effects, Low Replicates, and Data Sparsity
In high-throughput genomic studies, particularly in differential expression (DE) analysis, batch effects represent a formidable technical challenge. These are systematic technical variations introduced during experimental processes—such as different sequencing runs, reagent lots, personnel, or instrumentation—that are unrelated to the biological conditions of interest [42] [43]. Left unaddressed, these non-biological variations can confound analysis results, leading to spurious findings, reduced statistical power, or even misleading conclusions about treatment effects [44] [43]. The profound impact of batch effects is evidenced by real-world cases where they have contributed to irreproducible research, necessitating article retractions and causing economic losses [43].
Within the context of benchmarking differential expression tools—DESeq2, edgeR, and limma—researchers primarily employ two strategic paradigms for managing batch effects. The first, covariate modeling, incorporates batch information directly into the statistical model during differential expression testing. The second, data correction (or batch correction), involves pre-processing the data to remove batch-associated variation before conducting DE analysis [42]. Understanding the relative performance, appropriate applications, and limitations of these approaches is critical for generating reliable and reproducible research findings, especially for drug development professionals who rely on accurate biomarker identification and validation.
Understanding the Two Approaches
Covariate Modeling
Covariate modeling, also known as statistical adjustment, involves treating batch as a known variable within the differential expression model itself. In this approach, the original count data remains unchanged. Instead, the model simultaneously estimates the effects of both the biological condition of interest and the technical batch. This method is natively supported by all major DE tools: in DESeq2, batch is included in the design formula; in edgeR, it is added to the statistical model; and in limma, it is specified as a covariate in the linear model [42]. The primary advantage of this method is that it accounts for batch variation without altering the raw data, thereby preserving the inherent data structure and variability. It is particularly effective when batch information is known, complete, and accurately recorded.
Data Correction
Data correction methods actively transform the dataset to remove technical variations prior to differential expression analysis. These algorithms attempt to disentangle batch effects from biological signals, producing a "corrected" data matrix for subsequent analysis. Common methods include:
- ComBat/ComBat-seq: Uses an empirical Bayes framework to adjust for batch effects, with ComBat-seq specifically designed for RNA-seq count data [42] [45].
- removeBatchEffect (limma): A linear model-based approach that removes batch effects from normalized expression data [42].
- Harmony: An advanced method that integrates datasets by projecting cells into a shared embedding and correcting within clusters, showing strong performance in benchmark studies [45].
The central risk with data correction is the potential for over-correction, where genuine biological signal is inadvertently removed along with technical noise, or the introduction of artifacts that distort true expression relationships [44] [45].
Performance Comparison: Key Experimental Findings
Table 1: Comparative Performance of Batch Effect Handling Strategies
| Performance Metric | Covariate Modeling | Data Correction | Notes & Context |
|---|---|---|---|
| False Discovery Rate (FDR) Control | Well-controlled with known batches [46] | Variable; can be inflated (e.g., SVA FDR up to 0.2 with large group effects) [46] | For latent batches, fixed effects models can inflate FDR [46] |
| Statistical Power | High for known batch variables [46] | Generally good, but power loss observed in mixed effects/aggregation methods for latent batches [46] | |
| Biological Signal Preservation | High (does not alter biological data) [46] | Risk of signal erosion/over-correction [44] [45] | Harmony shows good biological retention [45] |
| Handling Known Batches | Recommended approach [46] | Not recommended as primary strategy [46] | Regression with known covariates outperforms correction [46] |
| Handling Latent Batches | Limited unless using SVA [46] | SVA recommended despite occasional FDR inflation [46] | Surrogate Variable Analysis (SVA) generally controls FDR well with good power [46] |
| Computational Artifacts | Minimal (no data transformation) [45] | Common (e.g., MNN, SCVI, LIGER create artifacts) [45] | Harmony is notably well-calibrated [45] |
| Integration with DE Workflow | Direct in DESeq2, edgeR, limma [42] | Requires additional pre-processing step |
Experimental Evidence from Systematic Evaluations
A comprehensive evaluation of methods accounting for batch effects in differential expression analysis demonstrated that for known batch variables, incorporating them as covariates into a regression model outperformed approaches using a batch-corrected matrix [46]. This finding supports the preference for covariate modeling when reliable batch metadata exists.
For more challenging scenarios involving latent batch effects (unknown or unmeasured technical factors), the performance landscape becomes more complex. Fixed effects models tend to have inflated FDRs, while aggregation-based methods and mixed effects models suffer from significant power loss [46]. Among methods designed for latent batches, Surrogate Variable Analysis (SVA) based methods generally control the FDR well while achieving good power, particularly with small group effects. However, their performance (with the exception of SVA) can deteriorate substantially in scenarios involving large group effects and/or group label impurity [46].
In single-cell RNA sequencing data, a specialized evaluation of eight batch correction methods revealed that many introduce measurable artifacts during the correction process [45]. Methods including MNN, SCVI, LIGER, ComBat, ComBat-seq, BBKNN, and Seurat all introduced detectable distortions. Notably, Harmony was the only method that consistently performed well across all tests, making it a recommended choice when data correction is necessary for scRNA-seq data [45].
Experimental Protocols for Benchmarking
Standardized Workflow for Method Comparison
Table 2: Essential Research Reagents and Computational Tools
| Category | Specific Tools/Methods | Primary Function | Key Reference |
|---|---|---|---|
| Differential Expression Tools | DESeq2, edgeR, limma | Core differential expression analysis | [3] [47] |
| Covariate Modeling | Native functions in DESeq2, edgeR, limma | Incorporating batch in statistical models | [42] |
| Data Correction Algorithms | ComBat-seq, removeBatchEffect, Harmony, SVA | Batch effect removal from data | [46] [42] [45] |
| Evaluation Metrics | FDR, Statistical Power, Silhouette Score | Performance quantification | [46] [44] |
| Visualization Tools | PCA, t-SNE | Effect visualization pre/post-correction | [42] [48] |
Performance Assessment Methodology
A rigorous approach to evaluating batch effect correction methods involves differential expression sensitivity analysis [44]. This methodology begins by splitting the dataset into its individual batches and performing DE analysis on each batch separately to obtain their differentially expressed (DE) features. The unique features are stored by their union and intersect to serve as reference sets. Next, multiple batch effect correction algorithms (BECAs) are applied to the original data, followed by DE analysis on each corrected dataset. Performance is then quantified by calculating recall (correct identifications) and false positive rates (incorrect identifications) for each BECA against the reference sets. DE features found in all batches (the intersect) can serve as a quality check, where missing features after correction suggest underlying data issues potentially caused by the BECA itself [44].
For studies with known batch effects, a straightforward protocol can be implemented using standard DE tools:
- Data Preparation: Filter low-expressed genes (e.g., keeping genes expressed in at least 80% of samples) and normalize using appropriate methods (e.g., TMM for edgeR, median ratio for DESeq2) [3] [42].
- Model Specification: For covariate modeling, include batch in the design formula:
- DESeq2:
design = ~ batch + condition - edgeR: Include batch in the statistical model
- limma: Specify batch in the linear model [42]
- DESeq2:
- Correction Application: For data correction, apply chosen methods like ComBat-seq (for counts) or removeBatchEffect (for normalized data) following package-specific protocols.
- Visualization: Use Principal Component Analysis (PCA) plots colored by batch and condition to visually assess the effectiveness of each approach in removing batch clustering while preserving biological separation [42] [48].
Recommendations for Different Research Scenarios
Based on the accumulated experimental evidence, the following recommendations emerge for handling batch effects in differential expression studies:
For Known Batch Variables: Consistently incorporate them as covariates in regression models (DESeq2, edgeR, or limma) rather than using batch-corrected data. This approach demonstrates superior performance for known technical factors [46] [42].
For Latent Batch Effects: Employ Surrogate Variable Analysis (SVA) which generally controls the FDR well while achieving good power, particularly with small group effects. However, researchers should be aware that FDR can occasionally be inflated (up to 0.2) in scenarios with large group effects [46].
For Single-Cell RNA-seq Data: When data correction is necessary, Harmony is currently the best-performing method, as it consistently removes batch effects while minimizing the introduction of artifacts and preserving biological variation [45].
For Complex Experimental Designs: When batch effects have a hierarchical structure or multiple random effects, mixed linear models offer a sophisticated approach that can handle these complex designs effectively [42].
A critical consideration is the experimental design. In fully confounded studies where biological groups completely separate by batches, it may be impossible to reliably distinguish biological signals from technical artifacts, regardless of the statistical method used [48]. This underscores the importance of proper experimental design with balanced sample distribution across batches whenever possible.
The comparative analysis between covariate modeling and data correction for handling batch effects reveals a nuanced landscape with clear guidance for specific research scenarios. For the majority of studies with known batch variables, the evidence strongly supports covariate modeling through direct inclusion of batch in DESeq2, edgeR, or limma models as the most effective and reliable approach. This method provides optimal FDR control and statistical power while avoiding the artifacts and signal erosion risks associated with data correction.
For challenging situations with latent batch effects or requiring single-cell data integration, carefully selected correction methods like SVA or Harmony offer viable solutions, though they require vigilant performance monitoring. As the field advances, developing better methods that more precisely distinguish technical artifacts from biological signals remains crucial to fully unleash the power of high-throughput transcriptomics in biomedical research and drug development.
Strategies for Small Sample Sizes and Low Sequencing Depth
Differential expression (DE) analysis is a fundamental step in RNA sequencing (RNA-seq) studies, enabling researchers to identify genes that change under different biological conditions. However, many experiments face practical constraints, including limited biological replicates and low sequencing depth, which can severely impact the reliability of results. When dealing with small sample sizes, the choice of computational method is critical, as each tool uses distinct statistical approaches with varying sensitivities to these limitations.
This guide provides an objective comparison of three widely used DE analysis tools—DESeq2, edgeR, and limma (voom)—focusing specifically on their performance in studies with few replicates and shallow sequencing. We summarize findings from benchmark studies and provide detailed experimental protocols to inform robust experimental design and data analysis under constrained conditions.
Tool Comparison at a Glance
The table below summarizes the core characteristics, strengths, and weaknesses of DESeq2, edgeR, and limma in the context of small-sample studies.
| Aspect | DESeq2 | edgeR | limma (voom) |
|---|---|---|---|
| Core Statistical Model | Negative binomial with empirical Bayes shrinkage [3] [12] | Negative binomial with flexible dispersion estimation [3] [12] | Linear modeling with empirical Bayes moderation on voom-transformed data [3] [12] |
| Normalization Approach | Relative log expression (RLE) [49] | Trimmed Mean of M-values (TMM) [49] | Applies voom transformation to log-CPM values, can use TMM normalization [3] |
| Recommended Min. Sample Size | ≥3 replicates per condition [3] [22] | ≥2 replicates, efficient with small samples [3] | ≥3 replicates per condition [3] |
| Strengths for Small N | Good performance with 3+ replicates; robust for NB-distributed data [22] | High efficiency with very small samples (n=2); good for low-count genes [3] | Excellent for complex designs; versatility and robustness across conditions [3] |
| Limitations for Small N | Can be computationally intensive; conservative fold change estimates [3] | Requires careful parameter tuning [3] | Relies on sufficient data for reliable variance estimation [3] |
Performance and Benchmark Data
Understanding how these tools perform under suboptimal conditions is crucial for selecting the right method. Benchmarking studies have evaluated their performance in terms of false discovery rate (FDR) control and statistical power when sample size and sequencing depth are limited.
Impact of Sample Size and Sequencing Depth
A key meta-analysis concluded that the number of biological replicates has a greater impact on analysis power than library size, except for low-expressed genes where both parameters are equally important [49]. For researchers working with tomato data, for instance, the study recommended at least four biological replicates and 20 million reads per sample to confidently detect around 1,000 differentially expressed genes, if they exist [49].
Performance Across Sample Sizes
Systematic evaluations reveal that the optimal tool choice can depend on the specific sample size:
- With 3 replicates per group: One evaluation found that EBSeq performed best in terms of FDR control, power, and stability for negative binomial-distributed data. Among the three main tools, DESeq2 and limma were noted as safer choices with very small sample sizes [22].
- With 6 or more replicates per group: As sample size increases to 6 or 12, DESeq2 performs slightly better than other methods for data following a negative binomial distribution, with all methods showing improved performance [22].
A Note on False Discovery Rates in Larger Populations
While this guide focuses on small-sample studies, a critical finding for researchers working with larger population cohorts (dozens to thousands of samples) should be noted. A 2022 benchmark study reported that DESeq2 and edgeR can sometimes fail to control the false discovery rate (FDR) in these large datasets, with actual FDRs exceeding 20% when the target was 5%. The study found that the non-parametric Wilcoxon rank-sum test demonstrated better FDR control in such scenarios [24]. This highlights that the best tool depends not only on sample size but also on the data structure.
Experimental Protocols and Workflows
To ensure reproducible and reliable results, following a structured pipeline from raw data to differential genes is essential. The workflow below outlines the key stages of a robust RNA-seq analysis.
RNA-Seq Analysis Workflow
Detailed Protocols for Differential Expression
The following protocols are adapted from benchmarking publications and package vignettes.
DESeq2 Analysis Pipeline
DESeq2 models raw count data using a negative binomial distribution and performs internal normalization [3] [50].
- Create DESeq2 Dataset: Use the
DESeqDataSetFromMatrix()function, providing the filtered count matrix, sample metadata (colData), and a design formula (e.g.,~ condition) [3]. - Set Reference Level: Relevel the condition factor to set the control group as the reference [3].
- Run DESeq Analysis: Execute the core analysis with the
DESeq()function. This single command performs estimation of size factors, estimation of dispersion, and negative binomial generalized linear model fitting and Wald testing [50]. - Extract Results: Use the
results()function to obtain a table of log2 fold changes, p-values, and adjusted p-values. Thresholds for significance (e.g., FDR < 0.05, |log2FC| > 1) can be specified [3].
edgeR Analysis Pipeline
edgeR also uses a negative binomial model but offers multiple pathways for testing, with the quasi-likelihood (QL) pipeline being recommended for flexibility and good performance [3].
- Create DGEList Object: Use
DGEList()with the count matrix and sample metadata [3] [50]. - Normalize Library Sizes: Calculate normalization factors using the TMM method with
calcNormFactors()[50]. - Estimate Dispersions: Use
estimateDisp()to model common, trended, and gene-specific dispersion across the dataset [3]. - Fit Model and Test: For the QL pipeline, fit a generalized linear model with
glmQLFit(), followed by a quasi-likelihood F-test withglmQLFTest(). Results can be extracted withtopTags()[3].
limma-voom Analysis Pipeline
The limma package, when combined with the voom transformation, applies the established linear modeling framework of microarray analysis to RNA-seq data [3].
- Create DGEList and Normalize: As with edgeR, create a
DGEListand apply TMM normalization usingcalcNormFactors()[3]. - Apply voom Transformation: The
voom()function transforms the normalized counts into log2-counts-per-million (log-CPM), estimates the mean-variance relationship, and generates precision weights for each observation for use in the linear model [3]. - Fit Linear Model: Use
lmFit()to fit a linear model to the transformed and weighted data. - Apply Empirical Bayes Moderation: Use
eBayes()to moderate the standard errors of the model, improving power for small sample sizes by borrowing information across genes [3]. - Extract Results: Use
topTable()to obtain a list of differentially expressed genes [50].
Decision Pathway for Method Selection
The following decision diagram can help you select an appropriate analytical strategy based on your experimental design and goals.
Successful RNA-seq analysis relies on a suite of computational tools and reagents at various stages of the pipeline.
| Item Name | Function/Purpose | Usage Context |
|---|---|---|
| FastQC | Quality control tool for high-throughput sequence data. Checks for per-base quality, adapter contamination, etc. [18] | Used initially on raw sequencing reads (FASTQ files). |
| Trimmomatic | A flexible tool for trimming and removing adapter sequences from sequencing reads. [18] | Preprocessing of raw reads to remove low-quality bases and artifacts. |
| Salmon | A fast and accurate tool for transcript-level quantification from RNA-seq data using quasi-mapping. [18] | Generates transcript abundance estimates, which can be summarized to the gene level. |
| Negative Binomial Distribution | A statistical probability distribution that models count data where the variance is greater than the mean (overdispersion). [49] | The foundational model for count data used by DESeq2 and edgeR. |
| Trimmed Mean of M-values (TMM) | A normalization method that corrects for compositional differences between sample libraries. [18] [49] | The default normalization method in edgeR, also recommended for use with limma-voom. |
| R/Bioconductor | An open-source software environment for statistical computing and genomics. | The platform on which DESeq2, edgeR, and limma are implemented and run. |
There is no single "best" tool for differential expression analysis in the context of small sample sizes and low sequencing depth. The optimal choice depends on the specific parameters of your study.
- For very small sample sizes (n=2),
edgeRis often the most efficient choice. - With at least 3 replicates,
DESeq2shows robust performance, particularly as the number of replicates grows to 6 or more. - For studies with complex experimental designs or those that require integration with other data types (e.g., proteomics),
limma-voomoffers superior flexibility.
Regardless of the tool selected, the most critical factor for a successful analysis is sound experimental design. Investing in an adequate number of biological replicates, even if it means compromising on sequencing depth, will provide a more substantial foundation for reliable biological discovery.
Filtering Low-Expressed Genes and Managing Over-Dispersion
In the rigorous field of transcriptomics, differential expression (DE) analysis serves as a cornerstone for uncovering the molecular mechanisms underlying health and disease. RNA sequencing (RNA-seq) provides a powerful, genome-wide snapshot of gene activity, but the transformation of raw sequence data into reliable biological insights hinges on robust statistical preprocessing. Among the most critical preprocessing challenges are the handling of low-expressed genes and the management of over-dispersion—the excess variability in count data beyond what simple Poisson models can explain. These factors, if not properly addressed, can severely skew statistical results, leading to both false positives and false negatives.
The three most widely-used tools for DE analysis—DESeq2, edgeR, and limma (with its voom transformation)—each employ distinct statistical philosophies to tackle these issues. Understanding their unique approaches is not merely a technical exercise; it is a fundamental requirement for researchers and drug development professionals who need to ensure the validity of their findings. This guide provides an objective, data-driven comparison of how these methods manage low-expression filtering and over-dispersion, framing the discussion within the broader context of benchmarking DE tools. By synthesizing information from published protocols, benchmark studies, and methodological evaluations, we aim to equip scientists with the knowledge to select and implement the most appropriate tool for their specific experimental context.
Statistical Foundations: A Comparative Look at DE Tools
At their core, DESeq2, edgeR, and limma-voom are designed to answer the same question: which genes are differentially expressed between two or more biological conditions? However, their underlying statistical models and approaches to data normalization and variance stabilization differ significantly. The table below summarizes the core characteristics of each method.
Table 1: Core Statistical Foundations of DESeq2, edgeR, and limma-voom
| Aspect | DESeq2 | edgeR | limma-voom |
|---|---|---|---|
| Core Statistical Approach | Negative binomial modeling with empirical Bayes shrinkage [3] [12] | Negative binomial modeling with flexible dispersion estimation [3] [12] | Linear modeling with empirical Bayes moderation on voom-transformed data [3] [12] |
| Default Normalization | Median of ratios method based on geometric means [3] | Trimmed Mean of M-values (TMM) [3] [18] | Conversion of counts to log-CPM (Counts Per Million) using TMM-normalized library sizes [3] |
| Variance Handling | Adaptive shrinkage for dispersion estimates and fold changes [3] [51] | Flexible options for common, trended, or tagwise dispersion [3] | Empirical Bayes moderation improves variance estimates for small sample sizes; voom models the mean-variance relationship [3] [18] |
| Ideal Sample Size | ≥3 replicates, performs well with more [3] | ≥2 replicates, efficient with small samples [3] | ≥3 replicates per condition [3] |
These foundational differences directly influence how each tool manages the twin challenges of low-expression filtering and over-dispersion. The negative binomial-based models (DESeq2 and edgeR) explicitly model count data, while limma-voom applies a powerful framework designed for continuous, normally distributed data to RNA-seq via a careful transformation.
Handling Low-Expressed Genes: Strategies and Protocols
Genes with very low counts provide little statistical information for differential testing and can increase the burden of multiple testing corrections, thereby reducing the power to detect true differences. All three methods recommend filtering out such genes, though their default approaches vary.
DESeq2's Independent Filtering
DESeq2 incorporates an automatic independent filtering step within its results() function. This step is not a direct row-based filter on counts, but rather removes genes with low overall counts based on their mean normalized count. The rationale is that genes with very low mean counts have little chance of showing significant evidence against the null hypothesis. This filtering is performed in a way that is independent of the test statistic, which helps to maximize the number of discoveries while controlling the false discovery rate (FDR). Users can disable this feature, but it is generally recommended.
edgeR's Recommended Filtering
Unlike DESeq2, edgeR does not have a built-in automatic filter. Instead, its user guide strongly recommends that analysts manually filter the data before conducting DE analysis. A common and effective rule of thumb is to keep only genes that achieve a minimum count-per-million (CPM) value in a minimum number of samples. The specific threshold is determined by the experimental design, often requiring a CPM of >1 in at least the number of samples corresponding to the smallest group. For example, in a balanced experiment with three replicates per condition, a gene would need a CPM > 1 in at least three samples to be retained [51]. This is implemented via the filterByExpr function.
limma-voom's Pre-filtering
Similar to edgeR, filtering for limma-voom is a manual prerequisite step. The same filterByExpr function from edgeR is commonly used to create a logical vector indicating which genes to keep, based on the experimental design. The voom transformation is then applied only to this filtered expression set. This ensures that the mean-variance relationship modeled by voom is not unduly influenced by uninformative, low-count genes [3].
Table 2: Comparative Filtering Strategies for Low-Expressed Genes
| Method | Filtering Approach | Default/Recommended Threshold | Key Rationale |
|---|---|---|---|
| DESeq2 | Automatic independent filtering | Integrated into results(); removes low mean count genes |
Maximizes discoveries while controlling FDR [3] |
| edgeR | Manual pre-filtering (e.g., filterByExpr) |
CPM > 1 in at least n samples, where n is the smallest group size [51] |
Removes uninformative genes, increases power, reduces multiple testing burden [3] |
| limma-voom | Manual pre-filtering (e.g., filterByExpr) |
Same as edgeR's recommendation [3] | Prevents low-count genes from influencing the mean-variance relationship [3] |
Managing Over-Dispersion: Statistical Frameworks and Shrinkage
Over-dispersion is a hallmark of RNA-seq count data. All three methods employ sophisticated empirical Bayes techniques to stabilize variance or dispersion estimates by borrowing information across all genes, which is particularly crucial in experiments with small sample sizes.
DESeq2's Shrinkage
DESeq2 uses a parametric empirical Bayes approach to shrink gene-wise dispersion estimates toward a fitted trended mean (the "dispersion-mean relationship"). This shrinkage provides more stable estimates, especially for genes with low counts and few replicates. Furthermore, DESeq2 also applies shrinkage to the log2 fold changes, which helps to prevent false positives from genes with high variability and low counts. This results in more conservative and reliable fold change estimates [3] [51].
edgeR's Flexibility
edgeR offers greater flexibility in its dispersion estimation. It can calculate a common dispersion (one value for all genes), trended dispersion (where dispersion is a function of abundance), or tagwise dispersion (gene-specific estimates). Like DESeq2, it uses an empirical Bayes method to shrink the gene-wise dispersions toward the common or trended dispersion. This provides a robust compromise between the overly simplistic common dispersion and the overly noisy gene-wise dispersion [3]. edgeR also offers a robust option via estimateGLMRobustDisp to reduce the influence of outlier counts.
limma-voom's Moderation
The voom transformation converts RNA-seq counts into continuous, normally distributed log2-CPM values with estimated precision weights. These weights capture the mean-variance relationship in the data. The transformed data is then fed into limma's standard linear modeling pipeline, which applies empirical Bayes moderation to the gene-wise variances. This moderation shrinks the estimated variances of individual genes toward a pooled estimate, improving power and reliability in small-sample experiments [3] [18].
The following diagram illustrates the core analytical workflows of the three methods, highlighting the key steps for managing over-dispersion and filtering.
Experimental Protocols for Benchmarking
To objectively compare the performance of these tools, researchers often employ standardized benchmarking protocols using datasets where the "ground truth" is known, either through validated gene sets or sophisticated simulations.
Protocol 1: Permutation Analysis for FDR Control
This protocol is used to assess a method's ability to control false positives in real datasets with large sample sizes [24].
- Input: A real RNA-seq count matrix from a population-level study (e.g., with dozens to hundreds of samples per condition).
- Permutation: Randomly permute the condition labels (e.g., case/control) across the samples hundreds or thousands of times. This creates "negative control" datasets where no true differential expression should exist, as the group assignment is now random.
- Analysis: Run DESeq2, edgeR, limma-voom, and other methods on each permuted dataset.
- Evaluation: For each method, calculate the number of genes called differentially expressed (at a nominal FDR of 5%) in each permuted run. A well-controlled method should yield a median of ~5% false discoveries. Studies have shown that DESeq2 and edgeR can sometimes exceed 20% FDR in this test on large datasets, while non-parametric methods like the Wilcoxon rank-sum test may offer more robust control [24].
Protocol 2: Semi-Synthetic Data with Spiked-in Truth
This protocol, used in studies like Schurch et al. (2016) and others, evaluates both sensitivity and FDR [51].
- Input: A real count matrix is used as a base. A set of genes is artificially designated as "true positives."
- Spike-in: The counts for the "true positive" genes are systematically altered by a defined fold change to simulate genuine differential expression. This can be done in a way that preserves the underlying technical and biological noise of real data.
- Subsampling: The semi-synthetic dataset is repeatedly subsampled to smaller sizes (e.g., 3 vs. 3 samples) to evaluate performance with low replication.
- Analysis and Evaluation: Each DE method is run on the full and subsampled datasets. The number of true positives recovered and false positives identified is tracked. This allows for the calculation of precision (Positive Predictive Value) and recall (Sensitivity) across a range of sample sizes and fold changes.
Performance Benchmarking and Key Findings
Empirical benchmarks have revealed critical insights into the performance characteristics of DESeq2, edgeR, and limma-voom, particularly regarding their handling of over-dispersion and sensitivity to experimental design.
Table 3: Performance Benchmarks from Key Studies
| Benchmark Context | Key Finding on DESeq2 & edgeR | Key Finding on limma-voom | Citation |
|---|---|---|---|
| Population-level data (n > 100) | May produce exaggerated false positives; actual FDR can exceed 20% when target is 5% [24] | More robust FDR control compared to DESeq2/edgeR in large-sample scenarios [24] | [24] |
| Standard experiments (n = 3-10) | DESeq2 and edgeR show ~90% overlap in DEG calls and similar performance for gene-level DE [51] | Can have reduced sensitivity compared to DESeq2/edgeR with small n, small FC, or low counts [51] | [51] |
| Computational Efficiency | Can be computationally intensive for large datasets [3] | Very efficient, scales well to thousands of samples [3] | [3] |
| Model Fit in Large Samples | Negative binomial model can be violated, leading to false positives due to outliers [24] | Linear modeling on transformed data can be more robust to model violations and outliers [24] | [24] |
A notable finding from recent research is the impact of sample size. While DESeq2 and edgeR are the workhorses for small-sample experiments, their performance can become anti-conservative (producing too many false positives) in very large population-level studies with hundreds of samples. In such cases, the underlying negative binomial model assumptions can be violated by outliers or unknown confounders, leading to a failure of FDR control. For these large-scale studies, benchmarks suggest that non-parametric methods like the Wilcoxon rank-sum test or the limma-voom pipeline can provide more reliable FDR control [24].
To implement the protocols and analyses described, researchers rely on a core set of computational tools and resources.
Table 4: Essential Research Reagent Solutions for RNA-seq DE Analysis
| Item Name | Function / Application | Key Features / Notes |
|---|---|---|
| DESeq2 (Bioconductor) | Differential expression analysis based on negative binomial distribution. | Performs automatic filtering, dispersion shrinkage, and LFC shrinkage. Integral for standard RNA-seq analysis [3] [12]. |
| edgeR (Bioconductor) | Differential expression analysis based on negative binomial distribution. | Offers flexible dispersion estimation (common, trended, tagwise) and quasi-likelihood tests [3] [12]. |
| limma (Bioconductor) | Linear modeling of high-throughput data. | Used in conjunction with the voom function for RNA-seq data. Provides empirical Bayes moderation of variances [3] [12]. |
| FastQC | Quality control of raw sequencing reads. | Identifies sequencing artifacts, adapter contamination, and overall read quality. Essential first step in any pipeline [18]. |
| Salmon | Pseudo-alignment and quantification of transcript abundances. | Highly efficient and accurate tool for estimating gene-level expression counts from raw reads [18]. |
| splatter (R package) | Simulating single-cell and bulk RNA-seq data. | Used for benchmarking; allows generation of synthetic datasets with known ground truth for method evaluation [39]. |
The choice between DESeq2, edgeR, and limma-voom is not a matter of identifying a single "best" tool, but rather of selecting the most appropriate tool for a specific experimental context. Their approaches to filtering and managing over-dispersion are tailored to different challenges.
Based on the aggregated benchmarking data:
- For standard experiments with small to moderate sample sizes (3-10 replicates), both DESeq2 and edgeR are excellent choices, offering high sensitivity and generally reliable FDR control. DESeq2's automatic filtering and conservative fold changes can be advantageous for non-specialists.
- For large-scale population studies (dozens to hundreds of samples), limma-voom is often recommended due to its computational efficiency and more robust FDR control observed in benchmarks, which may be less susceptible to violations of the negative binomial model [3] [24].
- For complex experimental designs with multiple factors, limma's linear model framework is exceptionally powerful and flexible.
- When analyzing data with suspected outliers, edgeR's
estimateGLMRobustDispfunction or DESeq2's automatic outlier detection can be beneficial, though non-parametric methods may offer the greatest robustness [24] [51].
Ultimately, a rigorous DE analysis requires more than just running a software tool. It demands careful quality control, thoughtful consideration of filtering thresholds, and an understanding of the statistical assumptions underlying the chosen method. By aligning the tool's strengths with the study's design, researchers can ensure the identification of differentially expressed genes is both biologically meaningful and statistically sound.
This guide provides a performance-focused comparison of three leading differential expression (DE) analysis tools—DESeq2, edgeR, and limma (voom)—evaluating their computational efficiency and scalability for RNA-seq data analysis. Based on comprehensive benchmarking studies, limma consistently demonstrates superior speed and efficient resource utilization, particularly with large datasets. DESeq2 and edgeR offer robust statistical performance but can become computationally intensive as sample sizes grow. The optimal tool choice depends on specific experimental parameters, including sample size, biological variability, and computational resources.
Performance Metrics and Benchmarking Data
Independent benchmarking studies reveal clear performance differences among the three tools. The following table summarizes key quantitative findings regarding their computational efficiency and resource demands.
Table 1: Computational Performance Comparison of DESeq2, edgeR, and limma
| Performance Metric | DESeq2 | edgeR | limma (voom) | Supporting Evidence |
|---|---|---|---|---|
| Overall Computational Speed | Can be computationally intensive, especially for large datasets [3] | Highly efficient, fast processing [3] | Very efficient, scales well with large datasets [3] | [3] [52] |
| Scalability with Sample Size | Performance can be impacted in large population studies; may exhibit FDR inflation [24] | Efficient with small samples; performance varies in large datasets [3] [24] | Excellent scalability; handles large sample sizes efficiently [3] | [3] [24] |
| Handling of Complex Designs | Handles complex designs well [52] | Flexible modeling needs; handles technical replicates well [3] | Excels at complex multi-factor experiments and time-series data [3] | [3] [52] |
| Resource Intensity | More computationally intensive [3] | Highly efficient [3] | Very computationally efficient [3] | [3] |
Experimental Protocols for Benchmarking
To ensure fair and reproducible performance comparisons, benchmarking studies typically follow a standardized workflow and evaluation framework.
Standardized RNA-seq Analysis Workflow
The diagram below outlines the core computational workflow for differential expression analysis, shared by all three tools.
Key Methodologies in Performance Studies
Benchmarking studies employ rigorous methodologies to evaluate tool performance:
- Data Types: Studies use both real RNA-seq datasets (e.g., from SEQC/MAQC or Quartet projects) and in silico simulated data where the "ground truth" of differential expression is known [52] [17]. Simulation allows for precise control over parameters like sample size, proportion of DE genes, and effect sizes [52].
- Performance Metrics: Key metrics include computational runtime (speed), memory usage (resource consumption), area under the receiver operating curve (AUC), true positive rate (TPR), and false discovery rate (FDR) control [52].
- Test Conditions: Benchmarks test performance across diverse scenarios, including variations in sample size (from few to hundreds of replicates), proportion of DE genes, presence of outliers, and level of biological variability [52] [24].
The table below lists critical resources and data required for conducting robust differential expression analysis and performance benchmarking.
Table 2: Essential Research Reagents and Resources for RNA-seq DE Analysis
| Category | Item | Function in Analysis |
|---|---|---|
| Reference Materials | MAQC/SEQC Reference RNA Samples (e.g., A, B) | Provide benchmarks with large biological differences for validating analysis accuracy [17]. |
| Quartet Project Reference Materials | Enable assessment of subtle differential expression, more relevant to clinical scenarios [17]. | |
| ERCC Spike-in RNA Controls | Synthetic RNA controls with known concentrations to monitor technical performance and normalization [17]. | |
| Software & Pipelines | R/Bioconductor Environment | The standard platform for running DESeq2, edgeR, and limma analyses [3]. |
| Quality Control Tools (e.g., FastQC, fastp) | Assess raw sequence data quality and perform adapter trimming [18] [7]. | |
| Alignment/Quantification Tools (e.g., Salmon) | Map sequencing reads to a reference genome and quantify transcript abundances [18]. | |
| Computational Resources | High-Performance Computing (HPC) Cluster | Essential for processing large-scale RNA-seq datasets in a time-efficient manner. |
Decision Framework for Tool Selection
The choice between DESeq2, edgeR, and limma should be guided by the specific context of the study. The following diagram provides a logical pathway for selecting the most appropriate tool.
In summary, the computational performance of DESeq2, edgeR, and limma presents a classic trade-off. limma (voom) stands out for projects requiring rapid analysis of large sample sizes or when computational resources are a limiting factor. DESeq2 demonstrates robustness across a wide range of conditions, though at a higher computational cost. edgeR offers a strong balance, particularly for studies focused on low-abundance transcripts or those with very small sample sizes.
Future directions in DE tool development will likely focus on improving scalability for massive population-scale studies and enhancing robustness to data artifacts and outliers. As evidenced by large-scale consortium efforts like the Quartet project, the community is moving towards more standardized benchmarking using reference materials that reflect biologically subtle differences, which will further refine our understanding of tool performance in real-world scenarios [17].
Head-to-Head Benchmarking: Performance in Simulated and Real Data
Differential expression (DE) analysis is a fundamental methodology in transcriptomics for identifying genes whose expression changes significantly between different biological conditions. The reliability of these findings depends heavily on the statistical methods employed, making rigorous benchmarking essential for the research community. Benchmarking studies typically evaluate analytical tools using controlled datasets where the true differential expression status is known, allowing for the calculation of performance metrics that quantify how well each method separates true biological signals from background noise. The most informative metrics for this task are the F-score, which combines precision and recall into a single measure; the Area Under the Precision-Recall Curve (AUPR), which evaluates performance across all decision thresholds; and false positive control, which assesses a method's reliability in minimizing false discoveries. These metrics provide complementary insights into method performance under various experimental conditions, including different sample sizes, data sparsity levels, effect sizes, and batch effect scenarios.
Understanding the strengths and limitations of popular DE tools—DESeq2, edgeR, and limma—has been the focus of extensive benchmarking research. These tools employ distinct statistical approaches: DESeq2 and edgeR utilize negative binomial models with empirical Bayes shrinkage for dispersion estimation, while limma applies linear modeling with empirical Bayes moderation to log-transformed count data. Each approach exhibits different sensitivities to data characteristics such as sample size, sequencing depth, and the presence of outliers. This article synthesizes evidence from recent benchmarking studies to compare these methods using standardized metrics, providing researchers with evidence-based guidance for selecting appropriate tools across diverse experimental scenarios.
Quantitative Performance Comparison Across Methods
Benchmarking studies consistently reveal that the performance of differential expression methods varies significantly across different experimental conditions. No single method universally outperforms all others, but distinct patterns emerge when evaluating overall performance across multiple metrics.
Table 1: Overall Method Performance Across Multiple Benchmarking Studies
| Method | Statistical Foundation | Recommended Sample Size | Strengths | Limitations |
|---|---|---|---|---|
| DESeq2 | Negative binomial with empirical Bayes shrinkage | ≥3 replicates, better with more [3] | Robust performance across conditions, strong FDR control [52] | Conservative fold change estimates, computationally intensive for large datasets [3] |
| edgeR | Negative binomial with flexible dispersion estimation | ≥2 replicates, efficient with small samples [3] | Excellent for low-expression genes, multiple testing strategies [3] | Requires careful parameter tuning, inflated FDR with large samples [24] |
| limma | Linear modeling with empirical Bayes moderation | ≥3 replicates per condition [3] | Handles complex designs, computationally efficient, robust to outliers [3] [52] | May not handle extreme overdispersion well [3] |
| Wilcoxon | Non-parametric rank-based test | ≥8 per condition for good power [24] | Robust to outliers, controls FDR in large samples [24] | Low power with small samples, less interpretable coefficients [24] |
In a comprehensive benchmark of 12 DE analysis methods using both spike-in and simulation data, DESeq2, a robust version of edgeR (edgeR.rb), voom with TMM normalization (voom.tmm) and voom with sample weights (voom.sw) demonstrated robust performance regardless of the presence of outliers and the proportion of differentially expressed genes [52]. The performance of these methods, however, was significantly influenced by specific dataset characteristics, particularly the dispersion parameter and the proportion of DE genes.
Performance Metrics Under Specific Conditions
Table 2: Performance Metrics Across Different Experimental Conditions
| Experimental Condition | Best Performing Methods | Key Metrics | Supporting Evidence |
|---|---|---|---|
| Large sample sizes (>100 samples) | Wilcoxon, limma with winsorization | FDR control: Wilcoxon (actual FDR ~5%), DESeq2/edgeR (actual FDR up to 20-25%) [24] | Permutation tests on population-level datasets [24] |
| Small sample sizes | edgeR, DESeq2, limma | Power: edgeR efficient with small samples, DESeq2 requires ≥3 replicates [3] | Simulation studies with limited replicates [3] |
| Low sequencing depth | limma-trend, Wilcoxon, FEM for log-normalized data | F-score: Superior performance for low-depth data [39] | Model-based simulation tests with average nonzero counts of 4-10 [39] |
| Substantial batch effects | MAST with covariate, ZW_edgeR with covariate | F0.5-score: Among highest for large batch effects [39] | Benchmarking 46 workflows with multiple batches [39] |
| CircRNA data (low expression) | limma-voom, SAMseq | FDR control and recall: Most consistent performance [53] | Testing 38 pipelines on circRNA datasets [53] |
For single-cell RNA-seq data with multiple batches, benchmarking of 46 workflows revealed that parametric methods based on MAST, DESeq2, edgeR, and limma-trend showed good F0.5-scores and partial AUPR values. The use of batch-corrected data rarely improved DE analysis for sparse data, whereas batch covariate modeling improved analysis when substantial batch effects were present [39]. Covariate modeling overall improved DE analysis for large batch effects, though its benefit diminished for very low sequencing depths [39].
Detailed Experimental Protocols
Standard Benchmarking Workflow for DE Tools
The following diagram illustrates the comprehensive workflow employed in rigorous benchmarking studies for differential expression analysis tools:
Data Simulation and Preprocessing Protocols
Benchmarking studies typically employ multiple data generation approaches to thoroughly evaluate method performance:
Simulated Data Generation: Benchmarking studies often use splatter-based simulations to generate synthetic RNA-seq count data with known differentially expressed genes. The standard approach utilizes the splatter R package to simulate data based on negative binomial models, incorporating parameters for batch effects, sequencing depth, and data sparsity. For example, in one benchmark, researchers simulated sparse data with high overall zero rates (>80%) after gene filtering, using moderate depth (average nonzero count of 77 after filtering), and simulated 20% DE genes (10% up and 10% down) [39]. The batch and group factors were estimated using principal variance component analysis (PVCA) to quantify effect strengths.
Spike-in Data Utilization: The Sequencing Quality Control (SEQC) dataset from the MAQC study provides another benchmarking approach, containing replicated samples of universal human reference RNA with spike-in controls. These datasets enable performance evaluation with technical replicates, though they exhibit much smaller dispersion estimates compared to biological replicate data [52].
Real Data with Permutation: For population-level studies with large sample sizes, permutation tests provide a robust evaluation framework. Researchers generate negative-control datasets by randomly permuting condition labels across samples, creating scenarios where any identified DEGs represent false positives [24]. This approach was applied to 13 population-level RNA-seq datasets with sample sizes ranging from 100 to 1376 [24].
Method Application and Evaluation Protocol
The application of DE methods in benchmarking studies follows standardized procedures:
Method Configuration: Each differential expression method is applied with appropriate normalization techniques. For bulk RNA-seq tools, this includes DESeq2 with its default normalization, edgeR with TMM normalization, and limma with voom transformation with TMM normalization. Single-cell dedicated methods such as MAST and ZINB-WaVE are applied with their recommended preprocessing steps [39].
Batch Effect Handling: Studies specifically evaluate different approaches for handling batch effects, including (1) DE analysis of batch-effect-corrected data, (2) covariate modeling that includes batch as a covariate, and (3) meta-analysis combining results across batches [39].
Statistical Evaluation: Performance is assessed using the F-score, AUPR, and false discovery rates. For simulated data, the F-score and AUPR are calculated based on known true positives. For real data with permutation, the false positive rate is calculated as the proportion of permuted datasets where significant findings are detected [24]. Many studies use partial AUPR (pAUPR) for recall rates <0.5, which weighs precision higher than recall—particularly important for identifying a small number of marker genes from sparse single-cell RNA-seq data [39].
Experimental Reagents and Computational Tools
Essential Research Reagent Solutions
Table 3: Key Experimental reagents and Platforms for RNA-seq Benchmarking
| Reagent/Platform | Type | Primary Function | Considerations for Benchmarking |
|---|---|---|---|
| Spike-in RNA Controls | Biochemical Reagents | Reference transcripts with known concentrations for accuracy assessment | Enable technical variability measurement without biological variation [52] |
| Reference RNA Samples | Biological Reagents | Standardized RNA materials from established sources (e.g., MAQC samples) | Provide consistent baseline for method comparison across studies [52] |
| 10x Genomics Platform | Sequencing Technology | High-throughput single-cell RNA sequencing | Generates sparse data characteristic of droplet-based methods [39] |
| Smart-seq2 Protocol | Sequencing Technology | High-sensitivity full-length transcript sequencing | Produces different zero-inflation patterns than 10x [54] |
| RNase R Treatment | Enzymatic Reagent | Circular RNA enrichment for circRNA studies | Creates specialized datasets for method evaluation on low-abundance transcripts [53] |
Computational Tools and Software Packages
The benchmarking of differential expression methods relies on a comprehensive suite of computational tools and software packages:
Primary DE Analysis Tools: The core tools evaluated in benchmarking studies include DESeq2, edgeR, and limma-voom, which represent the most widely-used methods for bulk RNA-seq analysis. For single-cell data, additional methods such as MAST (Model-based Analysis of Single-cell Transcriptomics) and ZINB-WaVE (Zero-Inflated Negative Binomial-based Want Variation Extraction) are included due to their specialized handling of zero-inflated distributions [39].
Batch Effect Correction Methods: Comprehensive benchmarks evaluate multiple BEC algorithms including ZINB-WaVE, MNN (Mutual Nearest Neighbors), scMerge, Seurat v3, limma_BEC, scVI (single-cell Variational Inference), scGen, Scanorama, RISC, and ComBat [39]. These methods employ diverse approaches from deep learning to statistical models for removing technical variations between datasets.
Simulation Frameworks: The splatter R package provides a widely-adopted framework for simulating single-cell RNA-seq count data with various parameter settings for dropout effects, library sizes, and differential expression patterns [39]. Additional simulation approaches include semi-parametric methods using real data as a basis while introducing controlled differential expression.
Specialized Packages: Recent method developments include dreamlet, which uses a pseudobulk approach based on precision-weighted linear mixed models to identify genes differentially expressed across subjects for each cell cluster [55]. This approach is specifically designed for large-scale datasets with hundreds of subjects and millions of cells.
Visualization of Method Performance Relationships
The following diagram illustrates the relationship between experimental conditions and optimal method selection based on benchmarking evidence:
The comprehensive benchmarking evidence reveals that method performance depends critically on specific experimental parameters, particularly sample size, data sparsity, and the presence of batch effects. For standard bulk RNA-seq experiments with moderate sample sizes (5-20 samples per group), DESeq2, edgeR, and limma-voom all demonstrate robust performance with minor differences in their sensitivity-specificity tradeoffs. DESeq2 shows particular strength in controlling false discoveries, while edgeR exhibits advantages for analyzing low-expression genes, and limma-voom provides computational efficiency and handling of complex designs.
For large-scale population studies with hundreds of samples, researchers should exercise caution with parametric methods like DESeq2 and edgeR due to their tendency for FDR inflation. In these scenarios, the Wilcoxon rank-sum test provides superior false positive control, though with potentially reduced power for subtle effects. As demonstrated in recent research, winsorization preprocessing (particularly at the 93rd-95th percentile) can substantially mitigate FDR inflation in DESeq2 and edgeR while maintaining power comparable to Wilcoxon [56].
In single-cell RNA-seq analyses, where data sparsity and technical variability present distinct challenges, benchmarking evidence suggests that batch covariate modeling generally outperforms the use of pre-corrected data. For very low sequencing depth scenarios, limma-trend and Wilcoxon tests demonstrate particularly robust performance. As the field continues to evolve with new computational approaches and experimental protocols, ongoing method benchmarking will remain essential for ensuring the reliability of transcriptomic discoveries across diverse biological contexts.
Differential expression analysis is a cornerstone of transcriptomics, fundamental for understanding the molecular basis of phenotypic variation. Among the most widely adopted tools for this task are DESeq2, edgeR, and limma, each employing distinct statistical frameworks to identify differentially expressed genes (DEGs) from RNA-seq data. A critical challenge in the analysis of RNA-seq data is the substantial complexity, which has prompted a large amount of research on algorithms and methods, resulting in no clear consensus about the most appropriate pipelines [28]. This guide objectively compares the DEG lists generated by these three tools, synthesizing evidence from key benchmarking studies to elucidate the sources of their agreement and discrepancy. We provide supporting experimental data and detailed methodologies to empower researchers, scientists, and drug development professionals in making informed analytical decisions.
Statistical Foundations and Performance Profiles
The core differences between DESeq2, edgeR, and limma originate from their underlying statistical models and approaches to handling RNA-seq count data. The table below summarizes their fundamental characteristics and performance profiles based on extensive evaluations [3] [57] [21].
Table 1: Core Statistical Foundations and Performance Profiles of DESeq2, edgeR, and limma
| Aspect | limma | DESeq2 | edgeR |
|---|---|---|---|
| Core Statistical Approach | Linear modeling with empirical Bayes moderation of variances [3] | Negative binomial modeling with empirical Bayes shrinkage for dispersion and fold changes [3] | Negative binomial modeling with flexible dispersion estimation (common, trended, or tagwise) [3] |
| Key Components | voom transformation, precision weights, linear modeling [3] |
Internal normalization, dispersion estimation, GLM fitting, hypothesis testing [3] | Normalization (e.g., TMM), dispersion modeling, GLM/Quasi-likelihood (QLF) testing [3] |
| Ideal Sample Size | ≥3 replicates per condition [3] | ≥3 replicates; performs well with more [3] | ≥2 replicates; highly efficient with small samples [3] |
| Best Use Cases | Complex multi-factor experiments, time-series data, integration with other omics data [3] | Moderate to large sample sizes, data with high biological variability, strong false discovery rate (FDR) control [3] | Very small sample sizes, large datasets, experiments with technical replicates [3] |
| Computational Efficiency | Very efficient and scales well with large datasets [3] | Can be computationally intensive for very large datasets [3] | Highly efficient, with fast processing times [3] |
Levels of Agreement in DEG Lists
Concordance Based on Real-World Benchmarking
The level of agreement in DEG lists between DESeq2, edgeR, and limma is not fixed; it is significantly influenced by the experimental design and the nature of the biological differences being studied.
- High Concordance with Clear, Large Expression Differences: When analyzing samples with large biological differences, such as the well-known MAQC samples (derived from different cancer cell lines and brain tissues), the three tools show a high degree of overlap in their DEG lists [17]. This strong concordance under conditions with large expression changes reinforces confidence in the identified DEGs.
- Greater Discrepancy with Subtle Expression Differences: In contrast, when biological differences are subtle, as is common in clinical contexts (e.g., different disease subtypes or stages), the agreement between tools can decrease markedly. A large multi-center study using Quartet reference materials, which are designed to mimic these subtle differences, reported "significant variations in detecting subtle differential expression" across laboratories and methods [17]. This indicates that tool choice becomes critically important when the signal-to-noise ratio is lower.
Impact of Sample Size and Replicates
The number of biological replicates is a critical factor affecting both the statistical power of the analysis and the agreement between tools.
- Small Sample Sizes: With very small sample sizes (e.g., 2-3 replicates per condition), which are still common in RNA-seq experiments, all methods face challenges in accurately estimating gene-wise dispersion, leading to instability and higher rates of false positives or negatives [57]. Under these conditions, results from any tool, and the overlap between them, should be interpreted with caution [57].
- Larger Sample Sizes: As sample size increases, the performance and agreement of the methods generally improve. Studies have shown that for larger sample sizes, methods combining a variance-stabilizing transformation with the
limmamethod perform well, as does the nonparametric SAMseq method [57].
Experimental Protocols for Benchmarking
To ensure robust and reproducible comparisons of DEG tools, researchers should adhere to structured experimental protocols. The following workflow, derived from published benchmarking studies, outlines the key steps from data preparation to final evaluation [3] [28] [7].
Data Preparation and Quality Control
- Raw Read Processing: Begin with raw sequencing reads in FASTQ format. The quality of the sequences should be assessed using tools like FASTQC [28] [7].
- Filtering and Trimming: Adapter sequences and low-quality nucleotides must be removed. This step increases the read mapping rate. Tools like fastp (favored for speed and simplicity) or Trim Galore (an integrated wrapper for Cutadapt and FastQC) are commonly used [7]. It is recommended to apply trimming non-aggressively, preserving a wise read length to avoid unpredictable changes in gene expression [28].
Read Alignment and Quantification
- Alignment: Processed reads are aligned to a reference genome or transcriptome. The choice of aligner (e.g., STAR, HISAT2) is a known source of variation in RNA-seq pipelines [28] [17].
- Quantification: The number of reads mapping to each genomic feature (gene or transcript) is determined using tools like FeatureCounts or HTSeq, generating a count matrix for downstream analysis [28] [7].
Differential Expression Analysis
- Generate Count Matrix: The starting point for DESeq2, edgeR, and limma is a matrix of integer counts, where each row represents a gene and each column represents a sample [57] [21].
- Parallel DE Analysis: Apply the three tools to the same count matrix, following their standard workflows. For limma, this involves the
voomtransformation to model the mean-variance relationship [3] [57]. DESeq2 and edgeR perform internal normalization and model the raw counts directly using a negative binomial generalized linear model (GLM) [3] [21]. Consistent filtering of lowly expressed genes and use of a common FDR threshold (e.g., 5%) and fold-change threshold are essential for a fair comparison.
Evaluation and Comparison of DEG Lists
- Venn Diagrams: A direct and intuitive method to visualize the overlap of significant DEGs identified by each tool. This reveals the core set of consensus genes and those unique to specific methods [3].
- Ground Truth Validation: The most robust evaluations rely on "ground truth" for validation. This can be established using:
- qRT-PCR: A gold standard for validating the expression levels of a subset of genes [28].
- Spike-in Controls: Synthetic RNA molecules (e.g., ERCC spikes) with known concentrations can be added to samples, providing an objective standard for assessing accuracy [17] [6].
- In silico Mixtures: Creating sample mixtures with defined ratios (e.g., 3:1) provides built-in truths for differential expression [17] [6].
- Performance Metrics: When ground truth is known (from simulations or spike-ins), standard metrics like Precision (the proportion of identified DEGs that are truly DE), Recall (the proportion of true DEGs that are successfully identified), and FDR control can be calculated to quantitatively assess performance [57] [21].
Table 2: Key Research Reagent Solutions and Computational Tools for DEG Analysis
| Item Name | Type/Function | Brief Description |
|---|---|---|
| Quartet & MAQC Reference Materials | Biological Reference Standards | Well-characterized RNA reference materials from cell lines. Quartet samples enable benchmarking of subtle differential expression, while MAQC samples are used for large differences [17]. |
| ERCC Spike-In Controls | Synthetic RNA Controls | A set of 92 synthetic RNA transcripts with known sequences and concentrations, spiked into samples to provide an absolute standard for assessing quantification accuracy and DE detection [28] [17]. |
| TaqMan qRT-PCR Assays | Experimental Validation | Fluorescence-based probes used for validating RNA-seq results via qRT-PCR, considered a highly accurate method for measuring the expression of individual genes [28]. |
| DESeq2 / edgeR / limma | Software Package | Core R/Bioconductor packages for conducting differential expression analysis. They represent the current state-of-the-art and are the focus of this guide [3] [57] [21]. |
| fastp / Trim Galore | Bioinformatics Tool | Software for quality control, adapter trimming, and filtering of raw RNA-seq reads to ensure high-quality input data for alignment [7]. |
The evidence from systematic comparisons indicates that while DESeq2, edgeR, and limma often show substantial agreement, particularly with large biological effects and adequate replication, discrepancies are expected and even pronounced when analyzing subtle differential expression. No single tool is universally superior; the optimal choice depends on the specific experimental context.
Based on the aggregated findings, we recommend the following best practices:
- For Simple, Small-Scale Experiments:
edgeRis a robust choice due to its efficiency and performance with limited replicates [3] [21]. - For Standard RNA-seq Analyses:
DESeq2is a reliable workhorse, known for its strong FDR control and good performance across a range of conditions [3] [21]. - For Complex Designs or Large-Scale Data:
limma(with thevoomtransformation) offers excellent computational efficiency and flexibility for modeling complex factors, such as in time-series or multi-factorial studies [3] [57]. - For Maximum Confidence: When possible, researchers should employ a consensus approach. Identifying genes that are consistently called differentially expressed by two or more of these tools provides a more reliable and conservative set of high-confidence DEGs for downstream validation and interpretation.
The decreasing cost of RNA-sequencing has enabled increasingly sophisticated study designs, including longitudinal time series, repeated measures, and continuous exposure assessments [36]. These complex designs generate correlated data that violate the independence assumptions underlying standard differential expression analysis tools. For researchers investigating dynamic biological processes—such as disease progression, drug response kinetics, or developmental trajectories—selecting an appropriate analytical method is crucial for generating biologically valid conclusions.
This guide objectively compares the performance of three widely used differential expression analysis tools—DESeq2, edgeR, and limma (voom)—when analyzing data from complex experimental designs with correlated structures. We focus specifically on their application to time series data and continuous exposures, summarizing empirical findings from benchmark studies and providing detailed methodological protocols for implementation.
Statistical Foundations for Complex Designs
The table below summarizes the core methodological approaches of each tool for handling correlated data:
Table 1: Statistical Foundations for Complex Designs
| Tool | Core Approach for Independent Data | Extensions for Correlated Data | Distributional Assumptions |
|---|---|---|---|
| DESeq2 | Negative binomial GLM with empirical Bayes shrinkage | Limited native support; often requires treating samples as independent | Negative binomial |
| edgeR | Negative binomial GLM with flexible dispersion estimation | Quasi-likelihood (QL) methods; limited random effects support | Negative binomial |
| limma (voom) | Linear modeling of transformed counts with empirical Bayes moderation | duplicateCorrelation() function to account for repeated measures |
Log-normal after voom transformation |
Complex designs such as longitudinal studies introduce correlation through repeated measurements from the same biological units [36]. Methods that ignore this correlation produce biased standard errors and inflated false discovery rates. Proper analytical approaches must account for both the count-based nature of RNA-seq data and the correlated structure.
Performance Benchmarking Evidence
Comprehensive Method Comparison
A 2022 systematic evaluation compared 11 methods for analyzing correlated RNA-seq data, with emphasis on multiple degree of freedom (DF) tests valuable for time series analyses [36]. The study conducted extensive simulations and applied methods to a real longitudinal dataset from ICU patients with cardiogenic or septic shock.
Table 2: Performance Benchmarking Results from Simulation Studies
| Method | FDR Control | Power | Convergence Rate | Sample Size Requirements |
|---|---|---|---|---|
| Linear Mixed Models (transformed data) | Best control | Relatively high | Low (especially with small n) | Higher sample sizes needed |
| DESeq2 (standard) | Variable (conservative to anti-conservative) | Moderate | High | Moderate |
| edgeR (standard) | Variable (conservative to anti-conservative) | Moderate | High | Moderate |
| limma-voom (with correlation) | Good control | Moderate to high | High | Moderate |
Key findings from this comprehensive benchmark include:
- Linear mixed models applied to transformed data demonstrated the best false discovery rate (FDR) control while maintaining relatively high power, but suffered from high model non-convergence rates, particularly at small sample sizes [36].
- No method maintained high power at the lowest sample sizes (n=3-5 per group/time point), highlighting the importance of adequate replication in complex designs [36].
- The performance of DESeq2 and edgeR was influenced by sample size and the specific hypothesis being evaluated, with both showing a mix of conservative and anti-conservative behavior across different scenarios [36].
Specific Performance Characteristics
For time course experiments with multiple timepoints, limma with the duplicateCorrelation() function enables modeling of sample correlations, making it particularly valuable for repeated measures designs [51]. This approach estimates a common correlation value across all genes for incorporation into the linear model, though this assumes consistent correlation structures across all genes [36].
DESeq2 and edgeR, while highly performant for standard group comparisons, do not natively support random effects or complex covariance structures needed for properly modeling correlated data [36]. When applied to correlated designs without modification, these tools may produce biased results due to violated independence assumptions.
Experimental Protocols for Benchmarking
Simulation Study Design
The benchmark study employed the following rigorous methodology [36]:
Data Generation: Created synthetic datasets with known differential expression patterns and controlled correlation structures to represent various longitudinal designs.
Performance Metrics: Evaluated methods based on:
- False discovery rate (FDR): Proportion of falsely identified DEGs
- Power: Sensitivity to detect true DEGs
- Model convergence: Frequency of successful model fitting
- Computational efficiency: Processing time and memory requirements
Real Data Application: Applied each method to RNA-seq data from septic shock and cardiogenic shock patients over multiple timepoints following ICU admission.
Implementation Protocols
For longitudinal designs with repeated measures, the following limma-voom implementation protocol is recommended:
For edgeR with quasi-likelihood methods:
Workflow and Decision Pathways
The following diagram illustrates the experimental workflow and analytical decision process for selecting appropriate tools:
Diagram 1: Analytical decision pathway for complex RNA-seq designs (76 characters)
Research Reagent Solutions
Table 3: Essential Tools and Packages for Correlated RNA-seq Analysis
| Tool/Package | Function | Application Context |
|---|---|---|
| limma | Linear modeling with empirical Bayes moderation | Time series, repeated measures with duplicateCorrelation() |
| edgeR | Negative binomial generalized linear models | Experiments with technical replicates, balanced designs |
| DESeq2 | Negative binomial modeling with shrinkage | Standard group comparisons with independent samples |
| lme4 | Linear mixed-effects models | Advanced correlated designs with custom covariance structures |
| rmRNAseq | Specialized for repeated measures | Longitudinal designs with continuous auto-regressive structures |
For complex designs involving continuous exposures and time series, limma (voom) with correlation adjustment currently provides the most balanced combination of false discovery rate control and power while maintaining reasonable computational efficiency [36]. When implementing these methods, researchers should ensure adequate sample sizes to support complex modeling approaches and carefully assess model convergence, particularly for linear mixed models with small sample sizes.
The field continues to evolve with new methods specifically designed for correlated RNA-seq data, but current evidence supports limma's correlation handling as a robust approach for time series and repeated measures designs. Researchers working with highly complex covariance structures may need to consider specialized packages or custom implementations to properly account for their specific design characteristics.
Insights from Large-Scale Benchmarking Studies and Community Consensus
This guide provides an objective comparison of three predominant differential expression (DE) analysis tools—DESeq2, edgeR, and limma (often with its voom transformation)—based on findings from large-scale benchmarking studies. The performance of these tools is not uniform but is significantly influenced by experimental design, data type, and sample size. The following data, synthesized from recent rigorous evaluations, offers researchers in drug development and biomedical science a evidence-based framework for selecting the optimal tool for their specific RNA-seq study.
Performance at a Glance: Key Benchmarking Results
Large-scale benchmarking studies systematically evaluate DE tools against defined metrics such as False Discovery Rate (FDR) control, statistical power, and precision. The table below summarizes their performance across different experimental conditions.
Table 1: Performance Summary of DE Tools from Benchmarking Studies
| Experimental Context | Top Performing Tool(s) | Key Findings and Caveats | Primary Citation |
|---|---|---|---|
| Bulk RNA-seq (Standard) | DESeq2, edgeR, limma-voom | All three show high agreement and performance in standard, well-controlled bulk RNA-seq experiments with moderate sample sizes. | [3] [6] |
| Single-cell RNA-seq (Multi-batch) | limma-trend, DESeq2, MAST (with covariate) | Using batch-corrected data rarely improves analysis. Covariate modeling in DESeq2/MAST excels with large batch effects. For low sequencing depth, limma-trend and non-parametric methods perform well. |
[39] |
| Population-level Studies (Large n) | Wilcoxon rank-sum test | Parametric methods (DESeq2, edgeR, limma-voom) can exhibit exaggerated false positives, with FDRs sometimes exceeding 20% when target is 5%. The non-parametric Wilcoxon test provides robust FDR control. | [24] |
| Long-Read RNA-seq | DESeq2, edgeR, limma-voom | The three tools were the top performers for differential transcript expression analysis from long-read sequencing data. | [6] |
| Very Small Sample Sizes | edgeR | Efficient and powerful for experiments with as few as 2 replicates per condition. limma requires at least 3 replicates per condition for reliable variance estimation. | [3] |
Statistical Foundations and Ideal Use Cases
Each tool employs a distinct statistical approach for normalization, variance estimation, and hypothesis testing, which dictates its strengths and limitations.
Table 2: Core Methodologies and Best-Fit Applications
| Aspect | DESeq2 | edgeR | limma | |
|---|---|---|---|---|
| Core Statistical Approach | Negative binomial modeling with empirical Bayes shrinkage. | Negative binomial modeling with flexible dispersion estimation. | Linear modeling with empirical Bayes moderation on log-CPM values transformed via voom. |
[3] |
| Normalization Strategy | Median of ratios from geometric mean. | Trimmed Mean of M-values (TMM). | Uses voom transformation or TMM normalization, not quantile normalization for RNA-seq. |
[3] [10] |
| Variance Handling | Adaptive shrinkage for dispersion estimates and fold changes. | Flexible options for common, trended, or tagwise dispersion. | Empirical Bayes moderation of variances for improved inference with small samples. | [3] |
| Ideal Sample Size | ≥ 3 replicates; performs well with more. | ≥ 2 replicates; efficient with small samples. | ≥ 3 replicates per condition. | [3] |
| Best Use Cases | Moderate to large sample sizes; high biological variability; strong FDR control. | Very small sample sizes; large datasets; technical replicates. | Small sample sizes; multi-factor experiments; time-series data; integration with other omics. | [3] |
| Computational Efficiency | Can be intensive for large datasets. | Highly efficient, fast processing. | Very efficient, scales well to large-scale datasets. | [3] |
Detailed Experimental Protocols from Benchmarking Studies
Protocol: Benchmarking DE Tools for Single-Cell RNA-seq with Batches
A landmark study in Nature Communications benchmarked 46 workflows for single-cell DE analysis in the presence of batch effects [39].
1. Data Simulation and Preparation:
- Model-based Simulation: Count data was simulated using the
splatterR package, which is based on a negative binomial model. Data was generated with high overall zero rates (>80%) to mimic scRNA-seq sparsity. - Parameters: Simulations were run at varying sequencing depths (average non-zero counts of 77, 10, and 4) and with different levels of batch effects (small vs. large).
- Experimental Design: A "balanced" design was used where each batch contained samples from both conditions being compared.
2. Workflow Integration and Testing:
- The study tested three integrative strategies:
- DE analysis of batch-effect-corrected (BEC) data: Using 10 different BEC methods (e.g., ZINB-WaVE, scVI, ComBat) before DE testing.
- Covariate modeling: Including batch as a covariate in the statistical model of the DE tool (e.g.,
DESeq2_Cov). - Meta-analysis: Combining DE results from individual batches using methods like fixed effects models.
- These were compared to a "naïve" DE analysis that pooled all data without considering batch.
3. Performance Evaluation:
- Metrics: F0.5-score (emphasizing precision over recall) and partial Area Under the Precision-Recall Curve (pAUPR) were used.
- Result: The use of BEC data before DE analysis rarely improved performance. For large batch effects, covariate modeling with tools like
MAST_CovandZW_edgeR_Covranked among the highest performers [39].
Protocol: Evaluating FDR Control in Population-Level Studies
A critical study in Genome Biology highlighted the failure of common DE tools to control false discoveries in large-sample studies [24].
1. Data Source and Permutation Analysis:
- Real Datasets: 13 population-level RNA-seq datasets from sources like GTEx and TCGA, with sample sizes ranging from 100 to 1376, were analyzed.
- Permutation: For each original dataset, 1000 negative-control datasets were generated by randomly permuting the condition labels (e.g., pre-treatment vs. on-treatment). Any DEGs identified from these permuted datasets are, by definition, false positives.
2. Tool Comparison and FDR Calculation:
- Methods Tested: DESeq2, edgeR, limma-voom, NOISeq, dearseq, and the Wilcoxon rank-sum test.
- FDR Assessment: The number of false positives called in the permuted datasets was used to calculate the actual FDR for each method and compare it against the target FDR (e.g., 5%).
3. Semi-Synthetic Data for Power Analysis:
- To evaluate power, researchers created 50 semi-synthetic datasets from the real data by spiking in known true positive DEGs, allowing for a comparison of true positive and false positive rates.
4. Key Finding: DESeq2 and edgeR showed exaggerated false positives, with actual FDRs sometimes exceeding 20% against a 5% target. In contrast, the non-parametric Wilcoxon rank-sum test consistently controlled the FDR across all sample sizes, and outperformed other methods in power when compared at equal actual FDRs [24].
The Scientist's Toolkit: Essential Reagents for Benchmarking
Table 3: Key Computational Tools and Resources for DE Analysis Benchmarking
| Tool / Resource | Function in Benchmarking | Relevant Context | |
|---|---|---|---|
| splatter R Package | Simulates realistic bulk and single-cell RNA-seq count data based on a negative binomial model; provides known ground truth for benchmarking. | Used in model-based simulations to evaluate tool performance under controlled conditions. | [39] [58] |
| BenchmarkSingleCell (GitHub) | Provides R scripts for large-scale simulation and evaluation of DE methods for single-cell data, using metrics like sensitivity and FDR. | Repository for standardized, reproducible benchmarking of scRNA-seq DE tools. | [58] |
| ALDEx2 | A log-ratio transformation-based tool for differential abundance analysis; offers an alternative to count-based normalization. | Benchmarked against conventional tools (DESeq2, edgeR) for RNA-seq data, noted for high precision. | [59] |
| Sequin Spike-in Controls | Synthetic RNA spikes added to samples before sequencing; provide an internal, absolute standard for evaluating accuracy. | Used in long-read RNA-seq benchmarking to establish ground truth for isoform detection and DE. | [6] |
| Permutation Analysis | A statistical technique where group labels are randomly shuffled to create negative-control datasets for empirical FDR estimation. | Critical for evaluating false positive rates in real datasets where true negatives are unknown. | [24] |
The consensus from large-scale benchmarking is that no single tool is universally superior. The choice depends critically on the experimental context:
- For standard bulk RNA-seq with controlled conditions and small to moderate sample sizes, DESeq2, edgeR, and limma-voom are all excellent and well-validated choices, showing strong agreement [3].
- For single-cell RNA-seq involving multiple batches or individuals, leverage covariate modeling within the DE model (e.g., including "batch" as a factor) rather than pre-correcting the data. Methods like
limma-trendand covariate-modeledDESeq2orMASTare recommended [39]. - For population-level studies with large sample sizes (n > 100), the parametric assumptions of DESeq2, edgeR, and limma-voom can be violated, leading to inflated false discovery rates. In these cases, a non-parametric method like the Wilcoxon rank-sum test is recommended for robust FDR control [24].
Researchers are encouraged to consult specific benchmarking publications for detailed parameter settings and to consider validating critical findings using multiple complementary methods.
Conclusion
DESeq2, edgeR, and limma are all powerful tools for differential expression analysis, each with distinct strengths. DESeq2 and edgeR, sharing a negative binomial foundation, are robust for count data with biological variability, while limma excels in complex designs and is computationally efficient. The choice is not one-size-fits-all; it depends on experimental design, sample size, and data structure. For well-controlled experiments with sufficient replicates, all three can yield concordant results. Future directions include better integration of hierarchical modeling for stable gene ranking, refined methods for single-cell and observational data, and the development of species-specific optimized pipelines. Ultimately, a rigorous, method-aware approach to DE analysis, combined with biological validation, remains key to unlocking meaningful discoveries from transcriptomic data.
References
- 1. Negative binomial distribution [https://en.wikipedia.org/wiki/Negative_binomial_distribution]
- 2. Getting Started with Negative Binomial Regression Modeling [http://library.virginia.edu/data/articles/getting-started-with-negative-binomial-regression-modeling]
- 3. How to Analyze RNAseq Data for Absolute Beginners Part 20 [https://ngs101.com/how-to-analyze-rnaseq-data-for-absolute-beginners-part-20-comparing-limma-deseq2-and-edger-in-differential-expression-analysis/]
- 4. Negative Binomial Regression | R Data Analysis Examples [https://stats.oarc.ucla.edu/r/dae/negative-binomial-regression/]
- 5. Robustness of differential gene expression analysis ... [https://www.sciencedirect.com/science/article/pii/S200103702100221X]
- 6. Benchmarking long-read RNA-sequencing analysis tools ... [https://www.rna-seqblog.com/benchmarking-long-read-rna-sequencing-analysis-tools-using-in-silico-mixtures/]
- 7. A comprehensive workflow for optimizing RNA-seq data analysis [https://bmcgenomics.biomedcentral.com/articles/10.1186/s12864-024-10414-y]
- 8. Understanding sequencing data as compositions [https://pmc.ncbi.nlm.nih.gov/articles/PMC6084572/]
- 9. Navigating RNA-Seq Data: A Comprehensive Guide... [https://pluto.bio/resources/Learning%20Series/navigating-rna-seq-data-a-guide-to-normalization-methods]
- 10. How do I explain the difference between edgeR, LIMMA ... [https://www.biostars.org/p/284775/]
- 11. voom: precision weights unlock linear model analysis tools for ... [https://genomebiology.biomedcentral.com/articles/10.1186/gb-2014-15-2-r29]
- 12. Three Differential Expression Analysis Methods for RNA ... [https://pubmed.ncbi.nlm.nih.gov/34605806/]
- 13. DEseq/edgeR/limma comparison - STARTbio [https://artbio.github.io/startbio/bulk_RNAseq-IOC/29_0_comparisons/]
- 14. A new shrinkage estimator for dispersion improves ... [https://pmc.ncbi.nlm.nih.gov/articles/PMC3590927/]
- 15. Dispersion Estimation and Its Effect on Test Performance in ... [https://journals.plos.org/plosone/article?id=10.1371/journal.pone.0081415]
- 16. Shrinkage and Empirical Bayes to improve inference [https://kiwidamien.github.io/shrinkage-and-empirical-bayes-to-improve-inference.html]
- 17. A real-world multi-center RNA-seq benchmarking study ... [https://www.nature.com/articles/s41467-024-50420-y]
- 18. A robust pipeline for RNA-seq data and a benchmark ... [https://www.sciencedirect.com/science/article/pii/S2950433325002034]
- 19. limma powers differential expression analyses for RNA ... [https://pmc.ncbi.nlm.nih.gov/articles/PMC4402510/]
- 20. Moderated estimation of fold change and dispersion for RNA ... [https://genomebiology.biomedcentral.com/articles/10.1186/s13059-014-0550-8]
- 21. Comparison of software packages for detecting differential ... [https://pmc.ncbi.nlm.nih.gov/articles/PMC4293378/]
- 22. An evaluation of RNA-seq differential analysis methods [https://journals.plos.org/plosone/article?id=10.1371/journal.pone.0264246]
- 23. Limma can make differential expression with just one case ... [https://www.biostars.org/p/361582/]
- 24. Exaggerated false positives by popular differential expression ... [https://genomebiology.biomedcentral.com/articles/10.1186/s13059-022-02648-4]
- 25. Power analysis and sample size estimation for RNA-Seq ... [https://pmc.ncbi.nlm.nih.gov/articles/PMC4201821/]
- 26. RNA-Seq data processing and gene expression analysis [https://h3abionet.github.io/H3ABionet-SOPs/RNA-Seq]
- 27. 10 Best Practices for Effective RNA-Seq Data Analysis - Focal [https://www.getfocal.co/post/10-best-practices-for-effective-rna-seq-data-analysis]
- 28. Systematic comparison and assessment of RNA-seq ... [https://www.nature.com/articles/s41598-020-76881-x]
- 29. rnaseq: Output [https://nf-co.re/rnaseq/3.11.2/docs/output]
- 30. How to Install a Package in R (with 8 Code Examples) [https://www.dataquest.io/blog/install-package-r/]
- 31. Efficient way to install and load R packages [https://www.geeksforgeeks.org/r-language/efficient-way-to-install-and-load-r-packages/]
- 32. Install and Load Packages | Introduction to R [https://bookdown.org/nana/intror/install-and-load-packages.html]
- 33. Assessment of Regression Models Performance - easystats [https://easystats.github.io/performance/]
- 34. compare_performance function [https://www.rdocumentation.org/packages/performance/versions/0.12.4/topics/compare_performance]
- 35. Differential gene expression analysis pipelines and ... [https://pmc.ncbi.nlm.nih.gov/articles/PMC10951429/]
- 36. A comparison of methods for multiple degree of freedom ... [https://pmc.ncbi.nlm.nih.gov/articles/PMC9148455/]
- 37. DElite: a tool for integrated differential expression analysis [https://www.frontiersin.org/journals/genetics/articles/10.3389/fgene.2024.1440994/full]
- 38. Benchmarking RNA-seq differential expression analysis ... [https://pmc.ncbi.nlm.nih.gov/articles/PMC7192453/]
- 39. Benchmarking integration of single-cell differential ... [https://www.nature.com/articles/s41467-023-37126-3]
- 40. Benchmarking association analyses of continuous exposures ... [https://pmc.ncbi.nlm.nih.gov/articles/PMC8574950/]
- 41. Differential Gene Expression Analysis in scRNA-seq Data ... [https://www.10xgenomics.com/analysis-guides/differential-gene-expression-analysis-in-scrna-seq-data-between-conditions-with-biological-replicates]
- 42. How to Analyze RNAseq Data for Absolute Beginners 21 [https://ngs101.com/how-to-analyze-rnaseq-data-for-absolute-beginners-21-a-comprehensive-guide-to-batch-effects-covariates-adjustment/]
- 43. Assessing and mitigating batch effects in large-scale omics ... [https://genomebiology.biomedcentral.com/articles/10.1186/s13059-024-03401-9]
- 44. Thinking points for effective batch correction on biomedical ... [https://pmc.ncbi.nlm.nih.gov/articles/PMC11471903/]
- 45. Batch correction methods used in single-cell RNA sequencing ... [https://pmc.ncbi.nlm.nih.gov/articles/PMC12315870/]
- 46. A comparison of methods accounting for batch effects in ... [https://www.sciencedirect.com/science/article/pii/S200103701930409X]
- 47. Differential expression analysis with inmoose, the integrated ... [https://bmcbioinformatics.biomedcentral.com/articles/10.1186/s12859-025-06180-7]
- 48. What are Batch Effects in Omics Data and How to Correct ... [https://bigomics.ch/blog/the-tricky-problem-of-batch-effects-in-biological-data/]
- 49. Optimization of an RNA-Seq Differential Gene Expression ... [https://pmc.ncbi.nlm.nih.gov/articles/PMC5817962/]
- 50. RNA-seq differential expression analysis with DEseq2, edgeR ... [https://montilab.github.io/BS831/articles/docs/DiffanalysisRNAseqComparison.html]
- 51. DESeq2 or edgeR - Mike Love's blog - WordPress.com [https://mikelove.wordpress.com/2016/09/28/deseq2-or-edger/]
- 52. Benchmarking RNA-seq differential expression analysis ... [https://journals.plos.org/plosone/article?id=10.1371/journal.pone.0232271]
- 53. Systematic benchmarking of statistical methods to assess ... [https://pmc.ncbi.nlm.nih.gov/articles/PMC9851295/]
- 54. False signals induced by single-cell imputation [https://f1000research.com/articles/7-1740]
- 55. Efficient differential expression analysis of large-scale single ... [https://pmc.ncbi.nlm.nih.gov/articles/PMC10055252/]
- 56. Winsorization greatly reduces false positives by popular ... [https://pmc.ncbi.nlm.nih.gov/articles/PMC11523781/]
- 57. A comparison of methods for differential expression analysis ... [https://bmcbioinformatics.biomedcentral.com/articles/10.1186/1471-2105-14-91]
- 58. Large-scale Benchmarking of Single-cell Differential ... [https://github.com/himelmallick/BenchmarkSingleCell]
- 59. Benchmarking differential expression analysis tools for RNA ... [https://bmcbioinformatics.biomedcentral.com/articles/10.1186/s12859-018-2261-8]