Benchmarking RNA-Seq Analysis Workflows: A qPCR Validation Framework for Reliable Gene Expression Data
This article provides a comprehensive guide for researchers and drug development professionals on validating RNA-Seq analysis workflows using qPCR.
Benchmarking RNA-Seq Analysis Workflows: A qPCR Validation Framework for Reliable Gene Expression Data
Abstract
This article provides a comprehensive guide for researchers and drug development professionals on validating RNA-Seq analysis workflows using qPCR. It explores the foundational need for benchmarking in transcriptomics, methodically compares the performance of popular alignment and quantification tools, and outlines optimization strategies to address common pitfalls. By synthesizing evidence from large-scale multi-center studies and presenting a framework for comparative analysis, the content equips scientists with the knowledge to achieve accurate and reproducible gene expression data, a critical foundation for robust biomedical and clinical research.
The Critical Need for Benchmarking RNA-Seq Against qPCR Gold Standards
RNA-Seq as the Modern Transcriptome Standard and its Inherent Complexities
RNA sequencing has unequivocally established itself as the modern standard for transcriptome analysis, revolutionizing our capacity to explore gene expression landscapes in health and disease. This technology provides unprecedented detail about the RNA repertoire within biological samples, enabling comprehensive characterization of transcriptional activity across different conditions, time points, and cellular populations. However, beneath its transformative potential lies a complex framework of methodological choices, analytical pipelines, and technical variations that significantly impact data reliability and biological interpretation.
The complexities inherent to RNA-seq are particularly relevant when contextualized within benchmarking frameworks against quantitative PCR (qPCR), long considered the gold standard for targeted gene expression validation. While RNA-seq offers an unbiased, genome-wide perspective, its performance must be rigorously assessed against established metrics to ensure analytical validity, especially as it transitions from research tool to clinical application. This guide objectively compares RNA-seq methodologies and their performance characteristics, drawing upon recent large-scale benchmarking studies to provide evidence-based recommendations for researchers, scientists, and drug development professionals navigating this powerful yet complex technological landscape.
RNA-Seq Technology Landscape: Methodological Comparisons
The RNA-seq ecosystem has diversified into multiple specialized approaches, each with distinct strengths, limitations, and optimal applications. Understanding these methodological divisions is essential for appropriate experimental design and data interpretation.
Short-Read vs. Long-Read RNA Sequencing
Short-read RNA-seq (primarily Illumina-based) remains the workhorse for transcriptome profiling, providing high accuracy and depth for gene-level expression quantification. However, long-read RNA-seq technologies (Nanopore and PacBio) are emerging as powerful complementary approaches that enable full-length transcript sequencing, overcoming short-read limitations in isoform resolution [1].
A comprehensive benchmark of Nanopore long-read RNA sequencing demonstrated its robust performance in identifying major isoforms, detecting novel transcripts, characterizing fusion events, and profiling RNA modifications [2]. The Singapore Nanopore Expression (SG-NEx) project systematically compared five RNA-seq protocols across seven human cell lines, reporting that long-read protocols more reliably capture complete transcript structures, with PCR-amplified cDNA sequencing requiring the least input RNA and direct RNA sequencing providing information about native RNA modifications [2].
Bulk vs. Single-Cell RNA Sequencing
Bulk RNA-seq profiles the averaged transcriptome across cell populations, while single-cell RNA-seq (scRNA-seq) resolves cellular heterogeneity by capturing transcriptomes of individual cells. Within scRNA-seq, two primary approaches exist:
- Whole Transcriptome Sequencing: An unbiased, discovery-oriented method that aims to capture expression of all genes, ideal for de novo cell type identification and atlas construction [3].
- Targeted Gene Expression Profiling: Focuses sequencing resources on a predefined gene set, achieving superior sensitivity and quantitative accuracy for specific pathways or signatures, though it is blind to genes outside the panel [3].
Targeted vs. Whole Transcriptome Approaches
Targeted RNA-seq enriches for specific genes or transcripts of interest, enabling deeper coverage and enhanced detection of low-abundance targets. A recent evaluation of targeted RNA-seq for detecting expressed mutations in precision oncology demonstrated its ability to uniquely identify clinically actionable variants missed by DNA sequencing alone, with carefully controlled false positive rates ensuring high accuracy [4]. This approach is particularly valuable in clinical contexts where specific biomarker detection is paramount.
Table 1: Comparative Analysis of Major RNA-Seq Technologies
| Technology | Optimal Applications | Key Strengths | Inherent Limitations | qPCR Concordance |
|---|---|---|---|---|
| Short-Read RNA-Seq | Gene-level differential expression, splicing analysis, large cohort studies | High accuracy, cost-effective, well-established tools, high throughput | Limited isoform resolution, inference required for transcript assembly | High for moderate to highly expressed genes |
| Long-Read RNA-Seq | Full-length isoform detection, novel transcript discovery, fusion characterization, RNA modifications | End-to-end transcript sequencing, eliminates assembly challenges, direct RNA modification detection | Higher error rates, lower throughput, higher input requirements, developing analytical tools | Requires validation for isoform-specific quantification |
| Single-Cell Whole Transcriptome | Cell atlas construction, novel cell type discovery, developmental trajectories, heterogeneous tissue mapping | Unbiased cellular census, detects novel cell states and populations | High cost per cell, gene dropout effect (false negatives), computational complexity, data sparsity | Lower concordance for low-abundance transcripts due to dropout |
| Single-Cell Targeted | Validation studies, pathway-focused interrogation, clinical biomarker assessment, large-scale screens | Superior sensitivity for panel genes, reduced dropout, cost-effective at scale, streamlined analysis | Limited to predefined genes, discovery potential constrained | High concordance for targeted genes due to increased read depth |
| Targeted RNA-Seq (Bulk) | Expressed mutation detection, clinical diagnostics, low-abundance transcript quantification, fusion detection | Enhanced detection of rare variants, high coverage of targets, cost-effective for focused questions | Restricted to panel content, design challenges for novel targets | Excellent concordance when targets are expressed |
The translation of RNA-seq into clinical diagnostics requires ensuring reliability and cross-laboratory consistency, particularly for detecting subtle differential expression between disease subtypes or stages. A landmark multi-center RNA-seq benchmarking study, part of the Quartet project, systematically evaluated performance across 45 laboratories using reference samples with defined 'ground truth' [5].
Major Findings from Large-Scale Benchmarking
The study revealed significant inter-laboratory variations in detecting subtle differential expression, with experimental factors including mRNA enrichment methods and library strandedness emerging as primary sources of variation [5]. Bioinformatics pipelines also substantially influenced results, with each analytical step contributing to variability in gene expression measurements. The performance gap was particularly pronounced when analyzing samples with small biological differences (Quartet samples) compared to those with large differences (MAQC samples), highlighting the heightened challenge of detecting clinically relevant subtle expression changes [5].
The benchmark underscored the profound influence of experimental execution and provided best practice recommendations for experimental designs, strategies for filtering low-expression genes, and optimal gene annotation and analysis pipelines [5]. These findings emphasize that rigorous standardization is indispensable for reliable RNA-seq implementation, especially in clinical contexts.
Experimental Factors Influencing RNA-Seq Performance
Table 2: Key Experimental Factors Contributing to RNA-Seq Variability
| Experimental Process | Impact on Data Quality | Recommendations from Benchmarking Studies |
|---|---|---|
| RNA Extraction & Quality | Integrity, purity, and fragmentation affecting library complexity and bias | Implement rigorous QC (RIN > 8), standardize extraction protocols across samples |
| mRNA Enrichment | Efficiency influences 3' bias, transcript coverage, and detection dynamic range | Evaluate poly-A selection vs. rRNA depletion based on application; maintain consistency |
| Library Preparation | Strandedness, adapter design, and amplification introduce significant technical variation | Use stranded protocols; minimize PCR cycles; employ unique molecular identifiers (UMIs) |
| Sequencing Depth | Directly affects gene detection sensitivity and quantitative accuracy | 20-30M reads per sample for standard differential expression; increase for isoform detection |
| Spike-in Controls | Enable technical variation monitoring and cross-sample normalization | Use ERCC or sequin spike-ins for quality control and normalization reference [6] [2] |
Best Practices for RNA-Seq Workflow Optimization
Analytical Pipeline Considerations
A comprehensive workflow optimization study systematically evaluated 288 analysis pipelines using different tool combinations across multiple fungal, plant, and animal datasets [7]. The results demonstrated that different analytical tools show significant performance variations when applied to different species, challenging the common practice of applying similar parameters across diverse organisms without customization [7].
For differential expression analysis, benchmarking evidence indicates that performance depends critically on biological effect size and replicate number. When biological effect size is strong, methods like NOISeq or GFOLD effectively detect differentially expressed genes even in unreplicated experiments. However, with mild effect sizes (more representative of clinical scenarios), triplicate replicates are essential, and methods with high positive predictive value (PPV) such as NOISeq or GFOLD are recommended [8]. At larger replicate sizes (n=6), DESeq2 and edgeR show superior PPV and sensitivity trade-offs for systems-level analysis [8].
Computational Considerations for Large-Scale Data
As dataset sizes grow, computational efficiency becomes increasingly important. Benchmarking of large-scale single-cell RNA-seq analysis frameworks revealed that scalability depends critically on both algorithmic and infrastructural factors [9]. GPU-based computation using rapids-singlecell provided a 15× speed-up over the best CPU methods, with moderate memory usage [9]. For principal component analysis—a critical step in many workflows—ARPACK and IRLBA algorithms were most efficient for sparse matrices, while randomized SVD performed best for HDF5-backed data [9].
Table 3: Key Research Reagent Solutions for RNA-Seq Benchmarking
| Reagent/Resource | Function | Application Context |
|---|---|---|
| ERCC Spike-in Controls | Synthetic RNA transcripts at known concentrations for quality control and normalization | Evaluates technical performance, enables cross-platform normalization [5] |
| Sequins Spike-ins | Synthetic, spliced RNA spike-in controls with sequence similarity to human transcriptome | Benchmarking isoform detection and quantification accuracy in complex backgrounds [6] |
| Quartet Reference Materials | RNA from immortalized B-lymphoblastoid cell lines with well-characterized, subtle expression differences | Assesses performance in detecting clinically relevant subtle differential expression [5] |
| MAQC Reference Samples | RNA from cancer cell lines (MAQC A) and brain tissues (MAQC B) with large expression differences | Benchmarking for experiments with large anticipated effect sizes [5] |
| GIAB Reference Samples | Well-characterized reference genomes and transcriptomes (e.g., GM24385) | Analytical validation and proficiency testing for clinical RNA-seq [10] |
| Stranded mRNA Prep Kits | Library preparation with strand orientation preservation | Accurate transcript assignment, anti-sense transcription detection |
| Ribo-depletion Kits | Removal of ribosomal RNA to enrich for mRNA and non-coding RNA | Enhances sequencing efficiency for non-polyA transcripts or degraded samples |
| Single-Cell Isolation Kits | Partitioning individual cells for scRNA-seq library preparation | Enables cellular heterogeneity resolution, available for whole transcriptome or targeted |
Experimental Protocols for Benchmarking Studies
Protocol 1: Clinical RNA-Seq Validation for Mendelian Disorders
A comprehensive clinical validation study established a diagnostic RNA-seq framework using 130 samples (90 negative, 40 positive) with known molecular diagnoses [10]. The protocol employs:
- Sample Processing: Fibroblasts cultured in high-glucose DMEM with supplements; blood samples stored in PAXgene tubes at -80°C before RNA extraction [10].
- RNA Extraction: Using RNeasy mini kit (Qiagen) with on-column genomic DNA removal, followed by quality assessment with Qubit RNA HS assay kit [10].
- Library Preparation: Illumina Stranded mRNA prep kit for fibroblasts and lymphoblastoid cells; Illumina Stranded Total RNA Prep with Ribo-Zero Plus for whole blood to remove human globin RNA and rRNA [10].
- Sequencing: Illumina NovaSeqX platform, paired-end 150 bp reads, target depth of 150 million reads per sample [10].
- Data Processing: Alignment to GRCh38 with STAR, duplicate marking with Picard, quantification with RNA-SeQC and RSEM, annotation with GENCODE v39 [10].
- Validation Framework: Uses a 3-1-1 reproducibility design (triplicate preparations intra-run, two inter-runs) on reference materials (GM24385, K562) [10].
Protocol 2: In Silico Mixtures for Long-Read Tool Benchmarking
To address the challenge of benchmarking without established ground truth, researchers developed an innovative approach using in silico mixtures:
- Cell Lines and Controls: Two human lung adenocarcinoma cell lines (H1975 and HCC827) profiled in triplicate with synthetic, spliced spike-in RNAs ("sequins") [6].
- Sequencing: Deep sequencing on both Illumina short-read and Oxford Nanopore Technologies long-read platforms [6].
- In Silico Mixtures: Computational creation of mixture samples from pure RNA samples to enable performance assessment without true positives/negatives [6].
- Benchmarking Workflow: Systematic comparison of 6 isoform detection tools, 5 differential transcript expression tools, and 5 differential transcript usage tools [6].
- Key Findings: StringTie2 and bambu outperformed for isoform detection; DESeq2, edgeR and limma-voom excelled for differential transcript expression; no clear front-runner for differential transcript usage analysis [6].
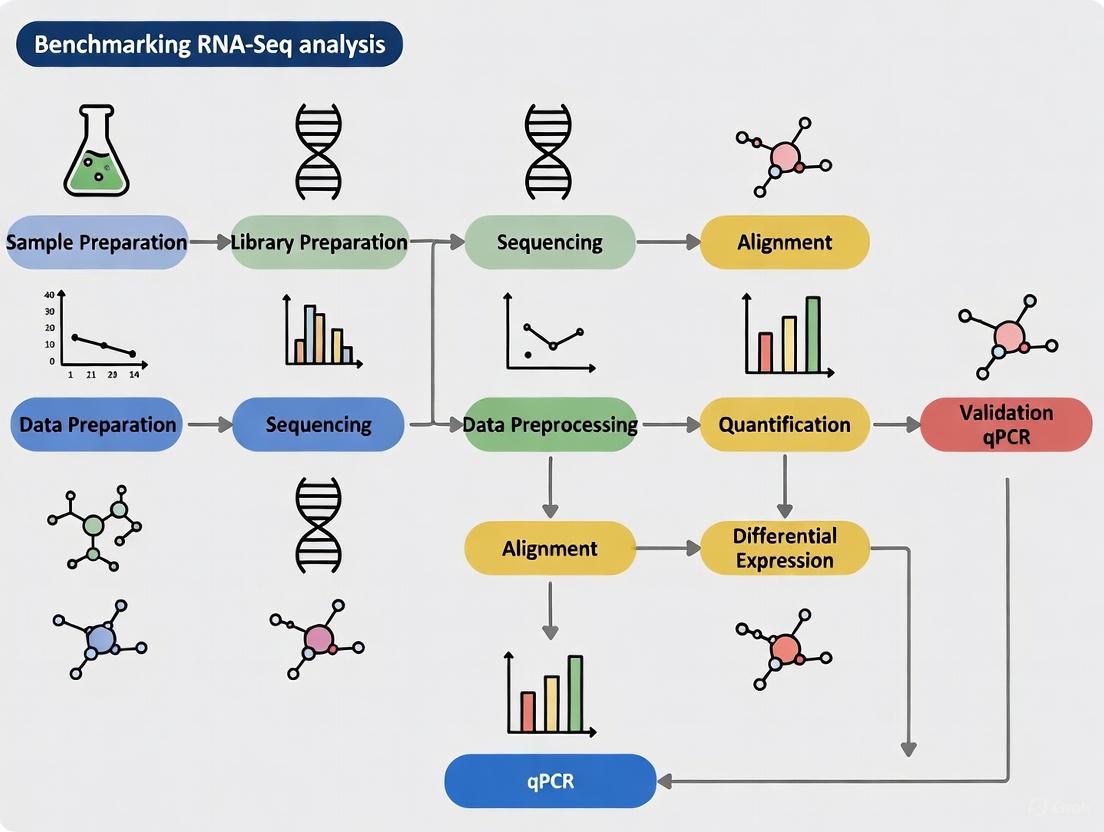
Visualization of RNA-Seq Benchmarking Workflow
The following diagram illustrates the comprehensive framework for benchmarking RNA-seq analysis workflows, integrating experimental and computational components:
Diagram 1: Comprehensive RNA-Seq Benchmarking Framework. This workflow integrates reference materials with known ground truth, standardized experimental protocols, diverse sequencing platforms, and multiple bioinformatics pipelines to generate performance metrics that inform best practices.
RNA-seq maintains its position as the modern standard for transcriptome analysis, but its inherent complexities demand rigorous benchmarking and standardization, particularly when contextualized against qPCR validation. The evidence from large-scale multi-center studies indicates that both experimental and computational factors introduce substantial variability, especially when detecting subtle differential expression with clinical relevance.
The trajectory of RNA-seq development points toward increased specialization—with long-read technologies solving isoform resolution challenges, targeted approaches enhancing clinical applicability, and single-cell methods resolving cellular heterogeneity. Successful navigation of this landscape requires careful matching of technology to biological question, adherence to benchmarking best practices, and implementation of standardized workflows validated against appropriate reference materials. As the field advances, the integration of DNA and RNA sequencing approaches promises to further strengthen molecular diagnostics, ultimately enhancing precision medicine and improving patient outcomes through more reliable and comprehensive genetic analysis.
The Role of qPCR as a Validation Benchmark in Transcriptomics
In the field of transcriptomics, RNA sequencing (RNA-seq) has become the predominant method for whole-transcriptome gene expression quantification [11]. However, this technology relies on complex computational workflows for data processing, creating a critical need for robust validation using an independent, highly accurate method. Among available technologies, quantitative polymerase chain reaction (qPCR) has emerged as the established benchmark for validating RNA-seq findings due to its exceptional sensitivity, specificity, and reproducibility [12] [13]. This review examines the experimental evidence establishing qPCR's role as a validation tool, provides direct performance comparisons between major RNA-seq workflows, and offers best practices for employing qPCR in verification studies.
qPCR Fundamentals and Methodological Advantages
Technical Principles of qPCR
qPCR, also known as real-time PCR, enables accurate quantification of nucleic acid sequences by monitoring PCR amplification in real-time using fluorescent detection systems [12]. When used for gene expression analysis (RT-qPCR), RNA is first reverse transcribed to complementary DNA (cDNA), which is then amplified and quantified. Unlike traditional PCR that provides end-point detection, qPCR focuses on the exponential amplification phase where the quantity of target DNA doubles with each cycle, providing the most precise and accurate data for quantification [12]. The critical measurement in qPCR is the threshold cycle (CT), which represents the PCR cycle at which the sample's fluorescent signal exceeds background levels, correlating inversely with the starting quantity of the target nucleic acid [12].
Advantages Over Other Technologies
qPCR offers several distinct advantages that make it ideal for validation studies:
- Exceptional sensitivity: Capable of detecting down to a single copy of a DNA sequence [12]
- Wide dynamic range: Can quantify targets across a concentration range of 6-8 orders of magnitude [12]
- High precision: Can detect small fold-changes in gene expression that other technologies might miss [12]
- Minimal sample requirement: Can generate reliable data from limited starting material [14]
These technical advantages position qPCR as the preferred method for confirming gene expression patterns identified through high-throughput screening technologies like RNA-seq.
Experimental Benchmarking: qPCR Versus RNA-Seq Workflows
Large-Scale Comparative Studies
A comprehensive benchmarking study compared five popular RNA-seq processing workflows against whole-transcriptome qPCR data for 18,080 protein-coding genes using the well-established MAQCA and MAQCB reference samples [11] [15]. The research evaluated both alignment-based workflows (Tophat-HTSeq, Tophat-Cufflinks, STAR-HTSeq) and pseudoalignment methods (Kallisto, Salmon), with gene expression measurements compared to wet-lab validated qPCR assays.
The results demonstrated high correlation between all RNA-seq methods and qPCR data, with Pearson correlation coefficients ranging from R² = 0.798 (Tophat-Cufflinks) to R² = 0.845 (Salmon) [11]. When comparing gene expression fold changes between MAQCA and MAQCB samples, approximately 85% of genes showed consistent results between RNA-seq and qPCR data across all workflows [11] [15].
Table 1: Performance Comparison of RNA-Seq Workflows Against qPCR Benchmark
| RNA-Seq Workflow | Expression Correlation (R²) | Fold Change Correlation (R²) | Non-Concordant Genes |
|---|---|---|---|
| Salmon | 0.845 | 0.929 | 19.4% |
| Kallisto | 0.839 | 0.930 | 18.2% |
| Tophat-HTSeq | 0.827 | 0.934 | 15.1% |
| STAR-HTSeq | 0.821 | 0.933 | 15.3% |
| Tophat-Cufflinks | 0.798 | 0.927 | 17.8% |
Another independent study using the MAQC dataset found that RNA-seq relative expression estimates correlated with RT-qPCR measurements in the range of 0.85 to 0.89, with HTSeq exhibiting the highest correlation [16].
Method-Specific Discrepancies and Consistent Patterns
Each RNA-seq method revealed a small but specific set of genes with inconsistent expression measurements compared to qPCR data [11] [15]. A significant proportion of these method-specific inconsistent genes were reproducibly identified in independent datasets, suggesting systematic rather than random errors. These problematic genes were typically characterized by shorter length, fewer exons, and lower expression levels compared to genes with consistent expression measurements [11].
Experimental Design and Methodological Protocols
Sample Preparation and RNA Isolation
Proper sample handling is critical for generating reliable qPCR data. In benchmarking studies, RNA is typically extracted using commercially available kits such as the mirVana RNA Isolation Kit or TIANGEN RNAprep Plant Kit [14] [17]. For tissue samples, preservation in RNAlater followed by storage at -80°C helps maintain RNA integrity [14]. RNA quality assessment should be performed using methods such as BioAnalyzer 2100 to ensure RNA Integrity Number (RIN) ≥ 6 or distinct ribosomal peaks [14].
Reverse Transcription and qPCR Setup
For reverse transcription, either oligo d(T)₁₆ or random primers can be used, with the high capacity cDNA reverse transcription kit being a common choice [13]. The qPCR reactions typically use SYBR Green or TaqMan chemistry, with reactions run in technical replicates on systems such as the Applied Biosystems StepOnePlus or QuantStudio platforms [18] [17].
A standard 20μL reaction might contain:
- 10μL of 2× SYBR Green PreMix
- 0.6μL of each primer (10 nM concentration)
- 2μL of diluted cDNA template
- 6.8μL of RNase-free water [17]
The thermal cycling conditions typically include an initial denaturation at 95°C for 15 minutes, followed by 40 cycles of denaturation at 95°C for 15 seconds and annealing/extension at 60°C for 1 minute [17].
Essential Experimental Controls
Appropriate controls are vital for validation experiments:
- No-template controls: To detect contamination
- No-reverse transcription controls: To assess genomic DNA contamination
- Reference genes: For normalization (see Section 5.1)
- Melting curve analysis: To verify amplification specificity [13] [17]
Critical Factors for Reliable qPCR Validation
Reference Gene Selection and Normalization
The choice of appropriate reference genes (RGs) is arguably the most critical factor in obtaining accurate qPCR results. Reference genes should demonstrate stable expression across all experimental conditions, but numerous studies have shown that commonly used "housekeeping" genes can vary significantly under different physiological or pathological conditions [19] [13] [17].
Table 2: Stable Reference Genes for Different Experimental Conditions
| Experimental Condition | Most Stable Reference Genes | Validation Method |
|---|---|---|
| Canine GI tissues | RPS5, RPL8, HMBS | GeNorm, NormFinder |
| Human glioblastoma | RPL13A, TBP | ΔCt method |
| Lotus plant tissues | TBP, UBQ, EF-1α | GeNorm, NormFinder |
| General recommendation | Global Mean (GM) of ≥55 genes | CV analysis |
A 2025 study on canine gastrointestinal tissues demonstrated that the global mean (GM) method, which uses the average expression of all tested genes, outperformed traditional reference gene normalization when profiling larger gene sets (>55 genes) [19]. For smaller gene panels, using a combination of 2-3 validated reference genes such as RPS5, RPL8, and HMBS provided the most stable normalization [19].
Specialized algorithms such as GeNorm and NormFinder are recommended for assessing reference gene stability [19] [13] [17]. These tools rank candidate reference genes based on their expression stability across samples, enabling evidence-based selection of the most appropriate normalizers for specific experimental conditions.
Data Analysis and Interpretation
For relative quantification, the comparative CT (ΔΔCT) method is widely used [12]. This approach normalizes target gene CT values to reference genes (ΔCT) and then compares these values between experimental and control groups (ΔΔCT). The final fold-change is calculated as 2^(-ΔΔCT).
When comparing RNA-seq and qPCR data, researchers should focus on relative expression changes (fold changes between conditions) rather than absolute expression values, as this is the most biologically relevant metric and shows better concordance between technologies [11].
Advanced Applications and Recent Innovations
qPCR in Diagnostic Assay Development
Recent advances have demonstrated qPCR's potential in clinical applications. A 2025 study developed a qPCR-based algorithm using platelet-derived RNA for ovarian cancer detection, achieving 94.1% sensitivity and 94.4% specificity [14]. This approach utilized intron-spanning read counts rather than conventional gene expression levels, enhancing detection of cancer-specific splicing events while reducing interference from contaminating genomic DNA.
Comparison of Instrument Platforms
Several qPCR systems are available with varying capabilities:
Table 3: Comparison of qPCR Instrument Platforms
| Instrument | Best For | Key Features | Throughput |
|---|---|---|---|
| Applied Biosystems QuantStudio 3 | Routine qPCR | User-friendly interface, cloud connectivity | 96-384 wells |
| Bio-Rad CFX Opus96 | High-performance qPCR | Advanced data analysis, BR.io cloud integration | 96 wells |
| Bio-Rad QX200 AutoDG | Digital PCR applications | Absolute quantification, rare mutation detection | Automated droplet generation |
| Applied Biosystems StepOnePlus | Budget-conscious labs | Compact footprint, proven reliability | 96 wells |
The selection of an appropriate platform depends on application requirements, throughput needs, and budget constraints [18].
Experimental Workflow and Visualization
The following diagram illustrates the typical workflow for benchmarking RNA-seq data using qPCR validation:
Diagram 1: RNA-seq Validation Workflow with qPCR Benchmarking
Essential Research Reagent Solutions
Table 4: Key Reagents and Materials for qPCR Validation Experiments
| Reagent/Material | Function | Example Products |
|---|---|---|
| RNA Isolation Kits | High-quality RNA extraction | mirVana RNA Isolation Kit, TIANGEN RNAprep Plant Kit |
| Reverse Transcription Kits | cDNA synthesis from RNA | High Capacity cDNA Reverse Transcription Kit, FastQuant RT Kit |
| qPCR Master Mixes | Amplification and detection | SYBR Green Master Mix, TaqMan PreMix |
| Reference Gene Assays | Normalization controls | Pre-validated primer/probe sets |
| qPCR Instruments | Amplification and detection | Applied Biosystems QuantStudio, Bio-Rad CFX Opus96 |
| RNA Quality Assessment | RNA integrity verification | BioAnalyzer 2100, TapeStation 4200 |
The evidence consistently demonstrates that qPCR serves as an essential validation benchmark for RNA-seq workflows, with correlation coefficients typically ranging from 0.80 to 0.93 depending on the specific workflow and analysis method [11] [16]. Based on current research, the following best practices are recommended:
- Validate reference genes for each specific experimental condition using algorithms like GeNorm or NormFinder [19] [13] [17]
- Focus on fold-change comparisons rather than absolute expression values when correlating RNA-seq and qPCR data [11]
- Exercise particular caution with genes that are shorter, have fewer exons, or show low expression levels, as these are more prone to quantification discrepancies [11] [15]
- Consider the global mean method for normalization when profiling larger gene sets (>55 genes) [19]
- Utilize appropriate instrumentation matched to throughput needs and application requirements [18]
When properly implemented, qPCR validation provides an essential quality control measure that strengthens the reliability of transcriptomic studies and enables more confident biological conclusions.
The translation of RNA sequencing (RNA-seq) from a research tool to a clinically viable technology hinges on the rigorous benchmarking of its performance against established quantitative methods. While RNA-seq provides an unbiased, genome-wide view of the transcriptome, quantitative PCR (qPCR) remains the gold standard for targeted gene expression quantification due to its sensitivity, dynamic range, and established reproducibility [11]. Consequently, a comprehensive comparison of these technologies requires well-defined metrics that assess both the consistency of absolute expression measurements and the accuracy of detecting expression changes between conditions. This guide objectively compares RNA-seq and qPCR performance using two cornerstone metrics—expression correlation and differential expression (DE) performance—providing researchers with a framework for evaluating RNA-seq workflow suitability for specific applications. The analysis is contextualized within a broader thesis on benchmarking RNA-seq workflows, leveraging experimental data from controlled studies to inform best practices for researchers, scientists, and drug development professionals.
Core Comparison Metrics
Expression Correlation
Expression correlation measures the concordance between absolute or relative expression levels obtained from RNA-seq and qPCR across a set of genes and samples. It is typically quantified using Pearson's correlation coefficient (R) or Spearman's rank correlation coefficient (rho), which assess linear and monotonic relationships, respectively.
High correlation indicates that RNA-seq can reliably reproduce the expression hierarchies established by qPCR. However, correlation can be influenced by factors including the expression level of genes (with low-abundance transcripts often showing poorer correlation), the specific RNA-seq quantification method used, and the normalization strategies applied to both datasets [11] [20].
Differential Expression (DE) Performance
Differential expression performance evaluates how well RNA-seq identifies genes with statistically significant expression changes between conditions (e.g., diseased vs. healthy) compared to qPCR. This metric moves beyond absolute expression to assess the accuracy of detecting relative changes, which is the primary goal of many transcriptomic studies.
Key measures for DE performance include:
- Fold-Change Correlation: The correlation (often Pearson's R) of log2 fold-changes between RNA-seq and qPCR.
- Concordance/Non-Concordance Rates: The percentage of genes classified as differentially expressed by both methods (concordant) or by only one method (non-concordant) [11].
- Sensitivity and Specificity: The ability of RNA-seq to recover DEGs identified by qPCR (sensitivity) and to exclude non-DEGs (specificity), though this requires a defined "truth set" from qPCR.
Quantitative Performance Data
Benchmarking studies consistently reveal high overall concordance between RNA-seq and qPCR, though performance varies by the specific analytical workflow employed.
Table 1: Overall Performance of RNA-seq Workflows Against qPCR Benchmark
| RNA-seq Workflow | Expression Correlation (R² with qPCR) | Fold-Change Correlation (R² with qPCR) | Key Characteristics |
|---|---|---|---|
| Salmon | 0.845 | 0.929 | Pseudoalignment; fast; transcript-level quantification [11] |
| Kallisto | 0.839 | 0.930 | Pseudoalignment; fast; low computing resource demand [11] [20] |
| STAR-HTSeq | 0.821 | 0.933 | Alignment-based; high precision; gene-level quantification [11] |
| TopHat-HTSeq | 0.827 | 0.934 | Alignment-based; established method [11] |
| TopHat-Cufflinks | 0.798 | 0.927 | Alignment-based; FPKM-based quantification [11] |
A landmark study by the Microarray Quality Control (MAQC) Consortium compared five RNA-seq workflows against a whole-transcriptome qPCR dataset of over 18,000 protein-coding genes. The results demonstrated high expression and fold-change correlations for all tested methods, with pseudoalignment tools (Salmon, Kallisto) and alignment-based count tools (HTSeq-based pipelines) performing comparably well [11]. Another independent study further confirmed that results are highly correlated among procedures using HTSeq for quantification [20].
Performance on Challenging Gene Sets
Despite strong overall performance, certain gene characteristics can lead to discrepancies between RNA-seq and qPCR.
Table 2: Performance on Challenging Gene Sets
| Gene Characteristic | Impact on RNA-seq/qPCR Concordance | Recommended Considerations |
|---|---|---|
| Low Expression Level | Higher rates of discordance; genes with inconsistent measurements are often lower expressed [11]. | Apply a minimal expression filter (e.g., 0.1 TPM) to avoid bias from low-abundance genes [11]. |
| Extreme Expression Level | Major differences in expression values often come from genes with very high or very low levels [20]. | Be cautious when interpreting results for extreme outliers; consider validation. |
| Complex Gene Families (e.g., HLA) | Moderate correlation (0.2 ≤ rho ≤ 0.53) due to extreme polymorphism and paralogous sequences [21]. | Use HLA-tailored bioinformatic pipelines that account for known diversity, rather than a standard reference genome [21]. |
| Small Gene Size / Fewer Exons | Genes with inconsistent expression measurements are often smaller and have fewer exons [11]. | Careful validation is warranted for this specific gene set [11]. |
A study focusing on HLA class I genes demonstrated that even with HLA-tailored pipelines, the correlation between qPCR and RNA-seq expression estimates was only low to moderate (0.2 ≤ rho ≤ 0.53). This highlights the significant technical challenges posed by highly polymorphic and complex genomic regions and underscores that performance can be gene-specific [21].
Experimental Protocols for Benchmarking
To ensure a fair and accurate comparison between RNA-seq and qPCR, the following experimental and analytical protocols are recommended based on established benchmarking studies.
Sample Preparation and Platform Comparison
- Reference Samples: Well-characterized RNA reference samples are crucial. The MAQC project established two widely used samples: Universal Human Reference RNA (MAQCA/UHRR) and Human Brain Reference RNA (MAQCB/HBR) [11] [5]. For detecting subtle differential expression, newer materials like the Quartet reference samples are also valuable [5].
- Spike-In Controls: Synthetic RNA controls from the External RNA Control Consortium (ERCC) should be spiked into samples prior to library preparation. These provide a built-in truth set for evaluating quantification accuracy and dynamic range [5].
- Tissue/Cell Selection: Use the same biological source material for both RNA-seq and qPCR assays. If a gene panel is the focus, ensure that the relevant genes are robustly expressed in the chosen tissue. For instance, one study found that over 79% of genes in an intellectual disability and epilepsy panel were expressed in peripheral blood mononuclear cells (PBMCs) [22].
- Replication: Include multiple technical and biological replicates to account for variability and enable robust statistical analysis.
Data Processing and Analysis
- qPCR Data Normalization: Use standard curve methods or the comparative Cq (ΔΔCq) method for qPCR analysis. Normalize Cq values to multiple stable reference genes.
- RNA-seq Alignment & Quantification: As shown in Table 1, multiple workflows perform well. STAR is a widely used aligner, and quantification can be done at the gene level (e.g., with HTSeq) or transcript level (e.g., with Salmon or Kallisto). For standard gene-level DE analysis, STAR-HTSeq and pseudoaligners are excellent choices [11] [20].
- Expression Filtering: Filter out lowly expressed genes prior to comparative analysis. A common threshold is a minimum of 0.1 TPM or 10 raw counts in a sufficient number of samples [11] [23].
- Differential Expression Testing: For count-based data (from HTSeq, Salmon, etc.), use tools like DESeq2 or edgeR. For FPKM-based data (from Cufflinks), Cuffdiff2 can be used [20].
- Defining "Truth" and Calculating Metrics: Use the qPCR measurements as the benchmark. Calculate Pearson correlation of log2(TPM) values from RNA-seq with normalized Cq values from qPCR for expression correlation. For DE, calculate log2 fold-changes for both methods and assess their correlation and concordance based on significance calls.
The Scientist's Toolkit
The following reagents, tools, and resources are essential for conducting robust comparisons of RNA-seq and qPCR performance.
Table 3: Essential Research Reagent Solutions and Tools
| Category | Item | Function in Benchmarking |
|---|---|---|
| Reference Materials | MAQC (UHRR, HBR) RNA [11] [5] | Provides well-characterized, stable RNA samples with known expression profiles for platform calibration. |
| Quartet RNA Reference Materials [5] | Enables assessment of performance in detecting subtle differential expression between biologically similar samples. | |
| Spike-In Controls | ERCC RNA Spike-In Mix [5] | A set of 92 synthetic RNAs with known concentrations spiked into samples to evaluate quantification accuracy, sensitivity, and dynamic range. |
| Clinically Accessible Tissues (CATs) | Peripheral Blood Mononuclear Cells (PBMCs) [21] [22] | A minimally invasive tissue source; expresses a high percentage of genes from disease panels (e.g., ~80% for neurodevelopmental disorders). |
| Fibroblasts / Lymphoblastoid Cell Lines (LCLs) [22] [24] | Renewable cell sources suitable for functional assays and studying splicing defects or allele-specific expression. | |
| Critical Bioinformatics Tools | Pseudoaligners (Kallisto, Salmon) [11] | Fast, alignment-free tools for transcript quantification. Show high correlation with qPCR. |
| Aligner-Quantifiers (STAR-HTSeq) [11] | Alignment-based pipelines that provide high precision for gene-level differential expression analysis. | |
| Differential Analysis Tools (DESeq2, edgeR) [20] | Statistical packages for identifying differentially expressed genes from count-based data. | |
| Sashimi Plot Visualizations (ggsashimi) [24] | Visualizes RNA-seq read alignment across exon junctions, crucial for validating suspected splicing defects. |
The benchmarking of RNA-seq against qPCR using expression correlation and differential expression performance confirms that RNA-seq is a highly accurate and reliable technology for transcriptome analysis. When best practices are followed—including the use of standardized reference materials, appropriate bioinformatic workflows, and expression-level filtering—RNA-seq can achieve greater than 90% concordance with qPCR in fold-change detection [11]. However, researchers must remain aware of specific challenges, such as the accurate quantification of genes with low expression levels or those located in complex genomic regions like the MHC locus [21] [11]. For clinical applications, where detecting subtle expression differences is critical, quality control using reference materials designed for this purpose (e.g., Quartet samples) is strongly recommended [5]. Ultimately, the choice of RNA-seq workflow should be guided by the specific research question, available computing resources, and the need for gene-level versus transcript-level resolution. The data and protocols outlined in this guide provide a foundation for making these informed decisions.
The transition of RNA-sequencing (RNA-seq) from a research tool to a clinical diagnostic method requires demonstrating high reliability and cross-laboratory consistency, particularly for detecting subtle differential expression between similar biological states [5]. Foundational studies utilizing well-characterized reference materials have been instrumental in assessing the technical performance of transcriptomic technologies. The MicroArray Quality Control (MAQC) project, followed more recently by the Quartet Project, have generated comprehensive benchmark datasets and systematic frameworks for evaluating RNA-seq workflows [5] [11]. These initiatives provide critical insights into how experimental protocols and bioinformatics pipelines influence gene expression measurements, establishing best practices for the field.
This guide objectively compares the reference materials from these landmark projects, detailing their experimental designs, key findings regarding RNA-seq performance, and implications for detecting differential expression. By synthesizing data from multiple large-scale studies, we provide researchers with a structured comparison of these foundational resources and their applications in benchmarking RNA-seq analysis workflows against the gold standard of qPCR.
The MAQC Project
The MAQC project was a landmark effort assessing the reproducibility of microarray and sequencing technologies using two well-characterized RNA samples: MAQC-A (Universal Human Reference RNA, a pool of 10 cell lines) and MAQC-B (Human Brain Reference RNA) [11] [16]. These samples exhibit large biological differences, making them suitable for initial platform validation and ongoing quality control. The project design included matching TaqMan RT-qPCR data for numerous genes, providing a robust benchmark for evaluating gene expression measurements from different technologies [11] [16].
The Quartet Project
The Quartet Project represents a next-generation approach to quality control, utilizing multi-omics reference materials derived from immortalized B-lymphoblastoid cell lines from a Chinese quartet family of parents and monozygotic twin daughters [5] [25]. This design includes four well-characterized samples with small inter-sample biological differences that more closely mimic the subtle expression variations observed between different disease subtypes or stages [5]. The project incorporates multiple types of "ground truth," including built-in truths from known mixing ratios of samples and external reference datasets, enabling comprehensive assessment of transcriptome profiling accuracy [5].
Table 1: Key Characteristics of Reference Material Projects
| Characteristic | MAQC Project | Quartet Project |
|---|---|---|
| Reference Samples | MAQC-A (Universal Human Reference RNA), MAQC-B (Human Brain Reference RNA) | Four samples from a family quartet (F7, M8, D5, D6) + defined mixture samples (T1, T2) |
| Nature of Biological Differences | Large differences between distinct tissue/cell types | Subtle differences between genetically related individuals |
| Primary Application | Platform validation, ongoing quality control | Assessing sensitivity for clinically relevant subtle differential expression |
| Ground Truth | TaqMan RT-qPCR datasets [11] | Multiple reference datasets, built-in truths from mixing ratios, ERCC spike-in controls [5] |
| Sample Stability | Well-established | Long-term stability monitoring integrated (15 months proteomics data) [25] |
Experimental Protocols
MAQC Experimental Protocol: The MAQC study utilized RNA samples with accompanying TaqMan RT-qPCR data for validation. Researchers typically extracted RNA from MAQC-A and MAQC-B samples, performed library preparation using various protocols (including both one-color and two-color platforms for microarray components), and conducted sequencing on available platforms [26] [16]. Bioinformatics workflows included alignment tools (TopHat, STAR), quantification methods (HTSeq, Cufflinks), and normalization approaches (FPKM, TPM) to derive gene expression estimates [11] [16].
Quartet Experimental Protocol: The Quartet project employed a distributed design where identical aliquots of reference materials were sent to multiple laboratories (45 for transcriptomics). Each laboratory performed RNA extraction, library preparation (with variations in mRNA enrichment, strandedness protocols), and sequencing on their preferred platforms [5]. Spike-in ERCC RNA controls were added to specific samples to enable absolute quantification assessment. For data analysis, both standardized pipelines and laboratory-specific workflows were applied, encompassing 26 experimental processes and 140 bioinformatics pipelines for comprehensive evaluation [5].
Performance Comparison of RNA-Seq Workflows
Accuracy of Gene Expression Quantification
Studies comparing RNA-seq workflows against qPCR benchmarks have revealed important patterns in quantification accuracy. When comparing relative expression measurements (fold changes) between MAQC-A and MAQC-B samples, multiple RNA-seq workflows showed high concordance with qPCR data, with approximately 85% of genes showing consistent differential expression calls between RNA-seq and qPCR [11]. The correlation coefficients for expression fold changes between RNA-seq and qPCR ranged from 0.927 to 0.934 across different workflows, demonstrating generally strong agreement [11].
Different quantification tools show varying performance characteristics. One study reported that HTSeq exhibited the highest correlation with RT-qPCR measurements (R²=0.85-0.89), though it produced greater root-mean-square deviation from qPCR values compared to other tools [16]. Pseudoalignment tools like Salmon and Kallisto demonstrated performance comparable to alignment-based methods, with correlation coefficients of approximately 0.93 for fold-change comparisons [11].
Table 2: Performance Metrics of RNA-Seq Analysis Workflows Against qPCR Benchmarks
| Analysis Workflow | Expression Correlation with qPCR (R²) | Fold Change Correlation with qPCR (R²) | Non-concordant Genes | Strengths and Limitations |
|---|---|---|---|---|
| Tophat-HTSeq | 0.827 [11] | 0.934 [11] | 15.1% [11] | High fold-change correlation but may produce greater deviation from qPCR values [16] |
| STAR-HTSeq | 0.821 [11] | 0.933 [11] | ~15% (inferred) | Nearly identical to Tophat-HTSeq, minimal mapper impact [11] |
| Tophat-Cufflinks | 0.798 [11] | 0.927 [11] | ~16% (inferred) | Transcript-level quantification, slightly lower correlation |
| Kallisto | 0.839 [11] | 0.930 [11] | ~17% (inferred) | Fast pseudoalignment, performance comparable to alignment methods |
| Salmon | 0.845 [11] | 0.929 [11] | 19.4% [11] | Highest expression correlation but highest non-concordance [11] |
Detection of Subtle Differential Expression
The Quartet Project revealed significant challenges in detecting subtle differential expression across laboratories. The signal-to-noise ratio (SNR) based on principal component analysis demonstrated that smaller intrinsic biological differences among Quartet samples were more challenging to distinguish from technical noise compared to the large differences in MAQC samples [5]. The average SNR values for Quartet samples (19.8) were substantially lower than for MAQC samples (33.0), with 17 of 45 laboratories producing low-quality data (SNR < 12) for the subtle differential expression condition [5].
Inter-laboratory variation was significantly more pronounced when analyzing Quartet samples compared to MAQC samples. Experimental factors including mRNA enrichment protocols, library strandedness, and each step in bioinformatics pipelines emerged as primary sources of variation [5]. This highlights the critical importance of standardized protocols when aiming to detect clinically relevant subtle expression differences.
Identification of Problematic Genes
Benchmarking studies have consistently identified specific gene sets that show inconsistent expression measurements between RNA-seq and qPCR. These method-specific inconsistent genes typically share common characteristics: they are smaller, have fewer exons, and are lower expressed compared to genes with consistent expression measurements [11]. A significant proportion of these problematic genes are reproducibly identified across independent datasets, suggesting systematic technological discrepancies rather than random errors [11].
Best Practice Recommendations
Experimental Design Considerations
Based on findings from both projects, the following experimental design considerations are recommended:
- Reference Material Selection: Use MAQC-style references for platform validation and initial quality control, but incorporate Quartet-like materials when assessing sensitivity to subtle expression differences [5].
- Spike-in Controls: Include ERCC RNA spike-in controls to monitor technical performance and enable absolute quantification assessment [5].
- Replication: Implement appropriate technical replication to distinguish biological signals from technical noise, particularly when studying subtle expression differences [5].
- Protocol Standardization: Prioritize consistent mRNA enrichment and library preparation methods across samples in a study to minimize technical variation [5].
Bioinformatics Pipeline Selection
- Quantification Tools: Select quantification tools based on priority of metrics; HTSeq for maximum correlation, but consider RSEM or IsoEM for potentially higher accuracy despite slightly lower correlation [16].
- Normalization Methods: Implement appropriate normalization strategies accounting for gene length and sequencing depth (FPKM, TPM) when comparing expression across samples [16].
- Quality Metrics: Incorporate signal-to-noise ratio calculations to identify potential quality issues, particularly for studies of subtle differential expression [5].
- Problematic Gene Filtering: Exercise caution when interpreting results for small, low-expressed genes with few exons, as these are more prone to inaccurate quantification [11].
Research Reagent Solutions Toolkit
Table 3: Essential Reference Materials and Reagents for Transcriptomics Benchmarking
| Reagent/Resource | Function and Application | Key Features |
|---|---|---|
| MAQC Reference Samples | Benchmarking platform performance, validating RNA-seq workflows | Large biological differences between samples, well-characterized with TaqMan qPCR data [11] |
| Quartet Reference Materials | Assessing sensitivity to subtle differential expression, cross-laboratory standardization | Small biological differences between genetically related samples, built-in truths from known relationships [5] |
| ERCC Spike-in Controls | Monitoring technical performance, enabling absolute quantification | Synthetic RNA controls with known concentrations, added to samples before library preparation [5] |
| TaqMan qPCR Assays | Establishing ground truth for gene expression measurements | High-accuracy validation method for subset of genes, used for benchmarking high-throughput data [11] |
| Standardized RNA-seq Protocols | Minimizing technical variation across experiments and laboratories | Detailed methodologies for library preparation, sequencing, and analysis [5] |
The MAQC and Quartet Projects provide complementary resources for benchmarking RNA-seq workflows against qPCR data. While the MAQC reference materials remain valuable for platform validation and quality control, the Quartet samples address the critical need for assessing performance in detecting subtle differential expression more relevant to clinical applications [5]. The comprehensive benchmarking data from these initiatives demonstrate that both experimental and computational factors significantly impact RNA-seq accuracy and reproducibility. Researchers should select reference materials and analysis workflows aligned with their specific experimental goals, particularly considering whether they require detection of large or subtle expression differences. Continued development and implementation of such reference materials will be essential as RNA-seq progresses toward routine clinical application.
A Methodological Deep Dive: From RNA-Seq Workflows to qPCR Validation
The analysis of bulk RNA-seq data fundamentally relies on computational workflows to quantify gene expression from sequencing reads. These methods have converged into two dominant paradigms: alignment-based workflows and pseudoalignment approaches [11] [27]. Alignment-based methods, considered the traditional approach, involve mapping sequencing reads directly to a reference genome or transcriptome using splice-aware aligners such as STAR or HISAT2, followed by counting reads that map to specific genomic features [28] [29]. In contrast, pseudoalignment tools like Kallisto and Salmon employ a fundamentally different strategy by breaking reads into k-mers and matching them to a pre-indexed transcriptome without performing base-by-base alignment, thereby achieving substantial gains in computational efficiency [30] [27].
The selection between these approaches carries significant implications for downstream analyses, including differential expression testing, with performance varying based on experimental design and biological context [28] [11]. This guide provides an objective comparison of these workflow categories, emphasizing empirical performance data derived from controlled benchmarking studies that utilize qPCR validation as a ground truth standard. Understanding the relative strengths and limitations of each approach enables researchers to select optimal strategies for their specific experimental requirements and biological questions.
Workflow Architecture and Fundamental Differences
The architectural differences between alignment-based and pseudoalignment workflows stem from their divergent approaches to handling sequencing reads. The following diagram illustrates the fundamental procedural distinctions between these two paradigms:
Alignment-based workflows employ a sequential, multi-step process that begins with quality control of raw sequencing data, including adapter trimming and quality filtering using tools such as Trimmomatic, Cutadapt, or fastp [7] [31]. The core alignment step utilizes splice-aware aligners like STAR or HISAT2 to map reads to a reference genome, accommodating intron-spanning reads through specialized algorithms [29] [27]. This generates alignment files (BAM format) that undergo post-alignment quality assessment before read quantification with tools such as featureCounts or HTSeq, which count reads overlapping genomic features defined in annotation files [28] [16].
Pseudoalignment methods fundamentally streamline this process by eliminating the explicit alignment step. Tools like Kallisto and Salmon first build a transcriptome index from reference sequences, then employ k-mer-based matching to rapidly determine transcript compatibility for each read [30] [27]. Kallisto utilizes a "pseudoalignment" algorithm that ascertains whether reads could have originated from particular transcripts without determining base-level alignment coordinates, while Salmon implements "quasi-mapping" with additional bias correction models for sequence-specific and GC-content biases [28] [27]. This approach directly generates transcript abundance estimates in TPM (Transcripts Per Million) format, bypassing the intermediate alignment files entirely.
Performance Benchmarking Against qPCR Standards
Experimental Design for Method Validation
Robust benchmarking of RNA-seq quantification workflows requires carefully designed experiments that enable comparison against ground truth measurements. The Microarray Quality Control (MAQC) consortium has established reference RNA samples that serve as community standards for this purpose [28] [11]. These include Universal Human Reference RNA (MAQCA) and Human Brain Reference RNA (MAQCB), which are frequently mixed in known ratios (samples C and D) to create samples with predetermined expression fold-changes [28]. This design enables calculation of expected differential expression values for validation.
In comprehensive benchmarking studies, RNA-seq data derived from these reference samples are processed through multiple alignment-based and pseudoalignment workflows, with resulting expression measurements compared against quantitative reverse transcription PCR (qRT-PCR) data generated for thousands of genes [11]. This experimental approach provides orthogonal validation through a method widely regarded as the gold standard for gene expression quantification [11] [31]. The qPCR validation typically encompasses 13,000-18,000 protein-coding genes, offering transcriptome-wide assessment of quantification accuracy [11]. Performance metrics include expression correlation coefficients (R²) between RNA-seq and qPCR measurements, root mean square error (RMSE) calculations, and concordance in differential expression detection between technically validated methods [28] [11] [16].
Quantitative Performance Comparisons
The following table summarizes key performance metrics derived from controlled benchmarking studies that utilized qPCR validation as ground truth:
Table 1: Performance Metrics of RNA-Seq Workflows Against qPCR Validation
| Workflow | Expression Correlation (R²) with qPCR | Fold-Change Correlation (R²) with qPCR | Quantification Bias | Strengths | Limitations |
|---|---|---|---|---|---|
| STAR-HTSeq | 0.821-0.827 [11] | 0.933-0.934 [11] | Moderate | Robust for small RNAs and low-expression genes [28] | Computationally intensive; longer processing time [30] |
| Salmon | 0.845 [11] | 0.929 [11] | Low to moderate | Fast processing; good for large datasets [27] | Reduced accuracy for small RNAs [28] |
| Kallisto | 0.839 [11] | 0.930 [11] | Low to moderate | Extremely fast with low memory usage [30] | Systematic underperformance with low-abundance genes [28] |
| HISAT2-featureCounts | 0.827-0.872 [28] [7] | 0.920-0.935 [28] [7] | Moderate | Balanced performance across diverse RNA biotypes [28] | Intermediate computational requirements [7] |
When assessing differential expression detection, benchmarking studies reveal that approximately 85% of genes show consistent differential expression calls between RNA-seq workflows and qPCR data [11]. The alignment-based methods (STAR-HTSeq, HISAT2-featureCounts) demonstrate slightly better concordance (85.1-85.3%) compared to pseudoaligners (83.1-84.9%) when comparing MAQCA and MAQCB samples [11]. However, it is important to note that the majority of discordant genes (93%) show relatively small fold-change differences (ΔFC < 2) between methods [11].
Specialized Performance Considerations
Performance differences between workflow categories become more pronounced for specific biological contexts. Alignment-based methods significantly outperform pseudoaligners for small structured non-coding RNAs (tRNAs, snoRNAs) and low-abundance transcripts, demonstrating superior accuracy in total RNA-seq contexts where these RNA biotypes are represented [28]. This performance gap is attributed to the fundamental k-mer-based approach of pseudoaligners, which may not adequately handle the distinct characteristics of small RNAs.
The following table summarizes context-specific performance considerations:
Table 2: Context-Dependent Performance of RNA-Seq Workflow Categories
| Experimental Context | Alignment-Based Performance | Pseudoalignment Performance | Recommendations |
|---|---|---|---|
| Small RNA Quantification | Superior accuracy for tRNAs, snoRNAs, and other small structured RNAs [28] | Systematically poorer performance; potential for quantification inaccuracies [28] | Alignment-based recommended for total RNA-seq including small RNAs |
| Low-Abundance Genes | More robust detection and quantification [28] [11] | Reduced accuracy; higher rate of dropouts for low-expression genes [28] | Alignment-based preferred for studies focusing on lowly-expressed targets |
| Large-Scale Studies | Computationally challenging for thousands of samples [27] | Ideal for processing thousands of samples efficiently [27] | Pseudoalignment recommended when processing large sample batches |
| Novel Transcript Discovery | Capable of identifying novel splice variants and unannotated features [29] | Limited to previously annotated transcriptomes [27] | Alignment-based essential for discovery-oriented research |
For standard protein-coding gene quantification, both workflow categories demonstrate high agreement with qPCR validation data, with correlation coefficients ranging from 0.82-0.85 for expression levels and 0.93-0.94 for fold-change measurements [11]. This suggests that for common differential expression analyses focusing on mRNA, the choice between paradigms may be driven primarily by practical considerations rather than absolute performance differences.
Experimental Protocols for Benchmarking Studies
Reference Sample Preparation
Benchmarking studies typically utilize well-characterized reference RNA samples to establish ground truth measurements. The MAQC consortium reference samples (Universal Human Reference RNA and Human Brain Reference RNA) are commonly employed, with preparation following standardized protocols [11] [16]. These samples are typically processed using the TGIRT (thermostable group II intron reverse transcriptase) protocol for RNA-seq library preparation, which enables more comprehensive recovery of full-length structured small non-coding RNAs alongside long RNAs in a single library workflow [28]. For qPCR validation, total RNA is reverse transcribed using oligo-dT primers or random hexamers, followed by amplification with TaqMan assays designed against protein-coding genes of interest [11] [31].
RNA-Seq Library Preparation and Sequencing
RNA-seq libraries are prepared following standardized protocols such as the TruSeq Stranded Total RNA protocol, with sequencing typically performed on Illumina platforms to generate paired-end reads (2×101 bp) at sufficient depth (20-30 million reads per sample) to ensure statistical power for quantification accuracy assessment [31]. Quality control steps include RNA integrity measurement (RIN > 7.0) using Agilent Bioanalyzer and quantification via fluorometric methods to ensure input material quality [29].
Data Processing Protocols
For alignment-based workflows, the typical protocol involves:
- Read trimming using Trimmomatic or fastp with quality threshold Q>20 and minimum read length 50 bp [31]
- Alignment using STAR or HISAT2 with genome index and annotation GTF file [28] [27]
- Read quantification with featureCounts or HTSeq using "union" or "intersection-nonempty" modes [16]
- Generation of count matrices for downstream analysis
For pseudoalignment workflows, the standard protocol includes:
- Transcriptome index generation from reference FASTA and GTF files [27]
- Quantification using Kallisto or Salmon with bias correction flags enabled [28]
- Generation of transcript-level TPM values and estimated counts
- Aggregation to gene-level counts when necessary [11]
qPCR Validation Methodology
qPCR validation follows established best practices with:
- Reverse transcription of total RNA using SuperScript First-Strand Synthesis System [31]
- Amplification with TaqMan assays in technical duplicates [11]
- Normalization using global median normalization approach for Ct values [31]
- Calculation of relative expression using ΔΔCt method with stable reference genes [31]
Table 3: Essential Resources for RNA-Seq Workflow Implementation
| Category | Resource | Function | Specifications |
|---|---|---|---|
| Reference Materials | MAQC Reference RNAs (UHRR, HBRR) | Benchmarking standards for method validation | Universal Human Reference RNA, Human Brain Reference RNA [11] |
| Library Preparation | TruSeq Stranded Total RNA Kit | RNA-seq library construction | Includes ribosomal depletion, fragmentation, adapter ligation [31] |
| qPCR Validation | TaqMan Gene Expression Assays | Target-specific amplification for validation | FAM-labeled probes, pre-optimized for 18,080 protein-coding genes [11] |
| Computational Tools | nf-core/rnaseq | Automated pipeline for reproducible analysis | Incorporates STAR, Salmon, quality control metrics [27] |
| Alignment Software | STAR | Spliced alignment to reference genome | Requires genome index, handles junction mapping [27] |
| Pseudoalignment Software | Kallisto | Rapid transcript quantification | Uses k-mer matching, outputs TPM values [30] |
| Quality Control | FastQC | Quality assessment of sequencing data | Evaluates base quality, adapter contamination, GC content [32] |
Empirical benchmarking against qPCR validation reveals that both alignment-based and pseudoalignment RNA-seq workflows provide accurate gene expression quantification for standard protein-coding genes, with correlation coefficients exceeding 0.82 for expression levels and 0.93 for fold-change measurements [11]. However, significant performance differences emerge for specific biological contexts, with alignment-based methods demonstrating superior capabilities for small RNA quantification and detection of low-abundance transcripts [28].
For researchers working with total RNA samples that include structured small RNAs, or when studying lowly-expressed genes, alignment-based workflows (STAR-HTSeq, HISAT2-featureCounts) provide more robust and accurate quantification [28]. For large-scale studies prioritizing processing efficiency with standard mRNA quantification, pseudoalignment tools (Salmon, Kallisto) offer excellent performance with substantially reduced computational requirements [30] [27]. A hybrid approach utilizing STAR alignment followed by Salmon quantification provides comprehensive quality assessment alongside efficient quantification, balancing the strengths of both paradigms [27].
The continuing evolution of both workflow categories ensures that benchmarking against orthogonal validation methods like qPCR remains essential for methodological advancements in RNA-seq analysis, ultimately enabling more accurate biological insights from transcriptomic studies.
RNA sequencing (RNA-seq) has become the gold standard for whole-transcriptome gene expression quantification, enabling researchers to explore genetic regulatory networks and identify novel transcripts with unprecedented detail [11] [7]. As the technology has proliferated, so too has the complexity of analytical workflows designed to derive biological insights from sequencing data. These workflows generally fall into two methodological categories: alignment-dependent approaches that map reads to a reference genome (e.g., STAR-HTSeq, Tophat-Cufflinks) and alignment-free methods that directly assign reads to transcripts using k-mer-based strategies (e.g., Kallisto, Salmon) [11]. Despite the critical importance of tool selection for research outcomes, the field lacks a standardized analysis pipeline, presenting researchers with a challenging decision landscape.
Benchmarking studies traditionally relied on simulated data or validation with limited numbers of genes, but these approaches fail to capture the full complexity of real biological systems [11]. The most rigorous evaluations now utilize whole-transcriptome reverse transcription quantitative PCR (qPCR) data, which provides a trusted ground truth for method validation [15] [11]. This article presents a comprehensive benchmark of five popular RNA-seq analysis workflows—STAR-HTSeq, Tophat-HTSeq, Tophat-Cufflinks, Kallisto, and Salmon—evaluated against extensive qPCR datasets. By synthesizing evidence from multiple independent studies, we provide researchers, scientists, and drug development professionals with data-driven guidance for selecting appropriate tools based on their specific research objectives and computational constraints.
Experimental Design and Methodologies
Reference Datasets and qPCR Ground Truth
To ensure robust benchmarking, the evaluated studies utilized well-characterized RNA reference samples, primarily the MAQCA (Universal Human Reference RNA) and MAQCB (Human Brain Reference RNA) from the MAQC-I consortium [11]. These samples represent carefully controlled transcript mixtures that provide a consistent benchmark across laboratories and analytical methods. The key innovation in recent benchmarking efforts involves using whole-transcriptome RT-qPCR assays targeting all protein-coding genes (approximately 18,080 genes) as validation data, moving beyond the limited gene sets that constrained earlier studies [11].
The qPCR data processing required careful alignment between transcripts detected by qPCR assays and those quantified by RNA-seq workflows. For transcript-level tools (Cufflinks, Kallisto, Salmon), gene-level TPM (Transcripts Per Million) values were calculated by aggregating transcript-level TPM values of transcripts detected by the respective qPCR assays [11]. For count-based workflows (Tophat-HTSeq, STAR-HTSeq), gene-level counts were converted to TPM values to enable cross-method comparison. To minimize bias from lowly expressed genes, researchers applied a minimal expression filter of 0.1 TPM across all samples and replicates [11].
Benchmarking Workflow Architecture
The following diagram illustrates the comprehensive experimental approach used to evaluate the five RNA-seq workflows against qPCR validation data:
Experimental Workflow for RNA-Seq Tool Benchmarking. The diagram illustrates the comprehensive approach used to evaluate five RNA-seq workflows against qPCR validation data. RNA-seq raw reads are processed through either alignment-based or alignment-free methods, followed by gene/transcript quantification. Results are compared against qPCR data using multiple performance metrics.
Performance Evaluation Metrics
The benchmarking studies employed multiple complementary metrics to evaluate workflow performance:
- Expression Correlation: Pearson correlation between normalized RT-qPCR Cq-values and log-transformed RNA-seq expression values (TPM) for the same samples [11].
- Fold Change Correlation: Pearson correlation of gene expression fold changes between MAQCA and MAQCB samples calculated from RNA-seq versus qPCR data [11].
- Rank Difference Analysis: Transformation of TPM and normalized Cq-values to gene expression ranks with calculation of absolute rank differences to identify outlier genes [11].
- Differential Expression Concordance: Classification of genes into concordant and non-concordant groups based on agreement between RNA-seq and qPCR differential expression calls [11].
- Computational Efficiency: Measurement of computational resource requirements including memory usage, processing time, and alignment rates [33] [34].
Key Research Reagent Solutions
The table below details essential reagents and resources used in the benchmark experiments:
| Reagent/Resource | Function in Experiment | Specific Examples/Details |
|---|---|---|
| Reference RNA Samples | Provide standardized transcript mixtures for cross-method comparison | MAQCA (Universal Human Reference RNA), MAQCB (Human Brain Reference RNA) [11] |
| Reference Genomes/Annotations | Foundation for read alignment and transcript quantification | Ensembl release 75 (GRCh37/hg19) genome assembly, cDNA, and non-coding RNA sequences [33] |
| Whole-Transcriptome qPCR Assays | Generate validation data with coverage of protein-coding transcriptome | Assays targeting ~18,080 protein-coding genes [11] |
| Alignment-Based Tools | Map RNA-seq reads to reference genome | STAR [11], Tophat [11], HISAT2 [34] with various quantification approaches |
| Alignment-Free Tools | Direct transcript assignment without full alignment | Kallisto [11], Salmon [11] using k-mer-based pseudoalignment |
| Quality Control Tools | Assess read quality and preprocessing needs | FastQC [7], Fastp [7], Trim Galore [7] for quality metrics and adapter trimming |
Performance Comparison of RNA-Seq Workflows
Expression Quantification Accuracy
When comparing gene expression values against qPCR measurements, all five workflows showed high correlation, though alignment-free methods demonstrated slightly superior performance. Salmon achieved the highest expression correlation (R² = 0.845), closely followed by Kallisto (R² = 0.839) [11]. Among alignment-based methods, Tophat-HTSeq (R² = 0.827) and STAR-HTSeq (R² = 0.821) showed comparable performance, while Tophat-Cufflinks had the lowest correlation (R² = 0.798) [11]. These results suggest that pseudoalignment methods provide marginally better agreement with qPCR measurements for absolute expression quantification.
A notable finding across all workflows was the identification of systematic discrepancies between technologies. Each method revealed a specific gene set (407-591 genes) with inconsistent expression measurements between RNA-seq and qPCR [11]. These "rank outlier genes" significantly overlapped across workflows and were characterized by significantly lower expression levels, suggesting that technological differences rather than algorithmic limitations explain most discrepancies.
Differential Expression Analysis Performance
For most research applications, accurate detection of differential expression between conditions represents the primary analytical goal. All workflows showed excellent fold change correlation with qPCR data (R² > 0.92), with minimal practical differences between methods [11]. The table below summarizes the quantitative performance metrics:
| Workflow | Expression Correlation (R²) | Fold Change Correlation (R²) | Non-Concordant Genes | Major Discordant Genes (ΔFC>2) |
|---|---|---|---|---|
| Salmon | 0.845 | 0.929 | 19.4% | 1.6% |
| Kallisto | 0.839 | 0.930 | 16.9% | 1.4% |
| Tophat-Cufflinks | 0.798 | 0.927 | 17.4% | 1.4% |
| Tophat-HTSeq | 0.827 | 0.934 | 15.1% | 1.1% |
| STAR-HTSeq | 0.821 | 0.933 | 15.3% | 1.2% |
Performance Metrics of RNA-Seq Workflows Against qPCR Validation. Expression correlation indicates Pearson correlation between RNA-seq and qPCR expression values. Fold change correlation represents Pearson correlation of gene expression changes between samples. Non-concordant genes show disagreement in differential expression calls. Major discordant genes have fold change differences >2 between methods [11].
When comparing differential expression calls between MAQCA and MAQCB samples, alignment-based methods (Tophat-HTSeq, STAR-HTSeq) showed a slightly lower fraction of non-concordant genes (15.1-15.3%) compared to pseudoaligners (16.9-19.4%) [11]. However, the majority of non-concordant genes showed relatively small fold change differences (ΔFC < 1), with only 1.1-1.6% of genes exhibiting major discrepancies (ΔFC > 2) [11]. This suggests that while the choice of workflow affects the specific genes identified as differentially expressed, the overall biological interpretation would likely be similar across methods.
Computational Efficiency and Resource Requirements
Computational performance varied substantially between workflows, with important implications for researchers with limited computational resources or processing large datasets. Kallisto-Sleuth demanded the least computing resources, while Cufflinks-Cuffdiff required the most substantial investment [34]. Salmon and Kallisto typically completed quantification within minutes, offering significant speed advantages over alignment-based methods [33].
Studies noted that HISAT2-StringTie-Ballgown showed higher sensitivity for genes with low expression levels, while Kallisto-Sleuth proved most effective for medium to highly expressed genes [34]. This differential performance across expression ranges suggests that research priorities should inform tool selection—if studying low-abundance transcripts is crucial, alignment-based methods may be preferable.
Technical Protocols and Implementation
Alignment-Based Workflow Implementation
For STAR-HTSeq and Tophat-HTSeq pipelines, the standard implementation begins with quality control checks using tools like FastQC or Fastp [7]. While some studies have questioned the necessity of trimming [33], quality assessment remains critical for detecting potential issues. The alignment step typically uses STAR or Tophat with reference genome indices, followed by read quantification with HTSeq-count using appropriate parameters for stranded libraries [11].
A critical consideration for alignment-based methods is the handling of multimapping reads. HTSeq employs a default strategy of discarding reads that align to multiple positions, while alternative tools like Rcount assign weights to each alignment [34]. For studies where paralogous genes or gene families are of interest, this handling strategy may significantly impact results and should be carefully considered.
Alignment-Free Workflow Implementation
Salmon and Kallisto require transcriptome indices rather than genome references. The indexing process uses cDNA and non-coding RNA sequences from references such as Ensembl [33]. For single-end RNA-seq data, both tools require specification of fragment length distribution parameters (typically 200bp mean with 20bp standard deviation) [33], while paired-end data enables automatic estimation of these parameters.
Salmon offers both traditional alignment-based and quasi-mapping-based modes, with the latter providing faster processing [33]. Both tools can generate transcript-level estimates that can be summarized to gene level using methods like tximport, which the developers recommend over Salmon's built-in gene-level quantification due to better multi-sample effective gene length estimation [33].
qPCR Validation Methodology
The qPCR validation followed rigorous standards to ensure reliability. RNA samples were treated with DNase to remove genomic DNA contamination, and quantification used calibrated instruments like the HT RNA Lab Chip [21]. The analysis incorporated efficiency-corrected models rather than relying solely on the 2−ΔΔCT method, with ANCOVA (Analysis of Covariance) providing greater statistical power and robustness for differential expression detection [35].
For comparative analysis, normalized Cq-values from qPCR were compared with log-transformed RNA-seq expression values, with careful attention to ensure that transcripts detected by qPCR assays aligned with those quantified in RNA-seq analysis [11]. This alignment step is particularly important for transcript-level workflows where multiple isoforms might complicate direct comparison.
Discussion and Practical Recommendations
Context-Dependent Workflow Selection
The benchmarking data reveals that no single workflow dominates across all performance metrics, suggesting that optimal tool selection depends on research priorities. The following diagram illustrates the decision process for selecting an appropriate workflow based on research objectives:
RNA-Seq Workflow Selection Guide. This decision diagram illustrates appropriate workflow selection based on research priorities. Alignment-based methods support novel transcript discovery, while alignment-free tools offer speed for standard differential expression analysis. Low-abundance gene studies benefit from HTSeq-based workflows, and clinical applications warrant consensus across multiple methods.
For research focusing on novel transcript discovery or alternative splicing analysis, alignment-based methods like STAR-HTSeq remain essential, as pseudoalignment tools require predefined transcript references [33]. When studying low-abundance transcripts, HISAT2-StringTie-Ballgown demonstrates superior sensitivity compared to Kallisto-Sleuth [34]. For standard differential expression analysis of bulk tissue samples, all workflows show excellent performance, with alignment-free methods providing significant speed advantages.
In clinical or diagnostic applications where maximizing reliability is paramount, employing multiple workflows and taking the intersection of results may provide the most conservative and reproducible gene list [34]. This approach helps mitigate method-specific biases, particularly for the small subset of genes with inconsistent measurements across technologies.
Emerging Considerations and Future Directions
Recent methodological advances continue to reshape the landscape of RNA-seq analysis. Studies specifically examining HLA gene expression have revealed unique challenges due to extreme polymorphism, prompting the development of specialized pipelines that account for known HLA diversity during alignment [21]. These specialized approaches demonstrate only moderate correlation with qPCR (0.2 ≤ rho ≤ 0.53), highlighting the particular difficulty of accurately quantifying highly polymorphic loci [21].
The growing interest in differential transcript usage (DTU) analysis has inspired new benchmark studies comparing twelve detection tools. For paired-end data, DEXSeq, edgeR, and LimmaDS emerged as top performers, while DEXSeq and DSGseq are recommended for single-end data [36]. These developments highlight the continuous evolution of RNA-seq analysis methodologies and the need for ongoing benchmarking as new tools emerge.
Comprehensive benchmarking of five popular RNA-seq workflows against whole-transcriptome qPCR data reveals that overall methodological performance has matured, with all tested methods showing strong correlation with validation data. Salmon and Kallisto demonstrate slightly superior expression correlation and substantial computational efficiency, while alignment-based methods like STAR-HTSeq and Tophat-HTSeq show marginally better concordance for differential expression calls. The minimal practical differences between workflows for most genes suggests that researchers can select tools based on their specific research questions, computational resources, and analytical priorities rather than seeking a universally superior solution.
The small but consistent set of genes with methodology-dependent discrepancies warrants special attention, particularly in clinical or diagnostic applications where maximum reliability is essential. These genes tend to be smaller, have fewer exons, and show lower expression levels, suggesting inherent biological features that challenge current quantification technologies. For these critical applications, employing multiple complementary workflows and examining consensus results may provide the most robust approach until the underlying causes of these discrepancies are fully resolved.
Within the context of benchmarking RNA-Sequencing (RNA-Seq) analysis workflows, quantitative PCR (qPCR) remains the definitive method for gene expression quantification and validation of high-throughput results. The formidable sensitivity of qPCR makes meticulous experimental design paramount to ensure the integrity, consistency, and reproducibility of the findings. This guide provides a systematic framework for designing a robust qPCR validation experiment, from initial assay selection to final data normalization, ensuring that the data generated provides a reliable gold standard for evaluating RNA-seq workflows.
Assay Selection and Experimental Design
The first phase of a robust qPCR experiment involves careful planning to minimize technical variability and bias.
Reference Gene (RG) Selection and Validation
A critical, yet often overlooked, step is the selection and validation of stable reference genes for data normalization. RGs, or housekeeping genes, are essential for controlling technical variability introduced during sample processing. However, their expression can vary significantly depending on the tissue type and pathological condition.
- Stability Validation: It is crucial to empirically validate the stability of potential RGs for your specific experimental system. This involves profiling several candidate RGs and using algorithms to rank their stability.
- Recommended Algorithms: Commonly used tools include geNorm, NormFinder, and RefFinder, which provide a comprehensive stability ranking [19] [37].
- Number of RGs: The MIQE guidelines recommend using more than one verified RG. Studies suggest that using a combination of the two or three most stable RGs often provides optimal normalization [19].
- Ribosomal Protein Genes: Be cautious when selecting RGs from the same functional group, such as ribosomal proteins (e.g., RPS5, RPL8), as they tend to be co-regulated. Incorporating a RG with a distinct cellular function (e.g., HMBS) can improve normalization robustness [19].
Alternative Normalization: The Global Mean (GM) Method
For studies profiling a large number of genes, the Global Mean (GM) method can be a superior alternative to using RGs. This method normalizes the expression of a target gene against the average expression of all well-performing genes in the assay.
- Application: The GM method is conventionally used for gene expression arrays or miRNA profiling and is a valuable alternative for qPCR.
- Performance: Research has demonstrated that the GM method can outperform normalization strategies using multiple RGs by resulting in a lower coefficient of variation of gene expression data across tissues and conditions [19].
- Break-even Point: The implementation of the GM method is advisable when profiling a large set of genes (e.g., greater than 55 genes) [19].
Experimental Design Strategy
Efficiency in experimental design can reduce costs and technical errors without compromising data quality.
- Dilution-Replicate Design: An alternative to the traditional design of using identical replicates is to use a dilution-replicate design. Here, a single reaction is performed on several dilutions for every test sample, creating a standard curve for each sample.
- Benefits: This design allows for the estimation of PCR efficiency for every sample, eliminates the need for separate efficiency calibration, and provides a means to identify and exclude outliers from the analysis rather than being forced to accept the average of technically flawed replicates [38].
The following diagram illustrates the key decision points and workflow for establishing a robust qPCR experiment.
qPCR Normalization Strategies: A Comparative Analysis
Selecting the appropriate normalization method is a cornerstone of qPCR data analysis. The table below summarizes the core strategies, their mechanisms, and ideal use cases.
Table 1: Comparison of qPCR Data Normalization Strategies
| Normalization Strategy | Mechanism | Best Use Case | Advantages | Limitations |
|---|---|---|---|---|
| Multiple Reference Genes [19] | Normalizes target gene expression against the geometric mean of 2-3 most stable RGs. | Profiling small sets of genes (<50); studies with limited candidate genes. | Robust for targeted studies; well-established statistical tools for validation. | Requires upfront validation; stability can be context-dependent. |
| Global Mean (GM) [19] | Normalizes target gene against the average Cq of all well-performing genes in the assay. | Profiling large gene sets (>55 genes); high-throughput qPCR. | Can outperform RG methods in reducing variability; no need for pre-defined RGs. | Not suitable for small-scale studies; requires all genes to be well-performing. |
| ANCOVA [35] | A flexible multivariable linear model that uses raw fluorescence curves instead of Cq values. | Any study design, especially when amplification efficiency varies. | Greater statistical power; accounts for efficiency variation; more robust than 2−ΔΔCT. | Requires raw fluorescence data; more complex implementation. |
Data Analysis and Statistical Frameworks
Moving beyond traditional analysis methods is key to improving rigor and reproducibility.
- Moving Beyond 2−ΔΔCT: The widespread 2−ΔΔCT method often overlooks critical factors such as amplification efficiency variability. It is strongly recommended to share raw qPCR fluorescence data along with detailed analysis scripts to ensure transparency [35].
- ANCOVA for Enhanced Power: Analysis of Covariance (ANCOVA) is a flexible multivariable linear modeling approach that generally offers greater statistical power and robustness compared to 2−ΔΔCT. ANCOVA P-values are not affected by variability in qPCR amplification efficiency, making it a more reliable method [35].
- Clinical Research Assay Validation: For research aimed at clinical translation, a higher level of validation is required. "Clinical Research (CR) Assays" fill the gap between Research Use Only (RUO) and In Vitro Diagnostics (IVD). This involves rigorous evaluation of analytical performance, including trueness, precision, analytical sensitivity, and analytical specificity [39].
Benchmarking RNA-Seq with qPCR: Key Considerations
When using qPCR to benchmark RNA-seq workflows, understanding the sources of discrepancy is essential.
- High Correlation but Important Outliers: Studies show high gene expression and fold-change correlations between RNA-seq and qPCR. However, each RNA-seq processing workflow (e.g., STAR-HTSeq, Kallisto, Salmon) reveals a small but specific set of genes with inconsistent expression measurements [11].
- Characteristics of Problematic Genes: These method-specific inconsistent genes are often characterized by being shorter, having fewer exons, and being lower expressed compared to genes with consistent measurements. Careful validation is warranted when evaluating RNA-seq based expression profiles for this specific gene set [11].
- Challenges with Complex Gene Families: For highly polymorphic gene families like the Human Leukocyte Antigen (HLA) genes, correlations between qPCR and RNA-seq can be only moderate (e.g., 0.2 ≤ rho ≤ 0.53). This highlights the additional technical challenges, such as read alignment issues due to extreme diversity, that need to be accounted for when comparing quantifications from different techniques [21].
Table 2: Performance of RNA-Seq Analysis Workflows Benchmarked Against qPCR
| RNA-Seq Workflow | Type | Expression Correlation with qPCR (R²) [11] | Fold-Change Correlation with qPCR (R²) [11] | Notes |
|---|---|---|---|---|
| Salmon | Pseudoalignment | 0.845 | 0.929 | Fast; transcript-level quantification. |
| Kallisto | Pseudoalignment | 0.839 | 0.930 | Fast; transcript-level quantification. |
| Tophat-HTSeq | Alignment-based | 0.827 | 0.934 | Gene-level quantification; lower fraction of non-concordant genes. |
| STAR-HTSeq | Alignment-based | 0.821 | 0.933 | Gene-level quantification; performance nearly identical to Tophat-HTSeq. |
| Tophat-Cufflinks | Alignment-based | 0.798 | 0.927 | Transcript-level quantification. |
The Scientist's Toolkit: Essential Reagents and Materials
A successful qPCR experiment relies on a suite of carefully selected reagents and tools.
Table 3: Essential Research Reagent Solutions for qPCR Validation
| Item | Function | Considerations for Robust Experimentation |
|---|---|---|
| Stable Reference Genes [19] [37] | Endogenous controls for data normalization. | Must be empirically validated for your specific tissue and condition (e.g., RPS5, RPL8, HMBS in canine GI tissue; Ref 2, Ta3006 in wheat). |
| RNA Isolation Kit [21] | Purification of high-quality RNA from samples. | Must effectively remove genomic DNA. Use of RNAse-free DNase is critical. |
| Reverse Transcriptase Kit | Synthesis of complementary DNA (cDNA) from RNA. | Choose kits with high efficiency and consistency. |
| qPCR Master Mix | Provides enzymes, dNTPs, and buffer for the PCR reaction. | Opt for mixes with robust performance and consistent amplification efficiency. |
| Primer Pairs [37] | Sequence-specific amplification of target and reference genes. | Must be validated for specificity (single peak in melting curve) and PCR efficiency [38]. |
| Standard Curve Dilutions [38] | Used to calculate PCR amplification efficiency (E). | Essential for traditional analysis; integrated into each sample in the dilution-replicate design. |
Designing a robust qPCR validation experiment requires a holistic approach that integrates rigorous assay selection, efficient experimental design, and statistically sound data normalization. The choice between reference genes and the global mean method depends on the scale of the study, while modern statistical approaches like ANCOVA offer greater robustness than traditional methods. When used to benchmark RNA-seq, qPCR reveals high overall concordance but also identifies a consistent set of genes for which RNA-seq quantification remains challenging. By adhering to these principles and leveraging the appropriate tools, researchers can generate qPCR data of the highest quality, providing a reliable foundation for the validation of transcriptomic studies.
The adoption of RNA sequencing (RNA-Seq) as the gold standard for whole-transcriptome gene expression quantification represents a significant advancement in transcriptomic research [11]. Despite its widespread use, a critical question remains: how accurately do different RNA-Seq processing workflows quantify gene expression levels from sequencing reads? While numerous benchmarking studies have been conducted, the consistent observation of high overall correlation with reference methods coupled with specific, reproducible discrepancies warrants detailed investigation [11] [16] [40]. This phenomenon, where different analysis workflows show strong concordance with quantitative PCR (qPCR) data for most genes yet reveal method-specific inconsistent measurements for particular gene sets, forms the core of this case study.
Within the broader context of benchmarking RNA-Seq analysis workflows against qPCR research, this analysis examines the paradoxical finding that high overall correlation coefficients can mask biologically relevant, systematic discrepancies. Understanding the source and implications of these specific gene set inconsistencies is paramount for researchers, scientists, and drug development professionals who rely on accurate transcriptome data for biomarker discovery, therapeutic target identification, and understanding disease mechanisms [41] [42]. The integration of artificial intelligence (AI) and machine learning (ML) in transcriptomic analysis further underscores the need for reliable input data, as the performance of these advanced models is contingent on the quality and accuracy of the underlying gene expression quantifications [41].
Experimental Design and Methodologies
Reference Samples and Benchmarking Data
This case study is grounded in an independent benchmarking study that utilized RNA-sequencing data from the well-established MAQCA and MAQCB reference samples [11] [40]. The MAQCA sample consists of Universal Human Reference RNA (a pool of 10 cell lines), while the MAQCB sample is derived from Human Brain Reference RNA [11]. These samples were selected for their well-characterized profiles and prevalent use in method validation studies.
The benchmark dataset consisted of expression data generated by wet-lab validated qPCR assays for 18,080 protein-coding genes, providing comprehensive coverage of the protein-coding transcriptome [11]. RT-qPCR remains considered the method of choice for validating gene expression data obtained by high-throughput profiling platforms due to its sensitivity and reproducibility [11]. The qPCR experiments followed rigorous standards, including proper assay validation and efficiency calculations, as emphasized in the MIQE 2.0 guidelines to ensure data reliability [43] [44].
RNA-Seq Analysis Workflows Evaluated
The benchmarking study processed RNA-sequencing reads using five distinct workflows, selected to represent the two major methodological approaches available: alignment-based methods and pseudoalignment methods [11].
Alignment-Based Workflows:
- Tophat-HTSeq: Utilizes the Tophat aligner for splice-aware mapping followed by HTSeq for gene-level quantification based on aligned reads [11] [16].
- Tophat-Cufflinks: Employs Tophat for alignment followed by Cufflinks for transcript assembly and quantification, capable of providing both gene-level and transcript-level expression estimates [11].
- STAR-HTSeq: Uses the STAR aligner for ultrafast universal RNA-seq aligner followed by HTSeq for quantification, representing a more recent alignment algorithm [11].
Pseudoalignment Workflows:
- Kallisto: A pseudoaligner that avoids full sequence alignment by breaking reads into k-mers before assigning them to transcripts, resulting in substantial gains in speed while providing transcript-level quantification [11].
- Salmon: Employs a similar pseudoalignment approach with a focus on accurate transcript-level quantification through selective alignment and bias correction [11].
Data Processing and Alignment
For alignment-based methods, RNA-Seq reads were first mapped to a reference genome using the respective aligners (Tophat or STAR) [11]. The alignment outputs then underwent various preprocessing stages to conform to the requirements of each quantification tool. The quantification tools subsequently estimated gene expression levels, with gene-level transcripts per million (TPM) values calculated for consistent comparison across workflows [11].
For the transcript-based workflows (Cufflinks, Kallisto, and Salmon), gene-level TPM values were derived by aggregating transcript-level TPM-values of those transcripts detected by the respective qPCR assays [11]. This careful alignment of transcripts detected by qPCR with transcripts considered for RNA-seq based gene expression quantification was crucial for ensuring a valid comparison.
Statistical Evaluation Metrics
The performance evaluation focused on two primary aspects of quantification accuracy:
Expression Correlation: Concordance in gene expression intensities between RNA-seq and qPCR was assessed by calculating Pearson correlation between normalized RT-qPCR quantification cycle (Cq) values and log-transformed RNA-seq expression values [11].
Fold Change Correlation: The most relevant assessment for most RNA-seq studies involved comparing gene expression fold changes between MAQCA and MAQCB samples, evaluating fold change correlations between RNA-seq and qPCR [11]. Differential expression was defined as log fold change > 1, with genes categorized as concordant (both methods agree on differential expression status) or non-concordant (methods disagree) [11].
Table 1: Key Experimental Components and Their Functions
| Component | Type | Function in Experiment |
|---|---|---|
| MAQCA & MAQCB Samples | Reference RNA | Well-characterized RNA samples for benchmarking [11] |
| TaqMan qPCR Assays | Validation Method | Provide "gold standard" expression measurements [11] [45] |
| Tophat/STAR | Alignment Tools | Map sequencing reads to reference genome [11] [16] |
| HTSeq | Quantification Tool | Generate gene-level counts from aligned reads [11] [16] |
| Cufflinks | Quantification Tool | Estimate transcript-level expression from alignments [11] [16] |
| Kallisto/Salmon | Pseudoaligners | Rapid transcript-level quantification without full alignment [11] |
| TPM/FPKM | Normalization Methods | Normalize expression data for cross-sample comparison [11] [16] |
Diagram 1: Experimental workflow for benchmarking RNA-Seq analysis pipelines against qPCR data.
Results: High Correlation with Specific Discrepancies
All five RNA-Seq workflows demonstrated high gene expression correlations with qPCR data, with Pearson correlation coefficients ranging from R² = 0.798 (Tophat-Cufflinks) to R² = 0.845 (Salmon) [11]. The pseudoalignment methods (Salmon and Kallisto) showed marginally higher expression correlations compared to most alignment-based methods.
When comparing gene expression fold changes between MAQCA and MAQCB samples—a more relevant metric for most biological studies—all workflows showed high concordance with qPCR data [11]. Fold change correlations were even stronger, with Pearson R² values ranging from 0.927 (Tophat-Cufflinks) to 0.934 (Tophat-HTSeq) [11]. This narrow range suggests nearly identical performance across workflows for the majority of genes.
Table 2: Performance Metrics of RNA-Seq Workflows Against qPCR Benchmark
| Workflow | Methodology Type | Expression Correlation (R²) | Fold Change Correlation (R²) | Non-concordant Genes |
|---|---|---|---|---|
| Salmon | Pseudoalignment | 0.845 | 0.929 | 19.4% |
| Kallisto | Pseudoalignment | 0.839 | 0.930 | 16.5% |
| Tophat-HTSeq | Alignment-Based | 0.827 | 0.934 | 15.1% |
| STAR-HTSeq | Alignment-Based | 0.821 | 0.933 | 15.3% |
| Tophat-Cufflinks | Alignment-Based | 0.798 | 0.927 | 16.2% |
Identification of Method-Specific Non-concordant Genes
Despite high overall correlations, a critical finding emerged when examining individual genes. When comparing gene expression fold changes between MAQCA and MAQCB samples, approximately 85% of genes showed consistent results between RNA-sequencing and qPCR data across all workflows [11] [40]. The remaining 15% represented non-concordant genes where the methods disagreed on differential expression status [11].
The proportion of non-concordant genes ranged from 15.1% (Tophat-HTSeq) to 19.4% (Salmon), with alignment-based algorithms generally showing slightly lower non-concordance rates compared to pseudoaligners [11]. Importantly, the majority of these non-concordant genes (over 66%) had relatively small differences in fold change (ΔFC < 1) between methods, while a smaller subset (7.1-8.0% of non-concordant genes) showed substantial discrepancies (ΔFC > 2) [11].
Most notably, each workflow revealed a small but specific set of genes with inconsistent expression measurements that were reproducible across independent datasets [11] [40]. These method-specific inconsistent genes demonstrated significant overlap between MAQCA and MAQCB samples for each workflow and showed significant overlap between different workflows, pointing to systematic discrepancies between quantification technologies rather than random errors [11].
Characteristics of Problematic Gene Sets
Further analysis revealed that the method-specific inconsistent genes shared common molecular characteristics. These genes were typically smaller, had fewer exons, and showed lower expression levels compared to genes with consistent expression measurements across methods [11] [40]. These characteristics potentially contribute to their problematic quantification, as smaller genes with fewer exons provide fewer sequencing reads for quantification, particularly when they are lowly expressed.
The reproducibility of these specific gene set discrepancies across independent datasets suggests they represent inherent limitations of each workflow rather than random noise [11]. This finding has important implications for researchers studying genes with these characteristics, as they may require special validation regardless of the RNA-Seq workflow employed.
Diagram 2: Characteristics and implications of method-specific non-concordant gene sets.
Critical Analysis of Discrepancies
The observed discrepancies between RNA-Seq workflows and qPCR data stem from fundamental differences in both technology and data processing. qPCR measures expression through amplification efficiency and quantification cycle (Cq) values for specific assay targets, providing highly accurate measurements for predefined genes [45]. In contrast, RNA-Seq quantification involves multiple processing steps including read mapping, resolution of multi-mapping reads, and normalization, each introducing potential sources of variation [11] [16].
For alignment-based methods, variations can arise from differences in how aligners handle spliced reads and how quantification tools resolve reads that map to multiple genomic locations [16]. Pseudoaligners, while faster, rely on k-mer matching and transcriptome-based reference indices, which may handle certain gene structures differently [11]. The finding that problematic genes tend to be smaller with fewer exons supports the hypothesis that limited sequence information for quantification contributes to these discrepancies [11].
Impact of Gene Set Correlation Structure
An often-overlooked factor in transcriptomic analysis is the correlation structure within gene sets. Traditional gene set analysis methods often assume gene independence, an assumption that is seriously violated in actual biological systems [46]. Extensive correlation between genes is a well-documented phenomenon, and this correlation can significantly impact statistical assessments of gene set enrichment [46].
Meta-analysis of over 200 datasets from the Gene Expression Omnibus has demonstrated that strong gene correlation patterns are highly consistent across experiments [46]. When gene set testing methods assume independence, they produce inflated false positive rates, particularly for gene sets with high internal correlation [46]. This has direct relevance to the observed discrepancies in RNA-Seq workflow benchmarking, as genes with similar characteristics (small size, few exons) may share correlation structures that affect their quantification consistency across methods.
Implications for Gene Set Analysis Methods
The challenge of inter-gene correlation has led to the development of more sophisticated gene set analysis methods that properly account for these relationships. Approaches like Quantitative Set Analysis of Gene Expression (QuSAGE) address this issue by estimating a variance inflation factor directly from the data and accounting for inter-gene correlations, thereby producing more accurate probability density functions for gene set activity rather than simple p-values [47].
Resampling-based methods that maintain the correlation structure of expression data have also been shown to properly control false positive rates, leading to more parsimonious and high-confidence gene set findings [46]. These methodological advances are particularly important for the accurate interpretation of RNA-Seq data in biomarker discovery and drug development contexts [41] [42].
The Scientist's Toolkit: Research Reagent Solutions
Table 3: Essential Research Reagents and Tools for RNA-Seq/qPCR Benchmarking
| Tool/Reagent | Category | Key Function | Example Use Case |
|---|---|---|---|
| Universal Human Reference RNA | Reference Standard | Provides consistent RNA template for cross-platform comparisons [11] | MAQCA sample in benchmarking studies [11] |
| Human Brain Reference RNA | Reference Standard | Tissue-specific RNA reference with known expression profile [11] | MAQCB sample for differential expression assessment [11] |
| TaqMan qPCR Assays | Validation Technology | Gold-standard quantification for specific targets [11] [45] | Validation of RNA-Seq expression measurements [11] |
| Stranded RNA-Seq Libraries | Sequencing Preparation | Maintains transcript strand information during sequencing | Improved accuracy of transcript quantification |
| UMI Adapters | Sequencing Enhancement | Unique Molecular Identifiers to correct for PCR duplicates | More accurate counting of original RNA molecules |
| ERCC RNA Spike-In Controls | Quality Control | Synthetic RNA controls for quantification assessment | Monitoring technical variation across samples |
| QuSAGE Software | Analysis Tool | Gene set analysis accounting for inter-gene correlations [47] | Accurate pathway analysis of RNA-Seq data [47] |
Implications for Drug Discovery and Development
The findings from this benchmarking case study have profound implications for transcriptomics applications in drug discovery and development. As RNA-Seq analysis becomes increasingly integrated into biomarker discovery and therapeutic target identification, understanding its limitations becomes crucial for proper interpretation of results [41] [42].
In pharmacotranscriptomics—which integrates transcriptomics and pharmacology to discover potential therapeutic targets—the accurate quantification of gene expression is fundamental for understanding disease mechanisms and identifying key signature genes for drug development [41]. The emergence of AI and machine learning approaches that analyze transcriptomic data to discover biomarkers and therapeutic targets further increases the importance of reliable input data [41].
The specific gene set discrepancies identified in this case study highlight the need for careful validation of transcriptomic findings, particularly when studying genes with characteristics that make them prone to quantification inconsistencies (small size, few exons, low expression). This is especially relevant for personalized medicine approaches, where organoid models and single-cell analyses are increasingly used to guide treatment decisions [42].
Furthermore, the integration of RNA-Seq with proteomic studies in drug discovery workflows necessitates accurate transcriptomic data, as discrepancies between mRNA and protein levels are often biologically meaningful rather than technical artifacts [42]. Understanding which mRNA-protein discrepancies reflect genuine biology versus methodological limitations requires robust and validated RNA-Seq quantification methods.
This case study demonstrates that while RNA-Seq workflows generally show high correlation with qPCR data, method-specific discrepancies affect distinct gene sets with reproducible patterns. The characteristics of these problematic genes—smaller size, fewer exons, lower expression—provide guidance for researchers when interpreting results and planning validation experiments.
The implications extend beyond methodological considerations to impact real-world applications in drug discovery and development. As transcriptomic analysis becomes increasingly central to biomarker discovery, target identification, and personalized medicine approaches, recognizing and addressing these limitations becomes essential for deriving biologically meaningful conclusions from RNA-Seq data.
Future directions should focus on developing improved quantification methods that specifically address the challenges posed by problematic gene sets, as well as establishing guidelines for when orthogonal validation is necessary. The integration of AI and machine learning approaches may help identify and correct for systematic biases, further enhancing the utility of RNA-Seq data in both basic research and therapeutic development [41].
Troubleshooting Workflow Performance and Optimizing for Accuracy
In the field of transcriptomics, RNA-Sequencing (RNA-Seq) has emerged as the gold standard for whole-transcriptome gene expression quantification, gradually replacing earlier technologies like microarrays due to its broader dynamic range and superior sensitivity [11]. However, not all genes are equally accessible to this powerful technology. A specific subset of genes characterized by shorter sequence lengths, fewer exons, and lower expression levels presents consistent challenges for accurate quantification and detection across various RNA-Seq workflows. These "problematic gene sets" systematically skew analytical results and can lead to misinterpretation of biological data if not properly accounted for in experimental design and analysis.
The identification and characterization of these problematic genes is particularly crucial when validating RNA-Seq findings against established quantitative PCR (qPCR) benchmarks. Discrepancies between these technologies often cluster within specific gene categories, revealing fundamental methodological constraints that affect data interpretation in fundamental research and drug development. This guide provides a comprehensive comparison of how different RNA-Seq approaches handle these challenging gene sets, with supporting experimental data to inform researchers' methodological selections.
Characteristics and Identification of Problematic Genes
Defining Genomic Features of Problematic Gene Sets
Problematic genes for RNA-Seq analysis share common genomic and structural characteristics that affect their detectability and quantification accuracy. Through systematic benchmarking studies comparing RNA-Seq workflows with whole-transcriptome RT-qPCR expression data, researchers have identified a consistent pattern of genomic traits associated with quantification inconsistencies.
Key genomic traits associated with problematic gene behavior include:
- Shorter gene length: Genes with smaller genomic spans and shorter transcript lengths are consistently problematic across multiple quantification workflows [11].
- Fewer exons: Genes with low exon counts (typically <10 exons) demonstrate higher rates of inconsistent expression measurements between RNA-Seq and qPCR validation [11].
- Lower expression levels: Problematic genes tend to exhibit lower overall expression, complicating accurate quantification due to signal-to-noise ratio challenges [11].
- Higher compactness: Genes with more compact structures, including smaller mean exon sizes, present particular challenges for certain library preparation protocols [48].
A significant benchmarking study revealed that while most genes show high expression correlation between RNA-Seq and qPCR, a specific subset of genes consistently demonstrates inconsistent expression measurements across technologies. These method-specific inconsistent genes are reproducibly identified in independent datasets and share the common characteristics of being smaller, having fewer exons, and showing lower expression compared to genes with consistent expression measurements [11].
Quantitative Analysis of Gene Features Affecting Expression Measurements
Table 1: Genomic Traits Correlated with Gene Expression Levels and Breadths
| Genomic Trait | Correlation with Expression Level | Correlation with Expression Breadth | Statistical Significance |
|---|---|---|---|
| Exon number | -4.9 (Human) / -0.7 (Mouse) | 1.6 (Human) / 4.2 (Mouse) | P < 0.01 (Human) / NS (Mouse) |
| CDS length | -18.2 (Human) / -12.1 (Mouse) | -6.3 (Human) / -3.6 (Mouse) | P < 0.0001 |
| Exon size | -19.2 (Human) / -17.7 (Mouse) | -11.3 (Human) / -11.9 (Mouse) | P < 0.0001 |
| Intron length | -13.4 (Human) / -7.6 (Mouse) | -2.1 (Human) / -2.7 (Mouse) | P < 0.0001 |
| GC content | 3.7-5.5 (Human) / 4.8-9.6 (Mouse) | -2.2-6.4 (Human) / 5.0-12.2 (Mouse) | P < 0.01-0.0001 |
Data derived from multivariate regression analysis of human and mouse transcriptomes showing percentage correlations between genomic traits and expression characteristics [48].
Statistical analyses reveal that gene compactness features, particularly mean exon size and CDS length, show the strongest negative correlations with both expression levels and expression breadth across both human and mouse models [48]. This relationship suggests that the molecular mechanisms regulating gene expression are influenced by structural genomic features that consequently affect RNA-Seq quantification accuracy.
Comparative Performance of RNA-Seq Technologies
Single-Cell vs. Single-Nucleus RNA-Seq Biases
The emergence of single-cell (scRNA-seq) and single-nucleus RNA sequencing (snRNA-seq) has revealed striking technology-specific biases in gene detection capabilities, particularly affecting problematic gene sets. A comprehensive 2023 comparison of paired single-cell and single-nucleus transcriptomes from heart, lung, and kidney tissues demonstrated that the choice of technique significantly impacts RNA capture efficiency for different gene categories [49].
Technology-specific biases include:
- snRNA-seq bias: Efficiently captures genes with longer sequence lengths and roughly >10 exons [49]
- scRNA-seq bias: Better captures shorter genes with fewer exons (<10) at higher rates [49]
- Mitochondrial genes: scRNA-seq more effectively captures mitochondrial and ribosomal protein-coding genes [49]
These disparities in RNA capture directly affect the calculation of basic cellular parameters and downstream functional analysis. When compared to the whole host genome, transcriptomes obtained with both techniques were significantly skewed from expected proportions in coding sequence length, transcript length, genomic span, and distribution of genes based on exon counts [49]. The top differentially expressed genes between the two techniques returned distinctive Gene Ontology terms, confirming that the technical approach affects biological interpretation [49].
RNA-Seq Library Preparation Protocol Performance
The choice of RNA-Seq library preparation protocol profoundly affects data outcomes, with different kits demonstrating specific strengths and weaknesses for particular gene sets. A systematic evaluation of four RNA-Seq kits revealed protocol-specific enrichment patterns that directly impact the recovery of problematic genes [50].
Table 2: RNA-Seq Library Preparation Protocol Performance Characteristics
| Library Prep Protocol | Recommended Input | Strengths | Limitations | Problematic Gene Recovery |
|---|---|---|---|---|
| TruSeq Stranded mRNA | Standard (100ng) | Universal applicability for protein-coding genes; Effective rRNA removal | Poly-A selection bias against non-polyadenylated transcripts | Better for high-expression, high-GC genes |
| TruSeq Stranded Total RNA | Standard (100ng) | Recovers non-coding RNAs; Comprehensive transcriptome coverage | Less effective for degraded samples | Balanced gene recovery |
| NuGEN Ovation v2 | Standard (modified) | Better for longer genes; Suitable for non-coding RNA studies | Less effective rRNA depletion; Lower exonic mapping rates | Favors longer genes |
| SMARTer Ultra Low | Low input | Good for rare transcripts; Effective with minimal RNA | Underrepresents high-GC transcripts; Inferior to TruSeq mRNA at standard input | Variable recovery of low-expression genes |
Performance characteristics of RNA-Seq library preparation protocols based on systematic evaluation [50].
The evaluation demonstrated that at manufacturers' recommended input RNA levels, all library preparation protocols were suitable for distinguishing between experimental groups, but each exhibited unique enrichment patterns. The TruSeq protocols tended to capture genes with higher expression and GC content, whereas the modified NuGEN protocol tended to capture longer genes [50]. These findings highlight the importance of matching library preparation methods to specific research goals, particularly when studying problematic gene sets.
Experimental Methodologies for Benchmarking Studies
Standardized Workflow for RNA-Seq and qPCR Comparison
Robust benchmarking of RNA-Seq workflows against qPCR data requires carefully controlled experimental designs and standardized analysis pipelines. The following methodology has been validated in multiple independent studies to identify characteristics of problematic genes:
Dataset Selection and Processing:
- Utilize well-established reference samples (e.g., MAQCA and MAQCB from MAQC project) with matching RT-qPCR measurements [11] [16]
- Process RNA-Seq reads using multiple workflows (Tophat-HTSeq, Tophat-Cufflinks, STAR-HTSeq, Kallisto, Salmon) for comparative analysis [11]
- Align reads using spliced alignment tools (TopHat v2.0.6) with reference genome assembly (Ensembl GRCh37) [16]
- Apply consistent normalization methods (FPKM or TPM) across all quantification tools for fair comparison [16]
Quality Control Measures:
- Filter genes based on minimal expression (e.g., >0.1 TPM in all samples and replicates) to avoid bias for low-expressed genes [11]
- Calculate mean expression across replicates for stable comparisons
- Remove mitochondrial genes and focus on protein-coding genes for cleaner analysis [49]
- Implement read-depth correction and sample-size balancing (e.g., select 1,000 cells from each technique with same read depth) [49]
Statistical Analysis:
- Calculate expression correlation using Pearson correlation between normalized RT-qPCR Cq-values and log-transformed RNA-seq expression values [11]
- Transform TPM and normalized Cq-values to gene expression ranks to identify outlier genes [11]
- Define rank outlier genes as those with absolute rank difference >5000 between RNA-seq and qPCR [11]
- Perform differential expression analysis using negative binomial generalized linear models [49]
Data Processing and Bioinformatics Workflow
The following diagram illustrates the integrated experimental and computational workflow for identifying problematic genes through RNA-Seq benchmarking:
Table 3: Essential Research Reagents and Computational Tools for Identifying Problematic Genes
| Category | Specific Tool/Reagent | Function | Application Context |
|---|---|---|---|
| Reference Materials | MAQCA (Universal Human Reference RNA) | Standardized reference for cross-platform comparison | Benchmarking study normalization [11] |
| MAQCB (Human Brain Reference RNA) | Tissue-specific reference material | Differential expression benchmarking [11] | |
| ERCC RNA Spike-In Controls | External RNA controls for normalization | Protocol performance assessment [50] | |
| Library Prep Kits | Illumina TruSeq Stranded mRNA | PolyA-selection based library prep | Protein-coding gene focus [50] |
| Illumina TruSeq Stranded Total RNA | rRNA depletion-based library prep | Whole transcriptome applications [50] | |
| NuGEN Ovation v2 | Amplification-based library prep | Low-input and challenging samples [50] | |
| SMARTer Ultra Low RNA Kit | Ultra-low input protocol | Rare transcript detection [50] | |
| Computational Tools | TopHat/STAR | Read alignment to reference genome | Preprocessing for quantification [16] |
| HTSeq/Cufflinks | Read counting and expression estimation | Gene-level quantification [11] [16] | |
| Kallisto/Salmon | Pseudoalignment for quantification | Rapid transcript-level estimation [11] | |
| Seurat | Single-cell RNA-seq analysis | scRNA-seq and snRNA-seq comparisons [49] | |
| g:Profiler/GSEA | Functional enrichment analysis | Biological interpretation of results [51] |
Implications for Transcriptomic Research and Drug Development
The systematic identification and characterization of problematic gene sets has profound implications for research and drug development. Understanding these technical limitations enables researchers to make informed decisions about experimental design and data interpretation strategies.
In drug development pipelines, where transcriptomic signatures often inform target identification and validation, awareness of these problematic genes prevents misinterpretation of crucial data. For example, if a potential drug target falls within a problematic gene category, additional validation using orthogonal methods (such as qPCR) becomes essential before proceeding with development programs [11]. The knowledge that shorter genes with fewer exons are more likely to yield inconsistent results across platforms provides a critical checklist for prioritizing candidate targets.
For basic research applications, particularly in emerging fields like single-cell transcriptomics, understanding the inherent biases of different technologies guides appropriate experimental design. When studying tissues with particular cell types that express high proportions of problematic genes (such as those with short transcripts), researchers can select the most appropriate technology—opting for scRNA-seq over snRNA-seq when targeting short genes, for instance [49]. This strategic approach ensures that biological conclusions reflect actual physiology rather than technical artifacts.
The consistent finding that genomic structural features influence expression quantification suggests fundamental relationships between gene architecture and transcriptional regulation that extend beyond technical considerations [48]. This insight bridges genomic and transcriptomic analysis, providing a more integrated understanding of gene expression regulation that benefits both basic research and applied pharmaceutical development.
Visualizing the Relationship Between Gene Features and Detection Issues
The diagram below illustrates the interconnected characteristics of problematic gene sets and how they influence detection across technologies:
In the realm of transcriptomics, RNA sequencing (RNA-seq) has become the gold standard for whole-transcriptome gene expression quantification [11]. However, the accuracy and reproducibility of its results are profoundly influenced by technical decisions made during the experimental process. As RNA-seq transitions more prominently into clinical diagnostics, ensuring the reliability of its results—particularly for detecting subtle differential expression between similar biological states—becomes paramount [5]. This guide objectively compares the performance of different RNA-seq strategies by framing the evaluation within the broader thesis of benchmarking RNA-seq analysis workflows against qPCR research, the long-established reference for gene expression validation [11]. We will summarize experimental data comparing key commercial kits and methodologies, focusing on the critical wet-lab factors of library preparation, mRNA enrichment, and library strandedness, providing researchers and drug development professionals with a clear basis for selecting optimal protocols for their specific needs.
Kit Performance Comparison: Key Experimental Data
Direct comparisons of library preparation kits reveal performance trade-offs critical for experimental design. The following table summarizes key findings from a published comparative analysis of two FFPE-compatible stranded RNA-seq kits.
Table 1: Performance Comparison of Two FFPE-Compatible Stranded RNA-Seq Kits [52]
| Performance Metric | Kit A: TaKaRa SMARTer Stranded Total RNA-Seq Kit v2 | Kit B: Illumina Stranded Total RNA Prep Ligation with Ribo-Zero Plus |
|---|---|---|
| Required RNA Input | 20-fold less (as low as 10 ng total RNA demonstrated in other studies [53]) | Standard input (e.g., 100ng - 1μg) |
| rRNA Depletion Efficiency | Moderate (17.45% rRNA content) | High (0.1% rRNA content) |
| Alignment Performance | Lower percentage of uniquely mapped reads | Higher percentage of uniquely mapped reads |
| Intronic Mapping | Lower (35.18%) | Higher (61.65%) |
| Exonic Mapping | Comparable (8.73%) | Comparable (8.98%) |
| Duplication Rate | Higher (28.48%) | Lower (10.73%) |
| Gene Expression Concordance | High (Over 83% overlap in differentially expressed genes with Kit B) | High (Over 91% overlap in differentially expressed genes with Kit A) |
| Pathway Analysis Concordance | High (16/20 upregulated and 14/20 downregulated pathways overlapped) | High (16/20 upregulated and 14/20 downregulated pathways overlapped) |
A separate, customer-conducted study further supports these findings, demonstrating that Takara Bio and Illumina kits yielded consistent and comparable sequencing metrics for standard human RNA control samples (MAQC HURR and HBRR), with strong correlations (R² >0.8) to established MAQC-generated qPCR data [53]. The SMARTer kit also showed high efficiency, producing data from 10 ng of high-quality mouse RNA that correlated strongly (R² >0.9) with data generated from 1 µg of input using an Illumina poly(A)-enrichment kit [53].
Detailed Experimental Protocols
To interpret comparison data accurately, understanding the underlying experimental methodologies is essential. Below are the protocols for the key experiments cited in this guide.
- Sample Origin: RNA was identically isolated from 6 FFPE tissue samples from a cohort of melanoma patients treated with Nivolumab.
- Sample Quality Assessment: RNA integrity was assessed via DV200 values, which ranged from 37% to 70%. No samples with DV200 < 30% (indicating excessive degradation) were included.
- Library Preparation: For each RNA sample, two separate libraries were prepared:
- Kit A (TaKaRa): Utilized the SMARTer Stranded Total RNA-Seq Kit v2.
- Kit B (Illumina): Utilized the Stranded Total RNA Prep Ligation with Ribo-Zero Plus.
- Sequencing: All libraries were sequenced on an Illumina platform to generate high-quality paired-end reads.
- Data Analysis:
- Read Quality: Phred quality scores were calculated.
- Alignment & Mapping: Reads were aligned to the reference genome, and percentages of reads mapping to exons, introns, intergenic regions, and rRNA were determined.
- Differential Expression: Differentially expressed genes (DEGs) were identified by comparing three randomly selected samples against three others, separately for each kit's dataset.
- Concordance Assessment: Overlap of DEGs and enriched pathways (using KEGG database) between the two kits was calculated.
- Reference Materials: The study used a panel of well-characterized RNA samples, including:
- Quartet RNA Reference Materials: Four samples from a family with small, clinically relevant biological differences.
- MAQC RNA Reference Materials (MAQCA and MAQCB): Two samples with large biological differences.
- ERCC Spike-in Controls: Synthetic RNAs spiked into samples for absolute quantification.
- Distributed Experimentation: A total of 24 RNA samples (including technical replicates) were distributed to 45 independent laboratories.
- Real-World Workflows: Each laboratory prepared sequencing libraries using its in-house experimental protocol (covering 26 distinct processes) and analysis pipeline (140 distinct pipelines).
- Sequencing and Data Collection: Over 120 billion reads from 1080 libraries were generated.
- Performance Assessment:
- Data Quality: Signal-to-Noise Ratio (SNR) based on Principal Component Analysis (PCA).
- Accuracy: Correlation of gene expression measurements with "ground truth" from Quartet and MAQC TaqMan reference datasets and ERCC spike-in ratios.
- Reproducibility: Consistency of results across laboratories and pipelines.
Impact of Experimental Factors: Visualization
The multi-center benchmarking study [5] systematically evaluated how different factors influence RNA-seq outcomes. The following diagram illustrates the core experimental workflow and the key factors identified as major sources of variation.
The multi-center study concluded that the factors of mRNA enrichment and strandedness were primary sources of inter-laboratory variation in gene expression measurements [5]. These experimental choices significantly impact the accuracy and reproducibility of downstream results, especially when trying to detect subtle differential expression.
The Scientist's Toolkit: Research Reagent Solutions
Table 2: Essential Reagents and Kits for RNA-Seq Workflows
| Product Name | Primary Function | Key Application Note |
|---|---|---|
| SMARTer Stranded Total RNA-Seq Kit v2 (TaKaRa) | Stranded RNA-seq library prep from total RNA with rRNA depletion. | Ideal for low-input (as low as 10 ng) and degraded samples (e.g., FFPE) [52] [53]. |
| Stranded Total RNA Prep Ligation with Ribo-Zero Plus (Illumina) | Stranded RNA-seq library prep with ribosomal RNA depletion. | Provides high rRNA depletion efficiency and superior alignment performance [52]. |
| TruSeq RNA Sample Preparation Kit v2 (Illumina) | RNA-seq library prep utilizing poly(A) enrichment of mRNA. | Requires higher input RNA (e.g., 1 µg) and is less suitable for degraded samples [53]. |
| ERCC Spike-in Controls | Synthetic RNA controls spiked into samples. | Enables absolute quantification and assessment of technical performance across experiments [5]. |
| RiboGone - Mammalian (TaKaRa) | rRNA depletion module. | Used in conjunction with library prep kits to remove ribosomal RNA [53]. |
| Universal Human Reference RNA (UHRR) | Standardized control RNA from multiple cell lines. | Used for protocol benchmarking and cross-platform performance comparison (e.g., MAQC study) [11] [53]. |
The selection of an RNA-seq library preparation method is a critical decision that directly impacts data quality and biological interpretation. Evidence shows that while different modern stranded kits like TaKaRa's SMARTer and Illumina's Stranded Total RNA Prep can produce highly concordant gene expression and pathway analysis results [52], they exhibit distinct performance trade-offs. The choice often boils down to prioritizing input requirement versus library complexity and mapping efficiency. For precious or limited samples such as FFPE tissues, a kit with superior low-input performance is advantageous [52]. For standard samples where input is not a constraint, a kit with higher rRNA depletion and unique mapping rates may be preferred. Furthermore, large-scale benchmarking confirms that technical factors, including the choice of mRNA enrichment method and strandedness, are major contributors to variability in real-world settings [5]. Therefore, aligning the kit's strengths with the specific sample type and research question, while adhering to rigorous quality control using reference materials like the Quartet or MAQC samples, is essential for generating robust and reliable RNA-seq data in both research and drug development.
The translation of RNA sequencing (RNA-seq) from a research tool into clinical and drug development applications demands rigorous benchmarking to ensure reliability and reproducibility. A foundational approach for this validation involves comparing RNA-seq results against quantitative PCR (qPCR) data, long considered the gold standard for gene expression quantification. This guide objectively compares the performance of various trimming, alignment, and normalization strategies, framing the evaluation within the context of benchmarking against qPCR data. The insights are critical for researchers, scientists, and drug development professionals who require robust and accurate transcriptomic analysis.
Performance Benchmarking of RNA-seq Workflows vs. qPCR
Independent benchmarking studies consistently reveal high concordance between RNA-seq and qPCR, though the choice of bioinformatics workflow can influence the results.
Table 1: Performance Comparison of RNA-seq Quantification Tools Against qPCR
| Quantification Tool | Expression Correlation with qPCR (R²) | Fold Change Correlation with qPCR (R²) | Root-Mean-Square Deviation (RMSD) | Key Characteristics |
|---|---|---|---|---|
| HTSeq | 0.827 [11] | 0.934 [11] | Highest [16] | Count-based; high correlation but potentially higher deviation. |
| Salmon | 0.845 [11] | 0.929 [11] | Information Missing | Pseudoalignment; fast, transcript-level quantification. |
| Kallisto | 0.839 [11] | 0.930 [11] | Information Missing | Pseudoalignment; fast, transcript-level quantification. |
| Cufflinks | 0.798 [11] | 0.927 [11] | Information Missing | Alignment-based; estimates isoform-level FPKM. |
| RSEM | Information Missing | Information Missing | Lower [16] | Expectation-Maximization algorithm; accurate for low-expression genes. |
| IsoEM | Information Missing | Information Missing | Lower [16] | Expectation-Maximization algorithm; uses base quality scores. |
A comprehensive study processing data from well-established MAQC reference samples with five different workflows found that while all methods showed high gene expression and fold change correlations with qPCR data, a significant portion of genes (15-19%) showed non-concordant differential expression status between RNA-seq and qPCR [11]. The alignment-based method Tophat-HTSeq yielded the lowest fraction of non-concordant genes (15.1%), whereas the pseudoaligner Salmon showed the highest (19.4%) [11]. These inconsistent genes were typically smaller, had fewer exons, and were lower expressed, necessitating careful validation when they are of interest [11] [40].
Impact of Normalization Methods on Analysis Outcomes
The choice of normalization method is a critical parameter that can significantly impact downstream analysis, more so than the specific differential expression method used in some cases [54]. Methods are broadly classified into within-sample and between-sample normalization.
Table 2: Comparison of RNA-seq Normalization Methods
| Normalization Method | Type | Key Principle | Performance in Differential Expression | Performance in Metabolic Model Building |
|---|---|---|---|---|
| TMM | Between-sample | Trims extreme log fold changes; assumes most genes are not DE [55]. | Robust performance; considered a top method [54]. | Low variability in model size; accurate capture of disease genes [55]. |
| RLE (DESeq2) | Between-sample | Median of ratios; similar assumption to TMM [55]. | Robust performance; considered a top method [54]. | Low variability in model size; accurate capture of disease genes [55]. |
| GeTMM | Between-sample | Combines gene-length correction with TMM-like normalization [55]. | Information Missing | Low variability in model size; accurate capture of disease genes [55]. |
| TPM | Within-sample | Corrects for gene length and sequencing library size [55]. | Information Missing | High variability in model size; identifies more affected reactions/pathways [55]. |
| FPKM | Within-sample | Similar to TPM, but intended for paired-end data [55]. | Information Missing | High variability in model size; identifies more affected reactions/pathways [55]. |
A benchmark evaluating normalization methods for building genome-scale metabolic models (GEMs) found that between-sample methods like TMM, RLE, and GeTMM produced models with low variability and more accurately captured disease-associated genes [55]. In contrast, within-sample methods like TPM and FPKM resulted in highly variable model sizes and identified a larger number of potentially false positive metabolic reactions [55]. Recent advancements propose adaptive normalization methods, such as an adaptive TMM that uses Jaeckel's estimator to automatically determine the optimal trimming factor from the data, potentially improving robustness [54].
Experimental Protocols for Benchmarking
Benchmarking with MAQC/SEQC Reference Samples
A widely adopted protocol involves using commercially available reference RNA samples from the MicroArray/Sequencing Quality Control (MAQC/SEQC) consortium.
- Samples: Universal Human Reference RNA (UHRR, MAQCA) and Human Brain Reference RNA (HBRR, MAQCB) [11] [16].
- Spike-ins: External RNA Control Consortium (ERCC) spike-in mixes can be added to provide ratio-based ground truth [5].
- qPCR Validation: A pre-designed, wet-lab validated qPCR assay targeting all protein-coding genes (e.g., 18,080 genes) serves as the benchmark [11].
- Procedure: Total RNA from reference materials is split for parallel RNA-seq library preparation (including various protocols and replicates) and qPCR analysis. RNA-seq data is then processed through multiple bioinformatics workflows for comparison [5] [11].
Multi-Laboratory Study Design
For large-scale benchmarking, a multi-laboratory approach can be employed.
- Procedure: A set of stable reference materials (e.g., Quartet project samples) is distributed to dozens of independent laboratories [5].
- Decentralized Analysis: Each lab uses its in-house experimental protocols (e.g., different mRNA enrichment, library strandedness) and bioinformatics pipelines for RNA-seq analysis [5].
- Data Integration: Centralized analysis assesses inter-laboratory variation and identifies technical factors that most significantly impact results, such as mRNA enrichment protocols and specific bioinformatics steps [5].
Workflow Visualization and Optimization Strategies
Standard RNA-seq Analysis Workflow
The following diagram outlines the key stages in an RNA-seq analysis workflow where parameter optimization is critical.
Optimization Strategies for Key Steps
Trimming and Quality Control: While foundational, the trimming step can be optimized. Tools like fastp have been shown to significantly enhance data quality and improve subsequent alignment rates [7]. The specific parameters for trimming should be determined based on the quality control report of the raw data rather than using default values [7].
Alignment and Quantification: The selection of alignment and quantification tools should be guided by the experimental goal. For standard gene-level differential expression analysis, pipelines like STAR-HTSeq or pseudoaligners like Kallisto and Salmon show strong concordance with qPCR [11] [40]. For specialized applications, such as estimating expression for highly polymorphic genes like HLA, HLA-tailored pipelines that account for allelic diversity are essential for accurate quantification [21].
Addressing Technical Variation: In real-world multi-center studies, experimental factors like mRNA enrichment protocols and library strandedness emerge as primary sources of variation [5]. Adhering to standardized, best-practice experimental protocols is as crucial as bioinformatics optimization.
The Scientist's Toolkit: Key Research Reagents and Materials
Table 3: Essential Materials for RNA-seq Benchmarking Experiments
| Item | Function / Role in Benchmarking | Example / Note |
|---|---|---|
| Reference RNA Samples | Provides a stable, well-characterized biological standard for cross-platform and cross-laboratory comparisons. | MAQC UHRR and HBRR [11]; Quartet project reference materials [5]. |
| ERCC Spike-in Controls | Synthetic RNA mixes with known concentrations provide a built-in "ground truth" for assessing quantification accuracy and dynamic range [5]. | 92 ERCC RNA Spike-in Mix. |
| Whole-Transcriptome qPCR Assays | Serves as the orthogonal validation method (gold standard) for RNA-seq-derived expression levels and fold changes. | Commercially available panels targeting all protein-coding genes. |
| RNA Extraction & Library Prep Kits | Isolate high-quality RNA and convert it into sequencing-ready libraries. Performance can vary between kits. | Multiple kits from different manufacturers are often tested in benchmarking studies [5]. |
| High-Throughput Sequencer | Generates the raw sequencing reads (FASTQ files) from the prepared libraries. | Platforms from Illumina, BGI, PacBio, etc. |
| Computational Resources | Essential for running the data-intensive bioinformatics workflows, from alignment to differential expression. | High-performance computing (HPC) clusters or cloud computing services. |
Benchmarking RNA-seq workflows against qPCR data provides an essential framework for optimizing bioinformatics parameters. Evidence indicates that while most modern workflows show high overall concordance with qPCR, specific choices matter: alignment-based quantification like HTSeq may offer slight advantages for certain gene sets, and between-sample normalization methods like TMM and RLE provide more robust outcomes for downstream applications like metabolic modeling than within-sample methods. The path to optimal performance involves using well-characterized reference materials, understanding the strengths and limitations of each tool in the pipeline, and validating results for critical low-expressed or polymorphic genes. This rigorous, evidence-based approach ensures that RNA-seq data is reliable and reproducible, meeting the high standards required for scientific research and drug development.
Best Practices for Filtering Low-Expression Genes to Improve DE Results
In RNA sequencing (RNA-seq) analysis, accurate differential expression (DE) detection is crucial for drawing meaningful biological conclusions. A critical step in this process is the filtering of low-expression genes, which are often indistinguishable from technical noise and can severely compromise the sensitivity and precision of DE analysis. This guide synthesizes evidence from multiple benchmarking studies that utilize qPCR-validated RNA-seq data to objectively compare the impact of various filtering strategies. The systematic removal of low-expression genes is not merely a pre-processing step but a vital procedure that increases the total number of detectable differentially expressed genes (DEGs) and enhances both the true positive rate and the positive predictive value of the results [56].
Why Filter Low-Expression Genes?
The presence of low-expression genes in an RNA-seq dataset introduces significant noise. These genes, often measured with high technical variability, can obscure true biological signals and reduce the statistical power of DE detection tools [56] [57].
- Increased Sensitivity and Precision: Research shows that appropriate filtering increases both the sensitivity (true positive rate) and precision (positive predictive value) of DEG detection. By removing the noisiest genes, the true signal from genuinely differentially expressed genes becomes more pronounced [56].
- Maximizing DEG Discovery: One study demonstrated that by removing approximately 15% of genes with the lowest average read counts, researchers could identify 480 more DEGs than without any filtering [56]. This directly translates to more biological insights from the same data.
Comparison of Filtering Methods and Their Performance
Various statistical approaches can be used to determine which genes should be filtered. The table below summarizes the most common methods and their performance characteristics as benchmarked against qPCR data.
Table 1: Performance of Low-Expression Gene Filtering Methods
| Filtering Method | Description | Performance Insights | Key Considerations |
|---|---|---|---|
| Average Read Count | Filters genes based on the mean raw read count across all samples. [56] | Considered an ideal method; achieves high combined sensitivity and precision (F1 score) when filtering <20% of genes. [56] | The optimal threshold can be set by maximizing the number of detected DEGs. [56] |
| Counts Per Million (CPM) | Filters genes based on the count scaled by the total number of sequenced fragments. [56] | Correlates well with qPCR measurements. [16] | Equivalent to RPKM without length normalization. [56] |
| Data-Driven Noise Removal (RNAdeNoise) | Models count data as a mixture of negative binomial (signal) and exponential (noise) distributions; subtracts the estimated noise. [57] | Significantly increases the number of detected DEGs, provides more significant p-values, and shows no bias against low-count genes. [57] | A robust method that avoids subjective threshold setting; suitable for different sequencing technologies. [57] |
| Fixed Threshold | Applies a universal minimum count threshold (e.g., 5, 10, or 32 reads). [57] | A common but subjective approach; performance depends heavily on the chosen threshold. [57] | May be inefficient as it does not adapt to the specific noise level of each dataset. [57] |
| Minimum Read Count | Filters a gene if its count in any single sample falls below a threshold. [56] | Not recommended; can incorrectly filter genes that are highly expressed in one condition but not another. [56] | Risks removing genuine, condition-specific DEGs. [56] |
| LODR (Limit of Detection Ratio) | Derived from spike-in control RNAs; defines the minimum count for a gene to be detectable with a specific fold-change. [56] | Can be overly strict, filtering out many true DEGs. [56] | Best used for assessing whether sequencing depth is adequate for the study's goals rather than for filtering. [56] |
Experimental Protocols for Benchmarking
To provide a reliable comparison of the filtering methods, the cited studies employed rigorous benchmarking protocols using well-established reference samples and qPCR validation.
Benchmarking Dataset (MAQC/SEQC)
A cornerstone of these benchmarking efforts is the use of the MicroArray Quality Control (MAQC) or Sequencing Quality Control (SEQC) consortium data.
- Samples: Universal Human Reference RNA (UHRR, sample A) and Human Brain Reference RNA (HBRR, sample B). [56] [11] [16]
- RNA-seq Data: Multiple biological and technical replicates were sequenced (e.g., Illumina Genome Analyzer, 36bp reads). [16]
- qPCR "Ground Truth": A transcriptome-wide qPCR dataset measuring 20,801 genes from the same samples A and B. Genes with a four-fold difference in expression between A and B were defined as true DEGs. [56] [11] This high stringency ensures a robust benchmark.
RNA-seq Analysis Workflows
The RNA-seq data was processed through multiple analysis pipelines to ensure findings were not dependent on a single software tool. A generalized workflow is depicted below.
Evaluation Metrics
The performance of pipelines with different filtering strategies was assessed by comparing their DEG lists to the qPCR ground truth using standard metrics:
- True Positive Rate (TPR/Sensitivity): The proportion of true DEGs correctly identified by the RNA-seq pipeline. [56]
- Positive Predictive Value (PPV/Precision): The proportion of genes identified as DEGs by the RNA-seq pipeline that are true DEGs. [56]
- F1 Score: The harmonic mean of sensitivity and precision, providing a single metric for overall performance. [56]
Key Findings and Data-Driven Recommendations
Optimal Filtering Threshold is Pipeline-Specific
There is no universal count threshold that works best for all analysis pipelines. The optimal filtering stringency is significantly influenced by the choice of transcriptome annotation (Refseq vs. Ensembl), the quantification method (e.g., HTSeq vs. featureCounts), and the DEG detection tool (e.g., edgeR, DESeq2, limma-voom). [56] Therefore, a one-size-fits-all approach should be avoided.
A Practical Workflow for Determining the Threshold
In the absence of a qPCR validation set for one's own data, a robust and data-driven strategy is to identify the filtering threshold that maximizes the number of detected DEGs in the experiment. Research has shown that this threshold is closely correlated with the threshold that maximizes the true positive rate against qPCR data. [56]
Performance Across Profiled Workflows
The table below consolidates quantitative results from studies that evaluated full RNA-seq workflows, including their inherent handling of low-expression genes, against qPCR data.
Table 2: qPCR Validation Performance of RNA-seq Workflows
| RNA-seq Analysis Workflow | Expression Correlation with qPCR (R²) | Fold-Change Concordance with qPCR | Notes |
|---|---|---|---|
| Salmon | 0.845 [11] | ~85% genes consistent [11] | Pseudoalignment-based; fast and efficient. |
| Kallisto | 0.839 [11] | ~85% genes consistent [11] | Pseudoalignment-based; fast and efficient. |
| Tophat-HTSeq | 0.827 [11] | ~85% genes consistent [11] | Alignment-based; a traditional pipeline. |
| STAR-HTSeq | 0.821 [11] | ~85% genes consistent [11] | Alignment-based; uses the fast STAR aligner. |
| Tophat-Cufflinks | 0.798 [11] | ~85% genes consistent [11] | Can perform transcript-level quantification. |
The Scientist's Toolkit
Table 3: Essential Reagents and Resources for Benchmarking
| Item | Function in Experiment | Example Source / Product |
|---|---|---|
| Reference RNA Samples | Provides consistent, biologically defined materials for method benchmarking. | Universal Human Reference RNA (UHRR), Human Brain Reference RNA (HBRR) [56] [11] |
| Spike-in Control RNAs | Adds known quantities of exogenous transcripts to help estimate technical noise and limit of detection. | ERCC Spike-in Control Mixes [56] |
| Whole-Transcriptome qPCR Assays | Serves as a gold-standard validation method to define "true" expression and differential expression. | TaqMan Gene Expression Assays [11] [31] |
| Strand-Specific RNA Library Kit | Prepares sequencing libraries that preserve strand information, improving accuracy of transcript assignment. | TruSeq Stranded Total RNA Kit [31] |
Filtering low-expression genes is a non-negotiable step in a robust RNA-seq differential expression analysis workflow. Evidence from qPCR-validated benchmarking studies consistently shows that appropriate filtering enhances both the sensitivity and precision of DEG detection. While the average read count method is a reliable and widely applicable choice, data-driven approaches like RNAdeNoise offer a powerful alternative by objectively determining the noise level in each dataset. Crucially, there is no single optimal threshold for all scenarios; the best practice is to determine a threshold that maximizes DEG detection for your specific data and analytical pipeline. By adopting these evidence-based filtering strategies, researchers can ensure their RNA-seq analyses yield more accurate, reliable, and biologically meaningful results.
Systematic Validation and Comparative Performance Across Platforms
The translation of RNA-sequencing (RNA-seq) from a research tool into clinical diagnostics necessitates rigorous demonstration of its reliability and consistency across different laboratories [5]. Clinically relevant biological differences—such as those between disease subtypes or stages—often manifest as subtle variations in gene expression profiles that can be challenging to distinguish from technical noise inherent to RNA-seq methodologies [5]. Prior quality assessment initiatives have predominantly relied on reference materials with large biological differences, which may not adequately ensure accurate identification of these subtle differential expressions [5]. This limitation underscores the necessity for more sensitive benchmarking approaches that reflect real-world diagnostic challenges.
Recent large-scale studies have revealed significant inter-laboratory variations in RNA-seq performance, particularly when detecting subtle differential expression [5]. These findings highlight the profound influence of both experimental execution and bioinformatics analysis on data quality and reproducibility. Within this context, systematic benchmarking emerges as an indispensable tool for identifying sources of variability, establishing best practices, and ultimately ensuring that RNA-seq can fulfill its promise as a robust clinical technology. This review synthesizes evidence from major benchmarking studies to evaluate current RNA-seq performance and provide guidance for researchers and clinicians relying on transcriptomic data.
Methodological Frameworks for Large-Scale Benchmarking
Reference Materials and Study Designs
Comprehensive RNA-seq benchmarking requires well-characterized reference materials with established "ground truth" for validation. Leading approaches utilize two primary types of reference samples: the MAQC reference materials (MAQC A and B) derived from cancer cell lines and brain tissues with large biological differences, and the Quartet reference materials from immortalized B-lymphoblastoid cell lines with intentionally subtle inter-sample differences [5]. The Quartet project introduced multi-omics reference materials derived from a Chinese quartet family, providing well-characterized, homogenous, and stable RNA samples that better reflect the challenges of detecting clinically relevant subtle differential expression [5].
The most extensive benchmarking effort to date involved 45 independent laboratories using Quartet and MAQC reference samples spiked with ERCC controls [5]. This study generated over 120 billion reads from 1080 RNA-seq libraries, representing a comprehensive assessment of real-world RNA-seq performance [5]. Each laboratory employed distinct RNA-seq workflows, encompassing variations in RNA processing methods, library preparation protocols, sequencing platforms, and bioinformatics pipelines, thereby accurately mirroring the diversity of actual research practices [5]. This design introduced multiple types of ground truth, including three reference datasets (Quartet reference datasets, TaqMan datasets for Quartet and MAQC samples) and "built-in truth" involving ERCC spike-in ratios and known mixing ratios for constructed samples [5].
Orthogonal Validation Approaches
Orthogonal validation methods are crucial for establishing accurate performance assessments. The most robust benchmarking studies employ multiple validation approaches, including:
- Whole-transcriptome RT-qPCR: Still considered the gold standard for validation, RT-qPCR provides reliable expression data for protein-coding genes. Studies have aligned transcripts detected by qPCR with those considered for RNA-seq quantification to enable direct comparison [11].
- ERCC Spike-in Controls: Synthetic RNA controls with known concentrations spiked into samples enable assessment of absolute quantification accuracy [5].
- RNase R Treatment: This exonuclease degrades linear RNA while generally leaving circRNAs intact, serving as a validation method for circular RNA detection [58].
- Amplicon Sequencing: Provides targeted sequencing validation for specific transcript features [58].
Table 1: Key Orthogonal Validation Methods in RNA-Seq Benchmarking
| Validation Method | Application | Key Metric | Limitations |
|---|---|---|---|
| Whole-transcriptome RT-qPCR | Gene expression validation | Concordance of expression levels and fold changes | Limited to known transcripts; different technical principles |
| ERCC Spike-in Controls | Absolute quantification assessment | Correlation with known concentrations | Synthetic sequences may not reflect biological RNA behavior |
| RNase R Treatment | Circular RNA validation | Resistance to exonuclease digestion | Some long circRNAs may be sensitive to RNase R |
| Amplicon Sequencing | Targeted transcript validation | Sequencing confirmation of specific features | Limited to pre-selected targets |
Performance Metrics and Evaluation Criteria
Benchmarking studies employ multiple metrics for robust characterization of RNA-seq performance. A comprehensive assessment framework typically includes [5]:
- Data Quality: Signal-to-noise ratio (SNR) based on principal component analysis (PCA) to evaluate the ability to distinguish biological signals from technical noise in replicates.
- Quantification Accuracy: Assessment of absolute and relative gene expression measurements using correlation coefficients with established reference datasets.
- Detection Reliability: Evaluation of differentially expressed genes (DEGs) based on reference datasets, focusing on both sensitivity and precision.
- Technical Reproducibility: Consistency of results across technical replicates, laboratories, and experimental batches.
These metrics collectively capture different aspects of gene-level transcriptome profiling, enabling a multidimensional assessment of RNA-seq performance [5]. For circular RNA detection, additional metrics include precision (median of 98.8%, 96.3% and 95.5% for qPCR, RNase R and amplicon sequencing, respectively) and sensitivity, which varies significantly between tools [58].
Diagram 1: Comprehensive RNA-Seq Benchmarking Workflow. This diagram illustrates the integrated approach used in large-scale multi-center benchmarking studies, encompassing reference materials, laboratory processing, bioinformatics analysis, orthogonal validation, and multi-dimensional performance assessment.
Performance Across RNA-Seq Workflows: Comparative Analysis
Gene Expression Quantification
Multiple studies have systematically compared RNA-seq workflows against whole-transcriptome RT-qPCR data to assess quantification accuracy. A landmark study evaluating five representative workflows (Tophat-HTSeq, Tophat-Cufflinks, STAR-HTSeq, Kallisto, and Salmon) demonstrated high gene expression correlations with qPCR data across all methods [11]. The alignment-based methodologies (Tophat-HTSeq, Tophat-Cufflinks, STAR-HTSeq) and pseudoalignment algorithms (Salmon, Kallisto) showed comparable performance in expression correlation, with Pearson correlation coefficients ranging from R² = 0.798 (Tophat-Cufflinks) to R² = 0.845 (Salmon) [11].
When comparing gene expression fold changes between MAQCA and MAQCB samples, approximately 85% of genes showed consistent results between RNA-seq and qPCR data [11]. High fold change correlations were observed for all workflows (Pearson, Salmon R² = 0.929, Kallisto R² = 0.930, Tophat-Cufflinks R² = 0.927, Tophat-HTSeq R² = 0.934, Star-HTseq R² = 0.933), suggesting nearly identical performance for differential expression analysis [11]. Notably, comparisons between Tophat-HTSeq and Star-HTSeq revealed almost identical results (R² = 0.994), indicating minimal impact of the mapping algorithm on quantification [11].
Table 2: Performance Comparison of RNA-Seq Analysis Workflows Against qPCR Benchmark
| Analysis Workflow | Methodology Type | Expression Correlation (R²) | Fold Change Correlation (R²) | Non-concordant Genes |
|---|---|---|---|---|
| Salmon | Pseudoalignment | 0.845 | 0.929 | 19.4% |
| Kallisto | Pseudoalignment | 0.839 | 0.930 | 18.2% |
| Tophat-HTSeq | Alignment-based | 0.827 | 0.934 | 15.1% |
| Star-HTSeq | Alignment-based | 0.821 | 0.933 | 15.3% |
| Tophat-Cufflinks | Alignment-based | 0.798 | 0.927 | 17.8% |
Detection of Differentially Expressed Genes
The fraction of non-concordant genes (where RNA-seq and qPCR disagree on differential expression status) ranges from 15.1% to 19.4% across workflows [11]. Importantly, the majority of these non-concordant genes (over 66%) show relatively small differences in fold change (ΔFC < 1) between methods, and 93% have ΔFC < 2 [11]. Only a small fraction (approximately 1.8%) of genes show severe non-concordance with fold changes > 2, and these are typically lower expressed and shorter genes [11] [59].
Alignment-based algorithms consistently demonstrated a lower fraction of non-concordant genes compared to pseudoaligners [11]. This pattern suggests methodological differences may impact performance for specific gene sets. The small but significant set of method-specific inconsistent genes were reproducibly identified in independent datasets and characterized by typically smaller size, fewer exons, and lower expression levels compared to genes with consistent expression measurements [11].
Circular RNA Detection Tools
Beyond conventional gene expression analysis, large-scale benchmarking has also been applied to specialized RNA-seq applications such as circular RNA detection. A comprehensive evaluation of 16 circRNA detection tools revealed substantial variation in their outputs, with tools detecting between 1,372 and 58,032 circRNAs in the same datasets [58]. While precision was generally high across tools (median of 98.8%, 96.3% and 95.5% for qPCR, RNase R and amplicon sequencing validation, respectively), sensitivity varied dramatically [58].
CircRNA detection tools employ different computational strategies, including pseudo-reference-based approaches that rely on known exon annotations and fragmented-based approaches that reassemble unmapped reads without prior annotation [58]. These methodological differences significantly impact detection capabilities, particularly for novel circRNAs not represented in existing annotations. Integrative tools that combine results from multiple detection methods can increase sensitivity but may require additional validation [58].
Experimental Factors
Large-scale multi-center studies have identified several experimental factors as primary sources of inter-laboratory variation in RNA-seq performance. The most significant factors include [5]:
- mRNA Enrichment Methods: Different approaches for enriching mRNA from total RNA (e.g., poly-A selection vs. ribosomal RNA depletion) introduce substantial variability in transcript coverage and detection.
- Library Strandedness: Strand-specific versus non-stranded library preparation protocols affect the accuracy of transcript assignment and quantification.
- Batch Effects: Sequencing libraries across different flow cells or lanes introduces technical variation that can confound biological signal detection.
- Platform Differences: While less impactful than other factors, variations between sequencing platforms contribute to inter-laboratory differences.
These experimental factors collectively influence the ability to detect subtle differential expression, with greater inter-laboratory variations observed for Quartet samples with small biological differences compared to MAQC samples with large differences [5]. The reduced biological differences among mixed samples led to a further decrease in average signal-to-noise ratio values, highlighting the particular challenge of distinguishing subtle expression differences from technical noise [5].
Bioinformatics Pipelines
Bioinformatics analysis introduces another major source of variability in RNA-seq results. Studies examining 140 different analysis pipelines comprised of various gene annotations, genome alignment tools, quantification methods, and differential analysis tools have revealed that each bioinformatics step contributes significantly to inter-laboratory variation [5]. Key factors include:
- Gene Annotation Sources: Different reference annotations vary in transcript representation and boundaries.
- Normalization Methods: Approaches for accounting for technical variability impact cross-sample comparisons.
- Differential Expression Algorithms: Statistical methods for identifying significantly changed genes.
- Quality Control Filters: Thresholds for excluding low-quality samples or low-expression genes.
The choice of bioinformatics pipeline particularly affects performance for low-abundance genes and subtle expression differences [5]. This underscores the importance of standardized processing approaches and careful parameter selection, especially for clinical applications requiring high sensitivity and reproducibility.
Table 3: Essential Research Reagents and Resources for RNA-Seq Benchmarking
| Resource Type | Specific Examples | Function/Purpose | Key Characteristics |
|---|---|---|---|
| Reference Materials | Quartet reference samples, MAQC reference samples | Provide ground truth for performance assessment | Well-characterized, stable, with established reference data |
| Spike-in Controls | ERCC RNA Spike-in Mix | Enable absolute quantification assessment | Known concentrations, synthetic sequences |
| Library Prep Kits | Stranded mRNA kits, rRNA depletion kits | Convert RNA to sequencing-ready libraries | Varying in strandedness, input requirements, bias |
| Validation Assays | Whole-transcriptome RT-qPCR, RNase R treatment | Orthogonal confirmation of RNA-seq findings | Different technological principles from RNA-seq |
| Bioinformatics Tools | Alignment (STAR, Tophat), Quantification (HTSeq, Kallisto) | Extract biological signals from raw data | Varying algorithms, sensitivity, computational requirements |
Best Practice Recommendations
Experimental Design Guidelines
Based on comprehensive benchmarking evidence, the following experimental design practices are recommended for reliable RNA-seq studies:
- Reference Material Integration: Include well-characterized reference materials like Quartet or MAQC samples in each batch to monitor technical performance and enable cross-study comparisons [5].
- Spike-in Controls: Utilize ERCC or similar spike-in controls to assess quantification accuracy and detect technical biases [5].
- Replication Strategy: Implement both technical and biological replication to distinguish technical variability from biological variation.
- Batch Balancing: Distribute experimental conditions across sequencing batches to avoid confounding biological effects with technical batch effects [5].
These practices are particularly crucial for studies aiming to detect subtle expression differences, as these are more susceptible to technical noise and inter-laboratory variability [5].
Bioinformatics Best Practices
Benchmarking studies support the following bioinformatics recommendations:
- Pipeline Selection: Choose analysis workflows demonstrated to have high concordance with orthogonal validation methods for your specific application [11].
- Low-expression Filtering: Implement appropriate filtering strategies for low-expression genes, which show higher rates of non-concordance between methods [11] [59].
- Normalization Approach: Select normalization methods appropriate for your study design, considering factors like library size differences and composition biases.
- Multi-tool Approaches: For applications like circRNA detection, consider using multiple complementary tools to increase detection sensitivity [58].
Evidence suggests that when all experimental and computational steps follow state-of-the-art practices, RNA-seq results are generally reliable and may not require systematic validation by qPCR for most genes [59]. However, orthogonal validation remains valuable when studies hinge on expression differences of a few genes, especially if these genes are lowly expressed or show small fold changes [59].
Quality Assessment and Reporting
Comprehensive quality assessment should include:
- Signal-to-Noise Evaluation: Calculate PCA-based SNR values using reference samples to quantify the ability to distinguish biological signals from technical noise [5].
- Reference Dataset Correlation: Assess correlation with established reference datasets where available.
- Inter-laboratory Comparison: Participate in community-wide benchmarking efforts to identify laboratory-specific biases.
Minimum information guidelines should be followed for both RNA-seq (MINSEQE) and any orthogonal validation methods (MIQE for qPCR) to ensure reproducibility and proper interpretation of results [59]. Transparent reporting of all methodological details, including any deviations from standard protocols, is essential for evaluating data quality and comparing results across studies.
Large-scale multi-center benchmarking studies have fundamentally advanced our understanding of RNA-seq performance in real-world scenarios. The evidence demonstrates that while RNA-seq generally provides accurate and reproducible gene expression measurements, significant inter-laboratory variability exists—particularly for detecting subtle differential expression with clinical relevance. Both experimental factors and bioinformatics pipelines contribute substantially to this variability, underscoring the need for standardized best practices and rigorous quality control.
Future developments in reference materials, assay protocols, and computational methods will continue to enhance the reliability and clinical utility of RNA-seq. The benchmarking frameworks and recommendations outlined here provide a foundation for improving data quality, enabling more confident translation of transcriptomic findings into clinical applications, and guiding the evolution of RNA-seq technologies toward more robust and standardized implementation across diverse laboratory settings.
Comparative Analysis of Workflow Performance on Absolute vs. Relative Quantification
The accurate quantification of gene expression is a cornerstone of modern molecular biology, with profound implications for basic research, drug development, and clinical diagnostics. Two principal methodological approaches—absolute and relative quantification—have emerged, each with distinct strengths, limitations, and optimal applications. Absolute quantification determines the exact number of target nucleic acid molecules in a sample, providing concrete copy numbers, while relative quantification measures changes in gene expression relative to a reference sample or control gene [60]. The choice between these approaches significantly impacts experimental outcomes, data interpretation, and biological conclusions.
Within the context of benchmarking RNA-Seq analysis workflows with qPCR research, this comparative guide objectively evaluates the performance of these quantification methodologies. Reverse transcription quantitative polymerase chain reaction (RT-qPCR) remains the gold standard for targeted gene expression analysis due to its practical nature, sensitivity, and specificity [61]. Meanwhile, RNA sequencing (RNA-Seq) has become the predominant method for whole-transcriptome analysis [11] [7]. Understanding how these technologies perform across different quantification paradigms is essential for researchers, scientists, and drug development professionals seeking to implement robust, reliable gene expression analyses in their work.
This article synthesizes evidence from multiple benchmarking studies to provide a comprehensive performance comparison of absolute and relative quantification workflows. We present structured experimental data, detailed methodologies, and practical recommendations to guide researchers in selecting appropriate quantification strategies based on their specific research questions and experimental requirements.
Performance Comparison of Quantification Methods
Key Characteristics of Absolute and Relative Quantification
| Characteristic | Absolute Quantification | Relative Quantification |
|---|---|---|
| Fundamental Principle | Direct measurement of exact target molecule count | Measurement of expression changes relative to a reference |
| Requires Standards/Calibrators | Digital PCR: No; Standard Curve: Yes [60] | Yes (typically endogenous control genes) |
| Primary Output | Copy number/concentration [62] | Fold-change/difference relative to calibrator [60] |
| Optimal Applications | Viral load quantification, rare allele detection, determining absolute copy number [60] | Gene expression studies in response to stimuli, comparative transcriptomics [60] |
| Tolerance to Inhibitors | Digital PCR: High [60] | Standard curve method: Moderate; Comparative CT: Variable |
| Throughput Considerations | Digital PCR: Lower due to partitioning requirement [60] | Comparative CT method: Higher, no standard curve wells needed [60] |
| Dynamic Range | Digital PCR: 1-100,000 copies/20µl reaction [60] | Broad, but depends on reference gene stability and target abundance |
Performance Metrics Across Methodologies
| Performance Metric | RNA-Seq (Relative) | qPCR (Relative) | Digital PCR (Absolute) |
|---|---|---|---|
| Expression Correlation | High correlation with qPCR (R² ~0.80-0.85) [11] | Gold standard for relative expression | High precision for absolute counts [60] |
| Fold-Change Concordance | ~85% genes consistent with qPCR [11] [40] | Reference method | Not typically used for fold-change determination |
| Sensitivity to Low Abundance Targets | Challenging for low-expression genes [11] | Excellent sensitivity | Superior for rare targets and complex mixtures [60] |
| Impact of Reference Gene | Not applicable | Critical source of variation if unstable [63] [62] | Not required [60] |
| Multi-site Reproducibility | High variation for subtle differential expression [5] | Generally high | High precision determined by number of replicates [60] |
| Accuracy for Absolute Measurements | Does not provide accurate absolute measurements [64] | Requires reference genes for relative measurements | Provides absolute counts without standards [60] |
Experimental Protocols and Methodologies
Stable Gene Combination Protocol for qPCR Normalization
A novel method for improving relative quantification in qPCR utilizes stable combinations of non-stable genes identified from RNA-Seq databases, outperforming traditional reference genes [63]. The protocol involves:
- RNA-Seq Database Selection: Identify a comprehensive RNA-Seq database containing a wide range of conditions relevant to your experimental design (e.g., TomExpress for tomato studies) [63].
- Target Gene Mean Calculation: Calculate the mean expression of your target gene across the selected RNA-Seq dataset.
- Candidate Gene Pool Extraction: Extract a pool of N genes (empirically set to 500) with the smallest mean expressions greater than or equal to the target gene's mean expression [63].
- Gene Combination Analysis: Calculate all geometric and arithmetic profiles of k genes (k-gene combinations). The geometric mean is used for expression level criteria, while the arithmetic mean is used for variance calculations [63].
- Optimal Combination Selection: Select the optimal set of k genes based on two criteria: (1) geometric k-gene mean expression ≥ target gene mean expression, and (2) the lowest variance among all arithmetic k-genes [63].
- Experimental Validation: Validate the selected gene combination using established qPCR analysis tools (e.g., geNorm, NormFinder, BestKeeper) [63].
RNA-Seq Workflow Benchmarking Protocol
Benchmarking studies comparing RNA-Seq workflows to qPCR data typically follow this methodology:
- Reference Sample Selection: Use well-characterized RNA reference samples such as MAQCA (Universal Human Reference RNA) and MAQCB (Human Brain Reference RNA) [11] [5].
- RNA-Seq Data Processing: Process RNA-Seq reads using multiple bioinformatics workflows. Commonly benchmarked workflows include:
- qPCR Validation: Generate whole-transcriptome qPCR expression data using wet-lab validated assays for all protein-coding genes [11].
- Data Alignment: Align transcripts detected by qPCR with transcripts considered for RNA-Seq quantification, calculating gene-level TPM values for transcript-based workflows [11].
- Performance Assessment: Evaluate workflows based on:
- Expression correlation (Pearson correlation between RNA-Seq and qPCR)
- Fold-change correlation between samples
- Fraction of concordant vs. non-concordant genes in differential expression [11]
Digital PCR Protocol for Absolute Quantification
For absolute quantification using digital PCR (ddPCR):
- Sample Partitioning: Divide the PCR reaction into thousands of nanodroplets, creating individual reaction chambers [62].
- Amplification: Amplify the target gene within the nanodroplets using standard PCR reagents and thermal cycling conditions.
- Endpoint Measurement: Read the fluorescence signal of each individual droplet after amplification, categorizing droplets as positive (containing target) or negative (no target) [62] [60].
- Absolute Quantification: Apply Poisson statistics to the ratio of positive to negative droplets to determine the absolute concentration of target molecules in the original sample, without reference to standards or endogenous controls [60].
- Quality Control: Use low-binding plastics throughout experimental setup to minimize sample loss, and optimize sample dilution to ensure meaningful data [60].
Workflow Diagrams
Figure 1: Decision workflow for implementing absolute versus relative quantification methodologies, highlighting key procedural differences and optimal applications for each approach.
Figure 2: Benchmarking framework for evaluating RNA-Seq analysis workflows against qPCR data, demonstrating the multi-laboratory approach and performance assessment methodology used in large-scale validation studies.
The Scientist's Toolkit: Essential Research Reagents and Materials
Table 1: Key research reagents and solutions for quantification workflows
| Reagent/Solution | Primary Function | Application Notes |
|---|---|---|
| Reference RNA Samples (MAQCA/MAQCB) | Well-characterized RNA materials for workflow benchmarking and quality control | Essential for cross-platform and cross-laboratory comparisons; available from SEQC/MAQC consortium [11] [5] |
| ERCC Spike-in Controls | Synthetic RNA controls with known concentrations for normalization assessment | Spiked into samples to evaluate technical performance and quantification accuracy [5] |
| Stable Gene Combinations | Multiple non-stable genes that balance each other's expression across conditions | Outperforms traditional reference genes; identified from RNA-Seq databases [63] |
| Low-Binding Plastics/Tubes | Minimize nucleic acid adhesion during sample preparation | Critical for digital PCR to prevent sample loss that would skew absolute quantification [60] |
| Validated qPCR Assays | Target-specific primers and probes for gene expression validation | Required for whole-transcriptome qPCR benchmarking; should detect specific transcript subsets [11] |
| Digital PCR Reaction Mixes | Reagents for partitioning and amplifying target molecules | Form stable water-oil emulsions for nanodroplet generation; compatible with target detection chemistry [62] |
The comparative analysis of workflow performance reveals that the choice between absolute and relative quantification must be guided by specific research objectives, rather than assuming universal superiority of either approach. Relative quantification methods, particularly when employing stable gene combinations identified from RNA-Seq data [63], provide excellent performance for comparative gene expression studies where fold-change determination is sufficient. However, these methods depend critically on reference gene stability and are susceptible to variability when experimental conditions affect reference gene expression [62].
Absolute quantification approaches, particularly digital PCR, offer significant advantages when exact molecule counting is required, such as in viral load quantification, rare allele detection, or clinical diagnostic applications where threshold values must be established [60]. The independence from reference genes and high tolerance to inhibitors make digital PCR particularly valuable for complex sample matrices. However, this approach typically offers lower throughput and requires specialized equipment.
Benchmarking studies consistently demonstrate that RNA-Seq workflows provide high correlation with qPCR data for relative expression measurements, with approximately 85% of genes showing consistent results between platforms [11] [40]. However, significant inter-laboratory variations emerge, particularly when detecting subtle differential expression [5]. Furthermore, neither RNA-Seq nor microarrays provide accurate absolute measurements of gene expression [64], highlighting a fundamental limitation of these high-throughput technologies.
For researchers and drug development professionals, these findings suggest several best practices:
- Employ absolute quantification (digital PCR) when exact copy numbers are required for clinical decision-making or when working with complex samples containing PCR inhibitors.
- Implement stable gene combinations rather than single reference genes for relative quantification to improve normalization accuracy.
- Use standardized reference materials and spike-in controls across laboratories to improve reproducibility, particularly in multi-center studies.
- Validate RNA-Seq findings for specific gene sets that typically show inconsistent measurements—particularly smaller genes with fewer exons and lower expression levels [11].
In conclusion, both absolute and relative quantification methodologies have distinct and complementary roles in modern gene expression analysis. Understanding their performance characteristics, limitations, and optimal applications enables researchers to select appropriate workflows based on their specific research questions, ultimately leading to more reliable and biologically meaningful results.
Assessing Accuracy in Detecting Subtle Differential Expression for Clinical Applications
In clinical research and diagnostic development, the ability to accurately detect subtle differential gene expression is paramount for identifying robust biomarkers, understanding disease mechanisms, and developing targeted therapies. Unlike pronounced expression differences observed in distinct tissue types or disease states, subtle differential expression characterizes minor but biologically significant transcriptomic variations—such as those between disease subtypes, treatment response groups, or early pathological stages. These subtle patterns are technically challenging to distinguish from background technical noise, yet they often hold crucial clinical implications.
The establishment of RNA-seq as the predominant tool for transcriptome profiling has necessitated rigorous benchmarking against established quantitative methods like quantitative PCR (qPCR), long considered the "gold standard" for gene expression quantification. This comparison is particularly critical in clinical applications, where reliable detection of minor expression changes can directly impact diagnostic accuracy and treatment decisions. The MicroArray Quality Control (MAQC) and Sequencing Quality Control (SEQC) consortia have pioneered large-scale efforts to assess transcriptomic technologies, while more recent initiatives like the Quartet project have specifically addressed the challenge of accurately detecting subtle differential expression. Understanding the performance characteristics, limitations, and optimal application conditions of these technologies provides the foundation for their reliable implementation in clinical settings.
Performance Comparison Between RNA-seq and qPCR
Key Characteristics and Capabilities
Table 1: Fundamental comparison of RNA-seq and qPCR technologies for gene expression analysis
| Feature | qPCR | RNA-seq |
|---|---|---|
| Discovery Power | Limited to known, pre-defined targets | Hypothesis-free; detects novel transcripts, isoforms, and fusion genes |
| Throughput | Low to moderate (typically ≤ 20 targets) | High (entire transcriptome) |
| Dynamic Range | ~7-8 logs | >5 logs of dynamic range |
| Sensitivity | Can detect single copies | Enhanced sensitivity for rare transcripts and lowly expressed genes |
| Absolute vs. Relative Quantification | Both possible, though typically relative | Primarily relative (though some methods enable absolute) |
| Technical Reproducibility | High (CV typically < 10%) | Moderate to high (dependent on workflow) |
| Multiplexing Capability | Limited without specialized approaches | inherently multiplexed |
| Cost per Sample | Lower for limited targets | Higher, though cost-effective for genome-wide coverage |
qPCR operates by amplifying and quantifying targeted cDNA sequences using sequence-specific probes or dyes, providing exceptional sensitivity and reproducibility for measuring predefined targets [65]. This technology is ideally suited for focused validation studies where high precision for a limited number of targets is required. In contrast, RNA-seq employs massively parallel sequencing of the entire transcriptome, capturing both known and novel transcriptional activity without prior target selection [65]. This comprehensive profiling capability makes RNA-seq particularly valuable for discovery-phase research and complex clinical phenotypes where the underlying transcriptomic alterations may be multifactorial or poorly characterized.
Quantitative Performance Metrics
Table 2: Correlation between RNA-seq and qPCR expression measurements across benchmarking studies
| Study | Sample Type | RNA-seq Processing Workflow | Correlation with qPCR (R²/Pearson) | Key Findings |
|---|---|---|---|---|
| BMC Immunology (2023) [21] | Human PBMCs | HLA-tailored pipeline | ρ = 0.20-0.53 (HLA class I genes) | Moderate correlation; highlights challenges with polymorphic genes |
| Scientific Reports (2017) [11] | MAQC reference samples | Salmon | R² = 0.845 | High expression correlation across workflows |
| Kallisto | R² = 0.839 | Consistent high performance among pseudoaligners | ||
| TopHat-Cufflinks | R² = 0.798 | Slightly lower but still strong correlation | ||
| TopHat-HTSeq | R² = 0.827 | Performance similar to alignment-based methods | ||
| EMBC Proceedings (2013) [16] | Human brain and cell lines | HTSeq | R² = 0.89 (highest correlation) | Highest correlation but also greatest deviation from qPCR |
| Cufflinks, RSEM, IsoEM | R² = 0.85-0.89 | Slightly lower correlation but potentially higher accuracy |
When evaluating relative expression measurements (fold-changes between samples), multiple studies have demonstrated strong concordance between RNA-seq and qPCR. A comprehensive benchmarking study reported fold-change correlations ranging from R² = 0.927 to 0.934 across five different RNA-seq processing workflows when compared to qPCR [11]. This indicates that despite differences in absolute quantification, RNA-seq reliably recovers biologically relevant expression differences. The high reproducibility of relative expression measurements across laboratories and platforms has been consistently demonstrated in large consortium studies, supporting the use of RNA-seq for differential expression analysis in clinical research [66].
However, important limitations exist for both technologies in providing accurate absolute measurements. Systematic biases have been observed in all transcriptomic methods, including both RNA-seq and qPCR, necessitating careful normalization and validation approaches [66]. Gene-specific biases can arise from various factors including GC content, transcript length, and amplification efficiency, highlighting the importance of using spike-in controls and reference materials for quality control, particularly in clinical applications [66] [5].
Experimental Designs for Method Benchmarking
Reference Materials and Study Designs
Robust benchmarking of transcriptomic technologies requires well-characterized reference materials with built-in "ground truths" that enable objective performance assessment. The most widely adopted reference samples have been developed through the MAQC/SEQC consortium efforts, including:
- Universal Human Reference RNA (UHRR, MAQC A): A pool of total RNA from 10 human cell lines [66] [5]
- Human Brain Reference RNA (HBRR, MAQC B): Total RNA from brain tissues of 23 donors [66] [5]
- Defined Mixtures: Samples C (3:1 A:B) and D (1:3 A:B) with known expression ratios [66]
- ERCC Spike-in Controls: 92 synthetic exogenous RNA transcripts added at known concentrations and ratios [66] [5]
More recently, the Quartet project has developed reference materials from immortalized B-lymphoblastoid cell lines derived from a Chinese quartet family, specifically designed to model subtle differential expression patterns more representative of clinical diagnostic challenges [5]. These materials exhibit significantly fewer differentially expressed genes compared to the MAQC samples, providing a more rigorous testbed for assessing analytical sensitivity in clinically relevant scenarios.
Large-scale consortium studies have implemented sophisticated experimental designs to comprehensively evaluate technical performance. The SEQC project employed a multi-site, cross-platform design in which reference samples were distributed to multiple independent laboratories for profiling using different sequencing platforms (Illumina HiSeq, SOLiD, Roche 454) and microarray technologies, with comparison to extensive qPCR datasets (>20,000 PrimePCR reactions) [66]. Similarly, a recent Quartet project study engaged 45 independent laboratories using their respective in-house protocols to generate RNA-seq data from over 1,000 libraries, representing the most extensive effort to date to characterize real-world performance variations [5].
Standardized Experimental Protocols
Diagram 1: Integrated workflow for benchmarking RNA-seq against qPCR showing key experimental and computational phases
Sample Preparation and Library Construction
The standard benchmarking protocol begins with RNA extraction from reference materials using validated kits (e.g., Qiagen RNeasy) followed by rigorous quality assessment using methods such as Bioanalyzer or TapeStation analysis [21]. For the MAQC and Quartet reference materials, ERCC spike-in controls are added at known concentrations prior to library preparation, enabling subsequent evaluation of technical performance [66] [5].
Library preparation methodologies vary significantly across studies and can substantially impact results. Common approaches include:
- Poly-A Enrichment: Selection of mRNA using poly-T oligonucleotides, most suitable for protein-coding genes
- Ribosomal RNA Depletion: Removal of ribosomal RNA, enabling retention of non-coding RNAs
- Stranded vs. Non-stranded Protocols: Preservation of strand information improves transcript annotation accuracy
The SEQC project found that both mRNA enrichment method and strandedness significantly influenced expression measurements, with stranded protocols generally providing more accurate gene-level quantification [5]. After library preparation, sequencing is typically performed on Illumina platforms (e.g., HiSeq, MiSeq, NextSeq) with varying read lengths (50-150bp) and depths (10-100 million reads per sample), with deeper sequencing enabling detection of lower abundance transcripts [65] [66].
qPCR Validation Methods
qPCR validation typically employs TaqMan assays or SYBR Green chemistry with carefully designed, transcript-specific primers. The MAQC-I study established a robust qPCR framework using 1,000 TaqMan assays, while subsequent studies have expanded to >20,000 PrimePCR reactions [66]. Critical considerations for qPCR validation include:
- Primer Specificity: Validation of amplification efficiency and absence of primer-dimers or non-specific products
- Reference Gene Selection: Use of multiple stable reference genes for normalization
- Technical Replication: Minimum of three technical replicates per sample
- Standard Curves: Implementation for absolute quantification when required
Data analysis employs the comparative Cq method (ΔΔCq) for relative quantification, with proper quality control including assessment of amplification efficiency, melt curve analysis (for SYBR Green), and normalization to reference genes [11].
Analysis of Factors Influencing Detection Accuracy
Bioinformatics Pipelines and Their Impact
Table 3: Performance characteristics of common RNA-seq quantification tools based on benchmarking studies
| Tool | Methodology | Correlation with qPCR (R²) | Strengths | Limitations |
|---|---|---|---|---|
| HTSeq | Count-based using feature coordinates | 0.89 (highest correlation) [16] | Simple, reproducible | Discards multimapping reads; gene-level only |
| Kallisto | Pseudoalignment with k-mer matching | 0.839 [11] | Fast; transcript-level quantification | Limited sensitivity for low-abundance transcripts |
| Salmon | Dual-phase: mapping and EM optimization | 0.845 [11] | Accurate; fast; bias correction | Complex parameter optimization |
| RSEM | Expectation-Maximization algorithm | 0.85-0.89 [16] | Comprehensive statistical model | Computationally intensive |
| Cufflinks | Assembly-based with flow analysis | 0.798 [11] | Transcript assembly and discovery | Higher false positive rate for isoforms |
The choice of bioinformatics pipelines significantly influences RNA-seq quantification accuracy. Benchmarking studies have evaluated numerous analytical workflows encompassing alignment tools (STAR, TopHat, HISAT2), quantification methods (HTSeq, featureCounts, Salmon, Kallisto), and normalization approaches (TPM, FPKM, TMM). A key finding across studies is that while no single method universally outperforms all others, certain strategies consistently yield more reliable results [11] [16] [5].
The normalization approach critically impacts accurate differential expression detection, particularly for subtle expression changes. Methods employing TMM (Trimmed Mean of M-values) or median ratio normalization have demonstrated superior performance compared to simple reads per kilobase million (RPKM/FPKM) approaches, especially when dealing with compositionally different transcriptomes [11]. For clinical applications where detection of subtle expression changes is paramount, incorporation of spike-in controlled normalization (e.g., using ERCC controls) provides the most robust approach for controlling technical variability [66] [5].
Technical and Biological Factors Affecting Sensitivity
Multiple technical parameters influence the ability to detect subtle differential expression:
- Sequencing Depth: While 10-20 million reads may suffice for highly expressed transcripts, detection of low-abundance transcripts or subtle fold-changes requires 50-100 million reads or more [66]
- Read Length: Longer reads (75-150bp) improve mapping accuracy, particularly for transcript isoform resolution
- Batch Effects: Technical artifacts introduced during sample processing represent a major confounding factor, requiring careful experimental design and statistical correction [5]
- Gene Annotation Quality: Comprehensive annotations (e.g., AceView, GENCODE) significantly improve mapping rates and detection sensitivity compared to basic annotations (RefSeq) [66]
Biological characteristics of target genes also significantly impact detection reliability:
- Gene Expression Level: Low-abundance transcripts show greater technical variability and reduced detection power for subtle differences [11]
- Transcript Length: Shorter transcripts typically show higher quantification variability due to fewer sampling events
- Gene Family Complexity: Genes with high sequence similarity to paralogs (e.g., HLA genes) present particular challenges for both RNA-seq and qPCR [21]
Recent large-scale assessments have revealed that inter-laboratory variations are substantially greater when detecting subtle differential expression compared to large-fold changes, highlighting the critical importance of standardized protocols and quality control measures for clinical applications [5].
The Scientist's Toolkit: Essential Research Reagents and Materials
Table 4: Key reagents and reference materials for differential expression benchmarking studies
| Category | Specific Product/Resource | Application Purpose | Performance Notes |
|---|---|---|---|
| Reference RNA Materials | MAQC A (UHRR) and B (HBRR) | Inter-laboratory standardization and performance assessment | Well-characterized; large transcriptomic differences [66] |
| Quartet Project Reference Materials | Assessment of subtle differential expression detection | Small biological differences; clinically relevant [5] | |
| Spike-in Controls | ERCC RNA Spike-In Mix | Normalization, sensitivity assessment, and limit of detection | 92 synthetic transcripts with known concentrations [66] |
| RNA Extraction Kits | Qiagen RNeasy | High-quality RNA isolation from multiple sample types | Maintains RNA integrity; minimal genomic DNA contamination [21] |
| Library Prep Kits | Illumina Stranded mRNA Prep | Library construction with strand specificity | Preserves strand information; improves transcript annotation [65] |
| qPCR Reagents | TaqMan Gene Expression Assays | Target-specific amplification and quantification | High specificity; pre-validated assays available [66] |
| SYBR Green Master Mix | Cost-effective detection with melt curve analysis | Requires rigorous primer validation | |
| RNA Quality Assessment | Agilent Bioanalyzer RNA kits | RNA integrity number (RIN) determination | Critical quality control step before library prep |
The rigorous benchmarking of RNA-seq against qPCR has yielded several critical insights for clinical application. First, while qPCR remains the method of choice for targeted analysis of a limited number of biomarkers in clinical validation studies, RNA-seq provides superior utility in discovery-phase research and complex diagnostic scenarios requiring comprehensive transcriptome profiling [65]. The demonstrated reproducibility of RNA-seq across laboratories and platforms supports its potential for clinical implementation, though this requires strict standardization of protocols and analytical pipelines [66] [5].
For clinical applications focusing on detection of subtle differential expression, recent evidence suggests that quality assessment based solely on reference materials with large transcriptomic differences (e.g., MAQC samples) is insufficient [5]. The Quartet project has demonstrated that materials with clinically relevant, subtle expression differences reveal substantial inter-laboratory variability that is not apparent when using more dissimilar samples. This highlights the necessity of implementing fit-for-purpose quality control materials that match the analytical challenges of specific clinical applications.
As regulatory frameworks for complex molecular diagnostics continue to evolve, the extensive benchmarking data generated by the MAQC/SEQC consortia and Quartet project provide critical foundation for establishing performance standards and validation requirements. The demonstrated reliability of RNA-seq for differential expression analysis, when appropriately controlled and processed, supports its growing integration into clinical diagnostics, particularly for applications requiring comprehensive transcriptomic assessment that extends beyond the capabilities of targeted technologies like qPCR.
Diagram 2: Performance characteristics for pronounced versus subtle differential expression detection, highlighting different standardization requirements
A Practical Framework for Selecting and Validating an RNA-Seq Pipeline for Your Research
Translating RNA sequencing into reliable biological insights and clinical diagnostics requires ensuring the consistency and accuracy of its results, particularly when detecting subtle differential expressions between different disease subtypes or stages [5]. Dozens of tools and workflows are available for RNA-seq data analysis, each with distinct strengths, weaknesses, and performance characteristics [67] [68]. Without systematic validation, researchers risk drawing erroneous conclusions based on technical artifacts rather than true biological signals.
The process of benchmarking informatics workflows against known standards provides an empirical foundation for selecting analytical tools [69]. This guide leverages whole-transcriptome RT-qPCR expression data as a gold standard for validation, offering a practical framework for researchers to evaluate and select the optimal RNA-seq pipeline for their specific research context [40]. By implementing the recommended validation strategies, scientists can significantly enhance the reliability of their transcriptome studies and ensure their findings reflect genuine biological phenomena.
Experimental Design for Benchmarking
Reference Materials and Ground Truths
Establishing a robust benchmarking study begins with well-characterized reference samples that provide multiple types of "ground truth" for validation. Two primary reference resources have been extensively used:
MAQC Reference Samples: Originally developed by the MicroArray/Sequencing Quality Control Consortium from ten cancer cell lines (MAQC A) and brain tissues of 23 donors (MAQC B), these samples feature significantly large biological differences between sample groups [5].
Quartet Reference Materials: Derived from immortalized B-lymphoblastoid cell lines from a Chinese quartet family, these samples exhibit small inter-sample biological differences that more closely mimic the subtle differential expressions observed between disease subtypes or stages [5].
These reference samples can be spiked with External RNA Control Consortium (ERCC) synthetic RNA controls to provide additional built-in truth measurements [5]. For clinical applications, commercially available reference standards containing thousands of variants across different genomic contexts provide comprehensive analytical validation [70].
Orthogonal Validation with RT-qPCR
Real-time quantitative PCR (RT-qPCR) remains the gold standard for gene expression analysis due to its high sensitivity, specificity, and reproducibility [71]. When used for RNA-seq validation, RT-qPCR requires careful selection of reference genes that demonstrate stable expression across the biological conditions being studied [71].
Tools like Gene Selector for Validation (GSV) facilitate the identification of optimal reference and variable candidate genes from RNA-seq data based on expression stability and level, filtering out stable low-expression genes that are unsuitable for RT-qPCR normalization [71]. The selection criteria include expression in all libraries, low variability between libraries (standard variation <1), absence of exceptional expression in any library, high expression level (average log2 TPM >5), and low coefficient of variation (<0.2) [71].
Performance Metrics and Statistical Evaluation
A comprehensive benchmarking framework should employ multiple metrics to evaluate different aspects of pipeline performance:
Data Quality: Signal-to-noise ratio based on principal component analysis can discriminate the ability to distinguish biological signals from technical noise [5].
Expression Accuracy: Pearson correlation coefficients between RNA-seq measurements and orthogonal validation data (TaqMan RT-qPCR) assess quantification accuracy [5] [16].
Differential Expression Performance: Root-mean-square deviation between RNA-seq and RT-qPCR fold changes evaluates the accuracy of differential expression detection [16].
Technical Reproducibility: Coefficient of variation across technical replicates measures precision [72].
These metrics collectively provide a multi-faceted assessment of pipeline performance, revealing how different tools balance sensitivity, accuracy, and reproducibility.
Comparative Performance of RNA-Seq Workflows
Pipeline Architecture Comparison
RNA-seq analysis involves multiple processing stages, each with several tool options. The table below summarizes the primary workflows discussed in the benchmarking literature:
Table 1: RNA-Seq Analysis Workflows and Component Tools
| Workflow Name | Alignment/Quantification | Differential Expression | Key Characteristics |
|---|---|---|---|
| Tophat-HTSeq | Tophat (alignment) + HTSeq (quantification) | DESeq2/edgeR | Traditional alignment-based approach |
| Tophat-Cufflinks | Tophat (alignment) + Cufflinks (quantification) | Cuffdiff | Transcript-focused analysis |
| STAR-HTSeq | STAR (alignment) + HTSeq (quantification) | DESeq2/edgeR | Fast splicing-aware alignment |
| Kallisto | Kallisto (pseudoalignment) | DESeq2/edgeR | Fast, alignment-free quantification |
| Salmon | Salmon (pseudoalignment) | DESeq2/edgeR | Bias-corrected lightweight alignment |
Research indicates that while most workflows show high gene expression correlations with qPCR data (typically R² values of 0.85-0.89), each reveals a small but specific gene set with inconsistent expression measurements [16] [40]. These method-specific inconsistent genes are typically smaller, have fewer exons, and show lower expression compared to genes with consistent expression measurements [40].
Tool-Specific Performance Profiles
Alignment and Quantification Tools
STAR vs. HISAT2: STAR emphasizes ultra-fast alignment with substantial memory usage, making it ideal for large mammalian genomes when sufficient RAM is available. HISAT2 uses a hierarchical indexing strategy that lowers memory requirements while maintaining competitive accuracy, preferable for constrained computational environments [68].
Salmon vs. Kallisto: These pseudoalignment tools provide dramatic speedups and reduced storage needs compared to traditional alignment-based approaches. Kallisto is praised for simplicity and speed, while Salmon incorporates additional bias correction modules that can improve accuracy in complex libraries [68].
HTSeq vs. RSEM vs. Cufflinks: Evaluation against RT-qPCR measurements reveals that HTSeq exhibits the highest correlation (up to R²=0.89) but may produce greater deviation from absolute expression values. RSEM and Cufflinks might not correlate as well but can produce expression values with higher accuracy for certain applications [16].
Differential Expression Tools
DESeq2: Uses negative binomial models with empirical Bayes shrinkage for dispersion and fold-change estimation, providing stable estimates especially with modest sample sizes [67] [68].
edgeR: Also employs negative binomial distributions but emphasizes efficient estimation and flexible design matrices, making it ideal for well-replicated studies [67] [68].
Limma-voom: Transforms counts to continuous data with observation-level weights that enable sophisticated linear modeling, excelling in large sample cohorts and complex experimental designs [67] [68].
Table 2: Performance Comparison of Differential Expression Tools
| Tool | Optimal Use Case | Strengths | Considerations |
|---|---|---|---|
| DESeq2 | Small-n studies, default choice | Stable variance estimation, user-friendly workflows | Conservative with low counts |
| edgeR | Well-replicated experiments, complex contrasts | Computational efficiency, flexible dispersion modeling | Requires more statistical expertise |
| Limma-voom | Large cohorts, multi-factor designs | Powerful linear modeling framework | Less ideal for very small sample sizes |
Experimental Factors Influencing Performance
Large-scale multi-center studies reveal that both experimental and bioinformatics factors significantly impact RNA-seq results [5]:
Experimental Factors: mRNA enrichment protocols, library strandedness, and sequencing depth introduce substantial variability. Batch effects from processing samples across different flowcells or lanes can further compromise data quality [5].
Bioinformatics Factors: Each step in the analysis pipeline—including read trimming, alignment parameters, gene annotation sources, and normalization methods—contributes to inter-laboratory variation. Studies have evaluated 26 different experimental processes and 140 bioinformatics pipelines to quantify these effects [5].
Species-Specific Considerations: Current RNA-seq analysis software often uses similar parameters across different species without considering species-specific differences. Performance variations have been observed when analyzing data from humans, animals, plants, and fungi, highlighting the importance of domain-specific optimization [7].
A Practical Validation Protocol
Step-by-Step Validation Framework
Implementing a systematic validation protocol ensures reliable RNA-seq results:
Reference Sample Selection: Choose appropriate reference materials (MAQC for large expression differences, Quartet for subtle differences) that best mimic your experimental conditions [5].
Orthogonal Validation Design: Select 10-20 genes representing different expression levels and functionalities for RT-qPCR validation. Use tools like GSV to identify optimal reference genes specifically stable for your biological system [71].
Pipeline Comparison: Run your data through 2-3 candidate pipelines that represent different methodological approaches (e.g., alignment-based vs. pseudoalignment) [40].
Performance Assessment: Calculate correlation coefficients with RT-qPCR data, focusing on both absolute expression levels and fold-change comparisons between conditions [16].
Error Analysis: Identify genes with inconsistent measurements across pipelines and prioritize them for additional validation. These typically include low-expressed genes with fewer exons [40].
Visualization of the Validation Workflow
The following diagram illustrates the comprehensive validation framework integrating experimental and computational components:
Reagent and Computational Solutions
Table 3: Essential Research Reagents and Resources for RNA-Seq Validation
| Resource Type | Specific Examples | Function in Validation |
|---|---|---|
| Reference Samples | MAQC A/B, Quartet samples, ERCC spike-ins | Provide ground truth for benchmarking |
| Nucleic Acid Isolation Kits | AllPrep DNA/RNA Mini Kit, Maxwell RSC kits | Ensure high-quality input material |
| Library Preparation | TruSeq stranded mRNA kit, SureSelect XTHS2 | Generate sequencing libraries |
| Sequencing Platforms | Illumina NovaSeq 6000 | Produce raw sequencing data |
| Validation Reagents | TaqMan assays, SYBR Green master mixes | Enable orthogonal qPCR validation |
| Computational Resources | High-performance computing clusters, Cloud platforms | Enable pipeline comparisons |
Implementation Guidelines
Context-Specific Pipeline Selection
The optimal RNA-seq pipeline depends on specific research contexts:
Clinical Diagnostics: Prioritize pipelines with demonstrated reproducibility across laboratories and rigorous validation using samples with subtle differential expressions [5]. Implement comprehensive quality control metrics including signal-to-noise ratio assessments [5].
Novel Organism Studies: When working with non-model organisms, emphasize alignment-free approaches like Salmon or Kallisto that don't require comprehensive genomic annotations [68]. Consider species-specific optimization of analytical parameters [7].
Large Cohort Studies: For studies with hundreds of samples, consider the computational efficiency of Limma-voom for differential expression analysis [68]. Pseudoalignment tools can significantly reduce processing time and storage requirements [68].
Small Pilot Studies: With limited replicates, DESeq2's stable variance estimation provides more reliable results [67] [68]. Invest in more comprehensive RT-qPCR validation to compensate for limited statistical power.
Quality Control and Reporting Standards
Implementing rigorous quality control measures ensures consistent pipeline performance:
Pre-alignment QC: Utilize FastQC and MultiQC to identify library preparation issues early in the analysis process [68] [7]. Trimming tools like fastp or Trim Galore can improve mapping rates but require careful parameter optimization [7].
Post-alignment QC: Monitor mapping rates, read distribution across genomic features, and strand specificity. For clinical applications, establish minimum thresholds for these metrics based on validation studies [70].
Batch Effect Monitoring: When processing samples across multiple sequencing runs, implement batch correction methods and include technical replicates to quantify batch effects [5].
Comprehensive documentation of all analytical parameters, software versions, and quality metrics is essential for reproducibility. Nearly 75% of published RNA-seq studies lack sufficient methodological details to enable exact reproduction of results [7].
Selecting and validating an RNA-seq pipeline requires careful consideration of experimental goals, biological systems, and computational resources. By leveraging orthogonal validation with RT-qPCR and well-characterized reference materials, researchers can identify the optimal workflow for their specific needs. The framework presented here emphasizes that pipeline choice significantly impacts results, particularly for subtle differential expression analyses relevant to clinical applications.
Future developments in RNA-seq benchmarking will likely include more comprehensive reference materials spanning diverse biological contexts and increased standardization of validation protocols across the research community. As single-cell and spatial transcriptomics technologies mature, similar validation frameworks will be essential to ensure their reliable application to basic research and clinical diagnostics.
Conclusion
Benchmarking RNA-Seq workflows with qPCR is not a one-time exercise but a fundamental component of rigorous transcriptomics. The convergence of evidence shows that while most modern workflows show high overall correlation with qPCR data, each can produce a small but specific set of inconsistent results, particularly for low-abundance genes. Successful translation of RNA-seq into clinical diagnostics, especially for detecting subtle differential expression, demands careful workflow selection, awareness of technical variations, and robust validation protocols. Future directions should focus on developing standardized reference materials and benchmarking protocols, enhancing algorithms for challenging gene sets, and establishing best-practice guidelines to ensure the reliability and reproducibility of gene expression data in biomedical research and therapeutic development.
References
- 1. Long-read RNA sequencing: A transformative technology ... [https://www.sciencedirect.com/science/article/pii/S1525001624007524]
- 2. A systematic benchmark of Nanopore long-read RNA ... [https://www.nature.com/articles/s41592-025-02623-4]
- 3. Whole Transcriptome vs. Targeted Gene Expression Profiling [https://missionbio.com/company/blog/comparison-whole-transcriptome-vs-targeted-gene-expression-profiling/]
- 4. Augmenting precision medicine via targeted RNA-Seq ... [https://www.nature.com/articles/s41698-025-00993-8]
- 5. A real-world multi-center RNA-seq benchmarking study ... [https://www.nature.com/articles/s41467-024-50420-y]
- 6. Benchmarking long-read RNA-sequencing analysis tools ... [https://www.rna-seqblog.com/benchmarking-long-read-rna-sequencing-analysis-tools-using-in-silico-mixtures/]
- 7. A comprehensive workflow for optimizing RNA-seq data analysis [https://bmcgenomics.biomedcentral.com/articles/10.1186/s12864-024-10414-y]
- 8. Getting the most out of RNA-seq data analysis [https://www.rna-seqblog.com/getting-the-most-out-of-rna-seq-data-analysis/]
- 9. Benchmarking large-scale single-cell RNA-seq analysis [https://pubmed.ncbi.nlm.nih.gov/41279840/]
- 10. Clinical validation of RNA sequencing for Mendelian ... [https://pmc.ncbi.nlm.nih.gov/articles/PMC12081282/]
- 11. Benchmarking of RNA-sequencing analysis workflows ... [https://www.nature.com/articles/s41598-017-01617-3]
- 12. Introduction to Quantitative PCR (qPCR) Gene Expression ... [https://www.thermofisher.com/us/en/home/life-science/pcr/real-time-pcr/real-time-pcr-learning-center/gene-expression-analysis-real-time-pcr-information/introduction-gene-expression.html]
- 13. Validation of Housekeeping Genes for Gene Expression ... [https://pmc.ncbi.nlm.nih.gov/articles/PMC4426273/]
- 14. Innovative qPCR Algorithm Using Platelet-Derived RNA for ... [https://www.mdpi.com/2072-6694/17/7/1251]
- 15. Benchmarking of RNA-sequencing analysis workflows ... [https://pubmed.ncbi.nlm.nih.gov/28484260/]
- 16. Benchmarking RNA-Seq quantification tools - PMC [https://pmc.ncbi.nlm.nih.gov/articles/PMC5003039/]
- 17. Evaluation and validation of suitable reference genes for ... [https://www.nature.com/articles/s41598-024-61806-9]
- 18. Best PCR Systems of 2025: Top Picks for Research ... [https://www.labx.com/resources/best-pcr-systems-of-2025-top-picks-for-research-clinical-industry-labs/4817]
- 19. Evaluation of normalisation strategies for qPCR data ... [https://www.nature.com/articles/s41598-025-06657-8]
- 20. A comparison of transcriptome analysis methods with ... [https://pmc.ncbi.nlm.nih.gov/articles/PMC8957167/]
- 21. Comparison between qPCR and RNA-seq reveals challenges ... [https://pmc.ncbi.nlm.nih.gov/articles/PMC9883133/]
- 22. Cracking rare disorders: a new minimally invasive RNA- ... [https://www.nature.com/articles/s41525-025-00502-7]
- 23. Impact of human gene annotations on RNA-seq differential ... [https://bmcgenomics.biomedcentral.com/articles/10.1186/s12864-021-08038-7]
- 24. Clinical applications of and molecular insights from RNA ... [https://genomemedicine.biomedcentral.com/articles/10.1186/s13073-025-01494-w]
- 25. Quartet protein reference materials and datasets for multi ... [https://pmc.ncbi.nlm.nih.gov/articles/PMC10483797/]
- 26. Performance comparison of one-color and two ... [https://pubmed.ncbi.nlm.nih.gov/16964228/]
- 27. [Tutorial] Bulk RNA-seq DE analysis [https://informatics.fas.harvard.edu/resources/tutorials/differential-expression-analysis/]
- 28. Limitations of alignment-free tools in total RNA-seq quantification | BMC Genomics | Full Text [https://bmcgenomics.biomedcentral.com/articles/10.1186/s12864-018-4869-5]
- 29. A Beginner's Guide to Analysis of RNA Sequencing Data [https://pmc.ncbi.nlm.nih.gov/articles/PMC6096346/]
- 30. Kallisto vs. STAR: Alignment and Quantification of Bulk RNA-seq Data [https://www.elucidata.io/blog/kallisto-vs-star-alignment-and-quantification-of-bulk-rna-seq-data]
- 31. Systematic comparison and assessment of RNA-seq procedures for gene expression quantitative analysis | Scientific Reports [https://www.nature.com/articles/s41598-020-76881-x]
- 32. Primary Data Analysis of RNA-Seq data| RNA Lexicon [https://www.lexogen.com/blog/rna-lexicon-data-analysis-and-quality-control-primary-analysis/]
- 33. Comparing salmon, kalliso and STAR-HTseq RNA-seq ... [http://crazyhottommy.blogspot.com/2016/07/comparing-salmon-kalliso-and-star-htseq.html]
- 34. A comparison of transcriptome analysis methods with ... [https://bmcgenomics.biomedcentral.com/articles/10.1186/s12864-022-08465-0]
- 35. Analyzing qPCR data: Better practices to facilitate rigor and ... [https://www.sciencedirect.com/science/article/pii/S2405580825004431]
- 36. Comprehensive benchmark of differential transcript usage ... [https://pmc.ncbi.nlm.nih.gov/articles/PMC10836064/]
- 37. Validated reference genes for normalization of RT-qPCR in ... [https://pmc.ncbi.nlm.nih.gov/articles/PMC12222547/]
- 38. Efficient experimental design and analysis of real-time ... [https://pmc.ncbi.nlm.nih.gov/articles/PMC3710343/]
- 39. Consensus guidelines for the validation of qRT-PCR ... [https://pmc.ncbi.nlm.nih.gov/articles/PMC8792405/]
- 40. Benchmarking of RNA-Seq analysis workflows [https://www.rna-seqblog.com/benchmarking-of-rna-seq-analysis-workflows/]
- 41. Transforming RNA-seq analysis into biomarker discovery ... [https://www.sciencedirect.com/science/article/abs/pii/S1359644625001047]
- 42. Applications and Showcases of RNA Sequencing ... [https://www.lexogen.com/blog/applications-and-showcases-of-rna-sequencing-throughout-the-drug-discovery-process/]
- 43. MIQE 2.0 and the Urgent Need to Rethink qPCR Standards [https://pmc.ncbi.nlm.nih.gov/articles/PMC12154065/]
- 44. MIQE 2.0: Revision of the Minimum Information for ... [https://pubmed.ncbi.nlm.nih.gov/40272429/]
- 45. Real-Time PCR (qPCR) Basics [https://www.thermofisher.com/us/en/home/life-science/pcr/real-time-pcr/real-time-pcr-learning-center/real-time-pcr-basics.html]
- 46. Heading Down the Wrong Pathway: on the Influence of Correlation ... [https://bmcgenomics.biomedcentral.com/articles/10.1186/1471-2164-11-574]
- 47. Quantitative set for analysis expression: a method to quantify... gene [https://pmc.ncbi.nlm.nih.gov/articles/PMC3794608/]
- 48. What are the determinants of gene expression levels ... [https://pmc.ncbi.nlm.nih.gov/articles/PMC3235009/]
- 49. Gene length is a pivotal feature to explain disparities in ... [https://pmc.ncbi.nlm.nih.gov/articles/PMC10132733/]
- 50. Systematic evaluation of RNA-Seq preparation protocol ... [https://bmcgenomics.biomedcentral.com/articles/10.1186/s12864-019-5953-1]
- 51. Pathway enrichment analysis and visualization of omics data ... [https://pmc.ncbi.nlm.nih.gov/articles/PMC6607905/]
- 52. Comparative analysis of library preparation approaches for ... [https://www.nature.com/articles/s41598-025-12992-7]
- 53. Comparing the performance of RNA-seq kits for inputs ... [https://www.takarabio.com/learning-centers/next-generation-sequencing/rna-seq/technotes/stranded-rna-seq-competitor-kit-comparison?srsltid=AfmBOorV9nN430zXWVZiUZwqi8hGXafDTvwCBsFNn2IPEGohQV_Q4-2d]
- 54. Normalization of RNA-Seq data using adaptive trimmed ... [https://pmc.ncbi.nlm.nih.gov/articles/PMC11107385/]
- 55. A benchmark of RNA-seq data normalization methods for ... [https://www.nature.com/articles/s41540-024-00448-z]
- 56. Effect of low-expression gene filtering on detection ... [https://pmc.ncbi.nlm.nih.gov/articles/PMC4983442/]
- 57. Modeling and cleaning RNA-seq data significantly improve ... [https://bmcbioinformatics.biomedcentral.com/articles/10.1186/s12859-022-05023-z]
- 58. Large-scale benchmarking of circRNA detection tools reveals ... [https://pmc.ncbi.nlm.nih.gov/articles/PMC10870000/]
- 59. Do results obtained with RNA-sequencing require ... [https://pmc.ncbi.nlm.nih.gov/articles/PMC7823214/]
- 60. Absolute vs. Relative Quantification for qPCR [https://www.thermofisher.com/us/en/home/life-science/pcr/real-time-pcr/real-time-pcr-learning-center/real-time-pcr-basics/absolute-vs-relative-quantification-real-time-pcr.html]
- 61. MiniResource Brief guide to RT-qPCR [https://www.sciencedirect.com/science/article/pii/S1016847824001663]
- 62. Relative versus absolute RNA quantification: a comparative ... [https://biologicalproceduresonline.biomedcentral.com/articles/10.1186/s12575-021-00144-w]
- 63. A stable combination of non-stable genes outperforms ... [https://www.nature.com/articles/s41598-024-82651-w]
- 64. Study finds RNA-Seq, like microarrays, only accurate for ... [https://www.rna-seqblog.com/rna-seq-like-microarrays-only-accurate-for-relative-expression-not-absolute-quantitation/]
- 65. NGS vs qPCR [https://www.illumina.com/science/technology/next-generation-sequencing/beginners/advantages/ngs-vs-qpcr.html]
- 66. A comprehensive assessment of RNA-seq accuracy ... [https://pmc.ncbi.nlm.nih.gov/articles/PMC4321899/]
- 67. Comparing the Most Popular Tools and Pipelines for Bulk ... [https://www.elucidata.io/blog/bulk-rna-sequencing-a-comparison-of-the-most-popular-tools-and-pipelines]
- 68. Top Bioinformatics Tools for RNA Sequencing Data Analysis [https://riveraxe.com/top-bioinformatics-tools-for-rna-sequencing-data-analysis-best-value-for-your-research/]
- 69. Benchmarking workflows to assess performance and ... [https://pmc.ncbi.nlm.nih.gov/articles/PMC7903625/]
- 70. Clinical and analytical validation of a combined RNA ... [https://www.nature.com/articles/s43856-025-00934-3]
- 71. RNA-seq validation: software for selection of reference and ... [https://bmcgenomics.biomedcentral.com/articles/10.1186/s12864-024-10511-y]
- 72. Benchmarking informatics workflows for data-independent ... [https://www.nature.com/articles/s41467-025-65174-4]