Beyond the pLDDT Score: Advanced Strategies to Improve Low-Confidence AlphaFold Predictions
AlphaFold has revolutionized structural biology, yet its self-reported confidence scores (pLDDT) are not infallible, and low-confidence regions pose significant challenges for downstream applications in drug discovery and functional analysis.
Beyond the pLDDT Score: Advanced Strategies to Improve Low-Confidence AlphaFold Predictions
Abstract
AlphaFold has revolutionized structural biology, yet its self-reported confidence scores (pLDDT) are not infallible, and low-confidence regions pose significant challenges for downstream applications in drug discovery and functional analysis. This article provides a comprehensive guide for researchers aiming to understand, troubleshoot, and improve these unreliable regions. Drawing on the latest research, we explore the root causes of low confidence, detail advanced methodological fixes like EQAFold and enhanced sampling, offer targeted troubleshooting for specific scenarios like antibody-antigen complexes and disordered regions, and establish a rigorous framework for validating the improved models against experimental data and specialized benchmarks.
Decoding Low Confidence: Why AlphaFold Struggles with Certain Regions
Frequently Asked Questions (FAQs)
What is the pLDDT score?
The pLDDT (predicted Local Distance Difference Test) is a per-residue measure of local confidence in AlphaFold's predicted protein structures. It is scaled from 0 to 100, with higher scores indicating higher confidence and usually more accurate prediction. This metric estimates how well the prediction would agree with an experimental structure by assessing the correctness of local distances without relying on structural superposition [1].
How should I interpret different pLDDT value ranges?
pLDDT scores are categorized into confidence bands that correspond to expected prediction accuracy, as shown in the table below [1].
| pLDDT Score Range | Confidence Level | Typical Structural Accuracy |
|---|---|---|
| > 90 | Very High | High accuracy for both backbone and side chains. |
| 70 - 90 | Confident | Correct backbone, but potential side chain placement errors. |
| 50 - 70 | Low | Low confidence in the backbone geometry. |
| < 50 | Very Low | Unreliable prediction; likely intrinsically disordered region. |
Why do some protein regions have low pLDDT scores?
Low pLDDT scores (<50) generally indicate one of two scenarios [1]:
- Natural Flexibility: The region is highly flexible or intrinsically disordered and does not adopt a single, well-defined structure.
- Insufficient Information: The region has a predictable structure, but AlphaFold lacks sufficient evolutionary or sequence information to model it confidently.
This often occurs in flexible linkers between well-defined globular domains [1].
Does a high pLDDT score guarantee the prediction is correct?
No. While a high pLDDT score generally indicates high local reliability, it is not an absolute guarantee of accuracy. Global distortions and errors in domain orientation can occur even in high-confidence models [2]. Furthermore, AlphaFold does not account for environmental factors like ligands, covalent modifications, or specific protein-protein interactions, which can alter a protein's structure [2]. High-confidence predictions should be considered as exceptionally useful hypotheses, with experimental validation remaining crucial for verifying structural details, especially for interaction sites [2].
How can I improve the reliability of low pLDDT regions in my predictions?
The EQAFold framework offers an enhanced approach. It replaces AlphaFold's standard pLDDT prediction head with an Equivariant Graph Neural Network (EGNN) that incorporates additional features for a more reliable confidence assessment [3].
Diagram: Workflow comparing standard AlphaFold2 and enhanced EQAFold pLDDT scoring.
Troubleshooting Low Confidence Predictions
Problem: My model has a region with very low pLDDT. What does this mean?
Interpretation & Solution:
- Likely Intrinsic Disorder: A continuous region with pLDDT < 50 is likely an Intrinsically Disordered Region (IDR). This is a biological reality, not a failure of the model [1]. You should interpret this region as flexible and not over-interpret its specific coordinates.
- Verify with Experimental Data: If the region is suspected to be structured, its low confidence may stem from a lack of evolutionary information. Consider if experimental data (e.g., from crystallography or cryo-EM) is available or could be generated to validate or guide modeling [2].
- Use Enhanced Assessment Tools: For a more reliable confidence assessment, tools like EQAFold can be used. EQAFold has been shown to provide more accurate confidence metrics, particularly in regions where the standard AlphaFold pLDDT is erroneous [3].
Problem: The high-pLDDT domains in my model appear correct, but their relative orientation looks wrong.
Interpretation & Solution:
- pLDDT Measures Local Accuracy: pLDDT does not measure confidence in the relative positions or orientations of domains or large-scale assembly [1].
- Consult the PAE Plot: You must examine the Predicted Aligned Error (PAE) plot. The PAE plot estimates the positional error between residues and is the correct metric for assessing inter-domain confidence and overall fold quality. Low PAE between domains indicates high confidence in their relative placement.
Diagram: Troubleshooting logic for low pLDDT regions.
Problem: My high pLDDT prediction disagrees with my experimental data.
Interpretation & Solution:
- Trust the Experiment: Global distortion and domain movements can occur in AlphaFold predictions, even for high-confidence residues [2]. A systematic analysis found that the median Cα root-mean-square deviation (RMSD) between high-confidence predictions and experimental structures was 1.0 Å, which is considerably larger than the median RMSD (0.6 Å) between experimental structures of the same protein determined under different conditions [2].
- Use the Prediction as a Hypothesis: The prediction is a strong starting model. Use it for molecular replacement in crystallography or as an initial model for fitting into cryo-EM maps [4].
- Iterative Rebuilding: Implement iterative refinement workflows where the initial AlphaFold model is fitted into the experimental density and then used as a template for a new prediction. This can progressively improve the model's agreement with the data [4].
Experimental Protocol: Improving Self-Assessment with EQAFold
The following protocol summarizes the EQAFold methodology for generating more accurate self-confidence scores, as detailed in the research [3].
Objective: To generate a protein structure prediction with a refined and more reliable pLDDT confidence score using the EQAFold framework.
Key Research Reagent Solutions:
| Reagent / Software | Function in Protocol |
|---|---|
| Pre-trained AlphaFold2 Model | Provides the foundational structure prediction and initial representations. |
| ESM2 Protein Language Model | Supplies evolutionary embeddings used as node features in the graph network. |
| Equivariant Graph Neural Network (EGNN) | Core architecture that refines pLDDT prediction using spatial and relational data. |
| RMSF from Dropout Replicates | Quantifies structural fluctuations; used as a feature to indicate local uncertainty. |
Methodology:
- Generate Base Structure Prediction: Run the target protein sequence through a standard AlphaFold2 pipeline (including MSA generation, Evoformer, and Structure Module) to obtain the initial 3D coordinates and the single and pair representations [3].
- Create Multiple Dropout Models: Run the AlphaFold2 structure module five additional times with 50% dropout enabled. Calculate the Root Mean Square Fluctuation (RMSF) of the Cα atoms across these five models. The RMSF provides a measure of positional variance that correlates with local confidence [3].
- Construct Graph Representation:
- Nodes: Represent each amino acid residue.
- Node Features: Concatenate the final single representation from AlphaFold's Evoformer (L × 384), averaged embeddings from the ESM2 language model (L × 33), and the calculated RMSF values (L × 1). Process this through a linear layer to create final node features of dimension L × 384 [3].
- Edges: Connect residues whose Cα atoms are within 16 Å of each other.
- Edge Features: Comprise the pair embeddings from AlphaFold (L × L × 128) and the averaged attention layers from ESM2 for the corresponding residue pairs [3].
- Process with EGNN: Pass the constructed graph through an EGNN network consisting of four equivariant graph convolutional layers. The network reduces the 384 input node features to 128 hidden features and finally to 50 output features [3].
- Output Refined pLDDT: The final layer produces the refined per-residue pLDDT score, which has been demonstrated to be more accurate than the standard AlphaFold output, especially in regions with substantial initial errors [3].
Frequently Asked Questions (FAQs)
Q1: What does a low pLDDT score in an AlphaFold prediction mean? A low pLDDT (predicted Local Distance Difference Test) score is AlphaFold's per-residue estimate of its own confidence. Scores below 50 are typically associated with intrinsically disordered regions (IDRs) that lack a fixed 3D structure. However, low confidence can also indicate a "hidden order"—a region capable of folding but for which AlphaFold lacks sufficient evolutionary information to make a confident prediction [5] [6].
Q2: Why would a seemingly foldable protein segment receive a low-confidence prediction? A segment may be foldable but receive low pLDDT scores due to a shallow Multiple Sequence Alignment (MSA). AlphaFold relies heavily on co-evolutionary signals from homologous sequences to infer structural contacts. If few related sequences exist in databases, these evolutionary constraints are missing, and the model has limited information to build a confident prediction, even for structured domains [5].
Q3: How can I distinguish between true intrinsic disorder and a false negative due to a lack of data? Combining AlphaFold's output with other bioinformatics tools is key. A region with low pLDDT that is also predicted to be disordered by tools like IUPred2 is likely genuinely disordered. Conversely, a region with low pLDDT that is flagged as foldable by a tool like pyHCA (which analyzes hydrophobic cluster density) may be a structured domain suffering from a lack of evolutionary data [5].
Q4: My protein-protein complex has a poor ipTM score. What does this indicate? The ipTM (interface predicted Template Modeling) score estimates the quality of a predicted protein-protein interaction. The score can be artificially lowered if your input sequences contain large disordered regions or accessory domains that do not participate in the core interaction. Trimming the sequences to the specific interacting domains often results in a higher and more reliable ipTM score for the interaction interface itself [7].
Troubleshooting Guides
Issue: Low Confidence in Structured Regions
Problem: Your protein has segments that are suspected to be structured, but AlphaFold assigns them low pLDDT scores (e.g., < 50).
Investigation and Solution Protocol:
Confirm Foldability:
- Action: Run your protein sequence through the pyHCA tool.
- Interpretation: This tool delineates "foldable segments" (FS) based on hydrophobic cluster density. Note segments with an HCA score typical of folded domains (e.g., between -1 and 3.5) that simultaneously have low pLDDT [5].
- Rationale: A high HCA score with low pLDDT suggests the region is likely structured but AlphaFold cannot confidently model it, often due to a lack of evolutionary information.
Check Evolutionary Coverage:
- Action: Examine the depth of the Multiple Sequence Alignment (MSA) generated during the AlphaFold run. Most AlphaFold implementations provide this data.
- Interpretation: A shallow MSA, with very few homologous sequences, strongly points to a lack of co-evolutionary signals as the root cause of low confidence [5].
Experimental Validation Pathway:
- If a region is confirmed as foldable but has low confidence, it becomes a high-priority candidate for experimental structure determination (e.g., via X-ray crystallography or cryo-EM) to confirm the "hidden" structure [5].
Issue: Poor Protein-Protein Interaction (PPI) Scores
Problem: The ipTM score for a predicted protein complex is low, making the model's reliability uncertain.
Investigation and Solution Protocol:
Analyze the Interface:
- Action: Inspect the predicted complex model. Look at the interface itself and check the pLDDT of the interfacial residues and the Predicted Aligned Error (PAE) between chains.
- Interpretation: A localized region of high inter-chain PAE and low pLDDT at the interface suggests a low-quality interaction prediction. High PAE across the entire chain, however, indicates global uncertainty [7].
Refine Input Constructs:
- Action: If the interface looks plausible but the global ipTM is low, truncate your input FASTA sequences to include only the known or suspected interacting domains, removing long disordered tails or non-participating domains.
- Rationale: The standard ipTM calculation is normalized over the entire length of the input sequences. Removing non-interacting regions prevents these segments from artificially depressing the score, providing a clearer signal of the interface quality [7].
Use Alternative Metrics:
- Action: For a more focused assessment, calculate scores like pDockQ or the newly proposed ipSAE, which are designed to be less sensitive to disordered regions and provide a better estimate of interface accuracy [7].
Data Presentation
Table: Interpreting pLDDT Confidence Scores
| pLDDT Range | Confidence Level | Typical Interpretation | Recommended Action |
|---|---|---|---|
| > 90 | Very high | High-confidence model; reliable for most analyses. | Can be used for detailed mechanistic studies. |
| 70 - 90 | Confident | Good backbone prediction; side-chain rotamers may vary. | Suitable for most applications like homology modeling. |
| 50 - 70 | Low | Caution advised; may be disordered or poorly aligned. | Use with caution; combine with disorder predictors. |
| < 50 | Very low | Likely intrinsically disordered region (IDR). | Treat as flexible; consider experimental validation for function. |
Source: Adapted from AlphaFold benchmarks and literature analysis [5] [6] [8].
Experimental Protocols
Protocol 1: Identifying "Hidden Order" with pyHCA and MSA Analysis
Objective: To systematically identify protein segments that are likely folded but are assigned low confidence by AlphaFold due to insufficient evolutionary information.
Methodology:
- Input: AlphaFold2 prediction for your protein of interest, including the pLDDT scores and the amino acid sequence.
- Foldable Segment Delineation:
- Use the
segmentfunction of the pyHCA tool (available on GitHub) to automatically delineate foldable segments (FS) from your protein sequence [5]. - The tool calculates an HCA score for each segment, which estimates its order/disorder ratio. Segments with an HCA score between -1 and 3.5 are considered "soluble-like" and foldable [5].
- Use the
- Cross-Reference with pLDDT:
- Map the pyHCA-derived segments onto the AlphaFold model and calculate the mean pLDDT for each segment.
- Identify candidates: Flag long segments (>30 amino acids) that have an HCA score typical of a folded domain but a very low mean pLDDT (<50). These are your "full-VL" (Very Low) segments of interest [5].
- MSA Depth Check:
- For the candidate segments, check the depth of the Multiple Sequence Alignment (MSA) generated by AlphaFold. This can be quantified by the average number of homologs per residue found in databases like BFD or UniRef [5].
- A shallow MSA confirms that lack of evolutionary data is the likely cause of low confidence.
Protocol 2: Improving ipTM Scores for Complex Prediction
Objective: To enhance the reliability of protein-protein interaction scoring by optimizing input sequence constructs.
Methodology:
- Initial Full-Length Prediction:
- Run AlphaFold-Multimer using the full-length sequences of the interacting proteins from UniProt.
- Record the ipTM score and analyze the PAE plot. Note the regions that appear to form the core interaction interface.
- Construct Truncation:
- Based on the initial model and domain knowledge, create new truncated FASTA files. Include only the structured domains involved in the interaction and short linkers, removing long N/C-terminal tails and known disordered regions [7].
- Second Prediction with Truncated Constructs:
- Run AlphaFold-Multimer again using the new, shorter sequence constructs.
- Compare the new ipTM score to the original. A significant increase suggests the original full-length score was artificially lowered by non-interacting regions.
- Validation with ipSAE:
- As an independent check, run the
ipSAEprogram (available on GitHub) on the original full-length prediction's PAE output. - The
ipSAEmetric is designed to be less sensitive to disordered regions and may give a higher, more accurate score for the interface even with the full-length input [7].
- As an independent check, run the
Visualizations
Diagram: Diagnosing Low Confidence in AlphaFold
Title: Diagnostic workflow for low-confidence AlphaFold predictions.
Diagram: Experimental Workflow for Characterization
Title: Workflow for characterizing low-confidence regions.
The Scientist's Toolkit: Research Reagent Solutions
| Tool / Resource | Function | Application in Troubleshooting |
|---|---|---|
| pyHCA | Automatically delineates foldable segments in a protein sequence based on hydrophobic cluster density (HCA). | Identifies regions that are likely structured ("hidden order") despite having low AlphaFold pLDDT scores [5]. |
| IUPred2 | Predicts intrinsic disorder from amino acid sequence. | Helps confirm whether a low-pLDDT region is likely a genuine IDR [5]. |
| BFD / UniRef Databases | Large-scale collections of protein sequences used to build Multiple Sequence Alignments (MSAs). | Provides the evolutionary data. Checking MSA depth from these databases confirms if low confidence is due to a lack of homologous sequences [5]. |
| ipSAE Software | Calculates an alternative protein-protein interaction score from AlphaFold's PAE output. | Provides a more reliable interaction score for complexes where the standard ipTM is depressed by disordered regions [7]. |
| AlphaFold-Multimer | Specialized version of AlphaFold for predicting protein complexes. | Used in the protocol for predicting and scoring protein-protein interactions [7]. |
Frequently Asked Questions
Q1: If AlphaFold gives a region a high pLDDT score, can I fully trust that part of the model? A: No. While a high pLDDT score (e.g., >90) generally indicates high model confidence, it does not guarantee the prediction is a perfect match for the experimental, biological structure. Global distortions and incorrect local side-chain conformations can occur even in high-confidence regions [2]. Always treat high-confidence predictions as exceptionally useful hypotheses, not final truths.
Q2: What are the main structural limitations in high-confidence AlphaFold predictions? A: The primary limitations, even at high confidence, are:
- Global Distortion: The entire predicted structure can be slightly distorted compared to the real structure.
- Domain Orientation: The relative placement of protein domains can be incorrect.
- Local Conformation: The precise shaping of the protein backbone and the positioning of amino acid side chains can be inaccurate [2].
Q3: How much can a high-confidence AlphaFold model differ from an experimental structure? A: The difference is measurable and often significant. When compared to experimental crystallographic data, the atomic coordinates in high-confidence AlphaFold predictions can have a median Cα root-mean-square deviation (RMSD) of around 1.0 Å from deposited models in the Protein Data Bank (PDB). This is considerably more than the median difference of 0.6 Å observed between two high-resolution experimental structures of the same protein crystallized under different conditions [2].
Q4: Why might a high-confidence prediction be inaccurate? A: AlphaFold's training does not fully account for the cellular environment. Predictions may be inaccurate because they do not incorporate:
- Ligands (e.g., drugs, cofactors)
- Covalent modifications (e.g., phosphorylation)
- Interactions with other biomolecules (e.g., DNA, other proteins)
- Effects of specific solution conditions [2] [9].
Q5: What is the definitive method to verify a structural detail from an AlphaFold prediction? A: Experimental structure determination is the only way to verify structural details, particularly those involving interactions not included in the prediction [2]. Techniques like X-ray crystallography or cryo-electron microscopy are required for confirmation.
Troubleshooting Guide: Diagnosing Mismatches Between High Confidence and Experimental Data
This guide helps you systematically identify and address discrepancies between your high-confidence AlphaFold model and experimental results.
Table: Summary of Quantitative Data on AlphaFold Prediction Accuracy
| Metric | AlphaFold Prediction (vs. Experimental) | Experimental Structures (vs. Each Other) | Source |
|---|---|---|---|
| Median Cα RMSD | ~1.0 Å | ~0.6 Å | [2] |
| Mean Map-Model Correlation | 0.56 | 0.86 (for deposited models) | [2] |
| Inter-atomic Distance Deviation (for atoms 48-52 Å apart) | ~0.7 Å | ~0.4 Å | [2] |
| Key Limitation | Does not model ligands, modifications, or environmental factors | Represents a single experimental condition | [2] [9] |
Issue: Suspected Global Distortion or Incorrect Domain Placement
Symptoms:
- Your entire AlphaFold model has high pLDDT but does not fit well into a cryo-EM map or X-ray crystallography density.
- Specific domains of your protein appear rotated or shifted relative to their expected position in a complex.
Diagnosis & Resolution Protocol:
- Quantify the Mismatch: Calculate the global RMSD between your AlphaFold prediction and any available experimental structure. Use the morphing analysis described in the Nature Methods study to determine if the discrepancy is due to a smooth distortion or a rigid domain movement [2].
- Check for "Conditional Order": The region might be foldable but requires a binding partner or specific cellular condition to adopt its true structure. This "conditional order" can lead to low-confidence or inaccurate predictions in the unbound state. Use tools like pyHCA to identify such foldable segments that AlphaFold may struggle with [5].
- Investigate Co-evolutionary Signal: The accuracy of AlphaFold is tied to the depth of the multiple sequence alignment (MSA). A shallow MSA, indicating a lack of evolutionary information, can be a source of error, even if the final pLDDT is high. Analyze the MSA depth for the problematic region [5].
- Consider Environmental Factors: If your experiment involves a specific ligand, ion, or post-translational modification, remember that standard AlphaFold predictions do not include these. The inaccuracy may arise because the protein's true structure in your experiment is dependent on these factors [2].
Diagnostic Workflow for Inaccurate High-Confidence Models
The Scientist's Toolkit: Research Reagent Solutions
Table: Essential Resources for AlphaFold Research and Validation
| Research Reagent / Tool | Function & Purpose | Key Details |
|---|---|---|
| AlphaFold Server | Provides free, non-commercial access to AlphaFold 3 for predicting complexes of proteins, nucleic acids, ligands, and modified residues [10]. | Predicts joint structures; uses AlphaFold 3's updated diffusion-based architecture [9]. Output is in mmCIF format. |
| ColabFold | A user-friendly, web-based platform for predicting protein structures and complexes using AlphaFold 2 and RoseTTAFold [10]. | Useful for multimers; accessible via Google Colab. Allows control over parameters like max_recycles (recommended: 12-48) [10]. |
| AlphaFill | An algorithm that "transplants" missing ligands, cofactors, and ions into pre-existing AlphaFold models [10]. | Provides approximate ligand positioning. Caution: Not suitable for quantifying precise atomic interactions [10]. |
| pyHCA | A computational tool that identifies foldable segments and estimates order/disorder ratio from a single protein sequence using Hydrophobic Cluster Analysis (HCA) [5]. | Helps identify "conditional order" and segments that may be well-folded but are missed by AlphaFold due to a shallow MSA [5]. |
| FirstGlance in Jmol | A molecular visualization tool that automatically colors uploaded AlphaFold models by their pLDDT confidence score [10]. | Simplifies initial assessment of model reliability. Displays average pLDDT for selected residue ranges. |
| Experimental Structure Determination (X-ray, Cryo-EM) | The definitive method for verifying structural details and hypotheses generated by AlphaFold predictions [2]. | Essential for confirming structures, especially for regions involved in interactions or with bound ligands not modeled by AlphaFold. |
Research Workflow Integrating Key Tools
Troubleshooting Guide & FAQs
This guide addresses common challenges researchers face when using AlphaFold to model protein conformational diversity and ligand interactions, providing targeted solutions based on current research.
FAQ 1: Why does AlphaFold only predict one structure for my protein, which is known to have multiple functional states?
AlphaFold was primarily trained to predict a single, thermodynamically stable conformation and often converges on the most common state found in structural databases [11]. To sample alternative conformations, you can manipulate the input multiple sequence alignment (MSA). Reducing the depth and information content of the MSA encourages the model to explore a broader conformational landscape [12].
- Recommended Protocol: MSA Subsampling
- Generate a deep MSA using standard AlphaFold2 (AF2) procedures.
- Stochastically subsample the MSA to a reduced depth (e.g., between 16 and 512 sequences) before structure inference.
- Generate a large number of models (e.g., 50-100) for each subsampled MSA.
- Cluster the resulting models and analyze them using metrics like TM-score to identify distinct, high-confidence conformational states [12].
FAQ 2: How can I generate a structural ensemble for an intrinsically disordered protein (IDP) or a protein with disordered regions?
Standard AlphaFold2 predictions for disordered regions often appear as unrealistic, low-confidence coils [11]. The AlphaFold-Metainference method addresses this by using AlphaFold-predicted distances as restraints in molecular dynamics (MD) simulations to generate a physically plausible ensemble [13].
- Recommended Protocol: AlphaFold-Metainference
- Run AlphaFold to obtain a distogram (predicted distance map).
- Use these predicted distances as structural restraints within an MD simulation framework.
- Run the simulation to generate a conformational ensemble that satisfies the AlphaFold-derived distances.
- Validate the ensemble against experimental data, such as Small-Angle X-Ray Scattering (SAXS) profiles or NMR chemical shifts [13].
FAQ 3: Why does AlphaFold3 (AF3) sometimes produce physically unrealistic protein-ligand complexes?
While AF3 demonstrates high accuracy in benchmarks, its predictions can fail to adhere to fundamental physical principles. It may rely on pattern recognition from its training data rather than an underlying understanding of physics, leading to issues like steric clashes and incorrect ligand placement when the binding site is subtly altered [14].
- Troubleshooting Steps:
- Always inspect predictions for severe steric clashes and impossible bond geometries.
- Perform a "sanity check" by mutating key binding residues in silico (e.g., to glycine or phenylalanine) and re-running the prediction. If the ligand pose remains unchanged, this indicates a potential over-reliance on memorization [14].
- Do not rely solely on AF3. Use its predictions as initial hypotheses and refine them with physics-based methods like molecular dynamics (MD) simulations and free energy calculations [15].
FAQ 4: How reliable are the confidence scores (pLDDT, pTM) for assessing predictions of alternative conformations or ligand binding?
Confidence scores are a useful but imperfect guide. While a low pLDDT often indicates disorder or flexibility, a high score does not guarantee a unique or functionally relevant state. When generating diverse conformations via MSA subsampling, the overall confidence may decrease, but this does not necessarily correlate with lower quality for the alternative state [16]. For ligands, confidence metrics may not reliably drop even in physically implausible binding scenarios [14].
- Recommendation: Use confidence scores as one piece of evidence. Prioritize the experimental validation of predicted conformational states and ligand-binding poses, especially for novel targets [2].
Experimental Methodologies & Data
The following table summarizes key methods for capturing conformational diversity.
| Method | Core Principle | Key Applications | Key Metric(s) |
|---|---|---|---|
| MSA Subsampling [12] | Reduces evolutionary information to bias, enabling sampling of alternative states. | Transporters, GPCRs, proteins with known open/closed states. | TM-score (≥0.9 considered high accuracy). |
| AFsample2 [16] | Randomly masks columns in the MSA with "X" to break co-evolutionary constraints. | Predicting alternative end states and intermediate conformations. | TM-score improvement (ΔTM); Model diversity. |
| AlphaFold-Metainference [13] | Uses AF-predicted distances as restraints in MD simulations to generate ensembles. | Intrinsically disordered proteins, partially disordered proteins. | Kullback-Leibler divergence to SAXS data; Rg. |
Workflow Visualization
AlphaFold-Metainference Workflow
MSA Manipulation for Conformational Sampling
The Scientist's Toolkit: Research Reagent Solutions
| Reagent / Resource | Function in Experiment |
|---|---|
| AlphaFold-Metainference Server/Code [13] | Generates structural ensembles for disordered and ordered proteins by integrating AF predictions with MD simulations. |
| AFsample2 Software [16] | An AlphaFold2-based method that uses random MSA column masking to predict multiple conformations and ensembles. |
| Molecular Dynamics (MD) Software (e.g., GROMACS, AMBER) | Used to refine AF models, sample dynamics, and validate predictions using physics-based force fields [13] [15]. |
| Serratus Platform [17] | A bioinformatics platform for identifying RNA-dependent RNA polymerase (RdRp) sequences and their palmprint motifs. |
| PoseBusterV2 Dataset [14] | A benchmark dataset for evaluating protein-ligand docking accuracy, used to test AF3's co-folding performance. |
Methodological Breakthroughs: From Built-in Fixes to External Tools
Technical Support Center
Frequently Asked Questions (FAQs)
Q1: What does a low pLDDT score mean in my AlphaFold prediction, and how should I interpret it? A low pLDDT score (typically below 70) indicates low local confidence in the predicted structure. This can mean one of two things: (1) the region is genuinely flexible or intrinsically disordered and does not adopt a single, stable structure, or (2) AlphaFold lacks sufficient information to predict the region with confidence, even if it might be structured. The EQAFold framework is designed to help distinguish between these scenarios and provide more accurate confidence estimates for these challenging regions [1] [18].
Q2: My prediction contains regions of "barbed wire" or "pseudostructure." What are these? These are specific behavioral modes identified within low-pLDDT regions:
- Barbed Wire: Characterized by wide, looping coils, an absence of packing contacts, and numerous validation outliers. It is extremely un-protein-like, and its conformation is considered to have no predictive value [19].
- Pseudostructure: Presents an intermediate behavior with a misleading appearance of isolated, badly formed secondary-structure-like elements [19].
Tools like
phenix.barbed_wire_analysiscan automatically identify and help you manage these non-predictive regions in your models [19].
Q3: Can a region with low pLDDT ever be structurally accurate? Yes. Some low-pLDDT regions can exhibit a "near-predictive" mode. These regions resemble folded protein structure, can be nearly accurate, and are often associated with conditional folding, where a region folds upon binding to a partner or due to post-translational modifications [19]. Identifying these regions is a key focus of improved quality assessment methods.
Q4: How does EQAFold improve upon standard AlphaFold's self-assessment? While standard AlphaFold provides a pLDDT score, it can struggle to consistently select the best models for difficult targets and to accurately assess flexibility in the presence of interacting partners [18] [20]. EQAFold overhauls the confidence prediction head using deep graph learning, leading to more accurate self-confidence scores that better correlate with the true quality of the structural model.
Q5: What is the best way to generate an accurate structural ensemble for a disordered protein? Standard AlphaFold output (a single structure) is often inconsistent with experimental data for disordered proteins [13]. Advanced methods like AlphaFold-Metainference use AlphaFold-predicted distances as restraints in molecular dynamics simulations to generate structural ensembles that are more accurate and better agree with techniques like small-angle X-ray scattering (SAXS) [13].
Troubleshooting Guides
Issue 1: Handling Low-Confidence Regions in Predictions
Problem: Your AlphaFold model contains extensive regions with low pLDDT scores, and you are unsure how to proceed with your analysis.
Solution:
- Categorize the Low-Confidence Region: Use analysis tools to determine the behavioral mode of the low-pLDDT region. The following table summarizes the modes and recommended actions [19].
| Behavioral Mode | Key Characteristics | Recommended Action |
|---|---|---|
| Barbed Wire | Wide loops, no packing, many validation outliers. | Remove for most tasks (e.g., molecular replacement). The coordinates are non-predictive [19]. |
| Pseudostructure | Poorly formed, isolated secondary structures. | Treat with caution. Use annotations (e.g., signal peptides) for context; generally not reliable [19]. |
| Near-Predictive | Protein-like, reasonable packing, few outliers. | Retain for analysis; can be useful for molecular replacement and studying conditionally folded regions [19]. |
Run a Barbed Wire Analysis:
- Tool:
phenix.barbed_wire_analysis(included in the Phenix software package) [19]. - Input: Your predicted structure in PDB or mmCIF format, with pLDDT in the B-factor field.
- Output: The tool will categorize residues into behavioral modes based on pLDDT, packing scores, and MolProbity validation metrics. It can output annotated files or a new structure file pruned of non-predictive regions.
- Tool:
Consult External Annotations: Cross-reference the low-pLDDT regions with databases like MobiDB to see if they are annotated as intrinsically disordered. An association between "barbed wire" and disorder annotations supports the interpretation of genuine disorder [19].
Issue 2: Generating Accurate Models for Difficult Targets
Problem: For a target with shallow multiple sequence alignments (MSAs) or complicated architecture, the standard AlphaFold pipeline produces poor-quality models, and the pLDDT score is not reliable for selecting the best one.
Solution: Adopt an integrative prediction strategy, as demonstrated by high-performing systems in CASP16 [20].
- MSA Engineering: Generate diverse MSAs using different sequence databases and alignment tools. For large proteins, consider a divide-and-conquer approach using domain-based alignments [20].
- Extensive Model Sampling: Run multiple predictions with different MSAs and model seeds to explore a larger conformational space [20].
- Advanced Model Ranking: Do not rely solely on pLDDT. Use a combination of complementary model quality assessment (QA) methods and model clustering to rank and select your final predicted structures [20].
Table: Key Research Reagent Solutions for Integrative Structure Prediction
| Research Reagent / Tool | Function in Experiment |
|---|---|
| Multiple Sequence Alignments (MSAs) | Provides evolutionary constraints from diverse homologs; primary input for deep learning-based prediction [20]. |
| AlphaFold-Metainference | Uses AF-predicted distances as MD restraints to generate accurate structural ensembles of disordered/ordered proteins [13]. |
| Molecular Dynamics (MD) Simulations | Used in AlphaFold-Metainference and for independent validation; provides flexibility metrics and conformational sampling [13] [18]. |
| Model Quality Assessment (QA) Methods | Estimates the accuracy of predicted models; crucial for ranking models from extensive sampling [20] [21]. |
phenix.barbed_wire_analysis Tool |
Automates identification of predictive vs. non-predictive residues in low-pLDDT regions of AlphaFold2 models [19]. |
Experimental Protocols
Protocol 1: Using AlphaFold-Metainference to Generate Structural Ensembles
Purpose: To construct a structural ensemble of a protein (including disordered regions) that is consistent with both AlphaFold-predicted distances and experimental data [13].
Methodology:
- Input Generation: Obtain the distogram (distance map) for your protein sequence from AlphaFold.
- Restraint Setup: Use the predicted inter-residue distances as structural restraints within a molecular dynamics (MD) simulation framework, implemented according to the maximum entropy principle via the metainference approach.
- Simulation: Run the MD simulation with the applied distance restraints to generate an ensemble of conformers.
- Validation: Compare the back-calculated properties (e.g., radius of gyration, pairwise distance distributions) of your ensemble against experimental data, such as SAXS profiles, for validation.
The workflow for this protocol is illustrated below.
Protocol 2: Benchmarking EQAFold Performance on Low-pLDDT Regions
Purpose: To quantitatively evaluate whether the EQAFold framework provides more accurate confidence estimates for low-pLDDT regions compared to standard AlphaFold.
Methodology:
- Dataset Curation: Select a set of protein targets with known experimental structures that contain regions of conditional folding or intrinsic disorder, evidenced by low pLDDT scores in standard AlphaFold predictions.
- Model Generation: Process the targets using both the standard AlphaFold and the EQAFold frameworks.
- Quality Assessment:
- Calculate the per-residue accuracy (e.g., using lDDT-Cα) of the predicted models against the experimental reference.
- Compare the correlation between the predicted confidence scores (pLDDT from AlphaFold vs. the improved score from EQAFold) and the calculated per-residue accuracy, focusing on regions originally with low pLDDT.
- Analysis: A successful benchmark will show that EQAFold's confidence scores have a stronger correlation with the true structural accuracy in low-confidence regions, correctly identifying "near-predictive" segments.
The logical flow of this benchmark is shown in the following diagram.
Leveraging Massive Sampling and Dropout for Conformational Diversity
Frequently Asked Questions (FAQs) and Troubleshooting Guides
FAQ 1: How does reducing information in the Multiple Sequence Alignment (MSA) help sample alternative conformations?
Answer: Standard AlphaFold2 (AF2) uses a deep, information-rich MSA, which constrains it to predict a single, high-confidence ground state. Reducing information in the MSA by randomly masking columns or subsampling sequences disrupts the co-evolutionary signals that bias the model toward one conformation. This increased uncertainty allows the network to explore alternative structural solutions, effectively revealing different conformational states of the same protein [22] [23] [24].
FAQ 2: What is the difference between MSA column masking and MSA subsampling?
Answer: Both methods aim to reduce evolutionary constraints, but they operate differently:
- MSA Column Masking (as in AFsample2): This method randomly replaces entire columns in the MSA with a placeholder (e.g., "X"), directly removing covariance information for specific residue positions across the alignment. This is integrated directly into the inference process, with a unique masking pattern applied for each predicted model [22].
- MSA Subsampling: This method reduces the depth of the MSA by randomly selecting a smaller subset of homologous sequences (
max_seq) and clusters (extra_seq) for each prediction. A shallower MSA provides a noisier evolutionary signal, encouraging conformational diversity [24].
FAQ 3: My models for alternative states have low pLDDT scores. Should I disregard them?
Answer: Not necessarily. A decrease in mean pLDDT is an expected consequence of introducing noise via MSA masking or subsampling and does not automatically indicate a lower-quality model. Research shows that models generated with these methods can have high accuracy (high TM-score to experimental structures) even with a moderately reduced pLDDT. You should validate the alternative state models by comparing them to known experimental structures of alternate conformations if available [22] [23].
FAQ 4: How much sampling (number of models) is sufficient to capture conformational diversity?
Answer: There is no one-size-fits-all number, but increased sampling consistently improves the probability of discovering high-quality alternative conformations. One study found that generating 160 models per run was effective for capturing the conformational ensemble of Abl1 kinase. As a general guideline, you should generate hundreds of models. The quality of the best-predicted state typically improves as the number of samples increases [22] [24].
FAQ 5: What are the key parameters I need to adjust in my AlphaFold2 implementation to enable this kind of sampling?
Answer: The key parameters to modify are:
- MSA Depth Parameters:
max_seqandextra_seq. Reducing these from their default values is a primary method for MSA subsampling [24]. - Dropout: Enable dropout during inference at rates of approximately 10% for the Evoformer module and 25% for the structural module to sample from the model's uncertainty [24].
- MSA Masking Probability: If using an AFsample2-like approach, this probability (e.g., 15%) controls how many columns are randomized [22].
- Number of Recycles: Limiting the number of recycles (e.g., to 3) can prevent over-optimization toward a single state [23].
Troubleshooting Common Experimental Issues
Issue 1: The generated ensemble lacks diversity and shows only one conformational state.
Possible Causes and Solutions:
- Cause 1: The MSA masking level or subsampling depth is too low. The network is still too constrained.
- Solution: Systematically increase the MSA column masking probability (e.g., from 5% to 15% to 25%) or further reduce the
max_seq/extra_seqparameters. Note that excessive masking (>30-35%) can lead to a rapid drop in confidence and model quality [22].
- Solution: Systematically increase the MSA column masking probability (e.g., from 5% to 15% to 25%) or further reduce the
- Cause 2: Insufficient sampling.
- Solution: Drastically increase the number of models generated. Run hundreds of predictions with different random seeds to adequately explore the conformational landscape [22].
- Cause 3: Dropout is not enabled.
- Solution: Ensure that dropout is activated for the Evoformer and structural modules during inference [24].
Issue 2: All generated models have very low pLDDT confidence scores and appear unstructured.
Possible Causes and Solutions:
- Cause 1: Excessively aggressive MSA manipulation.
- Solution: Reduce the MSA masking probability or increase the MSA subsampling depth. There is a trade-off between diversity and confidence; find the optimal balance for your target protein [22].
- Cause 2: The protein may be intrinsically disordered.
- Solution: Check the pLDDT profile from a standard AF2 prediction. Regions with low pLDDT (<50) are likely disordered, and their structural heterogeneity may not reflect a functional conformational change [23].
Issue 3: I cannot reproduce a known alternative conformation from a reference paper.
Possible Causes and Solutions:
- Cause: The optimal parameters (masking level, subsampling depth) can be target-dependent.
- Solution: Do not rely on a single parameter set. Perform a grid search over key parameters like masking probability (e.g., 5%, 10%, 15%, 20%) to find what works best for your specific protein [22].
Experimental Protocols & Data
Protocol 1: Implementing an AFsample2-like Workflow with MSA Column Masking
This protocol is based on the AFsample2 method for predicting multiple conformations [22].
- Input Preparation: Generate your master MSA using standard tools (e.g., JackHMMR against UniRef90, BFD, and MGnify databases).
- MSA Masking: For each model you generate, create a uniquely masked version of the master MSA. Randomly select a predefined percentage (e.g., 15%) of columns and replace all amino acids in those columns with "X" (unknown residue). The first row (target sequence) should not be masked.
- Run Inference: Execute the AlphaFold2 neural network with the following modifications:
- Input a differently masked MSA for each model.
- Activate dropout during inference (e.g., 10% for Evoformer, 25% for structure module).
- Use a limited number of recycles (e.g., 3).
- Post-processing: Cluster the resulting models (e.g., by TM-score). Analyze clusters to identify representative structures for different conformational states. Use the pLDDT and Predicted Align Error (PAE) for validation.
Protocol 2: Exploring Conformational Landscapes via MSA Subsampling
This protocol is derived from high-throughput methods used to predict conformational populations [24].
- Build a Deep Master MSA: Compile an extensive MSA for your target sequence.
- Configure AF2 Parameters: Set the key MSA depth parameters to reduced values. A combination of
max_seq:256andextra_seq:512has been shown effective for kinases, but this should be optimized. - Enable Stochastic Inference: Run multiple independent predictions (e.g., 32 runs with 5 models each, totaling 160 models) with different random seeds.
- Activate Dropout: Use dropout with a 10% rate for the Evoformer and 25% for the structure module during predictions.
- Analyze the Ensemble: The resulting ensemble of structures can be analyzed to identify major alternative conformations. For some systems, the population of different clusters can be correlated with relative state populations in experiments like NMR [24].
The following tables summarize key quantitative findings from recent studies to guide your experimental design and expectations.
Table 1: Performance Improvement of AFsample2 over Standard AF2 (AFvanilla)
| Protein Dataset | Targets with Improved Alternate State (ΔTM>0.05) | Notable Example Improvement |
|---|---|---|
| OC23 (Open-Closed Proteins) | 9 out of 23 cases | TM-score improved from 0.58 to 0.98 [22] |
| Membrane Protein Transporters | 11 out of 16 targets | Significant improvements in alternate state modeling [22] |
Table 2: Effect of MSA Column Masking Level on Model Quality and Confidence (AFsample2)
| Masking Level | Best TM-score (Alternate State) | Impact on Mean pLDDT | Recommendation |
|---|---|---|---|
| 0% (No Masking) | 0.80 | Baseline (Highest) | Avoid for diverse sampling [22] |
| 15% | 0.88 | Linear decrease (~2% drop per 5% masking) | Optimal starting point [22] |
| >30-35% | Deteriorates | Rapid drop in confidence | Use with caution [22] |
Table 3: Key Parameters for MSA Subsampling Protocol
| Parameter | Standard AF2 Setting | Subsampling Setting | Function |
|---|---|---|---|
max_seq |
512 | 256 | Number of sequences randomly selected from master MSA [24] |
extra_seq |
1024 | 512 | Number of sequences sampled from each cluster [24] |
| Dropout (Inference) | Off | On (Evoformer: 10%, Structure: 25%) | Introduces stochasticity during model generation [24] |
| Number of Models | 5 | 160+ | Increased sampling to explore conformational space [22] [24] |
Workflow and Signaling Pathways
Diagram 1: Workflow for Enhanced Conformational Sampling
Diagram 2: Logic of MSA-Based Sampling Strategies
The Scientist's Toolkit: Research Reagent Solutions
Table 4: Essential Computational Tools and Resources
| Item | Function / Description | Example / Source |
|---|---|---|
| AlphaFold2 Codebase | Open-source code for running structure predictions. Can be modified for methods like MSA masking. | GitHub: https://github.com/google-deepmind/alphafold/ [25] |
| ColabFold | Accelerated and user-friendly version of AF2, useful for rapid prototyping. | https://colabfold.mmseqs.com [23] |
| AFsample2 | A specific method that integrates MSA column masking into the AF2 inference process. | Described in Nature Communications Biology [22] |
| UniProt | Standard repository of protein sequences; used for finding homologs for MSA construction. | https://www.uniprot.org/ [26] |
| AlphaFold Protein Structure Database | Repository of pre-computed AF2 predictions; useful for obtaining a ground state model for comparison. | https://alphafold.ebi.ac.uk [26] |
| JackHMMER/MMseqs2 | Software tools for building deep Multiple Sequence Alignments (MSAs) from sequence databases. | Standard tools for MSA generation [24] |
| PDB (Protein Data Bank) | Repository of experimental protein structures; essential for validating predicted alternative conformations. | https://www.rcsb.org/ |
Frequently Asked Questions (FAQs) & Troubleshooting Guides
FAQ 1: Why are the self-confidence scores (pLDDT) from AlphaFold2 not always reliable, especially in certain regions?
AlphaFold2's predicted Local Distance Difference Test (pLDDT) scores serve as a key confidence metric for its structural predictions. However, a significant limitation is that poorly modeled regions of a protein may sometimes be assigned high confidence, which can be misleading for downstream applications [3].
The reliability of pLDDT scores is notably lower in intrinsically disordered regions (IDRs). These regions lack a well-defined 3D structure and often exhibit lower sequence conservation. Since AlphaFold2's architecture and training are optimized for structured domains, its pLDDT scores are less accurate for IDRs. Consequently, tools like AlphaMissense that rely on AlphaFold2 models also show reduced sensitivity in predicting pathogenic mutations within disordered regions [27].
Table: Challenges with AlphaFold2 Self-Confidence Scores in Different Protein Regions
| Protein Region Type | Key Characteristics | pLDDT Reliability | Impact on Downstream Tools |
|---|---|---|---|
| Structured / Ordered Regions | Well-defined 3D structure; higher sequence conservation. | High | High sensitivity for variant effect prediction (e.g., AlphaMissense). |
| Intrinsically Disordered Regions (IDRs) | Lack fixed 3D structure; dynamic and flexible; lower conservation. | Low | Reduced sensitivity; pathogenic mutations are harder to identify accurately. |
Troubleshooting Guide: Interpreting Low pLDDT Scores
- Symptom: Your AlphaFold2 model has contiguous regions with pLDDT scores below 70.
- Diagnosis: These regions are likely intrinsically disordered or have no evolutionary homologs, making them difficult for AlphaFold2 to model based on co-evolutionary signals [27].
- Action:
- Cross-verify with disorder predictors: Use specialized tools like AIUPred or metapredict to confirm if the low-pLDDT region is predicted to be disordered [27].
- Use with caution: Avoid using the atomic coordinates of these low-confidence regions for functional analysis or docking studies.
- Seek experimental validation: Consider using spectroscopic techniques or nuclear magnetic resonance (NMR) to probe the actual structural properties of these regions.
FAQ 2: How can I improve the accuracy of self-confidence scores for my AlphaFold2 models?
A proposed solution is to replace AlphaFold2's standard pLDDT prediction module with an enhanced framework that integrates more sophisticated data analysis. The Equivariant Quality Assessment Folding (EQAFold) method addresses this by using an Equivariant Graph Neural Network (EGNN) as a new prediction head [3].
EQAFold generates more reliable confidence scores by leveraging a broader set of input features than standard AlphaFold2, including:
- Root Mean Square Fluctuation (RMSF): Calculated from multiple AlphaFold2 models generated with 50% dropout in the structure module. RMSF provides a measure of positional variance, which negatively correlates with LDDT [3].
- Protein Language Model Embeddings: Layer-wise embeddings from models like ESM2 are incorporated, capturing deep evolutionary and semantic information from protein sequences [3].
- Graph Representation of Structure: The protein structure is converted into a graph, allowing the EGNN to leverage both node (residue-level) and edge (pairwise) information, which the original AlphaFold2 pLDDT head does not fully utilize [3].
Table: Key Research Reagent Solutions for Enhanced Confidence Scoring
| Reagent / Resource | Type | Function in the Protocol | Source/Availability |
|---|---|---|---|
| EQAFold | Software Framework | Replaces AlphaFold2's LDDT head with an EGNN to provide more accurate self-confidence scores. | GitHub: kiharalab/EQAFold_public [3] |
| ESM-2 Protein Language Model | Pre-trained Model | Provides contextual sequence embeddings that capture evolutionary and structural constraints. | Hugging Face / Meta GitHub [28] |
| Equivariant Graph Neural Network (EGNN) | Algorithm/Architecture | Parses protein structure graphs while respecting rotational and translational symmetries. | [3] |
| CABS-flex | Simulation Software | A tool for protein flexibility simulations that can be enhanced by integrating AlphaFold's pLDDT scores to refine its restraint schemes. | GitHub: kwroblewski7/cabsflex_restraints [29] |
Experimental Protocol: Benchmarking Improved Confidence Scores
- Dataset Curation: Assemble a test set of monomeric protein structures with high-resolution experimental determinations (e.g., ≤ 2.5 Å). Ensure no more than 40% sequence similarity between training and test sets to prevent redundancy [3].
- Model Generation:
- Generate predicted structures and pLDDT scores using the standard AlphaFold2 pipeline.
- Generate five additional structure models using AlphaFold2 with 50% dropout in the structure module. Calculate the RMSF from the Cα atoms of these replicate models [3].
- Feature Extraction:
- Extract the final single and pair representations from AlphaFold2's Evoformer and structure modules.
- Compute embeddings for the target sequence using a protein language model like ESM2 [3].
- Graph Construction and Training:
- Represent the protein as a graph where nodes are amino acids and edges connect residues within a 16 Å Cα distance.
- Construct node features by concatenating single representations, ESM2 embeddings, and RMSF values. Use pair embeddings as edge features [3].
- Train the EGNN-based LDDT prediction head on your curated dataset to minimize the error between predicted and true LDDT.
- Validation: Evaluate the model-level and residue-level accuracy of the new confidence scores against the true LDDT calculated from the experimental structure. Compare the performance against the standard AlphaFold2 pLDDT [3].
The workflow for integrating these diverse data sources into an improved confidence score can be visualized as follows:
FAQ 3: What approaches exist for proteins with no homologs (orphan proteins) where MSA-based methods fail?
For orphan proteins that lack evolutionary homologs, generating a deep Multiple Sequence Alignment (MSA) is impossible. This severely limits the performance of MSA-dependent tools like AlphaFold2 [30].
Alternative strategies that do not rely on MSAs include:
- Single-Sequence Protein Language Models (PLMs): Models like RGN2, which uses AminoBERT, learn latent structural information from millions of unaligned protein sequences. They can predict structure directly from a single sequence, achieving performance comparable to or better than AlphaFold2 on orphan proteins while being significantly faster (up to 10^6-fold reduction in compute time) [30].
- Leveraging Implicit Evolutionary Information: PLMs like ESM-2 are trained on massive datasets of diverse sequences, allowing them to learn evolutionary patterns implicitly without needing explicit MSA generation [31]. This captured information can be used for structure prediction or directly as feature inputs for other tasks.
Troubleshooting Guide: Handling Orphan Protein Prediction
- Symptom: AlphaFold2 produces a model with very low overall confidence, or the MSA generation stage returns few or no hits.
- Diagnosis: The target protein is likely an orphan or has rapidly evolving sequences.
- Action:
- Use a single-sequence method: Run the target sequence through a single-sequence predictor like RGN2 or ESMFold [30].
- Compare results: If both AlphaFold2 and the single-sequence method yield a high-confidence model with similar folds, confidence in the prediction increases.
- Focus on PLM embeddings: Even if the 3D structure is uncertain, use the embeddings from models like ESM-2 as features for predicting other properties, such as function or interaction sites [28].
Table: Comparison of MSA-dependent vs. Single-Sequence Prediction Approaches
| Feature | MSA-Dependent (e.g., AlphaFold2) | Single-Sequence PLM (e.g., RGN2, ESMFold) |
|---|---|---|
| Core Requirement | Deep Multiple Sequence Alignment (MSA) | Single amino acid sequence |
| Performance on Orphan Proteins | Low (fails without homologs) | High (designed for this scenario) |
| Computational Speed | Slower (due to MSA generation) | Significantly faster (up to millions of times) |
| Theoretical Basis | Leverages co-evolutionary signals from related sequences | Learns biophysical rules from the statistical patterns in the sequence universe |
Frequently Asked Questions
Q1: What does a low pLDDT score (e.g., below 50) mean in my AlphaFold prediction, and how should I handle it?
A low pLDDT score indicates very low local confidence. This typically means one of two things: the region is naturally unstructured (intrinsically disordered) or AlphaFold lacks sufficient information to make a confident prediction [1]. To handle this:
- For structural analysis: Consider removing residues with pLDDT < 70 to obtain a more reliable core structure. Residues with pLDDT above 70 usually have a correctly predicted backbone, while scores above 90 indicate high accuracy for both backbone and side chains [1] [32].
- For functional analysis: Be aware that some intrinsically disordered regions (IDRs) with low pLDDT may undergo binding-induced folding. Conversely, AlphaFold may sometimes predict conditionally folded states for IDRs with high confidence, which may not reflect the physiological unbound state [1].
Q2: DeepSCFold constructs "paired MSAs." Why is this critical for predicting protein complexes, and what can I do if my paired MSA is too shallow?
Traditional monomeric MSAs lack information about co-evolution between potential interaction partners. Paired MSAs are critical because they explicitly encode residue-residue correlations across protein chains, which provide evolutionary constraints to guide the accurate modeling of the interaction interface [33] [34]. If your paired MSA is shallow (contains too few sequences), DeepSCFold leverages several solutions:
- It uses deep learning models (pSS-score and pIA-score) to predict structural similarity and interaction probability between monomeric sequences to construct more accurate paired MSAs [34].
- It integrates information from multiple sources, including species annotations, UniProt accession numbers, and known complexes from the PDB [34].
Q3: My protein complex prediction has high confidence (pLDDT) for individual domains but the overall orientation seems wrong. What metric should I check?
The pLDDT score is a per-residue local confidence metric and does not reliably assess the relative positions or orientations of domains [1]. You must examine the Predicted Aligned Error (PAE) plot. The PAE plot indicates AlphaFold's confidence in the relative positioning of any two residues in the structure. For domain orientation, check for large predicted errors between residues in different domains. Tools like the phenix-process_predicted_model protocol can use PAE information to help identify compact domains [32].
Q4: Are there methods newer than standard AlphaFold that provide more reliable self-confidence scores like pLDDT?
Yes, research is actively addressing cases where AlphaFold's self-confidence scores are unreliable. EQAFold is an enhanced framework that replaces AlphaFold's standard pLDDT prediction head with an Equivariant Graph Neural Network (EGNN). This architecture better leverages spatial and pairwise information, leading to a more accurate alignment between the predicted confidence and the actual quality of the structural model [3].
Troubleshooting Guides
Problem: Poor Quality Paired Multiple Sequence Alignment (MSA) Symptoms: Low overall pLDDT in the complex interface, inconsistent models across multiple runs, and high PAE between chains. Solutions:
- Utilize Integrated Predictors: Ensure you are using DeepSCFold's built-in pSS-score and pIA-score models, which are designed to identify potential interaction partners from monomeric MSAs even with sparse direct evolutionary data [34].
- Broaden Sequence Databases: Confirm your search includes diverse databases such as UniRef30, UniRef90, BFD, and MGnify to maximize the number of homologous sequences found [34].
- Leverage External Information: Use the protocol's option to incorporate metadata like species annotation and UniProt IDs, which can help in generating more biologically plausible paired sequences [34].
Problem: Handling Low-Confidence Regions and Domain Splitting Symptoms: Long, flexible loops or linkers with pLDDT < 50 are obscuring the analysis of well-folded domains. Solutions:
- Identify Low-Confidence Residues: In tools like PyMOL, pLDDT scores are stored in the B-factor column. You can select low-confidence residues by filtering on this field (e.g.,
b < 50) [35]. - Automated Processing: Use the phenix-processpredictedmodel protocol. Feed it your predicted structure (with pLDDT as B-factor) and the corresponding PAE file. The protocol can automatically remove low-confidence residues (e.g., pLDDT < 70) and split the remaining structure into compact, well-defined domains [32].
- Manual Inspection: Always visually inspect the processed model to confirm that the biological units of interest have been preserved.
Problem: Inaccurate Self-Assessment of Model Quality by AlphaFold Symptoms: Regions of the model that appear poorly folded are assigned high pLDDT scores, or well-folded regions are assigned low confidence. Solutions:
- Run EQAFold: If available, use EQAFold to generate the structure and its confidence scores. Its EGNN-based quality assessment is specifically designed to provide a more reliable confidence metric than standard AlphaFold's pLDDT, particularly for regions with substantial errors [3].
- Consensus-Based Assessment: Generate multiple models (e.g., using AlphaFold with dropout enabled) and calculate the Root Mean Square Fluctuation (RMSF) between them. Regions with high fluctuation (high RMSF) across different runs typically have lower reliability, a feature that EQAFold integrates directly into its confidence prediction [3].
Research Reagent Solutions
Table 1: Essential software and databases for advanced complex prediction pipelines.
| Item Name | Type | Function in the Pipeline |
|---|---|---|
| DeepSCFold | Software Suite | An integrated system for high-accuracy protein complex modeling. Its key function is constructing complex paired MSAs using predicted interaction probabilities and structural similarity [34]. |
| AlphaFold-Multimer | Software / Algorithm | The core structure prediction engine within DeepSCFold that takes paired MSAs and folds the protein complex structure [34]. |
| UniRef90/UniRef30 | Sequence Database | Curated clusters of protein sequences used to build deep multiple sequence alignments (MSAs), providing evolutionary information for accurate structure prediction [34]. |
| ESM2 Protein Language Model | Algorithm / Embedding | A protein language model that provides evolutionary-scale sequence embeddings. These embeddings are used as input features in methods like EQAFold to improve the accuracy of quality assessment [3]. |
| PAE File | Data / Metric | The Predicted Aligned Error file output by AlphaFold. It is essential for evaluating inter-domain and inter-chain confidence and is used by downstream processing tools [32]. |
| phenix.processpredictedmodel | Software Tool | A protocol for post-processing AlphaFold outputs. It automatically removes very low-confidence residues and splits the cleaned structure into compact structural domains [32]. |
Experimental Data & Workflows
Table 2: Key quantitative performance metrics from relevant tools and studies.
| Method / Database | Key Performance Metric | Context / Explanation |
|---|---|---|
| DeepSCFold (GuijunLab-Complex) | Ranked 11th out of 111 groups | Based on models with the best scores for protein domains in CASP [34]. |
| DeepSCFold (GuijunLab-Assembly) | Ranked 14th out of 86 groups (2nd for easy/medium targets) | Based on models with the best scores for protein multimers in CASP [34]. |
| EQAFold | Average pLDDT error: 4.74 | Benchmark on 726 monomeric proteins. Lower error indicates more reliable self-confidence scores compared to standard AlphaFold (error of 5.16) [3]. |
| Standard AlphaFold (AFDB) | Average pLDDT error: 5.16 | Baseline for comparison on the same test set of 726 proteins [3]. |
| pLDDT Score Ranges | >90: Very High70-90: Confident50-70: Low<50: Very Low | Standard interpretation scale for per-residue confidence. A score above 70 usually indicates a correct backbone [1]. |
Workflow: DeepSCFold for Protein Complex Prediction
DeepSCFold Complex Prediction Workflow
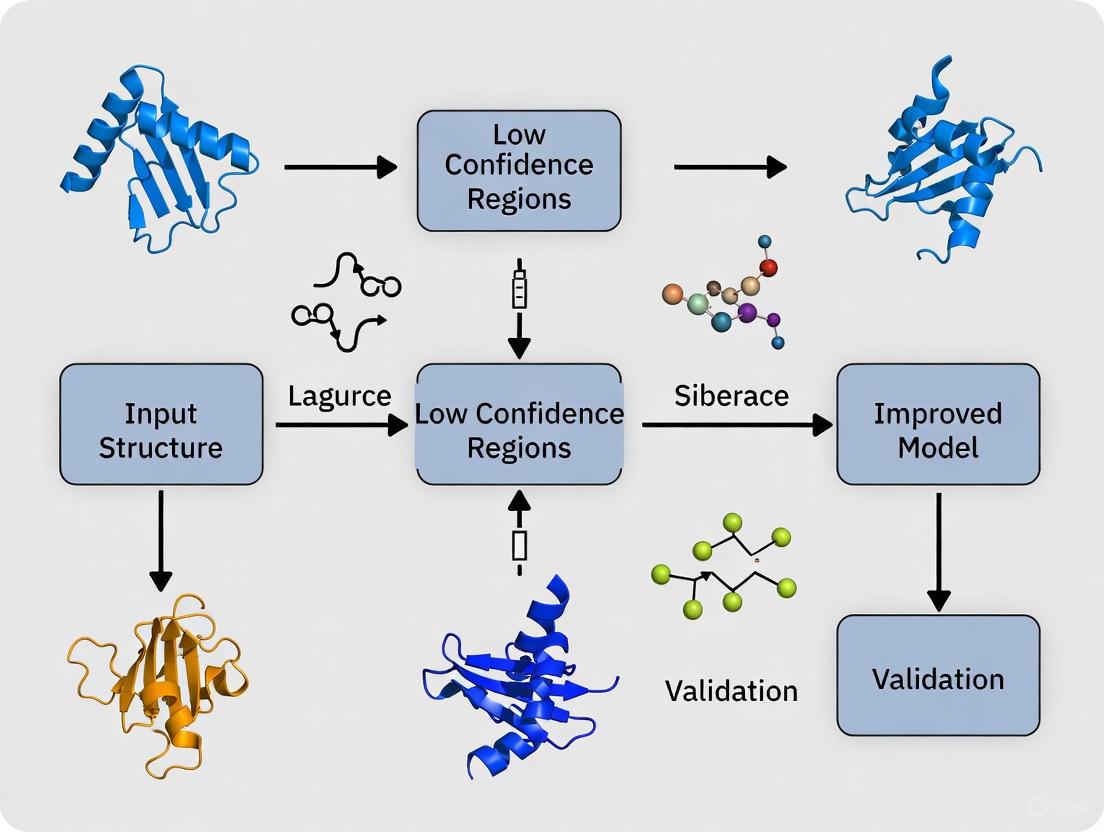
Workflow: Improving and Processing Low-Confidence Predictions
Confidence Improvement and Processing Pipeline
Troubleshooting Common Scenarios: A Practical Guide for Specific Challenges
Addressing Hallucinations in Intrinsically Disordered Proteins and Regions
Frequently Asked Questions (FAQs)
Q1: What is a "hallucination" in the context of AlphaFold and intrinsically disordered proteins?
A hallucination occurs when AlphaFold3 incorrectly predicts the structural state of a protein region. For Intrinsically Disordered Proteins (IDPs) and Intrinsically Disordered Regions (IDRs), this primarily manifests in two ways:
- False Order: AlphaFold3 predicts a region with a high-confidence, stable 3D structure (high pLDDT score) when experimental data confirms it is genuinely disordered.
- False Disorder: AlphaFold3 predicts a region with low confidence and no defined structure (low pLDDT score) when experimental data shows it has a stable, ordered structure. A recent study found that 32% of residues in a curated set of IDPs were misaligned with experimental databases, with 22% of all residues classified as hallucinations [36].
Q2: Why is accurately predicting IDP structure so important for drug discovery?
IDPs are crucial functional components in human biology, making them attractive therapeutic targets. They comprise 30-40% of the human proteome and are heavily implicated in critical biological processes like transcription, signaling, and disease [37] [36]. For example, approximately 80% of human cancer-associated proteins contain long disordered regions [36]. Hallucinations, particularly false order in biologically active regions, can misdirect drug design efforts by suggesting stable binding pockets or interfaces that do not exist in reality, leading to costly dead-ends in research [37] [38].
Q3: How can I identify a potential hallucination in my AlphaFold3 prediction?
The primary indicator is a discrepancy between the predicted local distance difference test (pLDDT) confidence score and experimental or bioinformatic evidence.
- pLDDT Score: This per-residue confidence score is scaled from 0 to 100 [1]. While a low pLDDT (below 50) can indicate a naturally disordered region, it can also mean AlphaFold lacks enough information to make a confident prediction [1].
- Key Sign: A high pLDDT score (e.g., >70) in a region that is annotated as disordered in databases like DisProt, or that is predicted to be disordered by other algorithms, is a strong signal of a potential "false order" hallucination [37] [36].
Q4: My protein is known to be disordered, but AlphaFold3 predicts a high-confidence structure. Is this always wrong?
Not necessarily. This may represent a context-driven misalignment rather than a pure hallucination. Some IDRs are conditionally folded—they remain disordered alone but adopt a stable structure upon binding to a partner biomolecule (like another protein, nucleic acid, or ion) or after a post-translational modification [1]. AlphaFold3 has a tendency to predict these conditionally folded, high-affinity states because they are often well-represented in its training data from the Protein Data Bank (PDB) [1]. This behavior highlights that a single AlphaFold3 prediction may not capture the full spectrum of a protein's conformational dynamics.
Q5: What experimental techniques are best for validating the structure of disordered regions?
Nuclear Magnetic Resonance (NMR) spectroscopy is arguably the most powerful technique for studying IDPs. Unlike X-ray crystallography, which requires a stable structure, NMR can characterize disordered states and report on residual structure, dynamics, ligand binding, and structural changes on a per-residue basis [39]. Other key biophysical techniques include:
- Small-Angle X-Ray Scattering (SAXS): Provides information about the overall dimensions and shape of disordered ensembles in solution [13].
- Circular Dichroism (CD) Spectroscopy: Can indicate the presence of transient secondary structure. These techniques are essential for grounding computational predictions in experimental reality.
Troubleshooting Guides
Guide 1: Diagnosing and Validating AlphaFold3 Hallucinations in IDRs
This guide provides a step-by-step protocol to assess the reliability of AlphaFold3 predictions for potentially disordered proteins.
- Objective: To systematically identify regions within a protein sequence where AlphaFold3 predictions may be hallucinating and to validate findings with experimental data.
- Background: The diffusion-based architecture of AlphaFold3, while powerful, can invent plausible-looking structures in regions that are inherently unstructured. This protocol uses a multi-source verification approach [37] [36].
Experimental Protocol
| Step | Action | Description | Key Output |
|---|---|---|---|
| 1 | Generate AF3 Predictions | Run the target protein sequence through AlphaFold3. Use multiple random seeds (e.g., no seed, '5', '1234567890') to assess reproducibility. | Multiple predicted structures (CIF format). |
| 2 | Extract Confidence Metrics | Programmatically parse the pLDDT scores for each residue from the B-factor column of the output CIF files. | Residue-level pLDDT data. |
| 3 | Gather Reference Data | Annotate the sequence using the manually curated DisProt database, which contains experimental evidence for disorder [36]. Run a disorder predictor like IUPred2 for additional computational evidence [5]. | Experimental and computational disorder annotations. |
| 4 | Classify Residues | Compare pLDDT scores to reference data. A common threshold is pLDDT ≥70 for "ordered" and <70 for "disordered" [36]. Classify discrepancies. | Table of aligned, hallucinated, and context-driven residues. |
| 5 | Contextual Modeling | For residues flagged as "context-driven," use AlphaFold3 to model the protein in complex with its known binding partners (if available) to see if the ordered prediction is justified [36]. | Complex structure predictions. |
| 6 | Experimental Validation | For critical regions, validate predictions using experimental techniques such as NMR or SAXS [39] [13]. | Experimental structural data. |
Guide 2: Generating Structural Ensembles for Disordered Proteins
This guide outlines an advanced method, AlphaFold-Metainference, to move beyond single structures and model the dynamic ensembles of IDPs.
- Objective: To construct a structural ensemble of a disordered protein that is consistent with both AlphaFold-predicted distances and experimental data.
- Background: A single static structure is inadequate to represent the heterogeneous nature of IDPs. This protocol integrates deep learning predictions with molecular dynamics to generate a more accurate ensemble of conformations [13].
Experimental Protocol
| Step | Action | Description | Key Output |
|---|---|---|---|
| 1 | Obtain AlphaFold Distogram | Generate the raw distance distribution map (distogram) for the protein using AlphaFold. Note: AlphaFold predicts distances up to ~22 Å [13]. | Predicted distogram. |
| 2 | Filter Distance Restraints | Apply a filtering criterion to select the most informative predicted distances for use as restraints, focusing on shorter-range contacts [13]. | Filtered distance restraints. |
| 3 | Set Up Metainference Simulation | Use the AlphaFold-Metainference method, which implements these distance restraints within a molecular dynamics framework according to the maximum entropy principle [13]. | Simulation input files. |
| 4 | Run Ensemble Simulation | Perform the molecular dynamics simulation. The restraints guide the simulation to generate an ensemble of structures that collectively satisfy the predicted distances. | Structural ensemble (trajectory). |
| 5 | Validate with SAXS | Compare the computed SAXS profile from the generated ensemble with experimental SAXS data to validate accuracy [13]. | Kullback-Leibler distance to experiment. |
Table 1: Quantitative Analysis of AlphaFold3 Hallucinations in IDPs
This table summarizes key findings from a study that analyzed AlphaFold3 predictions on 72 IDPs from the DisProt database [36].
| Metric | Value | Interpretation |
|---|---|---|
| Residues Misaligned with DisProt | 32% | Nearly one-third of all residue predictions did not match experimental annotations. |
| Hallucinated Residues | 22% | Represents clear errors (false order or false disorder). |
| Context-Driven Misalignment | 10% | Suggests AF3 predicts conditionally folded states. |
| Hallucinations in Biological Process Residues | 18% | Highlights a significant risk for misinterpretation in functionally critical areas. |
| Proteins with <70% DisProt Alignment | >50% | Over half of the tested proteins showed poor overall agreement. |
Table 2: Interpreting pLDDT Confidence Scores
This table provides a standard guide for interpreting per-residue pLDDT scores, based on AlphaFold documentation and research [1].
| pLDDT Score Range | Confidence Level | Structural Interpretation |
|---|---|---|
| 90 - 100 | Very High | High backbone and side chain accuracy. |
| 70 - 90 | Confident | Generally correct backbone, some side chain placement errors. |
| 50 - 70 | Low | Caution advised; may be flexible or poorly predicted. |
| < 50 | Very Low | Likely to be an intrinsically disordered region (IDR) or unstructured linker [1]. |
The Scientist's Toolkit: Research Reagent Solutions
| Item | Function / Explanation | Relevance to IDP Hallucination Research |
|---|---|---|
| DisProt Database | A manually curated database of experimental annotations for IDPs and IDRs. | Serves as the ground-truth benchmark for identifying hallucinations by providing experimental disorder annotations [36]. |
| NARDINI+ Algorithm | An unsupervised learning algorithm that identifies molecular "grammars" in IDR sequences. | Helps classify IDR functions and understand sequence-determinants of structure, providing a basis for why some regions might be mispredicted [40]. |
| AlphaFold-Metainference | A method that uses AlphaFold-predicted distances as restraints in molecular dynamics simulations. | Generates structural ensembles for disordered proteins, moving beyond single, potentially hallucinated, structures [13]. |
| NMR Spectroscopy | A biophysical technique for determining the structure and dynamics of proteins in solution. | The gold-standard for experimentally validating predictions of disorder and transient structure on a per-residue basis [39]. |
| 15N-labeled Media | Growth media containing 15N isotope used for producing labeled proteins for NMR. | Essential for producing the sample required for key NMR experiments (e.g., 15N-HSQC) to study IDPs [39]. |
Improving Predictions for Antibody-Antigen and Protein-Protein Complexes
Frequently Asked Questions (FAQs)
1. What do low pLDDT scores signify in my AlphaFold model, and how should I interpret them? A low pLDDT score (typically below 70) indicates a region where the model has low confidence. However, this can stem from different causes, and the structural output can manifest in distinct behavioral modes, ranging from non-protein-like "barbed wire" to near-predictive folds that can be useful for molecular replacement. It is critical to analyze these regions beyond the score itself [19].
2. Why does AlphaFold sometimes fail to predict the correct structures for antibody-antigen complexes? Accurately modeling antibody-antigen interactions is challenging due to the inherent flexibility of antibodies, particularly in the Complementarity-Determining Region H3 (CDR-H3). Current deep learning models, including AlphaFold, struggle to capture the full scope of these large-scale conformational changes and dynamic binding processes [41] [42].
3. Can AlphaFold predict multiple distinct conformations for a single protein sequence? AlphaFold is primarily a powerful pattern recognition engine and often predicts only the most common conformation seen in its training data. It is a weak predictor of fold-switching, where a single sequence adopts multiple distinct structures. Its successes in this area are often driven by memorization of training-set structures rather than a learned understanding of protein energetics that govern multiple states [43].
4. What is the role of the Multiple Sequence Alignment (MSA) in complex prediction, and are there better alternatives? While MSAs provide valuable co-evolutionary information, they can be insufficient for complexes that lack clear co-evolutionary signals, such as antibody-antigen or virus-host systems. Novel pipelines like DeepSCFold now complement or replace traditional MSA-based approaches by using deep learning to predict protein-protein structural similarity and interaction probability directly from sequence, leading to significant improvements in accuracy [44].
Troubleshooting Guides
Issue 1: Handling Low-Confidence (Low-pLDDT) Regions
Problem: Your AlphaFold prediction contains extensive regions with low pLDDT scores, and you are unsure if the predicted coordinates are usable.
Diagnosis and Solution: Low-pLDDT regions can be categorized into specific behavioral modes. Correct identification is essential for deciding how to handle the model.
- Step 1: Run a barbed wire analysis. Use the
phenix.barbed_wire_analysistool to automatically categorize residues in your prediction. This tool uses pLDDT, packing scores from atomic contacts, and MolProbity validation metrics to classify residues [19]. - Step 2: Interpret the modes. Use the following table to understand the analysis output and take appropriate action.
Table 1: Behavioral Modes of Low-pLDDT Regions and Recommended Actions
| Behavioral Mode | Key Identifying Features | Predictive Value | Recommended Action |
|---|---|---|---|
| Barbed Wire | Extremely unprotein-like; wide looping coils; absence of packing contacts; numerous validation outliers [19]. | None | Remove these regions when preparing models for molecular replacement or other downstream tasks [19]. |
| Pseudostructure | Isolated, badly formed secondary-structure-like elements; intermediate behavior [19]. | Low/None | Generally discard. Often associated with signal peptides [19]. |
| Near-Predictive | Resembles folded protein; has adequate packing contacts despite low pLDDT; few validation outliers [19]. | High (can be nearly accurate) | Retain and use. These regions can be valuable for molecular replacement even with pLDDT as low as 40 [19]. |
Issue 2: Improving Prediction of Antibody-Antigen Complexes
Problem: Standard AlphaFold predictions for antibody-antigen complexes are inaccurate, especially in the flexible CDR loops.
Diagnosis and Solution: The intrinsic flexibility of antibodies is a major challenge. Integrate flexibility metrics directly into the prediction pipeline.
- Step 1: Generate structures and pLDDT scores. Use ESMFold to predict the structure of your antibody. ESMFold provides a fast, single-sequence-based prediction and an associated pLDDT confidence score for each residue [42].
- Step 2: Use pLDDT as a proxy for flexibility. Evidence shows that pLDDT scores correlate with protein flexibility. In antibodies, the highly flexible CDRH3 loop consistently displays lower pLDDT scores compared to more rigid regions like CDRL2 [41] [42].
- Step 3: Incorporate flexibility into interaction prediction. Feed the antibody structure and its per-residue pLDDT scores into a fingerprint-based prediction model like dMaSIF. Using pLDDT to inform the model of residue flexibility has been shown to improve the predictive accuracy for antibody-antigen interactions by 4%, achieving an AUC-ROC of 92% [41] [42].
The workflow for this protocol is summarized in the diagram below:
Issue 3: Modeling Complexes with Weak Co-evolutionary Signals
Problem: Predicting complexes where standard MSA pairing fails due to a lack of inter-chain co-evolution (e.g., antibody-antigen, virus-host).
Diagnosis and Solution: Move beyond sequence-based co-evolution by leveraging methods that infer structural complementarity directly from sequence.
- Step 1: Implement the DeepSCFold pipeline. DeepSCFold is specifically designed to address this limitation.
- Step 2: Predict structure-aware scores. The pipeline uses deep learning models to predict a protein-protein structural similarity score (pSS-score) and an interaction probability score (pIA-score) from monomeric sequences alone [44].
- Step 3: Construct paired MSAs. Use these pSS-scores and pIA-scores to systematically rank and pair sequences from individual subunit MSAs, creating high-quality paired MSAs based on predicted structural compatibility rather than just sequence similarity [44].
- Step 4: Generate the complex structure. Feed the resulting paired MSAs into AlphaFold-Multimer for final structure prediction. This approach has been shown to improve the TM-score by over 10% compared to AlphaFold3 on CASP15 targets and enhance the success rate for antibody-antigen binding interfaces by 24.7% over AlphaFold-Multimer [44].
The following diagram illustrates the core DeepSCFold workflow:
Table 2: Essential Computational Tools for Improving Complex Predictions
| Tool / Resource | Function / Purpose | Key Application |
|---|---|---|
| ESMFold [42] | Protein structure prediction from a single sequence, generating a 3D model and pLDDT confidence scores. | Fast generation of antibody structures and flexibility proxies (pLDDT). |
| dMaSIF [41] [42] | A fingerprint-based method for predicting protein-protein interaction sites. | Modeling antibody-antigen interactions when supplied with pLDDT flexibility data. |
| DeepSCFold [44] | A pipeline that constructs paired MSAs using predicted structural similarity and interaction probability. | Greatly enhancing complex structure prediction for targets lacking strong co-evolutionary signals. |
| Phenix (barbedwireanalysis) [19] | Categorizes low-pLDDT regions in AlphaFold models into behavioral modes (Barbed Wire, Pseudostructure, Near-Predictive). | Critical validation and pruning step to identify usable regions in low-confidence predictions. |
| ITsFlexible [42] | A supervised model that classifies antibody CDR3 loops as either rigid or flexible. | Provides a biologically-grounded, task-specific assessment of antibody loop flexibility. |
Frequently Asked Questions (FAQs)
Q1: Can AlphaFold predict the structure of a protein bound to a drug-like molecule? While the original AlphaFold2 was not trained to predict ligand binding, AlphaFold 3 (AF3) is specifically designed for this task and demonstrates substantially improved accuracy for predicting protein-ligand interactions compared to traditional docking tools. It uses the ligand's SMILES string as input to predict the joint structure [45]. However, side chains in the predicted pocket may not be optimally oriented, and validation with molecular docking and free energy calculations is recommended [46].
Q2: Why does my protein-protein complex model have a high interface score but seem biologically implausible? A high interface score (ipTM) does not always guarantee biological reality. The model might be forced into an artificial interface due to sequence arrangement or input setup. Always cross-reference predicted interfaces with biological annotation from prior literature or interaction databases. For multimer modeling, carefully define stoichiometry and run multiple permutations of chain arrangements to find the most biologically plausible model [46].
Q3: How reliably can I use a low pLDDT score to identify a disordered or flexible region? A low pLDDT score (e.g., below 50) strongly correlates with intrinsic disorder and high flexibility [47] [48]. However, be cautious of regions with high pLDDT that are predicted as disordered by other algorithms, as AlphaFold can sometimes overconfidently "hallucinate" structure in flexible linkers. For critical applications, compare AlphaFold predictions with dedicated disorder predictors like IUPred or MetaDisorder [46].
Q4: I want to model a point mutant. Can I just change the sequence and run AlphaFold? Not reliably. AlphaFold is not designed to predict mutation-induced stability changes (ΔΔG). It may return a high-confidence structure even for a destabilizing mutation. After obtaining the mutant model, you should always use tools like FoldX or Rosetta to compute the change in folding free energy (ΔΔG) to assess the mutation's structural impact [46].
Troubleshooting Guides
Issue 1: Misinterpreting Confidence Metrics (pLDDT, PAE, ipTM)
Problem: High confidence scores are taken at face value, leading to misinterpretation of the model's quality and biological relevance.
Solution:
- Interpret Metrics in Tandem: Do not rely on a single score. Interpret pLDDT (local confidence), PAE (relative positional error), and ipTM (interface confidence) together.
- Add Biological Sense: Cross-reference the predicted model and its interfaces with prior experimental data, known domains from Pfam, and co-evolutionary signals. A high-score interface with no biological support is likely an artifact [46].
- Visualize Attention: If available, inspect attention maps to understand which parts of the sequence the model considered important for folding and interaction.
Table: Guide to AlphaFold Confidence Metrics
| Metric | What It Measures | High Score Indicates | Common Pitfalls |
|---|---|---|---|
| pLDDT | Local per-residue confidence [47]. | Accurate atom positioning for that residue [48]. | Can be high in over-confidently predicted disordered regions [46]. |
| PAE | Expected positional error between residues. | Two residues are predicted to be close in space with high certainty. | Low PAE does not guarantee biological reality of an interaction [46]. |
| ipTM | Confidence in the interface of a complex [49]. | A stable-looking interface was predicted. | The model may force an incorrect but compact interface [46]. |
Issue 2: Poor Setup of Multimers and Complexes
Problem: Artificial, non-biological interfaces are predicted due to incorrect input setup, such as wrong chain order, stoichiometry, or inappropriate linkers.
Solution:
- Define Stoichiometry Explicitly: Clearly specify the number and type of chains (e.g., A+B+B is different from A+B+C).
- Avoid Artificial Linkers: When modeling fusion constructs, run predictions both with and without the linker sequence to check for artifacts.
- Validate with Pairwise Runs: For a heterotrimer A+B+C, also run pairwise predictions (A+B, A+C, B+C) to check for consistent and stable sub-interfaces [46].
- Check Symmetry: For homo-oligomers, check if known symmetry constraints from literature or databases are satisfied by your model.
Workflow for Robust Complex Modeling
Issue 3: Modeling Ligand Binding and Point Mutants
Problem: Using raw AlphaFold models for docking or mutation analysis without further refinement, leading to inaccurate binding poses or missed destabilizing effects.
Solution:
- For Ligand Binding (with AF3):
- Use the SMILES string of the ligand as direct input to AF3 for the most accurate joint prediction [45].
- If using a pre-existing protein model, clean the pocket first: remove or refine loops with poor pLDDT and optimize side-chain rotamers with tools like RosettaRelax.
- Validate the binding pose with molecular dynamics (MD) or consensus docking if possible [46].
- For Point Mutants:
- Predict the structure by submitting the mutant sequence.
- Compute ΔΔG: Run the resulting PDB file through FoldX or Rosetta ddG protocols to calculate the change in folding free energy.
- Integrate other data: Correlate the ΔΔG value with the mutation's location (buried vs. surface) and conservation data [46].
Table: Essential Research Reagent Solutions
| Tool / Reagent | Function | Use Case |
|---|---|---|
| AlphaFold 3 | Joint structure prediction of proteins, nucleic acids, and ligands [45]. | Primary structure and complex prediction. |
| FoldX | Fast and quantitative analysis of interaction energy and protein stability; calculates ΔΔG for mutations [46]. | Validating point mutants; assessing stability. |
| Rosetta | Suite for high-resolution modeling and docking; includes ddG for mutation stability and Relax for side-chain optimization [46]. | Refining models before docking. |
| Molecular Docking Tools (AutoDock, SwissDock) | Predicts binding orientation and affinity of small molecules to a protein target [46]. | Ligand docking (use on refined models). |
| IUPred2A / MetaDisorder | Predicts intrinsically disordered regions from amino acid sequence [46]. | Validating flexible regions flagged by low pLDDT. |
Issue 4: Handling Disordered and Flexible Regions
Problem: AlphaFold outputs a single, static structure, but many proteins or regions are intrinsically disordered and exist as a dynamic ensemble of conformations.
Solution:
- Identify True Disorder: Use low pLDDT scores as a primary indicator and confirm with dedicated disorder predictors (IUPred, MetaDisorder) [46].
- Generate Structural Ensembles: For disordered regions or to study flexibility, use methods like AlphaFold-Metainference. This approach uses AlphaFold-predicted distances as restraints in molecular dynamics (MD) simulations to generate a Boltzmann-weighted ensemble of structures that is consistent with experimental data [13].
- Caution with MD: While MD is superior for flexibility assessment, AF2/3 pLDDT is a reasonable and quick estimator of flexibility, though it fails to capture flexibility induced by interacting partners [47].
Workflow for Modeling Disordered Proteins
Mitigating Unrealistic Structural Propensities in Perfect Repeat Sequences
FAQs and Troubleshooting Guides
Why does AlphaFold2 produce low-confidence (pLDDT) predictions for perfect repeat sequences?
Perfect repeat sequences challenge AlphaFold2's core architecture. The model relies heavily on co-evolutionary signals from Multiple Sequence Alignments (MSAs). In perfect repeats, the high degree of internal sequence symmetry leads to ambiguous and often contradictory evolutionary couplings. The Evoformer module struggles to resolve these conflicting signals, resulting in low self-confidence scores (pLDDT) and potentially unrealistic structural propensities. This is particularly problematic for researchers studying proteins with low-complexity regions, tandem repeats, and intrinsically disordered regions [3] [50].
What techniques can improve confidence scores for repeat regions?
Advanced methodologies focus on enhancing the Local Distance Difference Test (pLDDT) prediction head and leveraging ensemble approaches:
- EQAFold Framework: Replaces AlphaFold2's standard pLDDT prediction head with an Equivariant Graph Neural Network (EGNN). This network better leverages pairwise information and spatial relationships within the predicted structure, processing node features (single representations, protein language model embeddings, RMSF) and edge features (pair embeddings) for more accurate confidence metrics [3].
- Ensemble Methods (FiveFold): Combines predictions from five complementary algorithms (AlphaFold2, RoseTTAFold, OmegaFold, ESMFold, EMBER3D). This consensus-building approach mitigates individual algorithmic biases and captures a broader conformational landscape, helping to identify more reliable structural features in challenging regions [51].
- MSA Manipulation: Techniques like uniform subsampling of sequence alignments, rather than local subsampling, can sometimes improve performance on conformationally diverse proteins by altering the evolutionary information provided to the model [50].
How reliable are the improved confidence scores from these advanced methods?
While improvements are measurable, scores should be interpreted with caution. Benchmarking on known structures is crucial. For example, EQAFold demonstrated a reduction in average pLDDT error compared to standard AlphaFold2 (4.74 versus 5.16) on a test set of monomeric proteins, indicating more accurate self-assessment [3]. However, all computational predictions require experimental validation for critical applications, as these methods still struggle to capture the full spectrum of biologically relevant states, especially in highly flexible regions [50] [52].
Experimental Protocol: Enhancing Self-Confidence Scores with EQAFold
This protocol details the steps to implement the EQAFold framework to generate more accurate pLDDT scores for protein structure predictions, particularly beneficial for challenging targets like repeat sequences [3].
Step 1: Input Sequence and MSA Generation
- Procedure: Start with the input amino acid sequence of your target protein. Generate a Multiple Sequence Alignment (MSA) through a standard sequence database search, identical to the initial stage of a standard AlphaFold2 prediction.
Step 2: Generate Standard AlphaFold2 Representations
- Procedure: Process the MSA through the Evoformer module to produce single and pair representations. Subsequently, use the structure module to generate an initial set of five predicted protein structure models. It is recommended to run the structure module with 50% dropout to introduce variability between these models.
Step 3: Extract Features for Graph Construction
- Procedure: From the predictions, extract the following features:
- The final single and pair representations from the structure module.
- The predicted Cα coordinates.
- Root Mean Square Fluctuation (RMSF) values calculated from the five structure models generated in Step 2.
- Layer-wise embeddings from a protein language model (e.g., ESM2).
Step 4: Build Graph Representation
- Procedure: Construct a graph where nodes represent amino acid residues. Create edges between residues whose Cα atoms are within 16 Å of each other.
- Node Features: Concatenate the single representation, averaged ESM2 embeddings, and RMSF values. Process through a linear transition layer with ReLU activations to finalize node features.
- Edge Features: Construct using the pair embeddings and averaged attention layers from the ESM2 model for the corresponding residue pairs.
Step 5: Process with Equivariant Graph Neural Network (EGNN)
- Procedure: Pass the graph through the EGNN-based prediction network. The used architecture consists of four equivariant graph convolutional layers, which take the 384-dimensional node features and process them through hidden layers to output 50 features per node.
Step 6: Generate Refined pLDDT Scores
- Procedure: The final layer of the EGNN network produces the refined and more accurate per-residue pLDDT confidence scores, which can be used for downstream analysis and model validation.
Workflow Diagram
The following diagram illustrates the complete EQAFold workflow for refining AlphaFold2's self-confidence scores.
Table 1: Performance Comparison of EQAFold vs. Standard AlphaFold2 on Test Dataset [3]
| Metric | EQAFold | Standard AlphaFold2 (AFDB) |
|---|---|---|
| Average pLDDT Error | 4.74 | 5.16 |
| Targets with pLDDT within 0.5 Error | 348 (65.7%) | 316 (59.6%) |
| Key Architectural Improvement | EGNN-based LDDT head leveraging pairwise info | Standard multi-layer perceptron LDDT head |
Table 2: FiveFold Ensemble Method Functional Score Components [51]
| Score Component | Description | Weight in Final Functional Score |
|---|---|---|
| Structural Diversity Score | Measures conformational variety within the generated ensemble. | 30% |
| Experimental Agreement Score | Compares predictions to available experimental structures. | 40% |
| Binding Site Accessibility Score | Quantifies potential druggable sites across different conformations. | 20% |
| Computational Efficiency Score | Normalizes for computational cost relative to single methods. | 10% |
Research Reagent Solutions
Table 3: Essential Research Reagents and Computational Tools
| Item / Resource | Function / Purpose | Specification / Source |
|---|---|---|
| EQAFold Source Code | Implements the enhanced EGNN-based pLDDT prediction head for AlphaFold2. | Publicly available at: https://github.com/kiharalab/EQAFold_public [3] |
| ESM2 Protein Language Model | Provides deep learned sequence embeddings used as node features in the EQAFold graph network. | Used to generate input features for residue nodes [3]. |
| FiveFold Framework | Generates conformational ensembles by combining five structure prediction algorithms to capture diversity. | Integrates AlphaFold2, RoseTTAFold, OmegaFold, ESMFold, and EMBER3D [51]. |
| PISCES Protein Sequence Culling Server | Used to create non-redundant, high-quality datasets for training and testing model quality assessment methods. | Enables curation of datasets with controlled sequence similarity (e.g., ≤40%) [3]. |
Validation and Benchmarking: Ensuring Your Improved Model is Accurate
Frequently Asked Questions
Q1: What are the key confidence metrics in AlphaFold beyond pLDDT? AlphaFold provides multiple confidence metrics that assess different aspects of model quality. The predicted Local Distance Difference Test (pLDDT) is a per-residue measure of local confidence, while the Predicted Aligned Error (PAE) assesses the relative orientation between different parts of the protein. For protein complexes, the interface pTM (ipTM) score evaluates the accuracy of interface predictions. Each metric provides complementary information about model reliability [1] [53] [4].
Q2: Why does my model have high pLDDT but the domain arrangement seems incorrect? This occurs because pLDDT only measures local confidence at the residue level and does not assess the relative positions of domains. A model can have high pLDDT scores for individual domains while their spatial arrangement is inaccurate. You should consult the PAE plot, which specifically evaluates confidence in the relative positioning of different protein regions. High PAE values (>5 Å) between domains indicate low confidence in their relative orientation [1] [53].
Q3: Why do my ipTM scores improve when I use truncated constructs instead of full-length proteins? The ipTM score is calculated over entire chains, so disordered regions or accessory domains not involved in the interaction can artificially lower the score. When you trim constructs to only the interacting domains, you remove these non-interacting regions, resulting in a more accurate assessment of the interface quality. This is particularly important for proteins with large intrinsically disordered regions [7].
Q4: What do different pLDDT score ranges actually indicate? pLDDT scores are interpreted using standardized ranges that correspond to specific structural reliability levels, as shown in Table 1 below [1].
Q5: How can I identify intrinsically disordered regions in my prediction? AlphaFold typically assigns low pLDDT scores (<50) to two types of regions: naturally flexible or intrinsically disordered regions that lack a well-defined structure, and structured regions that AlphaFold cannot confidently predict due to insufficient information. Both scenarios result in low pLDDT, though distinguishing between them requires additional experimental validation [1].
Confidence Metric Reference Tables
Table 1: Interpretation of pLDDT confidence scores and their structural implications
| pLDDT Range | Confidence Level | Typical Structural Accuracy |
|---|---|---|
| >90 | Very high | Both backbone and side chains predicted with high accuracy |
| 70-90 | Confident | Correct backbone prediction with possible side chain misplacement |
| 50-70 | Low | Caution advised, potentially unreliable regions |
| <50 | Very low | Likely disordered or unstructured regions |
Table 2: Troubleshooting common AlphaFold model quality issues
| Problem Observed | Key Metrics to Check | Potential Solutions |
|---|---|---|
| Incorrect domain arrangements | High PAE between domains | Use experimental data for validation; consider multi-domain proteins as separate inputs |
| Low confidence in specific regions | pLDDT < 70 | Check for intrinsic disorder; verify MSA coverage in problematic regions |
| Poor protein complex predictions | Low ipTM scores | Try truncated constructs containing only interacting domains |
| Discrepancy between high confidence and experimental data | High pLDDT but incorrect structure | Validate with experimental methods; check for conditional folding |
Experimental Protocols for Model Validation
Protocol 1: Integrating AlphaFold Predictions with Cryo-EM Data
Purpose: To combine computational predictions with experimental electron density maps to determine structures of large complexes [4].
Methodology:
- Generate AlphaFold models for individual subunits or domains of the complex
- Fit these models into the experimental cryo-EM density map using programs like ChimeraX or COOT
- Use iterative refinement where the fitted structure is provided back to AlphaFold as a template
- Re-run prediction to generate models that better match the experimental density
- Validate final model using both computational scores and experimental map correlation
Key Tools: ChimeraX, COOT, PHENIX, ColabFold [4]
Protocol 2: Improving Molecular Replacement with AlphaFold Predictions
Purpose: To phase X-ray crystallography data using predicted models when experimental templates are unavailable [4].
Methodology:
- Generate AlphaFold prediction for the target protein
- Process the model using CCP4 or PHENIX tools to convert pLDDT to B-factors and remove low-confidence regions
- For multi-domain proteins, use tools like Slice'n'Dice or processpredictedmodel to split predictions into domains based on PAE plots
- Use these processed models as search models in molecular replacement pipelines like MRBUMP or MRPARSE
- Refine against experimental data using standard crystallographic refinement protocols
Key Tools: CCP4, PHENIX, MRBUMP, MRPARSE [4]
Research Reagent Solutions
Table 3: Essential computational tools for AlphaFold model validation and refinement
| Tool Name | Type | Primary Function | Application Context |
|---|---|---|---|
| COOT | Model building software | Fitting and refinement of models into cryo-EM density maps | Experimental validation of predicted models [4] |
| ChimeraX | Molecular visualization | Visualization and analysis of structures and density maps | Model evaluation and comparison [4] |
| ColabFold | Server-based prediction | Access to modified AlphaFold protocol without local installation | Rapid prediction generation [53] |
| checkMySequence | Validation tool | Identification of register shifts in experimental structures | Detecting model errors [4] |
| conkit-validate | Validation tool | Using AlphaFold predictions to identify register shifts | Model quality assessment [4] |
| LORESTR | Refinement pipeline | Low-resolution structure refinement using restraints | Improving model quality at lower resolutions [4] |
Workflow Diagrams
AlphaFold Model Validation Workflow
AlphaFold Confidence Metric Generation Process
Frequently Asked Questions (FAQs)
Q1: What are the main limitations of AlphaFold 3 when predicting protein complexes? AlphaFold 3, while highly accurate, faces challenges in accurately capturing inter-chain interaction signals for some protein complexes. Benchmarking studies show that specialized methods can outperform it in specific areas. For instance, DeepSCFold, a pipeline that uses sequence-derived structure complementarity, achieved an improvement of 11.6% and 10.3% in TM-score compared to AlphaFold-Multimer and AlphaFold3, respectively, on CASP15 multimer targets [54].
Q2: My AlphaFold models have poor side-chain accuracy. How can this be improved? Side-chain and detailed local structure accuracy is a known area for improvement. The DeepFold model, which builds upon AlphaFold2's architecture, specifically addresses this by modifying losses for side-chain torsion angles and frame aligned point error (FAPE), and adding loss functions for side-chain confidence. In blind tests, this approach showed superior side-chain accuracy and Molprobity scores compared to standard AlphaFold2 [55].
Q3: The ipTM score for my protein-protein interaction prediction is low, but the interface looks good. What is wrong? The interface predicted template-modeling score (ipTM) can be misleading when full-length protein sequences containing disordered regions or non-interacting domains are used. These regions can drag down the overall score even if the interacting interface is predicted accurately. A new metric, ipSAE (interface prediction Score from Aligned Errors), solves this by focusing only on high-confidence interface regions with low Predicted Aligned Error (PAE), providing a more reliable assessment for full-length proteins [56].
Q4: Are there specialized tools that outperform AlphaFold for specific biomolecular interactions? Yes, for certain interaction types, specialized tools can outperform the generalist AlphaFold 3 framework. AlphaFold 3 itself demonstrates this by substantially outperforming previous specialized tools in many categories, such as protein-ligand and protein-nucleic acid interactions [9]. However, for specific complexes like antibody-antigen systems, methods like DeepSCFold have shown a 24.7% higher success rate for predicting binding interfaces compared to AlphaFold-Multimer [54].
Q5: How critical is the quality of Multiple Sequence Alignments (MSAs) for accurate complex prediction? The quality and depth of MSAs are paramount. For protein complex prediction, constructing accurate paired MSAs is especially critical as it enables the identification of inter-chain co-evolutionary signals. Methods like DeepSCFold improve complex modeling by not relying solely on sequence-level co-evolution but by also leveraging sequence-based deep learning to predict protein-protein structural similarity and interaction probability to build better paired MSAs [54].
Troubleshooting Guides
Issue 1: Low Confidence in Protein-Protein Interface Predictions
Problem: Your AlphaFold model for a protein complex has low interface confidence scores (e.g., ipTM), making the result unreliable.
Solution Steps:
- Verify the Input Sequences: Ensure you are not using full-length sequences with long disordered regions if the interacting domain is known. Try predicting with truncated constructs that contain only the putative interacting domains [56].
- Use an Alternative Confidence Metric: Calculate the ipSAE score, which is more robust for evaluating interfaces in the presence of disorder.
- Methodology: The ipSAE metric narrows the focus to high-confidence interface regions by:
- Including only residue pairs with low Predicted Alignment Error (PAE).
- Adjusting the length normalization in the TM-score formula to consider only these high-confidence residues.
- Using PAE values directly to compute residue-residue alignment scores [56].
- Methodology: The ipSAE metric narrows the focus to high-confidence interface regions by:
- Employ a Specialized Tool: For critical targets, run your sequences through pipelines specifically designed for complexes, such as DeepSCFold or optimized versions of AlphaFold-Multimer, which often use enhanced MSA pairing strategies and extensive sampling [54].
Issue 2: Poor Side-Chain and Local Geometry Accuracy
Problem: The overall protein fold is correct, but the side-chain rotamers or local bond angles are inaccurate, limiting use in drug design or mechanistic studies.
Solution Steps:
- Utilize Specialized Refinement Tools: Use a protein structure prediction tool that specifically focuses on enhancing local structure details.
- Protocol (DeepFold): The DeepFold protocol incorporates several modifications to improve local accuracy:
- Modified Loss Functions: It uses sequentially conditioned torsion angle loss and adds losses for side-chain confidence and secondary structure prediction.
- Template Feature Enhancement: Replaces standard template feature generation with a refined alignment method (CRFalign) for better template selection.
- Post-Prediction Optimization: Performs re-optimization using a conformational space annealing (CSA) algorithm with a molecular mechanics energy function that integrates potentials from the distogram and side-chain predictions [55].
- Protocol (DeepFold): The DeepFold protocol incorporates several modifications to improve local accuracy:
- Benchmark Performance: On CASP15 targets, DeepFold showed a median GDT-TS score of 88.64 for backbones (compared to AlphaFold2's 85.88) and superior side-chain accuracy, demonstrating its utility for high-accuracy modeling [55].
Issue 3: Handling Complexes with Low Co-evolutionary Signal
Problem: Predicting the structure of complexes like antibody-antigen or virus-host interactions, which often lack clear inter-chain co-evolutionary information in their sequences.
Solution Steps:
- Leverage Structure-Aware Methods: Use a pipeline that does not rely solely on sequence co-evolution.
- Protocol (DeepSCFold):
- Step 1: Generate monomeric MSAs for each chain from multiple sequence databases (UniRef30, UniRef90, MGnify, etc.).
- Step 2: Use deep learning models to predict a protein-protein structural similarity (pSS-score) and an interaction probability (pIA-score) purely from sequence information.
- Step 3: Use the pSS-score to rank and select high-quality monomeric MSAs. Then, use the pIA-scores to systematically concatenate sequences from different subunit MSAs to build biologically relevant paired MSAs.
- Step 4: Integrate other biological information like species annotation or known complex data to construct additional paired MSAs.
- Step 5: Feed the series of paired MSAs into a structure prediction engine like AlphaFold-Multimer to generate the final complex model [54].
- Protocol (DeepSCFold):
- Expected Outcome: This approach provides reliable inter-chain interaction signals even in the absence of strong co-evolution, enhancing the success rate for challenging targets like antibody-antigen complexes by over 24% compared to some standard methods [54].
Experimental Protocols & Data
Table 1: Performance Comparison of Protein Complex Prediction Tools
Table comparing the performance of AlphaFold 3 and other specialized tools on standard benchmarks.
| Method | Benchmark Set | Key Metric | Performance | Key Advantage |
|---|---|---|---|---|
| AlphaFold 3 [9] | General Biomolecular Complexes | % of complexes with high accuracy | State-of-the-art across proteins, nucleic acids, ligands | Unified framework for nearly all molecular types |
| DeepSCFold [54] | CASP15 Multimers | TM-score | 11.6% improvement over AlphaFold-Multimer | Uses sequence-derived structural complementarity |
| DeepSCFold [54] | SAbDab Antibody-Antigen | Success Rate (Interface) | 24.7% improvement over AlphaFold-Multimer | Effective for targets with low co-evolution |
| DeepFold [55] | CASP15 (109 domains) | Median GDT-TS | 88.64 (vs. AF2's 85.88) | Superior side-chain and local structure accuracy |
Table 2: Key Reagents and Tools for Advanced Structure Prediction
A list of essential "research reagents" – primarily computational tools and databases – for conducting experiments in this field.
| Item | Function | Relevance in Protocols |
|---|---|---|
| DeepMSA2 [54] | Generates deep multiple sequence alignments (MSAs) and constructs paired MSAs. | Foundation for building high-quality inputs for complex prediction in DeepSCFold. |
| CRFalign [55] | A sequence-structure alignment method for improved template selection and feature generation. | Used in DeepFold to enhance template-based information. |
| Conformational Space Annealing (CSA) [55] | A powerful global optimization algorithm for molecular structures. | Used in DeepFold for post-prediction re-optimization of models. |
| AlphaFold-Multimer [54] | A version of AlphaFold2 trained specifically for predicting protein multimer structures. | The core structure prediction engine in the DeepSCFold and other specialized pipelines. |
| pSS-score & pIA-score Models [54] | Deep learning models that predict structural similarity and interaction probability from sequence. | Core to DeepSCFold's method for building paired MSAs without relying on co-evolution. |
| Protein Data Bank (PDB) | Repository for experimentally determined 3D structures of biological macromolecules. | Source of templates and ground-truth data for training and validation. |
| UniRef90/UniRef30 [54] [55] | Clustered sets of protein sequences from UniProt; used for efficient, non-redundant MSA generation. | Standard databases for building MSAs. |
Workflow Diagram: Enhanced Complex Structure Prediction
Workflow for Enhanced Complex Prediction
Workflow Diagram: Troubleshooting Low Confidence Predictions
Troubleshooting Low Confidence Models
Cross-Validation with Experimental Data from PDB and DisProt Databases
Frequently Asked Questions (FAQs)
1. What does a low pLDDT score in my AlphaFold model indicate? A low pLDDT score (typically below 70) indicates a region of low prediction confidence. In the context of a thesis focused on improving these regions, this often signifies the presence of an Intrinsically Disordered Region (IDR) that does not adopt a single stable structure but exists as a dynamic ensemble of conformations [57]. It could also indicate a region that undergoes conditional folding, acquiring structure only under specific conditions, such as upon binding to a partner or following post-translational modification [57].
2. My AlphaFold model shows a high-confidence structure for a predicted IDR. Should I trust it? A high-confidence (high pLDDT) AlphaFold prediction for a region annotated as disordered by other tools may not represent a static, stable structure. Evidence suggests AlphaFold can predict the conditionally folded state of some IDRs with high precision [57]. However, these are static snapshots and do not represent the functionally relevant structural plasticity or the ensemble of conformations the IDR samples in its unbound state [57] [58]. Cross-validation with experimental data is crucial.
3. Which experimental databases are most reliable for validating disordered regions? For structured regions, the Protein Data Bank (PDB) is the primary resource, though it has a bias towards structured states. For disordered regions, dedicated databases are essential:
- DisProt: A curated database of experimentally annotated IDPs and IDRs, containing over 2300 protein entries [58].
- MobiDB: Annotations over 200 million sequences for disorder, often based on missing residues in X-ray structures or flexible regions in NMR data [58].
4. What experimental techniques are best for characterizing low-confidence regions? Different techniques provide complementary information:
- NMR Spectroscopy: Ideal for probing structural ensembles, dynamics, and residual structure at atomic resolution in solution [57] [58].
- X-ray Crystallography: Can identify disordered regions as missing electron density or regions with high flexibility (high B-factors) [58].
- Cryo-Electron Microscopy (Cryo-EM): Useful for visualizing flexible regions in large complexes, though resolution can be limited for highly dynamic segments [58].
5. How can I use this cross-validation to formulate hypotheses for my research? Successfully cross-validated low-confidence regions are prime targets for further investigation. You can hypothesize that these regions are involved in critical biological functions via conditional folding, such as molecular recognition, post-translational modification sites, or driving liquid-liquid phase separation. This directly contributes to a thesis aimed at improving the functional interpretation of AlphaFold's dark proteome [59] [57].
Troubleshooting Guides
Issue 1: Interpreting Conflicting Predictions Between AlphaFold and Disorder Predictors
Problem: You have a protein region where AlphaFold assigns a high pLDDT score, but a dedicated disorder predictor (e.g., SPOT-Disorder) flags it as an IDR.
Solution: This conflict often reveals a conditionally folding IDR. Follow this systematic workflow to resolve it.
Interpretation and Next Steps:
- If databases or sequence analysis support conditional folding (Path A): The high pLDDT may reflect a folded state under specific conditions. Design experiments to test for binding-induced folding (e.g., NMR titration) or check for post-translational modifications.
- If no support for folding is found (Path B): Treat the AlphaFold model with skepticism for this region. Investigate its role as a flexible linker or entropic chain using ensemble techniques like SAXS or NMR [57].
Issue 2: Validating AlphaFold's Low pLDDT Regions with Experimental Data
Problem: You need to confirm that a low-confidence (low pLDDT) region in your AlphaFold model is genuinely disordered.
Solution: Leverage a combination of computational predictors and experimental data repositories for robust validation.
Interpretation and Next Steps:
- If a consensus emerges for disorder (Path A): You can confidently annotate the region as an IDR. Focus shifts to predicting its function based on sequence features (e.g., motifs, charge).
- If evidence is inconclusive (Path B): The region may require direct experimental characterization. Techniques like Circular Dichroism (CD) or limited proteolysis can provide initial, low-resolution evidence of disorder.
Data Presentation
Table 1: Quantitative Benchmarks for IDR and Conditional Folding Prediction
This table synthesizes key performance metrics from recent studies to aid in tool selection and interpretation.
| Method / Observation | Reported Metric | Value | Context and Implication |
|---|---|---|---|
| AlphaFold2 for Conditional Folding [57] | Precision | ~88% | At a 10% false positive rate for identifying IDRs that fold under specific conditions. |
| Disease Mutation Enrichment [57] | Fold Enrichment | ~5x | Disease-associated mutations are nearly five times more enriched in conditionally folded IDRs compared to generic IDRs. |
| Prokaryotic vs. Eukaryotic IDRs [57] | Percentage Predicted to Conditionally Fold | Up to 80% (Prokaryotes) < 20% (Eukaryotes) | Suggests most eukaryotic IDRs function without adopting a stable structure. |
| Ensemble Deep Learning (IDP-EDL) [59] | (State-of-the-Art) | N/A | A 2025 approach integrating task-specific predictors to improve overall disorder prediction. |
| Multi-Feature Fusion (FusionEncoder) [59] | (State-of-the-Art) | N/A | A 2025 model combining evolutionary, physicochemical, and semantic features for better boundary accuracy. |
Essential computational and data resources for cross-validating low-confidence protein regions.
| Resource / Reagent | Type | Primary Function in Validation |
|---|---|---|
| AlphaFold Protein Structure Database [57] | Database | Source of pre-computed pLDDT scores and structural models for visual assessment of confidence. |
| DisProt [58] | Curated Database | Provides experimental evidence for IDPs/IDRs from the literature for ground-truth comparison. |
| MobiDB [58] | Annotated Database | Offers large-scale disorder annotations for millions of sequences, integrating predictions and experimental data. |
| SPOT-Disorder [57] | Software Tool | A state-of-the-art sequence-based predictor to independently assess intrinsic disorder propensity. |
| NMR Spectroscopy [57] [58] | Experimental Technique | The gold-standard method for characterizing structural ensembles and dynamics of IDRs in solution. |
| Protein Folding Fingerprint (FiveFold) [58] | Software Tool | A 2025 approach to predict multiple conformational 3D structures for IDPs, offering an ensemble view. |
Experimental Protocols
Protocol 1: NMR Validation of a Conditionally Folded IDR
This protocol outlines how to use Nuclear Magnetic Resonance (NMR) spectroscopy to validate whether a high pLDDT region in an IDR corresponds to a conditionally folded state.
1. Sample Preparation:
- Isotope Labeling: Express and purify the protein of interest in a minimal medium containing
15N-labeled ammonium chloride and/or13C-labeled glucose to produce isotopically labeled protein for NMR detection. - Buffer Conditions: Use a physiologically relevant buffer. If a binding partner or post-translational modification (PTM) is hypothesized to induce folding, prepare samples:
- Apo: Protein alone.
- Holo: Protein + binding partner (e.g., peptide, DNA, other protein) or enzymatically modified to introduce the PTM.
2. Data Acquisition:
1H-15N HSQC Experiment: This is the cornerstone experiment. Collect1H-15N Heteronuclear Single Quantum Coherence spectra for both the Apo and Holo states.- Chemical Shift Perturbation (CSP): A folded protein gives a well-dispersed HSQC spectrum, while a disordered one appears crowded in the center. Calculate CSPs between Apo and Holo states using the formula:
CSP = √(ΔδH² + (ΔδN/5)²)whereΔδHandΔδNare the chemical shift changes in proton and nitrogen dimensions, respectively.
3. Data Analysis and Interpretation:
- Compare the HSQC spectrum of your protein's Apo state with the AlphaFold model. A disordered Apo state with a structured Holo state that matches the AlphaFold prediction strongly validates a conditionally folded IDR [57].
- Significant CSPs upon binding/modification indicate regions involved in the interaction and folding.
Protocol 2: Computational Cross-Validation Workflow for Low-Confidence Regions
This protocol provides a step-by-step methodology for computationally cross-validating low pLDDT regions before embarking on expensive experiments.
1. Initial Assessment with AlphaFold Output:
- Download the model from the AlphaFold Protein Structure Database or generate it using ColabFold.
- Visualize the model in software like PyMOL or ChimeraX, coloring the structure by pLDDT score. Identify all regions with pLDDT < 70.
2. Independent Disorder Prediction:
- Submit your protein's amino acid sequence to at least two modern disorder predictors. These could include SPOT-Disorder [57], IUPred2A, or deep learning-based tools like those reviewed in [59].
- Look for a consensus between the low pLDDT regions and the predicted disordered regions.
3. Database Mining for Experimental Evidence:
- Query the DisProt database using your protein's UniProt ID to find any existing experimental annotations of disorder.
- Search the MobiDB for a comprehensive view that includes homology-based inferences and data from the PDB.
- In the PDB, search for structures of homologs or the protein itself. Look for entries where your region of interest is missing from the electron density map or has high B-factors.
4. Integrated Analysis:
- Create a simple table or plot aligning the pLDDT scores, disorder predictions, and experimental annotations along the protein sequence.
- A region where all lines of evidence converge (low pLDDT, high disorder prediction, experimental data) can be confidently assigned as an IDR. A region with high pLDDT but other evidence suggesting disorder should be flagged as a potential conditional folder.
Frequently Asked Questions (FAQs)
Q1: What does a low pLDDT score in my AlphaFold model indicate, and why is it a problem? A low pLDDT (predicted Local Distance Difference Test) score indicates a region of low confidence in the predicted model, often corresponding to reduced local accuracy. These regions may be poorly modeled because the protein is intrinsically disordered, undergoes conformational flexibility, or because the multiple sequence alignment provides insufficient evolutionary information [60]. For researchers, this is problematic because it complicates the interpretation of biologically critical regions, such as active sites or binding interfaces, and can hinder experimental efforts like drug design or mutagenesis studies [50] [60].
Q2: How can I improve the confidence scores of my AlphaFold predictions? Recent research has developed several methods to improve self-confidence metrics and the accuracy of the underlying models. One approach is to use an enhanced confidence prediction head, like the Equivariant Graph Neural Network (EGNN) in EQAFold, which provides a more reliable pLDDT score than standard AlphaFold2 [3]. Another powerful method is to integrate experimental data, such as cryo-EM density maps or NMR restraints, into the prediction process through an iterative rebuilding and prediction pipeline. This can synergistically improve regions that were initially predicted with low confidence [61] [62].
Q3: My protein is multi-domain and thought to be allosterically regulated. Why does AlphaFold struggle with it? AlphaFold is primarily trained on static structures from the Protein Data Bank and tends to predict a single, thermodynamically stable conformation [62]. Autoinhibited or allosterically regulated proteins often exist in an equilibrium between active and inactive states, involving large-scale domain rearrangements [50]. AlphaFold often fails to reproduce the specific relative domain positioning seen in experimental structures of these proteins, which is reflected in reduced confidence scores and higher RMSD for the placement of inhibitory modules relative to functional domains [50].
Q4: Are there solutions for predicting conformational ensembles rather than a single structure? Yes, new frameworks are being developed to move beyond the one-sequence–one-structure paradigm. For instance, experiment-guided AlphaFold3 treats the predictor as a sequence-conditioned structural prior and uses experimental data to infer a conformational ensemble consistent with measurements [62]. This approach can uncover conformational heterogeneity from crystallographic densities and generate NMR ensembles that fit experimental data, sometimes outperforming the structures deposited in the PDB [62].
Troubleshooting Guides
Issue: Poor Model Confidence in Specific Regions
Symptoms:
- Your model has isolated regions with low pLDDT scores (e.g., below 70).
- The overall model is high quality, but loops or terminal regions are poorly defined.
Solutions:
- Use an Enhanced Quality Assessment Tool: Run your sequence through frameworks like EQAFold, which replaces AlphaFold's standard LDDT prediction head with an Equivariant Graph Neural Network (EGNN). This has been shown to provide more accurate self-confidence scores, particularly in regions with substantial LDDT prediction errors [3].
- Inspect the MSA: Low confidence can stem from a weak multiple sequence alignment. Verify the depth and diversity of your MSA, as it is a critical input for the Evoformer module.
- Iterative Rebuilding with Experimental Data: If experimental data is available, use a pipeline that iteratively rebuilds the AlphaFold model to better fit the data (e.g., a cryo-EM density map) and then uses the rebuilt model as a template in a new AlphaFold prediction cycle. This can refocus the attention mechanism and improve accuracy beyond simple rebuilding [61].
Issue: Inaccurate Multi-Domain Protein or Complex Conformation
Symptoms:
- The relative orientation of protein domains does not match known experimental structures or biological expectations.
- High per-domain accuracy but poor overall assembly, a common issue with autoinhibited proteins [50].
Solutions:
- Employ Ensemble Prediction Methods: For proteins with known conformational diversity, use methods that perform subsampling of the multiple sequence alignment (MSA) to explore alternative conformations [50].
- Integrate Experimental Restraints: Use a framework like experiment-guided AlphaFold3 to guide structure generation based on experimental observables. This is particularly useful for modeling allosteric transitions [62].
- Leverage External Homomeric Models: For complexes, consult databases that integrate homomeric AlphaFold2 models, which may provide better templates for domain interfaces [63].
Issue: Model Does Not Fit Experimental Density Map
Symptoms:
- After docking a high-confidence AlphaFold model into a cryo-EM or crystallographic density map, specific regions show a clear mismatch.
- The map correlation coefficient is low.
Solutions:
- Automated Iterative Refinement: Implement an automated procedure that trims, docks, and rebuilds the AlphaFold model into the density map. Use this rebuilt model as an input template for a new round of AlphaFold prediction. This synergy between prediction and experiment can correct domain placements and local conformations that were initially wrong [61].
- Density-Guided Sampling: For a more advanced approach, use Density-guided AlphaFold3. This method uses the experimental electron density map to guide the diffusion-based sampling process of AlphaFold3, generating an ensemble of structures that are more faithful to the experimental data and can capture previously unmodeled heterogeneity [62].
The following tables summarize key statistical improvements from recent case studies.
Table 1: Model-Level Accuracy Improvements with EQAFold
| Metric | Standard AlphaFold2 | EQAFold | Improvement |
|---|---|---|---|
| Average pLDDT Error | 5.16 | 4.74 | 0.42 reduction [3] |
| Targets with LDDT error < 0.5 | 316 (59.6%) | 348 (65.7%) | 6.1% more targets [3] |
Table 2: Experimental Data Integration Improves Model Accuracy
| Experimental Method | Application | Result |
|---|---|---|
| Cryo-EM Density Map [61] | SARS-CoV-2 Spike RBD | Cα atoms matched within 3Å increased from 71% to 91% after iterative rebuilding and prediction. |
| X-ray Crystallography [62] | General Protein Modeling | Density-guided AlphaFold3 produced structures more faithful to experimental maps than unguided AF3, sometimes outperforming PDB-deposited structures. |
| NMR Restraints [62] | Ubiquitin | NOE-guided AlphaFold3 generated ensembles that better captured conformational flexibility and agreed more faithfully with NOE data than standard AF3. |
Experimental Protocols
Protocol 1: Iterative AlphaFold Modeling with Cryo-EM Density
This protocol is used to improve an initial AlphaFold model by leveraging a cryo-EM density map [61].
- Initial Prediction: Generate an initial AlphaFold2 model using the protein sequence without external templates.
- Docking and Rebuilding: Superimpose the predicted model onto the experimental cryo-EM density map. Use an automated tool (e.g., in Phenix or ISOLDE) to rebuild the model to better fit the density.
- Template Generation: Use the rebuilt model as a template for a new cycle of AlphaFold2 prediction.
- Iteration: Repeat steps 2 and 3 for multiple cycles (e.g., 4 cycles). With each iteration, the model should converge to a structure that is more accurate and has a better fit to the experimental map.
Protocol 2: EQAFold for Enhanced Self-Assessment
This protocol describes how to obtain more reliable per-residue confidence metrics for an AlphaFold2 model [3].
- Input Features: For a given protein, the following data are computed or extracted:
- The final single and pair representations from AlphaFold's structure module.
- The predicted Cα coordinates.
- Layer-wise embeddings from the ESM2 protein language model.
- The root mean square fluctuation (RMSF) from five structure models generated with dropout in the structure module.
- Graph Construction: Represent the protein as a graph where nodes are amino acids and edges connect residues within 16 Å. Node features are built from the single representation, ESM2 embeddings, and RMSF. Edge features are built from the pair embeddings and ESM2 attention layers.
- EGNN Processing: Process the graph through an Equivariant Graph Neural Network consisting of four equivariant graph convolutional layers.
- Output: The network outputs a refined and more accurate pLDDT score for each residue.
Protocol 3: Experiment-Guided AlphaFold3 for Ensemble Generation
This protocol generates a structural ensemble consistent with experimental data [62].
- Guided Sampling: Adapt the diffusion-based structure module of AlphaFold3 to incorporate experimental measurements (e.g., electron density or NOE distances) during the sampling process. A non-i.i.d. sampling scheme is used to jointly sample the ensemble, directing exploration toward regions compatible with the constraints.
- Force-Field Relaxation: Address potential artifacts from guided sampling by performing a computationally efficient force-field relaxation step using a method like AlphaFold2's relaxation protocol. This projects candidate structures onto physically realistic conformations.
- Ensemble Selection: Apply a matching-pursuit ensemble selection algorithm to iteratively refine the ensemble. This step maximizes agreement with the experimental data while preserving structural diversity.
Method Workflow and Relationships
Research Reagent Solutions
Table 3: Essential Computational Tools for Improving AlphaFold Predictions
| Tool / Resource Name | Type | Primary Function |
|---|---|---|
| EQAFold [3] | Software Framework | Replaces AlphaFold2's LDDT head with an EGNN to provide more accurate self-confidence scores (pLDDT). |
| Experiment-guided AlphaFold3 [62] | Computational Framework | Integrates experimental data to guide AF3 sampling, generating ensembles consistent with measurements. |
| AlphaFold Protein Structure Database [63] | Database | Provides pre-computed AlphaFold models; now includes AlphaMissense variant pathogenicity scores and Foldseek for structure comparison. |
| ESM2 (Evolutionary Scale Modeling) [3] | Protein Language Model | Provides protein embeddings used as input features to enhance quality assessment in methods like EQAFold. |
| 3D-Beacons Network [63] | Database Framework | Aggregates structural models and annotations, including homomeric models, facilitating access to template structures. |
Conclusion
Effectively addressing low-confidence regions in AlphaFold predictions requires a shift from passive interpretation of pLDDT scores to an active, multi-faceted strategy. By understanding the foundational limitations, applying advanced methodological fixes like EQAFold and massive sampling, and rigorously troubleshooting specific protein classes, researchers can significantly enhance model reliability. The future of computational structural biology lies in integrating these improved static predictions with dynamic simulation methods like Molecular Dynamics to fully capture the functional spectrum of proteins. This progression is crucial for accelerating biomedical breakthroughs, particularly in structure-based drug design where accurately modeling flexible binding pockets and protein complexes is paramount.
References
- 1. pLDDT: Understanding local confidence | AlphaFold [https://www.ebi.ac.uk/training/online/courses/alphafold/inputs-and-outputs/evaluating-alphafolds-predicted-structures-using-confidence-scores/plddt-understanding-local-confidence/]
- 2. AlphaFold predictions are valuable hypotheses and ... [https://www.nature.com/articles/s41592-023-02087-4]
- 3. AlphaFold model quality self‐assessment improvement via ... [https://pmc.ncbi.nlm.nih.gov/articles/PMC12359199/]
- 4. AlphaFold two years on: Validation and impact - PMC [https://pmc.ncbi.nlm.nih.gov/articles/PMC11348012/]
- 5. Digging into the 3D Structure Predictions of AlphaFold2 with ... [https://pmc.ncbi.nlm.nih.gov/articles/PMC9599455/]
- 6. AlphaFold and Implications for Intrinsically Disordered ... [https://www.sciencedirect.com/science/article/pii/S0022283621004411]
- 7. What's wrong with AlphaFold's ipTM score and how to fix it [https://pmc.ncbi.nlm.nih.gov/articles/PMC11844409/]
- 8. Highly accurate protein structure prediction with AlphaFold [https://www.nature.com/articles/s41586-021-03819-2]
- 9. Accurate structure prediction of biomolecular interactions ... [https://www.nature.com/articles/s41586-024-07487-w]
- 10. How to predict structures with AlphaFold [https://proteopedia.org/wiki/index.php/How_to_predict_structures_with_AlphaFold]
- 11. and protein folding: Not dead yet! The frontier is... AlphaFold [https://pmc.ncbi.nlm.nih.gov/articles/PMC11892350/]
- 12. Sampling alternative conformational states of transporters and... [https://elifesciences.org/articles/75751]
- 13. AlphaFold prediction of structural ensembles of disordered ... [https://www.nature.com/articles/s41467-025-56572-9]
- 14. Investigating whether deep learning models for co-folding ... [https://www.nature.com/articles/s41467-025-63947-5]
- 15. The Limitations of Protein-Ligand Co-folding with ... [https://medium.com/@nexcoanalytics/the-limitations-of-protein-ligand-co-folding-with-alphafold-3-unveiled-61831cf116d9]
- 16. AFsample2 predicts multiple conformations and ensembles with... [https://www.nature.com/articles/s42003-025-07791-9?error=cookies_not_supported&code=24a4eaee-5f2a-483f-8664-0772612748af]
- 17. Frontiers | Viral replication modulated by hallmark conformational ... [https://www.frontiersin.org/journals/virology/articles/10.3389/fviro.2025.1501616/full]
- 18. Flexibility or uncertainty? A critical assessment of ... [https://pubmed.ncbi.nlm.nih.gov/41005302/]
- 19. Categorizing prediction modes within low-pLDDT regions ... [https://pmc.ncbi.nlm.nih.gov/articles/PMC12485489/]
- 20. Boosting AlphaFold protein tertiary structure prediction ... [https://www.nature.com/articles/s42003-025-08960-6]
- 21. Protein quality assessment with a loss function designed for high ... [https://www.semanticscholar.org/paper/48d8d3c5e0bea8e53eff9cf9b9289d2126cb3bc6]
- 22. AFsample2 predicts multiple conformations and ensembles ... [https://www.nature.com/articles/s42003-025-07791-9]
- 23. Modeling conformational states of proteins with AlphaFold [https://www.sciencedirect.com/science/article/abs/pii/S0959440X23001197]
- 24. High-throughput prediction of protein conformational ... [https://pmc.ncbi.nlm.nih.gov/articles/PMC10973385/]
- 25. AlphaFold [https://deepmind.google/science/alphafold/]
- 26. AlphaFold Protein Structure Database [https://alphafold.ebi.ac.uk/]
- 27. Deep learning tools predict variants in disordered regions with ... [https://bmcgenomics.biomedcentral.com/articles/10.1186/s12864-025-11534-9]
- 28. Getting started with Protein Language Models - Elisa G. de Lope [https://elisagdelope.rbind.io/post/plms/]
- 29. Integrating AlphaFold pLDDT Scores into CABS-flex for ... [https://www.sciencedirect.com/science/article/pii/S2001037024004185]
- 30. Single-sequence protein structure prediction using ... [https://pmc.ncbi.nlm.nih.gov/articles/PMC10440047/]
- 31. Protein Language Models: From Amino Acid Tokens to ... [https://medium.com/@anrizal05/protein-language-models-from-amino-acid-tokens-to-sequence-embeddings-e488e89a330e]
- 32. 7. Remove low-confidence residues of the model and break it into compact domains — Scipion 3.0.0 documentation [https://scipion-em.github.io/docs/release-3.0.0/docs/user/tutorials/modelBuilding/Alphafold/030-processModel.html]
- 33. Protein structure prediction from sequence variation - PMC [https://pmc.ncbi.nlm.nih.gov/articles/PMC4319528/]
- 34. DeepSCFold - IOBIO Lab [http://zhanglab-bioinf.com/DeepSCFold/]
- 35. protein structure - Pymol: select low confidence regions from AlphaFold pdb file - Bioinformatics Stack Exchange [https://bioinformatics.stackexchange.com/questions/19003/pymol-select-low-confidence-regions-from-alphafold-pdb-file]
- 36. Hallucinations in AlphaFold 3 for Intrinsically Disordered ... [https://arxiv.org/html/2510.15939v2]
- 37. Hallucinations in AlphaFold3 for Intrinsically Disordered ... [https://arxiv.org/abs/2510.15939]
- 38. Hallucinations in AlphaFold 3 for Intrinsically Disordered ... [https://openreview.net/forum?id=bX0i4s8AwD]
- 39. Troubleshooting Guide to Expressing Intrinsically ... [https://pmc.ncbi.nlm.nih.gov/articles/PMC6345686/]
- 40. Understanding intrinsically disordered protein regions and ... [https://source.washu.edu/2025/11/understanding-intrinsically-disordered-protein-regions-and-their-roles-in-cancer/]
- 41. Enhancing antibody-antigen interaction prediction with atomic ... [https://journals.plos.org/ploscompbiol/article?id=10.1371/journal.pcbi.1013576]
- 42. Enhancing antibody-antigen interaction prediction with atomic ... [https://pmc.ncbi.nlm.nih.gov/articles/PMC12530544/]
- 43. AlphaFold predictions of fold-switched conformations are ... [https://www.nature.com/articles/s41467-024-51801-z]
- 44. High-accuracy protein complex structure modeling based ... [https://pmc.ncbi.nlm.nih.gov/articles/PMC12630834/]
- 45. Accurate structure prediction of biomolecular interactions with... | Nature [https://www.nature.com/articles/s41586-024-07487-w?error=cookies_not_supported]
- 46. AlphaFold Predictions: Eight Critical Traps and How ... [https://www.accurascience.com/blogs_38_0.html]
- 47. Flexibility or uncertainty? A critical assessment of ... [https://www.sciencedirect.com/science/article/abs/pii/S0969212625003442]
- 48. Strengths and limitations of AlphaFold 2 | AlphaFold [https://www.ebi.ac.uk/training/online/courses/alphafold/an-introductory-guide-to-its-strengths-and-limitations/strengths-and-limitations-of-alphafold/]
- 49. In silico screening by AlphaFold 2 program revealed the potential... [https://elifesciences.org/reviewed-preprints/101967]
- 50. Challenging AlphaFold in predicting proteins with large- ... [https://www.nature.com/articles/s42004-025-01763-0]
- 51. A comprehensive application of FiveFold for conformation ... [https://www.nature.com/articles/s41598-025-17022-0]
- 52. Bridging prediction and reality: Comprehensive analysis of ... [https://www.sciencedirect.com/science/article/pii/S2001037025001734]
- 53. The power and pitfalls of AlphaFold2 for structure ... [https://pmc.ncbi.nlm.nih.gov/articles/PMC11956457/]
- 54. High-accuracy protein complex structure modeling based ... [https://www.nature.com/articles/s41467-025-65090-7]
- 55. DeepFold: enhancing protein structure prediction through ... [https://pmc.ncbi.nlm.nih.gov/articles/PMC10699847/]
- 56. Fixing the Flaws in AlphaFold's Interface Scoring [https://levitate.bio/fixing-the-flaws-in-alphafolds-interface-scoring-meet-dunbracks-ipsae/]
- 57. Systematic identification of conditionally folded intrinsically ... [https://pmc.ncbi.nlm.nih.gov/articles/PMC10622901/]
- 58. Expose flexible conformations for intrinsically disordered ... [https://pmc.ncbi.nlm.nih.gov/articles/PMC12270658/]
- 59. Decoding disorder: Advances in predicting intrinsically ... [https://www.sciencedirect.com/science/article/pii/S157016462500030X]
- 60. The impact of AlphaFold2 on experimental structure solution [https://pmc.ncbi.nlm.nih.gov/articles/PMC10231047/]
- 61. Improved AlphaFold modeling with implicit experimental ... [https://www.nature.com/articles/s41592-022-01645-6]
- 62. Inverse problems with experiment-guided AlphaFold [https://arxiv.org/html/2502.09372v1]
- 63. AlphaFold Protein Structure Database and 3D-Beacons [https://www.sciencedirect.com/science/article/pii/S0022283625000336]