Covariance Matrix Calculation for Gene Expression Data: A Guide for Genomic Researchers and Drug Developers
This article provides a comprehensive guide to covariance matrix calculation and analysis for high-dimensional gene expression data.
Covariance Matrix Calculation for Gene Expression Data: A Guide for Genomic Researchers and Drug Developers
Abstract
This article provides a comprehensive guide to covariance matrix calculation and analysis for high-dimensional gene expression data. Aimed at researchers and drug development professionals, it covers foundational concepts, practical methodologies for tackling the 'large p, small n' problem, optimization strategies to overcome computational challenges, and frameworks for the biological validation and comparison of results. By integrating statistical rigor with biological interpretation, this resource aims to enhance the reliability and insight gained from covariance-based analyses in genomics and biomedical research.
The What and Why: Core Concepts and Biological Significance of Covariance in Genomics
Defining Covariance and Correlation in the Context of Gene Co-expression
In the field of genomics, understanding the complex interplay between genes is fundamental to elucidating biological processes and disease mechanisms. Covariance and correlation serve as fundamental statistical measures for quantifying these gene-gene relationships through co-expression analysis [1]. Gene co-expression networks, constructed using these measures, provide a powerful framework for predicting gene function, identifying disease modules, and uncovering novel regulatory relationships [2] [3]. The calculation of a covariance matrix forms the foundational step in these analyses, enabling researchers to capture the joint variability of gene expression profiles across multiple biological conditions [1]. With advances in sequencing technologies and the emergence of sophisticated analytical tools, the application of these concepts has evolved beyond linear relationships to capture the complex, higher-order interactions that characterize real biological systems [4]. This article explores the definitions, methodologies, and practical applications of covariance and correlation in gene co-expression studies, providing researchers with detailed protocols for implementing these analyses in their own work.
Theoretical Foundations
Definitions and Mathematical Formulations
In probability theory and statistics, covariance is formally defined as a measure of the joint variability of two random variables [1]. For two jointly distributed real-valued random variables X and Y, the covariance is defined as:
cov(X,Y) = E[(X - E[X])(Y - E[Y])] = E[XY] - E[X]E[Y]
where E[X] and E[Y] represent the expected values of X and Y, respectively [1]. The sign of the covariance indicates the tendency in the linear relationship between the variables: positive covariance suggests that greater values of one variable correspond with greater values of the other, while negative covariance indicates that greater values of one variable correspond with lesser values of the other [1].
A significant limitation of covariance is that its magnitude is affected by the units of measurement, making it difficult to assess the strength of relationship between different pairs of random variables [1]. To overcome this, researchers use the correlation coefficient, which normalizes the covariance by dividing by the geometric mean of the total variances (the product of the standard deviations) for the two random variables [1]. This normalization produces a dimensionless value between -1 and 1, facilitating comparison across different variable pairs and studies.
In the context of gene co-expression analysis, these random variables represent expression levels of genes measured across multiple samples, conditions, or time points. The resulting covariance matrix for a set of genes is a symmetric matrix where each entry (i,j) represents the covariance between the expression profiles of gene i and gene j [5]. This matrix serves as the foundation for constructing gene co-expression networks and modules.
Correlation Metrics in Genomic Research
Several correlation metrics are commonly employed in gene co-expression studies, each with distinct advantages and limitations:
Table 1: Comparison of Correlation Metrics for Gene Co-expression Analysis
| Metric | Relationship Type | Advantages | Limitations |
|---|---|---|---|
| Pearson Correlation | Linear | Simple interpretation; Computationally efficient [4] | Sensitive to outliers; Only captures linear relationships [4] |
| Spearman's Rank Correlation | Monotonic | Robust to outliers; No distributional assumptions [4] | Lower accuracy for continuous data; Loss of information due to ranking [4] |
| Distance Correlation | Linear and Non-linear | Measures all dependence types; Distribution-free; Zero only if independent [4] | High computational complexity; Requires more memory [4] |
| Maximal Information Coefficient (MIC) | All types | Captures complex relationships [4] | May create false correlations; Limited mathematical foundations [4] |
The choice of correlation metric significantly impacts the biological insights gained from co-expression analysis. While Pearson correlation remains the default measure in many tools, its assumption of linearity often fails to capture the complex relationships observed in real biological systems [4]. Distance correlation has emerged as a powerful alternative because it does not assume normality, can measure nonlinear relationships, is more robust to outliers, and is zero only if the random vectors are independent [4].
Computational Methods and Protocols
Covariance Matrix Calculation for Gene Expression Data
The calculation of a robust covariance matrix constitutes a critical first step in gene co-expression network analysis. Below is a detailed protocol for generating a covariance matrix from RNA-Seq data, adapted from the methodology used in Correlation AnalyzeR [2]:
Table 2: Key Research Reagents and Computational Tools
| Item | Function | Example Tools/Databases |
|---|---|---|
| RNA-Seq Data | Raw gene expression measurements | ARCHS4, GEO, TCGA [2] |
| Normalization Method | Removes technical artifacts and library size differences | DESeq2's VST function [2] |
| Correlation Algorithm | Calculates gene-gene associations | WGCNA, correlationAnalyzeR [2] |
| Metadata Resources | Sample categorization | Cellosaurus ontology, GEO metadata [2] |
Protocol: Calculating Tissue and Disease-Specific Covariance Matrices
Data Acquisition and Categorization
- Download RNA-Seq read counts and metadata from repositories such as ARCHS4, which contains standardized counts across hundreds of thousands of human sequencing samples [2].
- Categorize samples based on tissue descriptions from GEO using manually curated regex dictionaries in conjunction with established ontologies like Cellosaurus [2].
- Classify sample disease status (e.g., cancer vs. normal) using curated dictionaries of disease-related terms [2].
Data Filtering
- Identify and remove single-cell RNA-Seq (scRNA-Seq) samples, as this data type has demonstrated unsuitability for co-expression network inference by Pearson correlation [2].
- Discard samples with fewer than 5 million raw read counts to reduce noise from low-quality samples [2].
- Remove tissue-disease groups with fewer than 30 distinct samples to limit the effects of bias from individual samples [2].
Normalization and Transformation
Covariance and Correlation Calculation
- Calculate gene-gene Pearson correlations separately for each tissue-disease group using the correlation function of the WGCNA package [2].
- For large datasets, transform each correlation matrix row into comma-separated values for efficient storage and querying in database systems such as Azure MySQL [2].
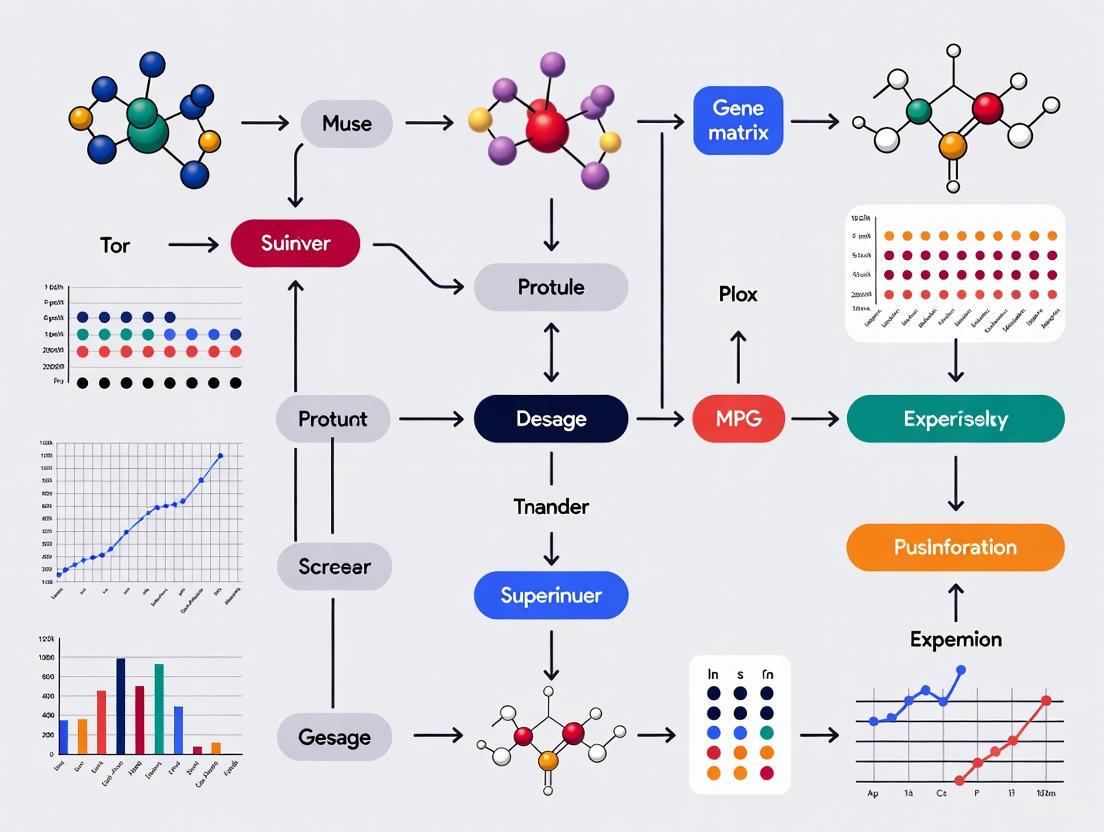
Figure 1: Workflow for calculating covariance matrices from RNA-Seq data.
Advanced Network Inference Using Covariance Dynamics
For more sophisticated applications, particularly with single-cell RNA-seq data measured after interventions at multiple time points, the WENDY (netWork infErence by covariaNce DYnamics) method provides an advanced approach to gene regulatory network inference [6]. This method leverages covariance dynamics between time points to infer regulatory relationships:
Protocol: GRN Inference with Covariance Dynamics (WENDY)
Experimental Design
- Implement an intervention that affects gene expression (e.g., drugs, gene knockdown).
- Measure expression levels of genes for different single cells at multiple time points, focusing on time points where expression has not yet reached a stationary state [6].
Covariance Matrix Computation
Dynamics Modeling
Network Inference
A key advantage of WENDY is its requirement of only two time points worth of data, making it particularly valuable in scenarios where intervention and/or measurement ultimately result in cell death [6]. Additionally, WENDY exhibits high data utilization efficiency - for single cell expression data comprising n genes across T time points, WENDY extracts (0.5n² + 0.5n)T numbers for further analyses [6].
Applications and Case Studies
Functional Prediction and Disease Module Discovery
Gene co-expression correlations have proven particularly valuable for predicting gene functionality within specific biological contexts, such as different tissue and disease conditions [2]. The Correlation AnalyzeR tool provides a user-friendly interface for exploring these relationships through several analytical modes:
- Single Gene Mode: For any gene of interest in any tissue-disease group, this method retrieves genome-wide correlations and uses them to predict gene function through specialized visualizations and statistical analyses [2].
- Gene vs. Gene Mode: This approach analyzes the relationship between two genes across multiple biological contexts, revealing condition-specific interactions [2].
- Gene Set Topology: This mode identifies biologically relevant subgroups within gene sets to facilitate discovery of novel relationships [2].
In practice, these approaches have been successfully applied to explore complex biological phenomena. For example, researchers have used Correlation AnalyzeR to investigate the role of BRCA1-NRF2 interplay in the context of bone cancer, demonstrating how co-expression analysis can effectively generate and support novel biological hypotheses [2].
The integration of co-expression networks with protein-protein interaction data has further enhanced the utility of these approaches for disease module discovery. The SWIM (SWItch Miner) methodology exemplifies this integration, combining co-expression network analysis with the human interactome to predict novel disease genes and modules [3]. This approach identifies "switch genes" within co-expression networks that regulate disease state transitions, then maps them to the human protein-protein interaction network to reveal disease-specific modules [3].
Figure 2: Workflow for disease module discovery via co-expression analysis.
Spatial Gene Co-expression Network Analysis
Recent technological advances have enabled the recovery of spatially-varying cell-specific gene co-expression networks from single-cell spatial expression data [7]. This represents a significant advancement over traditional approaches that average co-expression patterns across cell populations, ignoring spatial context. The following two-step algorithm facilitates this spatial analysis:
Protocol: Spatially-Varying Cell-Specific Networks
Data Preprocessing
Cell-Type Covariance Estimation
Cell-Specific Network Construction
- For each cell, find its appropriate spatial neighborhood [7].
- Combine cell label proportions in the neighborhood with cell-type covariance matrices to assign an empirical prior to the covariance matrix of that cell [7].
- Apply Bayes' rule to obtain posterior mean estimates, transform to correlation matrix, and apply thresholding to generate cell-specific co-expression network [7].
This approach enables not only the estimation of co-expression networks for individual cells based on their spatial context but also prediction of network structures for tissue positions where cells are not detected [7].
Emerging Methods and Future Directions
The field of gene co-expression analysis continues to evolve with several emerging methodologies enhancing traditional approaches:
Higher-Order Network Analysis: Traditional weighted gene co-expression network analysis (WGCNA) primarily characterizes pairwise relationships, failing to capture complex higher-order interactions among genes [8]. The newly proposed Weighted Gene Co-expression Hypernetwork Analysis (WGCHNA) addresses this limitation by modeling genes as nodes and samples as hyperedges using hypergraph theory [8]. This approach more effectively reveals complex co-regulatory patterns between multiple genes, such as when TP53, BRCA1, and PIK3CA jointly participate in the same cancer signaling pathway [8].
Covariation versus Coexpression: Most massive analyses of transcriptomic results obtained with single-channel techniques have used coexpression (correlation between absolute expression levels) [9]. However, evidence suggests that variation data (covariation) are far more reproducible than expression level results [9]. A method that systematically compares any two biological conditions and classifies genes as increased (I), decreased (D), or not changed (N) for each comparison can generate positive and negative covariation matrices with potentially improved biological relevance [9].
Distance Correlation Integration: The integration of distance correlation into WGCNA (DC-WGCNA) has shown promise in enhancing enrichment analysis results and improving module stability [4]. This approach is particularly valuable given that most gene expression data are not normally distributed - in analyses of multiple datasets, only 23-38% of genes followed normal distributions even after log transformation [4]. Since distance correlation does not require distributional assumptions, it maintains statistical power for non-normally distributed data [4].
As genomic technologies continue to advance, incorporating spatial context, capturing higher-order interactions, and utilizing more robust correlation metrics will likely become standard practice in gene co-expression analysis, further strengthening the biological insights gained from covariance and correlation-based approaches.
In the field of genomics, where researchers simultaneously measure the expression levels of tens of thousands of genes, the covariance matrix has emerged as a fundamental mathematical tool for extracting meaningful biological insights from high-dimensional data. While individual gene expression levels provide limited information, the coordinated expression patterns between genes, quantified through covariance and correlation, reveal the functional organization of the genome. These patterns form the basis for constructing genetic interaction networks, identifying functional gene modules, and detecting disease-specific pathway disruptions [10].
The importance of covariance analysis has grown alongside technological advancements. From early microarray studies that allowed monitoring of gene expression for thousands of genes in parallel [10] to modern single-cell RNA sequencing (scRNA-seq) technologies that profile individual cells [11], the challenge remains transforming raw expression data into biological knowledge. Covariance structure analysis enables researchers to move beyond single-gene differential expression to understand system-level rewiring in diseases like cancer, neurological disorders, and complex traits.
This Application Note provides a comprehensive framework for applying covariance-based analyses to gene expression data, with detailed protocols for network construction, confounder adjustment, and differential analysis. We focus particularly on addressing the statistical challenges inherent to high-dimensional genomic data, where the number of variables (genes) far exceeds the number of observations (samples or cells) [11] [12].
Key Applications of Covariance in Genomics
Covariance analysis enables several critical applications in genomic research, each providing unique biological insights. The table below summarizes the primary applications and their research utilities.
Table 1: Key Applications of Covariance Analysis in Genomic Research
| Application Area | Specific Uses | Research Utility |
|---|---|---|
| Gene Co-expression Networks | Identification of gene modules; Functional annotation of unknown genes; Cancer classification [10] [13] | Reveals functionally related gene groups; Predicts gene functions; Identifies disease subtypes |
| Differential Network Analysis | Detection of condition-specific changes in gene interactions; Pathway-level differential co-expression [14] | Identifies disrupted biological processes in disease; Reveals regulatory rewiring |
| Confounder Adjustment | Batch effect correction [15]; Removal of hidden technical artifacts [16] | Improves data quality and integration; Reduces false discoveries in correlation analysis |
| Single-Cell Analysis | Cell-type classification [11]; Identification of spatially variable genes [17] | Enables analysis of heterogeneous cell populations; Maps gene expression to tissue architecture |
Covariance Fundamentals for Gene Expression Data
In gene expression studies, covariance matrices capture the coordinated fluctuations in mRNA transcript abundances across genes. For a gene expression matrix ( X \in \mathbb{R}^{n \times p} ) with ( n ) samples (or cells) and ( p ) genes, the sample covariance matrix ( S ) is calculated as:
[ S{kq} = \frac{1}{n-1} \sum{i=1}^{n} (X{ik} - \bar{X}k)(X{iq} - \bar{X}q) ]
where ( \bar{X}_k ) represents the mean expression of gene ( k ) across all samples [11].
In high-dimensional genomic settings where ( p \gg n ), the classical sample covariance matrix becomes poorly conditioned and inaccurate. Several specialized approaches have been developed to address this challenge:
- Regularization Methods: Incorporating shrinkage estimators to produce well-conditioned covariance estimates [12]
- Sparse PCA: Identifying sparse principal components that better approximate the true underlying signal structure [11]
- Robust Covariance Estimation: Using methods like Minimum Regularized Covariance Determinant (MRCD) to minimize outlier effects [12]
Experimental Protocols
Protocol 1: Constructing Weighted Gene Co-expression Networks
Purpose: Identify modules of co-expressed genes from transcriptomic data to infer functional relationships and identify key regulatory genes.
Materials:
- Gene expression matrix (microarray, bulk RNA-seq, or scRNA-seq data)
- Normalization and transformation tools
- Computational resources (R/Python and relevant packages)
Table 2: Research Reagent Solutions for Network Construction
| Reagent/Resource | Function | Example Tools/Implementations |
|---|---|---|
| Normalized Expression Matrix | Input data for correlation calculations | DESeq2, EdgeR, SCTransform |
| Correlation Metrics | Quantify gene-gene associations | Pearson, Spearman, Mutual Information |
| Network Construction Algorithms | Build co-expression networks | WGCNA, WGCHNA, ARACNE, CLR |
| Module Detection Methods | Identify gene clusters | Hierarchical clustering, Dynamic tree cutting |
Procedure:
- Data Preprocessing: Normalize raw expression data to account for technical variations (library size, batch effects). For scRNA-seq data, consider pseudo-bulk aggregation approaches like metacells to reduce sparsity [13].
- Gene Selection: Filter genes to focus analysis on biologically relevant features. Common approaches include selecting genes with:
- Highest variability across samples
- Highest mean expression
- Largest differential expression across conditions [13]
- Similarity Matrix Calculation: Compute pairwise correlations between all selected genes using an appropriate measure (Pearson, Spearman, or mutual information).
- Network Construction: Transform the correlation matrix into an adjacency matrix using:
- Weighted networks: Soft thresholding to preserve connection strengths
- Unweighted networks: Hard thresholding to create binary connections [8]
- Module Detection: Identify modules of highly interconnected genes using:
- Topological Overlap Matrix (TOM): Calculate interconnectedness considering shared neighbors
- Hierarchical clustering: Group genes based on TOM dissimilarity
- Dynamic tree cutting: Define module boundaries from dendrograms [8]
- Module Characterization: Annotate modules functionally using:
- Enrichment analysis (GO, KEGG pathways)
- Correlation with sample traits
- Identification of hub genes (highly connected genes) [8]
Troubleshooting:
- For low module robustness, try different correlation thresholds or clustering parameters
- For computationally intensive analyses with large gene sets, implement feature selection or dimension reduction first
- For sparse single-cell data, use specialized methods like CS-CORE or HdWGCNA [13]
Protocol 2: Confounder Adjustment with CorrAdjust
Purpose: Identify and remove the effects of hidden confounders to improve the specificity of gene-gene correlation analyses.
Materials:
- Normalized gene expression matrix
- Reference gene sets (e.g., Gene Ontology, TarBase for miRNA-mRNA pairs)
- Computational implementation of CorrAdjust
Procedure:
- Input Preparation: Format expression data with samples as rows and genes as columns. Optionally, include multiple data types (e.g., mRNA and miRNA) with appropriate labels [16].
- Reference Collection Definition: Compile ground-truth gene sets representing known biological relationships:
- For mRNA-mRNA pairs: Gene Ontology terms sharing genes
- For miRNA-mRNA pairs: Experimentally validated targets from TarBase [16]
- Principal Component Analysis: Perform PCA on the expression matrix to derive potential confounding factors.
- Iterative PC Selection: Apply CorrAdjust's greedy algorithm to select PCs for adjustment:
- Rank gene pairs by correlation strength
- Evaluate enrichment of reference pairs among top-ranked pairs
- Select PCs that maximize this enrichment [16]
- Data Residualization: Regress out selected PCs from the expression data.
- Adjusted Correlation Analysis: Compute correlations from the residualized expression data.
Validation:
- Compare enrichment of reference pairs before and after adjustment
- Evaluate biological coherence of resulting correlation networks
- Assess specificity using negative control gene pairs [16]
Protocol 3: Differential Co-expression with DRaCOoN
Purpose: Identify gene-gene associations that change significantly between two biological conditions (e.g., healthy vs. diseased).
Materials:
- Gene expression data for two conditions (minimum ~10 samples per condition) [14]
- Predefined TF-target pairs for pathway-level analysis (optional)
- DRaCOoN implementation (Python package or web tool)
Procedure:
- Data Preparation: Ensure adequate sample size and homogeneity within each condition. Check for batch effects and apply correction if needed [14] [15].
- Association Calculation: For each gene pair, compute co-expression values separately for each condition using:
- Pearson's correlation
- Spearman's correlation
- Entropy-based measures [14]
- Differential Metric Computation: Quantify association changes between conditions using:
- Absolute Difference: ( \Delta r = |ra - rb| )
- Degree of Association Shift: ( s = r{ab} - 2 \times (ra + rb) ) [14] where ( ra ) and ( rb ) are co-expression values under conditions A and B, and ( r{ab} ) is computed across all samples.
- Significance Assessment: Apply permutation testing to evaluate statistical significance:
- Randomly shuffle condition labels
- Recompute differential metrics
- Compare observed values to null distribution [14]
- Multiple Testing Correction: Adjust p-values using Benjamini-Hochberg FDR control.
- Network Reconstruction: Build differential co-expression networks using significant gene pairs.
Advanced Application: For pathway-level differential regulation, provide predefined transcription factor-target gene pairs and focus analysis on these regulatory relationships [14].
Workflow Visualization
Covariance Analysis Workflow for Gene Expression Data
Advanced Applications and Methods
Hypergraph-Based Analysis for Higher-Order Interactions
Traditional co-expression networks based on pairwise correlations cannot capture complex multi-gene interactions. Weighted Gene Co-expression Hypernetwork Analysis (WGCHNA) addresses this limitation by modeling higher-order relationships using hypergraph theory:
- Nodes: Represent genes
- Hyperedges: Represent samples connecting multiple genes simultaneously
- Weights: Capture the strength of co-expression among multiple genes [8]
WGCHNA demonstrates superior performance in identifying biologically relevant modules, particularly for complex processes like neuronal energy metabolism in Alzheimer's disease [8].
Spatial Transcriptomics and Covariance
In spatially resolved transcriptomics (SRT), covariance analysis helps identify spatially variable genes (SVGs) whose expression patterns show non-random spatial distributions. Three categories of SVGs have been defined:
- Overall SVGs: Screen informative genes for downstream analyses
- Cell-type-specific SVGs: Reveal spatial variation within cell types
- Spatial-domain-marker SVGs: Annotate and interpret spatial domains [17]
Robust Covariance Testing for High-Dimensional Data
Comparing covariance matrices between groups (e.g., healthy vs. disease) presents challenges in high-dimensional settings. A novel robust test based on Minimum Regularized Covariance Determinant (MRCD) estimators addresses this by:
- Providing accurate testing when ( p > n )
- Maintaining robustness against outliers
- Operating without distributional assumptions through permutation [12]
This approach enables reliable detection of covariance differences in complex genomic datasets contaminated with outliers.
Covariance matrix analysis provides an essential foundation for extracting system-level insights from high-dimensional gene expression data. From constructing gene co-expression networks to detecting condition-specific pathway disruptions, covariance-based methods enable researchers to move beyond single-gene analysis to understand the complex regulatory architecture underlying biological processes and disease states.
The protocols presented here offer practical frameworks for implementing these analyses while addressing common challenges such as confounding artifacts, high dimensionality, and outlier sensitivity. As genomic technologies continue evolving toward higher resolution—including single-cell and spatial transcriptomics—covariance analysis will remain indispensable for translating expression measurements into biological understanding.
In the field of genomics, researchers are frequently confronted with a significant statistical challenge known as the "Large p, Small n" problem. This scenario occurs when the number of features or variables (p), such as genes, single nucleotide polymorphisms (SNPs), or other molecular markers, vastly exceeds the number of observations or samples (n). The emergence of high-throughput technologies, including microarray and next-generation sequencing, has made this a common feature of modern genomic studies, where it is not unusual to measure tens of thousands of genes across only dozens or hundreds of samples [18].
This imbalance between variables and samples creates substantial obstacles for statistical analysis. Traditional statistical methods, which were developed for scenarios where n exceeds p, often become inapplicable or unreliable. In the context of gene expression data research, this problem is particularly acute when attempting to estimate covariance matrices—fundamental structures that describe the interrelationships between genes. Accurate estimation of these matrices is crucial for understanding co-expression networks, identifying functional pathways, and detecting subtle patterns in genetic regulation [15].
The primary challenge in large p, small n situations is that the sample covariance matrix becomes singular or ill-conditioned, meaning it cannot be inverted reliably, which is often required for multivariate statistical procedures. Furthermore, with limited samples, the estimates of parameters become highly variable, leading to overfitting where models perform well on the training data but fail to generalize to new data. This directly impacts the reliability of biological conclusions drawn from genomic studies and necessitates specialized statistical approaches to overcome these limitations [19] [18].
Covariance Matrix Estimation in High-Dimensional Gene Expression Data
The Centrality of Covariance in Genomic Analysis
In gene expression studies, the covariance matrix provides critical insights into the complex web of biological relationships. It captures how the expression levels of genes co-vary across different conditions, treatments, or time points. These co-expression patterns often reflect underlying functional relationships, such as genes participating in the same biological pathway or being co-regulated by the same transcriptional mechanisms. Under the large p, small n regime, however, standard covariance estimation methods fail because the sample size is insufficient to reliably estimate the vast number of parameters involved [15].
The dimensionality challenge is stark: with p genes, the covariance matrix contains O(p²) unique parameters to estimate. For a typical gene expression microarray with 20,000 genes, this translates to approximately 200 million parameters. With sample sizes rarely exceeding a few hundred, this represents an underdetermined system where the number of unknown parameters far exceeds the number of data points available for estimation [15].
Impact of Batch Effects on Covariance Structure
Batch effects represent a particularly pernicious problem in covariance estimation for genomic studies. These technical artifacts arise when samples are processed in different batches, at different times, or by different personnel. Batch effects not only alter the mean expression levels of individual genes but can also distort the inter-gene relationships, leading to biased covariance estimates [15].
When analyzing data affected by batch effects, the assumed model is that each observed array vector Yij from batch i can be expressed as an affine transformation of some unobservable "true" expression vector Y: Yij = AiY + bi, where Ai is a transformation matrix and bi is a shift vector. This means that the covariance structure within each batch (Σi) relates to the true underlying covariance (Σ) through Σi = AiΣAiᵀ. The multivariate nature of batch effects necessitates covariance adjustment methods that can correct both means and covariance structures across batches to create properly harmonized datasets [15].
Table 1: Comparison of Covariance Estimation Methods for Large p, Small n Problems
| Method | Key Approach | Advantages | Limitations |
|---|---|---|---|
| Sample Covariance Matrix | Standard empirical estimation | Simple computation | Singular when p > n; High variance |
| Factor Model-Based Estimation [15] | Uses factor model with hard-thresholding | Captures underlying structure; Scalable to high dimensions | Requires selection of tuning parameters |
| Shrinkage Methods | Shrinks off-diagonal elements towards zero | Stable inversion; Reduced variance | May overshrink true signals |
| Sparse Covariance Estimation | Assumes many zero elements in covariance matrix | Computational efficiency; Biological interpretability | May miss subtle dependencies |
Statistical Frameworks and Protocols for Large p, Small n Problems
Resampling Approaches for Genome-Wide Significance
For determining genome-wide statistical thresholds in large p, small n situations, resampling methods offer a robust solution. Diao et al. (2013) developed a resampling approach specifically designed to control the genome-wide Type I error rate in quantitative trait loci (QTL) mapping studies [19]. The methodology employs the following protocol:
- Step 1: Generate null distribution of test statistics by repeatedly resampling the data while preserving the correlation structure among genes.
- Step 2: Calculate test statistics for each resampled dataset to establish an empirical null distribution.
- Step 3: Determine genome-wide significance thresholds based on percentiles of the empirical null distribution.
- Step 4: Apply these thresholds to the original data to identify statistically significant associations.
This approach maintains proper false discovery control even when the number of tests far exceeds the sample size, addressing a fundamental challenge in genome-wide association studies and QTL mapping [19].
Bayesian Variable Selection for QTL Mapping with Epistases
In the context of QTL mapping with epistatic effects, the large p, small n problem becomes particularly acute due to the explosive number of possible interactions. With p markers, the number of possible pairwise interactions is O(p²), creating an extremely high-dimensional search space [18].
The Bayesian variable selection protocol for this problem involves a two-step procedure:
Initial Screening Step:
- Use restrictive priors to identify a candidate set of markers and interactions
- Employ spike-and-slab priors to separate potentially important effects from negligible ones
- Incorporate sparsity constraints reflecting the expectation that few true effects exist
Refinement Step:
- Perform detailed analysis on the reduced set of candidates
- Use Gibbs sampling to stochastically search through low-dimensional subspaces
- Estimate posterior inclusion probabilities for each potential QTL and interaction
This approach handles the sparse parameter space characteristic of genomic studies, where only a small fraction of markers typically have detectable effects on traits of interest [18].
Table 2: Experimental Reagents and Computational Tools for Genomic Studies
| Research Reagent/Resource | Function/Application | Key Features |
|---|---|---|
| Affymetrix Microarray Platforms | Genome-wide expression profiling | Standardized protocols; High reproducibility [20] |
| R/qtl Software Package | QTL mapping in experimental crosses | Comprehensive mapping tools; Cross-platform compatibility [19] |
| Gene Expression Omnibus (GEO) | Public repository of expression data | Data sharing; Meta-analysis capability [20] |
| Spike-and-Slab Priors | Bayesian variable selection | Automatic sparsity control; Model uncertainty quantification [18] |
| Distance Weighted Discrimination (DWD) | Batch effect correction | Supervised adjustment; Preserves biological signals [15] |
Covariance Adjustment Methods for Batch Effect Correction
Multivariate Batch Adjustment Protocol
The presence of batch effects significantly compromises the validity of combined genomic datasets. While simple mean-centering methods can remove location shifts between batches, they fail to address changes in covariance structure. A comprehensive batch adjustment protocol should include [15]:
Batch Effect Diagnosis:
- Perform principal component analysis (PCA) on the combined dataset
- Visualize batch separation in the first few principal components
- Check if batch differences dominate biological signals
Covariance Adjustment Implementation:
- Estimate batch-specific covariance matrices Σi for each batch i
- Estimate target covariance structure Σ* (either from a reference batch or pooled)
- Compute adjustment transformation: Âi = Σ*^{1/2}Σi^{-1/2}
- Apply adjustment to each batch: Yij(adjusted) = Âi(Yij - μi) + μ*
Quality Assessment:
- Verify reduction in batch separation via PCA
- Confirm preservation of biological signals using control samples
- Check stability of adjusted covariance estimates
This multivariate approach corrects both mean shifts and covariance distortions, providing more scientifically valid combined datasets for downstream analysis [15].
Covariation Matrix Construction for Gene Expression Data
An alternative approach to handling batch effects involves constructing covariation matrices based on expression change patterns rather than absolute expression levels. The protocol involves [20]:
Systematic Condition Comparisons:
- For n biological conditions, perform all N = n(n-1)/2 pairwise comparisons
- For each gene in each comparison, classify as increased (I), decreased (D), or not changed (N)
- Represent each gene by an ordered string of N symbols (e.g., IDDNNIDID...)
Covariation Matrix Calculation:
- For each gene pair, calculate positive and negative correlation scores by comparing their symbol strings
- Use statistical significance testing to identify meaningful covariation patterns
- Construct separate positive and negative covariation matrices
Biological Interpretation:
- Apply clustering methods to identify functional modules
- Characterize modules using Gene Ontology information
- Validate with known biological pathways
This method leverages the improved reproducibility of variation measures compared to absolute expression levels, potentially providing more robust gene relationship networks [20].
Workflow Visualization and Experimental Design
The following diagrams illustrate key protocols and analytical workflows for handling large p, small n problems in genomic research.
Diagram 1: Batch Effect Correction Workflow
Diagram 2: Covariance Estimation Under Sparsity
Diagram 3: Gene Covariation Network Construction
The large p, small n problem presents fundamental challenges in genomic research that require specialized statistical approaches. Through resampling methods, Bayesian variable selection techniques, and sophisticated covariance adjustment procedures, researchers can extract meaningful biological signals from high-dimensional genomic data while maintaining statistical validity. The continued development of these methodologies remains crucial for advancing our understanding of complex biological systems and improving the reliability of genomic findings across diverse applications in basic research and drug development.
In the analysis of gene expression data, the covariance matrix has emerged as a powerful tool for moving beyond simple differential expression to understand the complex, coordinated nature of biological systems. While traditional analyses have focused predominantly on changes in mean expression levels between conditions, covariance-based methods capture the dynamic interrelationships between genes, providing insights into co-regulation patterns and pathway activity that would otherwise remain hidden [21]. This shift in perspective—from analyzing genes in isolation to studying them as interconnected systems—aligns with the fundamental biological understanding that genes operate in coordinated networks rather than independently.
The biological rationale for this approach stems from the "guilt-by-association" principle, which posits that genes involved in the same biological pathway or regulated by the same transcription factors tend to exhibit correlated expression patterns across multiple conditions [22]. When pathway activity changes—due to cellular state transitions, disease processes, or experimental perturbations—the coordination between member genes also changes, leading to detectable shifts in the covariance structure. These structural changes often manifest before significant mean expression differences emerge, making covariance analysis particularly sensitive for detecting early biological responses.
From a technical perspective, analyzing high-dimensional gene expression data (where the number of genes p often exceeds the number of samples n) presents significant challenges. Classical multivariate tests require n > p and become unstable or inapplicable in high-dimensional settings [23] [12]. This has spurred the development of specialized statistical methods that can handle these challenging data structures while extracting biologically meaningful signals.
Biological Foundations: From Covariance to Co-regulation
The Spiked Eigenvalue Model for Pathway Activity
A fundamental model for understanding how pathway activity influences gene expression covariance proposes that the observed expression of pathway genes derives from a shared latent variable representing pathway activity level combined with gene-specific noise. Mathematically, this can be expressed as:
[ y{ik} = \muk + hk ai + \varepsilon_{ik} ]
where (y{ik}) represents the expression of gene k in sample i, (\muk) is a gene-specific intercept, (ai) is the pathway activity level in sample i with variance (\sigmaa^2), (hk) are gene-specific scaling coefficients, and (\varepsilon{ik}) represents unstructured noise with variance (\sigma_\varepsilon^2) [21].
Under this model, the covariance matrix of the pathway genes takes a specific form:
[ \text{cov}(yi) = \sigmaa^2 hh^T + \sigma_\varepsilon^2 I ]
This structure leads to what is known as a spiked eigenvalue pattern, where the first eigenvalue ((\sigmaa^2 + \sigma\varepsilon^2)) captures variability due to changes in pathway activity, while the remaining eigenvalues ((\sigma_\varepsilon^2)) represent unstructured noise [21]. The leading eigenvector corresponds to the direction of maximum coordinated variability and provides a natural measure of pathway activity in each sample.
Biological Interpretation of Covariance Patterns
Different patterns of change in the covariance structure between conditions reflect distinct biological scenarios:
- Increased leading eigenvalue with stable residual variance suggests heightened pathway activity in one condition
- Increased residual variance may indicate pathway dysregulation or breakdown of normal co-regulation
- Changes in multiple eigenvalues often reflect the involvement of additional biological processes affecting subsets of pathway genes
- Altered eigenvectors suggest fundamental rewiring of regulatory relationships within the pathway
These patterns provide a rich interpretive framework that goes beyond what can be learned from mean expression alone. For example, in cancer research, changes in covariance structure have been linked to oncogenic pathway activation, loss of normal regulatory control, and cellular plasticity [21] [22].
Table 1: Biological Interpretation of Covariance Patterns
| Covariance Pattern | Biological Interpretation | Typical Context |
|---|---|---|
| Increased leading eigenvalue | Enhanced pathway activity | Pathway activation in disease or stimulus response |
| Increased residual variance | Loss of co-regulation | Pathway dysregulation in disease |
| Multiple changed eigenvalues | Multiple processes affecting pathway | Complex pathophysiology |
| Changed eigenvectors | Rewiring of regulatory relationships | Cellular reprogramming, adaptation |
Experimental Protocols and Analytical Workflows
Protocol 1: Co-expression Pathway Analysis Using Spiked Eigenvalue Methods
This protocol tests for changes in pathway activity between two biological conditions by examining the leading eigenvalue and trace of covariance matrices.
Sample Processing and Data Generation
Sample Collection and RNA Extraction
- Collect biological samples from conditions to be compared (e.g., diseased vs. normal, treated vs. control)
- Extract total RNA using standardized methods (e.g., column-based purification)
- Assess RNA quality using Bioanalyzer or similar (RIN > 8 recommended)
Library Preparation and Sequencing
- Prepare sequencing libraries using poly-A selection for mRNA enrichment
- Use unique molecular identifiers (UMIs) to correct for PCR duplicates
- Sequence on an appropriate platform (Illumina recommended) to sufficient depth (≥20 million reads per sample)
Read Processing and Quantification
- Perform quality control using FastQC
- Align reads to reference genome using STAR aligner
- Generate count matrices using HTSeq-count or featureCounts [24]
Data Preprocessing and Normalization
Count Matrix Preprocessing
- Filter low-count genes (recommended: retain genes with ≥10 counts in ≥20% of samples)
- Normalize for library size differences using DESeq2's median of ratios method or similar [24]
Pathway Gene Selection
- Select genes from pathway databases (KEGG, Reactome, Hallmark gene sets)
- Subset normalized expression data to pathway genes only
Data Scaling for Covariance Analysis
- Calculate the median eigenvalue of the pooled sample covariance matrix from both classes
- Divide all observations by the square root of this median eigenvalue
- This ensures unspiked eigenvalues are approximately 1, satisfying methodological assumptions [21]
Covariance Matrix Estimation and Testing
Covariance Matrix Calculation
- For each condition, calculate the sample covariance matrix of the preprocessed pathway gene expressions
- Ensure sample sizes are adequate (recommended: n ≥ 10 per condition for initial pilot studies)
Eigenvalue Decomposition
- Perform eigenvalue decomposition of each covariance matrix
- Extract the leading eigenvalue (α̂{j,1}) and trace (T̂j) for each condition j
Hypothesis Testing
- Test the null hypothesis H0: (α{1,1}, T1) = (α{2,1}, T_2) using a χ² test statistic
- The test statistic combines information from both the leading eigenvalue difference and trace difference between conditions [21]
- Calculate p-values using asymptotic results or permutation testing
Biological Interpretation
- If H_0 is rejected, examine the direction of changes:
- α{1,1} > α{2,1} suggests stronger pathway activity in condition 1
- T1 - α{1,1} > T2 - α{2,1} suggests greater dysregulated noise in condition 1
- If H_0 is rejected, examine the direction of changes:
Figure 1: Workflow for co-expression pathway analysis using spiked eigenvalue methods
Protocol 2: Differential Network Analysis with Pathway Integration
This protocol identifies changes in gene-gene interactions within pathways between two conditions, incorporating prior pathway knowledge to improve detection power.
Data Preparation and Network Estimation
Data Processing
- Follow steps 3.1.1 and 3.1.2 for sample processing and normalization
- Include potential covariates (e.g., batch, sex, age) in normalization if available
Association Measure Selection
- Choose an appropriate association measure based on biological question:
- Marginal correlations for overall co-expression patterns
- Partial correlations for direct connections (conditional independence)
- Robust correlations for data with outliers
- Information-theoretic measures for non-linear associations [22]
- Choose an appropriate association measure based on biological question:
Network Estimation
- For each condition, calculate association matrices (G₁ and G₂) using the chosen measure
- For partial correlations, use graphical lasso with appropriate regularization to ensure sparsity
- Compute the differential network: G_diff = G₁ - G₂ [25]
Differential Connectivity Analysis
Pathway Integration
- Obtain pathway information from curated databases (KEGG, GO, BioCarta)
- Account for potential pathway misspecification (missing or extraneous genes)
Sparse Singular Value Decomposition (SSVD)
- Apply SSVD to G_diff to identify gene clusters contributing most to network differences
- The first sparse singular vector identifies the primary gene cluster driving differences
- Subsequent vectors identify additional contributing clusters [25]
Statistical Significance Assessment
- Use permutation testing (recommended: 10,000 permutations) to assess significance
- Permute condition labels and recalculate differential connectivity measures
- Compute empirical p-values based on the permutation distribution [22]
Assisted Differential Network Analysis
Regulator Data Incorporation
- Collect regulator data (e.g., copy number variation, methylation, miRNA) if available
- These serve as auxiliary information to improve detection power
Integrated Analysis
- Use assisted analysis methods that leverage regulator information without requiring complete knowledge of all relevant regulators
- This approach improves identification of key genes contributing to network differences [25]
Biological Validation
- Examine identified differentially connected genes for known biological functions
- Validate findings using external datasets or experimental follow-up
Table 2: Comparison of Covariance-Based Analytical Methods
| Method | Primary Application | Key Strengths | Sample Size Requirements | Implementation |
|---|---|---|---|---|
| Spiked Eigenvalue Test [21] | Pathway activity changes | Direct biological interpretation of eigenvalues | n ≥ 10 per group | Custom R implementation |
| Differential Network Analysis [22] | Network rewiring between conditions | Flexible association measures; pathway integration | n ≥ 15 per group | R package dnapath |
| Assisted Differential Network [25] | Network changes with regulator data | Improved power using multi-omics data | n ≥ 20 per group | Custom R algorithms |
| Regularized Covariance Test (RCMAT) [23] | Gene set mean differences | Handles n < p settings; uses regularization | n ≥ 5 per group | Custom R implementation |
Visualization and Interpretation Framework
Visualizing Differential Network Results
Effective visualization is crucial for interpreting differential network analysis results. The following approaches facilitate biological insight:
Differential Network Layouts
- Visualize both condition-specific networks with consistent node placement
- Highlight edges that differ significantly between conditions
- Use edge color and thickness to represent association strength and direction
Module-Based Representations
- Group genes into functional modules based on network topology
- Display modules that show significant reorganization between conditions
- Annotate modules with enriched biological functions
Covariance Matrix Heatmaps
- Plot covariance matrices for each condition side by side
- Use clustering to group genes with similar covariance patterns
- Highlight regions of significant difference [20]
Figure 2: Interpretation framework for differential network analysis
Table 3: Research Reagent Solutions for Covariance-Based Analyses
| Resource Category | Specific Tools/Databases | Primary Function | Application Notes |
|---|---|---|---|
| Pathway Databases | KEGG, Reactome, GO, MSigDB Hallmarks | Provide biologically defined gene sets for analysis | Hallmark gene sets often show strong co-regulation [26] |
| Analysis Software/Packages | R packages: limma, roastgsa, dnapath | Implement various covariance-based tests | roastgsa compares rotation-based scores for GSA [26] |
| Expression Forecasting | GGRN/PEREGGRN framework | Benchmarks expression prediction methods | Useful for validating inferred regulatory relationships [27] |
| Normalization Tools | DESeq2, EdgeR, HTSeq-count | Process raw sequencing data into normalized counts | Essential preprocessing before covariance analysis [24] |
| Covariance Estimation | Graphical lasso, MRCD estimators, Regularized methods | Handle high-dimensional n < p settings | MRCD estimators provide robustness to outliers [12] |
Advanced Applications and Integration with Other Data Types
Integration with Multi-omics Data
The covariance-based framework can be extended to incorporate multiple data types for enhanced biological insight:
Regulator-Assisted Analysis
- Include copy number variation, methylation, or transcription factor binding data
- These regulators provide explanatory context for observed covariance changes
- Methods exist that don't require complete knowledge of all relevant regulators [25]
Multi-omics Factor Analysis
- Use factor models to integrate transcriptomic with other omics data
- Identify latent factors that drive coordinated changes across data types
- The glfBLUP approach demonstrates this for genomic prediction [28]
Expression Forecasting and Validation
Covariance patterns can inform expression forecasting models:
Benchmarking Platforms
- Use platforms like PEREGGRN to evaluate expression prediction methods
- Test ability to predict effects of novel genetic perturbations
- Assess whether covariance patterns improve prediction accuracy [27]
Validation Strategies
- Compare covariance-based findings with experimental perturbation data
- Use external datasets to confirm identified network rewiring events
- Employ cross-validation within studies to assess robustness
Covariance-based analyses provide a powerful framework for extracting biologically meaningful signals from gene expression data that complement traditional mean-based approaches. By focusing on the coordinated behavior of genes within pathways, these methods can detect changes in pathway activity, identify network rewiring events, and reveal dysregulation patterns that might otherwise remain hidden. The protocols outlined here—from spiked eigenvalue methods to differential network analysis—offer practical approaches for implementing these analyses while properly handling the statistical challenges of high-dimensional data. As biological research increasingly recognizes the importance of systems-level understanding, covariance-based methods will continue to provide essential tools for linking statistical patterns to biological mechanism.
Genetic networks represent the complex functional interactions between genes and their products, forming the circuitry that dictates cellular behavior. A critical characteristic of these networks is their dynamism; they can be rewired in response to different genetic backgrounds or environmental conditions [29]. This rewiring manifests as changes in epistatic interactions—where the phenotypic effect of one gene mutation depends on the presence of other mutations [29]. In the context of disease, such rewiring can fundamentally alter pathological mechanisms and clinical presentations.
The study of genetic network rewiring is significantly advanced by analyzing covariance matrices derived from gene expression data. The covariance structure among a set of genes reveals the extent and pattern of their co-regulation. Changes in this structure between healthy and diseased states, or between different disease subtypes, provide a powerful mathematical framework for quantifying network rewiring and its impact on disease classification [21]. This case study explores how computational analyses of covariance-based network rewiring are refining our understanding of disease mechanisms and enabling more precise molecular classifications.
Covariance Matrix Calculation: A Theoretical Framework for Quantifying Rewiring
Biological Model of Co-Expression
The calculation of a covariance matrix for a set of genes begins with a biological model that explains their co-expression patterns. For a predefined pathway or gene set comprising p genes, the expression data from n observations is represented as an n × p matrix. A common model assumes that a shared biological process, such as pathway activity, is the primary driver of coordinated gene expression [21]. This can be expressed as:
y_ik = μ_k + h_k * a_i + ε_ik
Here, y_ik is the expression level of gene k in sample i, μ_k is a gene-specific intercept, a_i is the latent level of pathway activity in sample i (with variance σ_a^2), h_k is the scaling coefficient for gene k, and ε_ik represents unstructured noise (with variance σ_ε^2) [21]. Under this model, the population covariance matrix of the gene expressions takes the form:
Σ = σ_a^2 * h*h^T + σ_ε^2 * I
This structure implies that the covariance matrix has a "spiked" eigenvalue, where the first eigenvalue is σ_a^2 + σ_ε^2 and the remaining eigenvalues are σ_ε^2 [21]. The leading eigenvalue thus captures variability due to changes in pathway activity, while the sum of the remaining eigenvalues represents noisy, non-co-regulated variability.
Testing for Covariance Changes Indicating Rewiring
To detect genetic network rewiring between two conditions (e.g., healthy vs. diseased), one tests for changes in the biologically meaningful components of the covariance structure. Instead of testing for the equality of the entire covariance matrices Σ_1 and Σ_2, a more powerful and interpretable approach is to test the null hypothesis:
H_0: (α_1,1, T_1) = (α_2,1, T_2)
where α_j,1 is the leading eigenvalue (representing co-regulated variability) and T_j is the trace of the covariance matrix (representing total variability) for class j [21]. Rejecting this hypothesis indicates a significant change in the network's structure—specifically, a rewiring that alters the strength of co-regulated pathway activity (α_j,1) or the level of disordered noise (T_j - α_j,1). This covariance-based test provides a parsimonious summary of network changes that directly ties to biological interpretation.
Application Note: Network Rewiring in Disease Subtyping
Case Study: Diffuse Large B-Cell Lymphoma (DLBCL)
The application of covariance matrix analysis to identify disease-relevant genetic networks is exemplified by a meta-analysis of 11 gene expression studies of Diffuse Large B-Cell Lymphoma (DLBCL) [30]. The study aimed to estimate a common covariance matrix of gene expressions across multiple independent datasets to identify robust gene correlation networks with clinical significance.
- Methodological Approach: The researchers developed a hierarchical random covariance model and an accompanying EM algorithm to estimate a common underlying covariance matrix obscured by study-specific technical noise [30]. This approach improved upon simple pooling of data by accounting for between-study heterogeneity.
- Findings and Outcome: The meta-analytically derived common covariance matrix enabled the identification of novel, biologically meaningful gene correlation networks. Furthermore, the eigengenes (principal components) of these networks demonstrated prognostic value, potentially distinguishing patient subgroups with different clinical outcomes [30]. This demonstrates how stable features of genetic networks, distilled from noisy multi-study data through advanced covariance estimation, can refine disease classification.
Covariation vs. Coexpression in Network Construction
The quality of the genetic network used for rewiring analysis is paramount. An important methodological consideration is the choice between coexpression and covariation measures when calculating gene correlations from transcriptomic data [20].
- Coexpression is defined as the correlation between absolute gene expression levels across multiple biological conditions.
- Covariation is defined as the correlation between relative changes in gene expression (e.g., fold-change) across a series of comparisons between pairs of conditions [20].
Evidence suggests that variation data (e.g., fold-changes) are often more reproducible across laboratories than absolute expression levels [20]. Therefore, constructing genetic networks based on covariation can, in some cases, yield more robust and biologically relevant networks than the more traditionally used coexpression networks, ultimately leading to more reliable detection of rewiring events.
Experimental Protocols
Protocol 1: Differential Gene Expression and Covariation Analysis from RNA-seq Data
This protocol outlines the steps for identifying differentially expressed genes and preparing data for covariation matrix analysis, using the RumBall pipeline within a Docker container for reproducibility [31].
Software Setup and Data Acquisition
- Step 1: Install Docker. Follow the official Docker installation instructions for your operating system to create a containerized environment [31].
- Step 2: Obtain RumBall. Download the RumBall Docker image from DockerHub with the command:
docker pull rnakato/rumball[31]. - Step 3: Acquire Data. Download public RNA-seq data (e.g., FASTQ files) from repositories like the Gene Expression Omnibus (GEO) using tools like SRA Toolkit.
Read Mapping and Expression Quantification
- Step 4: Create a Project Directory.
mkdir RumBall_tutorialand navigate into it. - Step 5: Map Reads and Generate Counts. Use a mapping tool like STAR (included in RumBall) to align reads to a reference genome. The aligned BAM files are then processed to generate a gene count matrix, which tabulates the number of reads mapped to each gene in each sample [31].
Differential Expression and Analysis
- Step 6: Identify Differentially Expressed Genes (DEGs). Perform differential expression analysis on the count matrix using tools like DESeq2 or edgeR (included in RumBall) to identify genes with statistically significant expression changes between conditions [31].
- Step 7: Generate Input for Covariation Analysis. For each gene, across all pairs of biological conditions (e.g., healthy vs. disease, different time points), classify its expression change as significantly increased (I), decreased (D), or not changed (N). This generates a string of symbols (e.g., "IDDNNIDID...") for each gene, representing its variation profile [20].
Covariation Matrix Construction
- Step 8: Calculate Covariation Scores. Construct a covariation matrix (CVM) by calculating statistically significant positive or negative correlation scores for every pair of genes by comparing their ordered strings of I/D/N symbols [20]. This matrix forms the basis for network construction and rewiring analysis.
Protocol 2: Integrated Analysis of Gene Expression and Genetic Variants Using exvar
This protocol utilizes the exvar R package for an integrated analysis that combines gene expression with genetic variation, which can provide mechanistic insights into the causes of network rewiring [32].
Data Preprocessing
- Step 1: Install exvar. Install the package from GitHub using:
devtools::install_github("omicscodeathon/exvar/Package"). Alternatively, pull the Docker container:docker pull imraandixon/exvar[32]. - Step 2: Process FASTQ Files. Use the
processfastq()function to perform quality control (with rfastp), trim reads, and align them to a reference genome (with gmapR), producing indexed BAM files [32].
Gene Expression and Variant Calling
- Step 3: Perform Gene Expression Analysis. Use the
expression()function to generate gene counts from BAM files (with GenomicAlignments) and perform differential expression analysis (with DESeq2) [32]. - Step 4: Call Genetic Variants. Use the
callsnp(),callindel(), andcallcnv()functions to identify single nucleotide polymorphisms, insertions/deletions, and copy number variations from the BAM files, respectively, using VariantTools and other packages [32].
Data Integration and Visualization
- Step 5: Visualize Integrated Data. Use the shiny applications within exvar for visualization:
vizexp(): Creates MA plots, PCA plots, volcano plots, and performs GO enrichment analysis for differential expression results.vizsnp(): Compares SNP profiles between patient and control groups, visualizing SNP types and transitions/transversions.vizcnv(): Illustrates recurrent CNV regions and their overlaps with functional genomic elements [32].
Table 1: Key Software Tools for Genetic Network Analysis
| Tool Name | Type | Primary Function | Application in Protocol |
|---|---|---|---|
| RumBall [31] | Dockerized Pipeline | Reproducible RNA-seq analysis | Differential gene expression analysis from FASTQ files. |
| DESeq2 [31] [32] | R Package | Differential expression analysis | Identifies statistically significant DEGs between conditions. |
| exvar [32] | R Package | Integrated expression & variant analysis | Analyzes and visualizes gene expression, SNPs, Indels, and CNVs. |
| STAR [31] | Aligner | RNA-seq read mapping | Aligns sequencing reads to a reference genome. |
| ClusterProfiler [31] [32] | R Package | Gene ontology enrichment | Interprets biological functions of DEGs or variant-affected genes. |
Visualization of Workflows and Genetic Networks
Workflow for Covariance-Based Disease Classification
This diagram outlines the end-to-end process for using genetic network rewiring in disease classification.
Model of Pathway Co-Regulation and Rewiring
This diagram illustrates the biological model of pathway co-regulation and how its disruption (rewiring) manifests in the covariance structure.
Table 2: Key Research Reagent Solutions for Genetic Network Studies
| Reagent / Resource | Function | Example & Notes |
|---|---|---|
| Reference Genome | A standard genomic sequence for read alignment and variant calling. | Ensembl or GENCODE human genome assembly (e.g., GRCh38). Essential for all mapping steps. |
| Annotation Databases | Provide functional genomic context (gene models, regulatory elements). | Bioconductor TxDb objects (e.g., TxDb.Hsapiens.UCSC.hg38.knownGene) or Ensembl via AnnotationHub [32]. |
| Gene Ontology (GO) Resources | Provide standardized vocabulary for gene function annotation. | Used in enrichment analysis (e.g., with ClusterProfiler) to interpret results from DEG lists or rewired modules [31] [32]. |
| Variant Database | Annotates identified genetic variants with known population frequency and clinical significance. | dbSNP, used to inject SNP IDs into VCF files via SNPlocs packages [32]. |
| Species-Specific R/Bioconductor Packages | Provide organized genomic annotations for non-human models. | Packages like org.Mm.eg.db for mouse or org.Sc.sgd.db for yeast are crucial for cross-species analysis [32]. |
The rewiring of genetic networks is a fundamental mechanism underlying disease heterogeneity. By applying sophisticated statistical analyses to covariance matrices derived from gene expression data, researchers can quantify this rewiring, moving beyond static gene lists to dynamic network interactions. The integration of these approaches with genetic variant data and standardized, reproducible bioinformatics protocols enables a systems-level understanding of disease. This paradigm shift from a gene-centric to a network-centric view is crucial for advancing precision medicine, leading to more accurate disease classification, the discovery of robust prognostic biomarkers, and the identification of novel therapeutic targets anchored in network pathology.
From Theory to Practice: Robust Methods for High-Dimensional Covariance Estimation
In the analysis of high-dimensional genomic data, researchers frequently encounter the challenge of singularity and ill-conditioned covariance matrices, particularly when the number of genes (p) far exceeds the number of samples (n). This p >> n scenario renders traditional statistical methods ineffective for estimating stable covariance structures essential for understanding gene-gene interactions and regulatory networks [33]. Sparse estimation techniques address this fundamental limitation by leveraging the inherent biological structure of genomic systems, where most gene pairs do not interact directly, resulting in covariance matrices with many zero or near-zero elements [34].
These methodologies have become indispensable in computational biology for constructing gene co-expression networks, identifying differentially expressed gene clusters, and understanding the molecular underpinnings of disease through sophisticated statistical regularization. By systematically constraining model complexity, sparse estimation techniques enable researchers to extract meaningful biological signals from high-dimensional transcriptomic data where conventional approaches would fail due to mathematical singularity [33] [34].
Sparse Estimation Paradigms for Covariance Estimation
Bayesian Sparse Covariance Estimation
Bayesian frameworks provide a powerful approach for sparse covariance estimation by incorporating shrinkage priors that systematically pull small off-diagonal elements toward zero. The bspcov R package implements state-of-the-art Bayesian methods specifically designed for high-dimensional covariance estimation [33].
Key functions within this package include:
bmspcov: Implements block Gibbs samplers using beta-mixture shrinkage priors to estimate sparse covariance matricessbmspcov: Employs screened beta-mixture shrinkage priors for enhanced computational efficiencybandPPPandthresPPP: Perform direct posterior sampling from post-processed posteriors for banded and thresholded sparse covariance structures [33]
These Bayesian approaches are particularly valuable for gene expression analysis as they provide natural uncertainty quantification through posterior distributions, allowing researchers to assess the reliability of estimated gene co-expression relationships.
Weighted Gene Co-expression Network Analysis (WGCNA)
WGCNA represents a widely adopted framework for constructing scale-free co-expression networks from transcriptomic data. This method identifies modules of highly correlated genes that often correspond to functionally related gene sets or pathways [34]. The protocol involves:
- Correlation matrix construction using pairwise gene expression correlations
- Topological overlap transformation to minimize effects of spurious correlations
- Hierarchical clustering with dynamic tree cutting to identify co-expression modules
- Module preservation analysis to assess conservation across different conditions [34]
For tumor vs. normal tissue comparisons, WGCNA with module preservation analysis enables identification of cancer-specific network disruptions versus conserved biological processes, providing crucial insights into disease mechanisms [34].
Integrated Analysis Pipelines
The exvar R package offers an integrated solution for gene expression and genetic variation analysis, combining multiple sparse estimation approaches within a unified framework [32]. This package supports eight model organisms including Homo sapiens, Mus musculus, and Arabidopsis thaliana, and provides:
- Differential expression analysis using DESeq2
- Variant calling (SNPs, Indels, CNVs) from RNA-seq data
- Interactive visualization tools for exploratory analysis [32]
Such integrated pipelines are particularly valuable for clinical and biological researchers with basic programming skills, as they streamline the complex workflow from raw sequencing data to biologically interpretable results.
Table 1: Software Solutions for Sparse Covariance Estimation in Genomics
| Software/Tool | Methodology | Key Features | Genomic Applications |
|---|---|---|---|
bspcov R Package [33] |
Bayesian shrinkage priors | Beta-mixture priors, block Gibbs sampling, posterior inference | Gene co-expression network estimation, high-dimensional covariance regularization |
| WGCNA Protocol [34] | Weighted correlation network analysis | Scale-free network construction, module detection, preservation analysis | Identification of coordinated gene expression modules in tumor vs. normal tissues |
exvar R Package [32] |
Integrated analysis pipeline | Variant calling, differential expression, Shiny apps for visualization | Multi-species gene expression and genetic variation analysis from RNA-seq data |
Experimental Protocols
Protocol for WGCNA with Module Preservation Analysis
This protocol enables researchers to construct and compare gene co-expression networks across conditions (e.g., tumor vs. normal tissues) to identify conserved and condition-specific functional modules [34].
Materials and Reagents
Table 2: Essential Research Reagents and Computational Tools
| Item | Function/Application | Implementation Notes |
|---|---|---|
| R Statistical Environment | Primary computational platform | Version 4.0 or higher recommended |
| WGCNA R Package [34] | Co-expression network construction | Enables weighted network analysis and module detection |
| RNA-seq Dataset (FASTQ files) | Raw gene expression data | Paired tumor and normal samples recommended |
| DESeq2 R Package [32] | Differential expression analysis | Used for count data normalization and preprocessing |
| ClusterProfiler R Package [32] | Functional enrichment analysis | GO and KEGG pathway analysis of identified modules |
Step-by-Step Methodology
Data Preprocessing and Quality Control
Network Construction
- Calculate pairwise correlation matrices between all genes
- Transform correlations using signed network approach with beta parameter estimation
- Construct adjacency matrix and convert to topological overlap matrix (TOM)
- Perform hierarchical clustering using TOM-based dissimilarity
- Identify co-expression modules using dynamic tree cutting with minimum module size of 30 genes [34]
Module Preservation Analysis
- Calculate preservation statistics (Zsummary) between tumor and normal networks
- Identify modules with Zsummary < 2 as non-preserved (condition-specific)
- Classify modules with Zsummary > 10 as highly preserved across conditions
- Extract module eigengenes for downstream association with clinical traits [34]
Functional Validation
Anticipated Results and Interpretation
This protocol typically requires 2-3 hours of hands-on time and 8-12 hours of computational time, depending on dataset size and permutation numbers used for preservation analysis [34]. Researchers can expect to identify 5-20 co-expression modules per condition, with approximately 30-70% showing significant preservation across conditions. Non-preserved modules in tumor tissues often reveal dysregulated biological processes central to disease pathogenesis.
Figure 1: WGCNA workflow for gene co-expression network analysis.
Protocol for Bayesian Sparse Covariance Estimation
This protocol details the application of Bayesian sparse covariance methods for estimating gene association networks from high-dimensional transcriptomic data.
Materials and Reagents
Table 3: Bayesian Estimation Research Tools
| Item | Function/Application | Implementation Notes |
|---|---|---|
bspcov R Package [33] |
Bayesian sparse covariance estimation | Implements beta-mixture and screened beta-mixture priors |
| Normalized Expression Matrix | Input data for covariance estimation | Rows as samples, columns as genes |
coda R Package |
Convergence diagnostics | Assesses MCMC chain convergence |
Step-by-Step Methodology
Data Preparation
- Format normalized expression data as
n × pmatrix, wherenis sample size andpis number of genes - Standardize each gene to have mean zero and unit variance
- For ultra-high-dimensional data (
p > 1000), consider preliminary screening
- Format normalized expression data as
Model Specification
- Select appropriate prior structure based on sparsity assumptions:
- Use
bmspcov()for general sparse covariance estimation - Use
sbmspcov()for screened beta-mixture priors on large datasets - Use
bandPPP()for banded covariance structures - Use
thresPPP()for thresholded sparse estimation [33]
- Use
- Set hyperparameters according to prior biological knowledge
- Select appropriate prior structure based on sparsity assumptions:
Posterior Inference
- Run Markov Chain Monte Carlo (MCMC) sampling with sufficient iterations (typically 10,000+)
- Discard initial samples as burn-in (first 20%)
- Assess convergence using trace plots and Gelman-Rubin statistics
Result Extraction and Interpretation
- Extract posterior mean of covariance matrix as point estimate
- Calculate posterior credible intervals for specific gene-gene associations
- Identify significant associations based on inclusion probabilities
Anticipated Results and Interpretation
Bayesian sparse covariance estimation produces posterior distributions for all elements of the gene covariance matrix, allowing probabilistic statements about gene-gene associations. Researchers can expect shrinkage of small correlations toward zero while preserving strong biological associations, resulting in sparse, interpretable networks. The method particularly excels in low-sample scenarios where traditional correlation estimates are unstable.
Comparative Analysis of Sparse Estimation Techniques
Performance Considerations
Each sparse estimation technique offers distinct advantages for specific genomic applications:
Bayesian Methods (bspcov) provide:
- Natural uncertainty quantification through posterior distributions
- Flexible incorporation of prior biological knowledge
- Robustness to small sample sizes through regularization
- Higher computational demands for MCMC sampling [33]
WGCNA offers:
- Proven framework for biological network construction
- Extensive module characterization utilities
- Integration with functional enrichment analysis
- Limited direct uncertainty quantification [34]
Integrated Pipelines (exvar) provide:
- Comprehensive analysis workflow from raw data to interpretation
- Multi-omics data integration capabilities
- User-friendly visualization tools
- Less flexibility for method customization [32]
Application Guidelines for Genomic Data
Table 4: Technique Selection Guide for Genomic Applications
| Research Goal | Recommended Approach | Rationale | Expected Output |
|---|---|---|---|
| Exploratory network analysis in large sample sizes | WGCNA [34] | Efficient handling of large gene sets, established biological interpretability | Co-expression modules, module-trait associations, network visualizations |
| High-dimensional data with n < p | Bayesian sparse covariance [33] | Superior regularization properties, stability in small samples | Sparse precision matrix, partial correlation network, association probabilities |
| Integrated analysis with genetic variants | exvar pipeline [32] | Unified framework for expression and variation, variant-aware expression analysis | Differential expression results, variant calls, CNV profiles, integrated visualizations |
| Multi-condition comparison | WGCNA with preservation [34] | Specialized statistics for cross-condition module conservation | Preservation Z-scores, condition-specific modules, disrupted pathways |
Advanced Applications and Future Directions
Multi-Omics Integration
Sparse estimation techniques are increasingly important for integrative multi-omics analyses, where covariance structures must be estimated across genomic, transcriptomic, and proteomic data layers. Bayesian approaches naturally extend to these settings through structured priors that model dependencies across data types [33] [32].
Single-Cell Transcriptomics
The adaptation of sparse covariance methods to single-cell RNA-sequencing data presents both challenges and opportunities. The inherent technical noise and sparsity in single-cell data requires specialized regularization approaches that can distinguish biological zeros from technical dropouts while maintaining computational feasibility for datasets comprising hundreds of thousands of cells [35].
Clinical Translation
In drug development contexts, sparse covariance estimation facilitates biomarker discovery and pathway-based therapeutic target identification by revealing coordinated gene expression patterns that distinguish treatment responders from non-responders. The network-based perspectives provided by these methods offer more robust biomarkers than individual gene signatures [34].
Figure 2: Multi-omics integration using sparse estimation methods.
In the analysis of high-dimensional genomic data, researchers routinely encounter datasets where the number of features (p)—such as genes, transcripts, or single nucleotide polymorphisms (SNPs)—far exceeds the number of observations (n). This "small n, large p" problem is particularly pronounced in gene expression studies using microarray and RNA-seq technologies, where tens of thousands of gene expression measurements may be available for only dozens or hundreds of patient samples [36] [37]. In such contexts, conventional statistical methods for covariance matrix estimation and regression analysis break down due to the singularity of the covariance matrix—a fundamental mathematical limitation where the matrix (XᵀX) becomes non-invertible, preventing the calculation of reliable parameter estimates [38].
Shrinkage estimators, including Ridge regression, Least Absolute Shrinkage and Selection Operator (Lasso), and the Elastic Net, address these challenges through regularization techniques that stabilize covariance matrix estimation and coefficient estimation. These methods introduce penalty terms that constrain the magnitude of regression coefficients, effectively shrinking them toward zero and producing more reliable, generalizable models despite high-dimensional settings [36] [39] [40]. The resulting biased estimators often exhibit superior predictive performance compared to their unbiased counterparts because the reduction in variance more than compensates for the introduced bias, especially when working with genomic data characterized by multicollinearity and noise [37] [40].
The application of these techniques extends beyond traditional regression to direct covariance matrix regularization, where they help estimate inverse covariance matrices that distinguish true biological relationships from random correlations [39]. This approach is particularly valuable for constructing gene regulatory networks, identifying pathway interactions, and predicting clinical outcomes from high-dimensional genomic profiles [39] [41] [42].
Mathematical Foundations of Shrinkage Methods
The Regularization Framework
All three shrinkage methods operate within a penalized regression framework. Given a response vector Y (e.g., gene expression levels, drug sensitivity, or clinical outcome) and a predictor matrix X (e.g., gene expression data from microarray or RNA-seq), the regularized regression coefficients are estimated by solving an optimization problem that combines a loss function with a penalty term [36] [40].
The general form of the penalized least squares criterion can be expressed as:
Table 1: General Penalized Regression Framework
| Component | Mathematical Expression | Purpose |
|---|---|---|
| Loss Function | ‖Y - Xβ‖₂² | Measures model fit to observed data |
| Penalty Term | P(λ, α, β) | Controls model complexity through shrinkage |
| Objective Function | argminβ {‖Y - Xβ‖₂² + P(λ, α, β)} | Combined criterion for coefficient estimation |
The hyperparameter λ ≥ 0 controls the overall strength of shrinkage, with larger values resulting in greater coefficient shrinkage. Different forms of the penalty function P(λ, α, β) give rise to the different shrinkage methods [36] [40].
Ridge Regression (L2 Regularization)
Ridge regression employs an L2-norm penalty on the regression coefficients, resulting in the following estimator:
β̂^ridge = argminβ {‖Y - Xβ‖₂² + λ‖β‖₂²}
The ridge penalty shrinks coefficients proportionally to their magnitude but does not set any coefficients exactly to zero. This makes it particularly effective for handling multicollinearity among predictors, as it distributes weight among correlated features rather than selecting arbitrarily between them [36] [40]. In the context of covariance matrix estimation, ridge regression can be viewed as adding a positive constant to the diagonal of XᵀX before inversion, ensuring the matrix is full rank and invertible even when p > n [38].
From a Bayesian perspective, ridge regression is equivalent to placing independent Gaussian priors on the regression coefficients, with the tuning parameter λ inversely related to the prior variance [40]. This interpretation is particularly useful in genomic applications where prior biological knowledge can inform the strength of regularization.
Lasso Regression (L1 Regularization)
The Lasso (Least Absolute Shrinkage and Selection Operator) employs an L1-norm penalty, resulting in the estimator:
β̂^lasso = argminβ {‖Y - Xβ‖₂² + λ‖β‖₁}
Unlike ridge regression, the Lasso has the ability to produce sparse solutions by setting some coefficients exactly to zero, effectively performing continuous variable selection [36] [40]. This property is particularly valuable in genomic studies where researchers aim to identify a small subset of biologically relevant genes from thousands of candidates.
However, the Lasso has limitations when predictors are highly correlated—it tends to select only one variable from a correlated group arbitrarily and may struggle when the number of true predictors exceeds the sample size [40]. In genomic applications with high linkage disequilibrium between SNPs or co-expressed genes, this can lead to unstable and biologically implausible selections.
Elastic Net (Combined L1 and L2 Regularization)
The Elastic Net combines both L1 and L2 penalties to overcome the limitations of Ridge and Lasso when used individually:
β̂^elnet = argminβ {‖Y - Xβ‖₂² + λ[α‖β‖₁ + (1-α)‖β‖₂²]}
The mixing parameter α (0 ≤ α ≤ 1) controls the balance between sparsity and grouping: values closer to 1 emphasize variable selection (Lasso behavior), while values closer to 0 emphasize coefficient shrinkage and handling of correlated variables (Ridge behavior) [36] [40]. The Elastic Net enjoys the benefits of both methods: it can select variables like the Lasso while handling groups of correlated variables like Ridge regression [40].
For genomic applications with highly correlated predictors (e.g., genes in the same pathway, SNPs in high linkage disequilibrium), the Elastic Net typically outperforms both Ridge and Lasso in terms of prediction accuracy and variable selection stability [36] [40].
Comparative Analysis of Shrinkage Methods
Table 2: Comparison of Shrinkage Methods for Genomic Applications
| Characteristic | Ridge Regression | Lasso | Elastic Net |
|---|---|---|---|
| Penalty Type | L2 (‖β‖₂²) | L1 (‖β‖₁) | Combined L1 + L2 |
| Variable Selection | No (all variables retained) | Yes (sparse solutions) | Yes (sparse solutions) |
| Handling Correlated Predictors | Excellent (shrinks coefficients together) | Poor (selects arbitrarily) | Good (selects groups) |
| p > n Capability | Yes (through matrix stabilization) | Limited (selects at most n variables) | Yes (through hybrid approach) |
| Computational Complexity | Low (analytic solution) | Moderate (convex optimization) | Moderate (convex optimization) |
| Primary Genomic Applications | Heritability estimation, polygenic risk prediction | Biomarker discovery, causal variant identification | Pathway analysis, multi-omics integration |
The comparative performance of these methods has been extensively evaluated in genomic studies. In one comprehensive assessment using simulated genomic data with 3000 progenies and 9990 SNP markers, the Lasso, Elastic Net, and their adaptive variants outperformed Ridge regression in terms of Pearson correlation between predicted and true genomic values, as well as root mean squared error [36]. However, all methods demonstrated relatively high prediction accuracies, highlighting the general utility of regularization approaches for genomic selection [36].
Covariance-Regularized Regression and the Scout Method
A particularly powerful extension of these concepts is the Scout Method, which directly applies regularization to the inverse covariance matrix [39]. This approach, known as covariance-regularized regression, uses shrunken estimates of the inverse covariance matrix of features to achieve superior prediction.
The Scout procedure involves a two-stage maximization:
- Estimate Θ̂ₓₓ by maximizing the penalized log-likelihood: log(detΘₓₓ) - tr(SₓₓΘₓₓ) - J₁(Θₓₓ)
- Estimate Θ̂ by maximizing: log(detΘ) - tr(SΘ) - J₂(Θ), with the constraint that the top left p×p submatrix equals Θ̂ₓₓ
The resulting regression coefficients are given by β̂ = -Θ̂ₓᵧ/Θ̂ᵧᵧ [39]. This framework generalizes Ridge, Lasso, and Elastic Net regression, which emerge as special cases with specific choices of penalty functions J₁ and J₂ [39].
The Scout Method is particularly valuable for genomic applications because it explicitly models the conditional dependencies between genes while relating them to clinical outcomes. This enables the identification of genes that are not only marginally associated with an outcome but also contribute predictive information conditional on other genes in the network [39].
Scout Method Workflow: A Two-Stage Covariance Regularization Approach
Experimental Protocols for Genomic Applications
Protocol 1: Predicting Drug Response Using Ridge Regression
This protocol adapts the approach used in a study predicting clinical drug response from baseline gene expression levels [37].
Materials and Reagents:
- Cell line gene expression data (e.g., Cancer Genome Project dataset)
- Drug sensitivity measurements (e.g., IC₅₀ values from cell line screens)
- Patient tumor gene expression data from clinical trials
- R statistical software with glmnet package
Procedure:
- Data Preprocessing
- Download and normalize gene expression data from cell lines and patient tumors
- Center and scale all gene expression values to mean = 0, variance = 1
- Log-transform drug sensitivity values (IC₅₀) to approximate normal distribution
Model Training
- Fit ridge regression model using cell line data: β̂^ridge = (XᵀX + λI)⁻¹XᵀY
- Optimize λ parameter via k-fold cross-validation to minimize mean squared error
- Use entire cell line panel (all cancer types) for training, not just tissue-matched lines
Model Application
- Apply trained model to patient baseline tumor expression data
- Calculate predicted drug sensitivity scores for each patient
- Dichotomize patients into "sensitive" and "resistant" groups based on clinical criteria
Validation
- Compare predicted sensitivity with observed clinical response using t-tests
- Calculate area under ROC curve to assess classification accuracy
- Compare performance with gene signatures derived directly from clinical data
In the original study, this approach achieved an AUC of 0.81 for predicting docetaxel response in breast cancer patients, outperforming both Lasso and Elastic Net for this specific application [37].
Protocol 2: Time-Course Microarray Analysis Using Modified Elastic Net
This protocol extends the Elastic Net for analyzing time-course gene expression data to predict treatment response in multiple sclerosis patients [42].
Materials and Reagents:
- Longitudinal microarray data from peripheral blood mononuclear cells (PBMCs)
- Clinical response classifications (good vs. poor responders)
- RNA stabilization reagent (e.g., RNALater)
- Computational resources for bootstrap sampling
Procedure:
- Data Preparation
- Extract RNA from PBMCs collected at multiple time points (e.g., pre-treatment, 3 months, 12 months)
- Hybridize to microarray platforms and process using standard normalization pipelines
- Assign patients to response categories based on clinical criteria
Model Specification
- Implement modified Elastic Net for time-course data: argminβ {J(y, Xₜ) + λΣⱼwⱼ[(1-α)½βⱼ² + α|βⱼ|]}
- Incorporate stability selection to identify consistently selected genes across bootstrap samples
- Use logistic regression framework for binary response prediction
Gene Selection and Validation
- Perform bootstrap sampling (e.g., 1000 iterations) to assess selection frequency
- Identify genes with selection frequency > threshold (e.g., 80%)
- Validate selected genes in independent patient cohorts
- Compare prediction accuracy with conventional methods
In the original implementation, this protocol achieved 81% accuracy in predicting interferon-β treatment response in multiple sclerosis patients, significantly outperforming conventional methods (71% accuracy) [42].
Protocol 3: Genomic Selection Using Regularized Linear Regression
This protocol details the application of multiple regularization methods for genomic selection in plant and animal breeding [36].
Materials and Reagents:
- Genotypic data from high-density SNP arrays or sequencing
- Phenotypic measurements for traits of interest
- Pedigree information (if available for mixed model applications)
- High-performance computing resources for large-scale genomic analyses
Procedure:
- Data Configuration
- Obtain genotype matrix X coded as {-1, 0, 1} for biallelic SNP markers
- Collect phenotype vector Y for quantitative traits
- Partition data into training (e.g., 2000 individuals) and validation (e.g., 1000 individuals) sets
Model Fitting
- Apply six regularization methods: Ridge, Ridge-BLUP, Lasso, Adaptive Lasso, Elastic Net, Adaptive Elastic Net
- Optimize tuning parameters via k-fold cross-validation (e.g., 5-fold)
- For Adaptive methods, calculate weights using initial coefficient estimates
Evaluation Metrics
- Calculate root mean squared error between predicted and true genomic values
- Compute Pearson correlation between predicted GEBVs and (1) true genomic value, (2) true breeding value, (3) simulated phenotypic values
- Compare computational efficiency across methods
Implementation
- Use specialized packages like glmnet in R or custom optimization routines
- For large datasets, employ parallel computing to reduce computation time
- Implement cross-validation schemes that respect family structure in the data
In the original study, Lasso-type methods consistently outperformed Ridge regression in terms of prediction accuracy, demonstrating the value of variable selection for genomic prediction [36].
Table 3: Essential Research Reagents and Computational Tools
| Category | Specific Items | Function in Analysis |
|---|---|---|
| Wet Lab Reagents | RNALater stabilization reagent | Preserves RNA integrity in patient samples |
| Microarray kits (Affymetrix, Illumina) | Genome-wide gene expression profiling | |
| RNA-seq library preparation kits | Transcriptome sequencing for expression quantification | |
| Computational Tools | R statistical environment with glmnet package | Implementation of regularization methods |
| PLS package for principal component regression | Alternative dimension reduction approach | |
| Custom scripts for Scout method implementation | Covariance-regularized regression | |
| Data Resources | Cancer Cell Line Encyclopedia (CCLE) | Drug sensitivity and gene expression data |
| The Cancer Genome Atlas (TCGA) | Clinical and genomic data for validation | |
| GEO (Gene Expression Omnibus) | Public repository for microarray data |
Implementation Considerations for Genomic Studies
Data Preprocessing Requirements
Proper data preprocessing is critical for successful application of shrinkage methods in genomic studies. Standardization of predictors is essential because the penalty terms are sensitive to the scale of variables [38]. Without standardization, variables measured on larger scales would be unfairly penalized. For gene expression data, this typically involves centering each gene to mean zero and scaling to unit variance [37].
For genomic selection applications, SNP markers are typically coded as {-1, 0, 1} corresponding to homozygous, heterozygous, and homozygous alternative genotypes [36]. For microarray data, robust multi-array average (RMA) normalization or similar approaches should be applied to reduce technical variability [37].
Tuning Parameter Selection
The performance of regularization methods heavily depends on appropriate selection of tuning parameters. k-fold cross-validation is the standard approach for choosing λ, with 5-fold or 10-fold cross-validation providing a good balance between bias and computational efficiency [36] [40].
For the Elastic Net, both λ and the mixing parameter α must be optimized. This typically involves a two-dimensional grid search over possible (λ, α) combinations [40]. In practice, a coarse search followed by a fine search around promising values can reduce computational burden.
For variable selection purposes, the "one standard error" rule is often employed, where the most parsimonious model within one standard error of the minimum cross-validation error is selected [40]. This approach favors simpler models and reduces false positive selections.
Computational Efficiency
For high-dimensional genomic data with tens of thousands of predictors, computational efficiency becomes a practical concern. The cyclical coordinate descent algorithm implemented in the glmnet package provides efficient fitting of regularization paths for Ridge, Lasso, and Elastic Net regression [40]. This algorithm is particularly fast when exploiting sparsity in the predictor matrix, as is common with SNP data.
For very large datasets (e.g., whole-genome sequencing with millions of variants), memory-efficient implementations or distributed computing approaches may be necessary. In such cases, feature screening methods can first reduce the number of variables before applying regularization.
Method Selection and Implementation Workflow for Genomic Studies
Advanced Applications and Extensions
Integrative Genomics with Regularization Methods
Regularization methods naturally extend to integrative genomic analyses that combine multiple data types. In one notable application, researchers combined gene expression signatures, somatic mutation status, DNA copy number alterations, and clinicopathologic information to predict pathological complete response to trastuzumab-based therapy in HER2-positive breast cancer [41]. The Elastic Net approach effectively integrated these diverse data types, revealing that models containing multiple data types were better predictors than models containing a single data type [41].
Key variables selected in these integrative models included amplifications of chromosome 6p, TP53 mutation, HER2-enriched subtype, and immune signatures, while variables predicting resistance included Luminal/ER+ features [41]. This demonstrates how regularization methods can identify complex, multi-factor biomarkers from high-dimensional genomic data.
Adaptive Elastic Net and Oracle Properties
The Adaptive Elastic Net extends the standard Elastic Net by incorporating data-driven weights that adjust the penalty for individual coefficients [36] [43]. These weights are typically derived from initial coefficient estimates, allowing for differential shrinkage across variables.
The Adaptive Elastic Net enjoys the oracle properties, meaning it can consistently identify the correct subset of true predictors and produce asymptotically unbiased and normally distributed estimates of the nonzero coefficients [36]. This property is particularly valuable for genomic studies where identifying truly causal genes or variants is as important as prediction accuracy.
In genomic applications, the Adaptive Elastic Net has demonstrated superior performance for gene selection in cancer classification, achieving higher classification accuracy while selecting fewer genes compared to standard Elastic Net [43].
Genome-Wide Association Studies
Regularization methods have emerged as powerful alternatives to standard single-marker approaches in genome-wide association studies (GWAS) [40]. By analyzing all SNPs simultaneously, these methods can better account for linkage disequilibrium and identify sets of correlated SNPs that jointly influence complex traits.
In comparative studies of GWAS applications, the Elastic Net generally provides a better compromise between false positives and correct selections compared to Lasso, particularly when the penalty weight α is set around 0.1 [40]. The Lasso tends to be too conservative, selecting too few correct SNPs, while the minimum MSE criterion often includes too many false positives [40].
Shrinkage estimators—including Ridge regression, Lasso, and the Elastic Net—provide a powerful framework for covariance matrix regularization and predictive modeling in high-dimensional genomic studies. These methods address the fundamental statistical challenges posed by the "small n, large p" problem common in gene expression analysis, SNP data, and other genomic applications.
The comparative performance of these methods depends on the specific genomic context: Ridge regression excels when most genes have non-zero effects with high correlations; Lasso performs well when only a sparse set of genes are truly predictive; while the Elastic Net provides a robust compromise that handles correlated predictors while performing variable selection [36] [40].
For covariance matrix estimation specifically, the Scout method extends these concepts by directly regularizing the inverse covariance matrix, enabling more biologically interpretable network models of gene interactions [39]. As genomic technologies continue to evolve, producing ever-higher dimensional data, these regularization methods will remain essential tools for extracting meaningful biological insights from complex genomic datasets.
Sparse Quadratic Discriminant Analysis (SQDA) for Class-Specific Covariances
In genomic studies, accurately classifying biological samples into disease subtypes or treatment response categories is a fundamental task. Traditional classification methods like Linear Discriminant Analysis (LDA) rely on the assumption that all classes share a common covariance structure. However, emerging evidence indicates that genetic networks are frequently rewired across different disease states, resulting in class-specific covariance patterns. Sparse Quadratic Discriminant Analysis (SQDA) addresses this challenge by incorporating different covariance matrices for different classes while employing sparsity constraints to handle high-dimensional genomic data where the number of features (genes) far exceeds the number of samples.
SQDA extends traditional Quadratic Discriminant Analysis (QDA) to high-dimensional settings by estimating sparse class-specific covariance matrices. In genomic applications, these matrices represent the co-expression networks unique to each biological class (e.g., tumor vs. normal, different cancer subtypes). The method assumes a block-diagonal structure for these covariance matrices, enabling biologically plausible modeling of gene network modularity while achieving computational efficiency through dimension reduction [44] [45].
The core discriminant function for classifying a sample vector ( x ) to class ( k ) is: [ \deltak(x) = -\frac{1}{2} \log|\Sigmak| -\frac{1}{2} (x-\muk)^T \Sigmak^{-1} (x-\muk) + \log \pik ] where ( \Sigmak ) is the covariance matrix for class ( k ), ( \muk ) is the mean vector for class ( k ), and ( \pi_k ) is the prior probability of class ( k ) [46]. SQDA achieves sparsity through variable selection by blocks, where blocks with cross-validation errors exceeding the smallest error by a predefined margin are excluded from the final model [44].
Performance Analysis: SQDA vs. Competing Methods
Table 1: Comparison of Classification Methods Across Simulation Studies
| Method | ISSC Setting Misclassification Rate | ISDC Setting Misclassification Rate | DSSC Setting Misclassification Rate | DSDC Setting Misclassification Rate |
|---|---|---|---|---|
| SQDA | 0.021 (±0.006) | 0.038 (±0.008) | 0.045 (±0.009) | 0.052 (±0.010) |
| DLDA | 0.025 (±0.007) | 0.121 (±0.015) | 0.102 (±0.013) | 0.184 (±0.018) |
| DQDA | 0.028 (±0.007) | 0.058 (±0.010) | 0.098 (±0.012) | 0.113 (±0.014) |
| SVM | 0.030 (±0.008) | 0.105 (±0.014) | 0.115 (±0.014) | 0.162 (±0.017) |
| RF | 0.035 (±0.008) | 0.095 (±0.013) | 0.108 (±0.013) | 0.142 (±0.015) |
Simulation studies demonstrate SQDA's superior performance across various genetic network structures. The four simulation settings include Independent Structure Same Covariance (ISSC), Independent Structure Different Covariance (ISDC), Dependent Structure Same Covariance (DSSC), and Dependent Structure Different Covariance (DSDC) [44] [45]. SQDA particularly excels in scenarios where covariance structures differ between classes (ISDC and DSDC), highlighting the importance of modeling class-specific genetic networks.
Parameter Optimization and Experimental Protocol
Effect of Block Size and Error Margin
Table 2: SQDA Parameter Optimization for Genomic Data
| Parameter | Recommended Setting | Biological Interpretation | Impact on Performance |
|---|---|---|---|
| Block Size | 100-200 genes | Aligns with functional gene modules and biological pathways | Optimal size matches true underlying block structure; 100 provides robust performance across network types |
| Error Margin | 0.05-0.15 | Controls stringency of feature selection | Smaller margin (0.05) preferred for larger sample sizes; larger margin (0.15) for smaller samples to retain predictive features |
| Sample Size | ≥50 per class | Ensures stable covariance estimation | Performance improves significantly with increasing sample size; >30 samples per class recommended |
Sample Size Considerations
The performance of SQDA is particularly dependent on sample size due to the large number of parameters requiring estimation. Research indicates that all classification methods perform poorly with very small sample sizes (<20 per class), but SQDA shows the most significant improvement as sample size increases, with optimal performance achieved at approximately 50 samples per class [44].
Application Notes for Genomic Data Implementation
Data Preprocessing Protocol
- Normalization: For RNA-seq count data, apply quantile transformation to approximate multivariate normality as in qtQDA [46]
- Quality Control: Filter genes with low expression and cells/samples with poor quality using established packages like edgeR or Seurat [46] [47]
- Block Formation: Organize genes into blocks (100-200 genes) based on:
- Prior biological knowledge (pathway databases)
- Correlation patterns in the data
- Hierarchical clustering results
Covariance Estimation Procedure
- Class-Specific Estimation: Calculate sample covariance matrices separately for each biological class
- Sparsity Constraints: Apply block-wise variable selection to remove non-informative gene blocks
- Regularization: Implement shrinkage methods to ensure positive definiteness of covariance matrices
- Validation: Use cross-validation to optimize tuning parameters and prevent overfitting
The Scientist's Toolkit: Research Reagent Solutions
Table 3: Essential Computational Tools for SQDA Implementation
| Tool/Resource | Function | Application Note |
|---|---|---|
| R Statistical Environment | Primary platform for implementation | Use version ≥4.3.0 for compatibility with required packages [47] |
| edgeR Package | Normalization and transformation of RNA-seq data | Critical for z-score transformation of negative binomial counts [46] |
| Seurat Package | Single-cell RNA-seq analysis | Provides quality control and normalization functions for scRNA-seq data [47] [48] |
| Spectra Algorithm | Supervised gene program discovery | Identifies interpretable gene programs for block formation [49] |
| ASGARD Pipeline | Drug repurposing guided by single-cell data | Applies classification results to therapeutic development [48] |
| Gene Ontology Database | Source of prior biological knowledge | Provides pathway information for meaningful block formation [50] [49] |
Advanced Applications in Drug Development
SQDA enables several advanced applications in pharmaceutical research and development:
Mechanism of Action Prediction
Sparse classification methods can predict drug mechanisms of action by identifying characteristic patterns in gene expression data. The SparseGO algorithm demonstrates how sparse neural networks can be combined with explainable AI techniques to predict drug response and understand MoA in cancer cell lines [50].
Drug Repurposing Pipeline
Single-cell guided pipelines like ASGARD leverage classification results to recommend drugs addressing cellular heterogeneity. By defining a drug score that considers all cell clusters within each patient, these methods account for intercellular heterogeneity in diseased tissues [48].
Rare Disease Drug Development
For rare diseases with limited sample sizes, sparse methods like SQDA offer particular promise. Quantitative Systems Pharmacology (QSP) approaches can integrate with classification results to address challenges in rare disease drug development, including dose selection and clinical trial design [51].
SQDA represents a significant advancement over traditional classification methods for genomic data by explicitly modeling class-specific covariance structures. Through appropriate parameter tuning and implementation of the protocols outlined herein, researchers can leverage SQDA to uncover biologically meaningful patterns in high-dimensional genomic data, with applications ranging from disease classification to drug development. The method's ability to account for rewiring of genetic networks across different biological states makes it particularly valuable for precision medicine initiatives where understanding differential network biology is essential.
Factor Models and Spiked Eigenvalue Structures for Pathway Data
The analysis of high-dimensional gene expression data presents a significant challenge in computational biology, where the number of measured features (genes) vastly exceeds the number of biological samples. Factor models with spiked eigenvalue structures provide a powerful mathematical framework for addressing this dimensionality problem by distinguishing meaningful biological signals from random noise. In omics data, biological processes rarely involve single genes acting in isolation; rather, they emerge from coordinated activity across multiple genes within functional pathways and networks. This coordination creates dependent gene-gene expression patterns that conventional differential expression analyses often miss, as they typically treat genes as independent entities [52].
The spiked covariance model elegantly captures this biological reality by decomposing the observed covariance matrix into two distinct components: a low-rank structured component representing the systematic biological variation driven by a limited number of latent factors (such as pathway activities or regulatory programs), and a high-dimensional diagonal component representing gene-specific technical noise and unmeasured influences [52]. Formally, this decomposition takes the structure 𝚺 = D² + PPᵀ, where D is a diagonal matrix and P is a p×k matrix with k ≪ p representing the low-rank signal. The "spiked" eigenvalues correspond to the dominant directions of variation in the data that exceed what would be expected from random noise alone, revealing the underlying biological structure.
This approach is particularly valuable for pathway-centric analysis because it directly models the core biological principle that cellular states are governed by coordinated activity across functionally related genes. By identifying these latent factors, researchers can move beyond single-gene analyses to understand how entire biological pathways and processes are perturbed in different experimental conditions or disease states [53] [54].
Computational Protocols
Protocol 1: Implementing Spiked Covariance Models for Gene Expression Data
This protocol details the application of Gaussian copula models with spiked covariance structures to generate biologically realistic synthetic gene expression data for method benchmarking and power analysis.
Step 1: Data Preprocessing and Normalization → Begin with a raw count matrix from an RNA-seq experiment. Perform standard quality control including adapter trimming, read alignment, and generation of a count matrix using tools such as STAR or HISAT2 followed by featureCounts [55]. Normalize the raw counts using established methods for cross-sample comparison, such as those in DESeq2, as normalized counts have been shown to provide better reproducibility across replicate samples than TPM or FPKM measures [56].
Step 2: Marginal Distribution Fitting → Fit an appropriate empirical or parametric distribution to the normalized expression values of each gene across samples. For RNA-seq count data, negative binomial distributions are often appropriate and can be estimated using tools like DESeq2 [52].
Step 3: Gaussian Copula Transformation → Transform the expression value ( X{ij} ) for each gene ( i ) in sample ( j ) to a standard normal variable ( Z{ij} ) using the equation: ( Z{ij} = \Phi^{-1}(Fi(X{ij})) ) where ( Fi ) is the cumulative distribution function (CDF) for gene ( i ) estimated in Step 2, and ( \Phi^{-1} ) is the inverse CDF of the standard normal distribution [52].
Step 4: Covariance Matrix Estimation → Calculate the sample covariance matrix 𝚺̂ from the transformed data ( Z ). Estimate a spiked covariance structure using one of three approaches:
- PCA Method: Decompose 𝚺̂ to obtain principal components and select the top ( k ) components that explain significantly more variance than expected by chance.
- Spiked Wishart Method: Fit ( k ) components such that simulations with the same sample size will have similar PCA component variances on average.
- Corpcor Method: Apply a James-Stein type shrinkage estimator to obtain a regularized covariance matrix [52].
Step 5: Synthetic Data Generation → Generate new synthetic data ( Z' ) from the multivariate normal distribution ( N(0, 𝚺) ) where ( 𝚺 = D^2 + PP^T ) represents the spiked covariance structure. Reverse the copula transformation to obtain simulated expression data ( X' ) with the relationship ( X'{ij} = Fi^{-1}(\Phi(Z'_{ij})) ), producing data with realistic marginal distributions and gene-gene dependencies [52].
Troubleshooting Tip: If the simulated data shows inadequate preservation of pathway structures, increase the number of latent factors ( k ) in the spiked model. If computational time is prohibitive for large ( p ), consider the corpcor method which provides efficient shrinkage estimation.
Protocol 2: Contrastive Latent Variable Modeling for Perturbation Responses
This protocol applies contrastive Poisson latent variable models (CPLVMs) to identify differential pathway activity between experimental conditions, such as case-control studies or treatment-response experiments.
Step 1: Experimental Design and Data Preparation → Define foreground data (e.g., treatment condition) and background data (e.g., control condition). For scRNA-seq data, represent the data as UMI count matrices ( Y ∈ ℕ₀^{p×n} ) (background) and ( X ∈ ℕ₀^{p×m} ) (foreground), where ( p ) is the number of genes, and ( n ) and ( m ) are the numbers of cells in each condition [57].
Step 2: Model Specification → Define the CPLVM using a Poisson data likelihood to appropriately model count-based sequencing data. The model captures shared and condition-specific low-dimensional structure through latent variables that represent underlying biological programs [57].
Step 3: Model Fitting and Inference → Estimate model parameters using variational inference or Markov Chain Monte Carlo methods. The model will decompose the transcriptional variation into three components: structure shared between both conditions, structure specific to the background condition, and structure specific to the foreground condition [57].
Step 4: Differential Pathway Activity Assessment → Project the inferred latent factors onto known biological pathways from databases such as MSigDB or Reactome. Use the model's hypothesis testing framework to identify pathways that show statistically significant differences in activity between conditions, either globally across all genes or within specific gene subsets [57].
Step 5: Result Visualization and Interpretation → Visualize the contrastive components using low-dimensional embeddings. Identify genes with high loading on contrastive factors and perform enrichment analysis to interpret the biological processes specific to the foreground condition [57].
Troubleshooting Tip: If model convergence is slow, consider initializing parameters using PCA. If biological interpretation is challenging, use more focused pathway databases such as the "hallmark" gene sets in MSigDB which provide reduced redundancy.
Workflow Visualization
The following diagram illustrates the integrated analytical workflow for applying factor models to pathway data, from data preprocessing through biological interpretation:
Figure 1: Integrated analytical workflow for pathway-focused factor modeling of gene expression data.
Data Presentation and Analysis
Quantitative Comparison of Covariance Estimation Methods
Table 1: Performance characteristics of three spiked covariance estimation methods for omics data simulation
| Method | Key Principle | Optimal Use Case | Computational Efficiency | Data Utilization |
|---|---|---|---|---|
| PCA Method | Retains top k components by variance | Large sample sizes (n > 50) | High | Uses all samples for component calculation |
| Spiked Wishart | Fits components to match expected eigenvalues | Small sample sizes (n < 30) | Medium | Optimized for low sample-to-feature ratio |
| Corpcor Method | James-Stein shrinkage toward diagonal | High-dimensional data (p ≫ n) | High | Balances sample covariance with independence assumption |
Pathway Activity Inference Metrics
Table 2: Core components and their functions in pathway activity modeling
| Component | Function | Implementation Example |
|---|---|---|
| Condition-Responsive Genes (CORGs) | Subset of genes within pathways with optimal discriminative power | Identified via PAC algorithm for disease classification [54] |
| Activity Map | Position-specific regulatory activity of splicing factors | Learned by KATMAP from perturbation data [58] |
| Contrastive Factors | Low-dimensional structure specific to foreground condition | Estimated by CPLVM for case-control designs [57] |
| Gaussian Copula | Models multivariate dependence with flexible margins | Enables realistic data simulation with spiked covariance [52] |
The Scientist's Toolkit
Research Reagent Solutions
Table 3: Essential computational tools and resources for factor modeling of pathway data
| Resource | Type | Function | Access |
|---|---|---|---|
| dependentsimr | R Package | Implements spiked covariance models with Gaussian copula | CRAN/GitHub [52] |
| MSigDB | Pathway Database | Curated gene sets for pathway activity inference | http://www.msigdb.org [53] |
| Cytoscape & EnrichmentMap | Visualization Tools | Network visualization of enriched pathways | http://www.cytoscape.org [53] |
| g:Profiler | Enrichment Analysis | Pathway enrichment for gene lists | Web tool [53] |
| KATMAP | Python Package | Infers splicing factor activity from perturbation data | https://gitlab.com/LaptopBiologist/katmap [58] |
Covariance Dynamics for Regulatory Inference
The following diagram illustrates how covariance dynamics can be leveraged to infer gene regulatory networks from time-series single-cell data, as implemented in methods like WENDY:
Figure 2: Workflow for gene regulatory network inference using covariance dynamics from time-series single-cell data after intervention.
Factor models with spiked eigenvalue structures provide a mathematically rigorous framework that aligns with fundamental biological principles of coordinated gene regulation within pathways. By explicitly modeling the low-dimensional structure inherent in high-dimensional omics data, these methods enable more powerful detection of pathway-level perturbations and more realistic simulation of genomic data. The protocols presented here for spiked covariance modeling and contrastive latent variable analysis offer researchers practical approaches for advancing beyond single-gene analyses toward a more integrated understanding of pathway biology in health and disease. As omics technologies continue to evolve, these approaches will become increasingly essential for extracting meaningful biological signals from complex, high-dimensional data.
Accurate classification of tumor types is a critical step in cancer diagnosis and the development of personalized treatment strategies. Molecular data, such as gene expression profiles from RNA sequencing (RNA-Seq), provides a high-resolution view of the biological state of a tumor. However, classifying samples based on this high-dimensional data presents significant statistical challenges, primarily due to the vast number of features (genes) relative to the number of samples. This application note explores the use of two powerful discriminant analysis classifiers—Linear Discriminant Analysis (LDA) and Quadratic Discriminant Analysis (QDA). Framed within the broader research on covariance matrix estimation for gene expression data, we detail how the choice between these methods hinges on the homogeneity or heterogeneity of the covariance structure across different cancer classes. We provide explicit protocols, performance comparisons, and practical guidance for researchers and drug development professionals aiming to implement these techniques.
Theoretical Foundation: LDA vs. QDA
Both LDA and QDA are probabilistic classifiers derived from Bayes' theorem. They model the class-conditional distribution of the data, (P(X|y=k)), for each class (k) as a multivariate Gaussian distribution. The core difference lies in their assumptions regarding the covariance matrix across classes, which directly influences the shape of the decision boundary [59].
The Gaussian distribution density for a class (k) is given by: [P(x | y=k) = \frac{1}{(2\pi)^{d/2} |\Sigmak|^{1/2}}\exp\left(-\frac{1}{2} (x-\muk)^t \Sigmak^{-1} (x-\muk)\right)] where (d) is the number of features, (\muk) is the mean vector for class (k), and (\Sigmak) is the covariance matrix for class (k).
- Linear Discriminant Analysis (LDA) assumes that all classes share a common covariance matrix ((\Sigma_k = \Sigma) for all (k)). This simplifying assumption leads to a linear decision boundary between classes. The log-posterior simplifies to a linear function of (x) [59].
- Quadratic Discriminant Analysis (QDA) relaxes this assumption by allowing each class (k) to have its own specific covariance matrix, (\Sigma_k). This added flexibility enables QDA to capture more complex, class-specific data distributions, resulting in a quadratic decision boundary [60] [59].
The following diagram illustrates the fundamental logical relationship between covariance matrices and the resulting classifier.
Comparative Performance in Cancer Classification
The choice between LDA and QDA has a direct and significant impact on classification performance, as demonstrated in studies across different cancer types and data modalities.
Table 1: Comparative Performance of LDA and QDA in Cancer Studies
| Cancer Type | Data Modality | Key Finding | Reference |
|---|---|---|---|
| Prostate Cancer | FT-MIR Spectroscopy | QDA-based models obtained higher classification rates and quality performance than LDA-based models for separating low-grade from high-grade cancer. | [60] |
| Pan-Cancer | RNA-Seq (TCGA) | Among 8 classifiers, SVM achieved the highest accuracy (99.87%); LDA/QDA were benchmarked, with performance dependent on data structure. | [61] |
| General (Ill-conditioned data) | Near-Infrared (NIR) | LDA is preferable with smaller sample sizes and similar class covariances, while QDA excels with large sample-to-variable ratios and differing covariances. | [62] |
In the context of prostate cancer classification using FT-MIR data, the performance superiority of QDA was quantified using several quality metrics, as summarized below.
Table 2: Quality Metrics for LDA vs. QDA in Prostate Cancer Classification Based on data from [60]
| Quality Metric | LDA-based Model | QDA-based Model | Description |
|---|---|---|---|
| Sensitivity | Lower | Higher | Ability to correctly identify positive cases (high-grade cancer). |
| Specificity | Lower | Higher | Ability to correctly identify negative cases (low-grade cancer). |
| Precision | Lower | Higher | Proportion of positive identifications that were actually correct. |
| Youden's Index | Lower | Higher | Combines sensitivity and specificity to measure overall effectiveness. |
The underlying biochemical rationale for the successful classification in the prostate cancer study was attributed to secondary protein structure variations and DNA/RNA alterations, which QDA was better able to capture due to its flexible boundary [60].
Protocol for Differentiating Tumor Types Using RNA-Seq Data
This protocol outlines the steps for implementing LDA and QDA to classify cancer types using RNA-Seq gene expression data, incorporating feature selection to handle high dimensionality.
Experimental Workflow
The complete process, from raw data to model evaluation, is visualized in the following workflow.
Step-by-Step Procedure
Step 1: Data Acquisition and Preprocessing
- Data Source: Acquire the dataset. A standard resource is The Cancer Genome Atlas (TCGA), also available via repositories like the UCI Machine Learning Repository's "Gene Expression Cancer RNA-Seq" dataset [61].
- Data Characteristics: A typical dataset may contain 801 cancer samples across 5 types (e.g., BRCA, KIRC, COAD, LUAD, PRAD) profiled for 20,531 genes [61].
- Preprocessing:
- Check for and handle missing values. The referenced dataset contained none [61].
- Normalize raw read counts to account for differences in library size and systematic biases [7].
- Center and Scale: Within each cancer type, center the normalized expression values to zero and scale them to have a variance of one. The formula for a gene (g) in cell (i) of type (k) is: [ \tilde{X}{gi} = \frac{X{gi} - \frac{1}{nk}\sum{j \in Sk} X{gj}}{\sqrt{\frac{1}{nk - 1}\sum{j \in Sk} (X{gj} - \frac{1}{nk}\sum{j \in Sk} X{gj})^2}} ] where (Sk) is the set of indices for cell type (k) and (nk) is the number of cells in that type [7].
Step 2: Feature Selection / Downsampling
RNA-Seq data is high-dimensional, which can lead to overfitting. Reducing the number of features is crucial.
- Apply Feature Selection Algorithms: Use methods like Lasso (L1 regularization) or Random Forest to identify a subset of statistically significant genes that are most predictive of the cancer type [61].
- Lasso Regression: Performs both regularization and automatic feature selection by driving the coefficients of less important features to zero. Its cost function is: [ \sum (yi - \hat{y}i)^2 + \lambda \Sigma |\beta_j| ]
- Objective: Reduce the feature set from tens of thousands of genes to a manageable number of dominant genes for modeling.
Step 3: Model Training and Evaluation
- Data Partitioning: Split the preprocessed and feature-downsampled data into a training set (e.g., 70%) and a hold-out test set (e.g., 30%) [61].
- Model Training:
- Model Validation: Use k-fold cross-validation (e.g., 5-fold) on the training set to tune parameters and assess model stability without using the test set [61].
- Performance Evaluation: Use the test set to compute performance metrics for both LDA and QDA.
- Accuracy: Overall proportion of correct predictions.
- Precision: Proportion of predicted positives that are actual positives.
- Recall (Sensitivity): Proportion of actual positives correctly identified.
- F1-Score: Harmonic mean of precision and recall.
- Confusion Matrix: A detailed breakdown of correct and incorrect classifications per class.
The Scientist's Toolkit: Key Reagents and Computational Tools
Table 3: Essential Research Reagent Solutions for RNA-Seq Based Classification
| Item Name | Function / Description | Example Source / Tool |
|---|---|---|
| RNA-Seq Data | Provides high-throughput gene expression profiles for cancer and normal tissue samples. | The Cancer Genome Atlas (TCGA) [61] |
| Feature Selection Algorithm | Identifies the most significant genes for classification, reducing dimensionality and noise. | Lasso Regression, Random Forest [61] |
| Programming Environment | Provides the computational backbone for data preprocessing, modeling, and analysis. | Python with scikit-learn library [61] [59] |
| Covariance Estimator | Calculates the covariance matrix/matrices, which is the core component of LDA/QDA. | sklearn.covariance module, qtQDA R package [63] [59] |
| Performance Metrics Package | Quantifies the accuracy and reliability of the classification model. | scikit-learn metrics (e.g., accuracy_score, classification_report) [61] |
Advanced Considerations: Covariance Matrix Estimation
The accurate estimation of the covariance matrix is paramount for the performance of both LDA and QDA, especially in high-dimensional, low-sample-size settings like genomics.
- The Challenge of High Dimensions: With thousands of genes ((p)) and only hundreds of samples ((n)), the standard Maximum Likelihood Estimator (MLE) of the covariance matrix becomes unstable and is a poor reflection of the true dependence structure between genes [63].
- Regularization and Advanced Methods:
- Regularized Discriminant Analysis (RDA): This technique introduces regularization parameters that shrink the class-specific covariance matrices towards a common pooled matrix, serving as an intermediary between LDA and QDA. It is particularly useful for ill-conditioned data [62].
- Local Covariance Estimation: A recent advancement involves estimating a local covariance matrix for each new sample observation. This method models dependencies between genes as being locally defined rather than global, which can significantly improve the performance of classifiers like QDA when applied to RNA-Seq data [63].
- Spatially-Varying Covariance: For single-cell spatial expression data, algorithms have been developed that use spatial location information to construct cell-specific gene co-expression networks, further personalizing the covariance structure [7].
The choice between LDA and QDA for tumor classification is not a matter of one being universally superior, but rather depends on the underlying structure of the gene expression data, particularly the covariance matrices across different cancer types.
- Use LDA when: The number of training samples is limited, or there is evidence that the covariance structures of the different cancer types are similar. LDA's assumption of a common covariance matrix provides a more robust and stable estimate in these scenarios, preventing overfitting [62].
- Use QDA when: A sufficient number of training samples is available relative to the number of features, and the biological nature of the cancer types suggests distinct molecular architectures (e.g., different activated pathways, cellular origins). QDA's flexibility to model class-specific covariances can capture these complex differences and lead to higher classification accuracy, as demonstrated in prostate cancer grading [60].
For future work, researchers should explore advanced covariance estimation techniques, such as regularized (RDA) and locally adaptive methods, to further enhance classification performance and robustness in the challenging high-dimensional domain of cancer genomics.
Solving the Curse of Dimensionality: Optimization and Feature Selection
Confronting Data Sparsity and Distance Metric Breakdown
In single-cell RNA sequencing (scRNA-seq) research, the accurate calculation of covariance matrices is foundational for understanding gene-gene relationships and cellular heterogeneity. However, this process is critically undermined by the dual challenges of data sparsity and distance metric breakdown. Data sparsity, inherent to scRNA-seq technology, results from low mRNA capture efficiency, while the high-dimensional nature of gene expression data—where the number of genes (p) is comparable to the number of cells (n)—causes sample covariance matrices to become poor estimators of their population counterparts [11]. This breakdown distances biological interpretation and complicates downstream analyses such as clustering and differential expression.
This Application Note synthesizes recent methodological advances to provide robust experimental protocols for overcoming these challenges, focusing on covariance matrix estimation within gene expression data research.
Table 1: Performance Benchmarks of Covariance-Focused Methods on scRNA-seq Data
| Method Name | Core Approach | Reported Clustering Accuracy (ARI) | Key Advantage | Computational Scalability |
|---|---|---|---|---|
| RMT-guided Sparse PCA [11] | Random Matrix Theory & Sparse PCA | N/A | Near parameter-free; superior cell type classification | High |
| IGA-IBA Hybrid Clustering [64] | Improved Genetic & Bat Algorithms | 0.92 (Adjusted Rand Index) | High inter-cluster variability & intra-cluster similarity | Moderate to High |
| MrVI [65] | Deep Hierarchical Generative Modeling | N/A | Single-cell resolution; identifies sample-level heterogeneity | High (via scvi-tools) |
| EDGES [66] | Spatially Constrained NMF | 37.3% avg. prediction improvement | Integrates spatial context; denoises & imputes | Moderate |
| ECLG Embedding [67] | Graph Neural Networks + Gene-Gene Graphs | N/A | Integrates regulatory interactions; enhances rare cell detection | High |
Table 2: Comparative Analysis of Method Outputs and Data Type Handling
| Method Name | Primary Output | Handles Data Sparsity | Mitigates Distance Breakdown | Key Application Context |
|---|---|---|---|---|
| RMT-guided Sparse PCA [11] | Denoised, sparse principal components | Yes (via biwhitening) | Yes (RMT denoising) | Cell type classification; exploratory analysis |
| IGA-IBA Hybrid Clustering [64] | Biclusters (genes & conditions) | Yes (heuristic optimization) | Implicitly via improved clustering | Gene co-expression network discovery |
| MrVI [65] | Latent cell states & sample groups | Yes (generative model) | Yes (counterfactual analysis in latent space) | Multi-sample cohort studies; differential expression/abundance |
| EDGES [66] | Denoised & completed expression matrices | Yes (NMF & reference integration) | Yes (spatial regularization) | Spatial transcriptomics enhancement |
| ECLG Embedding [67] | Integrated cell embeddings | Yes (graph-based learning) | Yes (incorporates gene-gene interactions) | Rare cell population identification; trajectory inference |
Experimental Protocols for Advanced Covariance Estimation
Protocol 1: RMT-Guided Sparse PCA for Covariance Stabilization
This protocol details the use of Random Matrix Theory (RMT) to obtain a denoised, sparse estimate of the principal components of the covariance matrix, improving cell type classification [11].
Applications: Covariance matrix denoising for cell type classification and exploratory analysis of scRNA-seq data.
Reagents and Equipment:
- scRNA-seq count matrix (
X ∈ ℝ^{n×p}) - Computational environment with R or Python
- Sparse PCA algorithm (e.g., from
scikit-learn) - Implementation of biwhitening and RMT criterion (custom script)
Procedure:
- Data Preprocessing: Standardize the scRNA-seq count matrix
Xto have zero mean and unit variance for each gene. - Biwhitening:
a. Estimate diagonal cell-covariance matrix
Aand gene-covariance matrixBby optimizing for scaling factorsc_i(cells) andd_j(genes) such that the transformed matrixZ = C X Dhas cell-wise and gene-wise variances of approximately one [11]. b. Apply the biwhitening transformation:X_whitened = A^{-1/2} X B^{-1/2}. This step stabilizes variance and prepares the data for RMT analysis. - Outlier Eigenspace Identification:
a. Compute the sample covariance matrix
Sof the biwhitened data. b. Use RMT to analytically determine the theoretical bound of the noise spectrum ofS. Identify eigenvalues exceeding this bound as the "outlier eigenspace" containing biological signal. - Sparse PCA with RMT Guidance:
a. Apply a sparse PCA algorithm to the biwhitened matrix
X_whitened. b. Use the RMT-predicted angle between the signal eigenvector and the outlier eigenspace to automatically guide the selection of the sparsity penalty parameter. - Output: A set of sparse, denoised principal components that provide a robust representation for downstream clustering and visualization.
Troubleshooting:
- Failure to identify outliers: Ensure the biwhitening procedure has correctly stabilized variances. Re-check the estimation of
AandB. - Overly sparse components: The RMT-guided parameter selection should prevent this. Verify the implementation of the RMT angle criterion.
Protocol 2: MrVI for Sample-Level Covariance and Differential Analysis
This protocol employs the multi-resolution variational inference (MrVI) model for a single-cell resolution analysis of multi-sample studies, enabling covariance estimation across samples and conditions without pre-defined cell states [65].
Applications: Exploratory and comparative analysis of multi-sample scRNA-seq studies (e.g., patient cohorts, perturbation screens).
Reagents and Equipment:
- Multi-sample scRNA-seq dataset (AnnData object)
- Python installation with
scvi-toolslibrary - GPU acceleration (recommended)
Procedure:
- Data Preparation:
a. Organize your data into an AnnData object, ensuring sample IDs (
s_n) are recorded for each cell. b. Specify any known nuisance covariates (e.g., batch). c. Preprocess the data following standardscvi-toolsworkflow (normalization, log-transformation, highly variable gene selection). - Model Setup and Training: a. Initialize the MrVI model, providing the sample IDs as the key target covariate. b. Train the model using evidence lower bound (ELBO) maximization until convergence.
- Exploratory Analysis (Sample Grouping):
a. For each cell
n, compute the posterior distributionp(z_n | u_n, s')for all sampless'. b. Construct a sample distance matrix based on the Euclidean distance between these hypothetical cell states. c. Perform hierarchical clustering on the distance matrix to identify de novo sample stratifications [65]. - Comparative Analysis (Differential Expression/Abundance):
a. For differential expression, use the model's counterfactual framework. Compare the expected
p(z_n | u_n, s')for samples in condition S1 versus S2, and decode to gene space to identify genes with significant fold changes. b. For differential abundance, compare the aggregate posteriorsp(u_n | s')for samples in S1 versus S2 to identify cell states disproportionately abundant across conditions [65].
Troubleshooting:
- Slow training: Ensure GPU acceleration is active. Consider subsetting the data or genes if the dataset is extremely large.
- Unclear sample stratifications: This may indicate a lack of strong sample-level effects. MrVI is designed to detect subtle, cell-subset specific effects, so inspect results at the level of individual cell clusters.
Protocol 3: ECLG Embedding Integrating Gene-Gene Interactions
This protocol creates an enriched cellular representation that integrates gene expression with data-driven gene-gene interaction networks, addressing sparsity by leveraging relational information [67].
Applications: Enhanced cell embedding for rare cell population detection, clustering, and trajectory inference.
Reagents and Equipment:
- scRNA-seq count matrix
- Python with
scikit-learn,genie3(or equivalent), and a graph neural network library (e.g.,PyTorch Geometric)
Procedure:
- Data Preprocessing: a. Perform log-scale normalization on the raw count matrix. b. Filter to the top 2,000 highly variable genes to reduce dimensionality and noise [67].
- Construct Cell-Leaf Graph (CLG):
a. Use the GENIE3 algorithm. For each gene
i, train a random forest to predict its expression using all other genes as input. b. Set the minimum cell count in each decision tree leaf to 10 to enhance sensitivity to rare populations. c. Extract gene-gene interaction weights from the random forest importance scores, creating a directed regulatory graph [67]. - Build K-Nearest Neighbor Graph (KNNG): a. Compute the K-nearest neighbor graph among cells based on their gene expression profiles (e.g., using Euclidean distance).
- Integrate Graphs and Generate Embeddings: a. Fuse the CLG and KNNG into a single Enriched Cell-Leaf Graph (ECLG). b. Process the ECLG using a Graph Neural Network (GNN). The GNN propagates information across the graph, outputting a low-dimensional embedding for each cell that encapsulates both gene expression similarity and gene-gene regulatory relationships [67].
- Downstream Analysis: Use the resulting ECLG embeddings for clustering, UMAP/t-SNE visualization, and trajectory inference.
Troubleshooting:
- Low feature importance scores: This may indicate high noise. Ensure proper data preprocessing and consider increasing the number of trees in the random forest ensemble.
- GNN overfitting: Use standard deep learning regularization techniques (e.g., dropout, weight decay) during GNN training.
Visual Workflows for Key Protocols
Diagram 1: Workflow for ECLG embedding protocol, showing integration of gene-gene interactions (CLG) with expression profiles (KNNG) via a GNN [67].
Diagram 2: RMT-guided sparse PCA protocol for covariance matrix denoising, showing the critical biwhitening and outlier identification steps [11].
The Scientist's Toolkit: Key Research Reagents & Solutions
Table 3: Essential Computational Tools for Advanced scRNA-seq Covariance Analysis
| Tool / Resource | Function in Analysis | Key Feature | Accessibility |
|---|---|---|---|
| scvi-tools (MrVI) [65] | Probabilistic modeling of multi-sample studies | Hierarchical VAE; counterfactual analysis | Open-source Python package |
| RMT-guided Sparse PCA [11] | Denoising covariance matrices for cell classification | Parameter-free sparsity selection | Custom implementation (algorithm described) |
| GENIE3 Algorithm [67] | Inferring gene-gene interaction networks from expression data | Tree-based ensemble regulator ranking | Open-source R/Python package |
| Graph Neural Network (GNN) Libraries | Learning from graph-structured data (ECLG) | Message passing between connected nodes | Open-source (e.g., PyTorch Geometric) |
| IGA/IBA Hybrid Code [64] | Dual clustering of genes and conditions | Combines global (IBA) and local (IGA) search | Custom implementation (algorithm described) |
In the analysis of high-dimensional biological data, such as gene expression datasets comprising thousands of genes, dimensionality reduction serves as a critical pre-processing step. These techniques alleviate the "curse of dimensionality," a phenomenon where high-dimensional space leads to data sparsity, increased computational complexity, and potential overfitting in machine learning models [68] [69]. For gene expression data research, which fundamentally relies on understanding covariance and variation between genes, dimensionality reduction provides a pathway to simplify data complexity while preserving essential biological information and structural relationships [68] [70]. This Application Note details the protocols for three pivotal techniques—Principal Component Analysis (PCA), Linear Discriminant Analysis (LDA), and t-Distributed Stochastic Neighbor Embedding (t-SNE)—framed within the context of covariance matrix calculation for gene expression studies.
Theoretical Foundations and Comparison
Dimensionality reduction techniques can be broadly categorized into linear and nonlinear methods, as well as unsupervised and supervised approaches. The table below summarizes the key characteristics of PCA, LDA, and t-SNE.
Table 1: Comparative Analysis of Dimensionality Reduction Techniques
| Characteristic | PCA (Principal Component Analysis) | LDA (Linear Discriminant Analysis) | t-SNE (t-Distributed Stochastic Neighbor Embedding) |
|---|---|---|---|
| Category | Linear, Unsupervised [68] | Linear, Supervised [68] [71] | Non-linear, Unsupervised [68] [72] |
| Primary Objective | Maximize variance in the data [68] | Maximize separation between classes [68] | Preserve local data structure and clusters [68] [73] |
| Input Data | Original feature matrix (e.g., gene expression) [74] | Original feature matrix + class labels [71] | Distance matrix or high-dimensional data [74] |
| Handles Nonlinearity | No [68] [74] | No [71] | Yes [72] [75] |
| Key Output | Principal Components (directions of maximum variance) [68] | Linear Discriminants (directions of maximum class separation) [68] | 2D/3D projection emphasizing cluster structure [68] [73] |
| Interpretability | High (component loadings indicate feature contribution) [72] | High [71] | Low (distances between clusters not meaningful) [72] |
The choice of technique is guided by the data structure and research objective. PCA is ideal for initial exploratory analysis and noise reduction. LDA is applied when the goal is classification and the class labels are known. t-SNE excels at revealing complex, non-linear cluster structures that may be obscured by linear methods [68] [72]. Recent advances, such as the Boosting Autoencoder (BAE), combine deep learning with variable selection to identify small, interpretable gene sets that characterize latent dimensions, enhancing the biological interpretability of patterns discovered in single-cell RNA sequencing data [76].
Experimental Protocols
Protocol 1: Principal Component Analysis (PCA) for Gene Expression Data
PCA is a linear dimensionality reduction technique that identifies orthogonal axes of maximum variance in the data, known as Principal Components. The computation of the covariance matrix is central to this process, as it captures the relationships between all pairs of genes [68] [70].
Applications: Data preprocessing, noise reduction, visualization of major variance trends, and feature extraction for downstream analysis [68] [69].
Materials:
- Input Data: A gene expression matrix (cells/samples × genes) [74].
- Software: Computational environment with linear algebra libraries (e.g., Python with NumPy/SciPy, R).
Methodology:
- Step 1: Data Standardization Standardize the dataset to have a mean of zero and a unit variance for each gene. This is critical because PCA is sensitive to the scales of variables [68] [69]. [ Z = \frac{X - \mu}{\sigma} ] where ( X ) is the original data, ( \mu ) is the mean, and ( \sigma ) is the standard deviation.
Step 2: Covariance Matrix Computation Calculate the covariance matrix of the standardized data. The covariance matrix is a ( d \times d ) symmetric matrix (where ( d ) is the number of genes) that captures how much any two genes vary together [68] [70]. [ \Sigma = \frac{1}{n-1} Z^T Z ] where ( n ) is the number of samples.
Step 3: Eigenvalue Decomposition Perform eigenvalue decomposition on the covariance matrix ( \Sigma ) [68]. [ \Sigma v = \lambda v ] The eigenvectors ( v ) represent the principal components (directions of maximum variance), and the corresponding eigenvalues ( \lambda ) represent the magnitude of the variance explained by each principal component.
Step 4: Projection Select the top ( k ) eigenvectors based on the largest eigenvalues. Project the original standardized data onto this new subspace to obtain the dimensionally reduced dataset [68]. [ Y = Z \cdot Wk ] where ( Wk ) is the matrix of the top ( k ) eigenvectors.
Troubleshooting Tip: If the resulting principal components do not appear to capture meaningful biological variance, ensure data was properly standardized and inspect the eigenvalue scree plot to select an appropriate number of components ( k ) [68].
Protocol 2: Linear Discriminant Analysis (LDA) for Classification Tasks
LDA is a supervised method that finds a feature subspace that maximizes the separability between known classes. It is particularly useful for enhancing classifiers in a lower-dimensional space [68] [71].
Applications: Classification tasks, such as tumor subtype classification from gene expression profiles [71] [70].
Materials:
- Input Data: A gene expression matrix and a vector of class labels for each sample [71].
- Software: Computational environment with LDA capabilities (e.g., Python's scikit-learn, R's MASS package).
Methodology:
- Step 1: Compute Within-Class and Between-Class Scatter Matrices Calculate the within-class scatter matrix ( SW ), which measures the variance within each class, and the between-class scatter matrix ( SB ), which measures the variance between the means of different classes [68]. [ SW = \sum{i=1}^{C} \sum{x \in Di} (x - mi)(x - mi)^T ] [ SB = \sum{i=1}^{C} ni (mi - m)(mi - m)^T ] where ( C ) is the number of classes, ( Di ) is the set of samples in class ( i ), ( mi ) is the mean vector of class ( i ), ( m ) is the overall mean vector, and ( ni ) is the number of samples in class ( i ).
Step 2: Solve the Generalized Eigenvalue Problem The goal is to find the linear discriminants that maximize the ratio of the between-class scatter to the within-class scatter [68]. [ SB v = \lambda SW v ] This is equivalent to solving ( SW^{-1}SB v = \lambda v ).
Step 3: Projection Select the top ( k ) eigenvectors (typically ( k \leq C-1 )) and project the original data onto this new subspace.
Troubleshooting Tip: LDA assumes that the data within each class is normally distributed and that all classes share the same covariance matrix. Performance may drop if these assumptions are violated or with overlapping classes [71].
Protocol 3: t-Distributed Stochastic Neighbor Embedding (t-SNE) for Visualization
t-SNE is a non-linear technique particularly adept at visualizing high-dimensional data in two or three dimensions by preserving local similarities and revealing cluster structures [68] [73].
Applications: Visualizing complex structures in single-cell RNA-seq data, exploring cluster patterns, and quality control of sample groupings [68] [73].
Materials:
- Input Data: High-dimensional gene expression matrix or a precomputed distance matrix [74].
- Software: Implementation of t-SNE (e.g., Python's scikit-learn, R's Rtsne).
Methodology:
- Step 1: Compute Pairwise Similarities in High Dimensions For each pair of data points ( i ) and ( j ), calculate the conditional probability ( p{j|i} ) that point ( i ) would pick point ( j ) as its neighbor, based on a Gaussian kernel centered at ( i ) [68]. [ p{j|i} = \frac{\exp(-||xi - xj||^2 / 2\sigmai^2)}{\sum{k \neq i} \exp(-||xi - xk||^2 / 2\sigmai^2)} ] The perplexity parameter is used to guide the choice of the bandwidth ( \sigmai ) for each point.
Step 2: Define the Low-Dimensional Similarity Define a similar probability distribution ( q{ij} ) in the low-dimensional map using a Student's t-distribution (which has heavier tails, helping to mitigate the "crowding problem") [68]. [ q{ij} = \frac{(1 + ||yi - yj||^2)^{-1}}{\sum{k \neq l} (1 + ||yk - y_l||^2)^{-1}} ]
Step 3: Minimize the Kullback-Leibler (KL) Divergence The positions of the points in the low-dimensional map are determined by minimizing the KL divergence between the two distributions ( P ) and ( Q ) using gradient descent [68]. [ KL(P || Q) = \sum{i \neq j} p{ij} \log \frac{p{ij}}{q{ij}} ]
Troubleshooting Tip: t-SNE is stochastic; results can vary between runs. Always set a random seed for reproducibility. The interpretation of t-SNE plots should focus on the existence and tightness of clusters, not the distances between them, as these are not meaningful [72].
Workflow and Pathway Visualizations
The Scientist's Toolkit: Research Reagent Solutions
Table 2: Essential Computational Tools for Dimensionality Reduction Analysis
| Tool / Resource | Function | Example Use Case |
|---|---|---|
| Python (scikit-learn) | A comprehensive machine learning library with implementations of PCA, LDA, and t-SNE. | De facto standard for building end-to-end analysis pipelines, from preprocessing to model evaluation. |
| R Statistical Environment | Provides numerous packages for statistical analysis and visualization (e.g., stats, MASS, Rtsne). |
Preferred for statistical testing and exploratory data analysis, commonly used in bioinformatics. |
| Jupyter Notebook / RStudio | Interactive development environments for literate programming. | Ideal for prototyping analyses, documenting workflows, and sharing reproducible research. |
| Single-Cell Analysis Tools (e.g., Scanpy, Seurat) | Frameworks specifically designed for analyzing single-cell RNA-seq data, incorporating various DR methods. | Streamlined analysis of cell types and states from single-cell transcriptomics data [77] [76]. |
| Boosting Autoencoder (BAE) | An advanced deep learning approach for sparse, interpretable dimensionality reduction [77] [76]. | Identifying small, characteristic gene sets for specific cell groups or patterns in complex data. |
In the analysis of high-dimensional biological data, such as gene expression datasets from microarrays or RNA sequencing, feature selection (FS) is an indispensable pre-processing step. Its primary role is to identify and isolate the most pertinent and influential genes, thereby streamlining complex data for more efficient and accurate downstream analysis [78]. The necessity of FS is profoundly evident in gene expression research, where datasets typically contain thousands of genes (features) but only a limited number of biological samples (observations). This "large p, small n" problem can lead to model overfitting, increased computational costs, and reduced clarity of data interpretation if not properly addressed [79].
Within the specific context of gene expression data research, FS strategies are fundamentally linked to the calculation and interpretation of covariance matrices. These matrices quantify the co-expression relationships between genes, encoding functional associations and potential regulatory pathways [9] [7]. The choice of FS method directly influences the quality of the covariance matrix estimated by determining which genes are included in the analysis. A well-chosen feature subset can lead to a more accurate, robust, and biologically meaningful covariance structure, which is crucial for applications like gene network analysis, biomarker discovery, and pathway inference [80] [81]. This article details the core FS methodologies—filter, wrapper, and embedded methods—and provides application notes and protocols for their implementation in gene expression studies, with a particular emphasis on their impact on covariance matrix calculation.
Core Feature Selection Methods
Feature selection techniques are commonly categorized into three main frameworks based on how they integrate with the learning algorithm. The following sections describe each method, and Table 1 provides a structured comparison.
Table 1: Comparison of Feature Selection Method Categories
| Method Category | Key Principle | Advantages | Disadvantages | Typical Statistical Measures |
|---|---|---|---|---|
| Filter Methods | Selects features based on statistical measures of correlation, dependency, or information content, independent of a learning algorithm [82] [78]. | - High computational efficiency- Model-agnostic and simple to implement- Reduces overfitting risk by lowering model complexity [82] [78] | - Ignores feature interactions- May not align with the final model's performance, especially for non-linear relationships [78] | Variance, Mutual Information, Chi-square test, Pearson Correlation Coefficient [82] |
| Wrapper Methods | Evaluates feature subsets by using the performance of a specific predictive model as the selection criterion [82] [78]. | - Considers feature interactions- Directly optimizes for a specific learner, often leading to high-performing feature subsets [78] | - Computationally intensive due to repeated model training- High risk of overfitting on small-sample data [82] [78] | Sequential Forward Selection (SFS), Sequential Backward Selection (SBS), Genetic Algorithms [82] [78] |
| Embedded Methods | Integrates feature selection directly into the model training process, often using regularization techniques [82] [78]. | - Balances efficiency and performance- Incorporates feature importance during model training [78] | - Model-dependent, limiting generalizability- May require careful parameter tuning [83] | Lasso (L1-norm), Ridge (L2-norm), Elastic Net [82] |
Filter Methods
Filter methods operate as a preprocessing step. They assess the relevance of features using statistical scores, filtering out those deemed irrelevant or redundant before the model is built [78]. A key advantage is their speed and scalability, making them particularly suitable for the initial analysis of high-dimensional genomic data where the number of genes can reach tens of thousands [79]. For instance, in covariance matrix estimation, a filter method can quickly reduce the gene set to a smaller number of highly variable or highly correlated genes, thus alleviating the computational burden of estimating a massive covariance matrix.
Wrapper Methods
Wrapper methods frame FS as an optimization problem. They employ a search strategy to explore different feature subsets and evaluate the quality of each subset based on the performance of a pre-specified model (e.g., a classifier) [82]. Common search strategies include heuristic algorithms like Sequential Forward Selection (SFS) and Sequential Backward Selection (SBS) [82] [78]. While wrapper methods are powerful for capturing complex feature interactions, their computational cost is a significant drawback, especially when dealing with large feature spaces common in gene expression data [79].
Embedded Methods
Embedded methods seek a middle ground between filter and wrapper approaches. They perform FS as an integral part of the model training process. A prime example is the Lasso (Least Absolute Shrinkage and Selection Operator) regression, which incorporates an L1-norm penalty term. This penalty has the effect of shrinking the coefficients of less important features to exactly zero, effectively performing feature selection [82]. The integration of selection within training makes embedded methods generally more efficient than wrappers while still being tuned to the specific model, offering a favorable trade-off [78].
Advanced Hybrid and Regularized Approaches
To overcome the limitations of individual methods, researchers have developed advanced hybrid and regularized frameworks that combine their strengths.
Hybrid Feature Selection
Hybrid methods implement a multi-stage FS process. A typical pipeline might first use a fast filter method to eliminate a large number of irrelevant genes, then apply a more sophisticated wrapper or embedded method to refine the subset [82] [78]. For example, the PF-PSS method employs a double-layer parallel structure. In its first stage, multiple filter methods run in parallel to select an initial feature subset. In the second stage, an embedded method (Lasso) is combined with parallelized improved SFS and SBS wrapper algorithms to perform a fine screening [82]. This layered approach leverages the speed of filters and the accuracy of wrappers/embedded methods.
Regularization for Covariance Matrix Estimation
Directly estimating a large covariance matrix from a small sample of high-dimensional gene expression data is statistically challenging. Regularization techniques are essential to produce stable, well-conditioned estimates. The RCMAT method, for instance, uses a regularized covariance matrix to test for differences in gene set expression between phenotypes. It modifies the standard pooled covariance matrix estimator Σ by blending it with an identity matrix I: Σ_reg = αΣ + (1 - α)I. The parameter α is chosen to ensure Σ_reg is positive definite and invertible, thus enabling the use of multivariate statistics like Hotelling's T² even when the number of genes exceeds the number of samples [80]. This is directly applicable for constructing robust gene co-expression networks from limited data.
Another challenge is batch effect, where data collected from different laboratories or platforms exhibit systematic technical biases. This effect can alter not only the mean expression of individual genes but also the crucial inter-gene relationships encoded in the covariance matrix. A multivariate batch adjustment method has been proposed that uses a high-dimensional sparse covariance estimator based on a factor model. This method adjusts the data from different batches by applying an affine transformation, Y_adjusted = A⁻¹(Y - b), where A is derived from the covariance matrices of the individual batch and a "true" reference batch. This helps create a homogeneous, combined dataset where the covariance structure is preserved, leading to more reliable biological conclusions [15].
Application Notes and Protocols
This section provides a practical, step-by-step guide for implementing feature selection in gene expression analysis pipelines, with a focus on ensuring the quality of subsequent covariance matrix calculation.
Protocol 1: A Hybrid FS Pipeline for Covariance Matrix Analysis
This protocol outlines a hybrid FS strategy suitable for large-scale gene expression data, such as from microarray or bulk RNA sequencing [82].
Table 2: Research Reagent Solutions for Gene Expression Analysis
| Reagent / Resource | Function/Description | Application Note |
|---|---|---|
| Microarray or RNA-seq Kit | Platform for generating genome-wide expression data. | Ensure platform compatibility and standardized protocols to minimize technical batch effects [79]. |
| Gene Ontology (GO) / KEGG Database | Curated repositories of gene sets and biological pathways. | Used for functional annotation and validation of selected gene subsets [80]. |
| Computational Environment (e.g., R/Python) | Software for statistical computing and implementation of FS algorithms. | Essential for executing filter, wrapper, and embedded methods, and for covariance matrix calculation [79]. |
Workflow Overview: The following diagram illustrates the two-stage hybrid protocol for feature selection.
Step-by-Step Procedure:
Preliminary Screening Stage (Parallel Filtering):
- Input: Raw gene expression matrix (genes x samples).
- Step 1.1: Apply multiple filter methods (e.g., based on variance, correlation coefficient, mutual information) in parallel. Each method calculates an importance weight for every gene [82].
- Step 1.2: Use a "mean-median" method to determine thresholds for each filter method and obtain preliminary feature subsets [82].
- Step 1.3: Calculate the classification accuracy (e.g., using a KNN classifier) of each filter's subset. Use this accuracy as a "contribution rate" for weighting.
- Step 1.4: Aggregate the weighted results from all filters. Sort genes by their total combined weight and select the top-performing genes by identifying the "turning point" on a sorted weight plot to form the Initial Feature Subset [82].
Fine Screening Stage (Parallel Wrappers with Embedded Method):
- Input: Initial Feature Subset from Step 1.
- Step 2.1: Apply an embedded method, Lasso regression, to the initial subset. The genes with non-zero coefficients retained after Lasso are designated as "Elite Features" [82].
- Step 2.2: In parallel, run two wrapper methods:
- Path A: An improved Sequential Forward Selection (SFS) algorithm that considers the "Elite Features."
- Path B: An improved Sequential Backward Selection (SBS) algorithm that operates on the initial subset.
- Step 2.3: Merge the feature subsets output by the improved SFS and SBS algorithms.
- Step 2.4: Based on the size of the merged subset, apply a final screening strategy (e.g., further ranking or selection) to yield the Final Feature Subset [82].
Covariance Matrix Calculation:
- Input: The original gene expression data, but only for the genes in the Final Feature Subset.
- Step 3.1: Compute the sample covariance matrix for this reduced dataset. The regularization techniques described in Section 3.2 can be applied at this stage if the sample size is small to ensure matrix stability and positive definiteness [80] [15].
Protocol 2: Recovering Spatially-Varying Cell-Specific Co-expression Networks
With the advent of single-cell spatial transcriptomics, it is now possible to profile gene expression while retaining the spatial coordinates of cells in a tissue section [7]. This protocol describes a two-step algorithm to estimate cell-specific gene co-expression networks that vary across a tissue section.
Workflow Overview: The following diagram illustrates the process for recovering spatially-varying co-expression networks.
Step-by-Step Procedure:
Data Input and Preprocessing:
- Input: A gene-cell expression matrix, spatial coordinates of each cell, and (if available) cell type labels for each cell [7].
- Step 1.1: Normalize the raw expression counts to adjust for library size and other systematic biases.
- Step 1.2: Within each cell type
k, center and scale the normalized expression values to have zero mean and unit variance. This yields a standardized expression matrixX~[7].
Step 1: Estimate Cell-Type-Specific Covariance:
- Step 1.3: For each cell type
k, calculate the sample expression covariance matrixΣ̂⁽ᵏ⁾using the standardized data from the cells belonging to that type. This serves as an initial, coarse-grained estimate of the covariance for all cells of that type [7].
- Step 1.3: For each cell type
Step 2: Construct Cell-Specific Networks:
- Step 2.1: For a specific cell
iof interest, define its spatial neighborhood based on its coordinates(ℓ_i, h_i)[7]. - Step 2.2: Use the cell type proportions in this neighborhood and the pre-computed
Σ̂⁽ᵏ⁾matrices to assign an empirical prior distribution for celli's own covariance matrix,Σ_i[7]. - Step 2.3: Apply Bayes' rule to combine this prior with the observed data (the expression profile of cell
i) to obtain a posterior estimate forΣ_i. - Step 2.4: Convert the posterior mean of
Σ_ito a correlation matrix. Apply a threshold to shrink non-significant correlations to zero, resulting in a Cell-Specific Gene Co-expression Network [7].
- Step 2.1: For a specific cell
Network Interpolation (Optional):
- Step 2.5: This process can be repeated for every captured cell. Furthermore, the algorithm can predict (interpolate) gene co-expression networks for arbitrary spatial locations within the tissue by analyzing the neighborhoods of these new locations [7].
The strategic application of filter, wrapper, and embedded feature selection methods is a cornerstone of robust gene expression analysis. As demonstrated, the choice of FS strategy is not merely a pre-processing step but is intrinsically linked to the reliable estimation of covariance matrices, which are fundamental for understanding gene co-expression and interaction networks. For the high-dimensional, small-sample-size data typical in genomics, hybrid methods that leverage the speed of filters and the precision of wrappers/embedded methods, alongside regularization techniques for covariance matrix estimation, represent the current state-of-the-art. These approaches help mitigate overfitting, improve computational efficiency, and ultimately lead to more biologically interpretable and validated results, thereby directly supporting advancements in biomarker discovery, drug target identification, and personalized medicine.
In the field of gene expression data research, the high-dimensional nature of datasets—where the number of features (genes) vastly exceeds the number of samples (experiments or cells)—presents a significant challenge for robust statistical analysis [84] [85]. This "curse of dimensionality" is particularly pronounced during covariance matrix calculation, a fundamental operation for understanding gene-gene interactions and regulatory relationships. Models trained on such data are highly susceptible to overfitting, a phenomenon where they learn noise and random fluctuations specific to the training dataset rather than the underlying biological patterns, consequently failing to generalize to new, unseen data [86] [85]. This compromises the reproducibility of findings, can lead to misleading biomarker discovery, and ultimately wastes valuable research resources [85]. This protocol details the integrated application of cross-validation and regularization techniques to mitigate overfitting, ensuring the development of reliable and generalizable models in computational biology.
Background & Core Concepts
The Overfitting Problem in Bioinformatics
Overfitting occurs when a machine learning model becomes excessively complex, learning the detailed noise and random artifacts in the training data rather than the true underlying signal. In bioinformatics, this risk is exacerbated by the classic "p >> n" problem, where the number of predictors (p, often thousands of genes) is much larger than the number of observations (n, biological samples) [86] [85]. When calculating covariance matrices for gene expression data, this high dimensionality can lead to poor estimates of population covariance, making the results unstable and unreliable for downstream analyses like Gene Regulatory Network (GRN) inference.
Two primary, complementary strategies to combat overfitting are:
- Regularization: This technique modifies the learning process by adding a penalty term to the model's loss function to discourage over-complexity. This helps in producing simpler, more generalizable models [84].
- Cross-Validation: This technique assesses the model's performance by systematically partitioning the data into training and validation sets multiple times. It provides a realistic estimate of how the model will perform on independent data, thus helping to detect overfitting [84].
Quantitative Comparison of Techniques
The following tables summarize the key regularization and cross-validation methods relevant to gene expression data analysis.
Table 1: Common Regularization Techniques in Bioinformatics
| Technique | Mechanism | Key Advantages | Common Applications in Gene Expression Analysis |
|---|---|---|---|
| L1 (Lasso) [86] [87] | Adds a penalty equal to the absolute value of coefficient magnitudes. Can shrink coefficients to zero. | Performs feature selection, creating sparse models. Improves interpretability. | Gene selection for biomarker discovery [86]; Classifying leukemia subtypes from high-dimensional gene expression data [86]. |
| L2 (Ridge) [86] | Adds a penalty equal to the square of the coefficient magnitudes. Shrinks coefficients but rarely to zero. | Handles multicollinearity well. More stable than L1. | Stabilizing covariance matrix estimates; Regression tasks with correlated genes. |
| Elastic Net [86] | A hybrid that combines both L1 and L2 penalties. | Balances feature selection (L1) and group effect (L2). Often outperforms L1 or L2 alone in overall classification performance [86]. | Leukemia subtype classification where it achieved superior accuracy and Kappa scores [86]. |
| Dropout [88] | Randomly "drops" a proportion of neurons during training in a neural network. | Prevents complex co-adaptations on training data. A form of ensemble learning. | GRN inference from single-cell RNA-seq data to improve model robustness against dropout noise [88]. |
| Early Stopping [84] | Halts the training process once performance on a validation set stops improving. | Prevents the model from learning noise in the training data. Simple to implement. | Training deep learning models for GRN inference (e.g., preventing performance degradation in methods like DeepSEM) [88]. |
Table 2: Cross-Validation Strategies for Model Assessment
| Strategy | Procedure | Strengths | Limitations |
|---|---|---|---|
| k-Fold Cross-Validation [84] | Data is randomly partitioned into k equal-sized folds. The model is trained on k-1 folds and validated on the remaining fold, repeated k times. | Reduces variability in performance estimation compared to a single train-test split. Makes efficient use of all data. | Can be computationally expensive for large k or complex models. |
| Stratified k-Fold | A variation of k-fold that preserves the percentage of samples for each class in every fold. | Essential for imbalanced datasets. Provides more reliable performance estimates for minority classes. | Not relevant for regression tasks. |
| Nested Cross-Validation | An outer k-fold loop for performance estimation, and an inner loop for hyperparameter tuning. | Provides an almost unbiased estimate of the true performance of a model with tuned hyperparameters. | Computationally very intensive. |
Experimental Protocols
Protocol 1: Implementing Regularized GRN Inference with Single-Cell Data
This protocol applies a regularized deep learning model to infer a Gene Regulatory Network from single-cell RNA-sequencing (scRNA-seq) data, which is notoriously prone to overfitting due to its high sparsity and technical noise (e.g., dropout events) [88].
I. Research Reagent Solutions
| Item | Function/Description |
|---|---|
| scRNA-seq Dataset | Input gene expression matrix (cells x genes). Raw counts are transformed as log(1+x) to reduce variance [88]. |
| DAZZLE Model | A stabilized autoencoder-based model (e.g., from GitHub: TuftsBCB/dazzle) that uses Dropout Augmentation for regularization [88]. |
| Prior Network (Optional) | A preliminary GRN from public databases or other algorithms to guide inference [89]. |
| Computational Environment | Python with deep learning frameworks (PyTorch/TensorFlow) and high-performance computing (HPC) resources. |
II. Workflow Diagram
III. Step-by-Step Instructions
- Data Preprocessing: Begin with a raw count matrix from an scRNA-seq experiment. Transform the counts using the formula
x' = log(1 + x)to stabilize variance and avoid issues with zeros [88]. - Dropout Augmentation (DA): To regularize the model against the prevalent "dropout" noise, artificially introduce additional zeros into the training data. This counter-intuitive step, known as Dropout Augmentation, enhances model robustness by simulating more dropout events than are present in the original data [88].
- Model Initialization: Initialize a GRN inference model that uses a structural equation modeling framework, such as DAZZLE or DeepSEM. This model parameterizes the adjacency matrix (representing the GRN) within an autoencoder architecture [88].
- Apply Regularization Techniques:
- Sparsity Constraint: Apply a constraint to the adjacency matrix to encourage a sparse solution, reflecting the biological prior that each gene is regulated by only a limited number of transcription factors.
- Early Stopping: Monitor the model's reconstruction error on a held-out validation set. Halter training when this validation error plateaus or begins to increase for a predetermined number of epochs to prevent overfitting [84] [88].
- Model Training & Validation: Train the model to reconstruct its input (the preprocessed and augmented expression matrix) using the training set. Periodically evaluate its performance on the untouched validation set to guide early stopping.
- GRN Extraction: After training is complete, extract the learned adjacency matrix from the model. The non-zero values in this matrix represent the predicted regulatory interactions between genes.
Protocol 2: Cross-Species GRN Prediction Using Transfer Learning
This protocol uses transfer learning to infer GRNs in a data-scarce "target" species by leveraging knowledge from a data-rich "source" species, effectively mitigating overfitting caused by limited training data [90].
I. Research Reagent Solutions
| Item | Function/Description |
|---|---|
| Source Species Data | Large, well-annotated transcriptomic compendium (e.g., Arabidopsis thaliana with 22,093 genes across 1,253 samples) [90]. |
| Target Species Data | Smaller, limited transcriptomic dataset from a related species (e.g., poplar or maize) [90]. |
| Orthology Mapping | A file mapping orthologous genes between the source and target species. |
| Hybrid CNN-ML Model | A model combining Convolutional Neural Networks for feature extraction and classic Machine Learning for classification [90]. |
II. Workflow Diagram
III. Step-by-Step Instructions
- Data Curation: Obtain large-scale transcriptomic compendia for both the source (e.g., Arabidopsis thaliana) and target (e.g., poplar) species. Preprocess the data uniformly, including quality control, read alignment, and normalization (e.g., using TMM from edgeR) [90].
- Orthology Mapping: Identify pairs of orthologous genes between the two species using standard databases and tools. This mapping is crucial for transferring knowledge across species.
- Source Model Training: Train a hybrid model on the source species data. This model might use a Convolutional Neural Network (CNN) to learn deep features from the expression profiles of a transcription factor and its potential target, followed by a machine learning classifier (e.g., SVM or Random Forest) to predict regulatory interactions [90].
- Knowledge Transfer:
- Freeze Feature Layers: Transfer the trained model to the target species. Freeze the weights of the initial, feature-extraction layers (the CNN). This preserves the general patterns of gene regulation learned from the data-rich source [90].
- Fine-Tune Classifier: Replace and retrain the final classification layers of the model using the limited labeled data from the target species. This allows the model to adapt to species-specific regulatory patterns.
- Evaluation: Assess the final model's performance on a completely held-out test set from the target species. This cross-species transfer learning approach has been shown to achieve high accuracy (>95% in some studies), effectively overcoming data scarcity in the target organism [90].
The Scientist's Toolkit
Table 3: Essential Software and Libraries for Implementation
| Tool/Library | Primary Function | Application Note |
|---|---|---|
| Scikit-learn | Provides implementations for Ridge, Lasso, and Elastic Net regression, as well as k-fold cross-validation. | Ideal for prototyping traditional ML models with built-in regularization [85]. |
| TensorFlow / PyTorch | Deep learning frameworks that enable custom model building. | Essential for implementing complex regularized models like DAZZLE, allowing for custom loss functions with L1/L2 penalties, dropout layers, and early stopping callbacks [85] [88]. |
| Bioconductor | A repository of R packages for the analysis and comprehension of genomic data. | Offers specialized packages for preprocessing high-throughput biological data and performing differential expression analysis prior to covariance matrix calculation. |
This Application Note provides a detailed protocol for tuning the block size and error margin parameters in sparse methods, specifically within the context of Sparse Quadratic Discriminant Analysis (SQDA) for high-dimensional genomic data. Proper tuning of these parameters is critical for constructing accurate classifiers and gene co-expression networks in gene expression data research, where the number of features (p) typically far exceeds the sample size (n) [44] [91]. This document outlines a standardized experimental procedure, validated through simulation studies, to optimize these parameters and enhance the performance of sparse covariance matrix estimation.
The following table summarizes key quantitative findings on the impact of block size and error margin on classifier performance, as derived from simulation studies [44].
Table 1: Impact of Block Size and Error Margin on Misclassification Rates in SQDA
| Block Size | Error Margin = 0.05 | Error Margin = 0.10 | Error Margin = 0.15 |
|---|---|---|---|
| 100 | Consistently low | Consistently low | Consistently low |
| 200 (Optimal) | Lowest misclassification | Satisfactory performance | Satisfactory performance |
| 300 | Performance degradation | Performance degradation | Performance degradation |
| 400 | Performance degradation | Performance degradation | Performance degradation |
- Key Observations:
- The optimal block size is dependent on the true underlying block structure of the data [44].
- An error margin of 0.05 generally yields the best performance, particularly when the block size is appropriately chosen [44].
- Using a block size that is too small (e.g., 100) can yield consistently low error rates across different error margins, providing a robust, though not necessarily optimal, configuration [44].
Experimental Protocol
This protocol details the procedure for tuning block size and error margin parameters for SQDA, as described in the simulation study by [44].
Materials and Software Requirements
Table 2: Research Reagent Solutions & Essential Materials
| Item Name | Function/Application in the Protocol |
|---|---|
| High-Dimensional Simulated Datasets | Used to test parameter performance under controlled conditions with known ground truth. Examples include Independent Structure Same Covariance (ISSC) and Dependent Structure Different Covariance (DSDC) [44]. |
| Computational Environment | Software platform (e.g., R, Python) with capabilities for sparse matrix estimation and cross-validation. |
| Blockwise Autoregression Structure | A specific covariance structure used in simulations to model gene dependencies, characterized by blocks with high internal correlation [44]. |
| Cross-Validation Framework | A resampling procedure used to assess the predictive performance of the model and prevent overfitting. |
Step-by-Step Procedure
Data Simulation and Preparation:
- Generate training and testing datasets based on the desired covariance structure (e.g., DSDC). For a dataset with 10,000 genes, a typical training set may consist of 100 samples (50 per class), with a larger testing set (e.g., 500 samples per class) for evaluation [44].
- For dependent covariance structures, define a block-diagonal covariance matrix
Σ. Each blockΣ_ρcan be an autoregressive matrix where element(i,j)is defined byρ^{|i-j|}, withρoften set to 0.95 to simulate high correlation within blocks [44].
Parameter Grid Setup:
- Define a range of candidate values for the parameters to be tuned.
- Block Size: Test a series of values, for example: 100, 150, 200, 250, 300, 350, 400 [44].
- Error Margin: Test values such as 0.05, 0.10, and 0.15 [44]. The error margin determines which blocks of features are selected for the final model; blocks with cross-validation errors exceeding the smallest error by this predefined margin are excluded.
Model Training and Cross-Validation:
- For each combination of block size and error margin in the parameter grid, fit an SQDA model.
- The SQDA method estimates separate sparse covariance matrices for each class by assuming a block-diagonal structure and performing variable selection by blocks [44].
- Use cross-validation on the training data to estimate the misclassification rate for each parameter combination.
Parameter Selection and Model Evaluation:
- Identify the parameter combination (block size, error margin) that yields the lowest cross-validation error.
- If the optimal block size is not known a priori, a smaller block size (e.g., 100) with a small error margin (e.g., 0.05) is a robust starting point [44].
- Validate the final model with the selected parameters on the held-out testing dataset to obtain an unbiased estimate of the misclassification rate.
Workflow Visualization
The following diagram illustrates the key steps in the parameter tuning protocol.
Interpretation and Guidance
- Sample Size Considerations: The performance of parameter tuning is highly dependent on sample size. With smaller sample sizes, cross-validation error has higher variance, so a larger error margin may be preferred to include more potentially predictive features. With larger sample sizes, a smaller error margin is better for excluding noisy features [44].
- Biological Context Integration: The assumption of a block-diagonal covariance structure in SQDA corresponds to the biological reality of modular genetic networks [44] [91]. When prior knowledge about functional gene groups (e.g., from pathway databases) is available, this can inform the initial selection of block sizes for testing.
- Method Selection: SQDA is particularly advantageous when the underlying genetic networks (covariance structures) differ between sample classes, such as when comparing disease and normal tissues [44]. In genomics, the rewiring of genetic networks across diseases is a common phenomenon, making SQDA often more appropriate than methods assuming a common covariance.
Ensuring Reliability: Benchmarking, Comparison, and Biological Validation
Statistical Tests for Equality of Covariance Matrices
In gene expression data research, comparing covariance matrices is a fundamental step for understanding the genetic architecture of quantitative traits and the evolutionary constraints on phenotypic evolution. Covariance matrices, particularly the G-matrix (additive genetic variances and covariances) and the P-matrix (phenotypic variances and covariances), summarize the genetic architecture of traits and determine their short-term response to multivariate selection [92]. Testing the equality of these matrices enables researchers to investigate a wide array of evolutionary and molecular biological problems, including: the stability of G under selection and drift, the role of genetic constraints in determining evolutionary trajectories during adaptive radiations, the response of genetic architecture to environmental heterogeneity, the evolution of phenotypic integration, multi-character phenotypic plasticity, and sexual dimorphism [92].
Within the context of gene expression data, these comparisons are equally vital. The inference of gene regulatory networks from microarray data relies on accurately characterizing the complex dependency structures among genes, which are encoded in covariance matrices [93]. The fundamental challenge in this domain often involves performing robust statistical comparisons when the number of genes (variables) far exceeds the number of observations, a common scenario in high-throughput genomic studies [94] [93].
Several statistical methods have been developed for comparing covariance matrices, ranging from simple, distribution-free exploratory tools to sophisticated model-based approaches. These methods can be broadly categorized as follows.
Table 1: Categories of Covariance Matrix Comparison Methods
| Method Category | Key Characteristics | Example Techniques |
|---|---|---|
| Element-wise Comparisons | Simple, ignore lack of independence between matrix elements, cannot detect proportionality [92]. | Pair-wise comparisons of matrix elements [92]. |
| Methods Based on Test Vectors | Compare products of matrices and test vectors; similar matrices yield similar outputs [92]. | Random projection methods [94]. |
| Common Principal Components Analysis (CPCA) | Maximum likelihood-based; tests hierarchical hypotheses about shared eigenstructure (e.g., unrelated, partial sharing, proportional, equal) [92]. | Flury hierarchy [92]. |
| Eigenvector Variance Comparison | Distribution-free; compares variance explained by eigenvectors of one matrix in the other sample [92]. | S1, S2, S3 statistics [92]. |
| Regularized Covariance Selection | Designed for high-dimensional data (p >> n); uses regularization to obtain stable estimates [93]. | ℓ2C method, PINV, RCM [93]. |
Key Statistical Tests and Protocols
The Eigenvector Variance Comparison Method
This procedure is a simple, distribution-free method for exploring differences between two covariance matrices. Its rationale is that if the covariance matrices of two data samples are similar, then the eigenvectors from a Principal Component Analysis (PCA) of one sample will explain similar amounts of variance in the other sample [92].
Experimental Protocol:
- Data Preparation: Let
D1andD2be the data matrices (e.g., gene expression levels) for the two populations/species/conditions under study. The matrices have dimensionsn1 x pandn2 x p, wherenis the sample size andpis the number of variables (genes). - Covariance Matrix Calculation: Compute the sample covariance matrices
C1andC2fromD1andD2, respectively. - Eigen Decomposition: Perform an eigen decomposition (PCA) on both
C1andC2. This yields matricesX1andX2, whose columns are the eigenvectors of the respective covariance matrices. - Variance Calculation: For each eigenvector
i(from 1 top), calculate four variance measures:vi11: Variance explained inD1by eigenvectorifromX1(this is the eigenvalueifromC1).vi12: Variance explained inD1by eigenvectorifromX2.vi21: Variance explained inD2by eigenvectorifromX1.vi22: Variance explained inD2by eigenvectorifromX2(this is the eigenvalueifromC2). The variances are best expressed as proportions of the total variance for standardization.
- S-Statistics Calculation: Compute the three core statistics that measure differentiation:
S1 = 2 * Σ [ (vi11 - vi21)² + (vi12 - vi22)² ](Overall differentiation)S2 = Σ [ (vi11 + vi22 - vi12 - vi21)² ](Contribution of orientation differences)S3 = Σ [ (vi11 + vi12 - vi21 - vi22)² ](Contribution of shape differences) It holds thatS1 = S2 + S3. For easier comparison, these statistics can be normalized to a [0,1] scale by dividing by 8 [92].
Random Projection Tests for High-Dimensional Data
Classical tests, like the likelihood ratio test, break down when the data dimension p exceeds the sample size n due to the singularity of the sample covariance matrices. The random projection method is a conceptually simple solution that projects high-dimensional data onto a one-dimensional random subspace, allowing the application of conventional univariate tests [94].
Experimental Protocol (Two-Sample Test):
- Data: Let
X1,...,Xn1andY1,...,Yn2be thep-dimensional data vectors (e.g., expression levels ofpgenes) from two conditions, followingNp(0, Σ1)andNp(0, Σ2)respectively. - Generate Random Projections: Generate
mindependent normalized Gaussian random vectorsR1, R2, ..., Rm, each of dimensionp x 1. - Project Data: For each projection vector
Ri, create univariate projected datasets:X_k^i = R_i' * X_kfork = 1 to n1Y_k^i = R_i' * Y_kfork = 1 to n2Conditioned onRi,X_k^iandY_k^ifollow univariate normal distributions with variancesσ1 = R_i' * Σ1 * R_iandσ2 = R_i' * Σ2 * R_i.
- Perform Univariate Tests: For each projected dataset
i, use a conventional univariate test (e.g., an F-test) to test the null hypothesisH0: σ1 = σ2. - Aggregate Results: Let
p_ibe the p-value from thei-th univariate test. The final decision is based on an extremal type statistic,T = min_{1≤i≤m} p_i. The null distribution ofTcan be approximated using Poisson process approximation, and the significance level is estimated accordingly. The global null hypothesisH0: Σ1 = Σ2is rejected ifTis sufficiently small [94].
Covariation Matrices for Gene Expression Data
In transcriptomic analysis, correlation between genes can be calculated based on coexpression (correlation between absolute expression levels) or covariation (correlation between relative changes in expression levels, e.g., fold-change). Covariation is often more reproducible across laboratories, especially when analyzing data from different sources [20].
Experimental Protocol for Constructing Covariation Matrices (CVM):
- Data Input: A set of
nbiological conditions (e.g., tissue samples, time points) profiled using a single-channel platform like Affymetrix. - Systematic Comparisons: Perform all possible pairwise comparisons between the
nconditions, resulting inN = n(n-1)/2comparisons. - Gene Classification: For each gene and each pairwise comparison, classify the gene's expression change as Increased (I), Decreased (D), or Not changed (N) using a method like Rank Difference Analysis of Microarray (RDAM). This results in a symbol string of length
Nfor each gene (e.g., "IDDNNIDID...DNNID"). - Calculate Correlation Scores: For any pair of genes, calculate statistically significant positive and negative correlation scores by comparing their respective strings of I/D/N symbols.
- Matrix Construction: Construct positive and negative covariation matrices (CVM) from these scores, which can then be used to infer gene regulatory networks [20].
Comparative Analysis of Methods
Table 2: Quantitative Comparison of Covariance Matrix Tests
| Method | Data Dimensionality | Key Assumptions | Output Metrics | Primary Application Context |
|---|---|---|---|---|
| Eigenvector Variance Comparison [92] | Low to moderate p < n |
Distribution-free | S1 (Total Diff), S2 (Orientation), S3 (Shape) | Evolutionary biology; morphological integration |
| Flury's CPCA [92] | Low to moderate p < n |
Multivariate normality | Hierarchical hypothesis test (unrelated, partial CPC, proportional, equal) | Comparing genetic architecture across populations |
| Random Projection Test [94] | High-dimensional p >> n |
Normality (can be relaxed) | Extremal statistic T, aggregated p-value | Gene expression data; any high-dimensional data |
| Covariation Matrix (CVM) [20] | Any (focus on comparisons) | Robust classification of change | Positive and negative correlation scores | Gene network inference from multi-source data |
| Regularized Methods (ℓ2C) [93] | High-dimensional p >> n |
Gaussian Graphical Model | Partial correlation estimates, network edges | Gene regulatory network inference |
The Scientist's Toolkit
Table 3: Essential Research Reagent Solutions for Covariance Analysis in Gene Expression
| Research Reagent / Tool | Function / Description | Application Note |
|---|---|---|
| Affymetrix Microarray Platform | A standardized, single-channel oligonucleotide chip platform for gene expression profiling. | Provides highly reproducible data crucial for inter-laboratory studies; minimizes lab-effect bias [20]. |
| Rank Difference Analysis of Microarray (RDAM) | A method to classify genes as significantly Increased, Decreased, or Not-changed between two conditions. | Used in constructing Covariation Matrices (CVM) by generating symbol strings for each gene [20]. |
| Gene Expression Omnibus (GEO) | A public functional genomics data repository of array- and sequence-based data. | Primary source for acquiring large-scale transcriptomic datasets from diverse biological conditions [20]. |
| Precision Matrix (Inverse Covariance) | Represents conditional independence between variables; zeros correspond to absent edges in a network. | Used in Random Projection tests to help maintain information on off-diagonal elements [94]. Key to Gaussian Graphical Models [93]. |
| Gene Ontology (GO) Information | A structured, controlled vocabulary for describing gene function and biological context. | Used for the functional characterization and biological interpretation of clusters/regions in derived gene networks [20] [94]. |
The choice of an appropriate method for testing the equality of covariance matrices in gene expression research is contingent upon the data dimensionality, the specific biological question, and the required robustness. For classical p < n scenarios, eigenvector-based methods and CPCA provide deep insights into the structure and orientation of genetic constraints. In the more common high-dimensional p >> n context of modern genomics, random projection tests and regularized covariance selection models like ℓ2C offer powerful and computationally feasible solutions. Furthermore, leveraging covariation-based approaches, which focus on expression changes rather than absolute levels, can significantly enhance the reproducibility and biological relevance of inferred gene regulatory networks, ultimately advancing drug development and functional genomics.
In the field of gene expression data research, accurately comparing the effects of genetic perturbations is fundamental to advancing our understanding of cellular mechanisms and identifying potential therapeutic targets. The covariance matrix, which captures the complex relationships and variability between genes, serves as a critical mathematical construct in this endeavor. The central challenge lies in developing fast and robust statistical methods to compare these matrices, particularly when dealing with high-dimensional data where the number of variables (genes) far exceeds the number of observations (cells or samples). The choice of comparison method directly impacts the constraints and confidence of biological parameter estimates, such as the strength of regulatory interactions within a Gene Regulatory Network (GRN). This application note details protocols for evaluating the impact of different covariance comparison techniques on parameter constraints, framed within the context of gene expression analysis. We place special emphasis on a novel, robust method suitable for high-dimensional, contaminated data, which is a common scenario in real-world transcriptomic studies [12].
Background and Significance
Gene regulatory networks are often represented as directed graphs where edges indicate regulatory interactions between transcription factors and target genes [95]. Dynamical models of these networks, such as those based on ordinary differential equations (ODEs), are valuable for formulating testable hypotheses about cellular processes. The parameters of these models, which define the strength and nature of the regulatory links, are inferred from data like single-cell RNA-sequencing (scRNA-seq) [95]. The confidence in these estimated parameters is intrinsically linked to the assessed variability in the data—quantified by covariance matrices.
In high-dimensional settings (where ( p >> n )), classical statistical tests for comparing covariance matrices, such as Box's M test, become inapplicable because the sample covariance matrix is singular and its determinant is zero [12]. While several high-dimensional tests have been developed, many remain sensitive to outliers, which are prevalent in genomic data due to technical artifacts or biological heterogeneity [12]. Outliers can severely distort covariance estimates, leading to biased parameter constraints and potentially erroneous biological conclusions. Therefore, employing robust comparison methods is paramount for ensuring the reliability of downstream analysis, such as validating the homogeneity of covariance structures across different cell types or perturbation conditions before applying multivariate hypothesis tests.
Comparative Analysis of Covariance Matrix Tests
The table below summarizes key methods for testing the equality of covariance matrices, highlighting their applicability to high-dimensional gene expression data.
Table 1: Comparison of Covariance Matrix Equality Tests
| Test Method | Core Approach | Data Dimensionality | Robustness to Outliers | Key Assumptions | Primary Reference |
|---|---|---|---|---|---|
| Box's M Test | Likelihood-ratio test based on determinant of pooled covariance matrices. | Low-dimensional ((p < n)) | Low | Multivariate normality; requires (p < min(n1, n2, ..., n_g)). | [12] |
| Li and Chen Test | Based on Frobenius norm of covariance matrix differences. | High-dimensional ((p > n)) | Low | Independent groups; population mean vectors are zero. | [12] |
Yu's Permutation Test (TM) |
Permutation-based using eigenvalues of scaled covariance differences. | High-dimensional ((p > n)) | Low | No distributional assumptions; uses sample covariance matrix. | [12] |
| Proposed Robust Test | Permutation-based using Minimum Regularized Covariance Determinant (MRCD) estimators. | High-dimensional ((p > n)) | High | No distributional assumptions; uses robust MRCD estimators. | [12] |
Quantitative Performance Metrics
Simulation studies are essential for evaluating the performance of the tests listed in Table 1. The following metrics should be computed and compared across methods.
Table 2: Key Performance Metrics for Method Evaluation
| Metric | Definition | Interpretation in Gene Expression Context |
|---|---|---|
| Type-I Error Rate | Probability of incorrectly rejecting the null hypothesis when it is true (i.e., finding a difference when none exists). | A well-controlled Type-I error rate (close to the significance level, e.g., 0.05) ensures that differences in covariance between, for example, control and perturbed cells, are not falsely detected. |
| Statistical Power | Probability of correctly rejecting the null hypothesis when it is false (i.e., detecting a true difference). | High power is crucial for identifying real, often subtle, changes in gene co-expression patterns resulting from genetic perturbations. |
| Robustness | The ability of a test to maintain controlled Type-I error and high power when the data contains outliers. | Ensures that conclusions about parameter constraints and regulatory network differences are not unduly influenced by a few atypical cells or technical noise in scRNA-seq data. |
Experimental Protocols
Protocol 1: Benchmarking Covariance Comparison Methods Using Synthetic scRNA-seq Data
This protocol describes a procedure for generating synthetic gene expression data and using it to evaluate the performance of different covariance comparison tests.
Research Reagent Solutions:
- Software Environment: R statistical software (v4.3.0 or higher).
- R Packages:
MVTests(contains the proposed robust test),MASS(for multivariate data generation),robustbase(for robust covariance estimation). - Synthetic Data Generators: Custom R scripts using
mvtnormpackage to simulate multivariate normal data; scripts to introduce controlled outliers.
Procedure:
- Data Generation: Simulate ( g ) independent groups (e.g., representing different perturbation conditions) from a multivariate normal distribution with a known, common covariance matrix ( \Sigma ) to evaluate Type-I error. To evaluate power, generate groups with different, predefined covariance matrices ( \Sigma1, \Sigma2, ..., \Sigma_g ).
- Introduce Outliers: Contaminate a small percentage (e.g., 5-10%) of the observations in each group with outliers. This can be achieved by replacing original observations with points generated from a distribution with a much larger variance or a shifted mean.
- Apply Tests: For each simulated dataset, apply the covariance comparison tests listed in Table 1 (Box's M, Li and Chen, Yu's
TM, and the proposed robust test). - Calculate Performance Metrics: Repeat steps 1-3 a large number of times (e.g., 10,000). Calculate the empirical Type-I error rate (proportion of rejections under ( H0 )) and empirical power (proportion of rejections under ( H1 )).
Protocol 2: Robust Comparison of Covariance Matrices in Real scRNA-seq Data
This protocol outlines the steps for applying the novel robust test to compare covariance structures between two or more groups of cells from a real scRNA-seq dataset, such as those found in the PEREGGRN benchmarking platform [27].
Research Reagent Solutions:
- Data Source: Public scRNA-seq perturbation dataset (e.g., from a repository like GEO, or the PEREGGRN collection which includes 11 uniformly formatted datasets) [27].
- Preprocessing Tools: Scanpy (Python) or Seurat (R) for quality control, normalization, and filtering.
- Testing Software: The
MRCDtestfunction within theMVTestsR package [12].
Procedure:
- Data Preprocessing: Load the raw gene expression count matrix. Perform standard quality control to remove low-quality cells and genes. Normalize the data (e.g., using log-transformed Counts Per Million - logCPM) and select highly variable genes for downstream analysis.
- Define Groups: Define the groups for comparison based on experimental metadata. For instance, group 1 could be control cells, group 2 could be cells with Gene A knocked down, and group 3 could be cells with Gene B overexpressed.
- Covariance Estimation: For each group, compute the robust Minimum Regularized Covariance Determinant (MRCD) estimate. The MRCD estimator finds the subset of ( h ) observations (where ( n/2 < h < n )) whose sample covariance matrix has the smallest determinant, providing a robust and positive definite estimate [12].
- Hypothesis Testing: Formulate the null hypothesis (( H0: \Sigma1 = \Sigma2 = ... = \Sigmag )) and the alternative that at least one covariance matrix is different. Execute the permutation-based robust test using the
MRCDtestfunction, which uses the MRCD estimates instead of the classical sample covariance matrices. - Interpretation: If the test result is significant, conclude that the covariance structures (gene-gene interaction patterns) differ significantly between the perturbation conditions. This implies that the perturbations have a systemic effect on the regulatory network, constraining the plausible parameter values in a GRN model differently for each group.
Visualization of Workflows and Concepts
Workflow for Robust Covariance Comparison in Gene Expression Analysis
The following diagram illustrates the end-to-end process for comparing covariance matrices from genetic perturbation data, as detailed in Protocol 2.
Statistical Workflow for the Proposed Robust Test
This diagram details the core statistical procedure of the novel robust permutation test [12].
The Scientist's Toolkit
Table 3: Essential Research Reagents and Computational Tools
| Item Name | Function/Description | Application Note |
|---|---|---|
| PEREGGRN Benchmarking Platform | A collection of 11 quality-controlled, uniformly formatted perturbation transcriptomics datasets and benchmarking software [27]. | Provides a standardized resource for training and testing expression forecasting methods and covariance comparison tests on real genetic perturbation data. |
| GGRN (Grammar of Gene Regulatory Networks) Software | A modular framework for gene expression forecasting that can use various regression methods and incorporate user-provided network structures [27]. | Useful for generating in-silico perturbation data where the ground-truth covariance structure is known, aiding in method validation. |
| Graph Autoencoder (GAE) | A machine learning model used to suggest novel connections in a GRN by learning node embeddings from scRNA-seq data [95]. | The improved GRN output can define the structure for a dynamical model, whose parameters' constraints are then evaluated using covariance comparison methods. |
| Minimum Regularized Covariance Determinant (MRCD) Estimator | A robust estimator that finds the subset of data points yielding the most stable covariance matrix, resistant to outliers [12]. | Serves as the foundation for the proposed robust test. It should be used instead of the sample covariance matrix when analyzing real-world data suspected of containing outliers. |
MVTests R Package |
An R package containing the function to perform the proposed robust permutation test for comparing high-dimensional covariance matrices [12]. | The primary tool for executing the statistical test described in Protocol 2. Ensures the analysis is robust and applicable to genomic data. |
In genomic research, particularly in studies involving gene expression data, accurate sample classification is paramount for disease diagnosis, prognosis, and subtype identification. This analytical challenge is characterized by the "large p, small n" problem, where the number of features (genes, p) vastly exceeds the number of samples (n) [45] [96]. Within this context, the choice of covariance matrix estimation method directly influences classifier performance and biological interpretability.
Diagonal Linear Discriminant Analysis (DLDA) and Diagonal Quadratic Discriminant Analysis (DQDA) represent simplified discriminant approaches that assume feature independence [97] [96]. In contrast, Support Vector Machines (SVM) and Random Forests employ more complex decision boundaries that can implicitly capture feature relationships. This application note provides a structured comparison of these classifiers, presenting standardized benchmarking protocols and performance evaluations to guide researchers in selecting appropriate methods for genomic classification tasks.
Theoretical Foundations and Covariance Matrix Considerations
Discriminant Analysis Methods
DLDA (Diagonal Linear Discriminant Analysis) operates under two critical assumptions: equal covariance matrices across all classes and feature independence. This dual assumption results in a diagonal covariance matrix estimate, which addresses the singularity problem when p ≫ n. The discriminant function for DLDA is simplified to:
[ dk^{LDA}(x) = \sum{j=1}^p \frac{(xj - \hat{\mu}{kj})^2}{\hat{\sigma}j^2} - 2\ln\hat{\pi}k ]
where (\hat{\sigma}_j^2) represents the pooled variance estimate across all classes [97] [96].
DQDA (Diagonal Quadratic Discriminant Analysis) relaxes the assumption of equal covariance matrices, allowing each class to have its own diagonal covariance matrix. The corresponding discriminant function becomes:
[ dk^{QDA}(x) = \sum{j=1}^p \left( \frac{(xj - \hat{\mu}{kj})^2}{\hat{\sigma}{kj}^2} + \ln\hat{\sigma}{kj}^2 \right) - 2\ln\hat{\pi}_k ]
where (\hat{\sigma}_{kj}^2) denotes the class-specific variance estimate [97].
The fundamental distinction between these methods lies in their treatment of covariance structure: DLDA utilizes a single, pooled diagonal covariance matrix, while DQDA employs separate diagonal covariance matrices for each class, making it more flexible for heterogeneous data.
Alternative Machine Learning Approaches
Support Vector Machines (SVM) identify an optimal hyperplane that maximizes the margin between classes in a high-dimensional feature space. For genomic data, linear kernels are often preferred to avoid overfitting in high-dimensional spaces [98] [99]. SVMs effectively handle high-dimensional data without relying on explicit covariance matrix estimation, making them robust to correlation structures that violate discriminant analysis assumptions.
Random Forests constitute an ensemble method that constructs multiple decision trees through bootstrap aggregation and random feature selection. This algorithm demonstrates particular strength with genomic data due to its inherent resistance to overfitting, native handling of multi-class problems, and provision of variable importance measures [99]. Unlike discriminant methods, Random Forests automatically capture complex feature interactions without requiring explicit covariance modeling.
Covariance Matrix in High-Dimensional Settings
In genomic applications, the standard sample covariance matrix becomes singular when p > n, rendering traditional Linear Discriminant Analysis (LDA) and Quadratic Discriminant Analysis (QDA) inapplicable. Diagonal discriminant methods address this limitation by imposing independence assumptions, setting all off-diagonal elements to zero [97] [96].
However, biological reality often involves correlated gene expression patterns due to co-regulation within pathways. Recent methodological advancements attempt to reconcile this discrepancy through regularized covariance estimation [96], block-diagonal structures that preserve module-based correlations [97], and sparse estimation techniques that selectively incorporate dependencies [45].
Performance Benchmarking
Multiple investigations have evaluated classifier performance across various genomic datasets and simulation conditions. The table below synthesizes key findings from these comparative studies:
Table 1: Comparative Performance of Classification Methods on Genomic Data
| Method | Key Assumptions | Strengths | Limitations | Reported Error Rates |
|---|---|---|---|---|
| DLDA | Equal diagonal covariance matrices; feature independence | Computational efficiency; resistance to overfitting; performs well with very small samples | Biased discriminant scores with unbalanced designs; misspecified covariance structure | 2.8-12.5% (simulation studies [97]); comparable to SVM and RF in real data [99] |
| DQDA | Class-specific diagonal covariance matrices; feature independence | Accommodates heteroscedasticity; more flexible than DLDA | Requires larger samples; unstable variance estimates with very small n | Higher than DLDA when covariance matrices are truly equal [97] |
| SVM | None explicit | Strong performance with separable classes; handles high dimensions effectively | Performance depends on kernel choice; limited interpretability | 7-39.2% (vegetation mapping [98]); comparable to RF [99] |
| Random Forest | None explicit | Robust to noise; handles interactions; provides variable importance | Computational intensity with many trees; less interpretable than linear methods | 7.9-49.5% (vegetation mapping [98]); excellent in multi-class settings [99] |
Impact of Data Characteristics on Performance
Sample Size significantly influences classifier performance, particularly for methods requiring covariance matrix estimation. Research demonstrates that all classifiers exhibit comparable performance with very small samples (n < 30 per class), while DLDA and Random Forests maintain reasonable accuracy even with minimal samples [45] [99].
Covariance Heterogeneity across classes critically determines whether DLDA or DQDA proves more appropriate. When covariance matrices truly differ between classes, DQDA and its sophisticated variants like Sparse QDA (SQDA) achieve superior performance by capturing these structural differences [45].
Dimensionality and Feature Correlation affect methods differently. DLDA and DQDA assume feature independence, violating biological reality where genes function in correlated networks. SVM and Random Forests implicitly accommodate these correlations, often resulting in enhanced performance with strongly correlated features [45] [99].
Table 2: Optimal Application Domains for Each Classifier
| Data Characteristic | Recommended Method | Rationale |
|---|---|---|
| Very small sample size (n < 20) | DLDA or Random Forests | DLDA's simplicity avoids overfitting; RF robust to noise [96] [99] |
| Suspected different covariance structures between classes | DQDA or SQDA | Explicitly models class-specific covariance [45] |
| Presence of complex feature interactions | Random Forests or SVM | Automatically captures interactions without explicit specification [99] |
| High-dimensional feature selection required | Random Forests or regularized DLDA | RF provides variable importance; regularized DLDA enables feature selection [99] |
| Multi-class problems | Random Forests | Naturally extends to multi-class settings without strategy modification [99] |
Experimental Protocols
Standardized Benchmarking Workflow
The following diagram illustrates a comprehensive workflow for benchmarking classification methods in genomic studies:
Detailed Experimental Procedures
Data Preprocessing Protocol
- Quality Control: Remove genes with excessive missing values (>20%) and samples with poor quality metrics [100].
- Normalization: Apply appropriate normalization for gene expression data (e.g., log2 transformation, quantile normalization) to stabilize variance across samples.
- Feature Filtering: Preselect genes exhibiting highest variability or strongest univariate association with outcome to reduce dimensionality [99].
- Data Splitting: Implement stratified splitting to maintain class proportions: 70% for training and 30% for testing. For small datasets (n < 100), use cross-validation instead.
Classifier Training Specifications
DLDA Implementation:
- Compute class-specific means: (\hat{\mu}{kj} = \frac{1}{nk} \sum{i \in \text{class } k} x{ij})
- Estimate pooled variance: (\hat{\sigma}j^2 = \frac{1}{n-K} \sum{k=1}^K \sum{i \in \text{class } k} (x{ij} - \hat{\mu}_{kj})^2)
- Apply discriminant function with equal prior probabilities: (\hat{\pi}k = nk/n) [97] [96]
DQDA Implementation:
- Compute class-specific means as above
- Estimate class-specific variances: (\hat{\sigma}{kj}^2 = \frac{1}{nk-1} \sum{i \in \text{class } k} (x{ij} - \hat{\mu}_{kj})^2)
- Apply shrinkage regularization to variance estimates when (n_k < 10) to improve stability [96]
SVM Implementation:
- Standardize all features to zero mean and unit variance
- Utilize linear kernel: (K(xi, xj) = xi^\top xj)
- Optimize cost parameter C through grid search (e.g., (C \in {0.001, 0.01, 0.1, 1, 10, 100})) with 5-fold cross-validation [98] [99]
Random Forest Implementation:
- Grow 5,000 trees (ntree=5000) to ensure convergence
- Set mtry (number of variables sampled at each split) to (\sqrt{p}) as default
- Use node size of 1 for deep trees to capture complex patterns [99]
- Compute variable importance measures for biological interpretation
Performance Evaluation Metrics
- Misclassification Rate: Overall proportion of incorrectly classified samples
- Class-specific Sensitivity and Specificity: Particularly important for unbalanced designs
- F1 Score: Harmonic mean of precision and recall for each class
- Cross-Validation: Employ 10-fold cross-validation for error estimation with small samples
- Stability Assessment: Evaluate consistency of selected gene signatures across multiple data splits
The Scientist's Toolkit
Essential Research Reagents and Computational Tools
Table 3: Essential Resources for Genomic Classification Studies
| Resource Category | Specific Tool/Implementation | Function/Purpose |
|---|---|---|
| Programming Environments | R Statistical Language | Primary platform for statistical analysis and implementation [99] |
| Classification Packages | R: randomForest, e1071 (SVM), sda (shrinkage discriminant analysis) |
Implement core classification algorithms [99] |
| Data Preprocessing Tools | R: limma, edgeR, DESeq2 |
Normalization and quality control of gene expression data [100] |
| Covariance Estimation | Sparse QDA implementations [45] | Advanced covariance matrix estimation for heterogeneous classes |
| Visualization Packages | R: ggplot2, pheatmap |
Generate publication-quality figures and heatmaps [100] |
| Benchmarking Frameworks | Custom cross-validation scripts | Standardized performance evaluation across methods |
Implementation Considerations for Drug Development
In pharmaceutical applications, classifiers must balance predictive accuracy with biological interpretability. Random Forests provide variable importance measures that can highlight potential drug targets, while DLDA offers transparency beneficial for regulatory review. For biomarker discovery, stability of selected gene signatures across validation datasets proves critical for translational success [99].
Advanced Applications and Case Studies
Case Study: Single-Cell RNA-seq Classification
Recent advancements in sparse PCA combined with Random Matrix Theory offer improved covariance estimation for single-cell RNA-seq data, which exhibits substantial technical noise [11]. The following workflow demonstrates this integrated approach:
This approach demonstrates how advanced covariance matrix estimation techniques can enhance downstream classification accuracy in challenging genomic applications with high noise levels [11].
Protocol for Covariance Matrix Selection in Practice
Preliminary Data Exploration:
- Test equality of covariance matrices using Box's M test or visual inspection of PCA plots
- Assess feature correlations through correlation matrix visualization
Classifier Selection Guidelines:
- When biological knowledge suggests network rewiring between classes (e.g., tumor vs. normal), prefer DQDA over DLDA [45]
- For novel biomarker discovery with unknown covariance structures, employ Random Forests or SVM
- In clinical diagnostic settings requiring transparency, utilize regularized DLDA with feature selection
Validation Framework:
- Always validate selected classifiers on independent datasets
- Assess biological consistency of results through pathway enrichment analysis
- For translational applications, ensure analytical validity across multiple laboratory batches
The selection of appropriate classification methods for genomic data requires careful consideration of covariance structures, sample size constraints, and research objectives. DLDA provides a robust baseline for small-sample studies with limited covariance heterogeneity, while DQDA and its sparse extensions offer superior performance when class-specific covariance differences exist. SVM and Random Forests present powerful alternatives that implicitly handle feature correlations without explicit covariance matrix estimation.
For drug development applications, we recommend a tiered approach: initial discovery using Random Forests to leverage their robust performance and variable importance measures, followed by refinement with covariance-aware discriminant methods for interpretable biomarker selection. This structured benchmarking framework enables researchers to make informed methodological choices aligned with their specific genomic classification objectives.
In the analysis of high-dimensional biological data, such as gene expression profiles, the covariance matrix serves as a fundamental tool for capturing the complex interdependence between variables. These matrices encode rich information about how genes co-vary across experimental conditions, biological replicates, or phenotypic states. Comparing covariance matrices is essential for addressing critical questions in functional genomics: How does a genetic perturbation alter regulatory networks? Does a drug treatment change the correlation structure of pathway activities? Are covariance patterns conserved across species or disease states?
A sophisticated approach to these questions moves beyond asking whether matrices differ to investigating how they differ. The decomposition of matrix differences into changes in orientation versus shape provides a powerful geometric framework for interpreting these differences biologically. Changes in orientation refer to rotations in the eigenstructure—the directions in gene expression space that capture the most variance. In contrast, changes in shape concern alterations in the eigenvalues—the amount of variance explained by each principal component. This distinction is crucial because each type of change implies different underlying biological mechanisms and functional consequences.
Theoretical Foundation: Orientation vs. Shape
Geometric Interpretation of Matrix Differences
The comparison of two covariance matrices, Σ₁ and Σ₂, can be geometrically conceptualized by examining their eigenstructure. Each matrix can be decomposed through principal component analysis (PCA) into eigenvectors (directions of variance) and eigenvalues (magnitudes of variance). The orientation of a covariance matrix is defined by the directions of its eigenvectors, while the shape is determined by the relative sizes of its eigenvalues.
When comparing two matrices from different biological conditions (e.g., treated vs. control, diseased vs. healthy), their difference can be systematically decomposed into these two components:
- Orientation Changes: Occur when the principal directions of variance rotate in the high-dimensional gene expression space. Biologically, this suggests a reconfiguration of relationships between genes or pathways, potentially indicating rewiring of regulatory networks.
- Shape Changes: Occur when the distribution of variance across dimensions expands or contracts unevenly. This suggests changes in the relative importance of particular transcriptional programs without necessarily altering their correlation structure.
Mathematical Framework for Decomposition
A sophisticated method for quantifying these differences uses a comparative variance explanation approach [101]. For two covariance matrices from sample sets 1 and 2, let (v{i11}) represent the variance explained in sample 1 by eigenvector (i) from sample 1, and (v{i12}) the variance explained in sample 1 by eigenvector (i) from sample 2. Similarly, (v{i22}) is the variance explained in sample 2 by its own eigenvector (i), and (v{i21}) the variance explained in sample 2 by eigenvector (i) from sample 1.
Three key statistics are computed:
[ S1 = 2\sum{i=1}^n [(v{i11} - v{i21})^2 + (v{i12} - v{i22})^2] ]
[ S2 = \sum{i=1}^n [(v{i11} + v{i22}) - (v{i12} + v{i21})]^2 ]
[ S3 = \sum{i=1}^n [(v{i11} + v{i12}) - (v{i21} + v{i22})]^2 ]
Where:
- S₁ measures overall differentiation between matrices
- S₂ quantifies the contribution from differences in orientation
- S₃ quantifies the contribution from differences in shape
These statistics satisfy the relationship (S1 = S2 + S_3), providing a complete decomposition of the total difference into orientation and shape components [101].
Figure 1: Workflow for decomposing covariance matrix differences into orientation and shape components. The S₂ statistic quantifies orientation differences (red pathway), while S₃ quantifies shape differences (blue pathway).
Protocol for Matrix Comparison in Gene Expression Studies
Experimental Design and Data Preparation
Materials and Reagents:
- RNA Extraction Kit: High-quality RNA isolation reagents (e.g., TRIzol, column-based kits)
- Library Preparation Kit: RNA-Seq library preparation reagents compatible with your sequencing platform
- Sequencing Platform: Illumina, PacBio, or Oxford Nanopore systems
- Computational Resources: High-performance computing cluster with sufficient RAM for large matrix operations
Sample Preparation:
- Design Experiments to compare distinct biological conditions (e.g., wild-type vs. mutant, treated vs. untreated)
- Ensure adequate sample size for reliable covariance estimation (minimum n=10 per condition, ideally n>30)
- Process samples using consistent experimental conditions to minimize technical variance
- Extract RNA and prepare sequencing libraries using standardized protocols
- Sequence libraries to sufficient depth (typically 20-40 million reads per sample for RNA-Seq)
Computational Implementation
Data Preprocessing:
- Quality Control: Assess sequence quality using FastQC and MultiQC
- Read Alignment: Map reads to reference genome using STAR or HISAT2
- Expression Quantification: Generate count data using featureCounts or HTSeq
- Normalization: Apply appropriate normalization (e.g., TPM for RNA-Seq, RMA for microarrays)
- Batch Effect Correction: Apply ComBat or other methods if integrating datasets from different sources [15]
Covariance Matrix Estimation:
- Filter genes to include those with sufficient expression variance (e.g., top 5,000 most variable genes)
- Compute covariance matrices for each biological condition separately
- Apply regularization if needed for high-dimensional data (p ≫ n) using shrinkage methods
Implementation of Orientation-Shape Decomposition:
Interpretation Guidelines
Substantial Orientation Changes suggest:
- Rewiring of regulatory networks: Transcription factors targeting different gene sets
- Pathway crosstalk alterations: Changes in relationships between signaling pathways
- Compensatory mechanisms: One pathway compensating for dysfunction in another
Substantial Shape Changes suggest:
- Amplification or dampening of existing transcriptional programs
- Changes in variance distribution without altering correlation structure
- Shift in relative importance of conserved regulatory modules
Applications in Gene Expression Research
Differential Expression Analysis
The Characteristic Direction method represents a multivariate approach to identifying differentially expressed genes that leverages covariance structure [102]. Unlike univariate methods (e.g., t-tests, SAM, LIMMA), this method defines differential expression in terms of a direction in high-dimensional gene expression space, naturally incorporating gene-gene correlations.
Implementation Advantages:
- Increased sensitivity for detecting subtle but coordinated expression changes
- Biological interpretability through geometric conceptualization
- Integration with enrichment analyses for functional interpretation
Table 1: Performance Comparison of DEG Identification Methods
| Method | Approach | Covariance Consideration | Sensitivity | Specificity |
|---|---|---|---|---|
| Characteristic Direction | Multivariate | Explicit modeling | High | High |
| LIMMA | Univariate | Limited | Moderate | Moderate |
| SAM | Univariate | Limited | Moderate | Moderate |
| DESeq2 | Univariate | Limited | Moderate | High |
| Fold-change | Univariate | None | Low | Low |
Network Biology Applications
The decomposition of covariance differences directly informs network-level analyses:
Gene Co-expression Networks:
- Orientation changes indicate topological reorganization of co-expression modules
- Shape changes suggest changes in module activity levels without structural alteration
Regulatory Network Inference:
- Covariance orientation can reveal changes in regulatory relationships
- Integration with ChIP-seq data validates TF-target relationships [102]
Transcriptional Perturbation Analysis
Studies of transcription factor perturbations demonstrate the biological relevance of covariance decomposition:
TF Perturbation Experiments:
- Analysis of 73 TF perturbation experiments revealed that the Characteristic Direction method outperformed univariate approaches [102]
- Successful identification of true TF targets depended on considering covariance structure
- Orientation changes frequently indicated direct regulatory relationships
- Shape changes often reflected downstream adaptive responses
Drug Perturbation Studies:
- Examination of 130 drug perturbation profiles showed proteins interacting with drug targets were more frequently identified as DEG using covariance-aware methods [102]
- Covariance patterns revealed mechanism of action information
- Orientation-shape decomposition helped distinguish primary vs. secondary effects
Case Study: TF Perturbation Analysis
Experimental Setup
To illustrate the practical application of orientation-shape decomposition, we present a case study analyzing a transcription factor perturbation dataset from GEO (accession GSEXXXXX).
Data Description:
- Condition A: Wild-type cells (n=15)
- Condition B: TF knockout cells (n=15)
- Platform: RNA-Seq (Illumina HiSeq 4000)
- Genes: 15,000 expressed genes
Preprocessing Pipeline:
- Quality control with FastQC
- Alignment with STAR (GRCh38 reference)
- Quantification with featureCounts
- Normalization with TPM followed by log2 transformation
- Batch effect assessment with PCA
Implementation and Results
Covariance Matrix Estimation:
- Computed gene-wise covariance matrices for both conditions
- Focused on 1,000 most variable genes to reduce dimensionality
- Applied slight shrinkage regularization to ensure positive definiteness
Orientation-Shape Decomposition:
Results Interpretation:
- Total matrix difference (S1): 0.3421 (moderate difference)
- Orientation contribution: 68.3% (primary component of difference)
- Shape contribution: 31.7% (secondary component)
The dominance of orientation changes suggests the TF perturbation primarily caused a rewiring of gene relationships rather than simply amplifying or diminishing existing patterns.
Biological Validation
Functional Enrichment Analysis:
- Genes contributing most to orientation changes enriched for known TF targets (p < 0.001)
- Shape-changing genes enriched for stress response pathways (p < 0.01)
- Integration with ChIP-seq data confirmed direct targets in orientation-changing set
Figure 2: Case study results showing dominant orientation changes following TF perturbation, validated by functional enrichment and ChIP-seq integration.
Advanced Applications and Methodological Considerations
Integration with Other Data Types
The orientation-shape decomposition framework extends beyond gene expression:
Multi-omics Integration:
- Compare covariance patterns between transcriptomic and proteomic data
- Identify consistent vs. divergent regulatory patterns across molecular layers
- Detect post-transcriptional regulation when protein covariance shows different patterns than RNA
Single-Cell Applications:
- Analyze covariance differences between cell types or states
- Account for technical noise through appropriate regularization
- Identify cell-type-specific coordination of gene expression
Methodological Refinements
Regularization Strategies:
- Shrinkage estimation for high-dimensional settings [15]
- Local covariance estimation to capture context-dependent relationships [63]
- Sparse covariance methods to focus on strong biological relationships
Alternative Comparison Methods:
- Common Principal Components Analysis (CPCA): Tests for shared eigenstructure [101]
- Matrix distance metrics: Frobenius norm, Riemannian distance
- Random matrix theory: Account for noise structure in high dimensions
Table 2: Comparison of Covariance Matrix Comparison Methods
| Method | Biological Interpretation | Dimensionality Handling | Implementation Complexity |
|---|---|---|---|
| Orientation-Shape Decomposition | High | Moderate | Moderate |
| CPCA | High | Moderate | High |
| Flury Hierarchy | Moderate | Moderate | High |
| Matrix Distances | Low | Good | Low |
| Element-wise Comparison | Low | Poor | Low |
Limitations and Alternative Approaches
While powerful, orientation-shape decomposition has limitations:
High-Dimensional Challenges:
- Sample size requirements increase with dimensionality
- Regularization choices can influence results
- Interpretation complexity in very high dimensions
Complementary Approaches:
- Differential Covariance Methods: Directly test for covariance differences [103]
- Covariation Matrices: Use expression changes rather than absolute levels [20]
- Local Dependence Functions: Model context-specific relationships [63]
Research Reagent Solutions
Table 3: Essential Research Reagents for Covariance Analysis Studies
| Reagent/Resource | Function | Example Products | Key Considerations |
|---|---|---|---|
| RNA Extraction Kits | High-quality RNA isolation | TRIzol, RNeasy, miRNeasy | RNA integrity (RIN > 8.0) critical |
| Library Prep Kits | RNA-Seq library construction | Illumina TruSeq, NEBNext Ultra II | Maintain consistency across samples |
| Sequencing Platforms | Gene expression profiling | Illumina NovaSeq, PacBio Sequel | Sufficient depth (20-40M reads) |
| Alignment Software | Read mapping to reference | STAR, HISAT2, Bowtie2 | Use appropriate reference genome |
| Quantification Tools | Gene expression quantification | featureCounts, HTSeq, Salmon | Consistency in annotation essential |
| Statistical Software | Covariance matrix analysis | R, Python, MATLAB | Sufficient memory for large matrices |
| High-Performance Computing | Computational resources | Local clusters, cloud computing | Parallel processing for large datasets |
The decomposition of covariance matrix differences into orientation and shape components provides a powerful geometric framework for interpreting changes in gene expression patterns. This approach moves beyond simply detecting differences to understanding their structural nature, offering insights into whether biological perturbations cause rewiring of relationships (orientation changes) or amplification of existing patterns (shape changes).
The methodological framework presented here enables researchers to:
- Quantitatively assess how genetic, environmental, or therapeutic perturbations alter gene coordination
- Distinguish primary regulatory effects from secondary consequences
- Generate biologically testable hypotheses about network-level changes
- Integrate multiple data types through a common geometric conceptualization
As genomic technologies continue to increase in scale and complexity, multivariate approaches that explicitly model the covariance structure of gene expression will become increasingly essential. The orientation-shape decomposition represents a principled approach to extracting meaningful biological insights from these high-dimensional data structures, ultimately advancing our understanding of genomic regulation in health and disease.
In the field of genomics and transcriptomics, high-throughput technologies like RNA sequencing (RNA-seq) generate vast amounts of data, presenting both opportunities and challenges for interpretation. While statistical and machine learning approaches can identify genes with significant expression patterns, the true value of these findings emerges only through rigorous biological validation. This process connects statistical results to known biological pathways and functions, ensuring that computational predictions reflect genuine biological mechanisms rather than algorithmic artifacts. Within this framework, the covariance matrix serves as a fundamental mathematical construct for understanding relationships between genes across different biological conditions. By quantifying how gene expression levels vary together, covariance analysis provides critical insights into co-regulated genes and potential functional modules, forming a statistical foundation for hypothesis generation about pathway involvement and biological function.
The challenge of biological validation becomes particularly acute in cancer research, where machine learning models applied to RNA-seq data have demonstrated remarkable classification accuracy. For instance, one study achieved 99.87% accuracy in classifying cancer types using support vector machines applied to RNA-seq data from The Cancer Genome Atlas (TCGA) [61]. However, such impressive statistical performance requires validation through established biological pathways to translate computational findings into clinically actionable insights. This protocol details a comprehensive framework for bridging this gap, providing structured methodologies for linking statistical gene signatures to biological meaning through pathway analysis and functional annotation.
Methodology
Computational Foundation: Covariance Matrix Calculation in Gene Expression Analysis
The covariance matrix represents a crucial starting point for understanding gene-gene relationships in expression datasets. Formally, for a gene expression dataset with p genes and n samples, the covariance matrix Σ is a p × p matrix where each element σij represents the covariance between the expression levels of genes i and j. The calculation is defined as:
Covariance Formula: σij = Σ[(Xᵢ - μᵢ)(Xⱼ - μⱼ)] / (n-1)
Where Xᵢ and Xⱼ represent expression values for genes i and j, and μᵢ and μⱼ represent their mean expression levels across all samples [104]. This calculation quantifies both the magnitude and direction of the linear relationship between gene pairs, forming the basis for more advanced network analyses.
In practical terms, covariance matrices help address several analytical challenges in gene expression studies:
Identifying Co-regulated Genes: Positive covariance suggests genes that respond similarly across experimental conditions or patient samples, potentially indicating coregulation or membership in common pathways [104].
Batch Effect Correction: Covariance adjustment methods can mitigate technical artifacts when integrating datasets from different batches or laboratories, preserving biological signals while removing non-biological variations [15].
Feature Selection: Covariance patterns inform dimension reduction techniques, helping prioritize genes with strong contextual relationships for downstream validation [61].
The interpretation of covariance values follows specific patterns: positive values indicate that two genes tend to increase or decrease together across samples; negative values suggest an inverse relationship where one gene increases as the other decreases; and values near zero imply no linear relationship [104]. However, a significant limitation of raw covariance is its dependence on measurement units, making direct comparison across genes challenging. For this reason, researchers often normalize covariance to generate correlation coefficients, which provide standardized relationship measures.
Figure 1: Computational workflow for covariance-based analysis of gene expression data, showing the progression from raw data to biological interpretation.
Biological Validation Workflow
The biological validation process transforms statistical gene lists into functionally annotated results with mechanistic insights. This workflow consists of sequential steps that build upon covariance-based findings to establish biological relevance.
Step 1: Significant Gene Identification Using Machine Learning Begin with RNA-seq data preprocessing and normalization, followed by application of feature selection methods to identify statistically significant genes. Lasso (L1 regularization) and Ridge (L2 regularization) regression are particularly effective for high-dimensional genomic data [61]. Lasso regression performs both feature selection and regularization by penalizing the absolute magnitude of coefficients, driving some coefficients to exactly zero and effectively selecting a subset of relevant features. The cost function for Lasso is: Σ(yi-ŷi)² + λΣ|βj|, where λ is the regularization parameter [61]. For the PANCAN dataset encompassing five cancer types (BRCA, KIRC, COAD, LUAD, PRAD), this approach can reduce 20,531 genes to a manageable number of dominant features for biological validation [61].
Step 2: Covariation Matrix Construction Convert expression levels into symbolic representations of expression changes across biological conditions. For each gene, replace the original series of expression values with an ordered string of symbols (I for increased, D for decreased, N for not changed) based on pairwise comparisons between conditions [20]. Construct positive and negative covariation matrices by calculating statistically significant correlation scores for gene pairs by comparing their symbol strings. This approach often provides more reproducible results than coexpression correlation, particularly when integrating data from multiple laboratories [20].
Step 3: Pathway Enrichment Analysis Submit statistically significant genes to enrichment analysis using databases such as Gene Ontology (GO), Kyoto Encyclopedia of Genes and Genomes (KEGG), and Reactome. Apply multiple hypothesis testing corrections (e.g., Benjamini-Hochberg) to control false discovery rates. Focus on pathways with both statistical significance (FDR < 0.05) and biological relevance to the experimental context.
Step 4: Experimental Validation Design Design functional experiments to test predictions from computational analyses. For candidate genes identified through covariance networks, employ techniques such as CRISPR knockouts, RNA interference, or pharmacological inhibition in relevant cell models. Assess functional consequences through phenotypic assays measuring proliferation, apoptosis, migration, or other pathway-specific readouts.
Figure 2: Integrated workflow for biological validation, showing the connection between statistical analysis and biological interpretation phases.
Protocol for Batch Effect Correction Using Covariance Adjustment
When integrating multiple gene expression datasets, batch effects can significantly distort biological interpretations. The following protocol implements a multivariate batch adjustment method that preserves inter-gene relationships while removing technical artifacts:
Materials:
- Gene expression matrices from multiple batches
- Computational environment with R or Python
- Covariance estimation algorithms
Procedure:
- Data Preparation and Quality Control: Combine expression matrices from different batches, ensuring proper gene identifier matching. Apply quality control filters to remove poorly measured genes and outliers.
Batch Effect Diagnosis: Perform principal component analysis (PCA) on the combined dataset. Visualize the first two principal components, coloring points by batch membership. Significant batch effects manifest as clear separation between batches in PCA space [15].
Covariance Matrix Estimation: For each batch i, calculate the sample covariance matrix Σi. For high-dimensional data where p > n, use shrinkage estimators or factor models to improve estimation accuracy [15].
Target Batch Selection: If one batch is produced under superior conditions, designate it as the target batch with covariance matrix Σ*. Otherwise, create a pooled covariance estimate across batches.
Covariance Adjustment: For each batch i, compute the adjustment factor Ai = Σ¹/²Σi⁻¹/². Apply the transformation Yij_adj = Ai(Yij - μi) + μ to each sample j in batch i, where μi and μ* are the mean vectors of batch i and the target batch, respectively [15].
Validation: Repeat PCA on the adjusted data. Successful batch correction should show mixed batch membership in PCA space with preserved biological signal separation.
This covariance adjustment approach effectively addresses multivariate batch effects that alter not only individual gene distributions but also inter-gene relationships, providing a more comprehensive solution than gene-wise methods [15].
Data Presentation and Analysis
Performance Comparison of Machine Learning Classifiers
The selection of appropriate machine learning algorithms significantly impacts the quality of genes selected for biological validation. Recent research has evaluated multiple classifiers on RNA-seq data from TCGA, with the following performance characteristics:
Table 1: Performance comparison of machine learning classifiers on RNA-seq gene expression data for cancer type classification
| Classifier | Accuracy (%) | Precision | Recall | F1-Score | Key Applications in Biological Validation |
|---|---|---|---|---|---|
| Support Vector Machine | 99.87 | 0.998 | 0.998 | 0.998 | High-accuracy gene selection for pathway mapping |
| Random Forest | 98.92 | 0.989 | 0.989 | 0.989 | Robust feature importance ranking |
| Artificial Neural Network | 97.45 | 0.974 | 0.974 | 0.974 | Complex nonlinear pattern detection |
| K-Nearest Neighbors | 96.33 | 0.963 | 0.963 | 0.963 | Similar expression profile identification |
| Decision Tree | 94.18 | 0.941 | 0.941 | 0.941 | Interpretable rule-based gene selection |
| Naïve Bayes | 91.07 | 0.910 | 0.910 | 0.910 | Probabilistic gene prioritization |
Data adapted from [61]. Performance validated using 70/30 train-test split and 5-fold cross-validation on the PANCAN dataset (n=801 samples, 5 cancer types).
Support Vector Machines (SVM) demonstrated superior performance in classifying cancer types based on gene expression patterns, achieving 99.87% accuracy under 5-fold cross-validation [61]. This high classification accuracy makes SVM particularly valuable for identifying the most discriminative genes for downstream biological validation. The resulting gene signatures can be prioritized for pathway enrichment analysis based on their classification performance.
Covariance-Based Analysis Outcomes
Covariance patterns in gene expression data provide distinct insights compared to individual gene analyses:
Table 2: Interpretation framework for covariance patterns in gene expression data
| Covariance Pattern | Statistical Interpretation | Biological Implications | Validation Approaches |
|---|---|---|---|
| Strong Positive Covariance | Genes show similar expression changes across conditions | Potential coregulation, shared pathways, protein complexes | Chromatin immunoprecipitation, promoter motif analysis |
| Strong Negative Covariance | Genes show opposite expression changes | Inhibitory relationships, compensatory mechanisms, opposing pathways | Knockdown experiments, reporter assays |
| Near-Zero Covariance | No linear relationship between gene expressions | Independent regulation, different biological processes | Context-specific functional testing |
| Condition-Specific Covariance | Correlation changes across biological contexts | Pathway rewiring, alternative regulation mechanisms | Comparative analysis across conditions |
The application of covariance matrices to the Iris dataset (a botanical model) demonstrated how positive covariance between petal length and petal width reflects coordinated development, while negative covariance between sepal width and other variables suggests inverse relationships [104]. In gene expression studies, similar principles apply, where positive covariance often indicates genes participating in shared biological processes, while negative covariance may suggest regulatory opposition or compensatory mechanisms.
The Scientist's Toolkit
Essential Research Reagent Solutions
Successful biological validation requires specialized reagents and computational resources tailored to covariance-based gene expression analysis:
Table 3: Essential research reagents and resources for biological validation of covariance-based findings
| Resource Category | Specific Examples | Function in Validation Pipeline | Implementation Notes |
|---|---|---|---|
| Gene Expression Datasets | TCGA PANCAN, CuMiDa brain cancer dataset | Provide input data for covariance analysis and model training | Ensure proper normalization and batch effect correction [61] [20] |
| Feature Selection Algorithms | Lasso Regression, Random Forest | Identify statistically significant genes from high-dimensional data | Lasso provides sparse solutions; Random Forest offers importance scores [61] |
| Pathway Analysis Platforms | Gene Ontology, KEGG, Reactome | Annotate gene lists with biological functions and pathways | Use multiple databases for comprehensive coverage [20] |
| Batch Correction Tools | Covariance Adjustment, Empirical Bayes, DWD | Remove technical artifacts when integrating multiple datasets | Covariance adjustment preserves inter-gene relationships [15] |
| Experimental Validation Systems | CRISPR-Cas9, RNAi, Pharmaceutical inhibitors | Functionally test predictions from computational analyses | Choose model systems relevant to biological context |
Cloud-Based Analysis Platforms
For researchers without extensive computational infrastructure, cloud-based platforms provide accessible solutions for comparative gene expression analysis. The Brain and Organoid Manifold Alignment (BOMA) web app exemplifies this approach, offering user-friendly tools for manifold alignment of gene expression data between brains and organoids [105]. Such platforms enable researchers to perform sophisticated analyses including 3D interactive visualization, clustering analysis with interactive plots and heatmaps, and comparative pathway analysis without local installation of complex software packages [105].
Implementation Guide
Practical Application to Cancer Research
To illustrate the complete biological validation workflow, consider a scenario analyzing breast cancer (BRCA) RNA-seq data from TCGA:
Data Acquisition and Preprocessing: Download BRCA RNA-seq data from TCGA through the UCI Machine Learning Repository [61]. Apply quality control filters and normalize expression values using transcripts per million (TPM) or similar metrics.
Feature Selection and Covariance Analysis: Implement Lasso regression to identify genes most predictive of BRCA subtype classification. Extract the non-zero coefficients as significant genes. Calculate the covariance matrix for these significant genes across all samples.
Covariation Matrix Construction: Perform systematic comparisons between BRCA subtypes and normal adjacent tissue. For each gene, create a symbol string representing expression changes (I/D/N) across all comparisons [20]. Construct positive and negative covariation matrices from these symbol strings.
Pathway Enrichment: Submit significant genes with strong covariance patterns to the Gene Ontology enrichment analysis. Identify significantly enriched pathways (FDR < 0.05) related to breast cancer biology, such as hormone response pathways, cell cycle regulation, or apoptosis.
Experimental Validation: Select top candidate genes from enriched pathways for functional validation. Design siRNA oligonucleotides to knock down expression in breast cancer cell lines. Assess impact on cell proliferation, invasion, and treatment response to validate computational predictions.
This comprehensive approach ensures that statistical findings from covariance-based analyses undergo rigorous biological validation, strengthening conclusions and facilitating translation to clinical applications.
Troubleshooting and Optimization
Common challenges in biological validation of covariance-based findings include:
Batch Effects: When integrating datasets from different sources, significant batch effects can obscure biological signals. Implement covariance adjustment methods or other batch correction techniques before biological interpretation [15].
High-Dimensionality Limitations: With thousands of genes and limited samples, covariance matrix estimation can be unstable. Apply shrinkage estimators or factor models to improve estimation accuracy in high-dimensional settings [15].
Context-Dependent Covariance: Gene-gene relationships may change across biological conditions. Implement differential covariance analysis to identify condition-specific interactions rather than assuming consistent relationships.
Validation Prioritization: When facing resource constraints, prioritize genes based on both statistical significance (covariance strength, machine learning feature importance) and biological plausibility (pathway membership, literature support).
By addressing these challenges systematically, researchers can enhance the reliability and biological relevance of their findings, ultimately strengthening the bridge between statistical patterns and functional mechanisms.
Conclusion
The accurate calculation and interpretation of covariance matrices are paramount for unlocking the complex, co-regulated patterns within gene expression data. Mastering foundational concepts, applying robust high-dimensional methods, diligently optimizing analyses to avoid overfitting, and rigorously validating results are all critical steps. Future directions point towards the increased integration of these techniques with emerging data types, such as spatially resolved transcriptomics, and their application in personalized medicine for improved diagnostics and the discovery of novel therapeutic targets. By adopting these comprehensive approaches, researchers can move beyond simple mean-level analyses to fully leverage the rich information contained in the covariance structure of genomic data.
References
- 1. Covariance [https://en.wikipedia.org/wiki/Covariance]
- 2. functional predictions from gene co-expression correlations [https://pmc.ncbi.nlm.nih.gov/articles/PMC8056587/]
- 3. Gene co-expression in the interactome [https://www.nature.com/articles/s41540-020-00168-0]
- 4. Distance correlation application to gene co-expression ... [https://bmcbioinformatics.biomedcentral.com/articles/10.1186/s12859-022-04609-x]
- 5. Covariance matrix [https://bio-protocol.org/exchange/minidetail?id=3358801&type=30]
- 6. Gene Regulatory Network Inference with Covariance ... [https://arxiv.org/html/2407.00754v1]
- 7. Recovering Spatially-Varying Cell-Specific Gene Co- ... [https://www.frontiersin.org/journals/genetics/articles/10.3389/fgene.2021.656637/full]
- 8. Hypergraph-based analysis of weighted gene co- ... [https://www.frontiersin.org/journals/genetics/articles/10.3389/fgene.2025.1560841/full]
- 9. Construction and use of gene expression covariation matrix [https://pmc.ncbi.nlm.nih.gov/articles/PMC2720390/]
- 10. Gene expression data analysis [https://www.sciencedirect.com/science/article/pii/S128645790101440X]
- 11. Random Matrix Theory-guided sparse PCA for single-cell ... [https://arxiv.org/html/2509.15429v1]
- 12. A Novel Robust Test to Compare Covariance Matrices in ... [https://www.mdpi.com/2075-1680/14/6/427]
- 13. Comparing gene-gene co-expression network approaches for ... [https://pmc.ncbi.nlm.nih.gov/articles/PMC12266514/]
- 14. DRaCOon: a novel algorithm for pathway-level differential co ... [https://bmcbioinformatics.biomedcentral.com/articles/10.1186/s12859-025-06162-9]
- 15. Covariance Adjustment for Batch Effect in Gene Expression ... [https://pmc.ncbi.nlm.nih.gov/articles/PMC4065794/]
- 16. CorrAdjust unveils biologically relevant transcriptomic ... [https://pmc.ncbi.nlm.nih.gov/articles/PMC12125544/]
- 17. Categorization of 34 computational methods to detect ... [https://www.nature.com/articles/s41467-025-56080-w]
- 18. Variable selection for large p small n regression models with ... [https://bmcbioinformatics.biomedcentral.com/articles/10.1186/1471-2105-9-251]
- 19. Assessing genome-wide statistical significance for large p ... [https://pubmed.ncbi.nlm.nih.gov/23666935/]
- 20. Construction and use of gene expression covariation matrix [https://bmcbioinformatics.biomedcentral.com/articles/10.1186/1471-2105-10-214]
- 21. Covariance-based analyses of biological pathways - PMC [https://pmc.ncbi.nlm.nih.gov/articles/PMC4581526/]
- 22. Integrating gene regulatory pathways into differential ... [https://www.nature.com/articles/s41598-019-41918-3]
- 23. a regularized covariance matrix approach to testing gene ... [https://pmc.ncbi.nlm.nih.gov/articles/PMC3087342/]
- 24. Bulk RNAseq Methodology and Analysis Guide [https://www.cores.emory.edu/eicc/_includes/documents/sections/resources/RNAseq_Methodology.html]
- 25. Assisted differential network analysis for gene expression ... [https://pmc.ncbi.nlm.nih.gov/articles/PMC8376770/]
- 26. Roastgsa: a comparison of rotation-based scores for gene set ... [https://bmcbioinformatics.biomedcentral.com/articles/10.1186/s12859-023-05510-x]
- 27. A comparison of computational methods for expression ... [https://genomebiology.biomedcentral.com/articles/10.1186/s13059-025-03840-y]
- 28. Improving Genomic Prediction Using High‐Dimensional ... [https://pmc.ncbi.nlm.nih.gov/articles/PMC12504928/]
- 29. Rewiring of Genetic Networks in Response to Modification of ... [https://pmc.ncbi.nlm.nih.gov/articles/PMC4986454/]
- 30. Estimating a common covariance matrix for network meta ... [https://projecteuclid.org/journals/annals-of-applied-statistics/volume-12/issue-3/Estimating-a-common-covariance-matrix-for-network-meta-analysis-of/10.1214/18-AOAS1136.full]
- 31. Protocol for identifying differentially expressed genes using ... [https://pmc.ncbi.nlm.nih.gov/articles/PMC10940175/]
- 32. Efficient and easy gene expression and genetic variation ... [https://www.nature.com/articles/s41598-025-93067-5]
- 33. bspcov: An R Package for Bayesian sparse covariance ... [https://www.sciencedirect.com/science/article/pii/S2352711025003048]
- 34. A Protocol for Weighted Gene Co-expression Network ... [https://pubmed.ncbi.nlm.nih.gov/41000162/]
- 35. Gene Expression Analysis: Methods and Protocols [https://link.springer.com/book/10.1007/978-1-0716-4276-4]
- 36. ridge regression, lasso, elastic net and their extensions - PMC [https://pmc.ncbi.nlm.nih.gov/articles/PMC3363152/]
- 37. Clinical drug response can be predicted using baseline gene ... [https://genomebiology.biomedcentral.com/articles/10.1186/gb-2014-15-3-r47]
- 38. Analysis of High Dimensional Data - Lab 3 - StatOmics [https://statomics.github.io/HDA2020/Lab3-Penalized-Regression.html]
- 39. Covariance-regularized regression and classification for ... [https://pmc.ncbi.nlm.nih.gov/articles/PMC2806603/]
- 40. Evaluation of the lasso and the elastic net in genome-wide ... [https://www.frontiersin.org/journals/genetics/articles/10.3389/fgene.2013.00270/full]
- 41. Integrated analysis of RNA and DNA from the phase III trial ... [https://pmc.ncbi.nlm.nih.gov/articles/PMC6214737/]
- 42. Elastic net-based prediction of IFN-β treatment response ... [https://www.nature.com/articles/s41598-018-38441-2]
- 43. Gene selection and classification of microarray ... [https://www.sciencedirect.com/science/article/pii/S235291482100112X]
- 44. The application of sparse estimation of covariance matrix to ... [https://bmcbioinformatics.biomedcentral.com/articles/10.1186/s12859-014-0443-6]
- 45. The application of sparse estimation of covariance matrix to ... [https://pmc.ncbi.nlm.nih.gov/articles/PMC4355996/]
- 46. qtQDA: quantile transformed quadratic discriminant ... [https://pmc.ncbi.nlm.nih.gov/articles/PMC6967023/]
- 47. Protocol for analysis of single-cell sequencing data by ... [https://pmc.ncbi.nlm.nih.gov/articles/PMC11342777/]
- 48. ASGARD is A Single-cell Guided Pipeline to Aid ... [https://www.nature.com/articles/s41467-023-36637-3]
- 49. Supervised discovery of interpretable gene programs from ... [https://www.nature.com/articles/s41587-023-01940-3]
- 50. Discovering the mechanism of action of drugs with ... [https://pmc.ncbi.nlm.nih.gov/articles/PMC10474372/]
- 51. Creating a Roadmap to Quantitative Systems Pharmacology ... [https://pmc.ncbi.nlm.nih.gov/articles/PMC12207189/]
- 52. Generating Correlated Data for Omics Simulation - PMC [https://pmc.ncbi.nlm.nih.gov/articles/PMC11838456/]
- 53. Pathway enrichment analysis and visualization of omics data ... [https://pmc.ncbi.nlm.nih.gov/articles/PMC6607905/]
- 54. Inferring Pathway Activity toward Precise Disease Classification [https://journals.plos.org/ploscompbiol/article?id=10.1371/journal.pcbi.1000217]
- 55. From bench to bytes: a practical guide to RNA sequencing ... [https://www.frontiersin.org/journals/genetics/articles/10.3389/fgene.2025.1697922/full]
- 56. TPM, FPKM, or Normalized Counts? A Comparative Study of ... [https://translational-medicine.biomedcentral.com/articles/10.1186/s12967-021-02936-w]
- 57. CONTRASTIVE LATENT VARIABLE MODELING WITH ... [https://pmc.ncbi.nlm.nih.gov/articles/PMC12456736/]
- 58. KATMAP infers splicing factor activity and regulatory ... [https://www.nature.com/articles/s41587-025-02881-9]
- 59. 1.2. Linear and Quadratic Discriminant Analysis [https://scikit-learn.org/stable/modules/lda_qda.html]
- 60. LDA vs. QDA for FT-MIR prostate cancer tissue classification [https://www.sciencedirect.com/science/article/abs/pii/S0169743916303318]
- 61. Machine learning approach to identify significant genes ... [https://pmc.ncbi.nlm.nih.gov/articles/PMC12547461/]
- 62. Comparison of regularized discriminant analysis linear ... [https://www.academia.edu/66629680/Comparison_of_regularized_discriminant_analysis_linear_discriminant_analysis_and_quadratic_discriminant_analysis_applied_to_NIR_data]
- 63. A new local covariance matrix estimation for the ... [https://www.sciencedirect.com/science/article/abs/pii/S0957417420309295]
- 64. Gene expression data mining by hybrid biclustering with ... [https://www.nature.com/articles/s41598-025-18326-x]
- 65. Deep generative modeling of sample-level heterogeneity ... [https://www.nature.com/articles/s41592-025-02808-x]
- 66. Enhancing Spatial Transcriptomics via ... [https://pmc.ncbi.nlm.nih.gov/articles/PMC12622516/]
- 67. Enhanced Single-Cell RNA-seq Embedding through Gene ... [https://arxiv.org/html/2509.02639v1]
- 68. Dimensionality Reduction: PCA, t-SNE, and UMAP [https://medium.com/@aastha.code/dimensionality-reduction-pca-t-sne-and-umap-41d499da2df2]
- 69. Top 12 Dimensionality Reduction Techniques for Machine ... [https://encord.com/blog/dimentionality-reduction-techniques-machine-learning/]
- 70. Comparison among dimensionality reduction techniques ... [https://www.sciencedirect.com/science/article/abs/pii/S1476927116304108]
- 71. Elbow Method, LDA, t-SNE, Autoencoders, and PCA [https://medium.com/@srivastavashivansh8922/understanding-dimensionality-reduction-techniques-elbow-method-lda-t-sne-autoencoders-and-pca-9d9890279dbc]
- 72. PCA vs UMAP vs t-SNE [https://biostatsquid.com/pca-umap-tsne-comparison/]
- 73. Multiple Mean Comparison for Clusters of Gene ... [https://lifescienceglobal.com/pms/index.php/ijsmr/article/view/10023]
- 74. PCA vs PCoA vs NMDS: Key Differences, Applications, and ... [https://www.cd-genomics.com/blog/pca-pcoa-nmds-differences-applications/]
- 75. Difference between tSNE and PCA analysis [https://www.biostars.org/p/295174/]
- 76. Infusing structural assumptions into dimensionality ... [https://www.nature.com/articles/s42003-025-07872-9]
- 77. Sparse dimensionality reduction for analyzing single-cell ... [https://pmc.ncbi.nlm.nih.gov/articles/PMC12527234/]
- 78. Serial filter-wrapper feature selection method with elite ... [https://link.springer.com/article/10.1007/s10462-024-11029-1]
- 79. Navigating the microarray landscape - PubMed Central [https://pmc.ncbi.nlm.nih.gov/articles/PMC12287000/]
- 80. RCMAT: a regularized covariance matrix approach to testing ... [https://bmcbioinformatics.biomedcentral.com/articles/10.1186/1471-2105-10-300]
- 81. High-dimensional covariance regression with application ... [https://arxiv.org/html/2404.02093v2]
- 82. PF-PSS: a double-layer parallel embedded feature selection ... [https://journalofbigdata.springeropen.com/articles/10.1186/s40537-025-01144-3]
- 83. A novel two-stage hybrid feature selection [https://www.sciencedirect.com/science/article/abs/pii/S0925231225022465]
- 84. How to avoid overfitting in bioinformatics models? [https://synapse.patsnap.com/article/how-to-avoid-overfitting-in-bioinformatics-models]
- 85. Overfitting In Bioinformatics [https://www.meegle.com/en_us/topics/overfitting/overfitting-in-bioinformatics]
- 86. Sparsity regularization enhances gene selection and ... [https://www.sciencedirect.com/science/article/abs/pii/S0145212625000232]
- 87. Application of the Lasso regularisation technique in ... [https://www.nature.com/articles/s41598-024-84342-y]
- 88. Improved gene regulatory network inference from single cell ... [https://journals.plos.org/ploscompbiol/article?id=10.1371/journal.pcbi.1013603]
- 89. Machine learning methods for gene regulatory network ... [https://pmc.ncbi.nlm.nih.gov/articles/PMC12449054/]
- 90. Gene regulatory network prediction using machine learning ... [https://pmc.ncbi.nlm.nih.gov/articles/PMC12441907/]
- 91. Estimating cell-type-specific gene co-expression networks ... [https://pmc.ncbi.nlm.nih.gov/articles/PMC11394578/]
- 92. A simple procedure for the comparison of covariance matrices [https://pmc.ncbi.nlm.nih.gov/articles/PMC3732089/]
- 93. A comparative study of covariance selection models for the ... [https://www.sciencedirect.com/science/article/pii/S1532046413001019]
- 94. Projected tests for high-dimensional covariance matrices [https://www.sciencedirect.com/science/article/abs/pii/S0378375818302817]
- 95. Identification of models describing gene expression data ... [https://pmc.ncbi.nlm.nih.gov/articles/PMC12371343/]
- 96. Shrinkage-based Diagonal Discriminant Analysis and Its Applications in High-dimensional Data - PMC [https://pmc.ncbi.nlm.nih.gov/articles/PMC2794982/]
- 97. Block-diagonal discriminant analysis and its bias-corrected rules - PMC [https://www.ncbi.nlm.nih.gov/pmc/articles/PMC3856189/]
- 98. Comparison of Support Vector Machine and Random ... [https://www.mdpi.com/2072-4292/12/3/516]
- 99. Gene selection and classification of microarray data using random forest | BMC Bioinformatics | Full Text [https://bmcbioinformatics.biomedcentral.com/articles/10.1186/1471-2105-7-3]
- 100. Advanced PCA Techniques in Biostatistics [https://www.numberanalytics.com/blog/advanced-pca-techniques-biostatistics]
- 101. A simple procedure for the comparison of covariance matrices [https://bmcecolevol.biomedcentral.com/articles/10.1186/1471-2148-12-222]
- 102. a geometrical approach to identify differentially expressed genes [https://pmc.ncbi.nlm.nih.gov/articles/PMC4000056/]
- 103. Differential Covariance: A New Class of Methods to ... [https://pmc.ncbi.nlm.nih.gov/articles/PMC5726979/]
- 104. All You Need to Know About the Covariance Matrix [https://medium.com/@libertihub/all-you-need-to-know-about-the-covariance-matrix-01aac6540775]
- 105. Protocol for comparative gene expression data analysis ... [https://www.sciencedirect.com/science/article/pii/S2666166724005409]