From Discovery to Validation: A Comprehensive Guide to Integrating RNA-Seq and qPCR in Biomedical Research
This article provides a complete roadmap for researchers and drug development professionals navigating the transition from genome-scale RNA-Seq discovery to targeted qPCR validation.
From Discovery to Validation: A Comprehensive Guide to Integrating RNA-Seq and qPCR in Biomedical Research
Abstract
This article provides a complete roadmap for researchers and drug development professionals navigating the transition from genome-scale RNA-Seq discovery to targeted qPCR validation. It covers the foundational principles of both technologies, detailing a step-by-step experimental workflow from RNA extraction to data analysis. The guide offers practical solutions for common troubleshooting and optimization challenges, including primer design and handling low-quality samples. Furthermore, it presents a modern framework for validation, examining the correlation between RNA-Seq and qPCR data and discussing when validation is necessary. By synthesizing best practices from foundational to advanced applications, this resource empowers scientists to design robust, reproducible gene expression studies that accelerate biomarker discovery and therapeutic development.
RNA-Seq and qPCR: Understanding the Core Technologies for Gene Expression Analysis
RNA sequencing (RNA-Seq) has fundamentally transformed transcriptomics, becoming the gold standard for whole-transcriptome gene expression quantification [1]. This powerful technology uses deep-sequencing to provide an unbiased, comprehensive view of the cellular transcriptome, enabling researchers to move beyond targeted gene expression analysis to discover novel transcripts, identify alternative splicing events, and quantify expression levels across an unprecedented dynamic range [2] [3]. Since its introduction in 2008, RNA-Seq has seen exponential growth in adoption, with publications containing RNA-Seq data reaching an all-time high of 2,808 in 2016 alone [4].
The fundamental advantage of RNA-Seq lies in its hypothesis-free approach, requiring no prior knowledge of the organism's transcriptome, which makes it particularly valuable for studying non-model organisms or discovering novel transcriptional events [2] [3]. Unlike microarray technologies, which are limited by predefined probes and suffer from cross-hybridization artifacts and background noise, RNA-Seq provides single-base resolution with very low background signal and a dynamic range exceeding 8,000-fold [2]. This technological leap has enabled a more detailed understanding of the functional elements of the genome and revealed the molecular constituents of cells and tissues in both development and disease [5] [2].
Table 1: Comparison of Transcriptome Analysis Technologies
| Feature | Microarray | Tag-based Methods (SAGE/CAGE) | RNA-Seq |
|---|---|---|---|
| Principle | Hybridization | Sanger sequencing of tags | High-throughput sequencing |
| Genomic Sequence Requirement | Yes | No | For alignment-based methods |
| Background Noise | High | Low | Very low |
| Dynamic Range | Several hundred-fold | Not practical | >8,000-fold |
| Ability to Distinguish Isoforms | Limited | Limited | Excellent |
| Detection of Novel Transcripts | No | Limited | Yes |
RNA-Seq Applications in Research and Drug Development
Comprehensive Transcriptome Characterization
RNA-Seq enables researchers to catalog all species of transcripts, including mRNAs, non-coding RNAs, and small RNAs, while simultaneously determining the transcriptional structure of genes with single-base resolution [2]. This includes precise mapping of start sites, 5′ and 3′ ends, splicing patterns, and other post-transcriptional modifications [2]. The technology has revealed unexpected complexity in eukaryotic transcriptomes, with many studies identifying extensive alternative splicing, novel promoters, and previously unrecognized non-coding RNAs [2] [6].
The unbiased nature of whole transcriptome sequencing makes it an ideal tool for de novo discovery, particularly in creating comprehensive cell atlases and identifying novel cell types and transient cell states [3]. Global initiatives like the Human Cell Atlas rely on this approach to build reference maps of every cell in the human body, providing foundational knowledge for understanding health and disease [3]. When comparing healthy and diseased tissues, RNA-Seq provides high-resolution maps of pathology, revealing specific cell populations driving disease processes and identifying dysregulated signaling pathways that may represent novel therapeutic targets [3].
Applications in Pharmaceutical Development
In drug development, RNA-Seq plays complementary roles at different stages of the pipeline. Whole transcriptome approaches are particularly valuable during early target identification, where their unbiased nature allows for discovery of novel disease mechanisms without preconceived notions of which genes might be important [3]. As projects move toward clinical applications, the unparalleled comprehensiveness of RNA-Seq makes it invaluable for understanding complex biological systems, mapping developmental processes, and uncovering novel disease pathways [3].
RNA-Seq also provides crucial insights into mechanism of action (MoA) studies and safety assessment. By capturing the full transcriptional response to drug treatment, researchers can identify both intended therapeutic effects and potential adverse outcome pathways [3]. This comprehensive view is particularly valuable for characterizing complex therapeutics like cell and gene therapies, where understanding the full spectrum of transcriptional changes is essential for assessing both efficacy and safety [3].
RNA-Seq Experimental Workflow and Protocols
Sample Preparation and Library Construction
A successful RNA-Seq experiment begins with proper experimental design and high-quality RNA isolation. The RNA should have sufficient quality, typically measured as an RNA Integrity Number (RIN) > 6, as degradation can substantially affect sequencing results by causing uneven gene coverage and 3′-5′ transcript bias [5]. Careful attention must be paid to minimizing batch effects throughout the experiment, including during sample collection, RNA isolation, library preparation, and sequencing runs [4].
Library preparation involves several critical choices that depend on the research objectives. The most fundamental decision involves selecting the RNA species to target, typically achieved through either poly-A selection (enriching for mRNA) or ribo-depletion (removing ribosomal RNA to retain other RNA species including pre-mRNA and noncoding RNAs) [5]. Other considerations include whether to use strand-specific protocols (preserving strand information valuable for transcriptome annotation), fragment size selection (particularly important for small RNA sequencing), and whether to incorporate unique molecular identifiers to control for amplification biases [5] [2].
Table 2: RNA-Seq Library Preparation Protocols
| Library Design | Usage | Description | Considerations |
|---|---|---|---|
| Poly-A Selection | Sequencing mRNA | Selects for RNA species with poly-A tail and enriches for mRNA | Misses non-polyadenylated transcripts |
| Ribo-depletion | Sequencing mRNA, pre-mRNA, ncRNA | Removes ribosomal RNA and enriches for mRNA, pre-mRNA, and ncRNA | Retains non-coding RNAs |
| Size Selection | Sequencing miRNA | Selects RNA species using size fractionation by gel electrophoresis | Targeted to specific RNA size classes |
| Strand-specific | De novo transcriptome assembly | Preserves strand information of the transcript | More complex protocol |
| Duplex-specific nuclease | Reduce highly abundant transcripts | Cleaves highly abundant transcripts, including rRNA | Can reduce dynamic range |
Computational Analysis Pipeline
Following sequencing, the computational analysis of RNA-Seq data involves multiple steps to transform raw sequencing reads into biologically meaningful information. The initial processing includes quality control assessment, read trimming, and filtering to remove low-quality sequences [4] [7]. The high-quality reads are then aligned to a reference genome or transcriptome using tools such as TopHat2, STAR, or HISAT2 [4] [1]. For organisms without a reference genome, de novo assembly can be performed using tools like Trinity or SOAPdenovo-Trans [2].
After alignment, reads are assigned to genomic features (genes or transcripts) using quantification tools such as HTSeq, featureCounts, or Cufflinks [4] [1]. The resulting count data then undergoes normalization to account for technical variations between samples, such as sequencing depth and gene length biases [7]. The most common normalization methods include TMM (trimmed mean of M-values) in edgeR and the median-of-ratios method in DESeq2 [7]. For differential expression analysis, statistical models accounting for the count-based nature of the data (negative binomial distribution) are applied using tools like edgeR, DESeq2, or limma-voom [4] [7].
Differential Expression Analysis Protocol
A typical differential expression analysis follows these key steps:
Data Preparation: Read the raw count matrix into R and clean the data by transforming the first column into row names and removing it from the table [7].
Filtering Low-Expressed Genes: Remove genes with low or no expression using thresholds such as keeping genes expressed in at least 80% of samples:
Creating DGEList Object: Combine the count data and sample information into a DGEList object using edgeR:
Normalization: Calculate normalization factors using the TMM method and transform the data using the voom method in limma:
Differential Expression Testing: Create a design matrix, fit linear models, and apply empirical Bayes moderation:
Quality Control and Visualization
Data Quality Assessment
Effective quality control is essential for reliable RNA-Seq analysis. Visualization methods play a crucial role in assessing data quality, detecting normalization issues, and identifying potential outliers [6]. Principal Component Analysis (PCA) is commonly used to visualize the overall structure of the data and identify patterns such as sample clustering, batch effects, or outliers [4] [7]. In a PCA plot, samples from the same treatment group should cluster together, with the distance between clusters reflecting the biological effect of interest [7].
Additional visualization techniques include parallel coordinate plots, which display each gene as a line connecting its expression values across samples, allowing researchers to assess whether variability between treatments exceeds variability between replicates [6]. Similarly, scatterplot matrices plot read count distributions across all genes and samples, enabling the identification of unexpected patterns and assessment of data structure [6]. These multivariate visualization tools provide valuable feedback on the appropriateness of statistical models and help detect issues that might otherwise go unnoticed [6].
Benchmarking and Validation with qPCR
Validation of RNA-Seq results typically involves comparison with quantitative PCR (qPCR) data, which remains the gold standard for gene expression measurement [1]. Benchmarking studies have shown high concordance between RNA-Seq and qPCR, with Pearson correlation coefficients for fold changes typically exceeding 0.92 across different analysis workflows [1]. However, a small but consistent set of genes (approximately 7-15%) may show discordant results between the two technologies [1].
These discrepant genes tend to have specific characteristics: they are typically shorter, have fewer exons, and show lower expression levels compared to genes with consistent measurements [1]. The alignment-based algorithms (e.g., Tophat-HTSeq, STAR-HTSeq) generally show slightly better performance in fold-change correlation with qPCR compared to pseudoalignment methods (e.g., Salmon, Kallisto), though all methods show high overall concordance [1]. This benchmarking underscores the importance of validation for specific gene sets and provides guidance for interpreting RNA-seq based expression profiles.
Table 3: Performance Comparison of RNA-Seq Analysis Workflows
| Workflow | Expression Correlation with qPCR (R²) | Fold Change Correlation with qPCR (R²) | Non-concordant Genes | Key Features |
|---|---|---|---|---|
| Salmon | 0.845 | 0.929 | 19.4% | Pseudoalignment, fast |
| Kallisto | 0.839 | 0.930 | 18.2% | Pseudoalignment, fast |
| Tophat-Cufflinks | 0.798 | 0.927 | 17.8% | Alignment-based, isoform analysis |
| Tophat-HTSeq | 0.827 | 0.934 | 15.1% | Alignment-based, gene-level counts |
| STAR-HTSeq | 0.821 | 0.933 | 15.3% | Alignment-based, fast mapping |
Research Reagent Solutions
The following table details essential materials and reagents used in a typical RNA-Seq workflow, along with their specific functions in the experimental process.
Table 4: Essential Research Reagents for RNA-Seq Workflows
| Reagent Category | Specific Examples | Function | Considerations |
|---|---|---|---|
| RNA Isolation Kits | PicoPure RNA Isolation Kit | Extract high-quality RNA from cells or tissues | Critical for obtaining RIN > 6 |
| Poly-A Selection Kits | NEBNext Poly(A) mRNA Magnetic Isolation Kit | Enrich for polyadenylated mRNA transcripts | Depletes non-polyadenylated RNAs |
| Ribosomal RNA Depletion Kits | RiboMinus Kit | Remove abundant ribosomal RNAs | Retains non-coding RNAs |
| Library Preparation Kits | NEBNext Ultra DNA Library Prep Kit | Prepare sequencing libraries from RNA | Platform-specific options available |
| cDNA Synthesis Kits | TruSeq RNA Sample Prep Kit | Convert RNA to cDNA for sequencing | Includes fragmentation step |
| Quality Control Assays | Agilent Bioanalyzer RNA kits | Assess RNA integrity (RIN) | Essential for QC pre-sequencing |
| Normalization Controls | External RNA Controls Consortium (ERCC) spikes | Monitor technical variation | Quality assessment benchmark |
| Strand-Specific Library Kits | ScriptSeq kits | Preserve strand orientation | Important for transcript annotation |
RNA-Seq has revolutionized transcriptomics by providing an unparalleled comprehensive view of the transcriptome through unbiased, whole-transcriptome analysis. Its power lies in simultaneously enabling discovery of novel transcriptional elements and precisely quantifying expression levels across a tremendous dynamic range. As the technology continues to evolve, with improvements in library preparation methods, sequencing platforms, and computational tools, RNA-Seq remains an indispensable tool for researchers and drug development professionals seeking to understand the complexities of gene regulation in health and disease. The integration of RNA-Seq with complementary technologies like qPCR creates a powerful framework for validating discoveries and translating them into clinical applications, ultimately advancing our understanding of biology and therapeutic development.
Quantitative PCR (qPCR) remains the established gold standard for targeted gene expression analysis due to its exceptional sensitivity, specificity, and reproducibility. This application note details robust protocols for qPCR experimental workflows, provides benchmarking data against RNA-Seq, and outlines a framework for integrating both methods to leverage their complementary strengths. Adherence to MIQE guidelines and the use of stable reference genes are emphasized as critical for ensuring data rigor and reproducibility in basic research and drug development.
In the landscape of modern genomics, RNA-Seq has emerged as a powerful discovery tool for transcriptome-wide analysis. However, for the targeted quantification of a limited number of genes, quantitative PCR (qPCR) maintains its status as the benchmark method due to its unmatched sensitivity, wide dynamic range, and cost-effectiveness [8]. Its role is particularly critical in the validation of RNA-Seq findings, where it provides an independent, high-confidence verification of differential gene expression [1]. This application note delineates the position of qPCR within a broader RNA-Seq to qPCR experimental workflow, providing detailed protocols and data to empower researchers in generating precise, reproducible, and reliable gene expression data.
Performance Benchmarking: qPCR vs. RNA-Seq
While RNA-Seq offers a hypothesis-free, comprehensive view of the transcriptome, qPCR excels in the accurate, reproducible quantification of predefined targets. The table below summarizes a direct comparison of their core performance characteristics.
Table 1: Comparative analysis of qPCR and RNA-Seq for gene expression profiling.
| Feature | qPCR | RNA-Seq |
|---|---|---|
| Throughput | Low to medium (ideal for 1-30 targets) [8] | Very high (entire transcriptome) [9] |
| Discovery Power | Limited to known sequences [9] | High; detects novel transcripts, isoforms, and fusions [9] [10] |
| Sensitivity | Very high; capable of detecting rare transcripts and subtle (down to 10%) expression changes [9] | High, but can be affected by sequencing depth and bioinformatic biases [11] |
| Dynamic Range | >10-log range [8] | ~5-log range (limited by background noise and saturation) [8] |
| Turnaround Time | Fast (1-3 days) [10] | Longer (several days to weeks, including data analysis) |
| Cost per Sample | Low for a few targets | Moderate to high |
| Ease of Data Analysis | Straightforward; requires minimal bioinformatics [8] | Complex; requires significant bioinformatics expertise and resources [8] |
| Absolute Quantification | Possible with standard curves | Typically provides relative quantification (e.g., TPM) |
Correlation with qPCR Validates RNA-Seq Workflows: Benchmarking studies consistently demonstrate strong concordance between RNA-Seq and qPCR. One comprehensive study comparing five RNA-Seq analysis workflows (Tophat-HTSeq, Tophat-Cufflinks, STAR-HTSeq, Kallisto, Salmon) against whole-transcriptome qPCR data for over 13,000 genes revealed high fold-change correlations (Pearson R² values of 0.93-0.93) [1]. This high level of agreement underscores the reliability of both technologies while reinforcing the role of qPCR as the validation standard.
Detailed Experimental Protocols
Protocol 1: qPCR Assay Design and Validation for RNA-Seq Hit Confirmation
This protocol is designed for the robust validation of candidate genes identified from an RNA-Seq experiment.
A. Primer Design
- Specificity: Design primers to span exon-exon junctions where possible to avoid amplification of genomic DNA.
- Amplicon Length: Optimal length is 80-150 base pairs for efficient amplification.
- Validation: Verify primer specificity using BLAST and confirm with melt curve analysis (a single sharp peak).
B. Reaction Setup
- Master Mix: Use a SYBR Green or probe-based master mix according to manufacturer's instructions.
- Reaction Volume: Standard reactions are 10-20 µL.
- Replicates: Perform a minimum of three technical replicates and three biological replicates to account for technical and biological variance.
- Controls: Include no-template controls (NTC) for each primer pair and a no-reverse transcription control (-RT) for each RNA sample.
C. Cycling Conditions
| Step | Temperature | Time | Cycles |
|---|---|---|---|
| Initial Denaturation | 95°C | 2-5 min | 1 |
| Amplification | 95°C | 10-15 sec | 40 |
| 60°C | 20-30 sec | ||
| 72°C | 20-30 sec | ||
| Melt Curve | 65°C to 95°C, increment 0.5°C | 5 sec/step | 1 |
D. Data Analysis
- Determine Cq values for each reaction.
- Calculate PCR efficiency for each primer pair using a standard curve of a known template. Efficiency between 90-110% is acceptable.
- Normalize Cq values using a validated reference gene or combination of genes (see Section 3.2).
- Calculate relative fold change using the 2^(-ΔΔCq) method or a more robust statistical model like ANCOVA, which offers greater power and is less affected by efficiency variability [12].
Protocol 2: Identification of Optimal Reference Genes from RNA-Seq Data
A critical step in qPCR normalization is the selection of stably expressed reference genes. RNA-Seq data can be leveraged in silico to identify superior candidates.
- Data Extraction: From a comprehensive RNA-Seq database (e.g., TomExpress for tomato), extract gene expression values (e.g., TPM, FPKM) for your organism and conditions of interest [13].
- Candidate Pool Selection: For a target gene of interest, select a pool of ~500 genes with expression levels similar to or greater than the target [13].
- Stability Calculation: Calculate the variance of all possible geometric means of combinations of 2-3 genes from this pool. The geometric mean is used as it provides a more accurate normalization factor [13].
- Optimal Combination Selection: Identify the combination of genes (e.g., a 3-gene set) that exhibits the lowest variance in expression across the conditions in the RNA-Seq dataset. This stable combination often outperforms single "housekeeping" genes [13].
- Experimental Validation: Confirm the stability of the selected gene combination in your own samples using algorithms like geNorm, NormFinder, or BestKeeper.
Table 2: Essential research reagents for qPCR workflows.
| Reagent / Solution | Function | Key Considerations |
|---|---|---|
| High-Quality RNA | Template for cDNA synthesis | Integrity (RIN > 8), purity (A260/A280 ~2.0), and absence of genomic DNA contamination are critical. |
| Reverse Transcriptase | Synthesizes cDNA from RNA | Choose enzymes with high fidelity and efficiency, especially for long transcripts or degraded samples. |
| qPCR Master Mix | Contains enzymes, dNTPs, buffer, and fluorescent dye | Select SYBR Green or probe-based mixes based on requirements for specificity, multiplexing, and cost. |
| Validated Primers/Probes | Sequence-specific amplification | Must be designed for high efficiency and specificity; pre-validated assays save time. |
| Nuclease-Free Water | Solvent for reactions | Ensures no enzymatic degradation of reagents. |
| Reference Gene Assays | For data normalization | Must be empirically validated for stability under specific experimental conditions [13]. |
Protocol 3: RNA-Seq Library Amplification with Optimal PCR Cycles
Accurate RNA-Seq library preparation is foundational for generating data that can be validated by qPCR. Determining the correct number of PCR cycles during library prep is crucial to avoid artifacts.
- qPCR Assay for Cycle Determination: Use a small aliquot (e.g., 1.7 µL) of the pre-amplified RNA-Seq library in a qPCR reaction with the library amplification primers [14].
- Determine Cq: The cycle number at which the fluorescence crosses the threshold (Cq) indicates the point of amplification.
- Calculate End-Point Cycles: For the main end-point PCR amplification, use Cq - 3 cycles to account for the higher template concentration in the full-scale reaction, preventing overcycling [14].
- Troubleshooting: Overcycling can lead to chimeric reads, "bubble products," and biased gene expression estimates, which can be detected via Bioanalyzer traces and will manifest as outliers in principal component analysis [14].
Integrated Workflow and Data Analysis
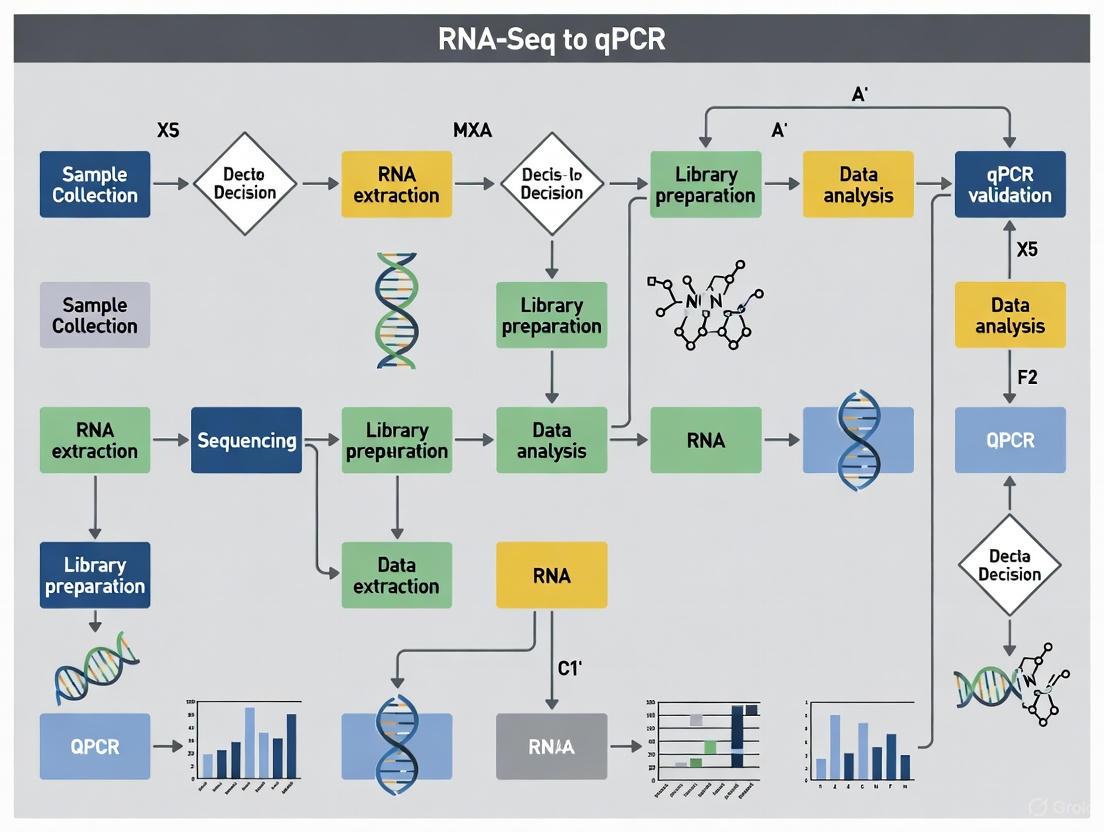
The following diagram illustrates the synergistic relationship between RNA-Seq and qPCR in a complete gene expression study.
qPCR remains an indispensable tool in the molecular biologist's toolkit. Its strengths in sensitivity, specificity, and throughput for targeted quantification make it the unequivocal gold standard for validating high-throughput sequencing data [1] [8]. The protocols outlined herein, particularly the use of RNA-Seq databases to inform reference gene selection and the careful control of amplification cycles, provide a pathway to achieving the highest standards of rigor and reproducibility.
For drug development professionals, the combination of RNA-Seq for unbiased biomarker discovery followed by qPCR for high-fidelity, scalable validation in large clinical cohorts represents a powerful and efficient strategy. By understanding the distinct advantages of each method and implementing them within an integrated workflow, researchers can generate robust, reliable, and clinically actionable gene expression data.
Why Combine Them? Defining the Complementary Roles in a Modern Workflow
In the field of gene expression analysis, the choice between RNA sequencing (RNA-Seq) and quantitative polymerase chain reaction (qPCR) is not a matter of selecting a superior technology but rather of strategically deploying complementary tools. While RNA-Seq provides an unbiased, genome-wide discovery platform, qPCR delivers precise, sensitive validation for targeted genes. This application note delineates the distinct and synergistic roles of these technologies within a modern experimental workflow, providing researchers and drug development professionals with a framework for optimizing their genomic research strategies. By understanding the specific strengths of each method, scientists can design more efficient, reliable, and cost-effective studies that bridge the gap between exploratory discovery and clinical application.
The Complementary Strengths of RNA-Seq and qPCR
RNA-Seq and qPCR serve fundamentally different yet complementary purposes in gene expression analysis. RNA-Seq is a hypothesis-free approach that enables comprehensive transcriptome profiling without requiring prior knowledge of gene sequences [15] [9]. This next-generation sequencing technology can detect both known and novel transcripts, including alternatively spliced isoforms, gene fusions, and non-coding RNAs, providing an unprecedented view of transcriptional dynamics [15]. In contrast, qPCR is a targeted approach ideal for validating specific gene expression patterns with exceptional sensitivity and reproducibility [1] [16]. While qPCR is limited to analyzing known sequences, its established workflow, accessibility, and cost-effectiveness make it indispensable for focused studies or confirmation of high-throughput findings [9].
Table 1: Fundamental Characteristics of RNA-Seq and qPCR
| Feature | RNA-Seq | qPCR |
|---|---|---|
| Discovery Power | High (detects novel transcripts, isoforms, and fusions) [15] [9] | Limited to known sequences [9] |
| Throughput | High (profiles thousands of genes simultaneously) [15] [9] | Low to medium (typically ≤ 20 targets) [9] |
| Dynamic Range | Broad (≥ 10⁵-fold range) [15] | Wide (≥ 10⁷-fold range) |
| Sensitivity | Can detect subtle expression changes (down to 10%) and rare transcripts [9] | Extremely high for targeted detection |
| Data Output | Qualitative and quantitative (sequence and abundance information) [15] | Quantitative (expression levels only) |
| Experimental Workflow | Multi-step process requiring specialized bioinformatics analysis [4] | Streamlined, accessible workflow with standardized analysis |
The integration of these technologies creates a powerful framework for genomic research. RNA-Seq serves as an unbiased discovery engine that can identify novel biomarkers, pathways, and transcriptional events without the constraints of pre-defined probes [9]. Once candidate genes of interest are identified through RNA-Seq, qPCR provides a cost-effective validation mechanism for confirming expression patterns in larger sample cohorts, across different experimental conditions, or in clinical validation studies [1] [16]. This sequential approach leverages the respective strengths of each technology while mitigating their limitations, resulting in more robust and reproducible research outcomes.
Quantitative Performance Comparison
Understanding the technical performance characteristics of RNA-Seq and qPCR is essential for appropriate experimental design and data interpretation. Both technologies demonstrate strong correlation in gene expression measurement, though systematic differences exist that researchers must consider when integrating these platforms.
Table 2: Performance Benchmarking Between RNA-Seq and qPCR
| Performance Metric | Findings | Experimental Context |
|---|---|---|
| Expression Correlation | High Pearson correlation (R² = 0.80-0.85) between RNA-Seq and qPCR [1] | Analysis of MAQC reference samples using multiple bioinformatics workflows [1] |
| Fold Change Concordance | 80-85% of genes show consistent differential expression between methods [1] | Comparison of log fold changes between MAQCA and MAQCB samples [1] |
| Inter-laboratory Reproducibility | Moderate correlation (rho = 0.2-0.53) for HLA class I gene expression [11] | Multi-center study of HLA expression in healthy donors [11] |
| Sensitivity to Subtle Expression Changes | RNA-Seq workflows show variable performance for detecting subtle differential expression [17] | Evaluation of E. coli response to low-dose radiation [17] |
| Impact of Bioinformatics Tools | DESeq2 provided more conservative fold-changes than other tools for subtle expressions [17] | Comparison of four analysis workflows on the same dataset [17] |
A comprehensive benchmarking study that compared five RNA-Seq processing workflows against whole-transcriptome qPCR data revealed high concordance between the technologies, with approximately 85% of genes showing consistent differential expression results [1]. The remaining 15% of non-concordant genes typically displayed relatively small differences in fold-change measurements between methods, with over 66% showing a ΔFC < 1 [1]. These discrepancies often involved genes with specific characteristics, including lower expression levels, fewer exons, and smaller transcript sizes, highlighting the importance of careful validation for this gene subset [1].
For studies requiring detection of subtle expression changes, the choice of bioinformatics pipeline significantly impacts RNA-Seq results. One investigation found that while three of four evaluated software tools reported exaggerated fold-changes (15-178 fold) for subtle transcriptional responses, the DESeq2 algorithm provided more conservative and biologically realistic fold-changes (1.5-3.5 fold) that showed better agreement with qPCR validation [17]. This emphasizes the importance of selecting analysis parameters appropriate for the expected effect size in RNA-Seq experiments.
Integrated Experimental Workflow
The strategic integration of RNA-Seq and qPCR follows a logical sequence that progresses from discovery to validation and application. This structured approach maximizes the strengths of each technology while providing internal validation that enhances the robustness of research findings.
Diagram 1: Integrated RNA-Seq to qPCR Experimental Workflow
RNA-Seq Discovery Phase
The workflow begins with comprehensive transcriptome profiling using RNA-Seq to identify candidate genes or pathways of interest without prior bias [9]. Proper experimental design at this stage is critical, including sufficient biological replication (typically ≥3 replicates per condition) and sequencing depth (usually 20-50 million reads per sample for standard differential expression studies) to ensure statistical power [4] [18]. During library preparation, researchers must choose between mRNA enrichment (typically using poly-A selection) or rRNA depletion methods depending on whether the focus is specifically on protein-coding genes or includes non-coding RNAs [15].
Following sequencing, bioinformatic analysis involves quality control of raw reads, alignment to a reference genome, gene quantification, and differential expression analysis [4]. For studies expecting subtle expression changes, the DESeq2 algorithm has demonstrated superior performance with more conservative and biologically realistic fold-change estimates [17]. This discovery phase generates a list of candidate genes that require validation in larger sample cohorts or under different experimental conditions.
qPCR Validation Phase
The transition to qPCR validation requires careful selection of stable reference genes for data normalization. Tools such as Gene Selector for Validation (GSV) can identify appropriate reference genes from RNA-Seq data by filtering for genes with high expression stability across experimental conditions [16]. For the validation itself, researchers should design target-specific assays with optimized amplification efficiency and include appropriate controls to ensure technical reproducibility.
qPCR validation typically expands beyond the original sample set used for RNA-Seq discovery to include additional biological replicates, different time points, or related tissue types to confirm the generalizability of findings [1]. The resulting data, analyzed using the ΔΔCq method, provides independent confirmation of expression patterns identified through RNA-Seq, significantly strengthening the credibility of research conclusions before proceeding to more resource-intensive functional studies or clinical applications.
Research Reagent Solutions
The successful implementation of an integrated RNA-Seq to qPCR workflow depends on appropriate selection of research reagents and platforms. The following table outlines essential solutions for each stage of the experimental process.
Table 3: Essential Research Reagents and Platforms
| Application | Solution | Function |
|---|---|---|
| RNA-Seq Library Prep | Illumina Stranded mRNA Prep | Selective analysis of coding transcriptome via poly-A enrichment [15] |
| RNA-Seq Library Prep | Illumina Stranded Total RNA Prep | Comprehensive transcriptome analysis including non-coding RNAs [15] |
| Targeted RNA-Seq | RNA Prep with Enrichment + Targeted Panel | Focused analysis of specific gene sets with exceptional coverage uniformity [9] |
| Sequencing Platforms | MiSeq System | Benchtop sequencing for smaller targeted panels and validation studies [9] |
| Sequencing Platforms | NextSeq 1000/2000 Systems | Higher-throughput sequencing for comprehensive transcriptome analysis [9] |
| qPCR Analysis Software | Gene Selector for Validation (GSV) | Identifies optimal reference genes from RNA-Seq data for qPCR normalization [16] |
| Automation | Automated Liquid Handling Systems (e.g., Opentrons OT-2) | Standardizes library preparation and qPCR setup to minimize technical variability [19] |
The selection of appropriate library preparation kits depends on the specific research goals. For studies focused primarily on protein-coding genes, poly-A enrichment methods such as the Illumina Stranded mRNA Prep provide a cost-effective solution [15]. When investigating non-coding RNAs or transcripts without poly-A tails, rRNA depletion approaches using the Illumina Stranded Total RNA Prep are more appropriate [15]. For large-scale validation studies, targeted RNA-Seq panels enable focused analysis of specific gene sets with optimized coverage and reduced cost compared to whole transcriptome approaches [9].
Automation plays an increasingly important role in ensuring reproducibility across both RNA-Seq and qPCR workflows. Automated liquid handling systems such as the Opentrons OT-2 can perform precise liquid transfers for library preparation and qPCR setup, while integrated AI-powered quality control systems provide real-time feedback to correct errors such as missing tips or incorrect liquid volumes [19]. These automated solutions enhance reproducibility while making advanced genomic capabilities accessible to broader research communities.
Applications in Drug Development and Clinical Translation
The complementary RNA-Seq to qPCR workflow has proven particularly valuable in drug development and clinical translation, where rigorous validation is essential for decision-making. In biomarker discovery, RNA-Seq enables unbiased identification of transcriptional signatures associated with disease subtypes, treatment response, or patient stratification, followed by qPCR development of clinically implementable assays [20]. The extreme sensitivity of qPCR makes it ideal for detecting low-abundance transcripts in limited clinical samples, such as fine-needle aspirates or circulating tumor cells.
In immunotherapy development, RNA-Seq has been employed to identify tumor-specific HLA ligands and neoantigens, while qPCR facilitates monitoring of immune activation markers in patient samples [15]. Similarly, in infectious disease research, both technologies have been used to characterize host transcriptional responses to pathogens like SARS-CoV-2 and HIV, revealing how viruses modulate HLA expression to evade immune recognition [11].
For regulatory submissions, the qPCR validation component provides the precision, reproducibility, and standardization required for clinical assay development. While RNA-Seq offers comprehensive discovery power, qPCR delivers the analytical validation necessary for FDA-approved diagnostic tests, creating a seamless pathway from initial discovery to clinical implementation.
RNA-Seq and qPCR are not competing technologies but rather complementary pillars of a robust gene expression workflow. RNA-Seq provides the discovery power to identify novel transcriptional features and generate hypotheses without prior sequence knowledge, while qPCR delivers the precision, sensitivity, and practicality required for targeted validation and clinical application. By strategically integrating these methods in a sequential workflow—using RNA-Seq for comprehensive discovery followed by qPCR for focused validation—researchers can maximize the strengths of both platforms while mitigating their respective limitations. This integrated approach accelerates scientific discovery while ensuring the reproducibility and reliability required for translational research and drug development.
Application Note: Biomarker Discovery for Precision Oncology
The integration of RNA sequencing (RNA-Seq) with advanced computational tools has revolutionized the identification and validation of biomarkers for cancer diagnosis, prognosis, and therapeutic monitoring [21]. RNA biomarkers, including messenger RNAs (mRNAs), microRNAs (miRNAs), long non-coding RNAs (lncRNAs), and circular RNAs (circRNAs), provide a dynamic view of tumor biology and therapeutic response [21] [22]. Machine learning and deep learning algorithms efficiently analyze complex RNA expression patterns from bulk and single-cell RNA-Seq data to discover novel biomarkers with clinical utility [21] [23].
Table 1: Classes of RNA Biomarkers in Cancer Research
| Biomarker Class | Key Characteristics | Primary Applications in Cancer |
|---|---|---|
| mRNA (protein-coding) | Most studied form; multi-gene expression patterns (e.g., 50-gene PAM50 for breast cancer) [21]. | Cancer subtyping, prognosis, and prediction of treatment response [21]. |
| MicroRNA (miRNA) | Small non-coding RNAs; stable in bodily fluids (liquid biopsies) [21]. | Early detection, disease monitoring, and therapeutic target identification [21] [22]. |
| Long Non-Coding RNA (lncRNA) | RNAs >200 nucleotides; diverse regulatory roles [21]. | Forecasting patient outcomes and treatment responses; potential therapeutic targets [21]. |
| Circular RNA (circRNA) | Covalently closed loop structure; high stability [21]. | Promising biomarkers for diagnosis and monitoring; functions as miRNA "sponges" [21]. |
Experimental Protocol: A Machine Learning Workflow for Biomarker Discovery from Bulk RNA-Seq
This protocol outlines an end-to-end workflow for identifying predictive biomarkers from bulk RNA-Seq data, leveraging tools like the RnaXtract pipeline [23].
Step 1: Sample Preparation and RNA Sequencing
- Extract total RNA from patient tissue or liquid biopsy samples (e.g., FFPE tumor blocks, blood for PBMCs). Assess RNA quality using an Agilent Bioanalyzer (RIN > 7 recommended) [24].
- Prepare sequencing libraries. For 3'-end focused quantification (e.g., for the QuantSeq protocol), use 100 ng of total RNA as input. This method is robust for FFPE samples and efficient for gene expression profiling [22].
- Sequence on an Illumina platform to a minimum depth of 20-30 million reads per sample for robust gene expression quantification [23].
Step 2: Computational Processing and Feature Extraction with RnaXtract
- Quality Control and Alignment: Use RnaXtract, a Snakemake-based pipeline, to perform adapter trimming and quality control with
fastpandFastQC. Align reads to a reference genome (e.g., GRCh38) usingSTAR[23]. - Gene Expression Quantification: Generate a normalized gene expression matrix (in Transcripts per Million, TPM) using
Kallisto. TPM normalization accounts for sequencing depth and gene length, making samples comparable [23]. - Variant Calling: Identify single nucleotide polymorphisms (SNPs) and insertions/deletions (INDELs) from RNA-Seq data using the GATK best practices workflow integrated into RnaXtract [23].
- Cell-Type Deconvolution: Estimate cellular heterogeneity within bulk tissue using integrated tools like
CIBERSORTxorEcoTyper. This provides an additional layer of features (cell type proportions) for analysis [23].
Step 3: Machine Learning for Biomarker Identification
- Feature Engineering: Combine the generated TPM matrix, variant table, and cell composition data into a unified feature set. Filter genetic variants based on a presence threshold (e.g., retain variants present in at least 10% of the cohort) to reduce overfitting [23].
- Model Training and Feature Selection: Apply gene selection approaches such as LASSO or Recursive Feature Elimination (RFE) to identify the most predictive genes for the phenotype of interest (e.g., chemotherapy response) [25]. Train a classifier (e.g., logistic regression, random forest) using a BioDiscML framework [23].
- Validation: Evaluate the model and the discovered biomarker panel on an independent validation cohort. Assess performance using metrics like Matthews Correlation Coefficient (MCC), F1-score, and accuracy [23] [25].
Application Note: RNA-Seq in Infectious Disease and Pathogen Detection
RNA-Seq provides a powerful, pathogen-agnostic approach for diagnosing infections, crucial for identifying novel or unexpected pathogens in clinical samples [26] [27]. Unlike targeted methods like qPCR, which require prior knowledge of the pathogen, metagenomic RNA-Seq (mNGS) can simultaneously detect a wide range of RNA viruses and actively transcribing DNA pathogens without preset assumptions [27].
Experimental Protocol: Targeted RNA-Seq (tNGS) for Respiratory Pathogen Detection
This protocol describes a targeted NGS approach that uses probe hybridization to enrich for pathogens of interest, improving sensitivity and reducing cost compared to shotgun mNGS [27].
Step 1: Nucleic Acid Extraction from Clinical Samples
- Collect lower respiratory tract samples (e.g., bronchoalveolar lavage fluid (BALF), sputum). For sputum, mix 100 µL with a liquefaction reagent and incubate at 37°C for 15 minutes [27].
- Extract total nucleic acids (both DNA and RNA) from 400 µL of processed sample using a magnetic bead-based kit. Include a DNase digestion step if extracting RNA separately [27].
- Reverse-transcribe the extracted RNA into cDNA using a ds-cDNA synthesis kit [27].
Step 2: Library Preparation and Targeted Enrichment
- Prepare sequencing libraries from 50 ng of the extracted nucleic acid (or cDNA) using a commercial library prep kit. The protocol typically involves fragmentation, end-repair, A-tailing, and adapter ligation [27].
- For targeted enrichment, pool up to eight uniquely barcoded libraries and hybridize with a panel of biotinylated probes targeting 306 respiratory pathogens (DNA and RNA) and antimicrobial resistance (AMR) markers. Use 0.3 fmol of probes and hybridize at 60°C for 4 hours [27].
- Capture the probe-bound libraries using streptavidin beads, wash, and elute the enriched libraries at 70°C [27].
Step 3: Sequencing and Bioinformatic Analysis
- Sequence the enriched libraries on a platform such as the Gene+ Seq-100. A data size of approximately 5 million reads per sample is typically sufficient for tNGS [27].
- Use a bioinformatics pipeline to:
- Remove low-quality reads and human host sequences.
- Align non-host reads to a curated database of pathogen reference genomes.
- Identify and quantify detected pathogens, with a Limit of Detection (LOD) of 100-200 CFU/mL [27].
- Perform subtyping of viruses and identify AMR genes from the sequence data [27].
Table 2: Comparison of Pathogen Detection Methods
| Method | Principle | Throughput | Key Advantage | Key Limitation |
|---|---|---|---|---|
| Culture | Growth of microorganisms | Low | Gold standard for viability and AST | Slow (days to weeks), many pathogens unculturable [27] |
| qPCR / Multiplex PCR | Target amplification with fluorescent probes | Medium to High | Fast, sensitive, specific, low cost | Requires prior knowledge; limited multiplexing [26] [27] |
| Metagenomic NGS (mNGS) | Shotgun sequencing of all nucleic acids | Very High | Completely agnostic; discovery potential | High cost; high host background; complex data analysis [26] [27] |
| Targeted NGS (tNGS) | Probe-based enrichment prior to sequencing | Very High | High sensitivity for panel pathogens; reduces host DNA | Limited to predefined pathogens; probe design required [27] |
Application Note: Transcriptomics in Drug Development and Therapy Selection
RNA-Seq is critical for advancing personalized oncology by enabling the development of molecular signatures that predict patient response to specific therapies, such as immune checkpoint inhibitors (ICIs) [22]. By analyzing the tumor transcriptome, researchers can move beyond single-analyte tests (e.g., PD-L1 immunohistochemistry) to multi-analyte models that offer superior predictive power [22].
Experimental Protocol: Developing an RNA-Based Biomarker Classifier for Immunotherapy
This protocol is based on the development and validation of the OncoPrism test, an RNA-Seq-based assay that predicts response to anti-PD-1 therapy in head and neck squamous cell carcinoma (HNSCC) [22].
Step 1: Cohort Selection and Sample Preparation
- Identify a retrospective patient cohort with a defined clinical outcome (e.g., disease control vs. progression on anti-PD-1 monotherapy). Collect formalin-fixed, paraffin-embedded (FFPE) tumor biopsies obtained prior to treatment [22].
- Extract total RNA from FFPE tissue sections. Assess RNA quality. The QuantSeq 3' mRNA-Seq method is well-suited for this application due to its efficiency and performance with degraded RNA from FFPE samples [22].
Step 2: Targeted RNA Sequencing and Data Generation
- Construct sequencing libraries from 100 ng of total RNA using the QuantSeq FWD (3' mRNA-Seq) library prep kit. This protocol involves reverse transcription, second-strand synthesis, and PCR amplification with indexing, resulting in strand-specific libraries focused on the 3' end of polyadenylated transcripts [22].
- Pool libraries and sequence on an Illumina sequencer to a depth sufficient for robust expression quantification.
Step 3: Biomarker Classifier Training and Validation
- Process raw sequencing data to generate a normalized gene expression matrix.
- Using the training cohort (e.g., n=99 patients), apply machine learning algorithms (e.g., logistic regression) to identify a parsimonious set of features (genes) whose expression patterns are associated with clinical outcome [22]. The final OncoPrism-HNSCC model incorporated 62 immunomodulatory features [22].
- Generate an "OncoPrism Score" (0-100) that correlates with the likelihood of disease control and overall survival [22].
- Validate the classifier's performance on one or more independent validation cohorts (e.g., n=62 and n=50 patients), comparing its sensitivity, specificity, and predictive value against standard-of-care tests like PD-L1 IHC [22].
The Scientist's Toolkit: Essential Research Reagent Solutions
Table 3: Key Reagents and Tools for RNA-Seq Applications
| Item | Function/Description | Example Use Case |
|---|---|---|
| QuantSeq FWD 3' mRNA-Seq Library Prep Kit | Streamlined library prep for 3' end counting; ideal for FFPE and low-quality RNA [22]. | Generating gene expression data for predictive biomarker models in oncology [22]. |
| VAMNE Magnetic Pathogen DNA/RNA Kit | Simultaneous extraction of DNA and RNA from clinical samples [27]. | Preparing nucleic acids for agnostic pathogen detection via tNGS or mNGS [27]. |
| Targeted Enrichment Probes | Biotinylated oligonucleotide probes designed to capture and enrich sequences of specific pathogens or genes [27]. | Focusing sequencing power on a predefined panel of respiratory pathogens in tNGS [27]. |
| CIBERSORTx / EcoTyper | Computational tools for deconvoluting bulk RNA-Seq data to infer cell type abundance and states [23]. | Analyzing tumor immune microenvironment composition for biomarker discovery [23]. |
| RnaXtract Pipeline | A comprehensive, Snakemake-based workflow for processing bulk RNA-Seq data, including QC, expression, variants, and deconvolution [23]. | End-to-end analysis of RNA-Seq data for integrated machine learning studies [23]. |
Executing the Workflow: A Step-by-Step Guide from RNA to Quantitative Data
The reliability of any RNA-Seq or qPCR experiment is fundamentally dependent on the quality and integrity of the starting RNA material. In the context of drug discovery and development, where transcriptional profiling underpins critical decisions on target identification and compound efficacy, rigorous RNA isolation and quality control are not merely preliminary steps but the foundation of scientifically valid and reproducible results. Inadequate attention to these initial phases can introduce significant bias, leading to misinterpretation of gene expression data and ultimately, flawed biological conclusions [28]. This application note details the essential protocols and best practices for RNA isolation, DNase treatment, and quality control, providing a robust framework for researchers to ensure data integrity throughout the RNA-Seq to qPCR experimental workflow.
The Critical Role of RNA Quality in Downstream Analysis
The advent of updated guidelines such as MIQE 2.0 for qPCR experiments underscores the enduring necessity of methodological rigor in molecular biology [28]. These guidelines highlight a persistent issue in the literature: serious problems with experimental workflows, including poorly documented sample handling and absent assay validation, which lead to exaggerated sensitivity claims and overinterpreted fold-changes [28]. The core message is that without strict adherence to quality controls from the very beginning, the resulting data cannot be trusted.
The consequences of poor RNA quality are particularly acute in sensitive downstream applications:
- RNA-Seq: Contaminating genomic DNA (gDNA) can be mistaken for transcript reads, causing quantification biases. This is because reverse transcriptases can use DNA as a template, and short primers in library preparation protocols cannot always distinguish between RNA and DNA [29].
- qPCR: gDNA contamination can lead to false positive signals or overestimation of transcript abundance, as PCR amplification will not differentiate between cDNA and gDNA templates [28] [29].
Therefore, a meticulous approach to RNA isolation, which includes effective removal of gDNA, is a non-negotiable first step for generating reliable gene expression data.
RNA Isolation and the Imperative of DNase Treatment
The co-purification of gDNA with RNA is a common challenge during extraction. The most effective method for removing this contaminant is DNase digestion, a process using a DNA-specific endonuclease that cleaves both single- and double-stranded DNA [29]. The question of whether DNase treatment is always required depends on the sample type and extraction method, but it is a critical step for ensuring data quality in sensitive applications like RNA-Seq and qPCR.
Table 1: Sample Types that Require DNase Treatment and the Rationale
| Sample Type | Reason for DNase Treatment |
|---|---|
| Blood | Blood cells contain more DNA than RNA, making gDNA carry-over highly likely. [29] |
| FFPE Samples | Degradation and cross-linking increase the chance of DNA carry-over. [29] |
| Mechanically Disrupted Samples | Harsh disruption shears and fragments gDNA, facilitating its co-isolation with RNA. [29] |
| Bacterial Samples | High copy numbers of extra-chromosomal plasmids shift the DNA:RNA ratio. [29] |
| Degraded RNA | Fragmented, lower molecular weight DNA can be co-isolated with the RNA. [29] |
DNase Treatment Methodologies
Two primary methods are employed for DNase treatment:
- On-Column Digestion: This method is performed during the RNA extraction procedure. After the lysate is loaded onto a binding column, a DNase solution is applied directly to the column-bound nucleic acids to digest DNA. While convenient, this method can be less efficient, potentially leaving residual gDNA [29].
- In-Solution Digestion: This method is performed after RNA has been eluted. The purified RNA is mixed with DNase and reaction buffer and incubated, typically at 37°C for 15-60 minutes [29]. This is widely considered a more thorough and efficient means of eliminating gDNA [29].
Following in-solution digestion, it is critical to inactivate or remove the DNase enzyme to prevent it from degrading the primers and probes used in subsequent cDNA synthesis or PCR reactions. Clean-up methods include column- or bead-based purification, or ethanol precipitation [29]. Heat inactivation is simple but risks fragmenting the RNA and is therefore not recommended for RNA-Seq workflows [29].
Diagram 1: A decision workflow for determining the necessity of DNase treatment in RNA preparation.
Comprehensive Quality Control Assessment
Quality Control (QC) is a multi-faceted process that evaluates RNA quantity, purity, and integrity. A combination of methods should be used to build a complete picture of RNA quality.
Table 2: Methods for Assessing RNA Quality and Purity
| Method | Parameter Measured | Ideal Outcome | Notes |
|---|---|---|---|
| Spectrophotometry (NanoDrop) | Quantity & Purity (A260/A280 & A260/A230) | A260/A280 ≈ 2.0A260/A230 > 2.0 | A low A260/A280 ratio (<1.8) can indicate gDNA or protein contamination. [29] |
| Agarose Gel Electrophoresis | Integrity & gDNA contamination | Sharp ribosomal RNA bands; no high molecular weight smear. | A high molecular weight band indicates gDNA contamination (See Fig. 1A). [29] |
| Fragment Analyzer / Bioanalyzer | Integrity (RIN equivalent) | RIN > 8 for standard RNA-Seq; RIN as low as 2 may be acceptable for 3' mRNA-Seq. [30] | A high molecular weight "bump" indicates gDNA (See Fig. 1B). Provides an RNA Integrity Number (RIN). [29] |
| qPCR for Housekeeping Genes | gDNA contamination (sensitivity) | No amplification in no-RT control. | The most sensitive method to detect trace gDNA. [29] |
Detailed Protocol: RNA Extraction with Double DNase Treatment
The following protocol, adapted from a published bio-protocol, provides a robust method for ensuring DNA-free RNA, incorporating an optional second DNase treatment for challenging samples [31].
Materials and Equipment
- Sample Material (e.g., 100 mg of tissue or cell pellet)
- Commercial RNA Extraction Kit (e.g., RNeasy Kit from Qiagen)
- DNase Kit (e.g., RNase-Free DNase set from Qiagen)
- Robust DNase (e.g., TURBO DNA-free Kit from Life Technologies)
- Microcentrifuge and Magnet (for magnetic bead clean-up)
- Electrophoresis System or Bioanalyzer/Fragment Analyzer
Procedure
Initial RNA Extraction and On-Column DNase Treatment:
- Extract total RNA using your chosen commercial kit according to the manufacturer's instructions.
- Incorporate the optional on-column DNase digestion step. This involves applying a DNase I solution directly onto the silica membrane and incubating for ~15 minutes to digest bound gDNA [31].
- Complete the remaining wash steps and elute the RNA in nuclease-free water.
Second, In-Solution DNase Treatment (Optional but Recommended):
- Set up the following digestion reaction with the eluted RNA:
- Total RNA (up to 1 µg): X µL
- 10x Reaction Buffer: 1 µL
- RQ1 RNase-Free DNase (or similar): 1 µL
- Nuclease-free water to: 10 µL
- Mix gently and incubate at 37°C for 30 minutes [32].
- Terminate the reaction by adding 1 µL of DNase Stop Solution (e.g., 20 mM EGTA) and incubating at 65°C for 10 minutes to inactivate the enzyme [32].
- Set up the following digestion reaction with the eluted RNA:
Post-DNase Clean-up via Bead-Based Purification:
- Add 1.8 volumes of RNA Clean Beads (e.g., VAHTS RNA Clean Beads) to the reaction. Mix thoroughly by pipetting [32].
- Incubate at room temperature for 5 minutes.
- Place the tube on a magnet rack. Wait until the supernatant is clear, then discard it.
- With the tube on the magnet, wash the bead pellet twice with 200 µL of freshly prepared 80% ethanol. Do not disturb the pellet.
- Air-dry the pellet briefly, ensuring it does not crack.
- Remove the tube from the magnet and elute the purified, DNA-free RNA in 10-20 µL of nuclease-free water [32].
Quality Control Assessment:
- Quantify the RNA using a spectrophotometer.
- Assess integrity using a Fragment Analyzer or gel electrophoresis.
- Crucially, test for residual gDNA by running a PCR or qPCR targeting a housekeeping gene (e.g., GAPDH, ACTB) using the purified RNA as a template, omitting the reverse transcription step. No amplification should be observed after 35-40 cycles [29].
The Scientist's Toolkit: Essential Reagents and Kits
Table 3: Key Research Reagent Solutions for RNA Isolation and QC
| Item | Function | Example Products / Kits |
|---|---|---|
| Silica-Membrane RNA Kits | Efficient total RNA purification from various sample types. | RNeasy Kit (Qiagen) [31] |
| Acid-Phenol/Chloroform | Organic extraction for high-quality, high-purity RNA; can minimize gDNA carry-over. | TRIzol Reagent [29] |
| On-Column DNase | Convenient gDNA removal integrated into the extraction workflow. | RNase-Free DNase Set (Qiagen) [31] |
| Robust In-Solution DNase | Highly effective gDNA digestion for post-extraction treatment. | TURBO DNA-free Kit (Life Technologies) [31] |
| Magnetic RNA Beads | High-throughput, bead-based purification and clean-up post-DNase treatment. | VAHTS RNA Clean Beads [32] |
| RNA Integrity Kits | Microfluidic capillary electrophoresis for assigning RIN scores. | Agilent 2100 Bioanalyzer RNA kits [32] |
| Spike-in RNA Controls | Synthetic RNA added to samples to monitor technical performance and normalization in RNA-Seq. | SIRVs, ERCC RNA [33] [30] |
Integration with Downstream Workflows
The quality of the RNA prepared using these protocols directly impacts the choice and success of subsequent applications. For instance, while standard full-length RNA-Seq typically requires high-quality RNA (RIN > 8), newer 3' mRNA-Seq methods (e.g., DRUG-seq, BRB-seq) are more robust for degraded RNA (RIN as low as 2) and are ideal for high-throughput drug screening [30]. Similarly, adherence to MIQE guidelines for qPCR requires full documentation of RNA quality and the steps taken to eliminate gDNA contamination [28].
Diagram 2: Route RNA samples to suitable downstream applications based on their quality and sample type.
The initial steps of RNA isolation, DNase treatment, and quality control form the bedrock of trustworthy transcriptomic data. In the demanding context of drug discovery, where decisions have significant resource and clinical implications, failing to prioritize these procedures undermines the entire experimental pipeline. By adopting the rigorous protocols and comprehensive QC checks outlined in this application note—particularly the robust, double DNase treatment for high-risk samples—researchers can confidently generate RNA of sufficient purity and integrity to ensure that their downstream RNA-Seq and qPCR results are both biologically meaningful and reproducible.
In the continuum of gene expression analysis, Reverse Transcription Quantitative PCR (RT-qPCR) remains a cornerstone technology for the validation and precise quantification of transcriptional changes discovered through high-throughput RNA Sequencing (RNA-Seq) [1] [9]. While RNA-Seq provides an unbiased, hypothesis-free exploration of the transcriptome, capable of identifying novel transcripts and splicing variants, RT-qPCR delivers unparalleled sensitivity, specificity, and quantitative accuracy for a defined set of targets [1] [9]. This establishes a powerful complementary relationship where RNA-Seq is used for discovery and RT-qPCR provides rigorous, reproducible confirmation. The critical initial decision in this validation pipeline is whether to employ a one-step or a two-step RT-qPCR protocol. This choice profoundly impacts the workflow's efficiency, flexibility, and data quality. This application note provides a strategic comparison of these two fundamental methods, framing them within the context of a modern RNA-Seq to qPCR experimental pathway to guide researchers and drug development professionals in selecting the optimal approach for their specific application.
Strategic Comparison: One-Step vs. Two-Step RT-qPCR
The core difference between the two methods lies in the integration of the reverse transcription (RT) and quantitative PCR (qPCR) steps. In one-step RT-qPCR, both reactions occur sequentially in a single, sealed tube using a common buffer. In contrast, two-step RT-qPCR physically separates these processes; RNA is first reverse transcribed into complementary DNA (cDNA) in one reaction, and an aliquot of this cDNA is then used as the template for a subsequent qPCR amplification [34] [35] [36]. This fundamental distinction leads to a cascade of practical implications for the experimental workflow.
The table below provides a detailed, side-by-side comparison of the two methodologies to aid in strategic decision-making.
Table 1: A strategic comparison of one-step and two-step RT-qPCR protocols.
| Parameter | One-Step RT-qPCR | Two-Step RT-qPCR |
|---|---|---|
| Workflow & Process | Reverse transcription and qPCR are combined in a single tube [34]. | Reverse transcription and qPCR are performed as two separate, discrete reactions [34]. |
| Primers for RT | Gene-specific primers only [34] [36]. | Random hexamers, oligo(dT) primers, gene-specific primers, or a mixture [34] [37]. |
| Key Advantages | ||
| Key Limitations | ||
| Ideal Applications |
Quantitative Performance in Practice
A recent study developing assays for Carpione rhabdovirus (CAPRV2023) provides illustrative quantitative data. The researchers developed both one-step and two-step TaqMan qPCR assays, revealing slightly higher sensitivity for the two-step method, with detection limits of 2 copies/μL and 15 copies/μL, respectively. Both assays demonstrated high amplification efficiencies (104.7% for two-step and 102.8% for one-step) and excellent repeatability, underscoring that both methods are highly capable, with the two-step protocol offering a marginal sensitivity benefit in this specific application [39].
Experimental Protocols
One-Step RT-qPCR Protocol
The one-step protocol is designed for speed and simplicity, consolidating the entire process into a single reaction tube.
- Step 1: Reaction Setup. Combine the following components in a qPCR tube or plate on ice [37]:
- RNA template: 1 pg–1 μg of total RNA (volume should be <20% of final reaction volume).
- One-Step Master Mix: Contains reverse transcriptase, thermostable DNA polymerase, dNTPs, and reaction buffers.
- Gene-specific primers: Both forward and reverse primers for the qPCR amplification.
- Probe or dye: A sequence-specific fluorescent probe (e.g., TaqMan) or a DNA-binding dye (e.g., SYBR Green).
- Nuclease-free water to the final volume.
- Step 2: Thermal Cycling. Place the plate into a real-time PCR instrument and run the following combined program:
- Reverse Transcription: 50°C for 10–30 minutes [37].
- Initial Denaturation/Enzyme Activation: 95°C for 2–10 minutes.
- Amplification (40–50 cycles):
- Denature: 95°C for 10–15 seconds.
- Anneal/Extend: 55–65°C for 30–60 seconds (with fluorescence measurement).
- Step 3: Data Analysis. Determine Cycle threshold (Ct) values and quantify target abundance using absolute standard curves or relative quantification methods [37].
Two-Step RT-qPCR Protocol
The two-step protocol offers superior flexibility by physically separating the cDNA synthesis and amplification steps.
- Step 1: Reverse Transcription (cDNA Synthesis).
- Primer Annealing: In a nuclease-free tube, mix 1 pg–2 μg of total RNA with RT primers (random hexamers, oligo(dT), or gene-specific primers) and nuclease-free water. Incubate at 65–70°C for 5–10 minutes to denature secondary structures, then immediately place on ice [37].
- cDNA Synthesis: Add a master mix containing reverse transcriptase, dNTPs, RNase inhibitor, and reaction buffer. Mix gently and incubate at 37–50°C for 30–60 minutes [37].
- Reaction Termination: Inactivate the reverse transcriptase by heating to 70–85°C for 5–15 minutes [37]. The resulting cDNA can be stored for future use.
- Step 2: Quantitative PCR.
- Reaction Setup: In a qPCR tube, combine:
- cDNA template: 1–5 μL of the diluted or undiluted RT reaction.
- qPCR Master Mix: Contains DNA polymerase, dNTPs, MgCl₂, and optimized buffers.
- Gene-specific primers and Probe or dye.
- Nuclease-free water to the final volume.
- Thermal Cycling: Place the plate into the real-time PCR instrument and run the following program:
- Initial Denaturation: 95°C for 2–10 minutes.
- Amplification (40–50 cycles):
- Denature: 95°C for 10–15 seconds.
- Anneal/Extend: 55–65°C for 30–60 seconds (with fluorescence measurement) [38].
- A melt curve analysis is recommended following amplification if using a DNA-binding dye like SYBR Green to verify amplification product specificity [38].
- Reaction Setup: In a qPCR tube, combine:
Integration with RNA-Seq Workflows
RT-qPCR is the gold standard for validating gene expression patterns observed in RNA-Seq experiments [1]. The choice between one-step and two-step RT-qPCR in this context is strategic. When RNA-Seq identifies a long list of candidate genes, two-step RT-qPCR is strongly recommended. The resulting cDNA archive allows for the efficient screening of tens to hundreds of targets from a single, often limited, RNA sample, which is a common scenario in patient-derived samples or precious tissue specimens [34] [36]. Conversely, once a specific, smaller gene signature has been firmly established and requires routine testing across large sample sets (e.g., in clinical trial biomarker assays or high-throughput drug screening), transitioning to a one-step RT-qPCR platform can dramatically increase throughput, reduce costs, and minimize procedural variability [34] [35].
The following diagram illustrates the decision-making workflow for integrating RNA-Seq with RT-qPCR validation.
The Scientist's Toolkit: Essential Reagents & Materials
Successful RT-qPCR relies on a set of core reagents. The table below details these essential components and their functions.
Table 2: Key research reagent solutions for RT-qPCR experiments.
| Reagent / Material | Function / Description | Key Considerations |
|---|---|---|
| Reverse Transcriptase | Enzyme that catalyzes the synthesis of complementary DNA (cDNA) from an RNA template [37]. | Engineered enzymes (e.g., LunaScript) tolerate higher temperatures, improving specificity [34]. |
| Thermostable DNA Polymerase | Enzyme that amplifies the cDNA template during qPCR cycles [37]. | Must be heat-stable. Often pre-mixed with optimized buffers in master mixes [38]. |
| dNTPs | Deoxynucleoside triphosphates (dATP, dCTP, dGTP, dTTP); the building blocks for DNA synthesis [37]. | Quality and concentration are critical for efficient cDNA synthesis and PCR amplification [37]. |
| RT Primers | Initiates cDNA synthesis. Types: Random Hexamers (for all RNA), Oligo(dT) (for mRNA), Gene-Specific (for specific targets) [37]. | Choice dictates sequence representation in the cDNA pool. Two-step protocols allow any type; one-step requires gene-specific [34] [36]. |
| qPCR Primers | Sequence-specific oligonucleotides that define the target region to be amplified during qPCR [37]. | Must be designed for high specificity and efficiency (~18-25 nt, 40-60% GC, spanning exon-exon junctions) [37]. |
| Fluorescent Reporter | Allows real-time detection of amplified products. Includes DNA-binding dyes (e.g., SYBR Green) and sequence-specific probes (e.g., TaqMan) [38]. | Dyes are cost-effective but less specific. Probes (e.g., TaqMan) offer higher specificity and enable multiplexing [39] [38]. |
| RNase Inhibitor | Protects the integrity of the RNA template from degradation by ribonucleases during the RT reaction [37]. | Essential for obtaining reliable and reproducible results, especially when working with low-abundance targets. |
| MgCl₂ | Provides magnesium ions (Mg²⁺), an essential cofactor for the activity of both reverse transcriptase and DNA polymerase [37]. | Concentration is often optimized in the commercial master mix. |
There is no universally superior choice between one-step and two-step RT-qPCR; the optimal path is dictated by the specific experimental goals and constraints. One-step RT-qPCR is the tool of choice for high-throughput, targeted quantification, where speed, simplicity, and a minimized contamination risk are paramount. Two-step RT-qPCR is the unequivocal strategy for flexible, multi-target analysis, especially when working with valuable samples and when the goal is to build a reusable cDNA resource for the validation of RNA-Seq findings. By aligning the strengths of each method with the requirements of the experimental workflow—from initial RNA-Seq discovery to final, robust validation—researchers can ensure the generation of precise, reproducible, and biologically meaningful gene expression data.
RNA sequencing (RNA-Seq) has emerged as the capstone technology for genome-wide transcriptome analysis, enabling the unbiased detection of both known and novel features like transcript isoforms, gene fusions, and single nucleotide variants in a single assay [15] [40]. This powerful technique provides a comprehensive, quantitative snapshot of the dynamic cellular transcriptome with a wide dynamic range and high sensitivity [15] [41].
Despite its comprehensive nature, the transition from RNA-Seq's discovery-based findings to focused, quantitative validation is a critical step in robust experimental workflow research. Quantitative PCR (qPCR) remains the gold standard for validating gene expression results due to its simplicity, maturity, affordability, and high sensitivity [42] [10]. This application note outlines a systematic framework for selecting optimal candidate genes from RNA-Seq datasets for subsequent qPCR validation, ensuring efficient resource allocation and confirmation of key biological findings.
RNA-Seq Data Analysis: From Raw Reads to Differential Expression
The journey from raw sequencing data to a list of candidate genes involves multiple computational steps, each requiring specific tools and careful quality control. A standard RNA-Seq analysis workflow progresses through preprocessing, alignment, quantification, and differential expression analysis [43].
Preprocessing and Quality Control
The initial phase begins with assessing raw sequence data stored in FASTQ format. Quality control (QC) is crucial and employs tools like FastQC or multiQC to identify technical artifacts including adapter contamination, unusual base composition, or duplicated reads [43]. Following QC, read trimming with tools such as Trimmomatic or Cutadapt cleans the data by removing low-quality bases and adapter sequences [43].
Subsequently, cleaned reads are aligned to a reference genome or transcriptome using aligners like STAR or HISAT2, or alternatively, pseudo-aligned using faster tools like Kallisto or Salmon [43]. Post-alignment QC is then performed with tools like SAMtools or Qualimap to remove poorly aligned or multimapping reads that could artificially inflate expression counts [43]. The final preprocessing step, read quantification, uses programs such as featureCounts to generate a raw count matrix summarizing the number of reads mapped to each gene in every sample [43].
Normalization and Differential Expression Analysis
The raw count matrix cannot be directly compared between samples due to differences in sequencing depth (total number of reads per sample) and library composition (expression profile of each sample) [43]. Normalization corrects for these technical biases. Table 1 compares common normalization methods.
Table 1: Common RNA-Seq Normalization Methods
| Method | Sequencing Depth Correction | Gene Length Correction | Library Composition Correction | Suitable for DE Analysis | Notes |
|---|---|---|---|---|---|
| CPM (Counts per Million) | Yes | No | No | No | Simple scaling; heavily affected by highly expressed genes [43] |
| RPKM/FPKM | Yes | Yes | No | No | Enables within-sample comparison; not for cross-sample DE [43] |
| TPM (Transcripts per Million) | Yes | Yes | Partial | No | Preferred over RPKM/FPKM for cross-sample comparison [43] |
| median-of-ratios (DESeq2) | Yes | No | Yes | Yes | Robust to composition bias; affected by large expression shifts [43] |
| TMM (Trimmed Mean of M-values, edgeR) | Yes | No | Yes | Yes | Robust to composition bias; affected by over-trimming [43] |
For differential expression (DE) analysis, normalization methods like the median-of-ratios (used in DESeq2) and TMM (used in edgeR) are recommended as they account for library composition biases [43]. These tools apply statistical models to test for significant expression differences between experimental conditions, generating a list of differentially expressed genes (DEGs) with associated p-values and fold-changes.
A Strategic Workflow for Selecting qPCR Candidate Genes
The process of selecting candidate genes from RNA-Seq results for qPCR validation should be guided by both statistical significance and biological relevance. The following workflow diagram illustrates a systematic selection pathway.
Figure 1: A systematic workflow for selecting candidate genes for qPCR validation from RNA-Seq results.
Application of Statistical and Abundance Filters
The first step involves applying stringent statistical thresholds to the DEG list. Genes should meet both a significance criterion (e.g., adjusted p-value < 0.05 or FDR < 0.1) and a minimum fold-change threshold (e.g., ≥ 2-fold up or down) [43]. This prioritizes genes with large and statistically robust expression changes.
Next, candidate genes should be filtered by expression abundance using metrics like CPM or TPM. Very lowly expressed genes, even with high fold-changes, are challenging to validate accurately by qPCR. Setting a minimum abundance threshold (e.g., CPM ≥ 5-10 in a sufficient number of samples) ensures selected targets are reliably detectable [43].
Prioritization Based on Biological Relevance
After statistical filtering, the final and most crucial step is to prioritize genes based on their biological relevance to the research question. This involves several key considerations:
- Hypothesis-Driven Candidates: Genes directly related to the core biological hypothesis being tested.
- Pathway Enrichment: Key players in significantly enriched biological pathways or gene ontology terms.
- Novel Findings: Genes representing unexpected or novel discoveries that are central to the study's conclusions.
- Biomarker Potential: For clinical or translational studies, genes with potential as diagnostic, prognostic, or therapeutic biomarkers.
- Druggable Targets: In drug development, genes encoding proteins with known or predicted druggability.
This strategic triage ensures that qPCR validation efforts and resources are invested in the most biologically meaningful targets.
Experimental Design and qPCR Validation Protocol
The Critical Role of Experimental Design
A successful validation hinges on proper experimental design. Biological replication is non-negotiable for both RNA-Seq and qPCR experiments. While RNA-Seq with a low number of replicates might be used for discovery, validation requires sufficient power. Three replicates per condition is often considered the minimum, though more may be needed for heterogeneous samples [43]. Most critically, qPCR validation should be performed on an independent set of biological samples—not the same RNA used for sequencing. This practice validates not just the technical measurement, but the underlying biology itself [42].
Detailed qPCR Validation Protocol
RNA Extraction and Reverse Transcription
- RNA Extraction: Isolate high-quality total RNA from validation samples using a commercial kit. RNA integrity and purity are critical. Assess quality using an instrument that provides an RNA Integrity Number (RIN); a RIN > 8.0 is generally recommended for reliable results.
- Reverse Transcription: Convert equal amounts of total RNA (e.g., 1 µg) into cDNA using a high-capacity reverse transcription kit. Use a mixture of oligo(dT) and random hexamers for priming to ensure comprehensive coverage of both polyadenylated and non-polyadenylated transcripts.
Selection and Validation of Reference Genes
A cornerstone of reliable qPCR data is normalization using stably expressed reference genes. The choice of reference genes must be empirically validated for the specific experimental conditions and tissues under study [44] [45]. Table 2 lists candidate reference genes and their performance in different species, as reported in recent studies.
Table 2: Evaluation of Reference Genes for qPCR Normalization in Recent Studies
| Gene Symbol | Full Name | Species | Tissues/Conditions Tested | Reported Stability | Citation |
|---|---|---|---|---|---|
| arf1 | ADP-ribosylation factor 1 | Honeybee (A. mellifera) | Antennae, hypopharyngeal glands, brains; adult stages | Most stable overall | [45] |
| rpL32 | Ribosomal Protein L32 | Honeybee (A. mellifera) | Antennae, hypopharyngeal glands, brains; adult stages | High stability | [45] |
| IbACT | Actin | Sweet Potato (I. batatas) | Fibrous root, tuberous root, stem, leaf | Most stable | [44] |
| IbARF | ADP-ribosylation factor | Sweet Potato (I. batatas) | Fibrous root, tuberous root, stem, leaf | Highly stable | [44] |
| IbCYC | Cyclophilin | Sweet Potato (I. batatas) | Fibrous root, tuberous root, stem, leaf | Highly stable | [44] |
| α-tubulin | Alpha-Tubulin | Honeybee (A. mellifera) | Antennae, hypopharyngeal glands, brains; adult stages | Poor stability | [45] |
| GAPDH | Glyceraldehyde-3-phosphate dehydrogenase | Honeybee (A. batatas) & Sweet Potato | Various tissues | Poor stability | [44] [45] |
| IbRPL | Ribosomal Protein L | Sweet Potato (I. batatas) | Fibrous root, tuberous root, stem, leaf | Least stable | [44] |
- Reference Gene Validation: Select and test a panel of at least 3-5 candidate reference genes. Use algorithms like geNorm, NormFinder, and RefFinder to determine the most stable genes for your specific experimental system [44] [45]. Using multiple validated reference genes for normalization is considered best practice.
qPCR Setup and Data Analysis
- Assay Design: Design primer pairs with high amplification efficiency (90–105%). Amplicons should be 80–150 bp. Perform BLAST analysis to ensure primer specificity.
- qPCR Reaction: Run reactions in technical triplicates using a SYBR Green or probe-based master mix on a real-time PCR instrument. Include no-template controls (NTCs) for each primer pair.
- Data Analysis: Calculate relative gene expression using the ΔΔCq method. Normalize the Cq values of your target genes against the geometric mean of the validated reference genes. Perform appropriate statistical tests (e.g., t-test, ANOVA) to confirm significant differential expression between groups.
Essential Research Reagent Solutions
The following table summarizes key reagents and tools required for implementing the RNA-Seq to qPCR workflow.
Table 3: Essential Research Reagent Solutions for RNA-Seq to qPCR Workflow
| Reagent/Tool Category | Specific Examples | Function/Application | Considerations |
|---|---|---|---|
| RNA Extraction Kits | Column-based, phenol-chloroform | Isolation of high-integrity total RNA | Choose based on sample type (e.g., tissue, cells, FFPE) and yield requirements. |
| RNA Quality Control | Bioanalyzer, TapeStation, nanodrop | Assess RNA integrity (RIN), quantity, and purity | RIN > 8.0 is ideal for RNA-Seq. |
| RNA-Seq Library Prep | Illumina Stranded mRNA Prep, xGen RNA Library Prep Kit | Convert RNA into sequencer-compatible cDNA libraries | Select poly(A) enrichment vs. rRNA depletion; stranded vs. non-stranded. |
| Alignment Tools | STAR, HISAT2, Kallisto (pseudo-aligner) | Map sequencing reads to a reference genome/transcriptome | Balance of speed, memory usage, and accuracy. |
| Differential Expression | DESeq2, edgeR | Identify statistically significant differentially expressed genes | Uses count-based data with specific normalization (median-of-ratios, TMM). |
| qPCR Master Mix | SYBR Green, TaqMan probes | Fluorescent detection of amplified cDNA | SYBR Green is cost-effective; TaqMan offers higher specificity. |
| Reverse Transcriptase | M-MLV, High-Capacity cDNA Reverse Transcription Kits | Synthesize cDNA from RNA templates | Kits with RNase inhibitor are recommended. |
The transition from RNA-Seq discovery to qPCR validation is a critical process in gene expression analysis. By applying a systematic candidate selection strategy that combines statistical rigor, expression abundance filters, and biological prioritization, researchers can effectively focus their validation efforts. Coupling this with a robust qPCR protocol that includes independent biological replicates and validated reference genes ensures that conclusions are both technically sound and biologically relevant. This integrated RNA-Seq to qPCR pipeline significantly strengthens the credibility of gene expression findings, facilitating their impact in fundamental research, drug development, and clinical applications.
Within integrated genomics research, quantitative PCR (qPCR) serves as a critical validation tool for RNA-Sequencing (RNA-Seq) findings. The transition from high-throughput, discovery-based RNA-Seq to targeted, sensitive qPCR necessitates rigorous experimental design to ensure data accuracy and reproducibility. The cornerstone of this process is the design of highly efficient, specific primers and probes, which directly controls the sensitivity, specificity, and reliability of the qPCR assay. This document outlines essential criteria and optimized protocols for designing hydrolysis (TaqMan) probe-based qPCR assays, framed within the context of an RNA-Seq to qPCR experimental workflow. Adherence to these guidelines ensures the generation of robust, publication-quality data that can reliably confirm transcriptomic changes identified in prior sequencing efforts.
Essential Design Criteria for Primers and Probes
The performance of a qPCR assay is fundamentally dictated by the physicochemical properties of its oligonucleotides. The following parameters are critical for achieving high-efficiency amplification.
Primer Design Specifications
Primers should be designed to bind uniquely and efficiently to the target sequence derived from RNA-Seq data.
Table 1: Essential Design Criteria for qPCR Primers
| Parameter | Ideal Value/Range | Rationale & Impact |
|---|---|---|
| Length | 18–30 nucleotides [46] | Balances specificity with efficient hybridization and minimizes synthesis errors. |
| Melting Temperature (Tm) | 60–64°C; ideally 62°C [46] | Ensures optimal enzyme activity and binding. The Tms of paired primers should not differ by more than 2°C [46]. |
| GC Content | 35–65%; ideal 50% [46] | Provides sufficient sequence complexity while avoiding overly stable bonds that promote mis-priming. |
| GC Clamp | Avoid >3 G/C residues within the last 5 bases at the 3' end [47] | Prevents non-specific binding and false positives, while still promoting specific binding. |
| Specificity | Unique to target; verified via BLAST [46] | Prevents off-target amplification and ensures the assay validates the intended RNA-Seq target. |
Probe Design Specifications
The hydrolysis probe must bind specifically between the forward and reverse primers and report amplification accurately.
Table 2: Essential Design Criteria for qPCR Probes
| Parameter | Ideal Value/Range | Rationale & Impact |
|---|---|---|
| Length | 20–30 nucleotides [46] | Achieves a suitable Tm without compromising fluorescence quenching. |
| Melting Temperature (Tm) | 5–10°C higher than primers [46] | Ensures the probe is fully bound before primer extension begins, maximizing fluorescence signal. |
| GC Content | 35–65% [46] | Similar rationale as for primers; maintains stable binding without mis-hybridization. |
| 5' End Base | Avoid Guanine (G) [46] [47] | A G residue can quench the fluorophore reporter molecule, reducing signal. |
| Quenching Strategy | Double-quenched probes (e.g., with ZEN/TAO) [46] | Provides lower background and higher signal-to-noise ratios compared to single-quenched probes. |
Amplicon and Specificity Considerations
- Amplicon Length: Design amplicons to be 70–150 base pairs [46]. This length is efficiently amplified under standard cycling conditions and provides sufficient sequence space for specific primer and probe binding.
- Amplicon Location: To ensure mRNA-specific amplification and avoid false positives from genomic DNA contamination, design assays to span an exon-exon junction [46]. This is particularly crucial when validating RNA-Seq data.
- Secondary Structures: Screen all oligonucleotides for self-dimers, cross-dimers, and hairpins. The ΔG for any such structures should be weaker (more positive) than –9.0 kcal/mol [46]. These interactions can severely inhibit amplification efficiency.
- Homologous Genes: When working with species that have gene families or paralogs, design primers based on single-nucleotide polymorphisms (SNPs) unique to the target sequence to ensure specificity [48].
A Stepwise Workflow for Assay Design and Optimization
The following protocol provides a systematic, stepwise approach for transitioning from an RNA-Seq-derived target to a fully optimized qPCR assay.
Protocol: Stepwise Optimization of a qPCR Assay
Step 1: Target Identification and In Silico Design
- Target Confirmation: Identify the specific target sequence from the RNA-Seq data. Use a curated RefSeq mRNA sequence (accession prefix
NM_) for design [49]. - Primer/Probe Design: Using a reliable design tool (e.g., IDT PrimerQuest, Primer-BLAST), design oligonucleotides according to the criteria in Tables 1 and 2.
- Specificity Check: Perform an in silico PCR and BLAST analysis to ensure the primers are unique to the desired target, checking against all known homologous gene sequences [48].
Step 2: Oligonucleotide Preparation
- Synthesis: Order HPLC- or dual-PAGE-purified primers and double-quenched probes.
- Reconstitution: Resuspend oligonucleotides in nuclease-free water or TE buffer to create high-concentration (e.g., 100 µM) stocks. Dilute to working aliquots (e.g., 10 µM) to avoid freeze-thaw cycles.
Step 3: Empirical Reaction Optimization
- Primer Concentration Optimization: Test a range of final primer concentrations (e.g., 50 nM, 300 nM, 900 nM) against a fixed probe concentration (e.g., 250 nM) using a positive control cDNA sample. Select the concentration that yields the lowest Cq and highest fluorescence (ΔRn) [50].
- Annealing Temperature Optimization: Using the optimized primer concentrations, run a thermal gradient PCR with an annealing temperature range (e.g., Tm ± 5°C). The optimal temperature provides the lowest Cq and absence of non-specific amplification [49].
Step 4: Assay Validation and Efficiency Calculation
- Standard Curve Preparation: Prepare a 5- to 6-log serial dilution (e.g., 1:10 or 1:5 dilutions) of a known positive template (e.g., synthetic gBlock, high-expression cDNA). Use at least 5 data points run in triplicate [51].
- qPCR Run: Amplify the dilution series using the optimized conditions.
- Data Analysis:
- Plot the Cq values against the log10 of the template concentration.
- Perform linear regression. The R² value should be ≥ 0.98, indicating a strong linear fit [51].
- Calculate the PCR efficiency (E) using the slope of the standard curve: E = (10^(-1/slope) - 1) * 100% [52].
- The ideal efficiency is 90–110%, corresponding to a slope of -3.58 to -3.10 [51] [52].
Step 5: Specificity and Sensitivity Testing
- Specificity: Analyze amplification products via melt curve analysis (for SYBR Green) or gel electrophoresis to confirm a single product of the expected size [51].
- Sensitivity: Determine the limit of detection (LOD), defined as the lowest concentration at which 95% of positive samples are detected [51]. Include No-Template Controls (NTCs) in every run to ensure no background amplification.
The Scientist's Toolkit: Essential Reagents and Materials
Table 3: Research Reagent Solutions for qPCR Assay Development
| Item | Function/Description | Example/Criteria |
|---|---|---|
| Design Software | In silico oligonucleotide design and analysis. | IDT SciTools (OligoAnalyzer, PrimerQuest) [46], Primer-BLAST [48], NCBI BLAST. |
| qPCR Master Mix | Provides optimized buffer, enzymes, dNTPs for efficient amplification. | Commercial master mixes (e.g., NEB Luna, IDT PrimeTime). Select one compatible with your probe chemistry. |
| Double-Quenched Probes | Hydrolysis probes with internal quencher for low background and high signal. | IDT PrimeTime qPCR probes with ZEN/TAO quenchers [46]. |
| Nucleic Acid Standards | For generating standard curves to calculate amplification efficiency. | Synthetic gBlocks [50] or cloned plasmid DNA. |
| Thermal Cycler | Instrument for running qPCR with precise temperature control. | Instruments capable of 384-well formats and gradient functionality for optimization. |
Troubleshooting Common Issues in qPCR Development
- Low Efficiency (>110% or <90%): This is frequently caused by poor primer design, reaction inhibitors, or inaccurate pipetting during dilution series creation [52]. Redesign suboptimal primers and ensure sample purity (A260/A280 ~1.8-2.0).
- Poor Specificity (Multiple Bands/Melt Peaks): Results from primers binding to off-target sequences. Increase the annealing temperature and verify primer specificity using BLAST. For gene families, ensure primers target unique SNP regions [48].
- High Cq Values in No-Template Control (NTC): Indicates primer-dimer formation or contamination. Redesign primers with high 3'-complementarity and use uracil-N-glycosylase (UNG) carryover prevention systems.
- Efficiency >100%: Often a sign of polymerase inhibition in concentrated samples, which flattens the standard curve slope. Dilute the sample or re-purify the nucleic acid template to remove inhibitors [52].
The integration of RNA-Seq and qPCR technologies provides a powerful framework for genomic discovery and validation. The fidelity of this workflow is entirely dependent on the quality of the qPCR assay at its core. By adhering to the precise design criteria, following the systematic optimization protocol, and rigorously validating assay performance against the MIQE guidelines, researchers can develop robust, high-efficiency qPCR assays. This ensures that data used to confirm RNA-Seq findings is both accurate and reliable, thereby strengthening the overall conclusions of the research.
Within molecular biology workflows such as RNA-Seq and qPCR, liquid handling is a fundamental yet critical process. Manual pipetting, however, is prone to inconsistencies that can compromise data integrity and experimental reproducibility [53]. The integration of automated liquid handling systems addresses these challenges by significantly enhancing precision, throughput, and traceability [53] [54]. This application note details how automation can be strategically implemented to improve the accuracy and efficiency of liquid handling within the context of an RNA-Seq to qPCR experimental workflow, providing structured data and detailed protocols for researchers and drug development professionals.
Application Notes
Automated liquid handlers transform laboratory workflows by standardizing the repetitive, high-volume liquid transfer tasks common in genomics.
Enhancing Accuracy and Reproducibility
Automation directly mitigates common human errors associated with manual pipetting, such as inconsistent aspiration speeds, variable tip immersion depth, and forgotten mixing steps [53]. By executing protocols with digital precision, these systems ensure that volumes are dispensed identically across thousands of reactions, which is crucial for generating reproducible results in sensitive downstream applications like qPCR and RNA-Seq library preparation [53] [54]. This standardization is increasingly mandated by funders and journals as a cornerstone of rigorous and transparent science [54].
Increasing Experimental Throughput
Automated systems dramatically increase experimental capacity. Liquid handling robots can process dozens of samples in the time a technician would take to manually prepare a single plate, enabling high-throughput screening and large-scale cohort studies [53]. Furthermore, systems can operate for extended periods, including unattended runs, accelerating timelines from sample to data [55].
Economic Impact and Return on Investment (ROI)
While the initial investment in automation can be significant, ranging from a few thousand dollars for entry-level systems to six figures for high-end platforms, the return on investment is substantial [53]. ROI is realized through reduced reagent waste from failed experiments, decreased labor costs on repetitive tasks, and higher-quality data that minimizes the need for costly repeats [53]. In high-throughput screening, where a single run can cost millions in reagents, a 20% over-dispensing error could lead to hundreds of thousands of dollars in annual losses and potentially cause a "blockbuster" drug candidate to be missed as a false negative [56] [57].
Table 1: Comparison of Automated Liquid Handler Types
| System Type | Common Use Cases | Key Advantages | Throughput |
|---|---|---|---|
| Electronic Pipettes | Semi-automated tasks, flexible protocol changes | Low cost, user-friendly, improved ergonomics | Low to Medium |
| Benchtop Dispensers | Reagent prep, PCR/qPCR, ELISA | Dedicated function, consistent performance, compact size | Medium |
| Robotic Platforms | Large-scale sample prep, NGS library prep, DNA extraction | High programmability, integratable with other instruments | High |
| Custom Workcells | Fully integrated, end-to-end workflows | Maximum efficiency, full traceability, minimal manual intervention | Very High |
Table 2: Quantitative Impact of Automated Liquid Handling
| Performance Metric | Manual Pipetting | Automated Liquid Handling |
|---|---|---|
| Typical Pipetting Precision (CV) | 5-30% (varies with user and volume) | <5% (highly consistent) [54] |
| Sample Throughput (samples/day) | 100-500 (limited by fatigue) | 1,000-10,000+ (continuous operation) |
| Cross-Contamination Risk | Moderate to High | Very Low (with disposable tips) [53] |
| Data Traceability | Low (manual lab notebook entries) | High (digital log of all actions) [54] |
| Operational Cost | Higher long-term labor costs | Higher upfront cost, lower long-term, reduced waste [53] |
Experimental Protocols
Protocol: Automated RNA-Seq Library Preparation
This protocol outlines the use of a benchtop automated liquid handler for preparing RNA-Seq libraries, from purified total RNA to a pooled library ready for sequencing.
3.1.1 Research Reagent Solutions
Table 3: Essential Reagents for Automated RNA-Seq Library Prep
| Item | Function | Consideration for Automation |
|---|---|---|
| rRNA Depletion Kit | Removes abundant ribosomal RNA to enrich for mRNA [58]. | Select kits compatible with automation; riboPOOL is noted for high depletion in bacteria [58]. |
| RNA Beads | Purifies and size-selects nucleic acids. | Magnetic beads are ideal for automated magnetic module-based purification. |
| NEBNext Ultra II RNA Library Prep Kit | Provides reagents for cDNA synthesis, end repair, A-tailing, and adapter ligation [58]. | A well-established, automation-compatible kit. |
| Dual-Indexed Adapters | Ligate to fragments for amplification and provide sample-specific barcodes for multiplexing [58]. | Enables pooling of dozens of samples into one sequencing run. |
| PCR Master Mix | Amplifies the final library. | Pre-mixed solutions ensure consistency and reduce pipetting steps. |
| Nuclease-Free Water | Solvent and dilution agent. | Low viscosity ensures accurate liquid handling. |
3.1.2 Procedure
- rRNA Depletion: Transfer 100-1000 ng of total RNA to a 96-well PCR plate. Add depletion probe hybridization mix using the liquid handler. Incubate to allow probes to bind rRNA. Add degradation solution to digest RNA:DNA hybrids. Purify the enriched RNA using magnetic beads on the deck's magnetic module [58].
- RNA Fragmentation and cDNA Synthesis: Dispense fragmentation buffer to the purified RNA. Incubate to shear RNA into short fragments. Add first-strand synthesis mix with random primers to reverse-transcribe RNA into cDNA. Follow with second-strand synthesis mix to create double-stranded cDNA [58].
- Library Construction and Indexing: Transfer the double-stranded cDNA to a new plate. Add end-prep mix to repair ends and add a single 'A' base. Ligate Illumina-compatible adapters containing unique dual indexes (UDIs) to the fragments. Use a multichannel pipette mode for efficient reagent dispensing across the 96-well plate [58].
- Library Amplification and Cleanup: Add PCR master mix and index primers to the ligated product. Perform a limited-cycle PCR to amplify the library. Perform a final bead-based cleanup and size selection to remove adapter dimers and large fragments [58].
- Quality Control and Pooling: Quantify the final library concentration using a fluorometric method like Qubit. Assess library size distribution using a bioanalyzer. Based on QC data, use the liquid handler to normalise concentrations and pool equal volumes of each uniquely indexed library into a single tube for sequencing [58].
Protocol: Automated High-Throughput qPCR Setup
This protocol describes the miniaturization and automation of qPCR setup for validating RNA-Seq results, significantly reducing reagent costs and increasing throughput.
3.2.1 Research Reagent Solutions
Table 4: Essential Reagents for Automated qPCR Setup
| Item | Function | Consideration for Automation |
|---|---|---|
| qPCR Master Mix | Contains DNA polymerase, dNTPs, buffer, and fluorescent dye. | Use a pre-mixed, robust master mix to minimize pipetting error. |
| Primer Assays | Gene-specific forward and reverse primers. | Prepare as pre-aliquoted, pooled primer mixes to reduce deck footprint. |
| cDNA Template | Reverse-transcribed RNA from samples of interest. | Normalize concentration prior to setup to ensure consistent Cq values. |
| Nuclease-Free Water | Brings reaction to final volume. |
3.2.2 Procedure
- Deck Layout Preparation: Position a 384-well qPCR plate on the deck. Place reagent reservoirs containing pre-mixed qPCR master mix, nuclease-free water, and pooled primer assays in chilled positions. Position sample cDNA plates in designated locations.
- Non-Contact Dispensing: Program the liquid handler for a non-contact dispensing method. First, dispense the master mix and primer combination into each well. This method uses technologies like acoustic droplet ejection (ADE) to transfer nanoliters of liquid without tips, eliminating carryover contamination and tip costs [54].
- Template Addition: Using a fresh set of disposable tips, add a small, precise volume of each cDNA sample to the designated wells. The software will track sample identity based on the deck location.
- Sealing and Centrifugation: Once dispensing is complete, the plate is automatically or manually sealed with an optical film and briefly centrifuged to collect all liquid at the bottom of the wells and remove bubbles.
- Run qPCR: Transfer the plate to a real-time PCR instrument and run the appropriate cycling program.
Workflow Visualization
The Scientist's Toolkit
Critical Considerations for Automated Systems
- Tip Selection: Always use vendor-approved tips. Cheap bulk tips may have flash (residual plastic), variable dimensions, and poor wetting properties, leading to inaccurate volume delivery [56] [57].
- Liquid Class Optimization: The software's "liquid class" defines pipetting parameters (aspirate/dispense speed, delay, air gap). Using an incorrect liquid class for a reagent (e.g., aqueous vs. viscous) is a major error source [56] [57].
- Regular Calibration: Implement a robust schedule of regular calibration and volume verification using standardized methods (e.g., gravimetric or fluorometric) to ensure all tips are performing within specification [56] [57].
- Contamination Control: Program trailing air gaps to prevent droplet fall-off during head movement. Carefully plan tip ejection locations to avoid splatter contamination of the deck [57].
Troubleshooting Common Issues
- Poor Precision Across a Plate: Check for tip integrity and fit. Verify that the liquid class is optimized for the reagent. Ensure the deck is level.
- Low Library Yield in RNA-Seq: Confirm bead ratios during cleanups are correct on the handler. Check for incomplete elution during purification steps.
- Inconsistent qPCR Replicates: Verify that mixing steps after reagent dispensing are sufficient and homogeneous. Check for evaporation in source plates during long runs.
Solving Common Problems and Optimizing Your RNA-Seq to qPCR Pipeline
In the RNA-Seq to qPCR experimental workflow, achieving reliable and reproducible results is fundamentally dependent on the yield and quality of the genetic material at each stage. The challenge of low yield can originate from multiple sources, including degraded RNA, inefficient cDNA synthesis, and suboptimal PCR amplification. This application note provides a structured framework and detailed protocols to diagnose and address the root causes of low yield, ensuring data integrity for critical applications in research and drug development. Based on a comprehensive quality control philosophy, we outline a triaged approach targeting RNA quality, reverse transcription efficiency, and qPCR reaction optimization [59].
A Framework for Diagnosing Low Yield
A systematic approach to troubleshooting low yield is essential. The following workflow diagram outlines a step-by-step diagnostic path to identify and resolve the most common issues.
Addressing Preanalytical Variables: RNA Quality
The preanalytical phase exhibits the highest failure rates in transcriptomic workflows [59]. Compromised RNA integrity and genomic DNA (gDNA) contamination are primary culpards for low yield and skewed results.
Critical Quality Metrics and Thresholds
The following table summarizes the key quality control metrics for RNA and the recommended actions for suboptimal samples.
Table 1: RNA Quality Control Metrics and Corrective Actions
| Quality Metric | Optimal Value/Range | Suboptimal Indication | Corrective Action |
|---|---|---|---|
| RNA Integrity Number (RIN) | RIN ≥ 8.0 [59] | RIN < 7.0 indicates significant degradation. | Use a new RNA sample; optimize collection and storage conditions. |
| Genomic DNA (gDNA) Contamination | No visible band on agarose gel post-DNase treatment. | Smear or band in no-RT control. | Implement a secondary DNase treatment step [59]. |
| 260/280 Ratio | ~2.0 (RNA) | Significantly lower than 2.0 suggests protein contamination. | Repeat phenol-chloroform extraction. |
| 260/230 Ratio | 2.0 - 2.2 | Lower values indicate salt or solvent carryover. | Repeat ethanol precipitation with fresh 70% ethanol. |
Protocol: Secondary DNase Treatment to Reduce gDNA
Objective: To eliminate persistent gDNA contamination that can lead to overestimation of cDNA yield and false-positive signals in qPCR.
Reagents:
- DNase I (RNase-free)
- 10x DNase Reaction Buffer
- EDTA (50 mM)
Method:
- To up to 5 µg of RNA in a nuclease-free tube, add:
- 5 µL of 10x DNase Reaction Buffer
- 2 µL of DNase I (1 U/µL)
- Nuclease-free water to a final volume of 50 µL.
- Mix gently and incubate at 37°C for 30 minutes.
- Add 5 µL of 50 mM EDTA to stop the reaction.
- Incubate at 65°C for 10 minutes to inactivate the DNase I.
- Purify the RNA using a standard ethanol precipitation or silica-column-based clean-up kit.
- Verification: Run the treated RNA on an agarose gel alongside the untreated sample. A successful treatment will remove the high-molecular-weight genomic DNA smear. Always include a no-RT control in subsequent cDNA synthesis to confirm the absence of gDNA amplification.
Optimizing cDNA Synthesis Efficiency
The reverse transcription (RT) step is a major bottleneck. The choice of primer and enzyme significantly impacts cDNA yield, library complexity, and the accurate representation of all transcripts.
The Impact of Reverse Transcription Primers
A recent systematic investigation compared random primers of different lengths for cDNA synthesis from human brain total RNA. The results demonstrate that primer length drastically affects gene detection rates.
Table 2: Effect of Random Primer Length on cDNA Synthesis Efficiency
| Primer Length | Relative Gene Detection Efficiency | Optimal For | Key Finding |
|---|---|---|---|
| Random 6mer | Low (Baseline) | Short RNAs | Commonly used but suboptimal for overall transcriptome coverage. |
| Random 12mer | Medium | - | Better than 6mer, but less efficient than 18mer. |
| Random 18mer | High | Long transcripts (mRNA, lncRNA), high-GC content targets | Detected significantly more genes, especially lowly expressed and long transcripts [60]. |
| Random 24mer | Medium | - | Similar to 12mer, less efficient than 18mer. |
Protocol: cDNA Synthesis with an Optimized 18-mer Random Primer
Objective: To maximize cDNA yield and transcriptome coverage, particularly for long and low-abundance transcripts.
Reagents:
- SuperScript II Reverse Transcriptase (or equivalent) [61]
- 5x RT Buffer
- 100 mM DTT
- 10 mM dNTP Mix
- Random 18-mer Primers (50 µM stock)
- RNase Inhibitor
- Nuclease-free water
Method:
- Combine 1 µg of high-quality (RIN ≥ 8), DNase-treated RNA and 2 µL of random 18-mer primers (50 µM) in a nuclease-free tube.
- Add nuclease-free water to a final volume of 13 µL.
- Incubate at 65°C for 5 minutes to denature secondary structures, then immediately place on ice.
- Prepare the master mix on ice:
- 4 µL of 5x RT Buffer
- 1 µL of 100 mM DTT
- 1 µL of 10 mM dNTP Mix
- 0.5 µL of RNase Inhibitor (40 U/µL)
- 0.5 µL of SuperScript II RT (200 U/µL)
- Add the 7 µL master mix to the denatured RNA-primer mixture, mixing gently by pipetting.
- Run the following thermocycler program:
- Primer Annealing: 25°C for 10 minutes.
- Reverse Transcription: 42°C for 50 minutes.
- Enzyme Inactivation: 70°C for 15 minutes.
- Dilute the resulting cDNA 1:5 to 1:10 with nuclease-free water before use in qPCR.
Verifying and Improving qPCR Reaction Efficiency
An optimized qPCR assay is critical for accurate gene expression quantification. Inefficient amplification leads to underestimated expression levels and poor sensitivity.
Protocol: Determining qPCR Amplification Efficiency
Objective: To calculate the amplification efficiency of a qPCR assay using a serial dilution of cDNA and establish a robust standard curve [62].
Reagents:
- KiCqStart SYBR Green ReadyMix (or equivalent)
- Forward and Reverse Primers (10 µM stock)
- cDNA template from the optimized synthesis (Section 4.2)
- PCR-grade water
Method:
- Prepare cDNA Dilutions: Create a 1:10 serial dilution of your cDNA sample across at least 5 points (e.g., undiluted, 1:10, 1:100, 1:1000, 1:10,000). For finer resolution, a 1:2 dilution series can be run in parallel.
- Prepare Master Mix: For each reaction, combine:
- 10 µL of 2x SYBR Green ReadyMix
- 0.8 µL of Forward Primer (10 µM)
- 0.8 µL of Reverse Primer (10 µM)
- 6.4 µL of PCR-grade water
- Total Master Mix per reaction: 18 µL
- Plate Setup: Aliquot 18 µL of master mix into each qPCR well. Add 2 µL of the corresponding cDNA dilution to each well. Each dilution should be run in duplicate or triplicate.
- qPCR Run: Use the following two-step cycling protocol:
- Initial Denaturation: 95°C for 3 minutes.
- 40 Cycles:
- Denature: 95°C for 15 seconds.
- Anneal/Extend: 60°C for 30 seconds (acquire fluorescence).
- Dissociation Curve: 95°C for 15 seconds, 60°C for 1 minute, then 95°C for 15 seconds.
Efficiency Calculation:
- The qPCR instrument software will generate a standard curve by plotting the Cq (Quantification Cycle) value against the log of the template concentration.
- From the linear regression of the standard curve, obtain the slope.
- Calculate the amplification efficiency (E) using the formula:
- E = [10^(-1/slope) - 1] x 100%
- An ideal reaction with 100% efficiency, where the amount of product doubles every cycle, has a slope of -3.32. In practice, an efficiency between 90% and 105% (slope between -3.58 and -3.10) is acceptable.
The Scientist's Toolkit: Essential Reagents for Success
Table 3: Key Research Reagent Solutions for the RNA-to-qPCR Workflow
| Reagent / Kit | Function / Application | Key Consideration |
|---|---|---|
| DNase I (RNase-free) | Degrades contaminating genomic DNA to prevent false-positive results in qPCR. | Essential for samples with high gDNA burden. Verify complete inactivation post-treatment [59]. |
| SuperScript II Reverse Transcriptase | Reverse transcribes RNA into first-strand cDNA. | Noted for high sensitivity and ability to detect single RNA molecules, ideal for low-abundance targets [63] [61]. |
| Random 18-mer Primers | Primes cDNA synthesis across the entire transcriptome, independent of poly-A tails. | Superior to 6-mers for detecting long transcripts and lowly expressed genes [60]. |
| SYBR Green qPCR ReadyMix | Contains all components (polymerase, dNTPs, buffer, dye) for quantitative PCR. | Opt for mixes with robust performance and low batch-to-batch variability. Includes a passive reference dye. |
| RNase Inhibitor | Protects RNA templates from degradation during reverse transcription. | Critical for working with low-input or sensitive RNA samples. |
A methodical approach to troubleshooting the RNA-to-qPCR pipeline is fundamental for generating reliable gene expression data. By rigorously monitoring RNA quality, adopting optimized cDNA synthesis protocols with longer random primers, and validating qPCR assay efficiency, researchers can overcome the pervasive challenge of low yield. Implementing the application notes and detailed protocols outlined here will enhance the confidence, accuracy, and translational potential of findings in both basic research and drug development programs.
Eliminating Non-Specific Amplification and Primer-Dimer Artifacts
Non-specific amplification and primer-dimer formation represent significant challenges in polymerase chain reaction (PCR)-based methodologies, particularly in the context of validating RNA-sequencing (RNA-seq) data with quantitative PCR (qPCR). These artifacts compete for essential PCR reagents, reduce amplification efficiency, and compromise the accuracy of gene expression quantification [64] [65]. The occurrence of these non-specific products is frequently determined by template concentration, non-template background, and primer concentration, highlighting the need for rigorously optimized protocols [65]. This application note details evidence-based strategies and detailed protocols to identify, prevent, and eliminate these artifacts, thereby ensuring the reliability of data in the RNA-seq to qPCR experimental workflow.
Understanding the Artifacts
Primer Dimers
Primer dimers are short, amplifiable artifacts formed by the hybridization of two primers. They typically produce amplicons of 20–60 base pairs, visible on an electrophoresis gel as a bright band at the bottom [64]. They form through various mechanisms, often involving the two primer sequences joining end-to-end. When primer dimers join with other dimers, they can form larger primer multimers, which exhibit a ladder-like pattern on a gel that can severely interfere with the interpretation of results and subsequent sequencing applications [64].
Broader Non-Specific Amplification
This category includes the amplification of any non-target DNA. It can manifest as smears or discrete bands of unexpected sizes on an electrophoresis gel [64]. Smears indicate the random amplification of DNA fragments of various lengths, often caused by highly fragmented template DNA, degraded primers, or an excessively low annealing temperature [64]. Non-specific amplicons can outcompete target amplicons, especially when they are shorter and thus amplified more efficiently, leading to failed experiments or untrustworthy results [64].
Experimental Protocols for Artifact Elimination
Protocol 1: Primer and Probe Design with SAMRS
Principle: Incorporating Self-Avoiding Molecular Recognition Systems (SAMRS) nucleobases into primers. SAMRS components (a, g, c, t) pair normally with their complementary standard nucleotides (T, C, G, A, respectively) but form weak pairs with other SAMRS components. This strategic modification significantly reduces primer-primer interactions, thereby preventing dimer formation while maintaining priming efficiency [66].
Detailed Methodology:
- Primer Design:
- Strategic Placement: SAMRS components should be placed at the 3'-end of the primer or in regions identified in silico as being involved in primer-primer complementarity [66].
- Optimal Number: The number of SAMRS modifications must be balanced. While more modifications reduce primer-dimer formation, they can also weaken the primer-target binding energy due to SAMRS:standard pairs having only two hydrogen bonds. A heuristic approach is recommended, guided by melting temperature (Tm) studies [66].
- Oligonucleotide Synthesis:
- PCR Setup:
- Use a hot-start polymerase, which is activated only at high temperatures, to prevent low-temperature mispriming and extension during reaction setup [66] [65].
- The PCR conditions (annealing temperature, MgCl₂ concentration) should be re-optimized for the SAMRS-modified primers, as their Tm may differ from unmodified primers.
Protocol 2: Optimization of Reaction Components and Cycling Conditions
Principle: Systematically adjust critical reaction parameters to favor specific target amplification over non-target artifacts [65].
Detailed Methodology:
- Reaction Setup:
- Concentration Optimization (Checkerboard Titration):
- Perform a checkerboard titration experiment to find the optimal balance between primer, template, and non-template cDNA concentrations [65].
- Primer Concentration: Test a range of final concentrations, typically from 0.1 µM to 1.0 µM. For digital PCR, higher concentrations (0.5–0.9 µM) can improve fluorescence amplitude and cluster separation [67].
- Template Input: Use a dilution series of the cDNA to determine the optimal input that minimizes artifacts while maintaining robust target amplification. High template concentrations can increase the chance of self-priming, while very low concentrations favor artifact formation [64] [65].
- Thermal Cycling Optimization:
- Annealing Temperature Gradient: Run a thermal gradient PCR to determine the highest possible annealing temperature that still yields a strong, specific product.
- Post-Amplification Heating: Include a short heating step (e.g., 5-15 seconds) at a temperature above the Tm of primer-dimers but below the Tm of the specific product after the elongation phase. This denatures primer-dimers and prevents their fluorescence from being measured in qPCR assays that use intercalating dyes, leading to more accurate Cq values [65].
Protocol 3: Digital PCR (dPCR) Troubleshooting for Artifact Prevention
Principle: dPCR partitions a sample into thousands of individual reactions, allowing for the identification and quantification of specific targets based on the fluorescence of each partition. Proper sample and assay preparation are critical to avoid artifacts that impair partition classification [67].
Detailed Methodology:
- Sample Integrity and Purity:
- Use high-purity nucleic acid templates. Contaminants like salts, alcohols, humic acids, and phenolic compounds can inhibit polymerase activity, reduce amplification efficiency, and quench fluorescence, leading to poor discrimination between positive and negative partitions [67].
- For long or complex templates (e.g., high-molecular-weight genomic DNA, supercoiled plasmids, or linked gene copies), perform restriction digestion to fragment the DNA. This ensures random partitioning and prevents over-quantification. The restriction enzyme must not cut within the amplicon sequence itself [67].
- Assay Design and Validation:
- When using DNA-binding dyes like EvaGreen, high PCR specificity is essential, as any non-specific product or primer dimer will generate a fluorescent signal and create separate, confounding clusters during analysis [67].
- For probe-based assays, ensure the fluorophore and quencher are a compatible pair. Overlap in their emission spectra can create background noise, adversely affecting cluster separation [67].
Table 1: Summary of Critical Experimental Parameters for Artifact Suppression
| Parameter | Objective | Recommended Range / Action |
|---|---|---|
| Primer Design | Minimize self-complementarity & primer-dimer formation | Use SAMRS components at 3'-end; ΔG of hetero-dimer ≤ -9 kcal/mol; avoid extendable 3' ends in dimers [66] [65] |
| Primer Concentration | Balance specificity and sensitivity | 0.1 - 1.0 µM (qPCR); 0.5 - 0.9 µM (dPCR) [67] [65] |
| Annealing Temperature | Maximize stringency for specific binding | Determine via gradient PCR; use highest possible Tm [64] |
| Template Quality | Ensure efficient amplification & partitioning | Use high-purity DNA/RNA; restrict digest large/complex templates for dPCR [67] |
| Polymerase Type | Prevent pre-PCR mispriming | Use hot-start formulations [66] [65] |
| Post-PCR Analysis | Avoid detecting primer-dimer fluorescence | Include a heating step above dimer Tm but below product Tm before signal acquisition [65] |
The Scientist's Toolkit: Research Reagent Solutions
Table 2: Essential Reagents and Kits for Reliable PCR
| Reagent / Kit | Function / Application | Key Features |
|---|---|---|
| SAMRS Phosphoramidites [66] | Synthesis of SAMRS-modified oligonucleotides | Enables creation of primers with reduced primer-primer interactions. |
| Hot-Start DNA Polymerase [66] [65] | High-fidelity PCR amplification | Prevents enzymatic activity until initial denaturation step, reducing artifacts. |
| dPCR System (e.g., QIAcuity) [67] | Absolute nucleic acid quantification | Partitions samples to enable target quantification without a standard curve, resistant to inhibitors. |
| Nucleic Acid Purification Kits [67] | Isolation of pure DNA/RNA from various samples | Removes contaminants (proteins, salts, alcohols) that inhibit polymerization and quench fluorescence. |
| Restriction Enzymes [67] | Preparation of template for dPCR | Reduces viscosity and fragments large DNA for even partitioning; linearizes plasmids. |
| EvaGreen / SYBR Green I Dye [67] [65] | Detection of double-stranded DNA in qPCR/dPCR | Intercalating dyes for detecting any dsDNA; require high specificity to avoid nonspecific signal. |
| TaqMan Hydrolysis Probes [67] | Sequence-specific detection in qPCR/dPCR | Provides higher specificity than intercalating dyes; requires careful design of reporter-quencher pair. |
| Ion-Exchange HPLC Columns [66] | Purification of synthesized oligonucleotides | Ensures high purity (>85-90%) of SAMRS-containing primers for reliable performance. |
Workflow and Pathway Visualizations
Experimental Workflow for RNA-seq to qPCR Validation
The following diagram outlines a robust workflow for validating RNA-seq results using qPCR, integrating key steps to prevent artifacts.
Diagram 1: RNA-seq Validation Workflow with Checkpoints.
Mechanism of Hot-Start Polymerase in Artifact Suppression
This diagram illustrates how hot-start polymerases prevent the formation of non-specific products during the critical reaction setup phase.
Diagram 2: Hot-Start vs Standard Polymerase Mechanism.
Minimizing Ct Value Variations through Pipetting Precision and Technical Replicates
In the context of validating RNA-Seq data through qPCR, the reproducibility and accuracy of results are paramount. The Cycle threshold (Ct) value, also known as quantification cycle (Cq), is a fundamental output of qPCR, representing the PCR cycle number at which a sample's reaction crosses a fluorescence threshold, indicating detection of the target nucleic acid [68]. These values are inversely proportional to the initial amount of target nucleic acid; lower Ct values indicate higher target amounts, while higher Ct values suggest lower amounts or potential issues in the reaction [68]. Technical variability, particularly from pipetting inaccuracy, is a major contributor to Ct value variation that can confound the biological interpretation of gene expression data. This application note details methodologies to minimize such variability through precision pipetting and appropriate replication strategies, ensuring that qPCR data used to confirm RNA-Seq findings is both reliable and reproducible.
Understanding Ct Values and Their Significance
The Ct value is a relative measure of the concentration of the target in the PCR reaction [69]. Its determination relies on accurate setting of two key parameters: the baseline, which is the background fluorescence level during the first 5-15 cycles, and the threshold, which is a fluorescence intensity set sufficiently above the baseline to indicate a significant increase in signal from amplified product [70] [69]. A sample's amplification curve intersecting this threshold defines its Ct value [68].
The Impact of Technical Variation
In an ideal qPCR, the amount of amplified product is defined by: Amplification product amount = Initial template amount × (1 + En)^number of cycles [71]. Because this is an exponential reaction, slight differences in the initial reaction components—caused by pipetting inaccuracies—are amplified with each cycle, leading to significant Ct value variations between technical replicates [72]. This variability directly impacts the statistical confidence of the results and can lead to erroneous conclusions when comparing gene expression levels between samples.
Table 1: Interpretation of Ct Value Ranges and Implications
| Ct Value Range | Interpretation | Recommended Action |
|---|---|---|
| < 15 | May be within baseline phase; very high template concentration [71]. | Check template dilution factor; may require less input template [71]. |
| 15 - 29 | Ideal range; indicates high target amount [68]. | Proceed with standard analysis. |
| 30 - 35 | Moderate to low target amount [71]. | Ensure high pipetting precision; stochastic effects may increase variability [72]. |
| > 35 | Very low target amount; theoretically less than 1 initial copy; statistically insignificant [71]. | Results may be unreliable; increase input template or investigate inhibition [71] [68]. |
Protocols for Minimizing Variation
Protocol 1: Precision Pipetting Technique
Objective: To eliminate technical variability introduced by the researcher during reaction setup.
- Step 1: Pre-Pipetting Preparation. Eliminate distractions and ensure a focused workspace. Banish all distractions for a clear mind while pipetting [72].
- Step 2: Master Mix Preparation. Create a single, homogeneous Master Mix containing all common reaction components (e.g., polymerase, dNTPs, buffer, primers, passive reference dye). This minimizes the number of pipetting steps and tube-to-tube variability [72]. For a 20 µL final reaction volume, prepare a master mix for 11 µL per reaction plus excess to account for pipetting dead volume.
- Step 3: Utilize Reverse Pipetting. For viscous solutions like SYBR-Green master mixes, which often contain glycerol, use the reverse pipetting technique. This pre-wets the pipette tip and ensures more accurate dispensing [72].
- Step 4: Systematic Plate Loading. Implement a consistent strategy for loading samples. For example, load the master mix in replicates by columns, then load diluted cDNA across the rows. Always pipette control replicates before experimental ones and organize primer sets in a pre-determined order (e.g., alphabetically) to prevent errors [72].
- Step 5: Use Appropriate Tools. Employ properly calibrated pipettes. Use multichannel or multi-dispensing pipettes for improved efficiency and consistency, as their accuracy has been greatly improved [72].
Protocol 2: Implementing Technical Replication
Objective: To account for residual technical variability and identify outliers, ensuring data robustness.
- Step 1: Determine Replication Level. Perform a minimum of three technical replicates per sample-primer combination. This allows for statistical identification and removal of outliers without losing the entire data point [72].
- Step 2: Distribute Replicates. When possible, distribute technical replicates across different plate locations to control for potential well-specific effects within the qPCR instrument.
- Step 3: Analyze Replicate Consistency. After the run, calculate the standard deviation (SD) of the Ct values for each set of technical replicates. A low SD indicates high precision. Exclude any replicate that is a clear outlier (e.g., using Grubbs' test) before proceeding to average the Ct values for downstream analysis.
Table 2: Experimental Design for Reliable qPCR Data Generation
| Experimental Component | Minimum Requirement | Best Practice | Function |
|---|---|---|---|
| Technical Replicates | 2 per sample | 3 per sample | Accounts for pipetting and plate-based variability; enables outlier detection [72]. |
| Biological Replicates | 3 per condition | 5-6 per condition | Accounts for natural biological variation within a population. |
| No Template Control (NTC) | 1 per primer set | 1 per plate | Detects contamination or primer-dimer formation. |
| Standard Curve (for Efficiency) | 5-point, 10-fold dilution | 5-point, 10-fold dilution in triplicate | Determines primer amplification efficiency for robust relative quantification [69]. |
Data Analysis and Quality Control
Assessing Pipetting Precision from Raw Data
The primary metric for assessing pipetting precision is the standard deviation (SD) or standard error (SE) of the Ct values across technical replicates. A low SD (e.g., < 0.15 cycles) between technical replicates indicates high pipetting precision and a well-prepared reaction mix [72]. High SD values signal potential issues with pipetting technique, reagent mixing, or reaction inhibitors.
The Scientist's Toolkit: Essential Reagents and Equipment
Table 3: Research Reagent Solutions for Precision qPCR
| Item | Function | Considerations for Minimizing Variation |
|---|---|---|
| High-Quality Master Mix | Provides polymerase, dNTPs, buffer, and fluorescent dye. | Use a commercial mix for consistency. Check for viscosity; requires reverse pipetting [72]. |
| Passive Reference Dye (e.g., ROX) | Normalizes for well-to-well variations in volume and fluorescence detection. | Lower amounts of ROX can produce higher fluorescence values, affecting Ct [68]. |
| Calibrated Pipettes | Accurate and precise dispensing of liquids. | Must be regularly maintained and calibrated every 6-12 months [72]. |
| Multichannel / Dispensing Pipettes | Streamlines plate setup and improves consistency. | Modern versions are highly accurate; ideal for master mix and cDNA distribution [72]. |
| qPCR Plates and Seals | Reaction vessel. | Use optically clear seals; ensure a tight seal to prevent evaporation. |
Advanced Workflow: Integrating with RNA-Seq Validation
When qPCR is used to validate RNA-Seq results, the entire workflow from RNA integrity to final data analysis must be controlled.
Minimizing Ct value variation is not merely a technical exercise but a fundamental requirement for generating reliable qPCR data, especially in the critical context of RNA-Seq validation. By implementing rigorous pipetting protocols, employing a strategic replication strategy, and adhering to strict quality control measures, researchers can significantly reduce technical noise. This ensures that observed differences in gene expression are reflective of true biological changes, thereby bolstering the integrity and reproducibility of research outcomes in drug development and scientific discovery.
Optimizing Primer Concentrations and Avoiding Stable Secondary Structures
Within the framework of an RNA-Seq to qPCR experimental workflow, the transition from large-scale, discovery-based sequencing to precise, targeted quantification hinges on the performance of the qPCR assay itself. Two of the most critical determinants of a robust and reliable qPCR result are the optimization of primer concentrations and the avoidance of stable secondary structures in both the primers and the target RNA [73] [74]. Failures in these areas directly compromise the exquisite specificity and sensitivity that make qPCR uniquely powerful for validation [74]. Suboptimal primer concentrations can lead to spurious amplification and reduced efficiency, while secondary structures can block primer access to binding sites, leading to inaccurate quantification or complete amplification failure [73] [75]. This application note provides detailed protocols and data-driven guidelines to navigate these challenges, ensuring that qPCR data generated for thesis research meets the highest standards of reproducibility and accuracy.
Quantitative Design Parameters for Primers and Probes
Adherence to established quantitative parameters during the initial design phase is the first and most cost-effective step toward a successful assay. The following tables summarize the key characteristics for primers and hydrolysis probes as recommended by leading industrial and academic sources [46] [47] [76].
Table 1: Optimal Design Characteristics for PCR Primers
| Parameter | Ideal Range | Rationale & Notes |
|---|---|---|
| Length | 18–30 nucleotides [46] | Shorter primers (<28 bp) may increase primer-dimer formation [76]. |
| Melting Temperature (Tm) | 60–64°C [46]; ideally 58–65°C [76] | The Tm of the two primers should not differ by more than 2–3°C [46] [73]. |
| GC Content | 40–60% [47] [76] [75] | Provides sequence complexity while minimizing overly stable binding. |
| GC Clamp | Avoid >3 G/C in the last 5 bases at 3' end [73] [47] | Prevents non-specific binding and false positives. |
| Self-Complementarity | ΔG > -9.0 kcal/mol [46] | Weaker (more positive) ΔG values prevent hairpins and self-dimers. |
Table 2: Optimal Design Characteristics for qPCR Probes
| Parameter | Ideal Range | Rationale & Notes |
|---|---|---|
| Length | 15–30 nucleotides [46] [75] | Ensures suitable Tm without compromising quenching efficiency. |
| Melting Temperature (Tm) | 5–10°C higher than primers [46] [75] | Ensures probe binds before primers. |
| GC Content | 40–60% [75] | Similar rationale as for primers. |
| 5' End Base | Avoid Guanine (G) [46] [75] | A 5' G can quench the fluorophore reporter. |
| Quenching Strategy | Double-quenched probes recommended [46] | Probes with internal quenchers (e.g., ZEN, TAO) yield lower background and higher signal. |
Experimental Protocols for Optimization
Protocol 1: Primer Concentration Optimization
This protocol is essential for achieving maximum amplification efficiency and specificity.
- Preparation of Primer Stocks: Resuspend lyophilized primers to a stock concentration of 100 µM in nuclease-free water or TE buffer.
- Reaction Setup: Set up a series of qPCR reactions with a constant amount of cDNA template. Vary the concentrations of the forward and reverse primers symmetrically. A standard starting range is 100 nM to 900 nM [75].
- Example Dilution Series: 100 nM, 200 nM, 300 nM, 400 nM, 500 nM.
- qPCR Run: Perform the qPCR run using standard cycling conditions for your system.
- Data Analysis: Analyze the results based on Ct value and amplification efficiency.
- The optimal concentration is the lowest one that yields the lowest Ct value and highest amplification efficiency (90–110%) without promoting nonspecific amplification or primer-dimer formation, which is often visible as a signal in the no-template control (NTC) or in the melt curve as a peak below the main amplicon Tm [73] [76]. A common optimal final concentration is 400 nM for each primer [75].
Protocol 2: Assessing and Overcoming Secondary Structures
Stable secondary structures in the template or primers can severely impede polymerase access. This protocol outlines a stepwise approach to identify and mitigate these issues.
- In silico Analysis:
- Empirical Validation with Temperature Gradient PCR:
- If secondary structures are suspected, perform a gradient qPCR with an annealing temperature range that spans 5–10°C above and below the calculated Tm.
- A significant shift in efficiency or Ct across the temperature gradient can indicate structural interference.
- Experimental Mitigation:
- Redesign Primers: The most reliable solution is to redesign primers to bind to a different, structurally unencumbered region of the target sequence [73].
- Thermostable Polymerases and Additives: Use polymerases capable of higher elongation temperatures. Incorporate additives like DMSO or betaine into the reaction mix, which can help denature stable GC-rich structures [76].
- One-Step RT-qPCR with Elevated RT Temperature: For one-step protocols, if the reverse transcriptase is thermostable, increase the reverse transcription temperature to 60°C (from a typical 55°C) to denature RNA secondary structures during cDNA synthesis [75].
Protocol 3: Validation of Assay Performance
Before using an assay for experimental data collection, its performance must be rigorously validated.
- Standard Curve and Efficiency Calculation:
- Prepare a serial dilution (at least 1:10 dilutions) of your template (cDNA or in vitro transcript) over a range of 3-5 logs.
- Run qPCR on all dilution points in replicate.
- Plot the Log10 of the initial template quantity against the Ct value to generate a standard curve.
- Calculate the PCR efficiency (E) using the slope of the standard curve: Efficiency (%) = (10^(-1/slope) - 1) x 100 [77]. An ideal assay has an efficiency between 90% and 110% with an R² value of ≥0.99 [77] [75].
- Specificity Check:
Workflow Visualization
The following diagram illustrates the logical workflow for designing and optimizing a qPCR assay, integrating the protocols described above to achieve a validated assay ready for gene expression quantification.
Diagram 1: A logical workflow for qPCR assay design and optimization.
The Scientist's Toolkit: Research Reagent Solutions
The following table lists essential materials and tools required for the successful implementation of the optimization protocols described in this note.
Table 3: Essential Reagents and Tools for qPCR Optimization
| Item | Function / Description | Example Products / Tools |
|---|---|---|
| High-Quality RNA Isolation Kit | To obtain pure, intact RNA free of genomic DNA and inhibitors, which is critical for accurate cDNA synthesis and downstream qPCR. | innuPREP RNA Kit [76] |
| Robust RT-qPCR Master Mix | A ready-to-use mix containing buffer, dNTPs, thermostable polymerase, and reverse transcriptase. May include warm-start technology and passive reference dye. | Luna Universal One-Step RT-qPCR Kit [75] |
| Optical qPCR Plates & Seals | Plates with white wells reduce signal crosstalk; clear seals are optimal for fluorescence detection. | White well plates with ultra-clear seals [76] |
| Primer Design & Analysis Software | In-silico tools for designing primers and checking for secondary structures, specificity, and Tm. | Primer-BLAST [78], IDT OligoAnalyzer [46], Primer3 [76] |
| Real-Time PCR System with Gradient | A thermocycler capable of detecting fluorescence in real-time. A temperature gradient function is invaluable for optimizing annealing temperatures. | qTOWERiris [76] |
| DNase I Treatment | Removal of contaminating genomic DNA from RNA samples prior to reverse transcription. | DNase I (RNase-free) [46] [75] |
RNA sequencing (RNA-Seq) has become the gold standard for whole-transcriptome gene expression quantification, providing an unbiased view of the transcriptome with a broad dynamic range [79]. However, its application to low-input and formalin-fixed paraffin-embedded (FFPE) derived RNA presents significant challenges. Archival FFPE tissues represent an invaluable resource in biomedical research due to their widespread availability and long-term storage capabilities at room temperature [80]. Unfortunately, the process of formalin fixation and paraffin embedding damages RNA, resulting in fragmented, chemically modified, and degraded RNA that is suboptimal for gene expression profiling [81] [80]. Furthermore, in both clinical and research settings, sample availability is often limited, necessitating protocols that can work with nanogram quantities of input RNA. These challenges demand optimized strategies for library preparation, specialized normalization methods, and appropriate validation techniques to ensure data reliability. This article outlines practical strategies and protocols for successful RNA-Seq analysis of these challenging samples within the context of a complete RNA-Seq to qPCR experimental workflow.
RNA-Seq Library Preparation Strategies for Challenging Samples
Comparison of Library Preparation Technologies
Selecting the appropriate library preparation method is crucial for successful transcriptome analysis from challenging samples. The choice depends on the specific research question, required data type (quantitative vs. qualitative), and RNA quality. The table below compares the major approaches.
Table 1: Comparison of RNA-Seq Library Preparation Methods for Challenging Samples
| Method | Principle | Optimal Use Cases | Advantages | Disadvantages |
|---|---|---|---|---|
| Whole Transcriptome (Ribo-Depletion) | Random priming and ribosomal RNA depletion [82] | FFPE samples; discovery of novel transcripts, isoforms, fusion genes, and non-coding RNAs [82] [83] | Comprehensive view of coding and non-coding RNA; identifies splicing events and novel features | Requires more input RNA; longer workflow; higher sequencing depth needed [82] |
| 3' mRNA-Seq (e.g., QuantSeq) | Oligo(dT) priming to target polyadenylated RNA 3' ends [82] | High-throughput gene expression quantification; severely degraded FFPE RNA; low-input samples [82] | Streamlined protocol; cost-effective; lower sequencing depth; robust with degraded RNA [82] | Limited to polyadenylated transcripts; no isoform-level information [82] |
| 5' End Sequencing (e.g., FFPEcap-seq) | Template switching and enzymatic enrichment of 5' capped RNAs [84] | FFPE samples for precise transcription start sites and enhancer RNA detection [84] | Works well with fragmented RNA; detects capped RNAs and enhancer RNAs; lower input requirements | Specialized protocol; may not capture full-length transcript information |
Performance Evaluation of Commercial Kits
A direct comparison of two commercially available FFPE-compatible stranded RNA-seq kits reveals important performance trade-offs. A 2025 study comparing TaKaRa SMARTer Stranded Total RNA-Seq Kit v2 (Kit A) and Illumina Stranded Total RNA Prep Ligation with Ribo-Zero Plus (Kit B) demonstrated that both can generate high-quality data from FFPE-derived RNA, but with distinct strengths [81].
Table 2: Performance Comparison of Two Commercial FFPE RNA-Seq Kits [81]
| Performance Metric | Kit A (TaKaRa SMARTer) | Kit B (Illumina) |
|---|---|---|
| Minimum RNA Input | 20-fold lower input requirement (e.g., 5 ng) [81] | Standard input (e.g., 100 ng) [81] |
| rRNA Depletion Efficiency | 17.45% rRNA content [81] | 0.1% rRNA content [81] |
| Duplicate Read Rate | 28.48% [81] | 10.73% [81] |
| Intronic Mapping | 35.18% [81] | 61.65% [81] |
| Exonic Mapping & Gene Detection | Comparable performance to Kit B [81] | Comparable performance to Kit A [81] |
| Biological Concordance | High (83.6%-91.7% DEG overlap; R²=0.9747 for housekeeping genes) [81] | High (83.6%-91.7% DEG overlap; R²=0.9747 for housekeeping genes) [81] |
The key takeaway is that Kit A achieves comparable gene expression quantification to Kit B while requiring substantially less starting material, a crucial advantage for limited samples, albeit at the cost of higher duplicate rates and less efficient rRNA depletion [81]. Both kits showed excellent concordance in downstream differential expression and pathway analyses, indicating that the choice should be guided by RNA availability and specific project needs [81].
Diagram 1: Library Prep Selection Workflow
Sample Preparation and Pathologist-Assisted Microdissection
Optimized sample preparation is a critical first step for successful RNA-Seq from FFPE tissues. An effective workflow involves pathologist-assisted macrodissection or microdissection to ensure high tumor content or to precisely isolate specific regions of interest (ROI) [81]. This is particularly important when analyzing the tumor microenvironment, where excluding adjacent normal tissue or lymphoid structures is necessary for accurate transcriptomic profiling [81]. In some cases, two distinct FFPE blocks from the same surgical specimen may be required—one for DNA extraction and another for RNA extraction—while other cases allow for both nucleic acids to be extracted from the same section [81]. RNA quality should be assessed using metrics such as DV200, with values above 30% generally indicating that samples, while fragmented, are still usable for RNA-Seq protocols [81].
Specialized Normalization Methods for FFPE RNA-Seq Data
The Challenge of FFPE RNA-Seq Data Normalization
RNA-Seq data from FFPE samples exhibits unique characteristics that make normalization challenging. A prominent feature is sparsity, characterized by an excess of zero or small counts caused by mRNA degradation [80]. Exploratory analyses of FFPE data have shown that a significant portion of genes have more than 50% zero counts, and the distribution of log read counts displays a bimodal density with one spike at zero [80]. Furthermore, FFPE samples demonstrate greater heterogeneity in RNA degradation levels compared to fresh-frozen (FF) samples, with densities from different FFPE samples showing tremendous variability in spread [80]. These characteristics render traditional normalization methods like Reads Per Million (RPM), Upper Quartile (UQ), DESeq, and TMM suboptimal as they cannot adequately cope with the complex features of FFPE data [80].
MIXnorm: A Tailored Normalization Solution
MIXnorm is a specialized normalization method developed specifically for FFPE RNA-seq data to address these challenges [80]. It employs a two-component mixture model that captures the distinct bimodality of FFPE data:
- Component 1 (Non-expressed genes): Models non-expressed genes using zero-inflated Poisson (ZIP) distributions to capture the spike at zero counts, which may represent biologically zero-expression genes, drop-outs, or highly degraded mRNA.
- Component 2 (Expressed genes): Models expressed genes using truncated normal (TN) distributions for log gene read counts to approximate the roughly bell-shaped curve centered at the second mode.
The method utilizes a nested Expectation-Maximization (EM) algorithm with closed-form updates in each iteration, making it computationally efficient and easy to implement [80]. Evaluations through simulations and cancer studies have shown that MIXnorm significantly improves upon commonly used normalization methods for RNA-seq expression data from FFPE samples [80].
qPCR Validation of RNA-Seq Results
When is qPCR Validation Appropriate?
qPCR remains a widely used method for validating RNA-Seq results, particularly in specific scenarios [42]:
- Journal Reviewer Mindset: When a second method is necessary to confirm an observation and ensure manuscript acceptance, as reviewers often want to see the same results obtained using different techniques.
- Cost Savings Mindset: When RNA-Seq data is based on a small number of biological replicates where proper statistical tests cannot be applied, using qPCR to focus on a few interesting targets with more samples can validate and extend the study.
When is qPCR Validation Inappropriate?
qPCR validation may be unnecessary in these situations [42]:
- Primary Screen Mindset: When RNA-Seq data is used to generate new hypotheses that will be exhaustively tested at a more focused level (e.g., protein-level approaches).
- More RNA-Seq Mindset: When suitable validation involves generating more RNA-Seq data on a new, larger set of samples, confirming that results are reproducible regardless of the technology used.
Best Practices for qPCR Validation
For rigorous validation, perform qPCR on a different set of samples with proper biological replication, not just the same RNA used for RNA-Seq [42]. This approach validates both the technology and the underlying biological response. Benchmarking studies have shown high fold-change correlations between RNA-Seq and qPCR (R² > 0.93), with approximately 85% of genes showing consistent differential expression results between the two technologies [79]. The small subset of inconsistent genes tends to be smaller, have fewer exons, and lower expression levels, warranting careful validation when these genes are of interest [79].
The Scientist's Toolkit: Essential Research Reagents and Materials
Table 3: Essential Research Reagents and Materials for RNA-Seq of Challenging Samples
| Reagent/Material | Function/Purpose | Examples/Considerations |
|---|---|---|
| Specialized RNA-Seq Kits | Library preparation from low-input/degraded RNA | TaKaRa SMARTer Stranded Total RNA-Seq Kit v2 (low-input) [81]; Illumina Stranded Total RNA Prep (high-fidelity) [81]; QuantSeq 3' mRNA-Seq (degraded RNA) [82] |
| RNA Stabilization Reagents | Preserve RNA integrity during sample collection | Reagents that prevent degradation during sample procurement and storage |
| Pathologist Tools for Microdissection | Precise isolation of regions of interest | Tools for macrodissection or microdissection to enrich for specific cell populations [81] |
| RNA Quality Assessment Kits | Evaluate RNA integrity for FFPE samples | DV200 measurement instead of RIN for FFPE samples; minimum DV200 > 30% recommended [81] |
| rRNA Depletion Reagents | Remove abundant ribosomal RNA | Crucial for total RNA approaches; efficiency varies between kits (0.1% vs 17.45% rRNA content reported) [81] |
| Unique Molecular Identifiers (UMIs) | Account for PCR duplicates and improve quantification | Especially valuable for low-input and degraded samples [84] |
| Specialized Normalization Software | Normalize FFPE RNA-Seq data | MIXnorm for addressing zero-inflation in FFPE data [80] |
| qPCR Validation Reagents | Confirm key RNA-Seq findings | Use different sample set for biological validation [42] |
Diagram 2: RNA-Seq to qPCR Workflow
Successful RNA-Seq analysis of low-input and FFPE-derived RNA requires a comprehensive strategy addressing sample preparation, library selection, and data analysis. Pathologist-assisted dissection ensures sample purity, while specialized library preparation methods like 3' mRNA-Seq or low-input optimized kits overcome limitations of sample quantity and quality. The adoption of specialized normalization methods like MIXnorm is crucial for handling the unique characteristics of FFPE data. Finally, strategic qPCR validation using independent samples confirms both technical accuracy and biological significance. By implementing these integrated strategies, researchers can reliably extract valuable transcriptomic information from even the most challenging clinical samples, enabling insights into disease mechanisms and biomarker discovery.
Ensuring Accuracy: Validation Strategies and Comparative Analysis of Technologies
When is qPCR Validation Essential? Scenarios for a Second Methodological Confirmation
In the context of an RNA-Seq to qPCR experimental workflow, the question of when quantitative PCR (qPCR) validation is essential represents a critical methodological consideration. While RNA sequencing (RNA-seq) has become a robust and widely accepted technology for transcriptome-wide expression profiling, specific scenarios demand confirmation of results through an orthogonal method such as qPCR. This application note examines these essential scenarios, providing researchers and drug development professionals with evidence-based guidance on when to implement a second methodological confirmation. The convergence of massive parallel sequencing with targeted, highly sensitive qPCR creates a powerful framework for gene expression analysis, but the application of both techniques requires strategic planning and resource allocation. Based on current literature and consensus guidelines, we outline specific circumstances where qPCR validation transitions from optional to necessary, supported by experimental protocols and performance criteria.
Essential Scenarios Requiring qPCR Validation
Validation for Clinical Application and Biomarker Development
When research findings are intended for clinical application or biomarker development, qPCR validation becomes essential. The transition from research use only (RUO) to in vitro diagnostics (IVD) requires rigorous technical standardization that often necessitates confirmation by multiple methods [85]. Biomarkers underpinning clinical decisions—for diagnosis, prognosis, prediction, and treatment monitoring—require validation beyond a single technology platform.
The noticeable lack of technical standardization remains a huge obstacle in translating qPCR-based tests into clinical practice [85]. For clinical research assays, validation should demonstrate analytical specificity (distinguishing target from non-target sequences), analytical sensitivity (minimum detectable concentration), trueness (closeness to true value), and precision (closeness of repeated measurements) [85]. This level of rigor ensures that biomarkers, particularly those based on noncoding RNAs which show contradictory results between studies, can reliably support clinical decision-making.
Low Expression Targets and Small Fold-Changes
qPCR validation is essential when RNA-seq identifies differentially expressed genes with low expression levels or small fold-changes (typically below 1.5- to 2-fold) [86]. Studies comparing RNA-seq and qPCR have shown that approximately 15-20% of genes may show non-concordant results when comparing these technologies, with the vast majority of these non-concordant genes exhibiting fold-changes lower than 2 [86].
Specifically, of the genes showing non-concordant results between RNA-seq and qPCR, approximately 93% show a fold change lower than 2 and about 80% show a fold change lower than 1.5 [86]. The small fraction (approximately 1.8%) of genes that are severely non-concordant (differing in both statistical significance and direction of effect) are typically lower expressed and shorter [86]. For these problematic cases, qPCR serves as an essential quality control measure to verify authentic expression differences.
When a research story depends entirely on the differential expression of only a few genes, orthogonal validation with qPCR becomes essential [86]. This scenario is particularly important when these key genes form the foundation for broader conclusions about molecular mechanisms, therapeutic targets, or biological pathways.
In such cases, independent verification provides critical support for the research narrative. qPCR can also extend these findings by measuring expression of the same selected genes in additional sample sets, different conditions, or across multiple model systems not included in the original RNA-seq experimental design [86]. This approach strengthens the robustness of conclusions based on a limited number of critical genes.
Novel Biomarkers or Unprecedented Findings
qPCR validation is essential for novel biomarker candidates or unprecedented findings that contradict established literature or expected biological patterns. The high sensitivity and specificity of well-designed qPCR assays provides confirmation for unexpected results that might otherwise be questioned as technical artifacts.
This scenario is particularly relevant for novel noncoding RNA biomarkers, where the lack of reproducibility has been widely documented across studies [85]. For example, in cardiovascular disease, circulating microRNA biomarkers have shown contradictory results between studies, with some miRNAs reported as both up-regulated and down-regulated for the same condition across different investigations [85]. Such discrepancies highlight the necessity of orthogonal validation for novel findings.
Experimental Design and Validation Workflow
The decision framework for implementing qPCR validation within an RNA-Seq to qPCR workflow can be visualized as follows:
Reference Gene Selection Protocol for Validation Studies
Computational Selection from RNA-seq Data
Proper reference gene selection is fundamental to reliable qPCR validation. The Gene Selector for Validation (GSV) software provides a systematic approach to identify optimal reference genes directly from RNA-seq data, addressing the limitation of traditional housekeeping genes which may vary under different biological conditions [87].
Procedure:
- Input Preparation: Prepare transcript quantification tables (in TPM values) from RNA-seq data in .xlsx, .txt, or .csv format.
- Software Configuration: Use standard cutoff values in GSV interface:
- Expression >0 TPM in all libraries
- Standard variation of log2(TPM) <1
- No exceptional expression (>2× average log2 expression)
- Average log2 expression >5
- Coefficient of variation <0.2
- Execution: Process data through GSV algorithm to generate ranked lists of reference candidate genes.
- Validation: Select top candidate genes for experimental confirmation using stability algorithms such as GeNorm or NormFinder [87].
Experimental Confirmation of Reference Genes
After computational selection, reference genes require experimental confirmation through the following protocol:
Materials:
- RNA samples from all experimental conditions (minimum n=5 per condition)
- Reverse transcription reagents
- qPCR reagents compatible with detection chemistry (SYBR Green or probe-based)
- qPCR instrument with multi-channel capability
Procedure:
- cDNA Synthesis: Convert equal amounts of RNA (500 ng recommended) to cDNA using reverse transcriptase with random hexamers or oligo-dT primers.
- qPCR Setup: Perform qPCR in technical triplicates for each candidate reference gene across all biological samples.
- Data Analysis: Calculate gene stability measures using GeNorm or NormFinder algorithms.
- Selection: Choose the most stable reference genes (minimum of two recommended) for normalization of target gene expression data [87].
qPCR Validation Experimental Protocol
Sample Preparation and Reverse Transcription
Materials:
- High-quality RNA samples (RIN >7 for animal systems)
- DNase I treatment kit
- Reverse transcription system (random hexamers and/or oligo-dT primers)
- RNAse inhibitor
Procedure:
- RNA Quality Control: Verify RNA integrity using appropriate method (e.g., Bioanalyzer).
- DNA Digestion: Treat RNA samples with DNase I to remove genomic DNA contamination.
- Reverse Transcription: Convert 500 ng-1 μg total RNA to cDNA in 20 μL reaction using reverse transcriptase according to manufacturer's protocol.
- Storage: Store cDNA at -20°C until qPCR analysis; avoid repeated freeze-thaw cycles.
qPCR Assay Design and Validation
Materials:
- Primer design software or predesigned assay sets
- qPCR reagents (SYBR Green or probe-based)
- qPCR plates and sealing films
- Quantitative PCR instrument
Procedure:
- Assay Design: Design primers with:
- Amplicon size: 70-150 bp
- Tm: 58-60°C
- GC content: 40-60%
- In Silico Validation: Check primer specificity using BLAST against relevant transcriptome.
- Efficiency Testing: Perform 10-fold serial dilution series (minimum 5 points) to determine amplification efficiency.
- Specificity Verification: Confirm single amplification product by melt curve analysis (SYBR Green) or probe specificity.
- Validation Runs: Include no-template controls and inter-run calibrators for plate-to-plate normalization.
Data Analysis and Interpretation
Materials:
- qPCR data analysis software
- Statistical analysis package
Procedure:
- Cq Determination: Set consistent threshold across all runs for Cq determination.
- Efficiency Correction: Calculate efficiency-corrected target quantities using individual sample PCR efficiencies rather than assuming 100% efficiency [88].
- Normalization: Normalize target gene expression to stable reference genes identified in Section 4.1.
- Statistical Analysis: Perform appropriate statistical tests to determine significant differences in expression.
- Correlation Assessment: Compare RNA-seq and qPCR results using correlation analysis.
Performance Criteria and Quality Control
For rigorous qPCR validation, the following performance criteria should be established prior to experimental implementation:
Table 1: Essential qPCR Assay Performance Characteristics
| Parameter | Acceptance Criteria | Assessment Method |
|---|---|---|
| Amplification Efficiency | 90-110% | Standard curve with 5-point 10-fold dilution series |
| Linearity | R² ≥ 0.980 | Correlation coefficient of standard curve |
| Dynamic Range | 6-8 orders of magnitude | Serial dilution analysis |
| Specificity | Single amplification product | Melt curve analysis or probe validation |
| Repeatability | CV < 5% for Cq values | Intra-assay replication |
| Reproducibility | CV < 10% for Cq values | Inter-assay replication |
| Limit of Detection | Determined empirically | Multiple replicate dilutions |
These criteria align with MIQE 2.0 guidelines, which emphasize transparency and reproducibility in qPCR experiments [28] [89]. Recent updates to these guidelines stress the importance of converting Cq values into efficiency-corrected target quantities and reporting detection limits with dynamic ranges for each target [89].
Research Reagent Solutions for qPCR Validation
Successful implementation of qPCR validation studies requires specific reagents and tools optimized for accurate gene expression analysis:
Table 2: Essential Research Reagents for qPCR Validation Studies
| Reagent/Tool | Function | Selection Considerations |
|---|---|---|
| Reverse Transcriptase | cDNA synthesis from RNA templates | High efficiency, minimal RNase activity |
| qPCR Master Mix | Amplification and detection | Compatibility with detection chemistry, inhibitor resistance |
| Predesigned Assays | Target-specific amplification | Validation status, amplification efficiency data |
| Reference Gene Assays | Expression normalization | Stability across experimental conditions |
| RNA Quality Assessment | Sample quality control | RIN equivalent measurement, degradation assessment |
| qPCR Plates | Reaction vessel | Optical clarity, sealing reliability |
| Automated Analysis Software | Data processing and QC | MIQE compliance, efficiency calculation capabilities |
qPCR validation remains essential in specific scenarios within the RNA-Seq to qPCR workflow, particularly for clinical applications, low-expression targets, critical research findings, and novel biomarkers. By implementing the experimental protocols and quality criteria outlined in this application note, researchers can ensure the robustness and reproducibility of their gene expression findings. The strategic integration of qPCR as a validation method strengthens research outcomes and facilitates the translation of discoveries into clinical applications.
Within the framework of RNA-Seq to qPCR experimental workflow research, a critical step involves the rigorous benchmarking of platform performance to ensure data accuracy and translational relevance. While RNA sequencing has become the gold standard for whole-transcriptome gene expression quantification, reverse transcription quantitative polymerase chain reaction (qPCR) remains the established method for validating gene expression data due to its sensitivity and specificity [79]. The transition from a discovery-based tool like RNA-Seq to a targeted, often regulatory-facing tool like qPCR necessitates a thorough understanding of the correlation between these platforms, particularly for applications in clinical diagnostics and drug development where detecting subtle biological differences is paramount [20] [90]. This application note details the protocols and benchmarks for assessing the correlation of gene expression and fold-change measurements between RNA-Seq and qPCR platforms, providing a standardized approach for researchers and scientists.
Performance Benchmarking Data
Comprehensive benchmarking studies provide quantitative evidence of the correlation between RNA-Seq and qPCR, establishing performance expectations for cross-platform analyses.
Table 1: Summary of Expression and Fold-Change Correlation Between RNA-Seq and qPCR
| Benchmarking Study Context | Expression Correlation (Pearson R²) | Fold-Change Correlation (Pearson R²) | Fraction of Non-Concordant DEGs | Key Observations |
|---|---|---|---|---|
| MAQC Samples (5 Workflows) [79] | 0.798 - 0.845 | 0.927 - 0.934 | 15.1% - 19.4% | Alignment-based tools (e.g., Tophat-HTSeq) showed slightly lower non-concordance than pseudoaligners (e.g., Salmon). |
| Quartet Project (45 Labs) [20] | 0.876 (Quartet), 0.825 (MAQC) | N/A | N/A | Accurate quantification of a broader gene set is more challenging, highlighting the need for large-scale reference datasets. |
| TempO-seq vs RNA-Seq (39 Cell Lines) [91] | 0.77 | N/A | 20% of genes non-concordant | 80% of genes showed concordant expression levels; non-concordant genes were enriched for histone and ribosomal functions. |
A pivotal benchmarking study utilizing the MAQC reference samples demonstrated high overall concordance between RNA-Seq and qPCR. The study evaluated five common RNA-Seq analysis workflows (Tophat-HTSeq, Tophat-Cufflinks, STAR-HTSeq, Kallisto, and Salmon) and found that while fold-change correlations were consistently high, a portion of genes consistently showed discrepancies [79]. These non-concordant genes were typically characterized by lower expression levels, smaller gene size, and fewer exons, indicating that careful validation is particularly warranted for genes with these features [92] [79]. Furthermore, large-scale real-world data from the Quartet project, involving 45 independent laboratories, confirmed that correlation with qPCR TaqMan datasets can vary, emphasizing the influence of experimental and bioinformatic processes on data quality [20].
Experimental Protocol: A Step-by-Step Guide
This protocol provides a detailed methodology for conducting a robust benchmarking study to correlate RNA-Seq and qPCR data, adapted from established benchmarking practices [20] [79].
Stage 1: Sample Selection and RNA Extraction
- Select Reference Materials: Begin with well-characterized RNA reference samples. The MAQC samples (MAQCA and MAQCB) are widely used and provide a benchmark with large biological differences [79]. For studies focused on subtle differential expression, newer materials like the Quartet project RNA references are more appropriate [20].
- Extract Total RNA: Using a Qiagen EZ1 Advanced XL automated RNA purification instrument or equivalent, purify total RNA from cell lysates or tissues. Include an on-column DNase digestion step to remove genomic DNA contamination [90].
- Quality Control (QC): Assess RNA concentration and purity (260/280 ratio) using a NanoDrop spectrophotometer. Determine the RNA Integrity Number (RIN) using an Agilent Bioanalyzer. A RIN greater than 7 is generally required for high-quality sequencing, especially for poly-A enrichment protocols [93].
Stage 2: RNA-Sequencing Library Preparation and Data Generation
- Library Preparation: Use a stranded mRNA library preparation kit, such as the Illumina Stranded mRNA Prep, Ligation Kit. This involves:
- Poly-A Enrichment: Purify messenger RNA (mRNA) from 100 ng of total RNA using oligo(dT) magnetic beads [90] [93].
- RNA Fragmentation & Reverse Transcription: Fragment the purified mRNA and reverse transcribe it into complementary DNA (cDNA).
- Adapter Ligation & Amplification: Ligate sequencing adapters and perform PCR-based amplification of the final library.
- Note: Stranded libraries are preferred as they preserve transcript orientation information, which is crucial for accurately identifying overlapping genes and long non-coding RNAs [93].
- Sequencing: Sequence the libraries on an Illumina platform to a sufficient depth (e.g., 30-50 million reads per sample) to ensure robust detection of both high and low-abundance transcripts.
Stage 3: qPCR Validation Assay
- Assay Design: Design qPCR assays that detect the same specific subset of transcripts that will be quantified in the RNA-Seq data. Assays must be wet-lab validated for efficiency and specificity [79].
- Reverse Transcription: Synthesize cDNA from the same RNA samples used for sequencing.
- qPCR Run: Perform qPCR reactions in technical replicates for all candidate genes and reference genes. Use a platform that provides Cycle Quantification (Cq) values.
Stage 4: Bioinformatics Analysis of RNA-Seq Data
- Quality Control and Trimming: Process raw sequencing reads (FASTQ files) with a tool like
fastpto remove adapter sequences and low-quality bases, which improves the alignment rate [94]. - Alignment and Quantification: Process the reads through multiple bioinformatics workflows to assess the impact of tool selection. For example:
- Alignment-based workflow: Align reads to a reference genome using STAR or Tophat, then quantify gene-level counts with HTSeq.
- Pseudoalignment workflow: Quantify transcript abundances directly from reads using Kallisto or Salmon, then aggregate to gene-level [79].
- Normalization: For correlation analysis with qPCR, convert gene-level counts to Transcripts Per Million (TPM). For differential expression analysis, use methods like DESeq2 or edgeR.
Stage 5: Data Correlation and Statistical Analysis
- Align Datasets: Map the qPCR assays to the corresponding genes quantified in the RNA-Seq data. For transcript-level tools, aggregate transcript TPM values for the transcripts detected by the qPCR assay [79].
- Expression Correlation: Calculate the Pearson correlation between the log-transformed RNA-Seq expression values (e.g., TPM) and the normalized qPCR Cq-values across all protein-coding genes.
- Fold-Change Correlation: Calculate the log2 fold-change between two sample groups (e.g., MAQCA vs. MAQCB) for both RNA-Seq and qPCR. Assess the correlation of these fold-changes.
- Identify Discrepancies: Classify genes into concordant and non-concordant groups based on their differential expression status and fold-change magnitude between the two platforms. Investigate the characteristics (e.g., length, expression level) of non-concordant genes [79].
The Scientist's Toolkit
Table 2: Essential Research Reagent Solutions for Benchmarking Studies
| Item | Function in Workflow | Example Products / Tools |
|---|---|---|
| Reference RNA | Provides a "ground truth" with known expression characteristics for method calibration. | Quartet Project RNA [20], MAQC RNA (MAQCA/MAQCB) [79] |
| Stranded mRNA Prep Kit | Prepares sequencing libraries by enriching for poly-adenylated mRNA and preserving strand information. | Illumina Stranded mRNA Prep [90] [93] |
| qPCR Assays | Provides highly accurate, targeted quantification of specific genes for validation of RNA-Seq data. | Whole-transcriptome RT-qPCR assays [79] |
| RNA Quality Control | Assesses RNA integrity, a critical factor for sequencing and qPCR success. | Agilent Bioanalyzer (RIN) [90] [93] |
| Bioinformatics Tools | Processes raw sequencing data into gene expression values for downstream analysis. | STAR, HTSeq, Kallisto, Salmon [79], fastp [94] |
Critical Data Analysis Considerations
Successful benchmarking requires careful attention to data analysis details. The following points are critical for a robust comparison.
- Focus on Relative Quantification: For most biological studies, the correlation of fold-changes between conditions is more relevant than the correlation of absolute expression values, as both RNA-Seq and qPCR are relative measurement techniques [79].
- Filter Low-Expression Genes: Implement a minimal expression filter (e.g., 0.1 TPM) before correlation analysis to prevent technical noise from low-abundance transcripts from skewing the results [79].
- Acknowledge Platform-Specific Biases: Be aware that a subset of genes will show systematic discrepancies between platforms. Genes related to ribosomal and histone functions are often enriched among non-concordant genes, potentially due to their high expression and complex regulation [91].
- Benchmark for Subtle Differences: If the research goal involves detecting subtle differential expression (e.g., between disease subtypes), ensure that the chosen reference materials and analysis pipelines are sensitive enough for this task, as performance assessed only with samples having large differences can be misleading [20].
Quantitative real-time PCR (RT-qPCR) remains one of the most sensitive and reliable techniques for gene expression analysis, serving as the gold standard for validating RNA sequencing (RNA-seq) data due to its high sensitivity, specificity, and reproducibility [95] [96] [97]. However, the accuracy of this technique critically depends on using stable internal reference genes for normalization across different biological conditions [96]. Traditional selection of reference genes often relies on housekeeping genes (HKGs) with presumed stable expression, such as those encoding actin (ACT), glyceraldehyde-3 phosphate dehydrogenase (GAPDH), and tubulin (TUB) [98]. Mounting evidence indicates that these conventionally used genes may demonstrate significant expression variability under physiological or pathological conditions, across tissue types, and different experimental conditions [99] [95]. Inappropriate reference gene selection can lead to misinterpretation of results, potentially yielding biologically incorrect conclusions [99]. This application note outlines a structured approach and specialized software tools for identifying and validating optimal reference genes, framed within the comprehensive RNA-seq to qPCR experimental workflow.
Software Solutions for Reference Gene Selection
Table 1: Software Tools for Reference Gene Evaluation
| Software Tool | Primary Function | Input Data | Key Features | Applications |
|---|---|---|---|---|
| GenExpA [99] | Normalization & validation | RT-qPCR (Ct values) | Combines NormFinder with progressive gene removal; calculates coherence score (CS) | Melanoma gene expression studies; independent of experimental model |
| GSV (Gene Selector for Validation) [95] | Candidate identification | RNA-seq (TPM values) | Filters stable low-expression genes; creates variable-expression validation list | Aedes aegypti transcriptome; meta-transcriptome processing |
| NormFinder [99] | Stability analysis | RT-qPCR data | Evaluates intra- and inter-group variation; identifies best single or pair of genes | Widely used across species and experimental conditions |
| GeNorm [96] | Stability ranking | RT-qPCR data | Calculates gene stability measure (M); determines optimal number of reference genes | Wheat development studies; determines that 1-2 reference genes are optimal |
| BestKeeper [98] | Stability index | RT-qPCR (Ct values) | Uses standard deviation and coefficient of variation of Ct values | Toona ciliata under various stress conditions |
| RefFinder [96] | Comprehensive ranking | RT-qPCR data | Integrates results from GeNorm, NormFinder, BestKeeper, and ΔCt method | Wheat tissue analysis; provides aggregated stability ranking |
Innovative Software Features
Next-generation reference gene selection tools incorporate advanced algorithms that address limitations of traditional methods. GenExpA introduces a coherence score (CS) that validates reference reliability based on consistency of statistical analyses of normalized target gene expression levels across all experimental models [99]. This approach progressively removes the least stable candidate reference gene from the pool in each sample, followed by re-selection and re-validation of new normalizers. The coherence score clarifies how low the stability value of a reference must be to draw biologically correct conclusions, adding a new quality metric to qPCR analysis [99].
GSV software implements a filtering-based methodology using transcripts per million (TPM) values from RNA-seq data to identify optimal reference genes, applying five sequential criteria: expression greater than zero in all libraries; standard variation <1; no exceptional expression in any library (≤2× average of log2 expression); average log2 expression >5; and coefficient of variation <0.2 [95]. This systematic approach effectively removes stable low-expression genes from consideration, addressing a critical limitation of earlier methods.
Experimental Protocols for Reference Gene Validation
Protocol 1: RNA-seq Guided Candidate Identification Using GSV
Purpose: To identify potential reference genes from RNA-seq data for subsequent experimental validation.
Materials:
- RNA-seq quantification data (TPM values preferred) [95]
- GSV software (Python-based with graphical interface) [95]
- Tissue/organ samples representing experimental conditions
Procedure:
- Data Preparation: Compile TPM values from RNA-seq libraries into a table format (.csv, .xls, or .xlsx) with gene names in the first column followed by TPM values (without replicates) [95].
- Software Configuration: Launch GSV and input the TPM table. Set filtering parameters using standard cutoffs or adjust based on experimental needs [95].
- Reference Candidate Identification: Execute the analysis to generate a list of potential reference genes meeting stability criteria [95].
- Validation Candidate Identification: Simultaneously identify variable genes for experimental validation of transcriptome data [95].
- Output Interpretation: Review the generated table indicating the most stable and most variable genes for downstream applications.
Validation: In an Aedes aegypti transcriptome study, GSV identified eiF1A and eiF3j as the most stable genes, which were subsequently confirmed by RT-qPCR analysis [95].
Protocol 2: Experimental Validation of Candidate Reference Genes
Purpose: To experimentally validate the stability of candidate reference genes identified through computational methods.
Materials:
- High-quality RNA samples from representative tissues/conditions [96]
- Reverse transcription kit (e.g., RevertAid First Strand cDNA Synthesis Kit) [96]
- qPCR reagents (e.g., HOT FIREPol EvaGreen qPCR Mix Plus) [96]
- Real-time PCR detection system [96]
- Primer pairs for candidate reference genes [98]
Procedure:
- RNA Extraction and Quality Control: Extract total RNA using TRIzol reagent or equivalent. Assess quality using agarose gel electrophoresis and spectrophotometry (NanoDrop) [96].
- cDNA Synthesis: Reverse transcribe 4 μg of RNA in a 20 μL reaction volume using an appropriate cDNA synthesis kit. Dilute cDNA 20-fold before use in qPCR [96].
- Primer Validation: Verify primer specificity through agarose gel electrophoresis and melting curve analysis. Ensure single target amplification with correct product length [98].
- qPCR Amplification: Perform reactions in technical replicates using a 384-well plate with 10 μL reaction volume: 2 μL diluted cDNA, 0.2 μM each primer, and 1× qPCR mix [96].
- Data Analysis: Calculate Ct values and analyze using multiple algorithms (GeNorm, NormFinder, BestKeeper) followed by RefFinder for comprehensive ranking [96] [98].
Application Example: In wheat developmental studies, this protocol identified Ta2776, eF1a, Cyclophilin, and Ta3006 as the most stable reference genes across different tissues, while β-tubulin, CPD, and GAPDH showed the least stability [96].
Protocol 3: GenExpA-Assisted Coherence Validation
Purpose: To validate reference gene selection through coherence scoring across multiple experimental models.
Materials:
- Raw or quantified qPCR data for candidate reference and target genes [99]
- GenExpA software (available at GitHub or sciencemarket.pl) [99]
- Samples representing the biological diversity of the study
Procedure:
- Data Upload: Input raw qPCR data for candidate reference genes and target genes, including technical and biological replicates [99].
- Model Design: Automatically generate an experimental model and daughter models (combinations of samples without repetition) using the 'Generate combinations' option [99].
- Parameter Setting: Select appropriate statistical tests (e.g., Pairwise t-test with Holm adjustment for normal data). Set 'Remove repetitions' initially to 0 [99].
- Initial Analysis: Execute NormFinder algorithm to determine the most stable reference gene or pair in each model [99].
- Iterative Improvement: Progressively remove the least stable gene by increasing the 'Remove repetitions' value and mark 'Select best remove for models' to identify references with improved stability values [99].
- Coherence Validation: Calculate coherence scores for target gene expression analyses across all models. Accept references with CS ≥0.99 for reliable normalization [99].
Application Example: In melanoma studies, GenExpA analysis improved the average coherence score from 0.94 to 0.99 through iterative removal of unstable reference genes, ensuring biologically correct normalization of B4GALT gene family expression [99].
Workflow Visualization: RNA-seq to qPCR Validation Pipeline
RNA-seq to qPCR Validation Workflow
Case Studies and Applications
Species-Specific Reference Gene Selection
Table 2: Optimal Reference Genes Across Species and Experimental Conditions
| Species | Experimental Condition | Most Stable Reference Genes | Least Stable Reference Genes | Validation Method |
|---|---|---|---|---|
| Wheat (Triticum aestivum) [96] | Developing organs | Ta2776, eF1a, Cyclophilin, Ta3006, Ref 2 | β-tubulin, CPD, GAPDH | RefFinder (GeNorm, NormFinder, BestKeeper) |
| Toona ciliata [98] | All samples | TUB-α | - | RankAggreg |
| Toona ciliata [98] | H. robusta & MeJA treatment | UBC17 | - | RankAggreg |
| Toona ciliata [98] | 4°C treatment | 60S-18, TUB-α | - | RankAggreg |
| Humpback grouper [100] | Normal tissues | RPL35, EEF1G | - | RefFinder |
| Humpback grouper [100] | Salinity stress | RPLP1, FH, METAP2 | - | RefFinder |
| Humpback grouper [100] | Embryonic development | EIF5A, EIF3F, CCNG1 | - | RefFinder |
Impact of Proper Normalization on Gene Expression Interpretation
The critical importance of appropriate reference gene selection is exemplified in wheat studies analyzing TaIPT gene expression. For TaIPT1, expressed specifically in developing spikes, normalized and absolute values showed no significant differences. However, for TaIPT5, expressed across all tested tissues, significant differences emerged between absolute and normalized values in most tissues. Crucially, normalization using either Ref 2, Ta3006, or both reference genes produced consistent results, underscoring the necessity of proper reference gene selection rather than reliance on absolute quantification or traditional housekeeping genes [96].
In melanoma research, normalization with suboptimal references led to unreliable results with a coherence score of 0.90 for four B4GALT target genes. After iterative improvement using GenExpA, which involved enlarging the candidate pool and progressive removal of unstable genes, the coherence score reached 1.0 for most target genes, confirming analysis consistency [99].
Table 3: Research Reagent Solutions for Reference Gene Studies
| Reagent/Resource | Function | Example Products/Specifications |
|---|---|---|
| RNA Extraction Kit | High-quality RNA isolation | TRIzol Reagent, Qiagen RNeasy Mini Kit, PAXGene Blood RNA Kit [96] [97] |
| cDNA Synthesis Kit | Reverse transcription of RNA to cDNA | RevertAid First Strand cDNA Synthesis Kit [96] |
| qPCR Master Mix | Amplification and detection | HOT FIREPol EvaGreen qPCR Mix Plus [96] |
| Real-time PCR System | qPCR performance and detection | CFX384 Touch Real-Time PCR Detection System, LightCycler 480 II [96] |
| RNA Quality Assessment | Integrity verification | TapeStation RNA ScreenTape, NanoDrop spectrophotometer [96] [97] |
| Reference Gene Software | Data analysis and validation | GenExpA, GSV, RefFinder, GeNorm, NormFinder, BestKeeper [99] [95] |
| Transcriptome Databases | Expression profiling and candidate identification | GTEx Portal, Genotype-Tissue Expression Portal [97] |
The integration of RNA-seq data with specialized bioinformatics tools represents a paradigm shift in reference gene selection, moving beyond traditional housekeeping genes to empirically validated, condition-specific normalizers. Software solutions such as GSV for candidate identification from transcriptomic data and GenExpA for experimental validation through coherence scoring provide robust frameworks for ensuring accurate normalization in gene expression studies. The documented variability in optimal reference genes across species, tissues, and experimental conditions underscores the necessity of implementing these validation protocols in every RT-qPCR experimental workflow. By adopting these standardized approaches, researchers can significantly enhance the reliability and reproducibility of gene expression data, ultimately strengthening conclusions in both basic research and drug development applications.
Within the context of RNA-Seq to qPCR experimental workflow research, a critical challenge persists: the inconsistent correlation of gene expression data between these foundational technologies. This discrepancy poses a significant barrier to translating discoveries from high-throughput screening into validated, clinically applicable assays. The transition from a broad, hypothesis-generating RNA-Seq experiment to a targeted, clinically feasible qPCR test represents a vulnerable phase where technical artifacts can be mistaken for biological truth, potentially derailing drug development pipelines. This application note synthesizes current evidence to delineate the biological and technical factors underlying these cross-platform discrepancies and provides standardized protocols to improve the reliability and interpretation of multi-platform gene expression data.
The Core Challenge in Cross-Platform Analysis
The fundamental challenge is that RNA-Seq and qPCR measure related but distinct molecular phenotypes through vastly different technical processes. RNA-Seq provides a global, hypothesis-free snapshot of transcript abundance, while qPCR offers targeted, highly sensitive quantification of specific transcripts. The successful transfer of a transcriptomic signature from a discovery platform (RNA-Seq) to an implementation platform (qPCR) is often hampered by a documented decline in diagnostic performance [101]. This "failure of implementation" is frequently attributed to a decoupling between the statistical selection of biomarker genes and the practical constraints of the qPCR assay design [101].
Strikingly, some genes detectable via microarray or qPCR can be completely lost in RNA-seq data. A 2021 study documented this phenomenon, showing that genes such as SOX21, SOX3, and SOX11 were readily detected by cDNA microarray and qPCR but resulted in zero RNA-seq read counts. This loss was traced to the RNA-seq library preparation process itself, as qPCR on the prepared library samples also failed to amplify these genes, ruling out a bioinformatic mapping artifact [102].
Key Factors Contributing to Discrepancies
Technical Factors
- Library Preparation Biases: The RNA-seq workflow, involving fragmentation, adapter ligation, and PCR amplification, can be significantly influenced by a transcript's secondary structure and GC content. Regions with strong secondary structures or extreme GC content may be under-represented or lost entirely [102].
- Bioinformatic Processing Variations: A large-scale, multi-center study (the Quartet project) revealed that each step in the bioinformatics pipeline—alignment, quantification, and normalization—can be a major source of variation. This study identified 140 different analysis pipelines across laboratories, contributing significantly to inter-laboratory discrepancies [20].
- Primer and Probe Design Limitations for qPCR: The successful implementation of a qPCR assay depends on meeting stringent biochemical criteria. It can be challenging to design efficient primers for a differentially expressed gene with unusually high GC content or other suboptimal sequence features, which are often neglected during the RNA-seq-based feature selection process [101].
- Dynamic Range and Sensitivity Differences: Platforms have different effective dynamic ranges. While RNA-Seq can quantify thousands of genes simultaneously, its sensitivity for low-abundance transcripts can be outpaced by qPCR for a specific target.
Biological Factors
- Transcript Complexity and Sequence Features: The very sequence of a transcript is a primary biological factor affecting cross-platform correlation. The presence of pseudogenes or highly homologous gene family members (e.g., within the HLA gene family) can lead to misalignment in RNA-seq or cross-hybridization in qPCR, compromising accurate quantification [11].
- Alternative Splicing and Isoform Usage: RNA-Seq can detect multiple transcript isoforms, whereas a qPCR assay is typically designed to target a specific exon or exon-junction. If the biology involves a shift in isoform usage that is not accounted for in the qPCR design, the expression measurements between the two platforms will diverge.
- Sample Quality and Integrity: RNA quality, particularly in clinically derived samples like FFPE tissues, impacts both platforms but in different ways. Degradation can lead to 3'-bias in RNA-seq and failure of qPCR assays targeting the 5' end of a transcript.
The following table summarizes key quantitative findings from recent studies on factors affecting cross-platform correlation.
Table 1: Quantitative Summary of Cross-Platform Discrepancy Factors
| Factor Category | Specific Factor | Observed Impact / Metric | Source |
|---|---|---|---|
| Technical (RNA-Seq) | Loss of specific genes (e.g., SOX21) | No read counts in RNA-seq; confirmed expression via microarray, qPCR, and Western blot | [102] |
| Technical (RNA-Seq) | Impact of experimental protocols | mRNA enrichment, library strandedness, and bioinformatics pipelines identified as primary variation sources | [20] |
| Technical (qPCR) | Correlation of expression estimates | Moderate correlation between qPCR and RNA-seq for HLA-A, -B, and -C (0.2 ≤ rho ≤ 0.53) | [11] |
| Technical (qPCR) | Impact of reference gene selection | Traditional housekeeping genes (e.g., ACTB, GAPDH) can be less stable than other candidates (e.g., OAZ1, RpS20) | [87] |
| Analytical | Inter-laboratory variation | Signal-to-Noise Ratio (SNR) for detecting subtle expression differences varied widely across 45 labs (0.3–37.6) | [20] |
Detailed Experimental Protocols
Protocol 1: Validating RNA-Seq Findings with qPCR
This protocol ensures robust cross-platform validation of transcriptomic data.
1. Selection of Candidate Genes for Validation
- Input: RNA-seq gene expression matrix (e.g., TPM or FPKM values).
- Tool: Use software like Gene Selector for Validation (GSV) to systematically select both reference and target genes [87].
- Criteria for Reference Genes:
- Expression > 0 TPM in all samples.
- Low variability: standard deviation of log2(TPM) < 1.
- No outlier expression: |log2(TPM) - mean(log2(TPM))| < 2.
- High expression: mean(log2(TPM)) > 5.
- Low coefficient of variation: CV < 0.2.
- Criteria for Variable (Target) Genes:
- Expression > 0 TPM in all samples.
- High variability: standard deviation of log2(TPM) > 1.
- High expression: mean(log2(TPM)) > 5.
2. RNA-seq Library Preparation Consideration
- Be aware that library preparation can lead to loss of specific transcripts.
- If validating a gene with prior evidence of being "lost" in RNA-seq, consider using an orthogonal method (e.g., microarray or Nanostring) for initial confirmation [102].
- Use spike-in controls (e.g., ERCC or SIRVs) to monitor technical performance and dynamic range [33].
3. qPCR Assay Design and Execution
- Primer Design: Design amplicons to span exon-exon junctions where possible to avoid genomic DNA amplification.
- Validation: Check primer specificity and ensure amplification efficiency is between 90–110%.
- Replication: Perform minimum of 3 biological replicates and 3 technical replicates [33].
- qPCR Run: Use a standardized cycling protocol appropriate for your chemistry.
4. Data Analysis
- Use the selected stable reference genes for normalization.
- Analyze Cq data using established algorithms (e.g., GeNorm, NormFinder) to finalize the best reference genes [87].
- Calculate relative fold-changes using methods like ΔΔCq.
Protocol 2: A Computational Framework for Cross-Platform Signature Transfer
This protocol, adapted from PMC11245942, embeds implementation constraints early in the discovery process [101].
1. Signature Discovery with Platform-Aware Filtering
- Perform initial differential expression analysis from RNA-seq data using established tools.
- Filter for "Amplifiability": Alongside statistical significance (p-value, fold-change), filter the candidate gene list based on:
- GC Content: Flag or exclude genes/transcripts with unusually high or low GC content in the region where qPCR primers must bind.
- Amplicon Length: Consider the optimal amplicon length for your qPCR chemistry and the constraints of your implementation platform (e.g., LAMP requires longer amplicons).
- Specificity: BLAST primer sequences to ensure specificity and avoid cross-homology with other genes or pseudogenes, a critical step for genes in families like HLA [11].
2. Signature Refinement
- Apply machine learning or statistical models to the filtered gene list to derive a sparse, optimal signature.
- The final signature should represent a trade-off between classification accuracy and practical implementability on the targeted qPCR platform.
3. Experimental Validation
- Follow the validation protocol (Protocol 1) to confirm the performance of the refined signature.
Visualizing the Workflow and Challenges
The following diagram illustrates the core workflow for transferring a gene signature from RNA-Seq discovery to qPCR validation, highlighting key points where discrepancies commonly arise.
cross-platform workflow
The Scientist's Toolkit: Essential Research Reagents
Table 2: Key Reagent Solutions for Cross-Platform Gene Expression Studies
| Reagent / Material | Function / Application | Key Considerations |
|---|---|---|
| Spike-in RNA Controls (ERCC, SIRV) | External RNA controls spiked into samples pre-library prep to monitor technical variation, sensitivity, and dynamic range of RNA-seq assay. | Essential for large-scale studies and quality control; enables absolute normalization [20] [33]. |
| Stable Reference Gene Panel | A set of pre-validated genes with stable, high expression across experimental conditions for reliable qPCR normalization. | Software like GSV can identify optimal candidates from RNA-seq data; superior to single housekeeping genes [87]. |
| Stranded mRNA / Total RNA Library Prep Kits | For RNA-seq library construction. Stranded protocols provide information on transcript orientation, improving accuracy. | Choice depends on sample type (FFPE, blood, cells) and RNA quality; 3'-Seq is efficient for large screens [103] [33]. |
| gDNA Removal Kit | Critical pre-treatment to remove genomic DNA contamination from RNA samples prior to both RNA-seq and qPCR. | Prevents false positives in qPCR and misalignment of genomic reads in RNA-seq. |
| HLA-Tailored Bioinformatics Pipelines | Specialized tools for accurate alignment and quantification of highly polymorphic genes (e.g., HLA) from RNA-seq data. | Standard alignment to a single reference genome is insufficient; these tools account for individual allelic variation [11]. |
Successfully navigating the discrepancies between RNA-Seq and qPCR is not merely a technical exercise but a fundamental requirement for robust biomarker development and drug discovery. By understanding the multifaceted technical and biological factors at play—from RNA secondary structure and library preparation biases to primer design constraints and sample integrity—researchers can design more reliable experiments. Adopting the protocols outlined here, including the preemptive, platform-aware filtering of gene signatures and the rigorous, software-aided selection of validation candidates, will significantly enhance the fidelity of cross-platform data transfer. This disciplined approach ensures that promising genomic discoveries from high-throughput screens can be efficiently translated into targeted, clinically actionable diagnostic assays.
The validation of gene expression data lies at the heart of modern transcriptomics research, particularly in the high-stakes field of drug discovery and development. For decades, quantitative polymerase chain reaction (qPCR) has served as the undisputed gold standard for confirming gene expression changes due to its sensitivity, reproducibility, and accessibility [104] [105]. However, with the rapid advancement and declining costs of next-generation sequencing technologies, RNA sequencing (RNA-Seq) is increasingly being proposed not merely as a discovery tool but as a primary validation method in its own right [106]. This application note examines the technical and practical considerations of this potential paradigm shift, evaluating whether RNA-Seq can legitimately serve as a viable alternative to qPCR for validation workflows within the broader context of RNA-Seq to qPCR experimental research.
The traditional workflow has positioned RNA-Seq as an exploratory, hypothesis-generating technique followed by targeted qPCR validation of key findings [104]. This complementary relationship leverages the strengths of both technologies: the unbiased, genome-wide scope of RNA-Seq and the precision, cost-effectiveness, and established standardization of qPCR for focused gene sets. However, as RNA-Seq protocols become more robust, analysis pipelines more standardized, and costs more competitive, researchers are questioning whether a single RNA-Seq experiment could simultaneously serve both discovery and validation purposes [107] [106].
This document frames this question within the specific needs of researchers, scientists, and drug development professionals, providing a balanced assessment based on current technological capabilities, experimental requirements, and practical constraints. We present structured comparisons, detailed protocols, and a strategic framework to guide decision-making for validation strategies in transcriptional profiling studies.
Technology Comparison: qPCR versus RNA-Seq
A comprehensive understanding of the technical and operational characteristics of both qPCR and RNA-Seq is essential for selecting the appropriate validation methodology. The following comparison delineates the fundamental differences and relative advantages of each technique in the context of verification and validation workflows.
Table 1: Comparative Analysis of qPCR and RNA-Seq for Validation Applications
| Parameter | qPCR | RNA-Seq |
|---|---|---|
| Throughput | Medium-throughput (dozens to hundreds of targets) [104] | High-throughput (entire transcriptomes) [108] |
| Primary Application | Targeted validation, absolute quantification, high-throughput screening [104] | Discovery, isoform expression, novel transcript/ variant identification [108] [104] |
| Sensitivity & Dynamic Range | High sensitivity and sufficient dynamic range for most applications [104] | High sensitivity, with dynamic range dependent on sequencing depth [108] [104] |
| Cost per Sample | Lower cost for limited target numbers [106] | Higher per-sample cost, but cost per data point can be lower [106] |
| Ease of Use & Accessibility | Ubiquitous instruments, straightforward workflows, familiar data analysis [104] | Specialized bioinformatics expertise required for data processing and interpretation [108] [109] |
| Standardization | Well-established, with MIQE guidelines promoting experimental rigor [105] | Evolving standards and best practices; greater inherent technical variability [108] |
| Turnaround Time | Rapid (1-3 days for typical experiments) [104] | Longer, especially when outsourcing or with complex data analysis [104] |
| Information Content | Targeted data on pre-selected genes; relies on a priori knowledge [104] | Unbiased global profile, splicing information, allele-specific expression [108] [107] |
The choice between these techniques is not necessarily binary. They often function synergistically within a single research project; for instance, RNA-Seq can identify a novel gene signature in a discovery cohort, and qPCR can provide a cost-effective means to validate this signature in a larger, independent cohort [104]. Furthermore, qPCR is frequently used upstream of RNA-Seq to check cDNA library quality, and downstream to verify key RNA-Seq findings, creating an integrated, quality-controlled workflow [104].
Experimental Protocols for Validation
The reliability of any validation method hinges on rigorous, reproducible experimental protocols. Below, we outline detailed methodologies for both qPCR and RNA-Seq, emphasizing critical steps that ensure data integrity.
Protocol for qPCR Validation
This protocol adheres to the MIQE (Minimum Information for Publication of Quantitative Real-Time PCR Experiments) guidelines to ensure the generation of reliable and publishable data [105].
1. RNA Extraction and Quality Control:
- Extract high-quality RNA using appropriate methods (e.g., column-based kits). For difficult samples like FFPE tissue or whole blood, use specialized protocols to remove contaminants and genomic DNA [33].
- Quantify RNA using spectrophotometry (NanoDrop) or fluorometry (Qubit). Assess RNA integrity via the RNA Integrity Number (RIN) on an Agilent Bioanalyzer. High-quality RNA (RIN > 8) is typically required for gene expression studies.
2. Reverse Transcription (cDNA Synthesis):
- Use a fixed amount of RNA (e.g., 500 ng - 1 µg) for reverse transcription to minimize loading bias.
- Select a reverse transcriptase kit with high efficiency and include a no-reverse transcription control (-RT) to confirm the absence of genomic DNA contamination [105].
3. Assay Selection and Design:
- Assay Selection: Use pre-designed, validated TaqMan assays for optimal specificity and sensitivity. These assays, which include a sequence-specific probe, are available for most exon-exon junctions and can be designed to be transcript-variant-specific [104].
- Custom Primers: If designing custom SYBR Green primers, ensure they span an intron to avoid genomic DNA amplification. Verify primer specificity by analyzing melt curves and, if possible, by gel electrophoresis.
4. Normalization Strategy:
- Critical Step: Normalization is crucial for accurate qPCR data interpretation [13].
- Reference Genes: Do not assume traditional housekeeping genes (e.g., GAPDH, ACTB) are stable under all experimental conditions. Validate candidate reference genes using algorithms like geNorm, NormFinder, or BestKeeper [13].
- Novel Method: An emerging method involves identifying a stable combination of non-stable genes from comprehensive RNA-Seq databases (e.g., TomExpress for tomato). This combination of genes, whose expressions balance each other out across conditions, can outperform single reference genes [13].
5. qPCR Run and Data Analysis:
- Run reactions in technical replicates (at least duplicates, preferably triplicates) to account for pipetting error.
- Use a standardized cycling protocol appropriate for your chemistry (TaqMan vs. SYBR Green).
- Calculate expression levels using the comparative Cq (ΔΔCq) method, applying the efficiency-corrected model.
Protocol for RNA-Seq as a Primary Validation Method
Using RNA-Seq for validation requires the same level of experimental rigor and careful design as when used for discovery, often with an increased emphasis on reproducibility and cost-control.
1. Experimental Design and Power Analysis:
- Replicates: Biological replicates are the cornerstone of a robust design. A minimum of 3 biological replicates per condition is standard, but 4-8 are recommended to achieve sufficient statistical power, especially when biological variability is high [33] [108]. Technical replicates are less critical.
- Pilot Studies: Conduct a pilot study to estimate biological variation and determine the optimal sample size and sequencing depth for the main experiment [33].
- Batch Effects: Plan the plate layout and sample processing to minimize and enable correction for batch effects, which are systematic non-biological variations [33].
2. Library Preparation and Sequencing:
- RNA Input: Follow the same rigorous RNA extraction and QC steps as for qPCR.
- Library Type: The choice of library preparation method depends on the study's goal.
- 3'-Seq (e.g., QuantSeq): Ideal for large-scale studies focused purely on gene expression and pathway analysis. It is cost-effective, allows for early sample pooling, and can be performed directly from cell lysates, omitting RNA extraction [33].
- Whole Transcriptome: Necessary for applications requiring information on isoforms, splice junctions, fusion genes, or non-coding RNAs. This requires mRNA enrichment or ribosomal RNA depletion [33] [109].
- Sequencing Depth: For standard differential gene expression analysis, a depth of 20-30 million reads per sample is often sufficient [108].
3. Computational Data Analysis: The following workflow, also depicted in Figure 1, provides a beginner-friendly pipeline starting from raw sequencing data [109].
A. Quality Control and Trimming:
- Tool: FastQC for initial quality assessment; MultiQC to aggregate reports from multiple samples [108] [109].
- Action: Inspect the QC report for per-base sequence quality, adapter contamination, and unusual GC content.
- Trimming: Use Trimmomatic or fastp to remove adapter sequences and trim low-quality bases from read ends [108] [109].
B. Read Alignment and Quantification:
- Alignment-based: Align cleaned reads to a reference genome using splice-aware aligners like STAR or HISAT2. Convert SAM files to BAM format using SAMtools. Then, use featureCounts (from the Subread package) to generate a count matrix [108] [109].
- Pseudo-alignment (Faster Alternative): Use Salmon or Kallisto to directly estimate transcript abundances without generating large alignment files. These tools are computationally efficient and are considered best practice for transcript-level quantification [108].
C. Differential Expression Analysis:
- Import the count matrix into R/Bioconductor and use packages like DESeq2 or edgeR, which use specific statistical models (e.g., negative binomial distribution) to reliably identify differentially expressed genes (DEGs) [108] [109].
- Normalize the data to account for differences in sequencing depth and RNA composition between samples [108].
D. Data Visualization:
- Generate plots such as volcano plots (to visualize significance versus fold-change) and heatmaps (to display expression patterns of DEGs across samples) to interpret and present the results [108] [109].
Figure 1: Standard RNA-Seq Data Analysis Workflow. The pipeline begins with raw sequencing files and proceeds through quality control, alignment/quantification, and statistical analysis to generate interpretable results. A pseudo-alignment path offers a faster, memory-efficient alternative.
A Strategic Framework for Choosing a Validation Method
The decision to use qPCR or RNA-Seq for validation should be guided by the specific research question, experimental constraints, and the nature of the required output. The following decision framework, illustrated in Figure 2, can help researchers navigate this choice.
Figure 2: Decision Framework for Validation Strategy. This diagram outlines key questions to guide the choice between qPCR and RNA-Seq for validation, highlighting that the technologies are often complementary.
Key strategic considerations include:
- Study Objective: If the goal is strictly to confirm expression changes in a pre-defined, small set of genes, qPCR is the most direct and economical choice [104] [106]. If the validation needs to confirm a complex signature, discover additional isoforms, or detect aberrant splicing, RNA-Seq provides a more comprehensive solution [107].
- Sample Availability: For precious biobank samples (e.g., patient FFPE tissues), where RNA is limited and difficult to obtain, maximizing information from a single assay is paramount. In such cases, RNA-Seq might be preferred as it can simultaneously validate a hypothesis and generate new, actionable data [33] [107].
- Budget and Infrastructure: While the cost of RNA-Seq has decreased, it remains more expensive per sample than qPCR for targeted studies. Furthermore, RNA-Seq requires bioinformatics infrastructure and expertise, which may not be accessible to all labs [108] [109] [106].
- Regulatory Compliance: In diagnostic or drug development settings, the well-established and standardized nature of qPCR may make it the more straightforward choice for regulatory submissions until standards for clinical RNA-Seq become more widespread.
Essential Research Reagent Solutions
Successful implementation of either validation protocol depends on high-quality reagents and tools. The following table lists key solutions and their applications.
Table 2: Key Research Reagents and Tools for qPCR and RNA-Seq Workflows
| Reagent / Tool | Function | Application Context |
|---|---|---|
| TaqMan Gene Expression Assays | Pre-designed, optimized primer-probe sets for specific transcripts. | qPCR: Provides high-specificity, ready-to-use assays for targeted gene validation [104]. |
| NMD Inhibitors (Cycloheximide) | Chemical inhibitor of nonsense-mediated decay (NMD). | RNA-Seq: Used in sample preparation to stabilize transcripts with premature termination codons, allowing detection of aberrant mRNAs [107]. |
| Spike-in Controls (e.g., SIRVs) | Synthetic RNA molecules added to samples in known quantities. | RNA-Seq: Acts as an internal control for normalization, assessing technical performance, sensitivity, and quantification accuracy across samples and batches [33]. |
| MIQE Guidelines | A minimum information standard for publishing qPCR experiments. | qPCR: Ensures experimental rigor, transparency, and reproducibility of qPCR data [105]. |
| RNA-Seq Analysis Tools (e.g., DESeq2, edgeR) | Bioconductor packages for statistical analysis of differential expression. | RNA-Seq: Essential for determining statistically significant gene expression changes from count matrix data [108] [109]. |
The question of whether RNA-Seq is a viable alternative to qPCR for validation is not answered with a simple "yes" or "no." Instead, the relationship between these two powerful techniques is evolving from a strictly sequential workflow to a more dynamic and strategic partnership.
For the validation of a small number of predetermined targets, qPCR remains the superior choice due to its lower cost, rapid turnaround, operational simplicity, and well-defined standards like the MIQE guidelines [104] [105].
However, RNA-Seq emerges as a compelling and often superior validation tool in specific contexts, particularly when the validation goal expands beyond simple confirmation to include characterization of transcriptomic complexity. This includes detecting specific splice variants, identifying fusion genes, or validating a multi-gene expression signature where the full scope of isoforms is unknown [107] [104]. Its ability to capture this additional layer of information in a single assay makes it highly valuable for in-depth mechanistic studies or when sample material is extremely limited.
Therefore, the future of validation is not about one technology replacing the other, but about making an informed, context-dependent choice. Researchers must weigh factors such as the number of targets, required information content, sample availability, budget, and in-house expertise. In an increasingly data-driven research environment, the most robust validation strategy will often be one that intelligently leverages the complementary strengths of both qPCR and RNA-Seq to build a more complete and reliable picture of the transcriptome.
Conclusion
The integration of RNA-Seq and qPCR forms a powerful, synergistic pipeline for gene expression analysis, combining the discovery power of one with the validation strength of the other. A successful workflow hinges on understanding the distinct advantages of each technology, executing a meticulous methodological process, proactively troubleshooting common pitfalls, and implementing a rigorous validation strategy. As both technologies advance—with improvements in RNA-seq bioinformatics for complex gene families like HLA and the growing robustness of automated qPCR systems—this integrated approach will become even more critical. For biomedical and clinical research, mastering this pipeline is fundamental for generating reliable, reproducible data that can confidently inform drug development, biomarker identification, and our understanding of disease mechanisms, ultimately bridging the gap between foundational discovery and clinical application.
References
- 1. Benchmarking of RNA-sequencing analysis workflows using whole-transcriptome RT-qPCR expression data | Scientific Reports [https://www.nature.com/articles/s41598-017-01617-3]
- 2. RNA-Seq: a revolutionary tool for transcriptomics - PMC [https://pmc.ncbi.nlm.nih.gov/articles/PMC2949280/]
- 3. Whole Transcriptome vs. Targeted Gene Expression Profiling [https://missionbio.com/company/blog/comparison-whole-transcriptome-vs-targeted-gene-expression-profiling/]
- 4. A Beginner's Guide to Analysis of RNA Sequencing Data [https://pmc.ncbi.nlm.nih.gov/articles/PMC6096346/]
- 5. RNA Sequencing and Analysis - PMC [https://pmc.ncbi.nlm.nih.gov/articles/PMC4863231/]
- 6. Visualization methods for differential expression analysis [https://bmcbioinformatics.biomedcentral.com/articles/10.1186/s12859-019-2968-1]
- 7. How to Analyze RNAseq Data for Absolute Beginners Part 3 [https://ngs101.com/how-to-analyze-rnaseq-data-for-absolute-beginners-part-3-from-count-table-to-degs-best-practices/]
- 8. qPCR, Microarrays or RNA Sequencing - What to Choose? [https://biosistemika.com/blog/qpcr-microarrays-rna-sequencing-choose-one/]
- 9. NGS vs qPCR [https://www.illumina.com/science/technology/next-generation-sequencing/beginners/advantages/ngs-vs-qpcr.html]
- 10. BLOG: Choosing the Right RNA Analysis Method [https://www.eurofins-viracorbiopharma.com/resource-library/posts/2025/june/blog-choosing-the-right-rna-analysis-method-rna-seq-nanostring-or-qpcr/]
- 11. Comparison between qPCR and RNA-seq reveals challenges ... [https://pmc.ncbi.nlm.nih.gov/articles/PMC9883133/]
- 12. Analyzing qPCR data: Better practices to facilitate rigor and ... [https://www.sciencedirect.com/science/article/pii/S2405580825004431]
- 13. A stable combination of non-stable genes outperforms ... [https://www.nature.com/articles/s41598-024-82651-w]
- 14. PCR Cycle Number in RNA-Seq [https://www.lexogen.com/blog/amplification-of-rna-seq-libraries-the-correct-pcr-cycle-number/]
- 15. RNA Sequencing | RNA-Seq methods & workflows [https://www.illumina.com/techniques/sequencing/rna-sequencing.html]
- 16. RNA-seq validation – software for selection of reference ... [https://www.rna-seqblog.com/rna-seq-validation-software-for-selection-of-reference-and-variable-candidate-genes-for-rt-qpcr/]
- 17. A transcriptome software comparison for the analyses of ... [https://bmcgenomics.biomedcentral.com/articles/10.1186/s12864-022-08673-8]
- 18. RNA-seq and ChIP-seq as Complementary Approaches for ... [https://pmc.ncbi.nlm.nih.gov/articles/PMC6981605/]
- 19. Integrating Artificial Intelligence in Next-Generation Sequencing [https://pmc.ncbi.nlm.nih.gov/articles/PMC12191491/]
- 20. A real-world multi-center RNA-seq benchmarking study ... [https://www.nature.com/articles/s41467-024-50420-y]
- 21. Integrating AI and RNA biomarkers in cancer [https://pmc.ncbi.nlm.nih.gov/articles/PMC12512311/]
- 22. RNA-Seq in Cancer Research: Driving Precision Medicine ... [https://www.lexogen.com/blog/how-rna-sequencing-is-revolutionizing-cancer-research-bringing-precision-medicine-to-cancer-patients/]
- 23. RnaXtract, a tool for extracting gene expression, variants ... [https://www.nature.com/articles/s41598-025-16875-9]
- 24. An updated comparison of microarray and RNA-seq for ... [https://bmcgenomics.biomedcentral.com/articles/10.1186/s12864-025-11548-3]
- 25. Biomarker discovery for early breast cancer diagnosis ... [https://www.sciencedirect.com/science/article/pii/S0010482525009357]
- 26. Assessment of Sequencing for Pathogen-Agnostic ... [https://www.jhuapl.edu/technical-digest/issues/vol-37-no-4-2025/biothreat-diagnostics-detection-actionability]
- 27. Integrating DNA and RNA sequencing for enhanced ... [https://pmc.ncbi.nlm.nih.gov/articles/PMC11907987/]
- 28. MIQE 2.0 and the Urgent Need to Rethink qPCR Standards [https://pmc.ncbi.nlm.nih.gov/articles/PMC12154065/]
- 29. DNase Treatment in RNA Extraction: Essential or Optional? [https://www.lexogen.com/blog/rna-lexicon-dnase-to-treat-or-not-to-treat/]
- 30. Designing Successful RNA-Seq Experiments for Drug ... [https://alitheagenomics.com/blog/designing-successful-rna-seq-experiments-for-drug-discovery-a-strategic-approach]
- 31. RNA extraction, DNAse treatments and quality control [https://bio-protocol.org/exchange/minidetail?id=3424035&type=30]
- 32. Protocol for RNA-seq library preparation from low-volume ... [https://pmc.ncbi.nlm.nih.gov/articles/PMC12630345/]
- 33. RNA-Seq Experimental Design Guide for Drug Discovery [https://www.lexogen.com/blog/planning-for-success-a-strategic-design-guide-for-rna-seq-experiments-in-drug-discovery/]
- 34. Choice Of One Step RT-qPCR Or Two Step RT-qPCR | NEB [https://www.neb.com/en-us/applications/dna-amplification-pcr-and-qpcr/choice-of-one-step-rt-qpcr-or-two-step-rt-qpcr]
- 35. One-step vs. two-step RT-qPCR—tips for choosing the right protocol [https://www.takarabio.com/about/bioview-blog/tips-and-troubleshooting/one-step-vs-two-step-rt-qpcr]
- 36. Starting with RNA—One-step or two-step RT-qPCR? | IDT [https://eu.idtdna.com/page/support-and-education/decoded-plus/one-step-two-step/]
- 37. Brief guide to RT-qPCR - PMC [https://pmc.ncbi.nlm.nih.gov/articles/PMC11612376/]
- 38. qPCR and RT-qPCR [https://www.promega.com/resources/guides/nucleic-acid-analysis/qpcr-and-rt-qpcr-amplification/]
- 39. One-step and two-step qPCR assays for CAPRV2023 [https://www.frontiersin.org/journals/veterinary-science/articles/10.3389/fvets.2025.1620997/full]
- 40. Exploring RNA-Seq Data Analysis Through Visualization ... [https://www.mdpi.com/2306-5354/12/1/56]
- 41. - RNA : Basics, Applications & Seq ... | Technology Networks Protocol [https://www.technologynetworks.com/genomics/articles/rna-seq-basics-applications-and-protocol-299461]
- 42. Do I Need to Validate My RNA - Seq Results With qPCR ? [https://www.rna-seqblog.com/do-i-need-to-validate-my-rna-seq-results-with-qpcr/]
- 43. a practical guide to RNA sequencing data analysis [https://pmc.ncbi.nlm.nih.gov/articles/PMC12599993/]
- 44. Evaluation and validation of reference genes for RT-qPCR ... [https://www.nature.com/articles/s41598-025-22650-7]
- 45. Selection and validation of RT-qPCR reference genes for ... [https://pubmed.ncbi.nlm.nih.gov/41013193/]
- 46. Rules and Tips for PCR & qPCR Primer Design | IDT [https://www.idtdna.com/page/support-and-education/decoded-plus/how-to-design-primers-and-probes-for-pcr-and-qpcr/]
- 47. Primer design guide - 5 tips for best PCR results [https://the-dna-universe.com/2022/09/05/primer-design-guide-the-top-5-factors-to-consider-for-optimum-performance/]
- 48. An optimized protocol for stepwise optimization of real-time ... [https://www.nature.com/articles/s41438-021-00616-w]
- 49. qPCR primer design revisited - PMC - PubMed Central - NIH [https://pmc.ncbi.nlm.nih.gov/articles/PMC5702850/]
- 50. Optimization and validation of a consolidated Set ... [https://www.sciencedirect.com/science/article/pii/S2215016125004443]
- 51. High-Throughput Data Analysis for qPCR [https://www.neb.com/en-us/tools-and-resources/feature-articles/development-of-a-high-throughput-data-analysis-method-for-quantitative-real-time-pcr?srsltid=AfmBOopu8p6Gs7rLiSNBaZZXEqKbosSCLVZ_z4Njp0WKpyXUypza6-DB]
- 52. Understanding qPCR Efficiency and Why It Exceeds 100% [https://biosistemika.com/blog/qpcr-efficiency-over-100/]
- 53. The Role of Liquid Handling Automation in Reducing Human ... [https://pipettetips.com/blogs/blog/the-role-of-liquid-handling-automation-in-reducing-human-error-in-life-science-labs?srsltid=AfmBOooy3Tz42DVCtNyQCHDtSUCaKhsLfbiE9Xg8FFW0mGLUL-Vhjh3G]
- 54. The Future of Lab Automation: Trends in Liquid Handling ... [https://www.apollotechnical.com/the-future-of-lab-automation/]
- 55. Automation of RNA-Seq Sample Preparation and ... [https://www.mdpi.com/2076-2607/13/4/849]
- 56. Automated Liquid Handlers As Sources of Error [https://www.bioprocessintl.com/assays/automated-liquid-handlers-as-sources-of-error]
- 57. Automated Liquid Handlers as Sources of Error [https://www.aicompanies.com/education-training/knowledge-center/automated-liquid-handlers-as-sources-of-error/]
- 58. From Total RNA to Differentially Expressed Genes [https://pmc.ncbi.nlm.nih.gov/articles/PMC12646576/]
- 59. Development of an End-to-End Total RNA Sequencing Quality ... [https://pubmed.ncbi.nlm.nih.gov/40578551/]
- 60. Exploring the impact of primer length on efficient gene ... [https://www.nature.com/articles/s41467-024-49685-0]
- 61. A Super Enhancer-Derived Enhancer RNA Acts Together ... [https://pmc.ncbi.nlm.nih.gov/articles/PMC12026470/]
- 62. qPCR Efficiency Determination Protocol [https://www.merckmillipore.com/CI/fr/technical-documents/protocol/genomics/qpcr/qpcr-efficiency-determination]
- 63. Efficiency and sensitivity optimization of a protocol to ... [https://www.sciencedirect.com/science/article/pii/S0195670122002742]
- 64. Troubleshooting Non-Specific Amplification [https://bento.bio/resources/bento-lab-advice/troubleshooting-non-specific-amplification-with-bento-lab/]
- 65. Amplification of nonspecific products in quantitative ... [https://pmc.ncbi.nlm.nih.gov/articles/PMC5727009/]
- 66. Eliminating primer dimers and improving SNP detection ... [https://pmc.ncbi.nlm.nih.gov/articles/PMC7200914/]
- 67. dPCR assay development | Digital PCR troubleshooting [https://www.qiagen.com/us/applications/digital-pcr/beginners/dpcr-guide/setup-and-troubleshooting]
- 68. What is a Ct Value and does it differ from qPCR Cq Values? [https://bitesizebio.com/24581/what-is-a-ct-value/]
- 69. How To Interpret RT-qPCR Results [https://www.goldbio.com/blogs/articles/how-to-interpret-rt-qpcr-results?srsltid=AfmBOooaAnVROf-S2-csEt9wePZIG-6F1XXmykPPfpDRVfLDJWhSfKQj]
- 70. PCR/qPCR Data Analysis [https://www.sigmaaldrich.com/US/en/technical-documents/technical-article/genomics/qpcr/data-analysis?srsltid=AfmBOor-P_JTO8UMaTeSRglAYylhppqUx0dxuDo6qFeH2D6gNnkKYaby]
- 71. The Reasonable Range of Ct Values in qPCR Experiments [https://www.yeasenbio.com/blogs/molecular-biology/the-reasonable-range-of-ct-values-in-qpcr-experiments]
- 72. Control your error! How to minimize pipetting error and get ... [https://bitesizebio.com/25261/control-your-error-how-to-minimize-pipetting-error-and-get-low-sds-in-qrt-pcr/]
- 73. Troubleshooting fine‐tuning procedures for qPCR system ... [https://pmc.ncbi.nlm.nih.gov/articles/PMC6647679/]
- 74. qPCR primer design revisited [https://www.sciencedirect.com/science/article/pii/S221475351730181X]
- 75. Optimization Tips for Luna® One-Step RT-qPCR [https://www.neb.com/en-us/tools-and-resources/usage-guidelines/optimization-tips-for-luna-one-step-rt-qpcr?srsltid=AfmBOoqj2oPwCdWX7m-fYtgOLPZ7qXmrP1qLdSBYARKUQd_FdXR6wWGv]
- 76. How to optimize qPCR in 9 steps? [https://westburg.eu/knowledge/pcr_qpcr/hate_optimizing_qpcr]
- 77. How To Interpret RT-qPCR Results [https://www.goldbio.com/blogs/articles/how-to-interpret-rt-qpcr-results?srsltid=AfmBOopQkFWOM7RUWLo994RnlV1Cl7ZE6DVMUpJUK8QnYn0aPcPv1UT3]
- 78. Primer designing tool - NCBI - NIH [https://www.ncbi.nlm.nih.gov/tools/primer-blast/]
- 79. Benchmarking of RNA -sequencing analysis workflows using... [https://pmc.ncbi.nlm.nih.gov/articles/PMC5431503/]
- 80. MIXnorm: normalizing RNA-seq data from formalin-fixed ... [https://pmc.ncbi.nlm.nih.gov/articles/PMC7267832/]
- 81. Comparative analysis of library preparation approaches for ... [https://www.nature.com/articles/s41598-025-12992-7]
- 82. Whole Transcriptome vs 3' mRNA-Seq: How to Choose ... [https://www.lexogen.com/blog/choosing-between-whole-transcriptome-total-rna-seq-and-3-mrna-seq/]
- 83. Low-Quality/FFPE RNA-Seq Solutions [https://www.illumina.com/science/education/ffpe-sample-analysis/low-quality-ffpe-rna-seq.html]
- 84. FFPEcap-seq: a method for sequencing capped RNAs in ... [https://pmc.ncbi.nlm.nih.gov/articles/PMC6836741/]
- 85. Consensus guidelines for the validation of qRT-PCR ... [https://pmc.ncbi.nlm.nih.gov/articles/PMC8792405/]
- 86. Do results obtained with RNA-sequencing require ... [https://pmc.ncbi.nlm.nih.gov/articles/PMC7823214/]
- 87. RNA-seq validation: software for selection of reference and ... [https://bmcgenomics.biomedcentral.com/articles/10.1186/s12864-024-10511-y]
- 88. An improvement of the 2ˆ(–delta delta CT) method for ... [https://pmc.ncbi.nlm.nih.gov/articles/PMC4280562/]
- 89. MIQE 2.0: Revision of the Minimum Information for ... [https://pubmed.ncbi.nlm.nih.gov/40272429/]
- 90. An updated comparison of microarray and RNA-seq for ... [https://pmc.ncbi.nlm.nih.gov/articles/PMC12016467/]
- 91. TempO-seq and RNA-seq gene expression levels are highly ... [https://journals.plos.org/plosone/article?id=10.1371/journal.pone.0320862]
- 92. Benchmarking of RNA-Seq analysis workflows [https://www.rna-seqblog.com/benchmarking-of-rna-seq-analysis-workflows/]
- 93. Commentary: a review of technical considerations for planning ... [https://bmcgenomics.biomedcentral.com/articles/10.1186/s12864-025-12094-8]
- 94. A comprehensive workflow for optimizing RNA-seq data analysis [https://bmcgenomics.biomedcentral.com/articles/10.1186/s12864-024-10414-y]
- 95. RNA-seq validation: software for selection of reference and ... [https://pmc.ncbi.nlm.nih.gov/articles/PMC11251314/]
- 96. Validated reference genes for normalization of RT-qPCR in ... [https://www.nature.com/articles/s41598-025-08295-6]
- 97. Clinical applications of and molecular insights from RNA ... [https://genomemedicine.biomedcentral.com/articles/10.1186/s13073-025-01494-w]
- 98. Selection and validation of reference genes for measuring ... [https://pmc.ncbi.nlm.nih.gov/articles/PMC7528382/]
- 99. Innovative GenExpA software for selecting suitable ... [https://www.nature.com/articles/s41598-022-07257-6]
- 100. Selection and evaluation of new reference genes for qRT ... [https://www.sciencedirect.com/science/article/pii/S235251342500167X]
- 101. A computational framework to improve cross-platform ... [https://pmc.ncbi.nlm.nih.gov/articles/PMC11245942/]
- 102. Loss of Gene Information: Discrepancies between RNA ... [https://pmc.ncbi.nlm.nih.gov/articles/PMC8430810/]
- 103. Clinical and analytical validation of a combined RNA ... [https://www.nature.com/articles/s43856-025-00934-3]
- 104. Real-Time PCR (qPCR) and Whole-Transcriptome NGS [https://www.thermofisher.com/us/en/home/life-science/pcr/real-time-pcr/ngs-comparison.html]
- 105. MIQE: Real-Time PCR Experiment Standards [https://www.sigmaaldrich.com/US/en/technical-documents/technical-article/genomics/qpcr/minimum-information-for-publication-of-quantitative-real-time-pcr-experiments?srsltid=AfmBOor8AR6Do2U_Ti886BibqAU_p5TYCvVKCmGE2GTTwlxf3ofQefQZ]
- 106. Cost comparison for qRT-PCR and RNA-Seq [https://www.rna-seqblog.com/cost-comparison-for-qrt-pcr-and-rna-seq/]
- 107. Cracking rare disorders: a new minimally invasive RNA- ... [https://www.nature.com/articles/s41525-025-00502-7]
- 108. From bench to bytes: a practical guide to RNA sequencing ... [https://www.frontiersin.org/journals/genetics/articles/10.3389/fgene.2025.1697922/full]
- 109. A Guide to Basic RNA Sequencing Data Processing and ... [https://pmc.ncbi.nlm.nih.gov/articles/PMC12067304/]