Getting Started with Genomic Variant Annotation: A Comprehensive Guide for Researchers and Clinicians
This guide provides a foundational and practical roadmap for researchers and drug development professionals embarking on genomic variant annotation.
Getting Started with Genomic Variant Annotation: A Comprehensive Guide for Researchers and Clinicians
Abstract
This guide provides a foundational and practical roadmap for researchers and drug development professionals embarking on genomic variant annotation. It covers core concepts, from defining genetic variants and their functional impact to implementing best-practice workflows for coding and non-coding regions. The article delves into advanced methodologies, including high-throughput functional assays, and addresses critical challenges such as tool discrepancies and the optimization of variant prioritization. Finally, it offers a comparative analysis of validation strategies and emerging technologies, equipping readers to accurately interpret genetic variation for disease research and therapeutic development.
Understanding Variant Annotation: From Raw Data to Biological Insight
The dramatic reduction in the cost and time of sequencing has democratized access to whole genome and exome data. However, the transition from raw sequencing data to biologically and clinically meaningful insights remains a significant challenge. The core bottleneck in genomic analysis is no longer data generation but rather data interpretation [1]. This process, which bridges the gap between a list of genetic variants and an understanding of their functional impact on health and disease, is critical for advancing personalized medicine, diagnosing rare genetic disorders, and identifying novel drug targets [2]. The primary goal of functional interpretation is to move beyond simply identifying the location of a variant to predicting its potential consequences on protein function, gene regulation, and cellular processes, ultimately elucidating its role in phenotype and disease pathology [1].
This guide provides a comprehensive technical roadmap for researchers and drug development professionals embarking on genomic variant annotation research. It outlines the definitive goal of the interpretation workflow: to systematically prioritize genetic variants and translate their predicted functional impacts into actionable biological insights that can inform clinical diagnostics and therapeutic development.
The Genomic Interpretation Workflow: From Sequencing to Insight
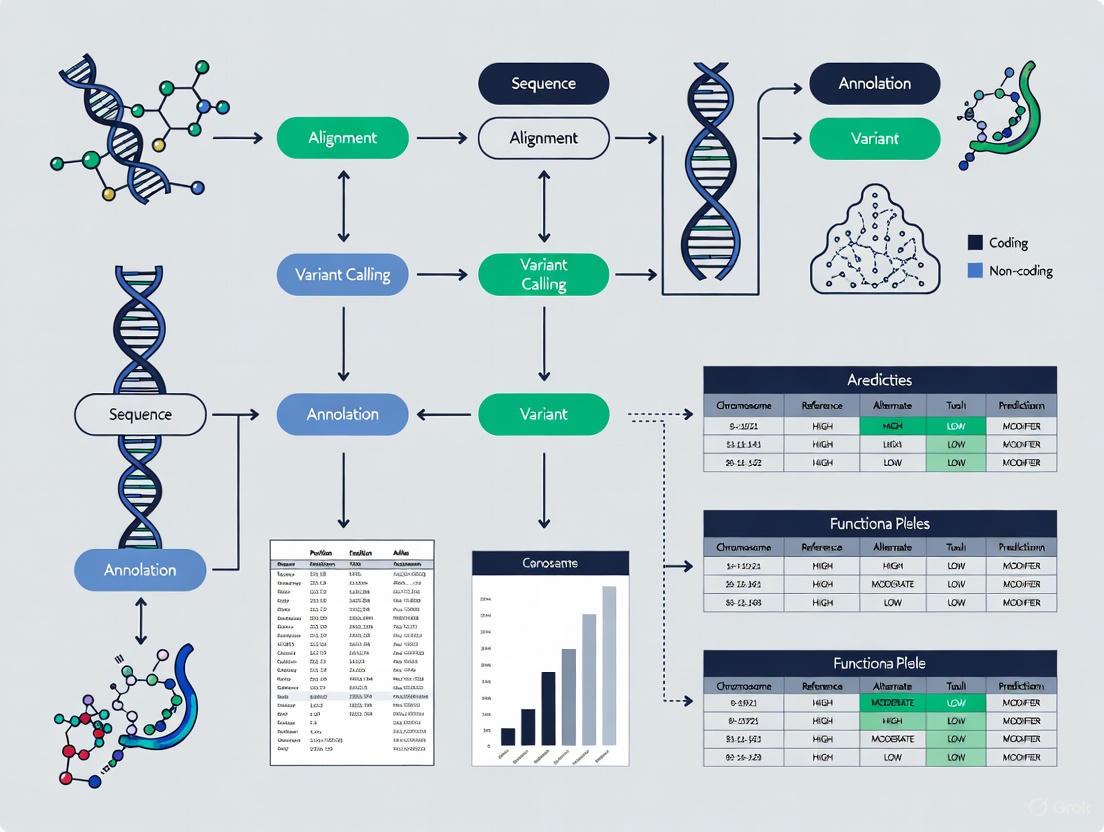
The journey from raw sequencing data to a functionally annotated and prioritized variant list is a multi-stage process. The following diagram illustrates the complete logical workflow, highlighting the key steps and decision points.
Core Technical Stages: A Detailed Methodological Breakdown
Data Preprocessing and Variant Calling
The foundational stage of the workflow involves generating a high-confidence set of genetic variants from raw sequencing reads.
- Read Alignment: The process begins by mapping short sequencing reads from FASTQ files to a reference genome (e.g., GRCh38). Tools like BWA-MEM are standard for this task, as they efficiently handle the alignment of millions of reads, accounting for possible gaps and mismatches [3]. The output is a Sequence Alignment/Map (SAM) file, which is then converted to its binary, compressed counterpart (BAM) for efficient storage and processing.
- Variant Calling: The sorted BAM file is analyzed to identify sites where the sequenced DNA differs from the reference genome. The
bcftools mpileupandcallcommands are commonly used for this purpose [3]. Thempileupstep examines the aligned reads to compute the likelihood of variants at each genomic position, while thecallstep makes the final determination, outputting a Variant Call Format (VCF) file. This file contains the genomic coordinates of the variants (chromosome, position), the reference and alternate alleles, and initial quality metrics.
Functional and Clinical Annotation
Annotation is the critical step that transforms a generic list of variants into a biologically meaningful dataset. This involves layering information from various biological databases onto each variant in the VCF file.
- Functional Impact Prediction: Tools like the Ensembl Variant Effect Predictor (VEP) and SnpEff are the workhorses of this stage [1] [4]. They determine the genomic context of each variant (e.g., intronic, exonic, intergenic) and predict its molecular consequence. For coding variants, this includes classifying the effect as missense, nonsense, synonymous, or frameshift, and predicting its impact on the protein sequence and structure [3].
- Integration of External Databases: Clinical and population frequency data are indispensable for prioritization. ClinVar is a key resource that provides assertions about the clinical significance of variants (e.g., Pathogenic, Benign) [5] [3]. Population databases like gnomAD provide allele frequencies across diverse populations, helping to filter out common variants unlikely to cause rare, severe diseases [5]. Annotation pipelines cross-reference variants against these and other databases, appending the information to the VCF's INFO field.
Variant Filtering and Prioritization
With annotation complete, the goal is to narrow down thousands of variants to a manageable shortlist for further investigation.
- Application of Biological and Clinical Filters: In a clinical context, such as diagnosing a rare disease, one might first filter for variants that are rare in the population (e.g., gnomAD allele frequency < 0.01), have a predicted deleterious effect (e.g., stop-gain, frameshift), and are classified as "Pathogenic" in ClinVar [5]. For trio analysis (e.g., parent-child), inheritance models (e.g., de novo, recessive) can be applied.
- Case Study Example: As demonstrated in a Sarek pipeline tutorial, a systematic approach can identify a causative variant. The process involved filtering a case sample for homozygous alternative alleles not present in a control, leading to the identification of a nonsense mutation in the
COL6A1gene. Cross-referencing with ClinVar confirmed its pathogenic status, providing a molecular diagnosis [5].
A successful variant interpretation project relies on a suite of bioinformatics tools, databases, and computational resources. The table below catalogues the key components of a modern genomic interpretation toolkit.
Table 1: Essential Resources for Genomic Variant Interpretation
| Category | Tool/Resource | Primary Function | Key Features / Applications |
|---|---|---|---|
| Workflow Management | Sarek [5], cio-abcd/variantinterpretation [4] | Automated end-to-end variant calling & annotation | Built on Nextflow for portability & reproducibility; integrates multiple best-practice tools. |
| Functional Annotation | Ensembl VEP [1] [4] | Predicts variant consequences on genes & transcripts | Annotates with consequence, SIFT, PolyPhen; uses cache for public databases. |
| Functional Annotation | SnpEff [3] | Genomic variant effect annotation | Annotates effects, impacts; used for adding ANN field to VCF. |
| Clinical Annotation | ClinVar [5] [3] | Archive of human variant interpretations | Provides clinical significance (Pathogenic/Benign) for variant prioritization. |
| Population Frequency | gnomAD [5] | Catalog of human genetic variation | Filters common polymorphisms; inspects gene constraint (LOEUF score). |
| VCF Manipulation | bcftools [4] [3] | VCF processing & normalization | Indexing, filtering, normalization (left-align indels), merging files. |
| Reporting | MultiQC [4] | Quality control report generation | Summarizes QC metrics from multiple tools into a single HTML report. |
Advanced Considerations and Future Directions
As the field evolves, several advanced topics are becoming integral to comprehensive variant interpretation.
- The Non-Coding Challenge: A significant limitation of early genomic studies was their focus on protein-coding regions. It is now understood that the majority of disease-associated variants from GWAS lie in non-coding regions [1]. Advanced annotation must therefore include regulatory elements such as promoters, enhancers, and non-coding RNAs. Techniques like Hi-C, which probes the 3D organization of the genome, are vital for linking non-coding variants to the genes they potentially regulate [1].
- The Rise of Multi-Omics and AI: Integrating genomic data with other molecular layers—such as transcriptomics, proteomics, and epigenomics—provides a more holistic view of a variant's functional impact [6]. Furthermore, artificial intelligence and machine learning are being leveraged to improve the accuracy of variant calling (e.g., DeepVariant) and to predict pathogenicity from sequence alone, helping to interpret variants of uncertain significance (VUS) [6].
- Reproducibility and Data Reusability: Ensuring that genomic analyses are reproducible and that data can be reused by the community is a critical challenge. Incomplete metadata and non-standardized reporting hamper this goal [7]. Adherence to FAIR (Findable, Accessible, Interoperable, and Reusable) data principles and the use of containerized workflows (e.g., Docker, Singularity) are essential practices for robust and shareable genomic science [4] [7].
The path from variant calling to functional interpretation is a complex but well-defined process that is fundamental to unlocking the value of genomic data. By following a structured workflow—encompassing rigorous data generation, comprehensive functional and clinical annotation, and systematic prioritization—researchers can transform a list of genetic differences into actionable biological insights. As technologies for sequencing and computational analysis continue to advance, the goal remains constant: to precisely determine the functional consequences of genetic variation, thereby accelerating the delivery of precision medicine and the development of novel therapeutics.
Genetic variants are differences in the DNA sequence that occur naturally between individuals in a population and form the basis of genetic diversity [8]. The genetic blueprint of every living organism, from humans to microbes, is written in DNA and shaped by a remarkable phenomenon: genetic variation [9]. These variations make each of us unique, contribute to susceptibility to certain diseases, and influence our response to the environment [9]. For scientists, understanding these genomic variants is critical not just for health research but also for advancing fields like agriculture and environmental sustainability [9].
The analysis of high-quality genomic variant data offers a more complete understanding of the human genome, enabling researchers to identify novel biomarkers, stratify patients based on disease risk factors, and decipher underlying biological pathways [10]. While the availability of genomic data has sharply increased in recent years, the accessibility of bioinformatic tools to aid in its preparation is still lacking, primarily due to the large volume of data, associated computational and storage costs, and difficulty in identifying targeted and relevant information [10].
Fundamental Variant Types and Characteristics
Single Nucleotide Variants (SNVs)
Single Nucleotide Variants (SNVs), often referred to as Single Nucleotide Polymorphisms (SNPs) when discussing frequent variations in populations, represent the most prevalent type of genetic variation [9] [1] [8]. Each SNV represents a change at a single nucleotide—the basic building block of DNA [9]. In every human genome, there are typically around 4 to 5 million SNVs [9].
The implications of SNVs are profound, especially when they occur in coding regions or regulatory elements of genes [9]. When SNVs occur within coding regions, they can result in amino acid substitutions (missense mutations), leading to altered protein structure and function [9]. In some cases, this change can be benign, but in others, it can significantly impact biological processes and contribute to disease [9]. Similarly, SNVs in regulatory elements can disrupt the normal control of gene expression, affecting when, where, and how much of a protein is produced [9]. These disruptions have the potential to influence a wide array of conditions, including genetic diseases such as cystic fibrosis and sickle cell anemia, as well as complex diseases like cancer [9].
SNVs have become very important markers for certain diseases, such as breast cancer, and serve as guideposts for developing personalized treatments [8]. In fact, there are approximately 180 SNPs associated with the development of breast cancer [8].
Insertion and Deletion Variations (Indels)
Insertions and Deletions (Indels) represent another significant class of genetic variation, involving the addition or removal of small segments of DNA within the genome [9]. Indels can range in size from just a single nucleotide to a few dozen base pairs, but even these seemingly minor changes can have dramatic effects on gene function [9]. This is especially true when indels occur within coding regions of the genome, as they can disrupt the gene's reading frame, a phenomenon known as a frameshift mutation [9].
Even small indels can have a considerable impact on biological processes and are frequently associated with genetic diseases [9]. It's estimated that humans have several million indels in their genome [8]. In the disease cystic fibrosis, for example, indels are responsible for the deletion of a single amino acid that triggers the disease [8]. The detection of small variants like SNVs and indels requires a sequencing technology that prioritizes high accuracy to distinguish true variants from sequencing errors and can handle difficult-to-sequence regions to ensure comprehensive detection [9].
Table 1: Comparative Analysis of Primary Genetic Variant Types
| Variant Type | Definition | Typical Size Range | Primary Functional Impact | Example Disease Associations |
|---|---|---|---|---|
| Single Nucleotide Variants (SNVs) | Change at a single nucleotide position | 1 base pair | Amino acid substitution, disrupted regulatory sites | Cystic fibrosis, sickle cell anemia, cancer [9] |
| Insertions/Deletions (Indels) | Addition or removal of DNA segments | 1 to ~10,000 base pairs [8] | Frameshift mutations, disrupted reading frames | Cystic fibrosis [9] [8] |
| Structural Variants (SVs) | Larger genomic rearrangements | >50 base pairs [9] | Gene disruption, rearrangements of key genomic regions | Autism, schizophrenia, cancer [9] |
| Copy Number Variants (CNVs) | Duplication or deletion of large sections | Large segments (genes or chromosomal regions) | Altered gene dosage | Autism spectrum disorder, developmental disorders [9] |
The Critical Challenge of Non-Coding Regions
The Prevalence and Importance of Non-Coding Variants
The majority of human genetic variation resides in non-protein coding regions of the genome [1] [11]. While the most studied variants are those in coding regions that directly alter protein sequences, the challenge of exploring non-coding regions (intergenic, intronic) and providing exhaustive functional annotation of these unknown regions remains substantial, despite the critical role that non-coding regions play in human disease [1]. The expanding collection of human WGS data, combined with the understanding of regulatory elements such as promoters, enhancers, transcription factor binding sites (TFBS), non-coding RNAs, and transposable elements, has the potential to transform our limited knowledge of the functional importance of these regions into a wealth of information [1].
Mutations in non-coding regions can affect the binding of transcription factors and alter the regulation of gene expression [12]. Such mutations may contribute to the development of disease [12]. Genome-wide association studies (GWAS) have identified hundreds of thousands of variants associated with complex pathological phenotypes, most of them in non-coding DNA [12]. Determining the functional effects of these variants has been a major challenge for GWAS [12].
Regulatory Elements in Non-Coding Regions
Non-coding regions contain critical regulatory elements that control gene expression. The key regulatory elements include:
- Promoters and Enhancers: Regions that control the initiation and rate of transcription [1]
- Transcription Factor Binding Sites (TFBS): Specific DNA sequences where transcription factors bind to regulate transcription [1]
- Non-coding RNAs: Functional RNA molecules that are not translated into proteins, including microRNAs and long non-coding RNAs [1]
- DNA Methylation Sites: Epigenetic modifications that regulate gene expression [1]
- Transposable Elements: DNA sequences that can change position within the genome [1]
The crux of a mechanistically insightful genome annotation lies in the functional interpretation at the gene level, rendering the interpretation of intergenic and non-coding variants particularly difficult [1]. By providing methods and resources for comprehensive functional annotation of both coding and non-coding regions, we can enhance our understanding of the relationship between non-coding variation and clinical disease [1]. This, in turn, will provide a more thorough understanding of disease biology and could reveal opportunities for developing novel therapeutic targets, generating novel druggable biomarkers, and identifying new drug candidates [1].
Experimental Methodologies for Variant Analysis
Sequencing Technologies and Variant Calling
The advent of next-generation sequencing (NGS) technologies has enabled a drastic growth in the number of sequencing projects by largely increasing the sequence output and by lowering overall costs [13]. Certain projects involve the sequencing of an organism whose genome is already available [13]. These projects, called resequencing projects, generally involve two steps: the mapping of reads onto the known genome and the subsequent analysis of divergent features between the reference genome and the mapped sequences [13].
The detection of small variants like SNVs and indels requires a sequencing technology that prioritizes high accuracy to distinguish true variants from sequencing errors and can handle difficult-to-sequence regions to ensure comprehensive detection [9]. HiFi sequencing provides high-resolution insights into these small genetic variants, making it easier to detect SNVs, even in challenging regions of the genome such as homopolymers or GC-rich sequences [9]. This precision is equally critical for identifying indels, reducing the risk of missing critical mutations and providing a powerful tool for understanding genetic contributions to disease [9].
Benchmarking Variant Calling Pipelines
Recent studies have compared various bioinformatics pipelines for whole genome sequencing data pre-processing. These comparisons involve different mapping and alignment approaches and variant calling pipelines, with performance assessed by computation time, F1 score, precision, and recall [14].
Table 2: Performance Metrics of Variant Calling Pipelines for SNVs and Indels
| Pipeline (Mapping/Variant Calling) | F1 Score (SNVs) | Precision (SNVs) | Recall (SNVs) | F1 Score (Indels) | Precision (Indels) | Recall (Indels) | Compute Time (min) |
|---|---|---|---|---|---|---|---|
| DRAGEN/DRAGEN | 0.994 | 0.994 | 0.994 | 0.986 | 0.987 | 0.985 | 36 ± 2 [14] |
| DRAGEN/DeepVariant | 0.995 | 0.997 | 0.993 | 0.983 | 0.991 | 0.975 | 256 ± 7 [14] |
| DRAGEN/GATK | 0.988 | 0.990 | 0.986 | 0.971 | 0.976 | 0.966 | ~200 [14] |
| GATK/DRAGEN | 0.991 | 0.993 | 0.989 | 0.980 | 0.983 | 0.977 | ~220 [14] |
| GATK/DeepVariant | 0.993 | 0.996 | 0.990 | 0.977 | 0.987 | 0.967 | ~414 [14] |
| GATK/GATK | 0.986 | 0.989 | 0.983 | 0.967 | 0.974 | 0.960 | ~323 [14] |
In the mapping and alignment step, the DRAGEN pipeline was faster than the GATK with BWA-MEM2 pipeline [14]. DRAGEN showed systematically higher F1 score, precision, and recall values than GATK for single nucleotide variations (SNVs) and Indels in simple-to-map, complex-to-map, coding and non-coding regions [14]. In the variant calling step, DRAGEN was fastest [14]. In terms of accuracy, DRAGEN and DeepVariant performed similarly and both superior to GATK, with slight advantages for DRAGEN for Indels and for DeepVariant for SNVs [14].
Annotation Workflows and Functional Prediction
Variant Annotation Processes
Variant annotation is the process of associating metadata from public databases with corresponding variant data [10]. The choice of annotations can have a significant impact on the interpretation and conclusions of genomic analyses [10]. Functional annotation of genetic variants is a critical step in genomics research, enabling the translation of sequencing data into meaningful biological insights [1].
The major types of genetic variation include Single Nucleotide Variants (SNVs) and small insertions or deletions (indels) of two or more nucleotides, often detected through Whole Exome Sequencing (WES) or Whole Genome Sequencing (WGS) at the individual level [1]. Single Nucleotide Polymorphisms (SNPs) also refer to changes in a single nucleotide in a DNA sequence, although they represent frequent variations in the genome shared across a population, typically identified through GWAS [1]. While the concept of variant identification involves the detection of the precise location of variants on the reference genome and determining the alternate alleles, functional annotation specifically refers to predicting the potential impact of these variants on protein structure, gene expression, cellular functions, and biological processes [1].
Variant Annotation and Analysis Workflow
AI and Machine Learning Approaches
Artificial Intelligence (AI) has become a potent tool in identifying genetic mutations [12]. By leveraging AI capabilities, scientists can rapidly and accurately analyze vast amounts of data [12]. AI algorithms, such as machine learning (ML) and deep learning (DL), are used in genomic analysis to process and interpret large amounts of genetic data [12]. These algorithms can identify patterns, make predictions, and classify genetic variations based on training from large datasets [12].
One of the first works in this area was done by Kircher et al. (2014), who developed a computational framework called Combined Annotation Dependent Depletion (CADD) that integrates different annotations to assess the effects of genetic variants in the human genome [12]. They created a variant-by-annotation matrix containing millions of observed and simulated genetic variants along with their unique annotations [12]. They then trained a support vector machine (SVM) using features derived from the annotations to score all possible single nucleotide variants (SNVs) in the human genome [12].
Two notable examples of AI solutions for mutation detection are DeepSEA and ExPecto, both of which are based on DL [12]. DeepSEA is a DL method specifically designed to predict the effects of sequence changes on chromatin [12]. It can accurately predict the epigenetic state of a sequence, including factors such as transcription factor binding, DNase I sensitivity, and histone marks in multiple cell types [12]. This capability allows DeepSEA to predict the chromatin effects of sequence variants and prioritize regulatory variants [12].
ExPecto is another DL-based approach focused on understanding gene regulation [12]. It can accurately predict the tissue-specific transcriptional effects of mutations directly from a DNA sequence [12]. This includes the ability to predict the effects of rare or previously unobserved mutations [12]. It prioritizes causal variants within loci associated with disease or traits using data from publicly available GWAS [12].
One of the most recent developments is the DEMINING method created by Fu et al. (2023), which directly detects disease-linked genetic mutations from RNA-seq datasets [12]. By utilizing DEMINING to RNA-seq data from acute myeloid leukemia (AML) patients, previously underappreciated mutations were found in unannotated AML-connected gene loci [12].
Research Reagent Solutions and Computational Tools
The landscape of variant annotation tools is quite complex, as different tools target different genomic regions and perform different types of analyses [1]. Some tools specialize in annotating exonic (protein-coding) regions, focusing on variants that may alter amino acid sequences and affect protein function or structure [1]. These tools provide insights into the potential pathogenicity of missense mutations and other coding variants [1]. Other tools concentrate on non-exonic intragenic regions, such as introns and untranslated regions (UTRs), as well as intergenic regions [1].
Table 3: Essential Tools and Databases for Genomic Variant Annotation
| Tool/Database | Primary Function | Variant Type Applicability | Key Features |
|---|---|---|---|
| Ensembl VEP [1] [10] | Variant effect prediction | SNVs, Indels, SVs | Maps variants to genomic features, suited for large-scale WGS/WES |
| ANNOVAR [1] | Variant functional annotation | SNVs, Indels | Handles large-scale annotation tasks for WGS/WES projects |
| SnpEff/SnpSift [10] | Variant effect annotation and filtering | SNVs, Indels | Simplicity, portability, and efficiency; supports custom databases |
| dbNSFP [10] | Functional pathogenicity scores | SNVs | Provides 36 different functional pathogenicity scores (SIFT, PolyPhen, CADD) |
| ClinVar [10] | Clinical significance archive | All variant types | Public archive of genetic variants and their significance in human disease |
| dbSNP [10] | Variant repository | Primarily SNPs | Centralized repository of genetic variation; auto-generates IDs for known variants |
| Segtor [13] | Rapid annotation for NGS | Coordinates, SNVs, Indels, SVs | Uses segment trees instead of DBMS; determines position relative to genes |
| DeepVariant [14] [12] | AI-based variant calling | SNVs, Indels | Deep learning-based variant caller; high accuracy for SNVs |
| CADD [12] | Pathogenicity prediction | SNVs | Integrates multiple annotations using machine learning |
Genetic variants, particularly SNVs and indels, represent fundamental components of genetic diversity with profound implications for health and disease [9] [8]. The challenge of non-coding regions remains substantial in genomic research, as the majority of human genetic variation resides in these areas and their functional interpretation is complex [1] [11]. Advances in sequencing technologies, bioinformatics pipelines, and AI-powered analysis tools are progressively enhancing our ability to detect, annotate, and interpret these variants with increasing accuracy and efficiency [14] [12].
The field continues to evolve with improvements in annotation methodologies, functional prediction algorithms, and comprehensive databases [1] [10]. By addressing the challenges associated with both coding and non-coding variants, researchers can unlock deeper insights into disease mechanisms, identify novel therapeutic targets, and advance the field of personalized medicine [1] [12]. The integration of AI and machine learning approaches represents a particularly promising direction for future research, enabling more accurate prediction of variant effects and prioritization of clinically significant mutations [12].
The systematic annotation of genomic variants is a foundational step in human genetics, enabling researchers to transition from raw sequencing data to biologically and clinically meaningful insights. This process involves characterizing genetic alterations based on their genomic location, predicted functional impact on genes and regulatory elements, and population frequency. A critical distinction in this field lies between variants occurring in coding regions—the segments of DNA that are translated into protein—and those in non-coding regions, which encompass the vast majority of the genome and include crucial regulatory sequences. Next-generation sequencing technologies have democratized the ability to generate vast amounts of genetic variation data, creating a pressing need for accessible and robust bioinformatic tools to annotate and interpret these findings. The growing gap between data generation and biological interpretation frames the essential challenge that modern annotation pipelines aim to solve [15] [16]. This guide provides an in-depth technical examination of the key genomic features that differentiate coding and non-coding variant impact, equipping researchers with the methodologies and analytical frameworks needed for advanced genomic research.
Fundamental Biological distinctions
Coding Variants: Direct Impact on Protein Sequence
Coding variants occur within the exonic regions of genes that are translated into proteins. Their primary classification depends on their effect on the amino acid sequence of the resulting polypeptide.
- Non-synonymous Variants: These single nucleotide variants (SNVs) alter the amino acid sequence of the encoded protein. They are further categorized as:
- Missense: A change that results in the substitution of one amino acid for another. The functional impact can range from benign to severe, depending on the chemical properties of the substituted amino acids and the structural/functional importance of the residue.
- Nonsense: A change that creates a premature stop codon, leading to truncation of the protein product. This often results in non-functional or degraded proteins.
- Synonymous Variants: Often called "silent" variants, these SNVs do not change the encoded amino acid. While historically considered neutral, they can potentially affect RNA splicing, stability, or translation efficiency.
- Frameshift Variants: Typically caused by insertions or deletions (indels) that are not multiples of three nucleotides, these alterations disrupt the translational reading frame. This usually leads to a completely altered amino acid sequence downstream of the variant and often a premature stop codon.
- In-Frame Indels: These insertions or deletions involve a number of nucleotides that is a multiple of three, resulting in the addition or removal of one or more amino acids from the protein without altering the rest of the reading frame.
Non-Coding Variants: Disruption of Regulatory Grammar
Non-coding variants reside outside of protein-coding exons and exert their influence primarily by disrupting the complex regulatory architecture of the genome. Nearly 90% of disease risk-associated variants identified by genome-wide association studies (GWAS) are found in these non-coding regions [17]. Their functional annotation is more complex and relies on intersecting genomic coordinates with functional genomic datasets.
- Regulatory DNA Variants: These affect elements that control the spatial and temporal expression of genes.
- Promoter Variants: Located near transcription start sites, these can directly alter the binding of the basal transcription machinery.
- Enhancer/Silencer Variants: These can be located vast distances from their target genes and can disrupt the binding of transcription factors, thereby enhancing or repressing gene expression.
- Epigenetic Variants: These can alter the landscape of epigenetic marks, such as histone modifications (e.g., H3K4me3 for promoters, H3K27ac for active enhancers) and DNA methylation, which in turn influences chromatin accessibility and gene expression. For example, H3K4me3 marks in specific cell types like the brain's dorsolateral prefrontal cortex have been shown to be highly enriched for heritability of related traits [18].
- Splicing Variants: Located in intronic regions near exon-intron boundaries (e.g., splice donor and acceptor sites), these variants can disrupt the normal splicing of pre-mRNA, leading to aberrant transcript isoforms.
- Non-Coding RNA Variants: These affect genes that produce functional RNA molecules that are not translated into protein (e.g., microRNAs, long non-coding RNAs), potentially disrupting intricate regulatory networks.
Table 1: Comparative Impact of Coding vs. Non-Coding Variants
| Feature | Coding Variants | Non-Coding Variants |
|---|---|---|
| Primary Functional Impact | Alters protein amino acid sequence, structure, and function | Disrupts regulatory logic; modulates gene expression levels, timing, and cell-type specificity |
| Genomic Context | Exons of protein-coding genes | Promoters, enhancers, silencers, introns, non-coding RNA genes |
| Key Annotation Databases | RefSeq, Ensembl, KnownGene, dbNSFP (for functional prediction) | RegulomeDB, ENCODE, Roadmap Epigenomics, GTEx [17] [19] |
| Typical Analysis Approach | Gene-based annotation; impact prediction (e.g., SIFT, PolyPhen) | Region-based annotation; overlap with functional genomic marks (e.g., ChIP-seq, DNase-seq) |
| Proportion of GWAS Signals | ~10% | ~90% [17] |
| Example Pathogenic Mechanism | Production of a truncated, non-functional enzyme | Dysregulation of a key developmental transcription factor |
Analytical Approaches and Workflows
Variant Annotation Methodologies
The annotation of coding and non-coding variants requires distinct but complementary methodological approaches, often integrated within a single software pipeline.
- Gene-Based Annotation (for Coding Variants): This approach focuses on relating variants to the genes they affect and the consequent changes to the protein product. Tools like ANNOVAR use databases such as RefGene, KnownGene, and EnsGene to determine whether a variant is exonic, intronic, or intergenic, and to annotate its specific effect (e.g., non-synonymous, stop-gain) [15] [19]. This is coupled with filter-based annotations using databases like dbNSFP that aggregate functional prediction scores from algorithms like SIFT and PolyPhen-2 to assess the potential deleteriousness of missense variants [15].
- Region-Based Annotation (for Non-Coding Variants): This methodology intersects the genomic coordinates of a variant with intervals from functional genomic datasets to infer its potential regulatory role. The RegulomeDB tool, for instance, integrates thousands of datasets from ENCODE, Roadmap Epigenomics, and other consortia, including transcription factor binding sites, chromatin accessibility, and histone modification profiles [17]. It synthesizes this information into a heuristic ranking score (e.g., RegulomeDB Score) that indicates the variant's likelihood of being functional in a regulatory context. A high-ranking variant might lie within a transcription factor binding site in a relevant cell type, suggesting a mechanism for its phenotypic effect.
Integrated Annotation Workflow
A typical variant annotation and prioritization pipeline involves a series of sequential steps, from raw data to a refined list of candidate variants, as visualized below.
Diagram 1: Variant Annotation Workflow
This workflow begins with a Variant Call Format (VCF) file containing the raw genetic variants identified from sequencing. The first critical step is Quality Control & Filtering to remove low-quality calls. The core annotation phase involves parallel or sequential Gene-Based and Region-Based Annotation to characterize each variant. Finally, researchers apply specific Filtering & Prioritization criteria—such as population frequency, predicted functional impact, and inheritance models—to generate a manageable Candidate Variant List for further validation.
Quantitative Functional Architecture
The functional architecture and the strength of natural selection differ markedly between coding and non-coding regions. Heritability partitioning studies reveal how the genetic contribution to traits is distributed across different functional annotations. The following table synthesizes key quantitative findings from large-scale analyses, such as those performed in the UK Biobank [18].
Table 2: Heritability Enrichment of Low-Frequency and Common Variants
| Functional Annotation | Low-Frequency Variant Heritability | Common Variant Heritability | Implication (Strength of Negative Selection) |
|---|---|---|---|
| Non-synonymous Coding | 17% ± 1% | 2.1% ± 0.2% | Very Strong |
| Brain DLPFC H3K4me3 (e.g., for Neuroticism) | 57% ± 12% | 12% ± 2% | Strong in specific cell types |
| Other Cell-Type-Specific Non-Coding Annotations | Similarly enriched as common variants for most traits | Baseline for comparison | Moderate to Strong |
The data demonstrates that low-frequency variants are dramatically enriched in functional categories under strong negative selection, such as protein-coding exons. This is because strongly deleterious mutations are kept at low population frequencies by natural selection. The high enrichment of heritability for low-frequency variants in brain-specific epigenetic marks further underscores the cell-type-specific functional importance of the non-coding genome.
The Scientist's Toolkit: Essential Research Reagents
A successful variant annotation project relies on a combination of robust software tools, comprehensive databases, and powerful computing resources.
Table 3: Key Research Reagents and Resources for Variant Annotation
| Tool / Resource | Type | Primary Function | Key Features |
|---|---|---|---|
| ANNOVAR [15] [16] | Command-line Software | Performs fast gene-based, region-based, and filter-based annotations. | A versatile, Perl-based tool; supports local database downloads for high-throughput analysis. |
| wANNOVAR [15] [16] | Web Server | Web-based interface for ANNOVAR functionality. | User-friendly; no command-line skills required; suitable for smaller datasets (<100 MB). |
| ShAn [19] | R Shiny App | Interactive graphical interface harnessing ANNOVAR's engine. | No file size limits; runs on local servers for enhanced data privacy; features a progress bar. |
| RegulomeDB v.2 [17] | Web Server / Database | Annotates and prioritizes non-coding variants. | Integrates ENCODE, epigenomic data, and machine learning scores (SURF) to rank variants. |
| SeattleSeq [19] | Web Server | Provides variant annotation. | Useful for smaller datasets; clinical significance annotation can be limited compared to others. |
| RefSeq / Ensembl [19] | Database | Provides canonical gene models and transcripts. | Used for gene-based annotation to define exons, introns, and UTRs. |
| dbSNP / 1000 Genomes [19] | Database | Catalogues population genetic variation. | Used for filter-based annotation to flag common polymorphisms. |
Experimental Protocols for Variant Annotation
Protocol: Command-Line Annotation with ANNOVAR
This protocol details the steps for annotating a VCF file using the command-line version of ANNOVAR, offering maximum flexibility and power for large datasets [15] [16].
Software and Database Setup:
- Download and install ANNOVAR (a Perl-based tool).
- Download required annotation databases (e.g.,
refGene,avsnp150,gnomad211_genome,dbnsfp35a) to a local directory using theannotate_variation.plscript.
Input Data Preparation:
- Prepare your input file in VCF format generated from your sequencing pipeline (e.g., GATK).
- Ensure the genome build of your VCF file (Hg19/GRCh37 or Hg38/GRCh38) matches the databases you will use.
Run Annotation:
- Execute a command that specifies the input VCF, output file name, and databases. A typical command structure is:
table_annovar.pl <input.vcf> <humandb_directory> -buildver <hg19/hg38> -out <output> -remove -protocol refGene,avsnp150,gnomad211_genome,dbnsfp35a -operation g,f,f,f -nastring . -vcfinput - This performs gene-based annotation with
refGeneand filter-based annotation with the other databases.
- Execute a command that specifies the input VCF, output file name, and databases. A typical command structure is:
Output and Interpretation:
- The main output is a tab-delimited text file or a VCF file with new annotation fields added to each variant.
- Analyze the output by filtering columns based on variant frequency, predicted deleteriousness (e.g., SIFTscore, Polyphen2HDIV_score from dbNSFP), and clinical significance.
Protocol: Interactive Annotation with ShAn
For researchers without a command-line background or those working with sensitive data, ShAn provides an excellent alternative [19].
Application Access:
- Option A: Run ShAn locally on your personal computer by downloading the source code from its GitLab repository and executing it within R.
- Option B: Access a version hosted on a secure institutional server.
Data Upload and Parameter Selection:
- In the ShAn web interface, use the sidebar to upload your VCF file.
- Select the reference genome build (Hg19 or Hg38).
- Choose the annotation type: "gene" (for RefSeq, KnownGene, Ensembl) or "filter" (for population frequency and functional databases).
Execution and Monitoring:
- Initiate the annotation. A progress bar at the lower right corner will show the status in real-time.
- The annotation typically takes 5-30 minutes of compute time, depending on file size.
Result Analysis and Export:
- View the fully annotated variant table directly in the main browser panel.
- Use the interactive table to sort and filter variants.
- Download the final annotated results as a text file for permanent storage and further analysis.
The distinction between coding and non-coding variants is fundamental to genomic medicine. Coding variants, with their direct and often interpretable effects on protein function, have been the traditional focus of research. However, as evidenced by the enrichment of disease heritability in regulatory annotations, non-coding variants represent a vast and complex landscape that controls the intricate circuitry of gene expression. The strength of negative selection acting on these regions, particularly in a cell-type-specific manner, highlights their biological importance [18]. Modern genomic research requires a dual approach: leveraging robust gene-based annotation to understand protein-altering changes and employing sophisticated region-based annotation tools like RegulomeDB to decipher the regulatory code [17]. The availability of diverse tools—from command-line powerhouses like ANNOVAR to user-friendly interfaces like ShAn—ensures that researchers of all computational backgrounds can participate in this endeavor [15] [19]. By integrating these analytical strategies and resources, scientists and drug developers can more effectively prioritize causal variants, elucidate disease mechanisms, and identify novel therapeutic targets across the full spectrum of the human genome.
The functional annotation of genomic variants is a critical step in translating sequencing data into biological and clinical insights. It involves identifying the location and functional consequences of genetic variants, such as their impact on genes, proteins, and regulatory regions. Three tools have become the cornerstone of this process: ANNOVAR, SnpEff, and the Ensembl Variant Effect Predictor (VEP). While they share a common goal, their methodologies, output formats, and underlying assumptions differ significantly. This guide provides an in-depth technical overview of these tools, equipping researchers and drug development professionals with the knowledge to select and implement the appropriate tool for their genomic research projects. Understanding their strengths and limitations is essential, as studies reveal that these tools can show concerning levels of disagreement, with one analysis finding only 58.52% concordance for HGVSc annotations and 65% concordance for Loss-of-Function variants between ANNOVAR and VEP [20] [21].
The table below summarizes the fundamental characteristics of ANNOVAR, SnpEff, and VEP.
Table 1: Core Feature Comparison of Major Annotation Tools
| Feature | ANNOVAR | SnpEff | Ensembl VEP |
|---|---|---|---|
| Primary Function | Gene, region, and filter-based annotation [22] | Variant effect prediction and annotation [23] | Functional effect prediction of genomic variants [24] |
| Input Format | Custom text file (Chr, Start, End, Ref, Obs) [25] | VCF (Variant Call Format) [26] | VCF, HGVS, variant ID [24] |
| Output Format | Tab-separated file [20] | Annotated VCF [20] | Tab-separated, VCF, JSON [24] |
| Annotation Philosophy | Reports single most deleterious effect per variant [20] | Lists all effects for all transcripts [20] | Lists all effects for all transcripts [20] |
| Strengths | Efficient filtering against population databases; diverse annotation types [22] [25] | Extremely fast; high degree of customization; supports over 38,000 genomes [23] [26] | Tight integration with Ensembl resources; regular updates; regulatory region annotation [20] [24] |
A critical differentiator is how each tool handles transcripts. Most genes have multiple transcript isoforms, and a variant may have different consequences depending on the transcript used. SnpEff and VEP provide annotations for every overlapping transcript, offering a comprehensive view. In contrast, ANNOVAR collapses this information to report only the single most deleterious effect based on a predefined priority system [20]. While this simplifies initial filtering, it removes granular data that can be crucial for later analysis, such as when a protocol specifically targets stop-gain variants that may be masked by a higher-priority frameshift annotation [20].
Technical Performance and Discrepancy Analysis
Despite their widespread use, ANNOVAR, SnpEff, and VEP often disagree in their annotations. A 2025 study using 164,549 high-confidence ClinVar variants highlighted substantial discrepancies [21].
Table 2: Annotation Concordance Across Tools (Based on ClinVar Analysis)
| Annotation Type | Overall Concordance | Highest Performing Tool | Performance Metric |
|---|---|---|---|
| HGVSc (DNA-level) | 58.52% | SnpEff | 0.988 (Match Ratio) |
| HGVSp (Protein-level) | 84.04% | VEP | 0.977 (Match Ratio) |
| Coding Impact | 85.58% | Not Specified | N/A |
The concordance drops dramatically for specific variant types. McCarthy et al. found only about 65% concordance for Loss-of-Function (LoF) variants between ANNOVAR and VEP when using the same transcript set. This figure plummets to 44% when different transcript sets (Ensembl vs. RefSeq) are used with ANNOVAR [20]. These discrepancies arise from several technical factors:
- Non-coding Region Definitions: The tools use different boundaries for non-coding features. For example, SnpEff defines upstream/downstream regions as 5 kb from a transcript, while ANNOVAR's default is 1 kb [20]. When non-coding variants are included, overall concordance between the tools can fall to as low as 49% [20].
- Transcript Sets: The choice of transcript database (e.g., RefSeq, Ensembl, MANE) significantly impacts results [21].
- HGVS Syntax and Alignment: Converting VCF coordinates to HGVS nomenclature involves complex rules, including left-alignment (VCF) versus 3'-alignment (HGVS), which can lead to different representations of the same variant, especially in repetitive regions [21].
- Algorithmic Edge Cases: The tools can produce conflicting annotations for biologically complex variants. For instance, a single-base deletion in a run of thymines might be annotated as a frameshift by Annovar and VEP, but as a more precise stop-gain by SnpEff. Similarly, a variant three bases into an intron might be annotated imprecisely as "intronic" by Annovar, correctly as "spliceregionvariant" by VEP, and incorrectly as "splicesiteacceptor" by SnpEff [20].
Experimental Protocols for Tool Evaluation and Application
To ensure reliable results, researchers should employ systematic protocols for using and validating annotation tools. The following workflow, based on a 2025 benchmarking study, outlines a robust methodology for comparing annotation outputs [21].
Protocol 1: Benchmarking Annotation Concordance
Objective: To quantify the agreement between ANNOVAR, SnpEff, and VEP on a known set of variants.
Methodology [21]:
- Dataset Curation:
- Source: Obtain the latest VCF file of human variants from ClinVar.
- Filtering: Apply stringent filters to create a high-confidence dataset. The 2025 study used 164,549 "two-star" variants from ClinVar.
- Preprocessing: Use
bcftoolsto left-align variants, remove duplicates, eliminate degenerate bases, and normalize the VCF.
- Variant Annotation:
- Software Versions: Use recent versions of all tools (e.g., ANNOVAR, SnpEff 5.2+, VEP 111+).
- Genome Build: Standardize on NCBI GRCh38 (or the latest build).
- Transcript Set: Specify a consistent transcript set (e.g., RefSeq or Ensembl) for all tools. For ANNOVAR, adjust the
upstreamanddownstreamparameters to 5000 bp to match SnpEff's default. - Execution: Run each tool with HGVS output enabled (
-hgvsfor ANNOVAR,--hgvsfor VEP).
- Data Analysis:
- Normalization: Map the specific effect terms from each tool (e.g., "stopgained," "stoplost") to standardized Sequence Ontology terms.
- Comparison: Perform string-match comparisons of the HGVSc and HGVSp strings generated by each tool against the reference ClinVar data and against each other.
- Concordance Calculation: Calculate the percentage of variants for which all tools produce identical HGVS nomenclature and effect predictions.
Protocol 2: Basic Annotation of a Human VCF File
Objective: To functionally annotate a set of human genetic variants called from a sequencing experiment.
Methodology [27]:
- Input Preparation: Start with a VCF file generated from a sequencing pipeline (e.g., after alignment with BWA and variant calling with GATK).
- Tool Execution (Example Commands):
- VEP (Offline with Cache):
- SnpEff (Human Genome):
- ANNOVAR:
- Output Interpretation: Examine the annotated files to identify high-priority variants, such as those with "high" impact in SnpEff, "LoF" predictions, or absence in population frequency databases like gnomAD.
Table 3: Key Resources for Genomic Variant Annotation
| Resource Name | Type | Function in Annotation |
|---|---|---|
| RefSeq & Ensembl Transcripts | Database | Provide the reference gene models to which variants are compared to determine their functional consequence [20]. |
| MANE (Matched Annotation from NCBI and EMBL-EBI) | Transcript Set | A curated set of "default" transcripts that precisely match between RefSeq and Ensembl, designed to reduce annotation ambiguity [21]. |
| ClinVar | Database | A public archive of reports detailing the relationships between human variants and phenotypes, with supporting evidence; used for validation [21]. |
| VCF (Variant Call Format) | File Format | The standard text file format used for storing gene sequence variations [21] [26]. |
| GRCh38 (hg38) | Reference Genome | The primary, maintained reference assembly for the human genome; recommended for all new studies. |
| gnomAD | Database | A resource of population allele frequencies from large-scale sequencing projects; crucial for filtering common polymorphisms [22]. |
| Sequence Ontology (SO) | Controlled Vocabulary | A standardized set of terms and definitions used to describe the effects of sequence variants, promoting consistency [20]. |
Critical Considerations for Clinical and Research Applications
The discrepancies between annotation tools have direct implications for research and clinical diagnostics. Incorrect interpretation of a variant's effect can lead to misclassification.
- Impact on ACMG Classification: The 2025 study demonstrated that discrepancies in LoF annotation directly affect the application of the ACMG/AMP PVS1 criterion (for null variants in disease genes). When tools misannotated a variant's coding impact, it led to the incorrect application of PVS1, which in turn caused 55.9% (ANNOVAR), 66.5% (SnpEff), and 67.3% (VEP) of Pathogenic/Likely Pathogenic (PLP) variants to be downgraded, risking false negatives in clinical reports [21].
- Recommendations for Robust Workflows:
- Use the MANE Select Transcript Set: Where available, prioritize annotation based on MANE Select transcripts to standardize the gene model used across tools and institutions [21].
- Cross-validate with Multiple Tools: For clinically significant variants, or those in critical genes, run annotations through at least two tools to identify and manually review discrepancies.
- Leverage Standardized Ontologies: Encourage the use of specific Sequence Ontology terms (e.g.,
five_prime_cis_splice_siteover the more generalsplice_region_variant) to improve communication and reduce ambiguity [20]. - Maintain Updated Software and Databases: The field evolves rapidly. Regular updates of both the annotation tools and the underlying databases (e.g., ClinVar, gnomAD) are essential for accurate results [24] [22].
In conclusion, ANNOVAR, SnpEff, and VEP are powerful and indispensable tools for genomic variant annotation. ANNOVAR excels in database filtering, SnpEff in speed and custom genome support, and VEP in its deep integration with Ensembl's continually updated resources. However, researchers must be acutely aware that these tools are not interchangeable. Their outputs can differ significantly due to fundamental algorithmic and philosophical differences. A rigorous, transparent, and often multi-tool approach is therefore necessary to ensure the accurate interpretation of genomic variants, which forms the foundation for both biological discovery and precision medicine.
Genomic variant annotation represents a foundational step in modern genetics, enabling the translation of raw sequencing data into biologically and clinically meaningful insights. For researchers, scientists, and drug development professionals, the strategic use of population and clinical databases is not merely a preliminary step but a critical, ongoing process that directly influences the validity and impact of research outcomes. This guide provides a comprehensive technical framework for leveraging these essential resources, with a specific focus on ClinVar, a premier public archive of variant interpretations. We will detail the core characteristics of major databases, present integrated workflows for their application, and quantify their performance to equip you with the methodologies necessary for robust genomic research. The subsequent diagram outlines a generalized workflow for integrating these databases into a variant annotation and prioritization pipeline.
Database Fundamentals: Characteristics and Applications
Understanding the scope, data sources, and strengths of each database is crucial for selecting the right resource for a specific research question.
Table 1: Core Genomic Databases for Variant Annotation
| Database | Primary Function & Scope | Key Features & Data Sources | Principal Strengths |
|---|---|---|---|
| ClinVar [28] [29] | Public archive of relationships between genomic variants and human health, with expert-curated interpretations. | - Aggregates submissions from clinical & research labs- Uses ACMG/AMP guidelines for classification- Provides review status ("stars") for submissions- Contains germline & somatic variants | - High transparency with submitter identity- Open access and frequently updated |
| HGMD [29] | Commercial database cataloging published disease-associated mutations. | - Curated from scientific literature by dedicated staff- Classifies variants as DM (disease-causing) or DM?- Contains nearly 385,000 DM/DM? variants | - Extensive collection of published variant-disease associations- Useful for initial screening of known pathogenic variants |
| dbSNP [30] | Central repository for single nucleotide polymorphisms and other short genetic variations. | - Assigns unique RS IDs for easy cross-referencing- Contains over 154 million reference variants- Includes population frequency data where available | - Essential for variant normalization and identification |
| gnomAD [22] | Public catalog of human genetic variation from large-scale sequencing projects. | - Provides population allele frequencies from exome and genome data- Includes data from diverse ancestral backgrounds- Flags variants with poor quality or low confidence | - Critical for filtering common variants unlikely to cause rare disease |
Quantitative Analysis of Database Accuracy and Trends
Empirical data on database performance is essential for assessing the reliability of variant interpretations in research. A 2023 study measured the false-positive rates of ClinVar and HGMD over six years, using inborn errors of metabolism (IEMs) screened in newborns as a model system [29]. The study utilized samples from the 1000 Genomes Project (1KGP) to identify individuals with genotypes classified as pathogenic; due to the rarity of IEMs in this general population, such findings predominantly indicate variant misclassification.
Table 2: Comparative Analysis of Database Accuracy Over Time (2014-2020)
| Metric | ClinVar | HGMD | Context and Implications |
|---|---|---|---|
| False-Positive Rate Trend | Significant improvement over time [29] | Improvement over time, but higher baseline [29] | Reflects iterative reclassification and improved guidelines. |
| Implied Disease Burden in 1KGP | Lower implied burden [29] | Two orders of magnitude higher than ClinVar [29] | Suggests more stringent current classification in ClinVar. |
| Variant Reclassification Rate | Sixfold more frequent than HGMD [29] | Lower reclassification rate [29] | Higher ClinVar reclassification may contribute to its improved accuracy. |
| Impact of Ancestral Bias | Reduced bias after excluding common variants [29] | Initially higher false-positive rate for African genomes; mitigated by frequency filtering [29] | Allele frequency databases are critical for correcting ancestral bias. |
Integrated Experimental Protocol for Database Leveragement
This section provides a detailed methodology for integrating population and clinical databases into a variant annotation pipeline, a process critical for studies ranging from rare disease research to polygenic risk assessment.
Protocol: Comprehensive Variant Annotation and Prioritization
Objective: To systematically annotate a set of genetic variants (e.g., from a VCF file) using population and clinical databases, and to prioritize them based on predicted functional impact and disease relevance.
Materials and Reagents:
- Input Data: Variant Call Format (VCF) file from WES/WGS.
- Annotation Software: Ensembl VEP [1] [31] or ANNOVAR [31] [22].
- Filtering & Analysis Tool: SnpSift [23].
- Reference Transcript Set: RefSeq or Ensembl/GENCODE [31].
- Population Frequency Database: gnomAD (via ANNOVAR or VEP plugins) [22].
- Clinical Database: ClinVar (integrated within ANNOVAR/VEP) [28] [22].
- In silico Prediction Tools: CADD, SIFT, PolyPhen-2 (available via dbNSFP in ANNOVAR) [22] [32].
Methodology:
- Variant Effect Prediction: Initiate the annotation process using a tool like ANNOVAR or VEP to map variants to genomic features. A critical first step is the selection of a transcript set (RefSeq or Ensembl), as this choice can lead to discrepant annotations for a significant proportion of variants, including a 44% disagreement for loss-of-function variants [31].
- Population Frequency Filtering: Annotate variants with allele frequency data from gnomAD. The primary goal is to filter out common variants (e.g., MAF > 0.01) that are unlikely to cause highly penetrant rare diseases. This step is crucial for mitigating ancestral bias, as it helps correct for variants that are common in one population but may be misclassified as pathogenic [29].
- Integration of Clinical Evidence: Annotate with ClinVar to identify variants with existing clinical interpretations. Pay close attention to the review status of ClinVar entries (e.g., multiple submitters, expert panel review) as a measure of confidence [28] [29]. Be aware that classifications can change; ClinVar variants are reclassified six times more often than those in HGMD, reflecting an evolving understanding [29].
- Computational Pathogenicity Prediction: Incorporate scores from multiple in silico prediction algorithms (e.g., SIFT, PolyPhen-2, CADD) to assess the potential functional impact of missense and other non-truncating variants. These provide supporting evidence for variant prioritization [29] [32].
- Prioritization and Triage: Synthesize the collected evidence to prioritize variants. A typical strategy involves a tiered approach:
- Tier 1 (High Priority): (Likely) Pathogenic variants in ClinVar (with high review status), with low population frequency, and high computational prediction scores.
- Tier 2 (Medium Priority): Variants of Uncertain Significance (VUS) in ClinVar that are predicted to be damaging and are located in genes relevant to the disease phenotype.
- Tier 3 (Low Priority): Benign/likely benign variants or variants with high population frequency.
The Scientist's Toolkit: Essential Research Reagents
Table 3: Key Resources for Genomic Variant Annotation
| Tool / Resource | Category | Primary Function in Research |
|---|---|---|
| ANNOVAR [22] | Annotation Software | Performs gene-, region-, and filter-based annotation, enabling functional classification and database integration. |
| Ensembl VEP [1] [31] | Annotation Software | Predicts the functional consequences of variants on genes, transcripts, and protein sequence. |
| SnpEff/SnpSift [23] | Annotation & Filtering | Annotates variant effects and provides tools to filter and manipulate large annotated genomic datasets. |
| LOFTEE [1] | Plugin Tool | Works with VEP to rigorously annotate and quality-control loss-of-function variants. |
| dbNSFP [22] | Aggregated Database | Provides a compiled set of multiple functional predictions (SIFT, PolyPhen, CADD, etc.) for streamlined annotation. |
Challenges and Future Directions
Despite significant advancements, critical challenges remain in the field of variant annotation. A primary issue is annotation inconsistency, which arises from two key variables: the choice of transcript set and the selection of annotation software. Research has shown that using RefSeq versus Ensembl transcripts with the same software (ANNOVAR) resulted in only a 44% agreement for loss-of-function variants and an 83% agreement for all exonic variants [31]. Furthermore, when using the same transcript set (Ensembl) but different software tools (ANNOVAR vs. VEP), the agreement for loss-of-function variants was only 65% [31]. This highlights that variant annotation is not a solved problem and requires careful, conscious selection of pipelines.
The field is rapidly evolving to address these and other challenges. Future directions emphasize:
- Automation and Integration: Developing more efficient, comprehensive, and largely automated systems for annotating both coding and non-coding variants [1] [33].
- Harnessing Non-Coding Regions: Creating methods to exploit information in non-coding regions (promoters, enhancers, non-coding RNAs) to better understand their role in disease [1] [32].
- Improved Diversity: Expanding population databases to include more diverse ancestries is paramount to reducing health disparities and improving the accuracy of variant interpretation for all populations [29].
- Text-Mining for Novel Discoveries: Tools like tmVar 2.0 demonstrate the potential of extracting variant information from the vast biomedical literature, having identified 41,889 RS numbers not found in ClinVar, thus uncovering a wealth of potential novel variant-disease relationships for further investigation [30].
Implementing Annotation Workflows: From Standard Pipelines to Advanced Techniques
The rapid evolution of next-generation sequencing technologies has democratized access to vast amounts of genetic variation data, creating a critical gap between data generation and biological interpretation. For researchers and drug development professionals embarking on genomic variant annotation research, building a standardized analysis pipeline is not merely advantageous—it is essential for producing reproducible, reliable results. This guide provides a comprehensive framework for constructing a robust variant annotation workflow, enabling scientists to transform raw sequencing data into biologically meaningful insights that can drive therapeutic discovery and development.
The fundamental challenge in genomic variant analysis lies in the sheer volume of data and the complexity of biological systems. A typical human genome contains 3.5 million genetic variants compared to the reference genome, with each individual carrying 250-300 loss-of-function variants in annotated genes and 50-100 variants previously implicated in inherited disorders [34]. This vast genetic landscape necessitates systematic approaches to identify the handful of clinically or biologically relevant variants among mostly benign background variation. The pipeline described herein addresses this challenge through a structured, multi-tiered methodology that progresses from raw data to prioritized candidate variants.
Core Components of a Variant Annotation Pipeline
Pipeline Architecture and Data Flow
A standard variant annotation pipeline integrates several specialized computational tools and databases in a sequential manner, where the output of each stage becomes the input for the next. The overall architecture follows a logical progression from data quality control through functional annotation to prioritization, with opportunities for iterative refinement at each step. This structured approach ensures that variants are evaluated systematically rather than arbitrarily, reducing the risk of overlooking potentially significant findings or pursuing false leads.
The foundational principle underlying pipeline development is that annotation creates biological context for raw variants. As outlined in genomic visualization research, effective analysis requires "one-dimensional, semantic zooming to show sequence data alongside gene structures" [35], meaning that the pipeline must maintain the connection between individual variants and their genomic context throughout the analysis. This contextual preservation enables researchers to shift seamlessly between big-picture patterns and nucleotide-level details, both of which are essential for accurate biological interpretation.
Table 1: Essential Databases for Genomic Variant Annotation
| Database Category | Examples | Primary Purpose | Data Type |
|---|---|---|---|
| Variant Frequency | dbSNP, 1000 Genomes, gnomAD | Determine population frequency and filter common polymorphisms | Population data |
| Functional Prediction | SIFT, PolyPhen-2, CADD | Predict functional impact of protein-altering variants | Algorithmic scores |
| Gene Annotation | RefSeq, Ensembl, GENCODE | Define gene models and regulatory elements | Gene structure |
| Clinical Association | ClinVar, OMIM, GWAS Catalog | Link variants to known phenotypes and diseases | Clinical knowledge |
| Conservation | PhastCons, GERP++ | Assess evolutionary constraint across species | Evolutionary data |
These databases collectively enable researchers to address critical questions about each variant: Is it common or rare? Does it affect protein function? What gene or regulatory element does it impact? Is it evolutionarily conserved? Has it been associated with disease? The integration of these diverse data types creates a multidimensional profile for each variant that forms the basis for prioritization decisions in both research and clinical contexts.
Step-by-Step Analytical Workflow
Primary Workflow Stages
The variant annotation workflow follows a structured pathway with distinct stages, as illustrated below:
Quality Control and Data Preparation
The initial quality control stage is critical for establishing a reliable foundation for all subsequent analyses. This phase begins with the Variant Call Format (VCF) file generated from sequence alignment and variant calling processes. Key quality metrics include:
- Transition/Transversion (Ti/Tv) ratio: This measure should approximate expected values (~2.0-2.1 for whole exome sequencing), with significant deviations indicating potential technical artifacts.
- Variant concordance with known databases: Comparing your variant set with established resources like dbSNP and HapMap provides a quality baseline.
- Mendelian error rates: For family-based studies, checking inheritance patterns can identify systematic genotyping errors.
- Variant call quality scores: Filtering based on metrics such as QUAL, DP, GQ, and MQ ensures inclusion of high-confidence variants only.
Systematic discounting of erroneous SNPs is challenging because "all quality measures are just proxies because we do not know which variants are real" [34]. Therefore, a balanced approach that removes clear outliers while retaining potentially novel findings is essential. For an average human genome dataset containing approximately 3.5 million SNPs, initial quality filtering typically reduces this number by 10-30%, depending on sequencing quality and stringency of filters applied.
Functional Annotation Methodology
Functional annotation represents the core of the variant interpretation process, where biological context is added to each variant. As demonstrated in protocols for tools like ANNOVAR, this stage typically takes "5-30 minutes of computer time, depending on the size of the variant file, and 5-10 minutes of hands-on time" [16]. The annotation process occurs through three primary mechanisms:
Gene-based annotation focuses on identifying the relationship between variants and gene elements. This includes determining whether variants fall within exonic regions, intronic regions, untranslated regions (UTRs), or intergenic spaces. For exonic variants, further classification includes synonymous versus nonsynonymous changes, stop-gain or stop-loss mutations, and frameshift indications. The impact of protein coding region variants can be profound, including introduction of stop codons, structural disruption, domain disruption, or altered translation efficiency [34].
Region-based annotation examines variants in the context of functionally important genomic regions beyond protein-coding genes. This includes conservation metrics (such as PhastCons and GERP++ scores), regulatory elements (enhancers, promoters, transcription factor binding sites), and chromatin states identified through projects like ENCODE. This dimension is particularly important given that "intergenic variants are also important" as they can "disrupt regulatory elements" and cause "changes in the expression of proteins" [34].
Filter-based annotation focuses on population frequency and clinical associations. This includes identifying variants present in population databases (gnomAD, 1000 Genomes), cataloging variants with known disease associations (ClinVar, OMIM), and flagging variants with predicted functional consequences using algorithms like SIFT and PolyPhen. These tools "assign a pre-computed score that says how likely this substitution is tolerated given the sequence of homologous proteins" or use "machine learning methods predicting the impact of a sequence on the protein's structure" [34].
Visualization and Interpretation Strategies
Genomic Data Visualization Techniques
Effective visualization is essential for interpreting complex genomic data. Semantic zooming approaches allow researchers to "inspect individual bases that influence the gene structure's believability" while maintaining "a sense of context" [35]. This technique enables seamless transitions between chromosome-level views and nucleotide-level resolution, supporting both broad pattern recognition and detailed mechanistic hypotheses.
Advanced genome browsers implement one-dimensional zooming rather than traditional two-dimensional approaches because "genome browser applications represent a one-dimensional world in that they display location-based features across a single axis defined by the genomic sequence data itself" [35]. This specialized visualization strategy aligns with the intrinsic nature of genomic information, allowing efficient navigation along linear genomes while using the perpendicular axis to represent different annotation tracks or data types.
Color Application in Scientific Visualization
Table 2: Color Palettes for Genomic Data Visualization
| Palette Name | Package | Colorblind-Friendly | Best Use Case |
|---|---|---|---|
| Viridis | viridis | Yes | Gradient data (conservation, quality scores) |
| ColorBrewer Qualitative | RColorBrewer | Yes (selected palettes) | Categorical data (variant types, functional classes) |
| Scientific Journal | ggsci | Varies | Publication-ready figures |
| Wes Anderson | wesanderson | No | Presentations and internal reports |
| Grey Scale | ggplot2 | Yes | Black-and-white publication requirements |
Color selection should follow accessibility guidelines to ensure interpretability by all researchers, including those with color vision deficiencies. The Web Content Accessibility Guidelines (WCAG) recommend "a contrast ratio of at least 4.5:1 for small text and 3:1 for large text" [36]. Tools like ColorBrewer include integrated "Colorblind Safe" options to simplify this process [37]. The viridis color scales are particularly valuable as they are "printer-friendly, perceptually uniform and easy to read by those with colorblindness" [38].
When creating visualizations, specify colors using hexadecimal RGB notation (e.g., #FF0000 for red) for consistent reproduction across platforms and media [37]. For genomic feature displays, establish consistent color coding across all figures—for example, using the same hue to represent exonic variants regardless of whether they appear in a main analysis figure or supplementary materials.
Implementation with ANNOVAR
Practical Protocol Execution
ANNOVAR provides a representative tool for implementing the annotation workflow described previously. The protocol begins with preparing a VCF file from your sequencing pipeline and proceeds through these concrete steps:
Installation and setup: Download ANNOVAR from its public repository and configure the database paths. The software requires Perl and standard computational resources.
Database downloading: Retrieve relevant annotation databases based on your research focus. For human studies, this typically includes RefSeq gene annotations, dbSNP, population frequency databases, and functional prediction scores.
Annotation execution: Run the annotation command, which follows the syntax:
table_annovar.pl [input.vcf] [humandb/] -buildver hg19 -out [output] -remove -protocol [db1,db2,...] -operation [t1,t2,...] -nastring . -vcfinput. This single command integrates multiple annotation types in a single pass.Output interpretation: The primary output includes a comprehensive table with each variant annotated across all specified dimensions. Additional summary statistics help assess the overall characteristics of the variant set.
This protocol enables "fast and easy variant annotations, including gene-based, region-based and filter-based annotations on a variant call format (VCF) file generated from human genomes" [16]. For non-human species, the process can be adapted through gene-based annotation using orthology relationships or species-specific databases when available.
Web-Based Alternatives
For researchers without computational infrastructure or expertise, web-based tools like wANNOVAR provide accessible alternatives. These platforms "prioritize candidate genes for a Mendelian disease" through user-friendly interfaces that eliminate command-line requirements [16]. The web server approach is particularly valuable for exploratory analyses or researchers transitioning from wet-lab to computational approaches, though it may have limitations for large datasets or proprietary genomic data due to privacy considerations.
Variant Prioritization Framework
Multi-Dimensional Filtering Strategy
Variant prioritization represents the culminating stage where annotated variants are ranked based on their potential biological or clinical relevance. This process employs a structured filtering approach:
This sequential filtering approach progressively reduces variant numbers from millions to a manageable number of high-priority candidates. The specific criteria and thresholds should be established based on the research context—for example, a de novo mutation study would prioritize very rare variants, while a complex disease analysis might consider somewhat higher frequency variants with moderate effect sizes.
Pathway and Network Analysis
Following initial variant prioritization, contextualizing results within biological pathways and networks adds another layer of interpretation. The "one-variant one-phenotype" model is "rather unlikely" for many diseases, making it essential to "prioritize variants or sets of variants to focus analysis on variants likely to be functional [and] involved in the same pathway" [34]. This systems-level approach can identify clusters of related variants that collectively impact biological processes, even when individual variants have modest effects.
Tools that model "disease liability on this subset" represent the cutting edge of statistical genetics, seeking to "find variants with relatively large effect sizes that are able to explain a proportion of disease heritability in the population" [34]. This approach acknowledges the complex genetic architecture of most traits and diseases, where multiple genetic factors interact with environmental influences to determine outcomes.
Essential Research Reagents and Computational Tools
Table 3: Essential Research Reagent Solutions for Genomic Variant Analysis
| Tool/Category | Specific Examples | Function | Implementation |
|---|---|---|---|
| Annotation Software | ANNOVAR, SnpEff, VEP | Functional annotation of variants | Command-line or web interface |
| Quality Control Tools | FastQC, VCFtools, PLINK | Assess sequencing quality and variant metrics | Command-line |
| Visualization Platforms | IGV, GenomeBrowse, UCSC Browser | Graphical exploration of variants in genomic context | GUI or web-based |
| Statistical Analysis | R, Python, PLINK | Population genetics and association testing | Programming environments |
| Functional Prediction | SIFT, PolyPhen-2, CADD | In silico prediction of variant impact | Web service or local installation |
| Database Resources | dbSNP, gnomAD, ClinVar | Reference data for frequency and clinical interpretation | Downloaded or queried via API |
These tools collectively enable the complete variant annotation workflow, from raw data processing through biological interpretation. Selection of specific tools should consider factors such as dataset size, organism, computational resources, and research objectives. For most human genetics studies, a combination of ANNOVAR for annotation, R for statistical analysis, and IGV for visualization represents a robust, well-supported foundation.
Building a standard analysis pipeline for genomic variant annotation requires careful integration of multiple computational tools, databases, and analytical frameworks. By following the structured approach outlined in this guide—encompassing quality control, multidimensional annotation, strategic prioritization, and thoughtful visualization—researchers can systematically transform raw variant data into biologically meaningful insights. The pipeline presented here emphasizes reproducibility, interpretability, and biological relevance, aligning with best practices in genomic research.
As sequencing technologies continue to evolve and expand into single-cell, long-read, and epigenetic applications, variant annotation pipelines must similarly adapt to incorporate new data types and analytical approaches. The fundamental principles outlined herein—systematic data evaluation, integration of diverse biological evidence, and clear visualization of complex information—will remain essential regardless of technical advancements. Through continued refinement and standardization of these analytical workflows, the research community can accelerate the translation of genomic discoveries into therapeutic advances and improved human health.
The widespread adoption of exome sequencing (ES) and genome sequencing (GS) has revolutionized the diagnostic odyssey for rare disease patients. However, these technologies present a significant analytical challenge: they identify millions of genetic variants per individual, among which typically only one or two are clinically relevant [39] [40]. This needle-in-a-haystack problem makes variant prioritization—the process of filtering and ranking variants to identify the most likely causative changes—a critical bottleneck in rare disease diagnostics [40]. Despite advances in sequencing, an estimated 59–75% of rare disease patients remain undiagnosed after sequencing, often due to difficulties in accurately prioritizing and interpreting variants [41]. The development of sophisticated computational strategies and tools is therefore essential to reduce the manual interpretation burden on clinical teams and improve diagnostic yields.
The Exomiser and Genomiser Framework
Core Architecture and Functionality
Exomiser is an open-source Java program that has become the most widely adopted open-source software for prioritizing coding and non-coding variants in rare disease research [39] [41]. Its core functionality involves analyzing Variant Call Format (VCF) files alongside patient phenotypes encoded using the Human Phenotype Ontology (HPO) to generate a ranked list of candidate variants [42] [43].
The tool operates through a sophisticated scoring system that integrates multiple lines of evidence. The variant score incorporates population frequency data from resources like gnomAD and 1000 Genomes, variant pathogenicity predictions from dbNSFP, and compatibility with user-specified inheritance patterns [42] [43]. Simultaneously, the phenotype score measures the similarity between the patient's HPO terms and known gene-phenotype associations from human databases and model organism data using algorithms like PhenoDigm and OWLSim [42] [43]. These scores are combined to produce a final ranking, with the highest-ranked variants representing the strongest diagnostic candidates.
Genomiser for Non-Coding Variants
Genomiser extends Exomiser's capabilities to tackle the particularly challenging problem of non-coding variant prioritization. While Exomiser primarily focuses on protein-coding regions, Genomiser expands the search space to include regulatory elements, employing the same core algorithms but incorporating additional specialized scores like ReMM (Regulatory Module Mutation score), which is designed to predict the pathogenicity of non-coding regulatory variants [41]. Studies have shown Genomiser to be particularly effective in identifying compound heterozygous diagnoses where one variant is regulatory and the other is coding or splice-altering [41]. However, because non-coding regions introduce substantial analytical noise, Genomiser is recommended as a complementary tool to be used alongside Exomiser rather than as a replacement [41].
Table 1: Core Components of the Exomiser/Genomiser Ecosystem
| Component | Function | Data Sources |
|---|---|---|
| Variant Annotation | Functional consequence prediction | Jannovar (using UCSC, RefSeq, Ensembl) |
| Variant Filtering | Frequency and pathogenicity filtering | dbNSFP, gnomAD, 1000 Genomes, ExAC, TOPMed |
| Phenotype Matching | Gene-phenotype association scoring | HPO, human disease data, model organism data |
| Variant Prioritization | Combined scoring and ranking | Variant and phenotype integrated scores |
| Non-Coding Analysis | Regulatory variant prioritization | ReMM scores, regulatory element annotations |
Optimized Variant Prioritization: Evidence-Based Recommendations
Performance Gains from Parameter Optimization
Recent research analyzing 386 diagnosed probands from the Undiagnosed Diseases Network (UDN) has provided crucial data-driven guidelines for optimizing Exomiser and Genomiser parameters [39] [41]. This systematic evaluation demonstrated that moving beyond default settings can yield dramatic improvements in diagnostic variant ranking.
Table 2: Performance Improvements with Parameter Optimization
| Sequencing Type | Tool | Default Top 10 Ranking | Optimized Top 10 Ranking | Improvement |
|---|---|---|---|---|
| Genome Sequencing (GS) | Exomiser | 49.7% | 85.5% | +35.8% |
| Exome Sequencing (ES) | Exomiser | 67.3% | 88.2% | +20.9% |
| Genome Sequencing (GS) | Genomiser | 15.0% | 40.0% | +25.0% |
The optimization process systematically evaluated how key parameters—including gene-phenotype association algorithms, variant pathogenicity predictors, phenotype term quality and quantity, and family variant data inclusion—impact the ranking of known diagnostic variants [41]. These evidence-based recommendations have been implemented in the Mosaic platform to support ongoing analysis of undiagnosed UDN participants, providing efficient, scalable reanalysis capabilities [39].
Critical Input Factors for Success
The quality of Exomiser/Genomiser outputs is heavily dependent on several user-controlled input factors:
Phenotype Term Quality and Quantity: Comprehensive and accurately chosen HPO terms significantly impact performance. The UDN analysis revealed that phenotype lists should be carefully curated, with particular attention to removing overly generic perinatal and prenatal terms that may introduce noise [41]. Analysts should aim for precise phenotypic descriptors that effectively narrow the candidate gene space.
VCF Processing and Quality Control: The initial variant calling and filtering pipeline profoundly affects downstream prioritization. Best practices include joint calling of family samples where available, rigorous quality control metrics, and appropriate hard filtering for artifacts [41]. For GS data, special attention should be paid to non-coding variant calling parameters.
Familial Segregation Data: When family members are available, incorporation of pedigree information and multi-sample VCFs allows Exomiser to filter variants based on compatibility with specified inheritance patterns (e.g., de novo, compound heterozygous, autosomal dominant/recessive) [41]. This dramatically reduces the candidate variant space.
Experimental Protocol for Variant Prioritization
Workflow Implementation
A standardized protocol for variant prioritization using Exomiser/Genomiser ensures reproducible and optimized results:
Input Preparation:
- Generate a multi-sample VCF file following GATK best practices or equivalent pipelines for alignment and variant calling [40] [41].
- Create a PED-formatted pedigree file specifying familial relationships.
- Compile a comprehensive list of patient phenotypes using HPO terms, ideally through manual curation by a clinical geneticist [41].
Tool Configuration:
- Select the appropriate reference genome (hg19 or hg38), ensuring consistency with transcript annotations.
- Configure frequency filters based on disease prevalence and inheritance pattern (e.g., <0.1% for autosomal recessive, <0.001% for autosomal dominant conditions).
- Select pathogenicity prediction algorithms suited to the variant classes of interest (e.g., REVEL for missense variants, SpliceAI for splice-affecting variants).
Execution and Iteration:
- Run Exomiser initially with a broad parameter set to avoid over-filtering.
- Apply Genomiser specifically for cases where coding analysis is uninformative or suggests regulatory involvement.
- Iteratively refine parameters based on preliminary results and clinical knowledge.
Result Interpretation:
- Review top-ranked candidates (typically top 10-30 variants) considering gene-disease validity, phenotypic match, and segregation.
- Manually inspect variant reads in genomic context using tools like IGV.
- Corroborate findings through orthogonal methods (Sanger sequencing, functional studies) when possible.
Workflow Visualization
Variant Prioritization Workflow Using Exomiser/Genomiser
The Scientist's Toolkit: Essential Research Reagents
Table 3: Key Resources for Variant Prioritization Research
| Resource Category | Specific Tools/Databases | Primary Function |
|---|---|---|
| Variant Annotation | Ensembl VEP [1] [40], ANNOVAR [1] [40], Jannovar [42] [43] | Functional consequence prediction using genomic coordinates |
| Population Frequency | gnomAD [42] [43], 1000 Genomes [42] [43], TOPMed [42] | Filtering common polymorphisms |
| Pathogenicity Prediction | dbNSFP [42] [43], PolyPhen2 [40], REVEL, SpliceAI | In silico functional impact assessment |
| Phenotype Resources | Human Phenotype Ontology (HPO) [41] [43], PhenoTips [41] | Standardized phenotypic terminology |
| Gene-Disease Databases | OMIM, Orphanet, ClinGen | Curated gene-disease validity associations |
| Non-Coding Annotation | ReMM [41], ENCODE, FANTOM5 | Regulatory element functional annotation |
| Computational Infrastructure | GA4GH WES/TES APIs [44], Docker/Singularity | Workflow portability and scalable execution |
Advanced Strategies for Complex Cases
Overcoming Common Challenges
Even with optimized parameters, diagnostic variants can be missed in complex cases. Strategic approaches for these scenarios include:
Handling Frequently Ranked Non-Diagnostic Genes: Some genes may consistently appear in top rankings across multiple analyses but rarely represent true diagnoses. Flagging these genes based on internal historical data can reduce interpretation burden [41]. Establishing institutional databases of solved and unsolved cases enables this refinement.
Regulatory Variant Detection: For cases with strong clinical evidence but no coding variant, Genomiser should be employed with specific attention to variants affecting known regulatory elements of genes relevant to the patient's phenotype [41]. Non-coding hits should be assessed for potential compound heterozygosity with coding variants in the same gene.
Phenotype Expansion and Pruning: When initial analysis is uninformative, carefully reconsidering the HPO terms—both adding potentially relevant but omitted terms and removing nonspecific terms—can significantly alter gene rankings [41]. The UDN analysis demonstrated that pruning overly generic perinatal terms improved performance.
Future Directions and Integration
The field of variant prioritization continues to evolve rapidly. Promising directions include the incorporation of pangenome references to improve variant detection across diverse populations, better annotation of non-coding regulatory landscapes, and the application of machine learning methods that integrate diverse predictive features [1] [45]. Additionally, initiatives like the Global Alliance for Genomics and Health (GA4GH) are developing standards and APIs (e.g., WES, TES, DRS) that enable scalable, portable analysis pipelines across computing environments [44].
Effective variant prioritization represents a critical step in bridging the gap between genomic sequencing and rare disease diagnosis. The Exomiser and Genomiser toolkit, when configured with evidence-based optimized parameters, provides a powerful framework for identifying diagnostic variants in both coding and non-coding regions. By implementing the structured protocols, resource toolkit, and strategic approaches outlined in this guide, researchers and clinicians can significantly enhance their diagnostic capabilities. The continued refinement of these tools, coupled with growing annotation resources and standardized computational infrastructure, promises to further accelerate the diagnostic odyssey for rare disease patients worldwide.
High-throughput screening (HTS) represents a foundational methodology in modern biological discovery, enabling researchers to rapidly conduct millions of genetic, chemical, or pharmacological tests. Through automated processes utilizing robotics, liquid handling devices, and sensitive detectors, HTS facilitates the identification of active compounds, antibodies, or genes that modulate specific biomolecular pathways [46]. The results of these experiments provide critical starting points for drug design and for understanding the function of particular genetic elements [46]. In functional genomics, the application of HTS technologies has revolutionized our ability to associate genes with specific cellular phenotypes, with genome-wide CRISPR/Cas9 technology coupled with phenotypic screens allowing researchers to identify which genes or non-coding regions are important for specific functions such as gene expression, cytokine secretion, cell proliferation, or cell survival [47].
The emergence of base editing technologies has created new opportunities for high-throughput functional assessment of genetic variants. CRISPR/Cas9-mediated base editors, which introduce specific nucleotide substitutions in genomic DNA rather than double-stranded DNA breaks, have been used for mutational scanning across protein coding genes and regulatory elements [47]. This technological advancement is particularly significant for functional annotation, as current sequencing efforts generate vast amounts of variant data whose biological consequences remain largely unknown. Base editor technology holds immense promise to study post-translational modification (PTM) site functionality in high-throughput by mutating specific amino acids, bypassing the need to create site-specific homology-directed repair templates [47]. This approach enables systematic decoding of the vast network of biochemical signaling events and their downstream phenotypic consequences.
Technology Foundations: Base Editing for Functional Genomics
Base Editing Mechanisms and Applications
Base editing technology represents a significant advancement over traditional CRISPR-Cas9 systems for functional genomics applications. While conventional CRISPR-Cas9 introduces double-strand breaks that activate DNA repair pathways leading to random insertions or deletions, base editors directly convert one DNA base to another without causing double-strand breaks [47]. This precision makes them particularly valuable for functional phenotyping studies where specific nucleotide changes are required to model human disease variants or study precise molecular functions.
There are two primary classes of base editors: C-to-T base editors (such as the BE4 system) that convert cytosine to thymine, and A-to-G base editors (such as the ABE8e system) that convert adenosine to guanosine [47]. The editing efficiency and specificity vary between these systems, with ABE8e demonstrating particularly high efficiency in human T cells, achieving proper editing of over 95% of adenosines in the base editing window in some applications [47]. This high efficiency is critical for pooled screening formats where uniform editing across cell populations is necessary for robust phenotypic assessment.
Table 1: Comparison of Major Base Editing Systems
| Editor Type | Base Conversion | PAM Requirement | Editing Window | Primary Applications |
|---|---|---|---|---|
| BE4 | C → T | NGG | ~5 nucleotide window | Creating stop codons, missense mutations |
| ABE8e | A → G | NGG | ~5 nucleotide window | Conservative missense mutations, targeting tyrosine-encoding codons |
Design Considerations for Base Editing Screens
The design of base editing screens requires careful consideration of multiple factors to ensure successful functional assessment. A critical first step involves determining which genomic sites are targetable using available base editing systems. Bioinformatic pipelines must consider editing windows and targetable locations relative to the sites of interest [47]. In a recent study focusing on phosphorylation sites, researchers found that 7,618 unique phosphosites were targetable with 11,392 distinct sgRNAs using the SpCas9-A-to-G editor ABE8e, while 7,063 unique phosphosites could be targeted by the SpCas9-C-to-G editor BE4 [47]. This targeting capacity enables comprehensive functional assessment of diverse genomic elements.
The amino acid side chain representation of targetable phosphosites reflects those detected and statistically regulated in biological systems [47]. Different base editors have distinct strengths; ABE8e appears to make more structurally conservative missense mutations and, unlike BE4, can target tyrosine-encoding codons [47]. These biophysical properties must be considered when designing screens to ensure that the introduced mutations will produce meaningful biological effects that can be accurately phenotyped.
Experimental Framework for BE Screens
Workflow Design and Implementation
A robust experimental workflow for base editing screens integrates quantitative proteomics with proteome-wide base editing of individual modification sites and phenotypic screens. This approach enables functional evaluation of large numbers of previously unstudied modification sites involved in critical cellular processes [47]. A representative workflow for T cell activation studies begins with temporally-resolved quantitative phosphoproteomic experiments, assaying global phosphorylation patterns at multiple time points after cellular stimulation [47]. This initial molecular profiling identifies dynamically regulated sites that become candidates for functional assessment.
The next phase involves creating a lentiviral library consisting of thousands of phosphosite-targeting sgRNAs for missense mutations, along with appropriate controls including non-targeting controls, intergenic controls, and guides that introduce terminating edits in essential genes via mRNA splice site disruption [47]. Cells are transduced at appropriate multiplicity of infection, followed by selection and base editor delivery. The editing efficiency is then confirmed through sequencing-based assessment of representation of sgRNAs before and after base editor introduction [47].
Delivery Methods and Optimization
The efficiency of base editing screens depends critically on the method used to deliver editing components into target cells. Multiple delivery strategies have been developed, each with distinct advantages and limitations. In a comparative assessment of delivery methods for base editors in Jurkat cells, researchers tested plasmid DNA, chemically synthesized and capped mRNA, and recombinant protein of different base editor versions [47]. They found that purified recombinant ABE8e protein properly edited over 95% of adenosines in the base editing window, demonstrating superior efficiency compared to nucleic acid-based delivery methods [47].
This protein-based delivery approach builds on previous genome-wide CRISPR/Cas9 screens in primary T cells where sgRNAs are delivered via lentivirus, followed by electroporation of Cas9 protein [47]. The reproducibility of this method was confirmed through repeated protein expression and purification, with Sanger sequencing confirming that 92% of adenosines in the base editing window were mutated to guanosine [47]. This high reproducibility is essential for generating reliable phenotypic data in large-scale screens.
Phenotypic Assessment and Hit Identification
Quality Control Metrics
Robust quality control is essential for successful high-throughput phenotyping experiments. High-quality HTS assays require the integration of both experimental and computational approaches for quality control (QC) [46]. Three important means of QC include: (1) good plate design, (2) selection of effective positive and negative chemical/biological controls, and (3) development of effective QC metrics to measure the degree of differentiation so that assays with inferior data quality can be identified [46].
Several quality-assessment measures have been proposed to measure the degree of differentiation between a positive control and a negative reference. These include signal-to-background ratio, signal-to-noise ratio, signal window, assay variability ratio, Z-factor, and strictly standardized mean difference (SSMD) [46]. The Z-factor is particularly widely used, with values between 0.5-1 considered excellent, 0-0.5 acceptable, and below 0 likely unacceptable for phenotypic screens [48]. These metrics help researchers identify and troubleshoot assays that may generate false positives or false negatives.
Table 2: Key Quality Control Metrics for HTS Phenotyping
| Metric | Calculation | Interpretation | Application |
|---|---|---|---|
| Z-factor | 1 - (3σp + 3σn)/|μp - μn| | 0.5-1: Excellent0-0.5: Acceptable<0: Unacceptable | Overall assay quality |
| SSMD | (μp - μn)/√(σp² + σn²) | Values >3 indicate strong separation | Data quality assessment |
| CV | σ/μ × 100% | Lower values indicate less dispersion | Control variability |
| S/B | μp/μn | Higher values indicate better signal | Signal strength |
Hit Selection Methods
The process of selecting hits—compounds or genetic perturbations with desired effects—is a critical step in HTS analysis. The analytic methods for hit selection in screens without replicates (usually in primary screens) differ from those with replicates (usually in confirmatory screens) [46]. For screens without replicates, commonly used methods include the z-score method or SSMD, which capture data variability based on an assumption that every compound has the same variability as a negative reference in the screens [46]. However, these methods can be sensitive to outliers, leading to the development of robust methods such as the z-score method, SSMD, B-score method, and quantile-based method [46].
In screens with replicates, researchers can directly estimate variability for each compound, enabling the use of SSMD or t-statistic that do not rely on the strong assumptions that the z-score and z*-score rely on [46]. While t-statistics and associated p-values are commonly used, they are affected by both sample size and effect size. For hit selection, the major interest is the size of effect in a tested compound, making SSMD particularly valuable as it directly assesses the size of effects [46]. The population value of SSMD is comparable across experiments, allowing researchers to use consistent cutoff values for measuring the size of compound effects across different screens [46].
Data Analysis and Visualization Approaches
Computational Frameworks for HTS Data
The analysis of high-throughput screening data requires specialized computational tools capable of handling large volumes of data efficiently. As HTS is usually conducted on very large libraries of compounds, the volume of raw data produced is typically huge, necessitating analysis tools that can handle large volumes of data more effectively than spreadsheet-based tools [48]. Data science platforms such as KNIME Analytics Platform provide workflows specifically designed for HTS data processing, enabling automated import of HTS data and processing to identify hits with tunable criteria [48].
A typical HTS data analysis workflow includes three main components: file upload, data processing, and visualization [48]. The file upload component accesses raw experimental data and metadata, with each raw data file describing measurements in individual wells of multi-well plates. The data processing component joins raw data files to metadata, normalizes the data, and calculates quality controls. Normalization typically occurs plate-by-plate to account for plate-to-plate variation, with each compound normalized to controls within its plate [48]. Visualization components enable interactive exploration of results, with scatter plots of normalized values and Z-scores that allow specific points to be selected and examined in tabular form [48].
Advanced Phenotypic Analysis Methods
For image-based high-throughput screens, more sophisticated analytical approaches are required. These screens generate high-dimensional data sets based on images of phenotypes at single-cell resolution [49]. The analysis typically comprises two steps: image quantification and phenotype-based analysis of gene networks [49]. While image quantification is relatively well established with several software tools offering automated pipelines, deriving functional relationships from complex datasets representing phenotypes remains challenging.
Novel methods like PhenoDissim (phenotypic dissimilarity) have been developed to compute phenotypic dissimilarity between cell populations via Support Vector Machine classification and cross validation [49]. This method defines phenotypic dissimilarity between a perturbation and a control, or between two perturbations, as the classification accuracy between the two corresponding cell populations [49]. A higher accuracy indicates better separation between the cell populations, thus a larger phenotypic dissimilarity. This approach has demonstrated good replicate reproducibility, separation of controls, and clustering quality, enabling identification of siRNA phenotypes and discovery of potential functional links between genes [49].
Integration with Genomic Variant Annotation
Bridging Functional Data with Variant Interpretation
The functional data generated through base editing screens provides critical evidence for interpreting genomic variants, particularly those of uncertain significance. As the number of whole genome sequencing (WGS), whole exome sequencing (WES), and genome-wide association studies (GWAS) continues to grow rapidly, the challenge of functional annotation has become increasingly important [1]. Despite substantial efforts committed to systematic genomic annotation, exhaustive and massive genome-wide annotation remains far from optimal and automated [1].
Functional annotation of genetic variants is a critical step in genomics research, enabling the translation of sequencing data into meaningful biological insights [1]. This process involves predicting the potential impact of variants on protein structure, gene expression, cellular functions, and biological processes. However, the ability of WGS/WES and GWAS to causally associate genetic variation with disease is hindered by significant limitations, including linkage disequilibrium (LD) and the challenge that the majority of human genetic variation resides in non-protein coding regions of the genome [1]. High-throughput functional phenotyping approaches help address these challenges by providing direct experimental evidence of variant effects.
Emerging Technologies and Future Directions
The field of high-throughput functional genomics continues to evolve rapidly, with several emerging technologies promising to enhance our capabilities. Recent advances include quantitative HTS (qHTS), which enables pharmacological profiling of large chemical libraries through generation of full concentration-response relationships for each compound [46]. This approach yields half maximal effective concentration (EC50), maximal response, and Hill coefficient for entire libraries, enabling assessment of nascent structure activity relationships [46].
Innovative approaches like drop-based microfluidics have demonstrated the potential to increase screening throughput by 1,000 times while reducing costs by a factor of one million compared to conventional techniques [46]. These systems use drops of fluid separated by oil to replace microplate wells, allowing analysis and hit sorting while reagents are flowing through channels [46]. Such technological advances will further expand the scale and precision of functional phenotyping in the coming years.
The integration of large language models (LLMs) with genomic knowledge represents another promising direction. Recent research has demonstrated that retrieval-augmented generation (RAG) can successfully integrate 190 million highly accurate variant annotations from five major annotation datasets and tools into language models [50]. This integration empowers users to query specific variants and receive accurate variant annotations and interpretations supported by advanced reasoning capabilities, potentially accelerating the interpretation of functional screening results [50].
The Scientist's Toolkit: Essential Research Reagents
Table 3: Key Research Reagents for Base Editing Screens
| Reagent Category | Specific Examples | Function | Implementation Notes |
|---|---|---|---|
| Base Editors | ABE8e, BE4 | Introduce specific nucleotide substitutions | ABE8e: A>G conversions; BE4: C>T conversions |
| Delivery Systems | Lentiviral sgRNA libraries, Recombinant protein | Deliver editing components to cells | Protein electroporation achieves >95% editing efficiency |
| Cell Models | Jurkat E6.1, TPR Reporter cells | Provide cellular context for phenotyping | Reporter cells enable monitoring of pathway activation |
| Screening Libraries | Phosphosite-targeting sgRNAs, Non-targeting controls | Target specific genomic sites | Include essential gene targeting guides as positive controls |
| Activation Reagents | α-CD3/CD28 agonist antibodies | Induce cellular signaling pathways | Enable study of activation-dependent processes |
| Detection Reagents | Antibodies for CD69, CellTiter-Glo | Measure phenotypic outcomes | Flow cytometry and luminescence readouts |
| Analysis Tools | MAGeCK, PhenoDissim, KNIME | Identify hits and analyze data | MAGeCK for essentiality analysis; specialized tools for complex phenotypes |
The comprehensive understanding of how genetic variants influence cellular function represents one of the most significant challenges in modern biology. Both coding and noncoding genetic variants can profoundly impact gene function and expression, driving disease mechanisms such as cancer progression [51] [52]. Over 90% of predicted genome-wide association study variants for common diseases are located in the noncoding genome, yet assessing their specific gene regulatory impact has remained technically challenging [52]. Traditional approaches have been limited by inefficient precision editing tools and the inability to confidently link genotypes to gene expression at single-cell resolution, creating a critical methodological gap in our ability to systematically study endogenous genetic variants and their functional consequences [51] [52].
The emergence of multi-omics data integration has revolutionized biomedical research by enabling a holistic perspective on complex biological processes [53]. Integrated approaches combine individual omics data—including genome, epigenome, transcriptome, proteome, and metabolome—in a sequential or simultaneous manner to understand the interplay of molecules and bridge the gap from genotype to phenotype [53]. However, true simultaneous measurement of multiple molecular layers at single-cell resolution has remained challenging. Single-cell DNA-RNA sequencing (SDR-seq) represents a transformative methodological advancement that directly addresses this limitation, enabling researchers to simultaneously profile genomic DNA loci and gene expression in thousands of individual cells [54] [52].
Technical Foundation of SDR-seq
Core Methodology and Workflow
SDR-seq is a targeted droplet-based method that enables simultaneous measurement of RNA and genomic DNA (gDNA) targets in the same cell with high coverage across all cells [52]. The assay combines in situ reverse transcription (RT) of fixed cells with a multiplexed PCR in droplets using Tapestri technology from Mission Bio [52]. The experimental workflow proceeds through several critical stages:
Cell Preparation: Cells are dissociated into a single-cell suspension, fixed, and permeabilized. Fixation testing has demonstrated that glyoxal provides superior results compared to paraformaldehyde (PFA) due to its inability to cross-link nucleic acids, thereby preserving gDNA and RNA quality [52].
In Situ Reverse Transcription: Custom poly(dT) primers perform in situ RT, adding a unique molecular identifier (UMI), a sample barcode, and a capture sequence to cDNA molecules [52].
Droplet Generation and Cell Lysis: Cells containing cDNA and gDNA are loaded onto the Tapestri platform. After generating the first droplet, cells are lysed, treated with proteinase K, and mixed with reverse primers for each intended gDNA or RNA target [52].
Multiplexed PCR Amplification: During generation of the second droplet, forward primers with a capture sequence overhang, PCR reagents, and a barcoding bead containing distinct cell barcode oligonucleotides with matching capture sequence overhangs are introduced. A multiplexed PCR amplifies both gDNA and RNA targets within each droplet [52].
Library Preparation and Sequencing: Distinct overhangs on reverse primers containing either R2N (gDNA, Nextera R2) or R2 (RNA, TruSeq R2) allow for separation of next-generation sequencing (NGS) library generation for gDNA and RNA. This enables optimized sequencing of each library type—full-length coverage for variant information on gDNA targets and transcript information for RNA targets [52].
Key Technical Advancements
SDR-seq represents a significant improvement over previous technologies in several key aspects. Unlike high-throughput droplet-based or split-pooling approaches that suffer from sparse data with high allelic dropout rates (>96%), SDR-seq provides high-sensitivity and tagmentation-independent readout of gDNA and RNA [52]. The method demonstrates robust scalability, capable of simultaneously profiling up to 480 genomic DNA loci and genes in thousands of single cells [51] [52]. In proof-of-concept experiments, SDR-seq detected 82% of gDNA targets (23 of 28) with high coverage across the majority of cells, with RNA target detection showing varying expression levels consistent with expected biological patterns [52].
A critical validation through species-mixing experiments using human WTC-11 iPS cells and mouse NIH-3T3 cells demonstrated minimal cross-contamination, with gDNA cross-contamination below 0.16% on average and RNA cross-contamination ranging from 0.8% to 1.6% on average [52]. The incorporation of sample barcode information during in situ RT effectively removes the majority of cross-contaminating RNA from ambient RNA, ensuring data integrity [52].
Figure 1: SDR-seq Experimental Workflow. The complete process from cell preparation to library generation enables simultaneous DNA and RNA analysis at single-cell resolution.
Performance and Validation of SDR-seq
Scalability and Sensitivity Assessment
To systematically evaluate the scalability of SDR-seq, researchers designed experiments using panels of 120, 240, and 480 targets, with equal numbers of gDNA and RNA targets in iPS cells [52]. The results demonstrated robust performance across panel sizes, with 80% of all gDNA targets detected with high confidence in more than 80% of cells across all panels, showing only a minor decrease in detection for larger panel sizes [52]. Detection and coverage of shared gDNA targets were highly correlated between panels, indicating that gDNA target detection is largely independent of panel size [52].
RNA target detection similarly showed only a minor decrease in larger panels compared to the 120-panel, with detection and gene expression of shared RNA targets being highly correlated between panels [52]. The consistency across differently sized panels confirms the robust and sensitive detection capabilities of SDR-seq independent of panel size, with variability predominantly observed for lowly expressed genes [52].
Table 1: SDR-seq Performance Metrics Across Different Panel Sizes
| Parameter | 120-Panel | 240-Panel | 480-Panel | Measurement |
|---|---|---|---|---|
| gDNA Target Detection | >80% targets detected | >80% targets detected | >80% targets detected | Percentage of targets detected in >80% of cells |
| RNA Target Detection | High sensitivity | Minor decrease | Minor decrease | Relative to 120-panel performance |
| Cross-contamination (gDNA) | <0.16% | <0.16% | <0.16% | Average cross-contamination rate |
| Cross-contamination (RNA) | 0.8-1.6% | 0.8-1.6% | 0.8-1.6% | Average cross-contamination rate |
| Cell Throughput | Thousands of cells | Thousands of cells | Thousands of cells | Single experiment capacity |
Functional Validation Through CRISPR Screens
The functional sensitivity of SDR-seq was validated through comprehensive CRISPRi (CRISPR interference), prime editing (PE), and base editing (BE) screens [54] [52]. In the CRISPRi screen, researchers demonstrated SDR-seq's ability to detect significant gene expression changes (P < 0.05) following targeted perturbation, with results visualized through volcano plots indicating fold change and P values calculated using MAST with Benjamini-Hochberg correction for multiple testing [54].
The prime editing screen further validated SDR-seq's precision by comparing reference (REF), heterozygous (HET), and alternative (ALT) alleles, revealing distinct gene expression patterns across different genotypes [54]. For instance, analysis of SOX11, ATF4, and MYH10 STOP controls demonstrated significant expression differences (P < 10−3 and P < 10−4) between reference and altered alleles, confirming the method's sensitivity to detect functional consequences of specific variants [54].
In the base editing screen, SDR-seq successfully identified variants in the POU5F1 locus and their specific impacts on gene expression, enabling functional assessment of individual variants including those in untranslated regions [54]. These comprehensive screens collectively establish SDR-seq as a powerful platform for functionally phenotyping genomic variants through direct observation of their effects on gene expression in an endogenous context.
Applications in Disease Research
Cancer Biology and Lymphoma Characterization
SDR-seq has demonstrated significant utility in cancer research, particularly in characterizing the relationship between mutational burden and transcriptional programs in B-cell lymphoma [51] [52]. Application of SDR-seq to primary B-cell lymphoma samples revealed that cells with higher mutational burden exhibited elevated B-cell receptor signaling and tumorigenic gene expression [51] [52]. This finding provides a direct link between accumulated genetic variants and pathogenic signaling pathways active in cancer cells, offering potential mechanistic insights into lymphoma progression.
The ability to simultaneously profile DNA variants and gene expression patterns in the same single cells enables researchers to establish direct genotype-to-phenotype relationships within complex tumor ecosystems. This is particularly valuable for understanding tumor heterogeneity, as subpopulations of cancer cells with distinct mutational profiles can be correlated with their respective transcriptional programs and potential drug resistance mechanisms [52].
Stem Cell Biology and Regulatory Mechanism Dissection
In human induced pluripotent stem cells (iPS cells), SDR-seq has enabled the association of both coding and noncoding variants with distinct gene expression patterns [51] [52]. This application is particularly valuable for understanding the functional consequences of genetic variants in pluripotent cells, which serve as important models for development and disease. The technology's sensitivity in detecting expression changes and linking them to specific variants facilitates the dissection of regulatory mechanisms encoded by genetic variants, advancing our understanding of gene expression regulation and its implications for disease [54].
Comparison of pseudo-bulked SDR-seq gene expression data with bulk RNA-seq data of human stem cells showed comparable expression levels for the vast majority of targets with high correlation, validating the methodological accuracy [52]. Furthermore, SDR-seq demonstrated reduced gene expression variance and higher correlation between individually measured cells compared to iPS cell data from 10x Genomics and Parse Bio, indicating greater measurement stability [52].
Table 2: Research Applications of SDR-seq Technology
| Application Domain | Biological System | Key Findings | Reference |
|---|---|---|---|
| Cancer Biology | Primary B-cell lymphoma | Cells with higher mutational burden show elevated B-cell receptor signaling and tumorigenic gene expression | [51] [52] |
| Stem Cell Biology | Human induced pluripotent stem cells | Association of coding/noncoding variants with distinct gene expression patterns | [51] [52] |
| Variant Functionalization | CRISPR-generated variants | Direct linking of specific variants to expression changes in endogenous context | [54] [52] |
| Technology Benchmarking | Species-mixing experiments | Low cross-contamination rates (<0.16% gDNA, 0.8-1.6% RNA) | [52] |
Computational Analysis Framework
Data Processing and Analysis Tools
The computational analysis of SDR-seq data relies on specialized tools and pipelines designed to handle the multi-omic nature of the data. The primary processing tool for SDR-seq data is SDRranger, which generates count/read matrices from RNA or gDNA raw sequencing data [54]. This code is publicly available under https://github.com/hawkjo/SDRranger [54].
Additional computational resources include code for TAP-seq prediction, generation of custom STAR references, and general processing of SDR-seq data, available under https://github.com/DLindenhofer/SDR-seq [54]. These tools enable researchers to accurately determine coding and noncoding variant zygosity alongside associated gene expression changes from the raw sequencing data, facilitating the identification of statistically significant associations between genotypes and transcriptional phenotypes [54].
For broader multi-omics data integration and analysis, cloud-based solutions such as the AWS multi-omics data integration framework provide scalable infrastructure for managing and analyzing large-scale genomic, clinical, mutation, expression, and imaging data [55]. This framework utilizes AWS HealthOmics, Amazon Athena, and Amazon SageMaker notebooks to enable interactive queries against a multi-omics data lake, demonstrating how genomics variant and annotation data can be stored and queried efficiently [55].
Advanced Analytical Approaches
The analysis of single-cell multi-omics data has been further enhanced by computational frameworks such as Φ-Space, which enables continuous phenotyping of single-cell multi-omics data [56]. Unlike conventional discrete cell type annotation methods, Φ-Space adopts a versatile modeling strategy to characterize query cell identity in a low-dimensional phenotype space defined by reference phenotypes [56]. This approach allows for the characterization of continuous and transitional cell states, moving beyond hard classification to better capture cellular heterogeneity [56].
The Φ-Space framework demonstrates particular utility in various analytical scenarios, including within-omics annotation, cross-omics annotation, and multi-omics annotation where both reference and query contain multimodal measurements [56]. By assigning each query cell a membership score on a continuous scale for each reference phenotype, Φ-Space enables comprehensive characterization of cells in a multi-dimensional phenotype space, supporting various downstream analyses including visualization, clustering, and cell type labeling [56].
Figure 2: Φ-Space Computational Framework for Continuous Phenotyping. This approach enables characterization of query cells in a phenotype space defined by reference phenotypes.
Integration with Genomic Annotation Standards
GA4GH Variant Annotation Framework
The functional phenotyping data generated through SDR-seq can be effectively structured and shared using the Global Alliance for Genomics and Health (GA4GH) Variant Annotation (VA) specification [57]. This standard provides a community-driven definition of compatible and computable models for specific types of variation knowledge, addressing the genomics community's need for a precise method to structure variant annotations [57].
The VA specification includes a flexible modeling framework and machine-readable schema to represent statements of knowledge about genetic variations, including assertions about a variant's molecular consequence, impact on gene function, population frequency, pathogenicity, or impact on therapeutic response [57]. By providing a machine-readable structure, VA supports efficient and precise sharing of knowledge derived from SDR-seq experiments, facilitating interoperability across different research contexts and international borders [57].
Phenotypic Data Standardization with HPO
The functional phenotypes observed through SDR-seq can be standardized using the Human Phenotype Ontology (HPO), which provides a comprehensive, computationally accessible nomenclature for disease-associated phenotypic abnormalities [58]. HPO offers over 11,000 terms describing human phenotypic abnormalities arranged in a hierarchical structure, enabling precise annotation of phenotypic features observed in single-cell data [58].
The use of HPO facilitates interoperability with numerous resources, including human genotype-phenotype databases such as OMIM and ClinVar, as well as model organism databases [58]. This standardization enables integrated computational analysis of deep phenotyping data alongside genomic variation, supporting the goals of precision medicine by allowing stratification of patients into disease subclasses with common biological bases [58].
Research Reagent Solutions
Table 3: Essential Research Reagents and Platforms for SDR-seq Experiments
| Reagent/Platform | Function | Application in SDR-seq |
|---|---|---|
| Tapestri Platform (Mission Bio) | Microfluidic droplet generation | Core platform for single-cell partitioning and barcoding |
| Custom poly(dT) primers | Reverse transcription | In situ cDNA synthesis with UMI and sample barcode addition |
| Glyoxal fixative | Cell fixation | Nucleic acid preservation without cross-linking |
| Proteinase K | Protein digestion | Cell lysis and protein removal after droplet generation |
| Target-specific primers | Multiplexed PCR | Amplification of up to 480 gDNA and RNA targets |
| Barcoding beads | Cell barcoding | Unique cell barcode delivery during multiplexed PCR |
| SDRranger | Data processing | Generation of count/read matrices from raw sequencing data |
SDR-seq represents a significant advancement in single-cell multi-omics technology, providing an powerful platform to dissect regulatory mechanisms encoded by genetic variants [51]. By enabling accurate determination of coding and noncoding variant zygosity alongside associated gene expression changes in thousands of single cells, this method advances our fundamental understanding of gene expression regulation and its implications for disease [51] [52].
The technology's applications span from basic research in stem cell biology and cancer mechanisms to potential clinical translation in precision oncology. As the field moves toward increasingly comprehensive multi-omic profiling, integration of SDR-seq with other single-cell modalities such as epigenomics and proteomics will likely provide even more comprehensive views of cellular function and heterogeneity.
The ongoing development of computational methods for analyzing multi-omics data, including frameworks like Φ-Space for continuous phenotyping and standardized annotation formats like the GA4GH Variant Annotation specification, will be crucial for maximizing the biological insights gained from SDR-seq experiments [56] [57]. Together, these technological and analytical advances are paving the way for a more comprehensive understanding of how genetic variation shapes cellular phenotype in health and disease.
Genomic variant annotation is a critical computational process that interprets the functional impact of genetic variations. In specialized fields like oncology and antimicrobial resistance (AMR), it transforms raw genomic data into clinically actionable insights. This process involves identifying genetic variants from sequencing data and cross-referencing them with existing biological databases to predict their pathological significance, thus forming the foundation of precision medicine [59].
In oncology, the challenge lies in interpreting thousands of somatic variants, particularly classifying Variants of Unknown Significance (VUS), which lack clear therapeutic guidance [60]. For AMR, the objective is to correlate specific genetic mutations in pathogens with phenotypic resistance to antimicrobial drugs, enabling faster diagnostics and surveillance than traditional culture-based methods [61]. This guide details the experimental methodologies, computational tools, and data resources that underpin variant annotation in these two vital fields.
Annotation in Oncology
The Challenge of Actionable Mutation Discovery
The core challenge in oncology is the reliable identification of driver mutations that can be targeted therapeutically from the vast background of passenger mutations. Current strategies often focus on frequent driver mutations, leaving many rare or understudied variants unclassified and clinically uninformative [60].
An AI-Driven Framework for Oncology Variant Interpretation
A modern AI/ML-driven framework addresses this by systematically identifying variants associated with key cancer phenotypes. The following workflow illustrates this integrated approach:
Diagram 1: AI-Driven Variant Interpretation Workflow
This framework shifts from a frequency-based to a structure-informed classification, expanding the set of potentially actionable mutations. For example, it can reveal that mutations in PIK3CA and TP53 are strongly associated with ESR1 signaling, challenging conventional assumptions about endocrine therapy response in breast cancer [60].
Key Databases and Tools for Oncology Annotation
Table 1: Essential Computational Resources for Cancer Variant Interpretation
| Resource Name | Type | Primary Function in Annotation |
|---|---|---|
| CIViC [59] | Knowledgebase | Community-mined repository for clinical interpretations of variants in cancer |
| COSMIC [59] | Database | Catalog of somatic mutations from human cancers and their impacts |
| cBioPortal [59] | Platform | Open platform for interactive exploration of multidimensional cancer genomics data |
| Cancer Genome Interpreter [59] | Tool | Annotates the biological and clinical relevance of tumor alterations |
| ClinVar [59] | Database | Public archive of relationships between variants and phenotypes |
| dbNSFP [59] | Database | One-stop database of functional predictions for human non-synonymous SNVs |
Annotation in Antimicrobial Resistance
The AMR Genomic Prediction Challenge
Antimicrobial resistance poses a formidable global health threat. Machine learning applied to Whole-Genome Sequencing (WGS) data presents significant potential for uncovering the genomic mechanisms of drug resistance, moving beyond traditional diagnostic methods that are slow or limited to specific targets [61].
Experimental Protocol for ML-Based AMR Prediction
The following workflow and detailed protocol outline a robust method for developing an ML model to predict resistance in Mycobacterium tuberculosis (MTB), a methodology that can be adapted to other pathogens.
Diagram 2: ML-Based AMR Prediction Workflow
Detailed Methodology:
Data Collection and Pre-processing:
- WGS Data: Download WGS data for MTB isolates (e.g., from the Sequence Read Archive).
- Phenotype Data: Obtain corresponding Antimicrobial Susceptibility Testing (AST) phenotypes for 18 antibiotics (e.g., Rifampicin/RIF, Isoniazid/INH) from databases like PATRIC. These serve as labels (0 for susceptible, 1 for resistant) [61].
- Quality Control: Filter samples based on genome completeness (>95%) and contamination (<5%). Perform quality control on sequencing reads using tools like
fastp(Q30 ≥ 80%) [61]. - Variant Calling: Map sequencing reads to a reference genome (e.g., MTB H37Rv) using a tool like
Snippy. Perform SNP calling and genome annotation [61].
Dataset Construction for ML:
- Generate a binary matrix from the genotypes (0 for reference allele, 1 for alternative allele) and AST phenotypes.
- For datasets with a high number of SNP loci (>30,000), perform feature selection using LASSO (Least Absolute Shrinkage and Selection Operator) regression to reduce computational load and identify the most predictive features [61].
- Construct three dataset types for model training and comparison:
- All Dataset: All SNPs included.
- Intersected Dataset: SNPs from top-ranked AMR genes.
- Random Dataset: Randomly selected SNPs as a control.
Machine Learning Model Training & Evaluation:
- Algorithms: Employ twelve different ML algorithms, including Logistic Regression (logR), Random Forest (RF), Support Vector Machine (SVM), and Gradient Boosting Classifier (GBC) [61].
- Training/Test Split: Randomly hold out 10% of isolates as a final validation set. Use the remaining 90% for model training and hyperparameter tuning, typically with k-fold cross-validation (e.g., 6-fold) [61].
- Performance Metrics: Evaluate models using precision, recall, F1-score, area under the ROC curve (auROC), and area under the Precision-Recall curve (auPR) [61].
Model Interpretation and Validation:
- Use the SHapley Additive exPlanations (SHAP) framework to interpret the optimal model. SHAP quantifies the contribution of each SNP to the model's prediction, identifying the most important resistance-related mutations (e.g., position 761,155 in
rpoBfor RIF resistance) [61]. - Validate the final model's generalizability by predicting resistance phenotypes in independent, external MTB isolate datasets from different geographical regions [61].
- Use the SHapley Additive exPlanations (SHAP) framework to interpret the optimal model. SHAP quantifies the contribution of each SNP to the model's prediction, identifying the most important resistance-related mutations (e.g., position 761,155 in
Performance of ML Models in AMR Prediction
Table 2: Performance of Gradient Boosting Classifier (GBC) on MTB Drug Resistance Prediction [61]
| Antimicrobial Drug | Prediction Accuracy (%) |
|---|---|
| Rifampicin (RIF) | 97.28% |
| Isoniazid (INH) | 96.06% |
| Pyrazinamide (PZA) | 94.19% |
| Ethambutol (EMB) | 92.81% |
The Scientist's Toolkit: Essential Research Reagents & Materials
Table 3: Key Research Reagent Solutions for Genomic Variant Annotation
| Reagent / Resource | Function / Application |
|---|---|
| Next-Generation Sequencing Kits (e.g., Illumina) [62] | Library preparation and whole-genome sequencing of bacterial or tumor samples to generate raw genomic data. |
| Reference Genomes (e.g., MTB H37Rv for TB, GRCh37/38 for human) [61] | A standardized genomic sequence for mapping sequencing reads and identifying variants. |
| PATRIC Database [61] | A bacterial bioinformatics resource providing curated AST phenotypes and genomic data for model training. |
| WHO MTB Mutation Catalog [61] | A panel of mutation sites for predicting resistance to common anti-tuberculosis drugs. |
| CheckM / fastp [61] | Tools for genomic quality assessment and read quality control, respectively, to ensure data integrity. |
| Snippy [61] | A rapid tool for variant calling and core genome alignment from WGS data. |
| Scikit-learn [61] | A Python library providing the twelve ML algorithms (e.g., GBC, RF) used for building prediction models. |
| SHAP Framework [61] | A game-theoretic approach for explaining the output of any ML model, critical for identifying key AMR SNPs. |
| Ensembl Variant Effect Predictor (VEP) [59] | A tool to determine the functional consequences of genomic variants on genes, transcripts, and protein sequences. |
| ANNOVAR [59] | A software tool to functionally annotate genetic variants from high-throughput sequencing data. |
Overcoming Annotation Challenges: Discrepancies, Filtering, and Reanalysis
The translation of high-throughput sequencing data into clinically actionable findings represents a significant challenge in genomic medicine. Variant annotation, the process of identifying the biological and functional impact of genetic changes, serves as the critical foundation for all downstream interpretation [63]. However, consistent and accurate annotation is hampered by substantial discrepancies in variant nomenclature and the misapplication of key pathogenicity criteria, most notably the PVS1 (Pathogenic Very Strong 1) criterion for predicted loss-of-function (LoF) variants [21] [64]. These inconsistencies directly impact the reliability of genetic diagnoses and the validity of research findings. This technical guide, framed within the context of genomic variant annotation research, delineates the sources of these discrepancies, provides quantitative evidence of their prevalence and impact, and offers detailed methodologies for systematic validation to enhance annotation consistency.
The Critical Challenge of Annotation Inconsistency
The HGVS (Human Genome Variation Society) provides standard guidelines for variant description, yet different annotation tools frequently produce divergent nomenclatures for the same genomic variant [21] [64]. These discrepancies arise from several fundamental sources:
- Transcript Selection and Versioning: A single gene can have multiple transcript isoforms, and the same variant may be annotated with different functional consequences depending on the selected transcript. Projects like MANE (Matched Annotation from the NCBI and EMBL-EBI) aim to standardize transcript selection, but differences still impact final annotation. For example, an exonic variant on a MANE Plus Clinical transcript might be annotated as intronic on a MANE Select transcript [21].
- Sequence Alignment and Strand Orientation: The Variant Call Format (VCF) enforces left-alignment of variants based on the genome reference, whereas HGVS nomenclature aligns variants to the right based on the 3' rule in the transcript direction. This distinction is particularly problematic in nucleotide repeat regions. For genes on the reverse strand, complementary sequence conversion and strand reversal further complicate HGVS representation [21] [64].
- Syntax Preferences: HGVS nomenclature allows for preferred and non-preferred, yet equivalent, syntax. A duplication may be correctly expressed as
c.5824dup(preferred) orc.5824_5825insC(non-preferred). Similarly, protein annotations can use long-form (p.Arg1942ProfsTer48) or short-form (p.Arg1942fs) nomenclature, both of which are considered correct [21].
The PVS1 Misclassification Problem
The ACMG/AMP PVS1 criterion is a very strong evidence for pathogenicity assigned to null variants (nonsense, frameshift, canonical splice-site, etc.) in genes where loss of function is a known disease mechanism [65] [66]. However, its application is not straightforward. Inconsistent annotation of a variant's functional impact (e.g., whether it is truly a frameshift) directly leads to incorrect PVS1 application. This is exacerbated by a lack of consideration for gene-specific biological context, such as:
- Whether LoF is a confirmed disease mechanism for the gene.
- The variant's position relative to critical functional domains.
- The potential for in-frame results from splice-altering variants or the presence of alternative translation start sites [65].
Misapplication of PVS1 can result in both false-positive and false-negative pathogenicity assessments, with direct consequences for clinical reporting.
Quantitative Analysis of Annotation Discrepancies
Recent large-scale studies provide quantitative evidence highlighting the severity and impact of annotation inconsistencies.
Concordance Rates Across Major Annotation Tools
A 2025 study evaluated three widely used annotation tools—ANNOVAR, SnpEff, and the Ensembl Variant Effect Predictor (VEP)—using 164,549 high-confidence ClinVar variants [21] [64]. The analysis revealed variable concordance rates for different annotation types, as summarized in Table 1.
Table 1: Annotation Concordance Across Tools (vs. ClinVar)
| Annotation Type | Overall Concordance | ANNOVAR Performance | SnpEff Performance | VEP Performance |
|---|---|---|---|---|
| HGVSc (DNA-level) | 58.52% | Lower match rate | Highest match (0.988) | Intermediate match |
| HGVSp (Protein-level) | 84.04% | Lower match rate | Intermediate match | Highest match (0.977) |
| Coding Impact | 85.58% | Not specified | Not specified | Not specified |
The data shows that HGVSc nomenclature is the most inconsistent, with overall agreement barely exceeding 50%. This is particularly concerning as the DNA-level description forms the basis for all subsequent interpretation.
Impact on PVS1 Application and Pathogenicity Classification
The same study investigated the downstream effect of coding impact discrepancies on PVS1 assignment and final pathogenicity classification. When tools misannotated the coding impact of a variant, it frequently led to an erroneous change in the ACMG classification [21].
Table 2: Impact of LoF Misannotation on Pathogenic/Likely Pathogenic (PLP) Variants
| Annotation Tool | % of PLP Variants Downgraded due to Incorrect PVS1 Interpretation |
|---|---|
| ANNOVAR | 55.9% |
| SnpEff | 66.5% |
| VEP | 67.3% |
Alarmingly, a majority of variants that were pathogenic or likely pathogenic in ClinVar were downgraded to a lower evidence tier due to LoF misannotation, creating a significant risk of false negatives in clinical reports [21]. This underscores that annotation discrepancies are not merely academic but have real-world clinical consequences.
Experimental Protocols for Systematic Validation
To ensure the reliability of variant annotation in research and clinical pipelines, we propose the following detailed validation protocol.
Protocol 1: Benchmarking Annotation Tool Concordance
Objective: To quantitatively assess the consistency of HGVS nomenclature and predicted coding impact across multiple annotation tools against a validated benchmark dataset.
Materials and Reagents:
- Benchmark Dataset: High-confidence variant set from ClinVar (VCF format, GRCh38) [21] [64].
- Bioinformatic Tools: ANNOVAR, SnpEff, Ensembl VEP [21] [67] [1].
- Computational Environment: Unix-based command-line environment with sufficient memory and processing power for large VCF files.
Methodology:
- Data Curation: Download and preprocess the ClinVar VCF. Perform left-alignment and normalization using
bcftools normto ensure a consistent starting point [21] [64]. - Variant Annotation:
- ANNOVAR: Run
table_annovar.plwith RefSeq and Ensembl transcript databases. Adjust the-upstreamand-downstreamparameters to 5000 bp for consistency. Enable HGVS output [21]. - SnpEff: Execute with default parameters using a database that includes both MANE Select and MANE Plus Clinical transcripts (e.g.,
GRCh38.mane.1.2) [21] [64]. - Ensembl VEP: Run with
--hgvs,--protein, and--codingflags enabled to output HGVSc, HGVSp, and consequence predictions. Use the latest cache for Ensembl and RefSeq transcripts [21] [1].
- ANNOVAR: Run
- Data Extraction and Normalization: Parse the output from each tool. Normalize Sequence Ontology (SO) terms to a common set and prioritize the most severe consequence per transcript when multiple are reported [21].
- String-Match Comparison: For each variant, perform a string-match comparison of the HGVSc and HGVSp fields between each tool's output and the ClinVar reference. Account for and document equivalent syntax (e.g.,
dupvs.ins, long vs. short protein frameshift notation) [21] [64]. - Analysis: Calculate pairwise concordance rates for HGVSc, HGVSp, and coding impact. Identify variants and variant types (e.g., indels in repetitive regions) with the highest rates of discrepancy.
Figure 1: Workflow for benchmarking annotation tool concordance.
Protocol 2: Assessing PVS1 Misclassification Impact
Objective: To evaluate how annotation discrepancies, particularly in LoF variant classification, affect the application of the PVS1 criterion and the final ACMG pathogenicity classification.
Materials and Reagents:
- Annotation Dataset: Output from Protocol 1.
- ACMG Classification Tool: An automated classification pipeline such as an in-house system or commercially available solutions, configured with specific rule settings [21] [68].
- Reference Standard: Pathogenic/Likely Pathogenic (PLP) variants from the benchmark dataset.
Methodology:
- Establish Baseline Classification: Using the coding impact from the benchmark dataset (e.g., ClinVar's LoF designation), run the automated ACMG classifier for all PLP variants. This establishes the "ground truth" classification [21].
- Test Condition Classification: Re-run the ACMG classifier for the same variants, but this time use the coding impact as predicted by each annotation tool (ANNOVAR, SnpEff, VEP).
- PVS1 Application Logic: In the automated classification workflow, variants with a coding impact belonging to the LoF category (e.g., nonsense, frameshift, essential splice site) should be assigned the PVS1 criterion automatically. The strength of PVS1 should be modulated based on gene-specific knowledge, following the ClinGen SVI recommended decision tree [65].
- Compare and Analyze: For each tool, identify variants where the final pathogenicity classification changed between the baseline and test conditions. Calculate the percentage of PLP variants that were downgraded to a lower evidence tier (e.g., from Pathogenic to Likely Pathogenic or Uncertain Significance) due to the tool's misannotation preventing correct PVS1 application [21].
Figure 2: Process for assessing PVS1 misclassification impact.
Table 3: Key Resources for Variant Annotation and Validation
| Resource Name | Type | Primary Function in Validation | Key Features |
|---|---|---|---|
| ClinVar [21] | Public Database | Provides a benchmark dataset of variants with expert-curated assertions and HGVS nomenclature. | Includes review status; VCF files available for download. |
| ANNOVAR [21] [67] | Annotation Tool | Functional annotation of genetic variants with RefSeq/Ensembl transcripts. | Command-line based; extensive annotation databases. |
| SnpEff [21] [64] | Annotation Tool | Variant effect prediction and annotation, supports MANE transcript sets. | Integrates genomic database; predicts variant effects. |
| Ensembl VEP [21] [1] | Annotation Tool | Determines the functional consequence of variants on genes, transcripts, and protein sequence. | Web API and command-line; links to Ensembl resources. |
| bcftools [21] [64] | Bioinformatics Utility | Used for VCF file manipulation, including left-alignment and normalization. | Essential for standardizing input data pre-annotation. |
| MANE Transcript Set [21] | Transcript Resource | Provides a matched set of representative transcripts (MANE Select and MANE Plus Clinical) to standardize annotation. | Reduces discrepancies from transcript choice. |
| VariantValidator [64] | Validation Tool | Independently checks and standardizes HGVS nomenclature. | Helps resolve syntax discrepancies between tools. |
| ClinGen SVI PVS1 Guidelines [65] | Interpretation Guideline | Provides a refined decision tree for accurate application of the PVS1 criterion. | Critical for mitigating PVS1 misclassification. |
Discrepancies in variant nomenclature and the resultant misclassification of PVS1 pose a significant challenge to the reproducibility of genomic research and the accuracy of clinical diagnostics. Quantitative evidence demonstrates that even among leading annotation tools, concordance for HGVSc can be as low as 58%, leading to the erroneous downgrading of over half of pathogenic/likely pathogenic variants in automated pipelines. Addressing this requires a systematic, multi-faceted approach. Researchers must prioritize the use of standardized transcript sets like MANE, implement robust bioinformatic protocols for data pre-processing and tool comparison, and adhere to refined, gene-specific guidelines for pathogenicity criterion application. By integrating the experimental protocols and resources detailed in this guide, the research community can work towards mitigating these critical discrepancies, thereby enhancing the reliability and clinical utility of genomic variant interpretation.
Optimizing Filtering Strategies for Germline and Somatic Variants
The accurate distinction between germline and somatic variants is a critical challenge in genomic research, particularly in cancer genomics. Germline variants are inherited polymorphisms present in virtually all cells of an organism, while somatic variants are acquired mutations typically found in tumor cells. The fundamental biological difference necessitates distinct bioinformatic approaches for their identification. Filtering strategies have evolved from simple subtraction methods to sophisticated, multi-layered approaches that leverage matched normal samples, population databases, and machine learning classifiers to achieve high specificity and sensitivity [69] [70]. This technical guide provides an in-depth examination of current optimization methodologies for discriminating between these variant types, framed within the broader context of initiating genomic variant annotation research.
The strategic importance of optimized filtering extends across multiple domains of biomedical research. In clinical settings, accurate somatic variant identification enables precision oncology by revealing tumor-specific mutations that may guide therapeutic decisions. Simultaneously, recognizing germline variants informs cancer predisposition assessment. For drug development professionals, distinguishing these variant classes is essential for target validation, biomarker discovery, and understanding drug resistance mechanisms. Research scientists rely on precise variant classification to elucidate disease mechanisms and identify novel therapeutic targets [1] [10]. The strategies outlined herein provide a framework for maximizing analytical accuracy in these applications.
Fundamental Concepts and Challenges
Variant calling begins with sequencing read alignment to a reference genome, followed by application of specialized algorithms to identify differences. The variant call format (VCF) file generated represents the fundamental data structure containing variant positions, alleles, and quality metrics [10]. The functional annotation of these genetic variants constitutes a crucial step in genomics research, enabling the translation of sequencing data into meaningful biological insights [1]. This process involves predicting the potential impact of variants on protein structure, gene expression, cellular functions, and biological processes.
Several conceptual challenges complicate the distinction between germline and somatic variants. A primary issue stems from the fact that an individual's genome contains approximately 4 million variations compared to the reference genome, with over 95% of these being polymorphic within the human population [69]. This high background of germline variation creates a needle-in-a-haystack scenario when seeking rare somatic mutations. Additional complexities include tumor heterogeneity, normal tissue contamination of tumor samples, sequencing artifacts, and the presence of low allele fraction variants arising from subclonal populations [70] [71]. These factors collectively necessitate sophisticated filtering approaches rather than simple algorithmic solutions.
Table 1: Key Characteristics of Germline and Somatic Variants
| Feature | Germline Variants | Somatic Variants |
|---|---|---|
| Origin | Inherited from parents | Acquired during lifetime |
| Presence | In all nucleated cells | Only in descendant cells of mutated cell |
| Variant Allele Frequency | ~50% (heterozygous) or ~100% (homozygous) in germline | Highly variable (influenced by tumor purity, ploidy) |
| Primary Analysis Method | Comparison to reference genome | Comparison of tumor to matched normal tissue |
| Functional Impact | Often population polymorphisms | More likely to have functional consequences in cancer |
Computational Frameworks for Variant Calling
Specialized Callers for Distinct Variant Types
Somatic variant calling fundamentally differs from germline calling and should not be approached as a simple subtraction of germline variants identified in a matched normal sample [70]. Operational similarities exist between tools like HaplotypeCaller (germline) and Mutect2 (somatic) in their shared use of graph-based assembly and haplotype determination. However, they employ fundamentally different statistical models for variant likelihood estimation and genotyping [70]. The Germline variants are identified through comparison to a reference genome, while somatic variants are detected by contrasting tumor data with matched normal tissue from the same individual.
Specialized somatic callers such as Mutect2, VarScan, and SomaticSniper incorporate multiple strategic approaches to enhance detection accuracy [72] [71]. These tools utilize probabilistic models that account for tumor-specific characteristics including variable allele fractions, tumor heterogeneity, and normal contamination. Mutect2 implements a Bayesian approach that calculates the likelihood of a variant being somatic versus sequencing error or germline polymorphism [70]. These callers additionally incorporate filters for technical artifacts, mapping errors, and sequencing biases that might otherwise be misinterpreted as somatic variants.
Consensus Approaches for Enhanced Accuracy
Employing multiple somatic mutation detection algorithms in a consensus framework significantly improves prediction accuracy. Research demonstrates that variants identified by multiple callers exhibit validation rates exceeding 98%, substantially higher than single-caller approaches [71]. This consensus strategy effectively leverages the complementary strengths of different algorithms, mitigating their individual limitations and biases.
The implementation of consensus calling can follow either a full or partial consensus model. In full consensus, only variants called by all algorithms are considered high-confidence. Partial consensus approaches retain variants called by a subset of tools, then apply additional filtering based on read depth, mapping quality, and allelic fraction to rescue legitimate somatic mutations [71]. The consensus approach is particularly valuable in research settings where maximizing sensitivity while maintaining high specificity is paramount for discovering novel mutational patterns.
Advanced Filtering Methodologies
Matched Normal and Panel of Normals Approaches
The gold standard for somatic variant identification involves sequencing a matched normal sample (e.g., blood or healthy tissue) from the same individual. This approach directly controls for individual-specific germline variation, enabling highly specific somatic detection. Bioinformatically, this is implemented by comparing allele frequencies between tumor and normal samples, with statistical tests determining the significance of observed differences [73] [70].
When matched normal samples are unavailable, a panel of normals (PoN) provides an effective alternative. A PoN aggregates variant data from multiple normal samples, identifying systematic artifacts and common germline polymorphisms. Mutect2 utilizes PoNs to filter sites present in normal populations, significantly reducing false positives [72] [70]. The construction of an effective PoN requires careful sample selection, appropriate size, and compatibility with the sequencing platform and processing pipeline. Research indicates that approximately 200 normal genomes suffice for structural variants, while 400 are needed for optimal SNV and indel filtering [69].
Database-Driven Filtering and Virtual Normal Approach
Public variant databases represent essential resources for filtering common germline polymorphisms. Key databases include dbSNP for single nucleotide polymorphisms, the 1000 Genomes Project for population-level variation, the Exome Variant Server for exonic polymorphisms, and gnomAD for broader population frequencies [69] [1] [63]. Database filtering typically requires exact matches of position and alternative allele between the sample and database records.
The virtual normal (VN) approach extends beyond simple database filtering by leveraging complete genomic information from healthy individuals. This methodology utilizes a set of 931 samples from healthy, unrelated individuals originating from multiple sequencing platforms to create a comprehensive filter [69]. The VN approach removes >96% of the germline variants also removed by a matched normal sample, plus an additional 2-8% of variants not corrected by the associated normal. Advanced implementations of VN methodology can detect equivalences between differently described variants by analyzing reference sequence context and neighboring variants, providing superior accuracy compared to position-only database matching [69].
Table 2: Performance Comparison of Germline Filtering Methods
| Filtering Method | Germline SNVs Removed | Additional Variants Removed | Minimum Sample Size |
|---|---|---|---|
| Matched Normal | Gold standard | Baseline | 1 |
| Virtual Normal | >96% of MN performance | 2%-8% beyond MN | 400 for SNVs/indels |
| Database Filtering | Limited to catalogued variants | None | N/A |
| Panel of Normals | Systematic artifacts | Common germline polymorphisms | 200 for SVs |
Quality-Based Filtering Parameters
Quality filtering forms an essential layer in variant prioritization, applying thresholds based on various sequence-derived metrics. For germline variants, key parameters include coverage (minimum of 8 reads for capture kits), QUAL score (Phred-scaled probability of variant existence), and genotype quality (GQ) [74]. Somatic variant filtering employs more complex criteria, including median mapping quality of alternate alleles, base quality, strand bias, and allelic fraction thresholds [74].
The VarSome Clinical implementation exemplifies a comprehensive quality filtering regime, distinguishing between filters that automatically fail variants versus those that flag without automatic rejection [74]. Automatic failure triggers include low mapping quality, low base quality, evidence of contamination, weak evidence, low allele fraction, normal artifact, presence in panel of normals, and strand bias. Non-failing flags include clustered events, duplicates, fragment length differences, multiallelic sites, and orientation bias [74]. These thresholds require adjustment based on sequencing methodology, with amplicon-based sequencing necessitating different parameters than capture-based approaches.
Specialized Considerations for Structural Variants
Distinct Characteristics of Germline and Somatic SVs
Structural variants (SVs) represent a distinct class of genomic alterations comprising deletions, duplications, inversions, and translocations. Comprehensive analysis reveals significant differences between germline and somatic SVs in features including genomic distribution, sequence characteristics, and functional impact [75]. Somatic SVs demonstrate approximately 60 times larger spans than germline SVs, with 27% of somatic SVs exceeding 1Mb compared to only 0.4% of germline SVs.
Germline SVs show higher levels of breakpoint homology, particularly exhibiting a peak between 13-17bp corresponding to Alu element-mediated rearrangements [75]. These SVs occur closer to SINE and LINE elements, supporting transposon-mediated origins. Conversely, somatic SVs more frequently display features characteristic of chromothripsis, including closer genomic proximity to other SVs and increased likelihood of disrupting coding sequences (51% of somatic SVs versus 3.8% of germline SVs) [75].
Machine Learning Classification for SVs
The distinctive features of germline and somatic SVs enable highly accurate classification using machine learning approaches. The Germline and Tumor Structural Variant (great GaTSV) classifier leverages features such as SV span, breakpoint homology, proximity to repetitive elements, and gene disruption to discriminate variant origin with extremely high accuracy [75]. This approach is particularly valuable when matched normal samples are unavailable, such as in clinical settings or when working with long-term cell line models.
Feature analysis for SV classification extends beyond basic metrics to include associations between homology length and replication timing, relationships between SV type and gene spanning, and correlations between GC content and cluster proximity [75]. These multidimensional relationships reflect the different biological processes and selective pressures shaping germline and somatic SV landscapes, providing a robust foundation for computational classification.
Experimental Validation Protocols
Orthogonal Validation Methodologies
Experimental validation constitutes an essential step in verifying computational predictions of somatic variants. Sanger sequencing represents the gold standard for orthogonal validation, providing high-confidence confirmation of putative somatic mutations [71]. Validation protocols should prioritize variants based on potential biological significance, with particular emphasis on mutations in known cancer genes, truncating mutations, and mutations at residues with known functional importance.
The validation workflow entails PCR amplification of genomic regions containing putative variants, followed by Sanger sequencing and chromatogram analysis. Design considerations include amplicon length, primer design to avoid repetitive regions, and inclusion of positive controls. For clinical applications, the validation rate should exceed 98% for high-confidence variant calls [71]. The limited throughput of Sanger sequencing necessitates careful prioritization when dealing with the hundreds to thousands of putative somatic variants typically identified in whole exome or genome sequencing.
Validation-Based Optimization
Systematic validation of somatic mutation predictions provides critical data for optimizing filtering strategies. Comparative studies reveal significant differences in the performance of variant calling algorithms, with consensus approaches substantially improving validation rates [71]. Analytical parameters such as read depth, mapping quality, and allelic fraction thresholds should be calibrated using validation data to maximize sensitivity and specificity.
Validation data enables refinement of quality thresholds through receiver operating characteristic (ROC) analysis, identifying optimal balance points between sensitivity and specificity. This empirical approach is particularly valuable for establishing laboratory- and protocol-specific filtering parameters, accounting for differences in sequencing platforms, library preparation methods, and other technical variables. Continuous refinement of filtering strategies based on validation outcomes represents a best practice in genomic analysis.
Implementation Workflows and Tools
Integrated Analysis Pipelines
Production-scale variant filtering typically employs integrated pipelines that combine multiple specialized tools into cohesive workflows. The GDC DNA-Seq analysis pipeline exemplifies this approach, implementing alignment, co-cleaning, and four separate variant calling pipelines (MuTect2, MuSE, VarScan2, and SomaticSniper) [72]. Such pipelines incorporate quality control metrics, batch effect correction, and standardized annotation to ensure consistent results across large sample sets.
The Galaxy platform provides accessible workflow implementation through its graphical interface, including tools for somatic variant identification with tumor-normal pairs [73]. These workflows encompass quality control, alignment, duplicate marking, local realignment, base quality recalibration, variant calling, and annotation. Workflow management systems such as Nextflow and Snakemake further enable reproducible, scalable implementation of complex filtering strategies across computing environments.
Annotation and Prioritization Tools
Variant annotation represents the critical bridge between filtered variant lists and biological interpretation. Tools such as Ensembl's Variant Effect Predictor (VEP), ANNOVAR, and SnpEff provide comprehensive functional annotation, including gene consequences, protein effect, and regulatory element overlap [1] [10] [63]. These tools integrate information from diverse databases including dbSNP, ClinVar, COSMIC, and genotype-tissue expression (GTEx) data.
Prioritization approaches extend beyond basic annotation to incorporate pathogenicity prediction scores (SIFT, PolyPhen, CADD), population frequency filters, and phenotype-specific considerations [10] [63]. The VAREANT toolkit exemplifies modern approaches to variant reduction and annotation, supporting targeted extraction of relevant variants and AI/ML-ready dataset preparation [10]. Customizable filtration strategies enable researchers to balance stringency and sensitivity according to their specific research objectives.
Diagram 1: Comprehensive workflow for germline and somatic variant filtering. The parallel pathways highlight the distinct yet complementary approaches for each variant type, converging on quality filtering and annotation stages.
The Scientist's Toolkit
Table 3: Essential Research Reagents and Computational Tools for Variant Filtering
| Tool/Resource | Type | Primary Function | Application Context |
|---|---|---|---|
| BWA | Alignment tool | Maps sequencing reads to reference genome | Pre-processing step for all variant calling |
| GATK | Variant calling suite | Germline and somatic variant discovery | Production-scale variant detection |
| Mutect2 | Somatic caller | Identifies tumor-specific mutations | Primary somatic variant detection |
| VEP | Annotation tool | Functional consequence prediction | Post-calling variant interpretation |
| dbSNP | Database | Catalog of human genetic variation | Germline polymorphism filtering |
| Panel of Normals | Reference set | Identifies systematic technical artifacts | Somatic variant false-positive reduction |
| SnpEff | Annotation tool | Variant effect prediction | Impact assessment on genes and transcripts |
| VarSome | Clinical platform | Integrated variant calling and interpretation | Clinical variant analysis |
| COSMIC | Database | Catalog of somatic mutations in cancer | Cancer-specific variant prioritization |
| VAREANT | Filtering toolkit | Variant reduction and annotation | Preparing AI/ML-ready datasets |
Optimized filtering strategies for germline and somatic variants require a multi-layered approach that combines specialized computational methods with rigorous validation. The integration of matched normal samples when available, supplemented by population databases, panels of normals, and virtual normal approaches, provides a robust foundation for accurate variant classification. Quality-based filtering parameters must be tailored to specific experimental contexts and sequencing methodologies. Emerging machine learning approaches show particular promise for structural variant classification and situations where matched normal samples are unavailable. Implementation through integrated workflows and comprehensive annotation pipelines enables researchers to translate raw sequencing data into biologically meaningful insights, supporting advances in basic research, drug development, and clinical application. As genomic technologies evolve and datasets expand, continued refinement of these filtering strategies will remain essential for maximizing the value of genomic variant information.
Parameter Tuning in Prioritization Tools to Improve Diagnostic Yield
The advent of high-throughput sequencing technologies has made exome (ES) and genome sequencing (GS) standard genetic tests for rare diseases. Despite this, a significant diagnostic gap remains, with 59–75% of rare disease patients undiagnosed after sequencing, often due to the challenge of pinpointing clinically relevant variants among millions of candidates [41]. Variant prioritization tools are essential to bridge this gap, as they integrate multiple lines of evidence to generate a manageable list of candidate variants for clinical review.
The core challenge in genomic variant annotation research is that the default parameters of prioritization tools are not universally optimal for all datasets or clinical scenarios. Systematic parameter tuning is therefore not merely an optimization step but a fundamental requirement to maximize diagnostic yield. This guide provides a detailed, evidence-based framework for tuning variant prioritization tools, specifically focusing on the widely adopted open-source suite, Exomiser and Genomiser. The recommendations are contextualized within a broader research workflow, empowering scientists and drug development professionals to enhance the accuracy and efficiency of their genomic analyses.
Core Principles of Variant Prioritization
Variant prioritization tools function by aggregating and weighting diverse genomic evidence to calculate a score that ranks variants or genes by their likelihood of being diagnostic.
Foundational Concepts and Inputs
- Phenotype Integration: A patient's clinical presentation is encoded using Human Phenotype Ontology (HPO) terms [41]. These terms enable computational comparison between the patient's phenotype and known gene-phenotype associations from databases like OMIM.
- Genotypic Evidence: This includes data from a Variant Call Format (VCF) file, such as population allele frequency (e.g., from gnomAD), in silico predictions of variant deleteriousness (e.g., CADD, REVEL, SpliceAI), and segregation patterns within a family (e.g., de novo, compound heterozygous) [76] [41].
- Algorithmic Scoring: Tools like Exomiser calculate separate variant and phenotype scores, which are then combined into a final ranking. The phenotype score quantifies the match between the patient's HPO terms and phenotypes associated with a given gene [41].
Tuning Parameters for Optimal Diagnostic Performance
Default parameters in prioritization tools offer a starting point, but research demonstrates that systematic tuning can dramatically improve performance. The following data-driven recommendations are derived from an analysis of 386 diagnosed probands from the Undiagnosed Diseases Network (UDN) [41].
Key Parameters for Exomiser and Genomiser
Table 1: Key Parameters for Tuning Exomiser and Genomiser Performance
| Parameter Category | Parameter Description | Default/Naive Setting | Optimized Recommendation | Impact of Optimization |
|---|---|---|---|---|
| Gene-Phenotype Scorer | Algorithm for matching HPO terms to gene-disease associations | PhenIX | HiPhive [41] | Broadest coverage of gene-phenotype data, essential for novel discoveries [41] |
| Variant Pathogenicity | In silico predictor for missense variants | Multiple defaults | REVEL [41] | Superior performance in ranking pathogenic missense variants [41] |
| Frequency Filter | Maximum population allele frequency threshold | Often too restrictive | ≥ 1% for dominant, ≥ 0.5% for recessive inheritance [41] | Prevents filtering out of known diagnostic variants found at higher frequencies [41] |
| Structural Variants | Inclusion of non-SNV/indel variants | Not prioritized | Include in analysis | Captures a broader spectrum of pathogenic variation |
Quantitative Impact of Parameter Optimization
Empirical studies on UDN cohorts quantify the substantial gains achievable through parameter optimization.
Table 2: Diagnostic Variant Ranking Improvement with Optimized Parameters
| Sequencing Type | Variant Type | Top 10 Rank (Default) | Top 10 Rank (Optimized) | Percentage Point Improvement |
|---|---|---|---|---|
| Genome Sequencing (GS) | Coding Variants | 49.7% | 85.5% | +35.8 pp [41] |
| Exome Sequencing (ES) | Coding Variants | 67.3% | 88.2% | +20.9 pp [41] |
| Genome Sequencing (GS) | Noncoding Variants | 15.0% | 40.0% | +25.0 pp [41] |
For non-coding variant prioritization with Genomiser, it is recommended to use the tool complementarily with Exomiser, not as a replacement. Integration of ReMM scores, designed to predict the pathogenicity of noncoding regulatory variants, is critical for success [41].
Experimental Protocols for Benchmarking and Validation
To establish a robust variant prioritization workflow, researchers should implement a standardized protocol for benchmarking and validation.
Protocol: Benchmarking Prioritization Tool Performance
This protocol assesses how effectively a tuned pipeline ranks known diagnostic variants.
- Cohort Selection: Curate a set of "solved" cases (e.g., from the UDN or internal databases) with a confirmed molecular diagnosis. A cohort of 30-50 probands with diverse genetic conditions provides a good starting point [41].
- Data Harmonization: Ensure all ES/GS data is processed through a uniform bioinformatic pipeline (e.g., alignment to GRCh38, joint calling) to minimize batch effects [41].
- Phenotype Curation: Compile comprehensive and accurate HPO term lists for each proband. The quality and quantity of HPO terms significantly impact performance. Avoid over-reliance on automated extraction; manual curation by a clinical expert is ideal [41].
- Parameter Testing: Execute the prioritization tool (e.g., Exomiser) iteratively:
- Run with default parameters.
- Run with a set of optimized parameters (see Table 1).
- Test the impact of individual parameter changes in isolation.
- Performance Metric Calculation: For each run, record the rank of the known diagnostic variant. Calculate the percentage of diagnostic variants ranked in the top 1, top 5, top 10, and top 30 [41].
Protocol: Optimizing Phenotype Input
The following workflow diagram outlines a strategic approach to refining phenotype input, a critical factor for prioritization success.
Optimizing Phenotype Input
This protocol is supported by UDN data showing that pruning non-specific prenatal/perinatal HPO terms from proband lists can improve diagnostic variant ranking [41]. Furthermore, analysis indicates that using a set of 10-20 random HPO terms, or a list smaller than the comprehensive clinical profile, can yield performance comparable to using the full list, suggesting that term quality and specificity are more critical than sheer quantity [41].
The Scientist's Toolkit: Essential Research Reagents
A successful variant annotation and prioritization project relies on a suite of key reagents and computational resources.
Table 3: Essential Research Reagents and Resources for Variant Prioritization
| Category | Resource | Specific Example | Function in Workflow |
|---|---|---|---|
| Prioritization Software | Exomiser/Genomiser | https://github.com/exomiser/Exomiser/ [41] | Core open-source tool for phenotype-driven ranking of coding/non-coding variants [41]. |
| Variant Annotation | Functional Annotation Tool | NIRVANA, snpEff, VEP [77] [78] | Annotates variants with consequence, population frequency, and pathogenicity predictions [77]. |
| Phenotype Ontology | Human Phenotype Ontology (HPO) | https://hpo.jax.org/ [41] | Standardized vocabulary for describing patient phenotypic abnormalities [41]. |
| Population Frequency | Genomic Aggregation Database | gnomAD (https://gnomad.broadinstitute.org/) [77] | Filter out common polymorphisms unlikely to cause rare disease [41]. |
| Gene-Disease Association | Phenotype-Gene Knowledgebase | OMIM (https://www.omim.org/) [79] | Provides curated information on known Mendelian genes and associated phenotypes [79]. |
| Pathogenicity Predictors | In Silico Scores | REVEL, CADD, SpliceAI, ReMM (for non-coding) [41] | Computational prediction of the deleterious impact of missense and non-coding variants [41]. |
| Data Management | Structured Format | Variant Call Format (VCF), PED (Pedigree) [41] | Standardized files for inputting genomic and family structure data into prioritization tools [41]. |
Advanced Scenarios and Alternative Workflows
Even with an optimized primary workflow, complex cases require alternative strategies.
Handling Unsolved Cases
For cases that remain undiagnosed after initial analysis, consider these approaches:
- Gene Burden Testing: Investigate if non-coding variants in a gene's regulatory regions, when combined with a coding variant, cause compound heterozygous effects. Genomiser is specifically designed for this scenario [41].
- Re-analysis with Updated Annotations: Regularly re-analyze unsolved cases (e.g., annually) as gene-disease associations and variant interpretation guidelines evolve [41].
- Investigate Frequently Ranked Genes: Some genes may be consistently highly ranked across many patients but rarely diagnostic. These can be "blacklisted" to reduce noise in future analyses, though they should be periodically re-evaluated [41].
Integrated Multi-Omics Annotation
For a comprehensive functional interpretation, especially for non-coding variants, integrate epigenomic data. As demonstrated in pig genomics, combining WGS with ATAC-seq (Assay for Transposase-Accessible Chromatin with sequencing) and deep learning models (e.g., Basenji) can predict the impact of non-coding SNPs on chromatin accessibility and link them to effects on gene expression and complex traits [78]. This multi-dimensional annotation is a powerful method for prioritizing variants in regulatory regions.
Parameter tuning is a critical, evidence-driven process that significantly enhances the diagnostic yield of genomic sequencing. By moving beyond default settings—optimizing gene-phenotype scorers, selecting superior pathogenicity predictors, and adjusting frequency filters—researchers can improve the top-10 ranking of diagnostic coding variants by over 20 percentage points. The implementation of the detailed experimental protocols and the strategic use of the essential research reagents outlined in this guide will provide researchers and clinicians with a robust framework for tackling the most challenging rare disease cases. This structured approach to variant prioritization is fundamental to advancing genomic medicine, enabling more accurate diagnoses, and facilitating the development of targeted therapies.
Implementing Effective Reanalysis Workflows for Unsolved Cases
The diagnostic odyssey for rare genetic diseases often concludes inconclusiously after initial genomic testing. However, programmatic reanalysis of existing genome-phenome data has emerged as a powerful strategy to increase diagnostic yields without additional sequencing. Studies demonstrate that systematic reanalysis can achieve additional diagnostic yields of 2.7% to 33.3% in previously undiagnosed cases, leveraging updated databases and improved analytical methods developed since initial assessment [80] [81] [82]. This technical guide provides research scientists and drug development professionals with comprehensive frameworks for implementing effective reanalysis workflows, enabling them to harness advancing genomic knowledge to solve previously intractable cases.
Genomic science represents a rapidly evolving field where knowledge expansion necessitates periodic reassessment of previously generated data. The American College of Medical Genetics (ACMG) recommends variant-level re-evaluation and case-level reanalysis approximately every two years, reflecting the dynamic nature of genomic interpretation [80]. The growing gap between raw sequencing data generation and meaningful biological information extraction underscores the critical need for robust reanalysis protocols that can transform undiagnosed cases into solved ones.
Several factors drive the diagnostic potential of reanalysis workflows. New gene-disease associations emerge continuously, with approximately 250 new relationships established annually through OMIM alone [80]. Concurrently, variant-disease associations grow at a rate of approximately 9,200 curated entries per year in databases like HGMD [80]. These accelerating knowledge gains, combined with enhanced bioinformatic tools and refined genotype-phenotype correlations, create unprecedented opportunities for extracting new diagnostic insights from existing genomic data.
Quantitative Evidence: Diagnostic Yield from Reanalysis
Multiple studies across diverse patient populations demonstrate the significant impact of systematic reanalysis on diagnostic yields. The following table synthesizes key findings from recent implementations:
Table 1: Diagnostic Yields from Genomic Data Reanalysis in Selected Studies
| Study/Project | Patient Population | Sample Size | Reanalysis Method | Additional Diagnostic Yield |
|---|---|---|---|---|
| Solve-RD Project | Rare disease cases (ERNs) | 4,411 cases | Programmatic workflow using GPAP API | 120 solved cases (2.7% of total) [80] |
| Clinical Laboratory Study | Neurodevelopmental disorders | 116 cases | Reannotation with updated databases | 6 new diagnoses (5.2% increase) [81] |
| Clinical Laboratory Study | Epileptic encephalopathy | 384 cases | Reannotation with updated databases | 7 new diagnoses (1.8% increase) [81] |
| Bone Marrow Failure Study | Suspected Fanconi anemia | 6 cases | Comprehensive WES reanalysis | 2 new diagnoses (33.3% increase) [82] |
Beyond these specific findings, larger systematic reviews indicate that routine reanalysis of previously negative NGS data yields an average 10% diagnostic gain in undiagnosed cases, with some studies reporting yields as high as 25% [82]. The substantial variation in reported yields reflects differences in patient populations, initial testing methodologies, time intervals between analyses, and the comprehensiveness of reanalysis protocols.
Core Reanalysis Workflow Components
Standardized Data Processing Pipeline
Effective reanalysis begins with standardized processing of raw genomic data to ensure consistency and reproducibility. The following workflow illustrates the core data processing steps:
Diagram 1: Standardized Genomic Data Processing Workflow
This standardized processing pipeline forms the foundation for effective reanalysis. The RD-Connect Genome-Phenome Analysis Platform employs a similar approach, processing exome and genome sequencing data through GATK best practices using the GRCh37 human reference before annotation with Variant Effect Predictor (VEP) and major population databases [80]. This consistent processing enables reproducible variant identification essential for subsequent reanalysis iterations.
Programmatic Reanalysis Methodology
The Solve-RD project has pioneered an innovative programmatic approach to reanalysis that leverages computational scalability. Their method utilizes the RD-Connect GPAP's Application Programming Interface (API) and relies on big-data technologies upon which the system is built [80]. This programmatic workflow enables automated, flexible, and iterative re-evaluation of thousands of genomic datasets through systematic querying.
The core technical implementation involves:
- API-Driven Queries: Automated programmatic access to annotated genomic data indexed in a non-relational Elasticsearch database connected to a Hadoop environment [80]
- Flexible Filtering Parameters: Application of diverse filtering criteria according to variant annotation including population frequencies, protein impact, and in silico predictors [80]
- Phenotype Integration: Incorporation of standardized phenotypic information using Human Phenotype Ontology (HPO) and Orphanet Rare Disease Ontology (ORDO) to create unique gene lists for each case [80]
- Segregation Analysis: Family-based filtering based on suspected inheritance patterns and data from patient relatives within the system [80]
This programmatic approach returned an average of 1.45 candidate variants per case from 4,411 undiagnosed cases, enabling efficient prioritization for expert review [80].
Annotation and Prioritization Protocol
Variant annotation forms the critical bridge between raw variant calls and biological interpretation. The following workflow details the annotation and prioritization process:
Diagram 2: Variant Annotation and Prioritization Workflow
The ANNOVAR (ANNOtate VARiation) tool enables efficient functional annotation of single nucleotide variants and insertions/deletions, examining their functional consequences on genes, inferring cytogenetic bands, reporting functional importance scores, and identifying variants in public databases [83] [84]. This annotation process typically requires approximately 4 minutes for gene-based annotation and 15 minutes for variants reduction on 4.7 million variants, making practical the handling of hundreds of human genomes in a single day [83].
Following annotation, variant prioritization employs a multi-faceted filtering approach:
- Rarity Filters: Selection of variants with population allele frequency <0.01 in gnomAD and <0.02 in internal databases [80]
- Pathogenicity Filters: Focus on variants annotated as pathogenic or likely pathogenic in ClinVar or meeting ACMG/AMP guidelines for pathogenicity [81]
- Inheritance Filters: Application of mode-specific inheritance patterns (autosomal dominant, autosomal recessive, X-linked) based on family pedigree
- Gene-Disease Validity: Consideration of established gene-disease relationships using curated gene lists from clinical panels or expert networks [80]
Essential Research Reagents and Computational Tools
Successful implementation of reanalysis workflows requires specific computational tools and resources. The following table details essential components for establishing an effective reanalysis pipeline:
Table 2: Essential Research Reagents and Computational Tools for Reanalysis
| Tool/Resource Category | Specific Examples | Primary Function | Implementation Considerations |
|---|---|---|---|
| Variant Annotation Tools | ANNOVAR, wANNOVAR, VEP (Variant Effect Predictor) [83] [84] | Functional consequence prediction, database annotation | ANNOVAR enables fast annotation (4-15 min/genome); wANNOVAR provides web-based interface [84] |
| Variant Calling & Processing | GATK (Genome Analysis Toolkit), BWA (Burrows-Wheeler Aligner), Picard [82] | Read alignment, variant calling, file processing | GATK best practices provide standardized processing; BWA for efficient alignment [82] |
| Variant Databases | ClinVar, gnomAD, HGMD, dbSNP, OMIM [81] | Population frequency, pathogenicity classification, literature associations | Regular updates (quarterly recommended) essential for accuracy [81] |
| In Silico Prediction Tools | REVEL, SIFT, PolyPhen-2, MutationTaster, PROVEAN [81] [82] | Computational prediction of variant impact | REVEL particularly valuable for missense variant interpretation [82] |
| Phenotype Integration | HPO (Human Phenotype Ontology), ORDO (Orphanet Rare Disease Ontology) [80] | Standardized phenotypic data representation | Essential for genotype-phenotype correlation and candidate gene prioritization [80] |
| CNV Analysis | ExomeDepth, Genomic Ranges, IRanges [82] | Copy number variant detection from exome data | Bayes factor thresholding (e.g., >10) improves specificity [82] |
The ANNOVAR software exemplifies the efficiency required for large-scale reanalysis, performing gene-based annotation in approximately 4 minutes and variants reduction on 4.7 million variants in approximately 15 minutes using a standard desktop computer [83]. This computational efficiency makes practical the processing of hundreds of human genomes within a day, enabling scalable reanalysis implementation.
Experimental Protocols for Reanalysis Implementation
Comprehensive Reannotation Protocol
The clinical laboratory study on neurodevelopmental disorders and epileptic encephalopathy provides a validated protocol for diagnostic reanalysis:
- Input Preparation: Collect variant call format (VCF) files from patients with previously negative results [81]
- Automated Reannotation: Process VCF files through annotation pipelines using updated versions of ANNOVAR and Variant Effect Predictor software [81]
- Database Integration: Annotate variants with current versions of ClinVar, OMIM, HGMD, and population databases (gnomAD, 1000 Genomes) [81]
- Computational Prediction: Apply in silico predictive programs (Mutation Taster, SIFT, PolyPhen-2, PROVEAN) for variant impact assessment [81]
- Benign Variant Filtration: Filter out benign or likely benign variants using integrated scores from population frequency, in silico predictions, and literature evidence [81]
- Manual Review and Validation: Manually inspect automatically re-annotated data and perform parental confirmation testing when possible [81]
This protocol, implemented in a clinical laboratory setting, required reannotation reflecting updated databases as the primary intervention, demonstrating that even limited-scope reanalysis can yield significant diagnostic gains [81].
Comprehensive Reanalysis with Expanded Gene Consideration
The bone marrow failure study exemplifies a more comprehensive approach to reanalysis:
- Data Recovery and Realignment: Retrieve original sequencing FASTQ files and realign against reference genome (GRCh37) using BWA and Picard tools [82]
- Variant Recallation: Recall single nucleotide variants and indels using GATK, with functional annotation via ANNOVAR [82]
- CNV Integration: Analyze copy number variants using ExomeDepth and Genomic Ranges packages in RStudio [82]
- Quality Assessment: Evaluate sequencing quality using FastQC, ensuring adequate coverage (e.g., >80% of exome at 20X coverage) [82]
- Expanded Gene Consideration: Move beyond initial gene panels to examine variants across all genes associated with OMIM diseases, then consider genes without established OMIM associations but literature support for phenotypic relevance [82]
- Variant Prioritization: Filter variants based on allele frequency (public databases and internal population data), protein impact, and inheritance patterns [82]
This comprehensive approach achieved a 33.3% diagnostic yield in previously unsolved suspected Fanconi anemia cases by systematically expanding the analytical scope beyond initially considered genes [82].
Implementation Framework and Best Practices
Successful implementation of reanalysis workflows requires careful consideration of technical infrastructure, resource allocation, and ethical frameworks. The Solve-RD project exemplifies an enterprise-scale approach, developing a programmatic workflow using the RD-Connect GPAP's API that leverages big-data technologies for scalable reanalysis of thousands of cases [80]. This implementation demonstrates the feasibility of system-wide reanalysis when appropriate computational architecture exists.
Based on successful implementations documented in the literature, the following best practices emerge:
- Establish Regular Reanalysis Intervals: Implement systematic reassessment after sufficient time (24+ months) for genomic advancements to accumulate [82]
- Leverage Programmatic Approaches: Utilize API-based access to genomic databases for automated, scalable reanalysis of large datasets [80]
- Implement Tiered Reanalysis Protocols: Develop stratified approaches based on resource availability, from focused reannotation to comprehensive reassessment [81] [82]
- Maintain Phenotype-Genotype Integration: Ensure robust phenotypic data collection using standardized ontologies (HPO, ORDO) to inform variant prioritization [80]
- Plan for Computational Storage and Processing: Allocate sufficient resources for data storage and computational processing, recognizing that reanalysis workflows require substantial infrastructure [80]
The dynamic nature of genomic interpretation necessitates viewing reanalysis not as a one-time event but as an iterative process that evolves alongside scientific knowledge. Formalizing this approach through structured workflows and regular intervals represents the future standard for genomic medicine implementation in both research and clinical environments.
Leveraging AI and Automation for Scalable Genomic Analysis
The advent of high-throughput genome sequencing has transformed genomic analysis from a small-scale endeavor to a big data science, with projections suggesting that between 100 million and 2 billion humans could be sequenced by 2025, producing between 2 and 40 exabytes of data [85]. This deluge of genomic information has created a critical gap between generating raw sequencing data and extracting meaningful biological insights, particularly in the domain of variant annotation and interpretation [15] [16]. Traditional manual approaches to genomic analysis have become inadequate for processing the massive volumes of data generated by modern sequencing technologies, necessitating advanced computational strategies that leverage artificial intelligence (AI) and automation to achieve scalability, reproducibility, and precision [86].
In precision oncology specifically, interpreting the functional impact of genomic variants remains a major challenge, as many variants of unknown significance lack clear therapeutic guidance [60]. Current annotation strategies often focus on frequent driver mutations, leaving rare or understudied variants unclassified and clinically uninformative. The integration of AI and automated workflows addresses these limitations by enabling systematic analysis of variants across genomic, transcriptomic, structural, and drug response data dimensions, facilitating the discovery of previously overlooked mutation patterns with clinical relevance [60]. This technical guide explores the methodologies, tools, and implementations that are revolutionizing genomic variant analysis through AI and automation, providing researchers with practical frameworks for scaling their genomic research operations.
AI-Driven Approaches for Genomic Variant Analysis
Knowledge Graphs and Graph Machine Learning
The representation of genomic data as knowledge graphs (KGs) provides an ideal framework for integrating and organizing diverse biological information from multiple sources. These specialized graph structures model entities as nodes and relationships as edges, allowing for efficient querying, indexing, and supporting inference for new knowledge discovery [85]. VariantKG exemplifies this approach—a scalable tool that represents human genome variants as a KG in Resource Description Framework (RDF). It can consume numerous variant call format (VCF) files produced by variant calling pipelines and annotate them using SnpEff to generate additional information about raw variants [85].
VariantKG employs a novel ontology for genomic variants that precisely represents variant-level information and leverages Wikidata concepts useful for representing genomic data. A key feature is the synergistic integration of graph machine learning (GML) for conducting inference tasks on the knowledge graph. It employs the Deep Graph Library (DGL) for training and inference, supporting node classification tasks using well-known techniques such as GraphSAGE, Graph Convolutional Network (GCN), and Graph Transformer [85]. In evaluations, VariantKG successfully constructed a knowledge graph with 4 billion RDF statements from 1,508 VCF files, with each VCF file requiring between 1-3 minutes to process. For GML tasks, it demonstrated effective node classification using a subset of 500 VCFs and their associated metadata [85].
Large Language Models in Functional Genomics
Recent breakthroughs have demonstrated that large language models (LLMs), particularly GPT-4, can significantly automate functional genomics research, which seeks to determine what genes do and how they interact [87]. The most frequently used approach in functional genomics, called gene set enrichment, aims to determine the function of experimentally identified gene sets by comparing them to existing genomics databases. However, more novel biological insights are often beyond the scope of established databases [87].
In rigorous evaluations comparing five different LLMs, GPT-4 achieved a 73% accuracy rate in identifying common functions of curated gene sets from a commonly used genomics database. When asked to analyze random gene sets, GPT-4 refused to provide a name in 87% of cases, demonstrating its potential to analyze gene sets with minimal hallucination. The model also proved capable of providing detailed narratives to support its naming process, offering valuable explanatory context for researchers [87]. This capability to synthesize complex genomic information to generate new, testable hypotheses in a fraction of the traditional time highlights the transformative potential of LLMs in genomic analysis. To support broader adoption, researchers have created web portals to help other scientists incorporate LLMs into their functional genomics workflows [87].
AI-Driven Variant Annotation Frameworks
AI and machine learning (ML) frameworks are revolutionizing variant annotation by shifting from frequency-based to structure-informed classification. In precision oncology for breast cancer, AI/ML-driven approaches have demonstrated the ability to systematically identify variants associated with key phenotypes, including ESR1 and EZH2 activity, by integrating genomic, transcriptomic, structural, and drug response data [60].
These frameworks analyze thousands of variants across cancer genomes, identifying structurally clustered mutations that share functional consequences with well-characterized oncogenic drivers. This approach has revealed that mutations in PIK3CA, TP53, and other genes strongly associate with ESR1 signaling, challenging conventional assumptions about endocrine therapy response. Similarly, EZH2-associated variants emerge in unexpected genomic contexts, suggesting new targets for epigenetic therapies [60]. By expanding the set of potentially actionable mutations, these AI-driven annotation methods enable improved patient stratification and drug repurposing strategies, providing a scalable, clinically relevant methodology to accelerate variant interpretation and bridge the gap between genomics, functional biology, and precision medicine [60].
AI-Driven Variant Analysis Pipeline - This diagram illustrates the integrated workflow for AI-powered genomic variant analysis, showing how multiple data types are processed through various AI techniques to generate clinical insights.
Automated Workflows in Genomics
End-to-End Automation Platforms
Automation in genomics has evolved from basic robotic pipetting to fully integrated, end-to-end platforms capable of managing the entire sample-to-answer process. Modern solutions like the Automata LINQ platform offer integrated automation that transforms laboratories into cohesive, high-throughput environments by seamlessly connecting hardware and software [88]. These systems enable full walkaway automation, reducing manual touchpoints by up to 99% and doubling throughput without additional staffing or equipment [88].
These platforms typically feature intuitive, code-free workflow design interfaces that allow researchers to design and automate complex, multi-step genomics workflows without writing a single line of code. Color-coded labware makes experiments easy to read, edit, and plan, while supporting reuse of labware, reagents, and data flows for building real-world genomics automation [88]. For advanced users, software development kits (SDKs) and application programming interfaces (APIs) enable the creation of custom Python functions to accelerate development, generate detailed workflow and hardware utilization metrics, and leverage custom metadata to enhance data interoperability. This seamless preparation of workflows for advanced machine learning and AI applications positions these platforms as foundational infrastructure for modern genomic research [88].
Key Automation Areas and Their Impact
Automation touches nearly every step of a genomics pipeline, with several key areas where technology has demonstrated significant impact:
Sample Preparation and Tracking: Automated systems handle critical pre-analytical steps such as barcoding, aliquoting, and nucleic acid extraction. Robotic liquid handlers ensure precise reagent volumes and uniform mixing, reducing variability. Integration with barcoding and laboratory information management systems (LIMS) enhances traceability and chain-of-custody, which is critical for clinical and regulated environments [86].
Library Preparation and Normalization: Automated library prep platforms ensure accurate quantification, adapter ligation, and pooling for next-generation sequencing (NGS). These systems minimize human error and batch effects, improving reproducibility across runs. Automation also supports scalability, enabling laboratories to expand from dozens to hundreds of libraries daily [86].
Sequencing and Data Acquisition: Many sequencing instruments now include built-in automation modules that interface with robotic arms for plate loading and unloading. Combined with scheduling software, these integrations allow continuous operation and improved instrument utilization, maximizing return on investment for expensive sequencing equipment [86].
Bioinformatics and Data Management: Post-sequencing analysis can generate terabytes of data per project. Automation in data pipelines—using AI-enabled software, cloud computing, and machine learning—accelerates variant calling, annotation, and reporting. This reduces the manual burden of data curation and storage while improving analytical consistency [86].
Automated Genomics Workflow - This diagram shows the end-to-end automated genomics workflow with integrated automation technologies at each stage, from sample receipt to data analysis and reporting.
Benefits and Implementation Outcomes
The implementation of automated genomics workflows yields measurable operational, scientific, and economic advantages, as detailed in the table below:
Table 1: Benefits of Automation in Genomics Workflows
| Benefit | Impact on Laboratory Operations | Quantitative Outcomes |
|---|---|---|
| Consistency and Reproducibility | Reduces human variability and error rates across sample runs | Contamination rates drop to near zero [86] |
| Scalability | Supports high-throughput sequencing projects without increasing headcount | Throughput increases from 200 to 600 samples per week [86] |
| Sample Integrity | Minimizes contamination and degradation through controlled workflows | Improved data quality and reliability [86] |
| Time Efficiency | Frees scientists from repetitive pipetting and setup tasks | Hands-on time decreased by 65% [86] |
| Regulatory Compliance | Facilitates documentation, traceability, and audit readiness | Enhanced alignment with CLIA, CAP, and ISO standards [86] |
| Cost Optimization | Reduces waste and rework, improving cost per sample | Return on investment often realized within months [86] |
Successful implementation cases demonstrate striking results. One mid-sized academic genomics core implemented a fully automated NGS pipeline combining liquid handlers, robotic arms, and integrated LIMS tracking, resulting in a 65% reduction in hands-on time, a throughput increase from 200 to 600 samples per week, near-zero contamination rates, and improved staff satisfaction as technicians transitioned from repetitive pipetting to system programming and data validation roles [86]. This transformation illustrates how automation not only enhances productivity but also elevates workforce engagement and scientific quality.
Experimental Protocols and Methodologies
Variant Annotation with ANNOVAR and wANNOVAR
The ANNOVAR (ANNOtate VARiation) software represents a foundational protocol for genomic variant annotation, enabling fast and efficient functional annotation of genetic variants from high-throughput sequencing data [15] [16]. The protocol involves three primary annotation categories:
Gene-based Annotation: Identifies whether variants cause protein-coding changes and assesses their functional consequences on genes, using databases like RefSeq or Ensembl to map variants to genomic regions.
Region-based Annotation: Identifies variants in specific genomic regions of interest, such as conserved regions, predicted regulatory elements, or chromatin segmentation states, using resources like the ENCODE project, UCSC conserved elements, or dbSNP.
Filter-based Annotation: Identifies variants documented in various genomic databases with specific frequency thresholds, facilitating the removal of common polymorphisms and focusing on potentially pathogenic variants.
The variant annotation protocol typically requires 5-30 minutes of computational time, depending on the size of the variant file, and 5-10 minutes of hands-on time [15]. For gene-based annotation of a newly sequenced nonhuman species, the protocol involves downloading the gene annotation file for the target organism, converting it to a proper format, and building annotation libraries for gene-based annotation. The web-based wANNOVAR server provides a user-friendly interface for these annotation processes, enabling researchers without bioinformatics expertise to prioritize candidate genes for Mendelian diseases [16].
Knowledge Graph Construction for Genomic Variants
The construction of knowledge graphs for genomic variants follows a systematic protocol that transforms raw variant data into structured knowledge representations [85]:
Data Acquisition and Preprocessing: Obtain VCF files from variant calling pipelines and annotate them using tools like SnpEff to generate additional information about raw variants.
Ontology Development and Integration: Develop a specialized ontology for genomic variants that precisely represents variant-level information and integrate concepts from established resources like Wikidata that are useful for representing genomic data.
RDF Conversion: Convert annotated variant information into RDF format using tools such as Sparqling-genomics, which provides the foundation for graph-based data representation and querying.
Metadata Enhancement: Extract patient metadata (e.g., age, sex, disease stage) from resources like the European Nucleotide Archive (ENA) browser and insert additional RDF statements into the knowledge graph based on these resources.
Graph Database Storage: Store the resulting knowledge graph in a scalable graph database that enables efficient RDF indexing and query processing, supporting subsequent analysis and machine learning applications.
This protocol was validated through the processing of 1,508 genome sequences, resulting in 4 billion RDF statements, with each VCF file requiring between 1-3 minutes to process [85].
AI-Driven Variant Prioritization Framework
For AI-driven variant prioritization in precision oncology contexts, the following experimental protocol has been developed [60]:
Data Integration and Curation: Compile genomic, transcriptomic, structural, and drug response data from sources such as CCLE/DepMap and TCGA datasets. This includes analysis of >12,000 variants across breast cancer genomes.
Feature Engineering and Selection: Identify structurally clustered mutations that share functional consequences with well-characterized oncogenic drivers. Generate features that capture contextual information about variant distribution and potential functional impact.
Model Training and Validation: Implement machine learning algorithms, particularly those capable of identifying non-linear patterns and interactions between features. Train models to associate specific mutation patterns with clinically relevant phenotypes such as ESR1 signaling activity or EZH2 associations.
Functional Consequence Prediction: Shift from frequency-based to structure-informed classification to expand the set of potentially actionable mutations. Identify mutations in genes like PIK3CA and TP53 that strongly associate with key signaling pathways, challenging conventional assumptions about therapy response.
Clinical Interpretation and Validation: Enable improved patient stratification and drug repurposing strategies by linking variant classifications to therapeutic implications. Plan future validation efforts to refine predictions and integrate clinical outcomes to guide personalized treatment strategies.
The Scientist's Toolkit for Genomic Analysis
Table 2: Essential Research Reagent Solutions for Genomic Variant Analysis
| Tool/Category | Primary Function | Key Applications | Implementation Considerations |
|---|---|---|---|
| VariantKG [85] | Knowledge graph construction and graph machine learning for genomic variants | Scalable integration of genomic data; Node classification using GML techniques | Supports GraphSAGE, GCN, Graph Transformer; Processes 4B+ RDF statements |
| ANNOVAR/wANNOVAR [15] [16] | Functional annotation of genetic variants | Gene-based, region-based, and filter-based variant annotation | Protocol: 5-30 min compute time, 5-10 min hands-on time; Web server available |
| Automata LINQ [88] | End-to-end workflow automation platform | Laboratory automation for genomics; Integrated hardware and software solutions | Reduces manual touchpoints by up to 99%; Code-free workflow design |
| AI/ML Framework for Precision Oncology [60] | AI-driven variant interpretation | Identifying actionable mutations in cancer; Drug repurposing strategies | Analyzes >12,000 variants; Integrates genomic, transcriptomic, and drug response data |
| LLMs (GPT-4) [87] | Automated functional genomics analysis | Gene set enrichment analysis; Hypothesis generation | 73% accuracy in identifying gene functions; Minimal hallucination (87% refusal rate on random sets) |
| Illumina Variant Analysis Tools [89] | Comprehensive variant annotation and interpretation | Rare disease variant analysis; Somatic oncology research | Aggregates information from broad sources; Streamlines assessment of biologically relevant variants |
Visualization Principles for Genomic Data
Effective visualization of genomic data requires adherence to established principles that enhance interpretation and communication [90] [91]. The following rules provide guidance for creating biological data visualizations:
Rule 1: Identify the Nature of Your Data: Classify variables according to their level of measurement (nominal, ordinal, interval, ratio) and data kind (qualitative/categorical or quantitative) to inform appropriate visual encoding strategies [90].
Rule 2: Select a Perceptually Uniform Color Space: Utilize color spaces like CIE Luv and CIE Lab that align with human visual perception, ensuring that a change of length in any direction of the color space is perceived as the same change [90].
Rule 3: Consider Visual Scalability and Resolution: Design visualizations that maintain clarity across different genomic scales, from chromosome-level overviews to nucleotide-level detail, avoiding representations that become uninterpretable with larger datasets [91].
Rule 4: Make Data Complexity Intelligible: Employ visualization to detect patterns that would not be found through statistical measures alone, using derived measures and dimension reduction techniques while maintaining the ability to reveal unexpected relationships [91].
Rule 5: Assess Color Deficiencies and Accessibility: Ensure visualizations are accessible to color-blind users by testing color schemes and providing alternative encodings, considering that more than 3% of the global population experiences visual impairments [90] [91].
Implementation Considerations and Future Directions
Strategic Implementation of Automation
Successful implementation of automation in genomics requires a strategic, phased approach that addresses both technical and operational considerations [86]. Laboratory managers should begin with a comprehensive workflow audit to identify repetitive, error-prone, or bottleneck steps most suitable for automation. Starting with a pilot implementation in a single process (e.g., DNA extraction) before scaling to full workflows allows organizations to build expertise and demonstrate value incrementally [86].
Engaging end users early in the design and testing process is crucial for encouraging buy-in and ensuring that automated systems address real workflow challenges. Scientists and technicians who will interact with the automated systems daily provide invaluable feedback on interface design, workflow logic, and integration points [86]. Additionally, planning for data integration from the outset by selecting systems compatible with existing LIMS or cloud data tools prevents future interoperability challenges and ensures seamless data flow across the analytical pipeline.
Measuring return on investment through carefully selected performance metrics—such as throughput, reproducibility, error reduction, and downtime—provides objective evidence of automation's impact and guides future investment decisions [86]. These metrics should capture not only efficiency gains but also quality improvements and staff satisfaction measures to present a comprehensive view of automation's value proposition.
Emerging Trends and Future Outlook
The future of genomic analysis will be characterized by increasingly intelligent and adaptive automation systems, including modular "lab-in-a-box" solutions, closed-loop robotic arms integrated with AI-driven analytics, and the use of digital twins to simulate and optimize workflows before physical implementation [86]. These innovations signal a shift toward genomics automation that is not only efficient but also intelligent and predictive.
In AI-driven variant analysis, several trends are shaping the future landscape. Knowledge graphs and graph machine learning are evolving to incorporate more diverse data types, including real-world evidence from clinical practice, enabling more comprehensive variant interpretation [85]. Large language models are being specifically fine-tuned for genomic applications, potentially offering even higher accuracy for functional genomics tasks beyond GPT-4's current 73% success rate [87]. In precision oncology, AI frameworks are expanding to incorporate time-series data and treatment history, enabling dynamic assessment of variant significance as diseases progress and treatments change [60].
As these technologies mature, the integration of AI and automation will become increasingly seamless, creating unified systems that span from sample processing to clinical reporting. This integration promises to further accelerate genomic discovery and clinical application, ultimately fulfilling the promise of precision medicine by making comprehensive genomic analysis accessible, interpretable, and actionable for diverse research and clinical settings.
Ensuring Accuracy: Benchmarking Tools and Validating Functional Impact
The expansion of precision medicine has increased the demand for accessible and high-quality genomic analysis. As the global demand for genomic medicine grows, so does the need for platforms that empower clinicians, researchers, and smaller laboratories to perform analyses without the need for extensive programming experience [92]. Variant annotation—the process of identifying genetic alterations and interpreting their biological and clinical significance—is a critical step in this pipeline. The accuracy of annotation tools directly influences the reliability of downstream analyses, from diagnosing rare diseases to informing therapeutic decisions [93]. This guide provides an in-depth comparison of contemporary annotation tools, benchmarking their outputs and accuracy to help researchers select the most appropriate solutions for their genomic variant annotation research.
Core Concepts in Genome Annotation
Genome annotation is the process of identifying functional elements along a DNA sequence and attaching biological information to these elements. It is broadly categorized into two types:
- Structural Annotation: This involves finding features of DNA, such as exons, introns, promoters, and transposons. The process typically begins with repeat masking to identify and filter out repetitive elements, which can account for over two-thirds of the human genome [93]. Gene prediction then follows, employing either ab initio methods (which use statistical models like Hidden Markov Models to identify features based on sequence intrinsic properties), homology-based methods (which align the sequence with expressed sequence tags, cDNA, or protein evidence), or combined approaches [93].
- Functional Annotation: This process assigns biological meaning to structurally annotated features, such as gene functions, pathways, and variant pathogenicity. For variants, this involves cross-referencing databases to determine the potential impact of a genetic change on gene function and its known association with disease [92] [94].
The shift from traditional, code-intensive bioinformatics workflows toward integrated, no-code platforms is a significant trend, making powerful genomic analyses accessible to a broader range of professionals [92].
Benchmarking Methodologies and Performance Metrics
Standardized Evaluation Frameworks
Robust benchmarking requires standardized pipelines and datasets to ensure fair and reproducible comparisons between tools. Independent evaluations often utilize carefully curated independent datasets and gold standards, such as those from the Genome in a Bottle (GIAB) consortium [92] [94]. A typical benchmarking pipeline assesses tools based on three key criteria:
- Accuracy: The tool's ability to correctly identify true positive variants, often measured using the Area Under the Curve (AUC) metric on a trusted dataset like ClinVar [94].
- Robustness: Performance consistency across diverse genomic contexts and biological scenarios, such as when analyzing non-coding variants or somatic variants from cancer datasets [94].
- Usability: Encompasses computational efficiency, ease of installation, quality of documentation, and user-friendliness of the tool [94].
Key Performance Metrics
The quality of an annotation tool's output, which serves as training data for downstream analyses, is quantifiable through several key metrics. These metrics are also fundamental for evaluating the final performance of predictive models in research or clinical settings [95] [96].
- Precision: Measures the proportion of correctly labeled items among all items labeled as positive (e.g., as pathogenic). High precision indicates that the tool or annotator is accurate and introduces minimal noise.
Precision = True Positives (TP) / [True Positives (TP) + False Positives (FP)][96]. - Recall (Sensitivity): Measures the proportion of actual positive items that were correctly identified. High recall indicates that the tool is thorough and misses few true signals.
Recall = True Positives (TP) / [True Positives (TP) + False Negatives (FN)][96]. - F1 Score: The harmonic mean of precision and recall, providing a single balanced metric, especially useful when class distribution is uneven [92] [95].
- Accuracy: The overall proportion of correct predictions (both true positives and true negatives) among all predictions. While providing a broad overview, it can be misleading for imbalanced datasets [96].
Figure 1: A generalized benchmarking workflow for annotation tools, outlining core evaluation criteria and their relationships.
Benchmarking Results for Variant Annotation Tools
Whole-Exome and Whole-Genome Sequencing Tools
Independent benchmarking of platforms for whole-exome sequencing (WES) reveals a trade-off between raw calling accuracy and integrated interpretation capabilities.
Table 1: Benchmarking of Whole-Exome Sequencing Platforms using GIAB Datasets
| Platform / Tool | SNV F1 Score (%) | Indel F1 Score (%) | Key Strengths |
|---|---|---|---|
| Illumina DRAGON Enrichment | 99.69 (mean) | 96.99 (mean) | Highest raw accuracy for secondary analysis [92] |
| VarSome Clinical (Sentieon) | >98 (cluster mean) | 89-93 | Integrated tertiary analysis, ACMG/AMP pathogenicity classification [92] |
| PacBio WGS on AWS HealthOmics | High (specific metrics not provided) | High (specific metrics not provided) | Optimized for long-read data, efficient structural variant detection [97] |
A recent study highlighted that while Illumina's DRAGEN pipeline produced the most accurate secondary variant calls, VarSome Clinical simplifies the path to a clinical report by layering a germline classifier and a cross-referenced knowledge base directly over raw calls, turning VCF files into pathogenicity assessments in a single step [92]. For long-read Whole-Genome Sequencing (WGS) data, optimized pipelines like the PacBio WGS variant pipeline on AWS HealthOmics demonstrate strengths in resolving complex genomic regions and identifying structural variants, with benchmarking showing optimal performance using GPU acceleration (e.g., omics.g5.2xlarge instances) for cost-effective and rapid analysis [97].
Structural Variant Prioritization Tools
Structural variants (SVs) are genomic alterations larger than 50 base pairs and are notoriously challenging to analyze. A 2024 systematic assessment benchmarked eight widely used SV prioritization tools, categorizing them into knowledge-driven and data-driven approaches [94].
Table 2: Benchmarking of Structural Variant Prioritization Tools
| Tool Name | Category | Underlying Approach / Classifier | Primary Use Case |
|---|---|---|---|
| AnnotSV | Knowledge-driven | Implementation of ACMG/ClinGen guidelines | Clinical evaluation based on established rules [94] |
| ClassifyCNV | Knowledge-driven | Implementation of ACMG/ClinGen guidelines | Clinical evaluation based on established rules [94] |
| CADD-SV | Data-driven | Random Forest | Evolutionary fitness impact [94] |
| StrVCTVRE | Data-driven | Random Forest | Molecular functions on exons [94] |
| dbCNV | Data-driven | Gradient Boosted Trees | General pathogenicity prediction [94] |
| TADA | Data-driven | Random Forest | Molecular functions related to long-range interaction [94] |
| XCNV | Data-driven | XGBoost | General pathogenicity prediction [94] |
| SVScore | Data-driven | Derived from SNP CADD scores | Aggregation of single-nucleotide variant scores [94] |
The study found that both knowledge-driven and data-driven methods show comparable effectiveness in predicting SV pathogenicity, though performance varies among individual tools [94]. This underscores the importance of tool selection based on the specific research context, such as whether the goal is a strict clinical evaluation following ACMG guidelines (favoring knowledge-driven tools) or a broader functional prediction (favoring data-driven tools).
Emerging and Specialized Tools
The field continues to evolve with new tools addressing limitations in efficiency and scalability. SDFA (Standardized Decomposition Format and Toolkit) is a recently developed toolkit designed for efficient analysis of SVs in large-scale population studies [98]. It introduces a novel data format that standardizes and compresses SV information, overcoming challenges associated with processing conventional VCF files. SDFA demonstrates dramatic performance improvements, achieving at least 17.64 times faster merging and 120.93 times faster annotation than existing tools when validated on 895,054 SVs from 150,119 individuals in the UK Biobank [98]. This highlights a critical direction in tool development: optimizing for the computational demands of large-scale biobank data.
Figure 2: A classification of annotation tools based on their core methodology and application focus.
Successful variant annotation relies on a ecosystem of trusted datasets, software, and computational resources.
Table 3: Essential Resources for Genomic Variant Annotation Research
| Resource Name | Type | Function in Research | URL / Reference |
|---|---|---|---|
| Genome Aggregation Database (gnomAD) | Data Repository | Serves as a population frequency reference and a negative control set for benchmarking [94] | https://gnomad.broadinstitute.org/ |
| ClinVar | Data Repository | Public archive of reports of human genetic variants and their relationships to phenotype, used as a positive benchmark set [94] | https://www.ncbi.nlm.nih.gov/clinvar/ |
| Genome in a Bottle (GIAB) | Reference Material | Provides high-confidence reference genomes and datasets for benchmarking variant calls [92] | https://www.nist.gov/programs-projects/genome-bottle |
| ACMG/AMP Guidelines | Framework | The international standard for the interpretation of sequence variants, forming the basis for knowledge-driven tools [92] [94] | Richards et al. (2015) [94] |
| AWS HealthOmics | Computational Platform | A managed service for processing large-scale genomic data, used for running and benchmarking workflows like the PacBio WGS pipeline [97] | https://aws.amazon.com/healthomics/ |
Experimental Protocols for Benchmarking
To ensure reproducible and rigorous benchmarking, researchers should adhere to detailed experimental protocols. Below is a synthesis of methodologies from key cited studies.
Protocol for Benchmarking SV Prioritization Tools
This protocol is adapted from the systematic assessment of eight SV tools [94].
Dataset Curation: Construct several benchmarking datasets from independent data sources.
- Germline SVs: Collect "Pathogenic"/"Likely Pathogenic" and "Benign"/"Likely Benign" germline SVs from ClinVar. Use rare SVs from gnomAD, matched for length, as an additional negative set.
- Specialized Sets: Include non-coding SVs from peer-reviewed literature, somatic SVs from databases like COSMIC, and SV sets from GWAS and eQTL studies to test robustness.
Tool Execution and Scoring: Run each of the tools (e.g., AnnotSV, CADD-SV, ClassifyCNV) on the curated datasets. For each tool, obtain pathogenicity scores or classifications for every SV in the benchmark sets.
Performance Calculation:
- For the ClinVar dataset, plot the Receiver Operating Characteristic (ROC) curve by varying the score threshold for classifying a variant as pathogenic.
- Calculate the Area Under the Curve (AUC) as the primary accuracy metric.
- Evaluate robustness by analyzing performance consistency across the different specialized datasets (non-coding, somatic, etc.).
Usability Assessment: Document the computational resources (time, memory) required for each tool. Qualitatively score user-friendliness based on ease of installation, documentation quality, and input file complexity.
Protocol for End-to-End Pipeline Analysis
This protocol is based on the benchmarking of the PacBio WGS pipeline on AWS HealthOmics [97].
Infrastructure Setup: Deploy the chosen pipeline (e.g., PacBio's HiFi-human-WGS-WDL) on a cloud computing environment like AWS HealthOmics. Use a CloudFormation template to automate the setup of necessary Docker images and IAM roles.
Input Data Preparation: Obtain public, high-quality reference datasets, such as the PacBio HiFi data for the HG002 sample from the GIAB consortium. Store unaligned BAM files in an Amazon S3 bucket or a HealthOmics sequence store.
Pipeline Execution and Monitoring: Submit the workflow for execution. Use integrated monitoring tools like Amazon CloudWatch to track the progress of each stage (read alignment, variant calling, annotation). Test different compute instance types (e.g., CPU-optimized vs. GPU-accelerated) to assess performance and cost.
Performance and Cost Analysis: After run completion, use analytics tools (e.g., the
run_analyzerfromaws-healthomics-tools) to generate a detailed report of compute utilization, run time, and associated costs. Compare these metrics across different hardware configurations to determine the optimal setup.
Benchmarking studies consistently show that the choice of an annotation tool involves balancing raw accuracy, functional capabilities, and computational efficiency. There is no single "best" tool; rather, the optimal choice is dictated by the specific research question, the type of variant being studied, and the scale of the project. For clinical applications requiring adherence to established guidelines, knowledge-driven tools like AnnotSV and ClassifyCNV are essential. For large-scale discovery research, data-driven tools and emerging, highly efficient platforms like SDFA offer significant advantages [94] [98].
The future of annotation tool development is being shaped by several key trends. There is a strong push towards integrated platforms that combine secondary and tertiary analysis, as seen with VarSome Clinical, which streamlines the workflow from raw variant call to clinical report [92]. Furthermore, the explosion of data from large biobanks is driving innovation in computational efficiency, with new tools and data formats like SDFA achieving order-of-magnitude improvements in processing speed [98]. Finally, as long-read sequencing technologies mature, benchmarking and optimizing pipelines for these data types will be crucial for unlocking the full spectrum of genomic variation, particularly in complex regions previously inaccessible to short-read technologies [97]. For researchers beginning in genomic variant annotation, a firm grasp of these tools, their performance characteristics, and the methodologies for evaluating them is the foundation of robust and reproducible research.
The functional annotation of genetic variants is a cornerstone of modern functional genomics, crucial for interpreting the vast number of variants identified through sequencing and for understanding genotype-phenotype relationships [99] [100]. Two powerful methodologies have emerged for high-throughput variant functional analysis: cDNA-based Deep Mutational Scanning (DMS) and CRISPR Base Editing (BE). While Deep Mutational Scanning using saturation libraries of complementary DNAs (cDNAs) is a well-established method for annotating human gene variants, CRISPR base editing is rapidly emerging as a compelling alternative that operates directly on the genome [99]. Both approaches enable researchers to assess the functional impact of thousands of variants in parallel, but they differ fundamentally in their experimental paradigms, technical considerations, and applications. This technical guide provides an in-depth comparison of these methodologies, framed within the context of building a robust variant annotation research program. We examine their underlying mechanisms, performance characteristics based on recent direct comparisons, and practical implementation requirements to inform methodological selection for specific research objectives.
Core Technological Principles and Mechanisms
cDNA Deep Mutational Scanning (DMS)
The cDNA DMS approach involves creating a saturation library of cDNA constructs that encompass all possible amino acid substitutions at targeted positions. These libraries are typically introduced into mammalian cells via lentiviral transduction, often targeting safe harbor "landing pad" genomic loci or expressed from episomal vectors [100]. The fundamental principle involves tracking variant frequency changes over time or across conditions through deep sequencing, enabling quantitative assessment of each variant's effect on cellular fitness or specific phenotypic outputs. A significant technical consideration is that DMS measurements may not fully reflect mutation effects at endogenous genomic loci, as they typically involve overexpression systems that lack native genomic context and regulatory elements [100]. Additionally, the technical challenges involved in DMS can lead to variable dataset quality, requiring careful optimization and validation.
CRISPR Base Editing (BE)
CRISPR base editing represents a distinct approach that leverages engineered fusion proteins combining catalytically impaired Cas9 nucleases (nCas9) with deaminase enzymes to directly install point mutations in genomic DNA without inducing double-strand breaks [101] [102] [103]. Cytosine base editors (CBEs) convert cytosine to thymine (C→T) through deamination of cytosine to uracil, while adenine base editors (ABEs) convert adenine to guanine (A→G) through deamination of adenine to inosine [102] [103]. These editors operate within a defined "editing window" of approximately 5-10 base pairs within the target site, with efficiency influenced by factors including sequence context and chromatin accessibility [103]. The primary advantage of base editing screens is their ability to measure variant effects at endogenous genomic loci, capturing authentic splicing patterns and native gene regulation that may be absent in cDNA-based systems [100].
Table 1: Core Components of Base Editing Systems
| Component | Function | Examples |
|---|---|---|
| Cas9 nickase (nCas9) | Programmable DNA binding and strand nicking | SpCas9, SaCas9, SpRY |
| Deaminase Enzyme | Chemical conversion of nucleotides | APOBEC (CBE), TadA* (ABE) |
| Guide RNA (gRNA) | Target specificity | ~20nt spacer sequence |
| Inhibitor Domains | Enhance editing efficiency | UGI (in CBEs) |
Visualizing Base Editor Mechanism
The following diagram illustrates the fundamental mechanism of cytosine base editing, showing how the fusion protein complex targets DNA and achieves nucleotide conversion:
Direct Performance Comparison: Key Findings
A landmark 2025 study conducted the first direct comparison of cDNA DMS and base editing in the same laboratory and cell line (Ba/F3 cells), providing unprecedented insights into their relative performance [99]. This side-by-side analysis revealed several critical findings that inform methodological selection.
The study demonstrated a surprisingly high degree of correlation between base editor data and gold standard DMS measurements when appropriate data processing filters were applied [99] [100]. Specifically, agreement was maximized when focusing on the most likely predicted edits and highest efficiency sgRNAs. A simple bioinformatic filter for sgRNAs producing single edits within their editing window was sufficient to annotate a large proportion of variants directly from sgRNA sequencing of large pools [99]. When guides producing multiple edits (bystander edits) were unavoidable, the study showed that directly measuring the actual edits created in medium-sized validation pools could recover high-quality variant annotation data, suggesting a two-step workflow for optimal base editing screens [99].
Table 2: Performance Comparison of DMS vs. Base Editing
| Parameter | cDNA DMS | Base Editing |
|---|---|---|
| Genomic Context | Ectopic expression (cDNA) | Endogenous locus |
| Variant Types | All amino acid changes | Primarily transition mutations (CT, AG) |
| Editing Efficiency | High (library introduction) | Variable (depends on BE efficiency) |
| Bystander Edits | Not applicable | Challenge for interpretation |
| PAM Constraints | Not applicable | Limits targeting scope |
| Splicing Effects | Not captured | Can be assessed |
| Correlation with Gold Standard | Reference method | High with appropriate filtering |
Experimental Design and Workflows
cDNA DMS Workflow
The cDNA DMS workflow begins with library design and synthesis, typically employing saturating mutagenesis to generate single amino acid changes across the target protein domain [100]. The library is cloned into an appropriate expression vector, packaged into lentiviral particles, and transduced into target cells at low multiplicity of infection to ensure single variant integration. Cells are then sorted based on fluorescent markers to establish a baseline population, followed by phenotypic selection over an appropriate timeframe. Genomic DNA is harvested at multiple timepoints, and the mutagenized region is amplified and prepared for next-generation sequencing. A modified CRISPR-DS workflow incorporating unique molecular identifiers (UMIs) can be employed to generate error-corrected single strand consensus sequences, improving variant frequency quantification accuracy [100]. Growth rates for each mutant are then calculated using exponential growth equations based on mutant allele frequency changes between timepoints.
Base Editing Workflow
The base editing workflow initiates with comprehensive gRNA library design, tiling guides across the target genomic region with consideration of PAM orientation and editing window positioning relative to target codons [99] [100]. Guides are cloned into lentiviral vectors and packaged for delivery. Target cells are first infected with the base editor construct (ABE8e SpG or CBEd SpG in the comparative study), selected for stable expression, then transduced with the gRNA library. After sufficient time for editing and phenotypic expression, genomic DNA is harvested and sgRNAs are sequenced to assess depletion or enrichment patterns based on phenotypic selection. For enhanced accuracy, a validation pool can be established where the actual edited sequences are directly measured using error-corrected sequencing to confirm the specific variants created by each guide [99].
Visualizing Comparative Workflows
The following diagram illustrates the key procedural differences between cDNA DMS and Base Editing workflows:
Research Reagent Solutions and Tools
Implementing either cDNA DMS or base editing requires specific reagents and computational tools. The following table outlines essential components for establishing these methodologies:
Table 3: Essential Research Reagents and Tools for Variant Annotation
| Category | Specific Reagents/Tools | Function/Application |
|---|---|---|
| Vector Systems | pUltra lentiviral vector [100], lenti-sgRNA hygro vector [100] | cDNA and gRNA expression |
| Base Editors | ABE8e SpG [100], CBEd SpG [100] | Genomic nucleotide conversion |
| Cell Systems | Ba/F3 cells [100], HEK293T packaging cells [100] | Screening and viral production |
| Library Design | VaLiAnT [104], CHOP-CHOP [100] | Oligonucleotide library generation |
| Analysis Tools | Custom R/Python scripts [100], Curve_fit (Scipy) [100] | Data processing and modeling |
| Sequencing | Unique Molecular Identifiers (UMIs) [100], Error-corrected sequencing [100] | Accurate variant quantification |
Technical Considerations and Methodological Selection
Advantages and Limitations
Each methodology presents distinct advantages and limitations that must be considered during experimental design. cDNA DMS offers comprehensive coverage of all amino acid substitutions, simplified library design without PAM constraints, and typically higher editing efficiency through direct library introduction. However, it assesses variants outside their native genomic context, potentially missing splicing effects, endogenous regulation, and protein dosage effects [100]. Base editing examines variants in their endogenous genomic context, captures splicing effects, and can identify functional regions through tiling approaches [100]. Its limitations include PAM sequence constraints that limit targeting scope, bystander editing when multiple editable bases fall within the editing window, variable editing efficiency across cell types, and restriction primarily to transition mutations unless prime editing systems are employed [99] [100] [103].
Implementation Guidelines
For researchers initiating variant annotation studies, methodological selection should be guided by the specific biological questions and resources available. cDNA DMS is particularly suitable for comprehensive analysis of protein domains where all amino acid substitutions are informative, such as structure-function studies or identifying residues critical for function. Base editing excels in applications where genomic context is crucial, including splicing analysis, regulatory element characterization, and when modeling mutations in their native chromosomal environment. The recent direct comparison suggests that base editing can achieve high correlation with gold standard DMS data when appropriate filtering is applied, supporting its use for loss-of-function variant annotation [99]. For critical applications, a two-step approach using initial sgRNA screening followed by validation of actual edits in selected guides can provide high-confidence variant effect measurements.
The direct comparison of cDNA DMS and CRISPR base editing reveals that both methodologies provide powerful approaches for variant functional annotation, with surprising concordance when optimally implemented. The choice between these approaches depends on the specific research question, with cDNA DMS offering comprehensive amino acid coverage and base editing providing authentic genomic context. Recent methodological advances, including improved base editor specificity, expanded PAM compatibility, and enhanced computational tools like VaLiAnT for library design, continue to strengthen both approaches [104]. As these technologies mature and validation frameworks standardize, the research community is positioned to build increasingly comprehensive maps of variant function, ultimately advancing both basic biological understanding and precision medicine applications.
Establishing Performance Benchmarks for Minimal Models in AMR
The establishment of performance benchmarks represents a critical foundation for advancing research in genomic variant annotation. In the context of minimal models for Antimicrobial Resistance (AMR), benchmarking provides the standardized framework necessary to evaluate predictive accuracy, functional annotation reliability, and clinical applicability. The rapid evolution of sequencing technologies has democratized access to genetic variation data, creating a pressing need for robust benchmarking methodologies that can keep pace with data generation [16]. This technical guide addresses the intersection of minimal computational models and performance assessment within the broader domain of genomic annotation, providing researchers with protocols to establish meaningful benchmarks for AMR prediction tools.
Within genomic research, variant annotation refers to the process of information enrichment of genomic variants from a sequencing experiment [105]. These annotations typically include functional predictions, such as predicting amino acid sequence changes from DNA variants, predicting whether variants will induce splice anomalies, or predicting nonsense-mediated decay. Additional annotations combine database information, conservation scores, and population allele frequencies [105]. For AMR research specifically, benchmarking must address the unique challenge of connecting genotypic markers to phenotypic resistance profiles, requiring specialized approaches to model evaluation and validation.
Core Principles of Genomic Variant Annotation
Fundamental Annotation Types and Their Applications
Variant annotation pipelines typically employ three primary annotation types that form the basis for benchmarking metrics. Gene-based annotation focuses on identifying the relationship between variants and known genomic features, determining whether a variant falls within exonic, intronic, intergenic, or splicing regions [16]. Region-based annotation examines variants in the context of conserved genomic segments, protein-binding domains, or other functionally significant regions [16]. Filter-based annotation incorporates database information to filter variants based on frequency in population databases, clinical significance, or previously established associations [16].
The annotation process transforms raw variant calls from sequencing experiments into biologically meaningful information through a multi-step workflow. This begins with functional consequence prediction, which determines the effect of variants on protein coding sequences. The process continues with database integration, incorporating information from specialized repositories, and concludes with prioritization, ranking variants based on their potential functional impact and relevance to the research question [105]. For AMR benchmarking, this process must be adapted to specifically address mechanisms of resistance, including point mutations, gene acquisitions, and regulatory element alterations.
Annotation Tools and Platforms
Several specialized tools have been developed to facilitate comprehensive variant annotation. ANNOVAR (ANNOtate VARiation) represents one prominent software solution that enables fast and easy variant annotations, including gene-based, region-based, and filter-based annotations on variant call format (VCF) files generated from human genomes [16]. The web-based platform wANNOVAR provides a user-friendly interface for prioritizing candidate genes for Mendelian diseases, offering an accessible alternative to command-line implementation [16] [15].
For AMR-specific annotation, tools such as SnpEff provide specialized functionality for predicting the effects of single nucleotide polymorphisms [105]. These tools employ diverse algorithms to classify variants based on their predicted functional impact, utilizing reference databases and computational models to assign pathogenicity scores. The performance benchmarking of minimal AMR models must account for the specific capabilities and limitations of these annotation tools, establishing metrics that reflect real-world application requirements in both research and clinical settings.
Quantitative Benchmarking Frameworks for AMR Models
Key Performance Metrics and Evaluation Criteria
Table 1: Core Performance Metrics for AMR Model Benchmarking
| Metric Category | Specific Metric | Calculation Method | Optimal Range | Application Context |
|---|---|---|---|---|
| Predictive Accuracy | Sensitivity | TP / (TP + FN) | >0.95 | Clinical detection |
| Specificity | TN / (TN + FP) | >0.98 | Rule-out applications | |
| Balanced Accuracy | (Sensitivity + Specificity) / 2 | >0.90 | Overall performance | |
| Functional Impact | Precision | TP / (TP + FP) | >0.85 | Variant prioritization |
| F1 Score | 2 × (Precision × Recall) / (Precision + Recall) | >0.80 | Balanced measure | |
| Computational Efficiency | Annotation Speed | Variants processed per second | Platform dependent | Pipeline optimization |
| Memory Usage | Peak memory consumption | <16GB | Accessible implementation | |
| Concordance | Agreement between tools | >0.90 | Reliability assessment |
Performance benchmarking for minimal AMR models requires evaluation across multiple dimensions, with particular emphasis on predictive accuracy, computational efficiency, and clinical utility. Predictive accuracy metrics must capture the model's ability to correctly identify true resistance mechanisms while minimizing false positives that could lead to inappropriate treatment decisions. For AMR applications, sensitivity is particularly critical to ensure genuine resistance markers are not missed, though specificity remains important to maintain confidence in predictions [105].
Beyond basic accuracy metrics, benchmarking should evaluate computational efficiency, especially for minimal models designed for resource-constrained environments. Annotation speed, typically measured as variants processed per second, and memory consumption represent key efficiency indicators [16]. For clinical applications, where rapid turnaround times may be critical, these efficiency metrics may influence tool selection as significantly as raw accuracy. Concordance between different annotation tools provides an additional measure of reliability, with higher concordance suggesting more robust predictions [105].
Domain-Specific Benchmarking Considerations
Table 2: Domain-Specific AMR Benchmarking Parameters
| Resistance Mechanism | Primary Genomic Features | Annotation Databases | Validation Requirements | Specialized Metrics |
|---|---|---|---|---|
| Antibiotic Inactivation | Resistance genes, point mutations | CARD, ARG-ANNOT | Enzymatic activity assays | Gene detection sensitivity |
| Target Modification | SNPs in target genes | ResFinder, PointFinder | Binding affinity studies | SNP concordance rate |
| Efflux Pump Upregulation | Promoter mutations, regulatory elements | NDARO, MegaRES | Expression quantification | Regulatory variant precision |
| Membrane Permeability | Porin genes, structural variants | PATRIC, BacWGSTdb | Membrane transport assays | Structural variant recall |
| Bypass Pathways | Alternative metabolic genes | CARD, VFDB | Growth inhibition tests | Pathway completeness score |
AMR benchmarking requires specialized considerations that distinguish it from general variant annotation. Different resistance mechanisms necessitate distinct genomic features, annotation databases, and validation approaches. For example, benchmarking models for detecting antibiotic inactivation enzymes requires comprehensive resistance gene databases like CARD (Comprehensive Antibiotic Resistance Database) and validation through enzymatic activity assays [105]. In contrast, benchmarking models for identifying target site modifications focuses on single nucleotide polymorphism (SNP) detection in specific target genes, utilizing databases such as ResFinder and requiring different validation approaches [105].
The minimal model paradigm introduces additional benchmarking considerations, emphasizing efficiency and interpretability alongside predictive performance. For AMR applications, minimal models must balance comprehensive resistance detection with practical implementation constraints, particularly in clinical or point-of-care settings. Benchmarking frameworks should therefore include metrics that capture this balance, such as performance per computational resource unit or performance stability across diverse sample types and quality levels.
Experimental Protocols for Benchmark Establishment
Reference Dataset Curation and Preparation
The foundation of robust benchmarking lies in comprehensive reference dataset curation. For AMR model evaluation, this process begins with the assembly of genetically characterized isolates with well-defined resistance phenotypes. The protocol requires collecting approximately 500-1000 bacterial isolates spanning clinically relevant pathogens, with paired whole-genome sequencing data and standardized antimicrobial susceptibility testing (AST) results. Isolates should represent diverse resistance mechanisms and include both resistant and susceptible strains to enable balanced metric calculation.
Dataset preparation follows a structured multi-step process. First, raw sequencing data undergoes quality control using tools such as FastQC, requiring a minimum Q30 score of 85% and average coverage of 50-100x depending on the organism [16]. Variant calling should be performed using established pipelines such as the Genome Analysis Toolkit (GATK), with parameters optimized for bacterial genomes [15]. The resulting variant call format (VCF) files then serve as input for annotation tools, while the paired AST results provide the ground truth for resistance phenotypes. This curated dataset should be partitioned into training (60%), validation (20%), and test (20%) subsets to enable proper model development and evaluation while preventing overfitting.
Tool Configuration and Annotation Execution
The benchmarking protocol requires systematic configuration of annotation tools to ensure comparable results. For ANNOVAR implementation, the protocol begins with software installation and database setup, downloading necessary reference databases including gene annotations, conservation scores, and population frequencies [16]. The annotation command for a standard VCF file follows the structure: table_annovar.pl example.vcf humandb/ -buildver hg19 -out myanno -remove -protocol refGene,cytoBand,exac03,avsnp147,dbnsfp30a -operation gx,r,f,f,f -nastring . -vcfinput [16]. This protocol typically requires 5-30 minutes of computational time depending on variant file size, with approximately 5-10 minutes of hands-on time [16].
For SnpEff implementation, the protocol involves similar steps with tool-specific configuration. The basic execution command follows: java -Xmx8g -jar snpEff.jar -v -stats ex1.html GRCh38.76 ex1.vcf > ex1.ann.vcf [105]. Critical parameters include memory allocation (adjusting based on file size), reference genome version, and output formatting options. For AMR-specific annotation, custom databases must be incorporated, requiring additional configuration steps to integrate resistance-focused resources. The annotation output from all tools should be converted to standardized formats to facilitate comparative analysis, with particular attention to the consistent representation of resistance-conferring variants.
Performance Assessment and Statistical Validation
The performance assessment protocol implements the metrics defined in Section 3 through systematic comparison of annotation results against reference standards. For each tool and minimal model under evaluation, the process involves generating predictions for the test dataset and calculating sensitivity, specificity, precision, and F1 scores for resistance detection. Computational efficiency metrics including runtime and memory usage should be recorded during execution, with multiple replicates to account for system variability.
Statistical validation requires appropriate methods to quantify uncertainty and significance in performance differences. Confidence intervals for accuracy metrics should be calculated using binomial exact methods or bootstrapping with at least 1000 iterations. Comparison between tools employs paired statistical tests such as McNemar's test for categorical agreement, with correction for multiple testing where appropriate. For clinical utility assessment, positive and negative predictive values should be calculated using prevalence estimates from the target population, as these metrics more directly inform clinical decision-making than sensitivity and specificity alone.
Computational Tools and Software Platforms
Table 3: Essential Computational Tools for AMR Benchmarking
| Tool Category | Specific Tool | Primary Function | Implementation Requirements | Application Context |
|---|---|---|---|---|
| Variant Annotation | ANNOVAR | Gene-based, region-based, and filter-based annotation | Perl, 8GB RAM | Comprehensive variant annotation [16] |
| SnpEff | Variant effect prediction, functional impact | Java, 8GB RAM | Effect prediction [105] | |
| wANNOVAR | Web-based variant annotation | Web browser | Accessible implementation [16] | |
| Variant Calling | GATK | Variant discovery, quality control | Java, 16GB RAM | Primary variant calling [15] |
| FastQC | Sequencing data quality assessment | Java, 4GB RAM | Quality control [15] | |
| Database Resources | CARD | Antibiotic resistance gene reference | Internet access | AMR-specific annotation |
| dbSNP | Catalog of human genetic variation | Database download | Population frequency [15] | |
| ClinVar | Clinical variant interpretations | Database download | Clinical significance [105] | |
| Visualization & Analysis | R/Bioconductor | Statistical analysis, visualization | R environment | Comprehensive analysis |
| Integrative Genomics Viewer | Genomic data visualization | Java, 8GB RAM | Visual validation |
The computational toolkit for AMR benchmarking encompasses specialized software for variant annotation, effect prediction, and results visualization. ANNOVAR represents a cornerstone tool for comprehensive variant annotation, supporting gene-based, region-based, and filter-based annotation approaches [16]. For minimal model implementation, the web-based wANNOVAR platform provides an accessible alternative to command-line tools, enabling researchers without bioinformatics expertise to perform basic annotation tasks [16]. SnpEff offers specialized functionality for predicting variant effects, particularly valuable for interpreting the functional consequences of resistance-associated mutations [105].
Database resources form an essential component of the annotation toolkit, providing the reference information necessary for biological interpretation. The Comprehensive Antibiotic Resistance Database (CARD) offers specialized coverage of resistance genes and mechanisms, while general variant databases such as dbSNP and ClinVar provide population frequency and clinical significance information [15] [105]. For minimal models, selective database incorporation becomes critical to balance comprehensiveness with efficiency, requiring strategic prioritization of the most relevant resources for specific AMR applications.
Laboratory Reagents and Experimental Materials
The establishment of performance benchmarks requires not only computational resources but also laboratory reagents for experimental validation. Wet-bench validation represents a critical component of benchmark verification, ensuring that computational predictions correlate with biological reality. Bacterial culture materials including appropriate growth media, antimicrobial agents for susceptibility testing, and DNA extraction kits form the foundation for generating reference data. Whole-genome sequencing reagents, including library preparation kits and sequencing consumables, enable the generation of high-quality genomic data for benchmark development.
For functional validation of resistance mechanisms, specialized reagents may be required depending on the specific resistance type being studied. These include reverse transcription reagents for expression analysis of resistance genes, protein extraction and analysis materials for enzyme-based resistance mechanisms, and cell culture systems for studying resistance in relevant biological contexts. The specific reagent requirements vary significantly based on the resistance mechanisms under investigation and the model organisms employed, necessitating customized experimental designs for different AMR benchmarking applications.
Visualization Frameworks for Benchmark Data Interpretation
Performance Metric Visualization
Effective visualization of benchmark data enables researchers to quickly comprehend complex performance relationships across multiple tools and datasets. Standardized visualization approaches should include receiver operating characteristic (ROC) curves to illustrate the trade-off between sensitivity and specificity across classification thresholds. Precision-recall curves provide complementary information, particularly valuable for imbalanced datasets where resistance variants may be rare. Box plots effectively display distributions of computational efficiency metrics across multiple replicates or datasets, highlighting performance consistency in addition to central tendency.
For minimal model evaluation, visualization should facilitate comparison between simplified and comprehensive approaches, emphasizing the performance-efficiency trade-space. Scatter plots comparing accuracy metrics against computational requirements enable informed tool selection based on application-specific constraints. Concordance plots displaying agreement between different annotation tools help identify systematic differences in variant interpretation, highlighting areas where additional standardization may be required. These visualizations collectively support evidence-based selection of appropriate minimal models for specific research or clinical applications.
Functional Annotation Landscape Mapping
Visualization of the functional annotation landscape provides critical insights into the genomic context of resistance mechanisms. Genome browser tracks displaying annotation layers alongside variant positions help researchers interpret the functional potential of identified variants in their genomic context. Circos plots effectively summarize complex variant distributions across multiple genomes or samples, facilitating comparison of resistance marker patterns across bacterial isolates. Pathway diagrams illustrating how annotated variants impact biological processes particularly valuable for understanding resistance mechanisms involving multiple genes or complex regulatory networks.
For AMR-specific visualization, specialized approaches include resistance gene cluster diagrams showing the genomic organization of resistance elements, particularly relevant for horizontally acquired resistance mechanisms. Antimicrobial susceptibility heatmaps correlating genotypic predictions with phenotypic measurements provide intuitive displays of benchmark performance across different drug classes. Phylogenetic trees incorporating resistance annotations help trace the evolution and spread of resistance mechanisms, supporting epidemiological investigations and outbreak analysis. These visualization frameworks transform abstract annotation data into biologically meaningful representations that support scientific insight and clinical decision-making.
The establishment of performance benchmarks for minimal models in AMR annotation represents a critical foundation for reproducible, comparable research across the field. This technical guide has outlined comprehensive approaches to benchmark development, implementation, and interpretation, addressing both computational and experimental considerations. As sequencing technologies continue to evolve and resistance mechanisms grow increasingly complex, robust benchmarking methodologies will become ever more essential for translating genomic insights into clinical action.
The minimal model paradigm offers particular promise for increasing the accessibility and implementation of AMR annotation in diverse settings, from research laboratories to clinical environments with limited computational resources. By providing standardized approaches to evaluate the trade-offs between simplicity and comprehensiveness, the benchmarking frameworks described herein support informed model selection and development. Through community adoption of consistent benchmarking practices, the AMR research field can accelerate progress toward more effective detection, understanding, and countermeasures against the growing threat of antimicrobial resistance.
Integrating Structural Biology and Bioinformatics for Improved nsSNP Annotation
Non-synonymous single nucleotide polymorphisms (nsSNPs) represent a critical class of genetic variations that alter protein sequences and potentially disrupt function, with significant implications for disease mechanisms and drug development. This technical guide examines the integration of structural biology and bioinformatics approaches for enhanced nsSNP annotation. We evaluate computational methodologies, structural coverage limitations, experimental validation protocols, and emerging artificial intelligence (AI) technologies that collectively enable more accurate functional impact prediction. By synthesizing current resources, performance metrics, and practical workflows, this review provides researchers with a comprehensive framework for prioritizing nsSNPs in genomic studies and therapeutic target identification.
The exponential growth of genomic sequencing data has generated unprecedented opportunities for identifying genetic determinants of disease susceptibility and treatment response. Among the diverse forms of genetic variation, nsSNPs constitute a particularly consequential category because they directly alter protein amino acid sequences, potentially disrupting structure, function, and interaction networks [106]. The functional annotation of these variants represents a fundamental challenge in precision medicine and genomic research, necessitating sophisticated computational approaches that can predict molecular consequences from sequence and structural information [1].
Structural bioinformatics has emerged as a crucial discipline bridging computational analysis and experimental structural biology to elucidate genotype-phenotype relationships. By leveraging three-dimensional protein structures, evolutionary conservation patterns, and physicochemical properties, researchers can develop predictive models for nsSNP impact assessment [107]. However, significant challenges persist, including limited structural coverage of the human proteome, imperfect prediction algorithms, and difficulties in translating molecular effects to cellular and organismal phenotypes [107] [108]. This technical guide examines current methodologies, resources, and integrative strategies for optimizing nsSNP annotation within the broader context of genomic variant interpretation research.
Structural Coverage and Limitations for nsSNP Annotation
Structural Coverage of Human Genetic Variation
A fundamental limitation in structural bioinformatics approaches to nsSNP annotation is the incomplete coverage of human proteins by high-quality experimental structures. Comprehensive analyses indicate that only approximately 12% of known nsSNPs can be mapped to any structural model without restrictions on quality parameters [107]. This coverage drops significantly when applying stringent criteria necessary for reliable computational predictions.
Table 1: Structural Coverage of Human nsSNPs Under Different Quality Thresholds
| Parameter | Stringency Level | nsSNPs Covered | Percentage of Total |
|---|---|---|---|
| Sequence Identity | >40% | 12% | ~12% |
| Sequence Identity | >80% | 5,416 | ~4% |
| X-ray Resolution | ≤2.5Å | 5,416 | ~4% |
| Combined Quality | >80% identity + ≤2.5Å resolution | 5,416 | ~4% |
| Sequence Coverage | >80% coverage + 100aa alignment | 8,238 | ~6% |
The restricted structural coverage stems from several technical challenges: (1) difficulties in expressing, purifying, and crystallizing many human proteins, particularly membrane-associated and disordered proteins; (2) the dynamic nature of protein structures that cannot be fully captured by static snapshots; and (3) the resource-intensive nature of experimental structure determination [108]. These limitations have prompted the development of homology modeling and de novo structure prediction methods to expand the structural coverage of variant annotation.
Homology Modeling for Expanded Coverage
Comparative modeling techniques can significantly expand structural coverage by leveraging evolutionary relationships between proteins with unknown structures and experimentally solved homologs. Automated large-scale homology modeling efforts have enabled structural analysis for thousands of genes carrying approximately 24,000 nsSNPs [109]. The reliability of these models depends critically on the sequence identity between target and template:
- >80% sequence identity: High-confidence models suitable for detailed structural analysis
- 40-80% sequence identity: Moderate reliability for global fold assessment
- <40% sequence identity: Limited utility for specific variant impact prediction [107]
Recent advances in deep learning-based structure prediction, particularly AlphaFold, have revolutionized this field by providing accurate models for nearly the entire human proteome, dramatically expanding possibilities for comprehensive nsSNP annotation [110].
Computational Methodologies for nsSNP Impact Prediction
Structure-Based Prediction Tools
Structure-based methods utilize three-dimensional structural information to assess the biophysical consequences of amino acid substitutions, focusing primarily on protein stability and interaction interfaces.
Table 2: Structure-Based Tools for nsSNP Functional Impact Prediction
| Tool | Methodology | Primary Applications | Advantages | Limitations |
|---|---|---|---|---|
| FoldX | Empirical force field | Protein stability change calculation | High accuracy in stability estimation; all-atom representation | Requires high-quality structural models |
| SDM | Environment-specific substitution tables | Stability change prediction | Analogous to thermodynamic cycle | Performance varies with structural quality |
| I-Mutant 2.0 | Support vector machine | Stability change prediction | Uses sequence and structural information | Limited to stability effects |
| MUpro | Machine learning | Stability change prediction | Works with sequence alone | Lower accuracy than structure-based methods |
These tools primarily evaluate the thermodynamic consequences of amino acid substitutions, with FoldX representing one of the most accurate methods for quantifying stability changes (ΔΔG) when high-resolution structures are available [107]. However, studies examining 39 structural properties have demonstrated that individual parameters like stability changes or residue accessibility cannot reliably distinguish neutral nsSNPs from disease-associated mutations as standalone classifiers [107].
Sequence-Based Prediction Tools
Sequence-based methods leverage evolutionary conservation patterns and machine learning algorithms to predict functional impacts without requiring structural information, enabling genome-scale applications.
Table 3: Sequence-Based Tools for nsSNP Functional Impact Prediction
| Tool | Methodology | Features | Performance |
|---|---|---|---|
| SIFT | Sequence homology | Uses PSI-BLAST to find homologs, assesses conservation | ~75-80% accuracy in distinguishing neutral/damaging |
| PolyPhen | Empirical rules | Sequence conservation, structural features, phylogenetic information | ~80-85% accuracy |
| SNAP | Neural network | Multiple sequence alignments, various sequence features | ~80% accuracy |
| PROVEAN | Sequence clustering | Delta alignment scores for protein sequences | ~78% accuracy |
These tools generally outperform structure-based methods in large-scale analyses due to their broader applicability, though they provide less mechanistic insight into the structural consequences of mutations [109] [106]. Benchmarking studies have shown that while these predictors can distinguish disease-associated from neutral variants with reasonable accuracy, their performance varies considerably across different protein families and mutation types [109].
Integrative Annotation Strategies and Databases
Multi-Method Integration Approaches
Given the limitations of individual prediction methods, integrative approaches that combine multiple computational frameworks have emerged as superior strategies for comprehensive nsSNP annotation. These methods leverage complementary strengths of different algorithms to improve overall accuracy and reliability.
The SNPdbe database exemplifies this integrated approach by incorporating predictions from both SNAP and SIFT algorithms, augmented with experimental annotations from sources like PMD, OMIM, and UniProt [111]. This resource contains over 1.3 million unique single amino acid substitutions across 158,004 proteins from 2,684 organisms, providing one of the most comprehensive collections of annotated nsSNPs [111].
Large-scale analyses have demonstrated that combining structure-based stability predictions with sequence-based conservation metrics improves the classification accuracy between neutral polymorphisms and disease-associated mutations [109]. For example, one study analyzing 24,000 nsSNPs across 6,000 genes utilized both structure-based methods (when structures were available) and sequence-based methods (for the remaining variants) to predict functional impacts [109].
Several specialized databases aggregate nsSNP annotations from multiple sources, providing researchers with centralized platforms for variant interpretation.
Table 4: Major Databases for nsSNP Annotation and Analysis
| Database | Content Focus | Key Features | Update Frequency |
|---|---|---|---|
| SNPdbe | Pre-computed functional impact predictions | Integrates SIFT, SNAP predictions with experimental data | Monthly |
| LS-SNP | Structural annotations | Maps nsSNPs to protein structures and functional sites | Periodically |
| dbSNP | Comprehensive variant catalog | Reference SNP database with population frequency data | Continuous |
| ClinVar | Clinical significance | Medical interpretations of variants | Continuous |
| gnomAD | Population frequency | Aggregated sequencing data from diverse populations | Periodic releases |
These resources enable researchers to access pre-computed annotations without requiring specialized computational expertise, significantly accelerating variant prioritization in genomic studies [111] [106]. The trend toward integrating functional predictions with clinical interpretations and population genetics data represents a crucial advancement for translational genomics.
Experimental Protocols for Validation
Structural Validation Workflow
Experimental validation of computationally predicted damaging nsSNPs requires a systematic approach combining biochemical, biophysical, and cellular assays. The following protocol outlines a comprehensive validation pipeline:
Phase 1: Protein Production
- Site-Directed Mutagenesis: Introduce nsSNPs into wild-type cDNA using PCR-based mutagenesis protocols
- Protein Expression: Express wild-type and variant proteins in appropriate expression systems (E. coli, insect, or mammalian cells)
- Protein Purification: Purify proteins using affinity chromatography followed by size-exclusion chromatography
Phase 2: Biophysical Characterization
- Circular Dichroism Spectroscopy: Assess secondary structure content and folding stability using thermal denaturation experiments
- Differential Scanning Calorimetry: Quantify thermodynamic stability by measuring melting temperature (Tm) and enthalpy changes
- Size-Exclusion Chromatography with Multi-Angle Light Scattering: Evaluate oligomeric state and aggregation propensity
Phase 3: Functional Assays
- Enzyme Kinetics: For enzymatic proteins, determine Michaelis-Menten parameters (Km, kcat)
- Binding Affinity Measurements: Quantify protein-ligand or protein-protein interactions using surface plasmon resonance or isothermal titration calorimetry
- Cellular Localization: For expressed proteins, assess subcellular localization using fluorescence microscopy
This multi-tiered approach provides complementary data on structural, stability, and functional consequences of nsSNPs, enabling correlation with computational predictions [107] [109].
High-Throughput Experimental Methods
For large-scale validation of computational predictions, high-throughput experimental methods have been developed:
- Deep Mutational Scanning: Systematically assay thousands of variants simultaneously using functional selection coupled with next-generation sequencing
- Massively Parallel Reporter Assays: Evaluate the functional impacts of variants on gene expression and splicing
- Protein Microarrays: Profile interactions and post-translational modifications for variant proteins
These approaches generate valuable training datasets for improving computational prediction algorithms, creating a virtuous cycle of method refinement [106].
Visualization of Workflows and Relationships
Structural Annotation Pipeline
Integrative Annotation Framework
The Scientist's Toolkit for nsSNP Annotation Research
Table 5: Essential Research Reagents and Computational Resources
| Category | Resource | Function | Access |
|---|---|---|---|
| Structural Databases | Protein Data Bank (PDB) | Repository of experimentally determined protein structures | Public |
| EM Data Bank (EMDB) | Electron microscopy density maps and models | Public | |
| AlphaFold Database | AI-predicted protein structures | Public | |
| Variant Databases | dbSNP | Catalog of genetic variation | Public |
| gnomAD | Aggregate population frequency data | Public | |
| ClinVar | Clinical variant interpretations | Public | |
| Prediction Tools | FoldX | Structure-based stability prediction | Academic |
| SIFT | Sequence-based functional impact prediction | Public | |
| PolyPhen | Multi-source variant effect prediction | Public | |
| Annotation Suites | Ensembl VEP | Comprehensive variant effect annotation | Public |
| ANNOVAR | Functional annotation of genetic variants | Academic | |
| SNPdbe | Pre-computed nsSNP effects database | Public | |
| Experimental Resources | Site-directed mutagenesis kits | Introduction of specific variants | Commercial |
| Protein expression systems | Production of variant proteins | Commercial | |
| Biophysical instrumentation | Characterization of structural effects | Core facilities |
Emerging Technologies and Approaches
The field of nsSNP annotation is undergoing rapid transformation driven by several technological advancements:
Artificial Intelligence and Deep Learning: Recent breakthroughs in protein structure prediction, exemplified by AlphaFold, are revolutionizing structural bioinformatics approaches to nsSNP annotation [110]. These AI-based methods provide accurate structural models for nearly the entire human proteome, dramatically expanding opportunities for structure-based variant effect prediction. Deep learning frameworks that integrate sequence, structural, and functional data are showing superior performance compared to traditional algorithms [110] [112].
Integrative Multi-Omics Approaches: The combination of genomic variant data with transcriptomic, proteomic, and epigenomic information enables more comprehensive functional annotation. Methods that leverage expression quantitative trait loci (eQTLs), chromatin interaction data (Hi-C), and regulatory element maps provide insights into the broader functional consequences of nsSNPs beyond direct protein effects [1].
High-Throughput Experimental Validation: Scalable functional assays, including deep mutational scanning and massively parallel reporter assays, are generating extensive training datasets for improving computational prediction algorithms [106]. These empirical data help address the limitations of purely computational approaches and provide benchmarks for method evaluation.
The integration of structural biology and bioinformatics has substantially advanced our ability to annotate and interpret nsSNPs, yet significant challenges remain. The limited structural coverage of the human proteome, imperfect prediction algorithms, and difficulties in translating molecular effects to phenotypic outcomes continue to constrain variant interpretation. However, the convergence of improved computational methods, expanding structural resources, and high-throughput experimental validation promises to address these limitations.
For researchers embarking on genomic variant annotation studies, a tiered approach that combines multiple complementary methods is recommended: (1) initial filtering using population frequency and sequence-based predictors; (2) structural analysis when high-quality models are available; and (3) experimental validation of high-priority candidates. This integrated strategy maximizes the strengths of different approaches while mitigating their individual limitations.
As structural bioinformatics continues to evolve through AI advancements and expanding experimental data, the precision and scope of nsSNP annotation will progressively improve, enabling more accurate variant interpretation for both basic research and clinical applications. This progress will be essential for realizing the full potential of genomic medicine and advancing our understanding of genotype-phenotype relationships in human health and disease.
Best Practices for Clinical Validation and Reporting
Clinical validation and reporting represent the final, critical stages in the genomic variant analysis pipeline, transforming raw sequencing data into clinically actionable information. This process ensures that genetic variants are accurately interpreted and communicated, enabling their reliable use in diagnosis, prognosis, and treatment decisions in accordance with established clinical guidelines [113]. In the context of genomic variant annotation research, rigorous validation provides the essential bridge between computational predictions and clinical application, establishing the evidence base necessary for determining the clinical significance of genetic variants identified through next-generation sequencing (NGS) technologies [114].
The exponential growth of genetic testing, driven by NGS technologies that allow for rapid interrogation of thousands of genes and identification of millions of variants, has dramatically expanded our ability to diagnose inherited conditions and complex diseases like cancer [114]. However, this proliferation of genetic data has reiterated the critical need for standardized approaches in clinical validation and reporting. The accuracy of these processes directly impacts patient care, as errors or inconsistencies can lead to misdiagnosis, inappropriate treatment, or other clinical consequences [113]. Consequently, adherence to established standards and guidelines is not merely a technical formality but an ethical imperative in genomic medicine.
Core Principles of Clinical Variant Analysis
Foundational Concepts
Clinical variant analysis operates on several foundational principles that ensure consistent and accurate interpretation of genetic findings. First, variant classification follows a standardized categorical system that assesses the likelihood of pathogenicity based on accumulated evidence [113]. These categories provide a structured framework for clinical decision-making and risk assessment. Second, the principle of allele frequency filtering utilizes population genomics databases to determine variant rarity, recognizing that variants too common in healthy populations are unlikely to cause rare Mendelian disorders. Third, correlation with inheritance patterns ensures that variant interpretations align with established Mendelian genetics and observed family histories.
The clinical significance of variants is categorized into five standardized classifications:
- Benign: Not associated with disease
- Likely Benign: Low probability of disease association
- Variant of Uncertain Significance (VUS): Insufficient evidence to classify
- Likely Pathogenic: High probability of disease association
- Pathogenic: Established disease association [113]
These classifications depend on the strength of evidence supporting the variant's relationship to disease, with pathogenic variants strongly associated with disease and supported by both functional and clinical evidence, while VUS classifications indicate insufficient or conflicting data requiring further investigation [113].
Quantitative Benchmarks in Variant Annotation
The accuracy of variant annotation tools—a fundamental step in clinical validation—varies significantly across different platforms. A recent performance evaluation study benchmarked three major variant annotation tools using a manually curated ground-truth set of 298 variants from a clinical molecular diagnostics laboratory, with the following results:
Table 1: Performance Comparison of Variant Annotation Tools
| Tool Name | Type | Variants Correctly Annotated | Concordance with Ground Truth |
|---|---|---|---|
| Ensembl Variant Effect Predictor (VEP) | Open source | 297 of 298 variants | 99.7% |
| Alamut Batch | Commercial | 296 of 298 variants | 99.3% |
| ANNOVAR | Open source | 278 of 298 variants | 93.3% |
Source: Adapted from performance evaluation study [114]
The study attributed VEP's superior performance to its usage of updated gene transcript versions within the algorithm [114]. This quantitative assessment highlights the critical importance of tool selection in clinical validation workflows, as adoption of validated methods of variant annotation is essential in post-analytical phases of clinical testing.
Methodologies for Clinical Validation
Analytical Validation Framework
Clinical validation requires a comprehensive framework that integrates multiple evidence types to establish clinical utility and validity. The process begins with data collection and quality assessment, where high-quality data collection and robust quality assessment form the foundation of accurate clinical variant interpretation [113]. This includes gathering comprehensive patient information, including clinical history, genetic reports, and family data, which provide essential context for interpreting genetic variants [113]. Utilization of automated quality assurance systems enables real-time monitoring, ensuring the integrity of sequencing data throughout the analysis.
The second critical component is database utilization through genomic databases that play an essential role in supporting clinical variant interpretation by providing a wealth of information on genetic variants [113]. Resources such as ClinVar, a publicly accessible database that collects reports of genetic variants and their clinical significance, and gnomAD, which aggregates population-level data from large-scale sequencing projects, allow researchers to cross-reference variants with prior classifications and population frequencies [113]. Automated re-evaluation systems are particularly important, as the genomic field evolves rapidly with new studies that can influence variant classification.
The third element involves computational predictions through tools that play a key role in predicting the potential impact of genetic variants, particularly when experimental validation is not immediately available [113]. These tools analyze how amino acid changes caused by genetic variants might affect protein structure or function, with some evaluating evolutionary conservation across species to predict whether a substitution is likely to be deleterious. Platforms that integrate computational predictions with multi-level data filtering strategies systematically narrow down variant lists to those most likely clinically relevant [113].
Experimental Validation Techniques
Functional validation provides direct biological evidence for variant pathogenicity through laboratory-based methods. Functional assays are laboratory-based methods designed to validate the biological impact of genetic variants, directly assessing how a variant affects the function of a gene or protein and providing evidence beyond computational predictions or statistical correlations [113]. These assays evaluate processes such as protein stability, enzymatic activity, splicing efficiency, or cellular signaling pathways, with results helping determine whether a variant contributes to disease or is benign.
Cross-laboratory standardization is crucial to ensure consistency and reliability in functional assay results, with participation in external quality assessment (EQA) programs playing a key role in promoting standardized practices and quality assurance [113]. Programs such as those organized by the European Molecular Genetics Quality Network (EMQN) and Genomics Quality Assessment (GenQA) evaluate laboratory performance in running functional assays, ensuring reproducibility and comparability of results across institutions. Adherence to such programs, alongside compliance with international standards like ISO 13485, ensures that functional assay data used in clinical variant interpretation is credible and reliable [113].
Table 2: Methodologies for Clinical Variant Interpretation
| Methodology | Primary Function | Key Resources/Tools |
|---|---|---|
| Data Quality Assessment | Ensure input data integrity | omnomicsQ, ISO 13485 standards |
| Database Utilization | Cross-reference variant information | ClinVar, gnomAD, 1000 Genomes |
| Computational Predictions | Predict variant impact | SIFT, PolyPhen, CADD, REVEL |
| Functional Assays | Experimental validation of biological impact | Splicing assays, enzyme activity tests |
| Clinical Guidelines Application | Standardized variant classification | ACMG-AMP framework, CAP/ASCO guidelines |
Clinical Reporting Standards and Structure
Report Composition and Essential Elements
Clinical reports must present complex genetic information in a standardized, clear, and clinically actionable format. The structure typically includes:
- Test Information: Laboratory details, specimen information, and test methodology
- Clinical Indication: Reason for testing and relevant clinical context
- Results Summary: Clear statement of primary findings and their interpretations
- Detailed Results: Comprehensive variant data with evidence supporting classification
- Clinical Correlations: Genotype-phenotype relationships and inheritance patterns
- References and Limitations: Supporting literature and test limitations
Established clinical guidelines and classification systems are key tools in interpreting genetic variants with consistency and accuracy, with the widely adopted ACMG-AMP framework classifying variants into five categories: pathogenic, likely pathogenic, uncertain significance (VUS), likely benign, and benign [113]. These classifications rely on a structured evaluation of evidence, including population frequency data, computational predictions, functional studies, and genotype-phenotype correlations, helping ensure a standardized approach to variant interpretation across laboratories and clinicians.
In addition to manual interpretation, tools that support automated validation of variant classifications are particularly useful for ensuring compliance with regulatory standards, such as ISO 15189 accreditation [113]. By integrating the ACMG-AMP criteria into their algorithms, they enable faster, more consistent variant evaluations while reducing the risk of human error, supporting scalability in clinical genomics and improving adherence to best practices.
Quantitative Data Presentation in Clinical Reports
Effective presentation of quantitative data in clinical reports requires careful consideration of formatting and organization to enhance clarity and interpretation. Tables should be numbered sequentially with clear, concise titles that explain the table's content without referring to the body text [115]. Headings for columns and rows should be unambiguous, and data should be presented logically—either by size, importance, chronological order, alphabetical order, or geographical distribution [115]. When percentages or averages require comparison, they should be positioned in close proximity within the table structure to facilitate analysis.
For quantitative data derived from variant frequency assessments or functional assay results, frequency distribution tables with appropriate class intervals are often the most effective presentation method. The class intervals between groups should not be too broad or too narrow, as excessively large groups omit important details while overly small intervals defeat the purpose of making data concise [115]. Typically, between 6-16 classes are considered optimal, with equal class intervals maintained throughout the table and clear headings that specify units of measurement (e.g., percent, per thousand, specific units) [115].
Visualization and Workflow Documentation
Clinical Validation Workflow
The clinical validation process follows a structured pathway from sequencing to clinical reporting, with multiple checkpoints for quality assurance. The following diagram illustrates this comprehensive workflow:
Clinical Validation and Reporting Workflow
This workflow highlights the sequential nature of clinical validation while emphasizing the critical evidence integration points that inform variant interpretation. The process ensures systematic analysis with multiple quality checkpoints before final report generation.
Variant Interpretation Evidence Integration
Variant classification requires careful integration of diverse evidence types following established guidelines. The diagram below illustrates the evidence integration process for variant interpretation according to ACMG-AMP guidelines:
Variant Interpretation Evidence Integration
This evidence integration framework demonstrates how different data types contribute to the final variant classification, emphasizing the multidisciplinary nature of clinical variant interpretation.
Research Reagent Solutions for Clinical Validation
Table 3: Essential Research Reagents and Resources for Clinical Validation
| Reagent/Resource Category | Specific Examples | Primary Function in Clinical Validation |
|---|---|---|
| Variant Annotation Tools | Ensembl VEP, Alamut Batch, ANNOVAR | Assign functional information to DNA variants following HGVS nomenclature standards [114] |
| Population Databases | gnomAD, 1000 Genomes Project | Determine variant frequency across populations to assess rarity and disease association [113] |
| Clinical Databases | ClinVar, CIViC, ClinGen | Access curated information on variant-disease associations and clinical significance [113] |
| Computational Prediction Tools | SIFT, PolyPhen-2, CADD, REVEL | Predict deleterious effects of variants on protein function through in silico analysis [113] |
| Functional Assay Platforms | Splicing assays, enzyme activity tests, cellular models | Experimentally validate biological impact of variants on gene/protein function [113] |
| Quality Management Systems | ISO 13485, ISO 15189, CAP/CLIA frameworks | Ensure standardized quality processes for clinical test validation [113] |
Clinical validation and reporting constitute a rigorous, evidence-based process essential for translating genomic discoveries into clinically actionable information. As next-generation sequencing technologies continue to expand our capability to detect genetic variants, robust validation frameworks and standardized reporting practices become increasingly critical for ensuring patient safety and diagnostic accuracy [114]. The field continues to evolve with advancements in computational prediction algorithms, functional assay technologies, and database resources, all contributing to more precise variant interpretation.
Future directions in clinical validation will likely emphasize automated re-evaluation systems that continuously update variant classifications as new evidence emerges, integration of artificial intelligence to enhance pattern recognition in complex genomic data, and development of more sophisticated functional models that better recapitulate human biology [113]. Additionally, international collaboration and data sharing through resources like ClinVar will be essential for building the comprehensive evidence base needed to resolve variants of uncertain significance. By adhering to the best practices outlined in this guide—including rigorous quality control, multidisciplinary evidence integration, standardized reporting, and commitment to continuous improvement—clinical laboratories and researchers can ensure that genomic variant annotation research continues to advance precision medicine while maintaining the highest standards of clinical care.
Conclusion
Genomic variant annotation is a rapidly evolving field that sits at the crossroads of sequencing technology, bioinformatics, and clinical interpretation. A successful annotation strategy requires a solid grasp of foundational concepts, the careful application and optimization of methodological workflows, and a critical eye for troubleshooting and validation. As the community moves forward, the standardization of tools and nomenclature will be paramount for reliable clinical reporting. Future progress will be driven by the integration of multi-omic data, advanced functional assays like SDR-seq, and the increasing use of AI to automate reanalysis and uncover novel disease-associated variants. These advances promise to deepen our understanding of disease biology, reveal new therapeutic targets, and ultimately improve patient diagnosis and care.
References
- 1. Frontiers | Genome-wide functional annotation of variants ... [https://www.frontiersin.org/journals/pharmacology/articles/10.3389/fphar.2025.1474026/full]
- 2. GitHub - amushtaq102/ISMB_ECCB_ 2025 : Genomic ... Variant [https://github.com/amushtaq102/ISMB_ECCB_2025]
- 3. Demystifying the Variant : A Practical Walkthrough... Calling Pipeline [https://www.linkedin.com/pulse/demystifying-variant-calling-pipeline-practical-from-fastq-sohail-scgqe]
- 4. cio-abcd/variantinterpretation: Collaborative Interpretation - Pipeline ... [https://github.com/cio-abcd/variantinterpretation]
- 5. sarek: Usage [https://nf-co.re/sarek/3.5.1/docs/usage/variantcalling/interpretation]
- 6. and Beyond: The Future of 2025 and... Genomic Data Analysis [https://blog.crownbio.com/2025-and-beyond-the-future-of-genomic-data-analysis-and-innovations-in-genomics-services]
- 7. Frontiers | A standards perspective on genomic reusability and... data [https://www.frontiersin.org/journals/bioinformatics/articles/10.3389/fbinf.2025.1572937/full]
- 8. Genetic Variants Made Easy: 5 Types Everyone Should know [https://bitesizebio.com/23996/whats-so-important-about-variants/]
- 9. What are genomic variants and why do they matter? - PacBio [https://www.pacb.com/blog/what-are-genomic-variants-and-why-do-they-matter/]
- 10. VAREANT: a bioinformatics application for gene variant reduction and annotation - PMC [https://pmc.ncbi.nlm.nih.gov/articles/PMC11802749/]
- 11. Annotating non-coding regions of the genome - PubMed [https://pubmed.ncbi.nlm.nih.gov/20628352/]
- 12. AI-Powered Genomic Analysis: Revolutionizing the Detection of... [https://www.news-medical.net/health/AI-Powered-Genomic-Analysis-Revolutionizing-the-Detection-of-Genetic-Mutations.aspx]
- 13. Segtor: Rapid Annotation of Genomic Coordinates and Single... [https://pmc.ncbi.nlm.nih.gov/articles/PMC3206052/]
- 14. of calling pipelines for whole genome sequencing: an... Comparison [https://pmc.ncbi.nlm.nih.gov/articles/PMC9748128/]
- 15. and prioritization with... | Nature Genomic variant annotation Protocols [https://www.nature.com/articles/nprot.2015.105?error=cookies_not_supported]
- 16. and prioritization with ANNOVAR and... Genomic variant annotation [https://pubmed.ncbi.nlm.nih.gov/26379229/]
- 17. and prioritizing human Annotating - non with... coding variants [https://www.nature.com/articles/s41588-023-01365-3?error=cookies_not_supported]
- 18. Functional architecture of low-frequency variants highlights strength of... [https://pubmed.ncbi.nlm.nih.gov/30297966/]
- 19. ShAn: An easy-to-use tool for interactive and integrated variant ... [https://pmc.ncbi.nlm.nih.gov/articles/PMC7340278/]
- 20. Variant Classification: A comparison of Annovar , SNPeff and VEP [https://www.goldenhelix.com/blog/the-sate-of-variant-annotation-a-comparison-of-annovar-snpeff-and-vep/]
- 21. Toward streamline variant classification: discrepancies in variant... [https://humgenomics.biomedcentral.com/articles/10.1186/s40246-025-00778-x]
- 22. ANNOVAR Documentation [http://annovar.openbioinformatics.org/]
- 23. Home - SnpEff & SnpSift [https://pcingola.github.io/SnpEff/]
- 24. Download and install [https://www.ensembl.org/info/docs/tools/vep/script/vep_download.html]
- 25. ANNOVAR: functional annotation of genetic variants from high-throughput sequencing data - PMC [https://pmc.ncbi.nlm.nih.gov/articles/PMC2938201/]
- 26. A program for annotating and predicting the effects of single nucleotide polymorphisms, SnpEff: SNPs in the genome of Drosophila melanogaster strain w1118; iso-2; iso-3 [https://www.ncbi.nlm.nih.gov/pmc/articles/PMC3679285/]
- 27. Bioinformatics Workflows for Genomic Variant Discovery, Interpretation and Prioritization | IntechOpen [https://www.intechopen.com/chapters/67673]
- 28. - ClinVar Commons Database [https://ngdc.cncb.ac.cn/databasecommons/database/id/282]
- 29. and HGMD ClinVar classification accuracy has... genomic variant [https://genomemedicine.biomedcentral.com/articles/10.1186/s13073-023-01199-y]
- 30. (PDF) tmVar 2.0: integrating genomic information from... variant [https://www.academia.edu/128754387/tmVar_2_0_integrating_genomic_variant_information_from_literature_with_dbSNP_and_ClinVar_for_precision_medicine]
- 31. Choice of transcripts and software has a large effect on variant annotation | Genome Medicine | Full Text [https://genomemedicine.biomedcentral.com/articles/10.1186/gm543]
- 32. Central resources of variant discovery and annotation and its role in precision medicine - PMC [https://pmc.ncbi.nlm.nih.gov/articles/PMC10392146/]
- 33. Genome-wide functional annotation of variants: a systematic review of state-of-the-art tools, techniques and resources - PMC [https://pmc.ncbi.nlm.nih.gov/articles/PMC11911558/]
- 34. Functionally annotate | PPTX genomic variants [https://www.slideshare.net/slideshow/functionally-annotate-genomic-variants/8776547]
- 35. Visualizing the genome: techniques for presenting human genome... [https://bmcbioinformatics.biomedcentral.com/articles/10.1186/1471-2105-3-19]
- 36. Text has minimum contrast[proposed] | ACT Rule | WAI | W3C [https://www.w3.org/WAI/standards-guidelines/act/rules/afw4f7/proposed/]
- 37. Choosing color palettes for scientific figures - PMC [https://pmc.ncbi.nlm.nih.gov/articles/PMC7040535/]
- 38. Top R Color Palettes to Know for Great Data Visualization - Datanovia [https://www.datanovia.com/en/blog/top-r-color-palettes-to-know-for-great-data-visualization/]
- 39. An optimized variant process for prioritization ... rare disease [https://pubmed.ncbi.nlm.nih.gov/41121346/]
- 40. Frontiers | Bioinformatic Challenges Detecting Genetic Variation in Precision Medicine Programs [https://www.frontiersin.org/journals/medicine/articles/10.3389/fmed.2022.806696/full]
- 41. An optimized variant process for prioritization ... rare disease [https://genomemedicine.biomedcentral.com/articles/10.1186/s13073-025-01546-1]
- 42. GitHub - exomiser / Exomiser : A Tool to Annotate and Prioritize Exome... — GitHub [https://github.com/exomiser/Exomiser]
- 43. Welcome to the Exomiser documentation! — exomiser ... [https://exomiser.readthedocs.io/]
- 44. User guide - ELIXIR Cloud & AAI Documentation Hub [https://elixir-cloud-aai.github.io/guides/guide-user/]
- 45. Genomics of Rare Disease — 20240325 [https://coursesandconferences.wellcomeconnectingscience.org/event/genomics-of-rare-disease-20240325/]
- 46. High-throughput screening - Wikipedia [https://en.wikipedia.org/wiki/High-throughput_screening]
- 47. Post-translational modification-centric base to assess... editor screens [https://pmc.ncbi.nlm.nih.gov/articles/PMC11804830/]
- 48. SciLifeLab & KNIME Help Labs Asses Raw Data from HTS | KNIME [https://www.knime.com/blog/a-workflow-for-high-throughput-screening-data-analysis-processing-and-hit-identification]
- 49. A novel phenotypic dissimilarity method for image- based ... [https://bmcbioinformatics.biomedcentral.com/articles/10.1186/1471-2105-14-336]
- 50. Boosting GPT models for genomics analysis: generating trusted... [https://pubmed.ncbi.nlm.nih.gov/39981108/]
- 51. Functional phenotyping of genomic variants using joint multiomic... [https://pubmed.ncbi.nlm.nih.gov/40890552/]
- 52. Functional phenotyping of genomic variants using... | Nature Methods [https://www.nature.com/articles/s41592-025-02805-0?error=cookies_not_supported&code=81797c14-1dec-4552-baab-193b6a3854a7]
- 53. Multi-omics Data Integration, Interpretation, and Its Application - PMC [https://pmc.ncbi.nlm.nih.gov/articles/PMC7003173/]
- 54. Multiomic single - cell DNA–RNA sequencing... | RNA- Seq Blog [https://www.rna-seqblog.com/multiomic-single-cell-dna-rna-sequencing-functional-phenotyping-of-genomic-variants-using/]
- 55. Guidance for Multi-Omics and Multi-Modal Data Integration and Analysis on AWS [https://aws.amazon.com/solutions/guidance/multi-omics-and-multi-modal-data-integration-and-analysis/]
- 56. $$\Phi$$ -Space: continuous phenotyping of single - cell - multi ... omics [https://genomebiology.biomedcentral.com/articles/10.1186/s13059-025-03755-8]
- 57. (VA) – GA4GH Variant Annotation [https://www.ga4gh.org/product/variant-annotation/]
- 58. Capturing phenotypes for precision medicine - PMC [https://www.ncbi.nlm.nih.gov/pmc/articles/PMC4850887/]
- 59. Computational Resources for the Interpretation of Variations in Cancer | SpringerLink [https://link.springer.com/chapter/10.1007/978-3-030-91836-1_10]
- 60. AI-Driven Variant for Precision Annotation in Breast Cancer Oncology [https://pubmed.ncbi.nlm.nih.gov/41127930/]
- 61. Machine learning-based prediction of antimicrobial resistance and... [https://bmcgenomdata.biomedcentral.com/articles/10.1186/s12863-025-01338-x]
- 62. Tackling antimicrobial resistance, one genome at a time [https://www.illumina.com/company/news-center/feature-articles/tackling-antimicrobial-resistance--one-genome-at-a-time.html]
- 63. Genomic Variant Annotation: A Comprehensive Review of Tools and Techniques | SpringerLink [https://link.springer.com/chapter/10.1007/978-3-030-96308-8_98]
- 64. Toward Automatic Variant Interpretation... | Research Square [https://www.researchsquare.com/article/rs-5886884/v1]
- 65. Recommendations for interpreting the loss of function... [https://pubmed.ncbi.nlm.nih.gov/30192042/]
- 66. Criteria Specification Registry [https://cspec.genome.network/cspec/ui/svi/doc/GN092?version=1.1.0]
- 67. Genomic variant annotation and prioritization with ANNOVAR and wANNOVAR | Nature Protocols [https://www.nature.com/articles/nprot.2015.105]
- 68. InterVar and Varsome discrepancies in ACMG classification [https://www.biostars.org/p/380088/]
- 69. Discriminating somatic and germline mutations in tumor DNA samples... [https://pmc.ncbi.nlm.nih.gov/articles/PMC4561496/]
- 70. Somatic calling is NOT simply a difference between two callsets – GATK [https://gatk.broadinstitute.org/hc/en-us/articles/360035890491-Somatic-calling-is-NOT-simply-a-difference-between-two-callsets]
- 71. A simple consensus approach improves somatic mutation prediction... [https://genomemedicine.biomedcentral.com/articles/10.1186/gm494]
- 72. Bioinformatics Pipeline: DNA-Seq Analysis: Whole Exome and Targeted Sequencing Analysis Pipeline - GDC Docs [https://docs.gdc.cancer.gov/Data/Bioinformatics_Pipelines/DNA_Seq_Variant_Calling_Pipeline/]
- 73. Hands-on: Identification of somatic and germline from tumor... variants [https://training.galaxyproject.org/training-material/topics/variant-analysis/tutorials/somatic-variants/tutorial.html]
- 74. Variant calling and quality filters [https://docs.varsome.com/en/variant-calling-and-quality-filters]
- 75. of Comparison and germline structural somatic in cancers... variants [https://pmc.ncbi.nlm.nih.gov/articles/PMC10723258/]
- 76. Achieving the highest diagnostic yield possible with phenotype-based prioritization of variants [https://blog.congenica.com/phenotype-based-prioritization-of-variants-with-exomiser]
- 77. Table – User Support Variant Annotation [https://support.researchallofus.org/hc/en-us/articles/4615256690836-Variant-Annotation-Table]
- 78. Multi-dimensional annotation of porcine variants using genomic and... [https://bmcbiol.biomedcentral.com/articles/10.1186/s12915-025-02279-8]
- 79. and clinical utility of whole exome sequencing using... Diagnostic yield [https://pubmed.ncbi.nlm.nih.gov/32901917/]
- 80. Solving patients with rare diseases through programmatic reanalysis ... [https://www.nature.com/articles/s41431-021-00852-7?error=cookies_not_supported&code=effcbb55-fea6-4d28-a6b5-697887d321a4]
- 81. of Reanalysis Sequencing Results in a Clinical Laboratory... Genomic [https://pmc.ncbi.nlm.nih.gov/articles/PMC7338758/]
- 82. Ending diagnostic odyssey by reanalysis of whole exome sequencing... [https://ojrd.biomedcentral.com/articles/10.1186/s13023-025-03928-5]
- 83. ANNOVAR: functional annotation of genetic variants from... [https://pubmed.ncbi.nlm.nih.gov/20601685/]
- 84. and prioritization with... | Nature Genomic variant annotation Protocols [https://www.nature.com/articles/nprot.2015.105?error=cookies_not_supported&code=016c1e8d-7eab-49b0-bbbd-c0daa9a7e195]
- 85. Frontiers | A scalable tool for analyzing of humans... genomic variants [https://www.frontiersin.org/journals/big-data/articles/10.3389/fdata.2024.1466391/full]
- 86. Automation in Genomics Workflows | How Labs Improve Precision, Efficiency, and Scale | Lab Manager [https://www.labmanager.com/automation-in-genomics-workflows-driving-precision-efficiency-and-scale-34446]
- 87. How Artificial Intelligence Could Automate Genomics Research [https://today.ucsd.edu/story/how-artificial-intelligence-could-automate-genomics-research]
- 88. Fully automated genomics workflows - Automata [https://automata.tech/applications/genomics/]
- 89. Analysis | Variant and analysis software solutions Variant annotation [https://www.illumina.com/informatics/biological-interpretation/variant-analysis.html]
- 90. Ten simple rules to colorize biological data visualization - PMC [https://ncbi.nlm.nih.gov/pmc/articles/PMC7561171]
- 91. Ten simple rules for developing visualization tools in genomics - PMC [https://pmc.ncbi.nlm.nih.gov/articles/PMC9648702/]
- 92. Calling Benchmarking - Wong et al., Variant Tools 2025 [https://news.varsome.com/en/benchmarking-variant-calling-tools]
- 93. Review on the Computational Genome Annotation of Sequences Obtained by Next-Generation Sequencing - PMC [https://pmc.ncbi.nlm.nih.gov/articles/PMC7565776/]
- 94. Systematic assessment of structural variant for... annotation tools [https://pmc.ncbi.nlm.nih.gov/articles/PMC11632063/]
- 95. Quality Annotation : Measuring Labeling Metrics | Keylabs Accuracy [https://keylabs.ai/blog/annotation-quality-metrics-measuring-labeling-accuracy/]
- 96. Why Precision, Recall, & Accuracy Are Key Annotation Quality Metrics [https://www.cvat.ai/resources/blog/precision-recall-accuracy-annotation-quality-metrics]
- 97. PacBio whole genome sequencing Benchmarking pipeline... variant [https://aws.amazon.com/blogs/publicsector/benchmarking-pacbio-whole-genome-sequencing-variant-pipeline-analysis-with-aws-healthomics-workflows/]
- 98. SDFA: a standardized decomposition format and toolkit for efficient... [https://genomebiology.biomedcentral.com/articles/10.1186/s13059-025-03730-3]
- 99. A side-by-side comparison of variant function measurements using... [https://pubmed.ncbi.nlm.nih.gov/40744495/]
- 100. A side-by-side comparison of variant function measurements using deep mutational scanning and base editing - PMC [https://pmc.ncbi.nlm.nih.gov/articles/PMC11244880/]
- 101. /Cas-Mediated CRISPR : Technical Considerations and... Base Editing [https://pubmed.ncbi.nlm.nih.gov/30995964/]
- 102. CRISPR-Cas9 DNA Base-Editing and Prime-Editing - PMC [https://pmc.ncbi.nlm.nih.gov/articles/PMC7503568/]
- 103. News: Explainer: What Are Base Editors and How Do They Work? - CRISPR Medicine [https://crisprmedicinenews.com/news/explainer-what-are-base-editors-and-how-do-they-work/]
- 104. Variant Library Annotation Tool (VaLiAnT): an oligonucleotide library design and annotation tool for saturation genome editing and other deep mutational scanning experiments - PMC [https://pmc.ncbi.nlm.nih.gov/articles/PMC8796380/]
- 105. and Functional Prediction: SnpEff | SpringerLink Variant Annotation [https://link.springer.com/protocol/10.1007/978-1-0716-2293-3_19]
- 106. Innovative strategies for annotating the “relationSNP” between variants and molecular phenotypes | BioData Mining | Full Text [https://biodatamining.biomedcentral.com/articles/10.1186/s13040-019-0197-9]
- 107. Using structural to investigate the impact of non... bioinformatics [https://link.springer.com/article/10.1186/1471-2105-10-S8-S9]
- 108. The role of structural bioinformatics resources in the era of integrative structural biology - PMC [https://pmc.ncbi.nlm.nih.gov/articles/PMC3640467/]
- 109. Genome bioinformatic analysis of nonsynonymous SNPs - PMC [https://pmc.ncbi.nlm.nih.gov/articles/PMC1978506/]
- 110. Structural Bioinformatics: exciting times in a rapidly evolving field - PMC [https://pmc.ncbi.nlm.nih.gov/articles/PMC11788741/]
- 111. SNPdbe: constructing an nsSNP functional impacts database - PMC [https://pmc.ncbi.nlm.nih.gov/articles/PMC3278761/]
- 112. Genomics-based tools for drug discovery and development: From network maps to efficacy prediction - ScienceDirect [https://www.sciencedirect.com/science/article/pii/S2707368823001061]
- 113. A Practical Guide to Clinical Interpretation - Euformatics Variant [https://www.euformatics.com/blog-post/a-practical-guide-to-clinical-variant-interpretation]
- 114. A performance evaluation study: Variant tools - the enigma... annotation [https://pmc.ncbi.nlm.nih.gov/articles/PMC9577137/]
- 115. Presentation of Quantitative Data | PSM Made Easy [https://ihatepsm.com/blog/presentation-quantitative-data]