Machine Learning for Cancer Classification: A Comparative Review of Algorithms, Applications, and Clinical Translation
This article provides a comprehensive analysis of machine learning (ML) and deep learning (DL) algorithms for cancer classification, tailored for researchers and drug development professionals.
Machine Learning for Cancer Classification: A Comparative Review of Algorithms, Applications, and Clinical Translation
Abstract
This article provides a comprehensive analysis of machine learning (ML) and deep learning (DL) algorithms for cancer classification, tailored for researchers and drug development professionals. We explore the foundational principles driving the adoption of AI in oncology, detail a wide array of methodological approaches from ensemble systems to multiomics integration, and address critical troubleshooting and optimization challenges such as high-dimensional data and model interpretability. The scope culminates in a rigorous validation and comparative analysis of algorithm performance, synthesizing current evidence to guide model selection and benchmark future innovations in precision medicine.
The Rise of AI in Oncology: Core Concepts and Data Types for Cancer Classification
Cancer remains one of the foremost causes of mortality worldwide, with early and accurate diagnosis being a critical determinant of patient outcomes [1]. The complex, multidimensional nature of cancer data—spanning genomics, transcriptomics, imaging, and clinical records—presents analytical challenges that transcend the capabilities of traditional statistical methods. Machine learning (ML), particularly its subset deep learning (DL), is emerging as a transformative force in cancer diagnostics by detecting subtle patterns within large, heterogeneous datasets that often elude human perception [2] [3]. This guide provides a comparative analysis of ML algorithms used in cancer classification, detailing their performance, experimental protocols, and the essential tools driving this diagnostic revolution.
Comparative Performance of Machine Learning Algorithms in Cancer Diagnostics
The selection of an appropriate ML algorithm is pivotal to the success of a diagnostic model. Performance varies significantly based on the cancer type, data modality, and specific diagnostic task. The following table synthesizes quantitative results from recent studies to facilitate comparison.
Table 1: Comparative Performance of ML Algorithms Across Cancer Types
| Cancer Type | Algorithm | Accuracy | AUC | Key Data Modality | Source (Year) |
|---|---|---|---|---|---|
| Multiple Cancers(5 common types in Saudi Arabia) | Stacking Ensemble (SVM, KNN, ANN, CNN, RF) | 98% | N/R | Multiomics (RNA-seq, Methylation, Somatic Mutation) | [4] (2025) |
| Brain Tumor | Random Forest | 87% | N/R | MRI-based Radiomic Features | [5] (2025) |
| Brain Tumor | Simple CNN | 70% | N/R | MRI | [5] (2025) |
| Brain Tumor | VGG16, VGG19, ResNet50 | 47-66% | N/R | MRI | [5] (2025) |
| Skin Cancer | CNN | 92.5% | N/R | Dermoscopic Images | [6] (2025) |
| Skin Cancer | Vision Transformer (ViT) & EfficientNet Ensemble | 95.05% | N/R | Dermoscopic Images | [7] (2025) |
| Skin Cancer | Support Vector Machine (SVM) | <92.5% | N/R | Dermoscopic Images | [6] (2025) |
| Skin Cancer | Random Forest | <92.5% | N/R | Dermoscopic Images | [6] (2025) |
| Breast Cancer | SGA-RF (with feature selection) | 99.01% | N/R | Gene Expression | [8] (2025) |
| Breast Cancer | Random Forest (NK cell gene signature) | High (Best among 12 models) | High | Gene Expression (Transcriptomic) | [9] (2025) |
| Breast Cancer | Logistic Regression, SVM, KNN | <99.01% | N/R | Gene Expression | [8] (2025) |
| Microarray-based Cancer Classification | Support Vector Machine (SVM) | N/R | 0.787 | Gene Expression (Microarray) | [10] (2008) |
| Microarray-based Cancer Classification | Random Forest | N/R | 0.759 | Gene Expression (Microarray) | [10] (2008) |
Key Insights from Comparative Data:
- Ensemble Methods Dominate: Stacking multiple models or using sophisticated ensembles like ViT with CNNs consistently achieves top-tier performance (95-98% accuracy) by leveraging the strengths of individual algorithms [4] [7].
- Data Modality Dictates Optimal Algorithm: For complex image data (e.g., dermatology, radiology), deep learning models like CNNs and Vision Transformers excel [7] [6]. For structured, high-dimensional data like gene expression, tree-based ensembles like Random Forest can be superior, especially when paired with robust feature selection [5] [9] [8].
- The Random Forest Paradox: While Random Forest can outperform complex deep learning models in specific contexts (e.g., brain tumor classification from radiomic features) [5], it is generally outperformed by SVMs on microarray gene expression data [10] and by CNNs on raw image data [6].
Experimental Protocols and Methodologies
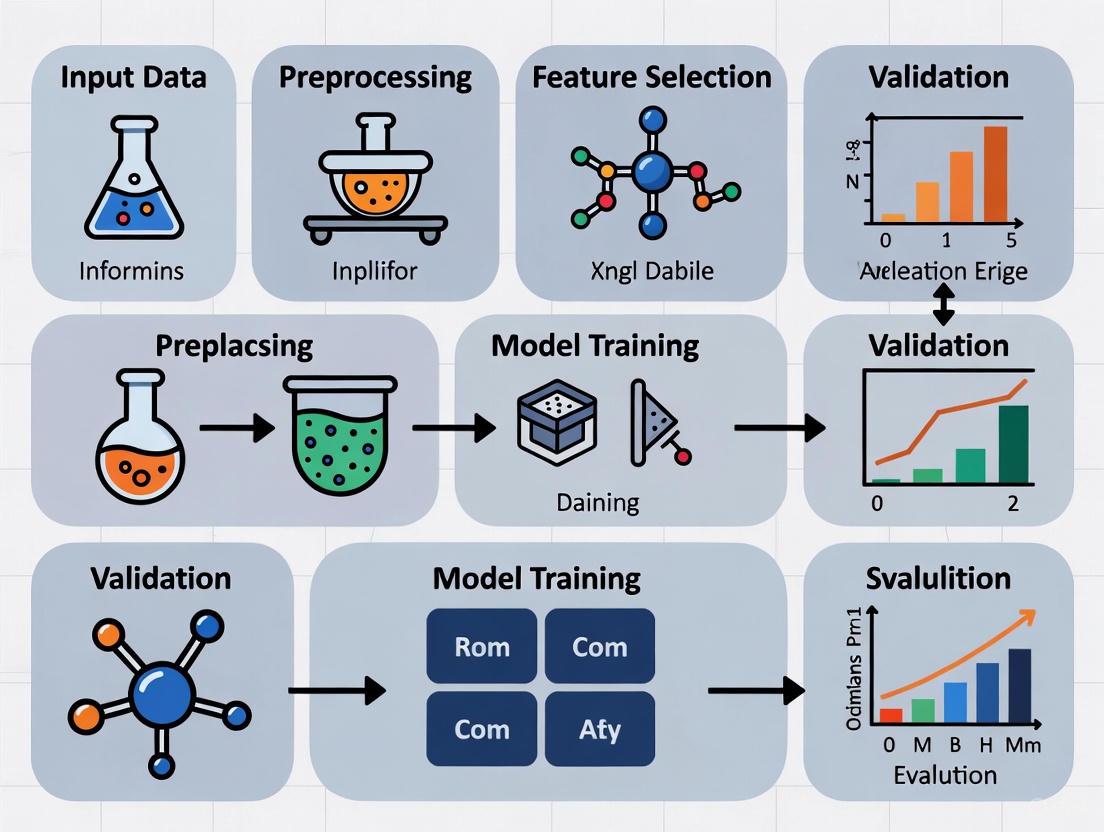
Understanding the experimental workflow is essential for evaluating and replicating ML diagnostics research. The following diagram and description outline a standard pipeline.
Figure 1: A generalized workflow for developing machine learning models in cancer diagnostics.
Detailed Protocol Breakdown
Data Acquisition and Preprocessing
The first phase involves gathering and curating high-quality datasets, which form the foundation of any robust ML model.
- Data Sources: Publicly accessible repositories like The Cancer Genome Atlas (TCGA) and Gene Expression Omnibus (GEO) are primary sources for genomic and transcriptomic data [4] [9]. For imaging, datasets such as BraTS (for brain tumors) and ISIC (for skin lesions) are widely used [7] [5].
- Preprocessing Steps:
- Genomic/Transcriptomic Data: Normalization is critical. For RNA sequencing data, methods like Transcripts Per Million (TPM) are used to eliminate technical variation and bias. The formula is:
TPM = (Reads Mapped to Transcript / Transcript Length) / (Sum of (Reads Mapped / Transcript Length)) * 10^6[4]. - Image Data: Preprocessing often involves resizing, noise reduction, and contrast enhancement techniques like Contrast Limited Adaptive Histogram Equalization (CLAHE) [5].
- Handling Data Imperfections: Addressing class imbalance is achieved through techniques like the Synthetic Minority Oversampling Technique (SMOTE) or downsampling [4].
- Genomic/Transcriptomic Data: Normalization is critical. For RNA sequencing data, methods like Transcripts Per Million (TPM) are used to eliminate technical variation and bias. The formula is:
Feature Engineering and Selection
This step reduces data dimensionality and highlights the most informative variables.
- Feature Extraction: For image data, CNNs automatically learn relevant features [6]. For genomic data, autoencoders (a type of neural network) can be used to compress high-dimensional input into a lower-dimensional, meaningful representation [4].
- Feature Selection: Algorithms like the Boruta algorithm [9] or nature-inspired optimizers like the Seagull Optimization Algorithm (SGA) [8] systematically explore the feature space to identify the most informative genes or biomarkers, reducing overfitting and computational cost.
Model Training, Validation, and Evaluation
The core of the experimental protocol involves building and assessing the model.
- Training with Cross-Validation: Models are typically trained using k-fold cross-validation (e.g., 10-fold) to ensure that performance is not dependent on a particular split of the data [9].
- Algorithm Selection: A diverse set of algorithms is often compared. These can range from traditional models like Support Vector Machines (SVM) and Random Forests (RF) to advanced deep learning architectures like Vision Transformers (ViT) and Convolutional Neural Networks (CNNs) [4] [7] [5].
- Performance Metrics: Models are evaluated based on a suite of metrics, including Accuracy, Area Under the Curve (AUC), Sensitivity, Specificity, and F1-Score [10] [9].
Successful development of ML diagnostics requires a suite of data, software, and computational tools.
Table 2: Key Research Reagent Solutions for ML in Cancer Diagnostics
| Tool Category | Specific Examples | Function and Application |
|---|---|---|
| Public Data Repositories | The Cancer Genome Atlas (TCGA), Gene Expression Omnibus (GEO) | Provide large-scale, well-annotated genomic, transcriptomic, and clinical data for model training and validation. Essential for developing molecular diagnostic models [4] [9]. |
| Medical Image Datasets | ISIC (Skin Cancer), BraTS (Brain Tumors) | Curated collections of medical images (dermoscopy, MRI) that serve as benchmarks for developing and testing image-based DL models [7] [5]. |
| Feature Selection Algorithms | Seagull Optimization Algorithm (SGA), Boruta Algorithm | Identify the most predictive biomarkers from thousands of genes, improving model accuracy and interpretability while reducing complexity [9] [8]. |
| Ensemble & Advanced DL Models | Stacking Ensemble (SVM, KNN, ANN, CNN, RF), Vision Transformer (ViT) | Combine the predictive power of multiple base models or use attention mechanisms to achieve state-of-the-art classification accuracy [4] [7]. |
| High-Performance Computing | Aziz Supercomputer, GPUs (Graphics Processing Units) | Provide the massive computational power required for training complex models, especially deep learning networks on large datasets [4] [1]. |
Advanced Architectures: Inside the Vision Transformer for Cancer Imaging
Vision Transformer (ViT) architecture has shown remarkable success in medical image analysis. The following diagram illustrates how its attention mechanism functions as a performance booster.
Figure 2: Vision Transformer workflow for multi-scale skin cancer analysis.
This innovative approach leverages the self-attention mechanism of Transformers to highlight diagnostically relevant regions in an image [7]. By generating attention maps, the model identifies and isolates critical areas, such as specific patterns within a skin lesion. These regions are then cropped and analyzed at a higher resolution alongside the original full image. This multi-scale analysis allows the model to capture both the broader context and fine-grained details, significantly boosting diagnostic accuracy. The final prediction is often made by an ensemble of different models (e.g., ViT and various EfficientNet versions) using a majority voting system, which enhances robustness and reliability [7].
The integration of machine learning into cancer diagnostics is no longer a speculative future but an active and transformative frontier. As the comparative data shows, there is no single "best" algorithm; the optimal choice is dictated by the specific clinical question, the nature of the available data, and the diagnostic task at hand. Ensemble methods and advanced deep learning architectures are pushing the boundaries of classification accuracy, enabling a level of precision that was previously unattainable. While challenges remain—including model interpretability, data standardization, and integration into clinical workflows—the continued development of sophisticated computational tools and expansive biological datasets promises to further solidify ML's role as an indispensable ally in the fight against cancer. For researchers and drug development professionals, mastering these tools and methodologies is becoming imperative to drive the next wave of innovations in precision oncology.
The application of artificial intelligence (AI) in biomedical research has revolutionized approaches to complex challenges, particularly in cancer classification. As high-throughput technologies generate vast amounts of molecular and clinical data, researchers require sophisticated computational methods to extract meaningful patterns. Three fundamental AI concepts—neural networks (NNs), deep learning (DL), and ensemble methods—form the cornerstone of modern computational biology approaches in oncology. This guide provides a comprehensive comparison of these methodologies, their experimental protocols, and their performance in cancer type classification, offering researchers a framework for selecting appropriate algorithms for their specific biomedical applications.
Core Terminology and Definitions
Neural Networks (NNs)
Neural Networks are computational models inspired by the human brain's network of neurons. The smallest unit of a neural network is an artificial neuron (or perceptron), which receives input, processes it through a weighted sum plus a bias term, and passes the result through an activation function to determine output [11] [12]. These neurons are organized into interconnected layers: an input layer that accepts raw data, one or more hidden layers that transform the data, and an output layer that produces the final prediction [12] [13]. In biomedical contexts, NNs excel at identifying complex, non-linear relationships in diverse data types, from genomic sequences to histological images [11] [14].
Deep Learning (DL)
Deep Learning refers to neural networks with multiple hidden layers (making them "deep") that can automatically learn hierarchical representations of data [12]. Unlike traditional machine learning that requires manual feature engineering, DL models learn relevant features directly from raw data through training [13]. The "deep" architecture enables these models to capture increasingly abstract patterns—from simple edges in early layers to complex structures in later layers—making them particularly powerful for analyzing biomedical images, genomic sequences, and other complex biomedical data [12] [13]. Convolutional Neural Networks (CNNs), a specialized DL architecture, have revolutionized image analysis in biomedicine through their use of small kernels that scan across input data to detect spatially local patterns [12].
Ensemble Methods
Ensemble Methods combine multiple machine learning models (called "base learners" or "weak learners") to obtain better predictive performance than could be obtained from any constituent model alone [15]. The fundamental principle is that a collection of models working together can compensate for individual biases and errors, resulting in more robust and accurate predictions [15] [16]. These methods are particularly valuable in biomedical applications where data complexity, heterogeneity, and noise can challenge individual models. The three main ensemble paradigms are:
- Bagging (Bootstrap Aggregating): Trains multiple models in parallel on different random subsets of the training data and combines their predictions through voting or averaging [15] [16].
- Boosting: Trains models sequentially, with each new model focusing on correcting errors made by previous models [15] [16].
- Stacking: Combines predictions from multiple different types of models using a meta-model that learns how to best integrate their outputs [15] [4].
Experimental Protocols in Cancer Classification
Deep Learning Protocol: The GraphVar Framework
The GraphVar framework exemplifies a sophisticated DL approach for multicancer classification using somatic mutation data [17].
Data Preparation:
- Data Source: Somatic variant data from The Cancer Genome Atlas (TCGA) encompassing 10,112 patient samples across 33 cancer types.
- Data Curation: Removal of duplicate patient entries followed by stratified partitioning into training (70%), validation (10%), and test sets (20%) to preserve proportional cancer type representation.
Multi-Representation Feature Engineering:
- Variant Map Construction: Genes harboring variants were organized into an N×N matrix based on genomic loci. Different variant types (SNPs, insertions, deletions) were encoded as different color channels (blue, green, red) with pixel intensities representing variant categories [17].
- Numeric Feature Extraction: A 36-dimensional feature matrix capturing population allele frequencies and six predefined somatic variant spectra was constructed for each sample.
Model Architecture and Training:
- Dual-Stream Network: Employed a ResNet-18 backbone (pretrained on ImageNet) to extract spatial features from variant images and a Transformer encoder to capture patterns in numeric features [17].
- Feature Fusion: Extracted features from both streams were concatenated into a comprehensive feature vector and passed to a fully connected classification head.
- Implementation: Python 3.10 with PyTorch 2.2.1; training leveraged cross-entropy loss with Adam optimizer and early stopping based on validation performance.
Ensemble Method Protocol: Performance-Weighted Voting
This ensemble approach demonstrates how combining multiple classifiers improves cancer type prediction [18].
Data Preparation:
- Data Source: TCGA somatic mutation data from 6,249 samples across 14 cancer types.
- Feature Engineering: Mutation count per gene served as input features for all classifiers.
Base Classifier Training:
- Model Selection: Five diverse classifiers were implemented: Logistic Regression (LR), Support Vector Machine (SVM), Random Forest (RF), XGBoost, and Multilayer Perceptron Neural Networks (MLP-NN) [18].
- Cross-Validation: Each classifier underwent cross-validation to obtain predicted probabilities and assess individual performance.
Ensemble Construction:
- Weight Optimization: Classifier weights were determined based on predictive performance by solving linear regression functions, assigning higher weights to better-performing models [18].
- Weighted Voting: Final prediction probability was computed as the summation of each classifier's weight multiplied by its predicted probability.
- Comparison Models: Performance was compared against hard-voting (equal weights, majority vote) and soft-voting (equal weights, probability average) ensembles.
Stacked Deep Learning Ensemble for Multiomics Data
This protocol integrates multiple data types using a stacking ensemble architecture [4].
Data Collection and Preprocessing:
- Multiomics Data: RNA sequencing data from TCGA; somatic mutation and DNA methylation data from LinkedOmics.
- Normalization: RNA sequencing data normalized using transcripts per million (TPM) method to eliminate technical variation.
- Feature Extraction: Autoencoders with five dense layers (500 nodes each, ReLU activation, dropout 0.3) reduced dimensionality while preserving biological properties.
Ensemble Architecture:
- Base Models: Five diverse algorithms: Support Vector Machine, k-Nearest Neighbors, Artificial Neural Network, Convolutional Neural Network, and Random Forest [4].
- Stacking Framework: Predictions from base models served as input features to a meta-model that learned optimal combination weights.
- Class Imbalance Handling: Addressed through downsampling and Synthetic Minority Oversampling Technique (SMOTE).
Performance Comparison in Cancer Classification
Table 1: Comparative Performance of AI Approaches in Cancer Classification
| Model | Cancer Types | Accuracy | Data Modality | Sample Size |
|---|---|---|---|---|
| GraphVar (DL) [17] | 33 | 99.82% | Somatic mutations | 10,112 |
| Stacked Ensemble [4] | 5 | 98% | Multiomics (RNA-seq, methylation, mutations) | 3,980 |
| Performance-Weighted Voting [18] | 14 | 71.46% | Somatic mutations | 6,249 |
| CPEM (DL) [17] | 31 | 84% | Somatic alterations | Not specified |
| MuAt (DL) [17] | 24 | 89% | Simple & complex somatic alterations | Not specified |
Table 2: Strengths and Limitations of AI Approaches in Biomedical Research
| Approach | Strengths | Limitations | Ideal Use Cases |
|---|---|---|---|
| Deep Learning | Automatic feature extraction; Handles raw, unstructured data; State-of-the-art accuracy with sufficient data [17] [13] | High computational requirements; Need for large datasets; "Black box" interpretability challenges [13] | Image-based diagnostics; Genomic sequence analysis; Multi-representation data integration |
| Ensemble Methods | Robust to noise and outliers; Reduces overfitting; Works well with diverse feature types; Often more interpretable [15] [16] [18] | Increased computational complexity; Model management overhead; Performance gains diminish beyond optimal ensemble size [15] | Multiomics integration; Modest dataset sizes; Heterogeneous data sources |
| Neural Networks | Captures complex nonlinear relationships; Flexible architecture designs; Good performance on diverse data types [11] [12] | Prone to overfitting with small datasets; Requires careful parameter tuning; May struggle with very high-dimensional data [11] | Traditional biomarker analysis; Structured biomedical data; Moderate-dimensional feature sets |
The Scientist's Toolkit: Research Reagent Solutions
Table 3: Essential Computational Tools for AI-Based Cancer Research
| Resource | Function | Application Context |
|---|---|---|
| PyTorch [17] [12] | Deep learning framework with GPU acceleration | Implementing custom neural network architectures; Transfer learning |
| TensorFlow [11] [12] | End-to-end machine learning platform | Production-grade model deployment; TensorBoard visualization |
| scikit-learn [11] [16] | Machine learning library for classical algorithms | Preprocessing; Traditional ML models; Ensemble implementations |
| TCGA Data Portal [17] [4] | Repository of cancer genomic and clinical data | Accessing standardized multiomics datasets for model training |
| LinkedOmics [4] | Multiomics data resource from TCGA and CPTAC | Integrating across genomic, proteomic, and clinical dimensions |
| Google Cloud Platform [12] | Cloud computing with pre-configured AI services | Scalable training of large models; Collaborative research environments |
| Autoencoder Networks [4] | Dimensionality reduction while preserving biological properties | Handling high-dimensional omics data; Feature extraction |
The comparison of AI methodologies for cancer classification reveals a complex landscape where each approach offers distinct advantages. Deep learning architectures, particularly multi-representation frameworks like GraphVar, achieve remarkable accuracy by automatically learning discriminative patterns from raw data. Ensemble methods provide robust performance gains through strategic model combination, especially valuable when integrating diverse data modalities or working with smaller sample sizes. Neural networks serve as the foundational technology enabling both approaches, with their ability to model complex, non-linear relationships in biomedical data. The selection of an appropriate methodology depends on multiple factors including data volume and complexity, computational resources, and interpretability requirements. Future directions point toward hybrid approaches that leverage the strengths of each paradigm, ultimately accelerating precision oncology through more accurate and biologically interpretable classification systems.
Machine learning (ML) and deep learning (DL) are revolutionizing oncology by providing powerful tools for cancer classification, risk assessment, and treatment personalization. These technologies excel at identifying complex patterns within high-dimensional biological data, enabling advancements that traditional statistical methods cannot achieve. By integrating diverse data types—from genomic sequences and epigenetic markers to medical imagery and lifestyle factors—ML algorithms are accelerating the transition toward precision oncology. This paradigm shift allows researchers and clinicians to move beyond one-size-fits-all approaches, instead leveraging computational models that account for the unique molecular and clinical characteristics of individual patients and their cancers. This guide objectively compares the performance of various machine learning approaches across key applications in cancer research, providing researchers and drug development professionals with validated experimental data and methodologies to inform their work.
Performance Comparison of ML Approaches in Oncology
The table below summarizes quantitative performance data for various machine learning approaches across different cancer research applications, based on recent experimental findings.
Table 1: Performance Comparison of Machine Learning Models in Cancer Applications
| Application Area | Best-Performing Model(s) | Reported Accuracy | Data Types Used | Cancer Types Studied | Reference |
|---|---|---|---|---|---|
| Multi-Omics Cancer Classification | Stacking Ensemble (SVM, KNN, ANN, CNN, RF) | 98% | RNA sequencing, DNA methylation, Somatic mutations | Breast, Colorectal, Thyroid, Non-Hodgkin Lymphoma, Corpus Uteri | [4] |
| Multicancer Classification from Genomic Data | GraphVar (ResNet-18 + Transformer) | 99.82% | Somatic mutation profiles (MAF files) | 33 cancer types from TCGA | [17] |
| Cancer Risk Prediction | Categorical Boosting (CatBoost) | 98.75% | Lifestyle factors, Genetic risk, Clinical parameters | Structured patient records | [19] |
| Brain Tumor Classification from MRI | Random Forest | 87% | MRI scans (T1c, T2w, FLAIR) | Brain tumors (BraTS 2024 dataset) | [5] |
| Pan-Cancer & Subtype Classification | XGBoost, SVM, Random Forest, DeepCC | Varies by cancer type | mRNA, miRNA, Methylation, Copy Number Variation | 32 TCGA cancer types, including BRCA, COAD, GBM, LGG, OV | [20] [21] |
Detailed Experimental Protocols and Methodologies
Multi-Omics Integration with Stacking Ensemble Learning
A 2025 study developed a stacking ensemble model to classify five common cancer types in Saudi Arabia by integrating three omics data types. The methodology involved a rigorous two-stage process to ensure robust performance [4].
Data Preprocessing Pipeline:
- Data Source: RNA sequencing data from The Cancer Genome Atlas (TCGA) and somatic mutation/methylation data from LinkedOmics.
- Normalization: Transcripts per million (TPM) normalization for RNA-seq data to eliminate technical bias.
- Feature Extraction: Autoencoder technique with five dense layers (500 nodes each, ReLU activation) and 0.3 dropout to reduce high-dimensional data while preserving biological properties.
- Class Imbalance Handling: Downsampling and Synthetic Minority Oversampling Technique (SMOTE) to address unequal class distribution.
Ensemble Architecture: The stacking model integrated five base learners:
- Support Vector Machine (SVM)
- k-Nearest Neighbors (KNN)
- Artificial Neural Network (ANN)
- Convolutional Neural Network (CNN)
- Random Forest (RF)
These models were combined using a deep learning-based meta-learner that learned to optimally weight predictions from the base models. The experiment was implemented in Python 3.10 on the Aziz Supercomputer, demonstrating the computational requirements for such integrative analyses [4].
Key Finding: Multiomics integration (98% accuracy) significantly outperformed single-omics approaches (RNA sequencing and methylation individually achieved 96%, while somatic mutations alone reached 81%), highlighting the value of combining complementary data types [4].
GraphVar Framework for Multicancer Classification
The GraphVar framework, introduced in a 2025 study, represents a novel approach to multicancer classification by integrating multiple representations of genomic data [17].
Data Preparation:
- Cohort: 10,112 patient samples across 33 cancer types from TCGA.
- Data Curation: Rigorous multi-step pipeline removing duplicate patient entries with stratified sampling (70% training, 10% validation, 20% testing).
- Input Representations:
- Variant Maps: Spatial representation with gene-level variant categories encoded as pixel intensities (SNPs=blue, insertions=green, deletions=red).
- Numeric Feature Matrix: 36-dimensional matrix capturing population allele frequencies and six predefined somatic variant spectra.
Model Architecture:
- Dual-Stream Design:
- ResNet-18 Backbone: Processes variant maps to extract spatial features and visual patterns.
- Transformer Encoder: Models contextual relationships within numeric feature matrices.
- Fusion Module: Concatenates features from both streams for final classification.
- Interpretability: Gradient-weighted class activation mapping (Grad-CAM) localizes influential genomic regions, while KEGG pathway enrichment validates biological relevance.
Performance: The framework achieved exceptional performance (99.82% accuracy) by leveraging complementary data representations, demonstrating how specialized architectures can exploit different aspects of genomic information [17].
GraphVar Multi-Representation Framework for Cancer Classification
Traditional vs. Deep Learning for Medical Imaging
A 2025 comparative analysis on the BraTS 2024 dataset revealed surprising performance patterns between traditional and deep learning approaches for brain tumor classification [5].
Experimental Setup:
- Dataset: BraTS 2024 MRI dataset (T1c, T2w, FLAIR sequences).
- Preprocessing: Tumor volume computation from segmentation masks, binary labeling (high/low tumor burden based on median volume).
- Model Comparison:
- Traditional ML: Random Forest with PCA feature reduction.
- Deep Learning: Simple CNN, VGG16, VGG19, ResNet50, Inception-ResNetV2, EfficientNet.
Unexpected Result: Random Forest (87% accuracy) significantly outperformed all deep learning models (47-70% accuracy), challenging the conventional wisdom that DL universally surpasses traditional ML for image analysis tasks. This highlights the importance of matching model selection to specific dataset characteristics and clinical requirements [5].
Table 2: Essential Research Resources for Machine Learning in Cancer Studies
| Resource Category | Specific Tool/Database | Function and Utility | Key Features |
|---|---|---|---|
| Multi-Omics Databases | MLOmics Database [20] [21] | Preprocessed, ML-ready multi-omics data | 8,314 samples across 32 cancer types; mRNA, miRNA, methylation, CNV data; Original, Aligned, and Top feature versions |
| Genomic Data Portals | The Cancer Genome Atlas (TCGA) [4] [17] | Primary source of cancer genomic data | 20,000+ primary cancer samples across 33 cancer types; Multiple omics data types |
| LinkedOmics [4] | Multi-omics data integration | Multi-omics data from 32 TCGA cancer types; Linked with clinical proteomic data | |
| Analysis Frameworks | GraphVar [17] | Multi-representation cancer classification | Integrates variant maps and numeric features; ResNet-18 + Transformer architecture |
| Stacking Ensemble Framework [4] | Multi-omics data integration | Combines SVM, KNN, ANN, CNN, RF; Handles class imbalance | |
| Biological Knowledge Bases | STRING Database [20] [21] | Protein-protein interaction networks | Supports biological interpretation; Integrated in MLOmics |
| KEGG Pathways [20] [17] | Pathway enrichment analysis | Functional validation of model findings; Biological relevance assessment |
MLOmics Database: A Closer Look
The MLOmics database addresses a critical bottleneck in cancer ML research by providing standardized, analysis-ready datasets [20] [21].
Feature Processing Tiers:
- Original Features: Complete feature sets directly extracted from source data.
- Aligned Features: Intersection of features present across all sub-datasets (shared genes).
- Top Features: Most significant features selected via ANOVA testing (p<0.05 with Benjamini-Hochberg correction).
Available Task Types:
- Pan-cancer Classification: Identifying specific cancer types across 32 classes.
- Golden-standard Subtype Classification: Recognizing established molecular subtypes.
- Cancer Subtype Clustering: Discovering novel subtypes in unlabeled data.
- Omics Data Imputation: Handling missing data in multi-omics datasets.
This resource significantly reduces the preprocessing burden on researchers and enables fair model comparisons through standardized benchmarking [20].
The experimental data and methodologies presented in this comparison guide demonstrate that optimal algorithm selection for cancer classification depends heavily on data type, cancer spectrum, and clinical context. While complex deep learning architectures like GraphVar achieve remarkable performance on genomic data, traditional ensemble methods like Random Forest can surprisingly outperform them on specific imaging tasks. The consistent theme across applications is that multi-modal data integration—whether combining omics types or merging genomic with clinical data—consistently enhances predictive accuracy and clinical utility. As these technologies mature, addressing challenges related to interpretability, dataset bias, and computational requirements will be essential for translating machine learning advancements into tangible improvements in cancer diagnosis, prognosis, and treatment selection.
A Toolkit of Algorithms: From Classical Machine Learning to Advanced Deep Learning Architectures
The application of machine learning (ML) in oncology represents a paradigm shift in cancer classification research, offering powerful tools for early detection and diagnostic precision. Among the diverse ML landscape, three classical supervised learners—Support Vector Machines (SVM), Decision Trees (DT), and Logistic Regression (LR)—have established themselves as foundational algorithms with distinct methodological advantages and practical utility. These algorithms serve as critical benchmarks against which more complex ensemble and deep learning approaches are measured in cancer prediction tasks [22] [23].
The performance of these classical learners is extensively documented across multiple cancer types, with breast cancer classification serving as a particularly rich domain for comparative analysis due to the widespread availability of standardized datasets and the critical importance of diagnostic accuracy. Similarly, in lung cancer prediction, these algorithms form the foundational layer upon which more specialized imaging analysis systems are built [24]. This guide provides a systematic comparison of SVM, DT, and LR through the lens of experimental cancer classification research, detailing their respective performance characteristics, optimal application contexts, and implementation considerations for researchers and clinical professionals.
Performance Comparison in Cancer Classification
Quantitative Performance Metrics Across Studies
Experimental evaluations across multiple cancer types and datasets reveal distinct performance patterns for each classical supervised learner. The following table synthesizes key performance metrics from recent studies focused on breast cancer classification, where comparative data is most abundant.
Table 1: Performance comparison of classical supervised learners in breast cancer classification
| Algorithm | Reported Accuracy | Precision | Recall/Sensitivity | F1-Score | Dataset/Context |
|---|---|---|---|---|---|
| Support Vector Machine (SVM) | 97.07% [22], 97.9% [22], 98.25% [23], 99.51% (with feature selection) [23] | 84.72% [23] | 92.42% [23] | Not specified | Wisconsin Breast Cancer Dataset [22] [23] |
| Logistic Regression (LR) | 98% [25], 96.9% (with neural network) [23], 99.12% (as AdaBoost-Logistic) [25] | 83.33% [23] | 90.91% [23] | 86.96% [23] | Wisconsin Breast Cancer Dataset [25], Fine needle aspiration cytology data [23] |
| Decision Tree (DT) | 97.7% [23], 88.0% (Decision Stump variant) [23] | Not specified | Not specified | Not specified | Dataset with 569 cases (357 benign, 212 malignant) [23] |
For lung cancer classification, although direct comparisons of these specific algorithms are less frequently documented, they often serve as baseline models in larger comparative studies. One comprehensive evaluation of nine ML classifiers for lung cancer prediction positioned these classical learners within a broader performance spectrum, with ensemble methods generally achieving superior results [24]. The Random Forest classifier, an ensemble extension of Decision Trees, achieved remarkable performance with 0.9893 accuracy, 0.99 precision, and 0.99 F1-score in lung cancer detection using synthetic data augmentation [24].
Relative Strengths and Limitations
Each algorithm demonstrates characteristic strengths that make it suitable for specific research contexts and data characteristics:
Support Vector Machines excel in high-dimensional feature spaces, effectively handling datasets with numerous predictive variables. Their ability to find optimal separation hyperplanes makes them particularly valuable when clear margin separation exists between classes [23]. The consistent high accuracy across multiple breast cancer studies positions SVM as a robust choice for binary classification tasks with complex feature relationships.
Logistic Regression provides probabilistic interpretations and model transparency, valuable when researchers require both prediction and explanatory insights [26] [23]. Its performance in multiple studies, particularly when enhanced with ensemble methods like AdaBoost (achieving 99.12% accuracy), demonstrates its continued relevance despite being one of the oldest classification techniques [25].
Decision Trees offer superior interpretability with visual decision pathways that can be valuable in clinical settings where model transparency impacts adoption [23]. However, their performance variability (evident in the 88-97.7% accuracy range) suggests sensitivity to dataset characteristics and implementation specifics, with simpler variants like Decision Stumps exhibiting notably lower performance [23].
Experimental Protocols and Methodologies
Standardized Evaluation Frameworks
Rigorous experimental protocols underlie the performance metrics reported in comparative studies. The following workflow visualization represents a consolidated research methodology for evaluating classical supervised learners in cancer classification.
Diagram 1: Experimental workflow for comparing classical supervised learners in cancer classification
Critical Methodological Components
The experimental protocols referenced in performance comparisons share several standardized components that ensure rigorous evaluation:
Data Preprocessing Procedures: Studies consistently apply feature scaling and normalization to address dimensional inconsistencies among predictive variables [25] [23]. Techniques for handling missing values are implemented to preserve dataset integrity, with some researchers employing statistical tests like the Wilcoxon rank sum test to identify significant feature distributions between classes [25].
Feature Selection Techniques: Dimensionality reduction is frequently employed to enhance model performance and interpretability. Principal Component Analysis (PCA) is commonly implemented to transform features into orthogonal components that capture maximum variance [23]. Correlation analysis, particularly Spearman correlation for non-normally distributed data, helps identify and retain the most predictive features while eliminating redundancy [25].
Validation Methodologies: To ensure robust performance estimation, studies employ stratified k-fold cross-validation (typically with k=5 or k=10) that maintains class distribution across folds [22]. An 80/20 split for training and validation subsets is also commonly implemented, with the validation cohort representing approximately 20% of the total dataset [26]. These approaches mitigate overfitting and provide realistic performance expectations for clinical deployment.
Hyperparameter Optimization: Grid search algorithms with cross-validation are systematically applied to identify optimal hyperparameter configurations [26]. For SVM, parameters including regularization (C), kernel coefficient (γ), and degree are tuned; Decision Trees undergo optimization for maximum depth, minimum samples per split, and leaf size; Logistic Regression primarily focuses on regularization strength and type (L1/L2) [26].
Research Reagent Solutions
The experimental comparisons of classical supervised learners rely on both data resources and computational tools that constitute essential infrastructure for cancer classification research.
Table 2: Essential research reagents and resources for cancer classification studies
| Resource Category | Specific Examples | Function in Research | Application Context |
|---|---|---|---|
| Standardized Datasets | Wisconsin Breast Cancer Diagnostic (WBCD) [25] [22] [23], Breast Cancer Coimbra Dataset [22], PLCO Lung Datasets [27], NLST LDCT Images [28] | Provide benchmark data for algorithm comparison and validation | Model training, performance benchmarking, methodological reproducibility |
| Computational Frameworks | Python Scikit-learn [26] [29], WEKA [23], Anaconda Environment [29] | Implement algorithms, preprocessing, and evaluation metrics | Algorithm development, hyperparameter tuning, performance assessment |
| Data Augmentation Tools | SMOTE [23], CTGAN [24], Gaussian Copula [22] | Address class imbalance and expand training data | Enhancing model robustness, mitigating overfitting, improving minority class prediction |
| Visualization & Interpretation | SHAP [30], 3D Slicer [28] | Model interpretation and medical image analysis | Feature importance analysis, clinical validation, result explanation |
Comparative Analysis and Discussion
Performance Interpretation and Contextual Factors
While quantitative metrics provide straightforward performance comparisons, several contextual factors significantly influence the practical utility of each algorithm:
The dataset characteristics substantially impact relative algorithm performance. Studies utilizing the Wisconsin Breast Cancer Dataset consistently report higher accuracy scores across all three algorithms compared to more complex clinical datasets [25] [22] [23]. This suggests that curated datasets with well-engineered features may inflate performance expectations compared to real-world clinical data with greater heterogeneity and noise.
Feature selection and engineering dramatically influence outcomes, with studies implementing strategic feature reduction often achieving superior performance. The SVM algorithm achieved 99.51% accuracy with only five carefully selected features, outperforming implementations using the full feature set [23]. Similarly, Logistic Regression benefited from feature elimination prior to classification, achieving 96.9% precision when combined with neural networks [23].
The computational efficiency of these algorithms varies substantially, with Decision Trees generally offering faster training times but potentially lower predictive consistency. Logistic Regression provides the most efficient parameter estimation, while SVM, particularly with non-linear kernels, demands greater computational resources for large datasets [23].
Integration Trends and Ensemble Applications
A prominent trend in recent cancer classification research involves integrating classical learners into ensemble frameworks that leverage their complementary strengths:
The AdaBoost-Logistic hybrid model demonstrates how classical algorithms can be enhanced through ensemble methods, achieving 99.12% accuracy by sequentially focusing on misclassified instances [25]. This represents a significant improvement over standard Logistic Regression implementation while maintaining model interpretability.
Random Forest, as an ensemble extension of Decision Trees, consistently ranks among top performers in comparative studies, achieving 99.3% accuracy on test datasets and outperforming its individual tree components [23]. In lung cancer detection, Random Forest achieved remarkable performance (0.9893 accuracy, 0.99 precision and F1-score) when combined with synthetic data generation using CTGAN [24].
Deep learning-based multi-model ensembles represent the current frontier, with stacked ensembles incorporating SVM, Random Forest, Naive Bayes, and Logistic Regression with Convolutional Neural Networks for feature extraction [22]. These approaches acknowledge that classical supervised learners retain value even alongside more complex deep learning architectures.
The comparative analysis of Support Vector Machines, Decision Trees, and Logistic Regression in cancer classification reveals a nuanced performance landscape where each algorithm exhibits distinct advantages depending on research objectives, data characteristics, and implementation context. SVM demonstrates consistent predictive power for complex feature relationships, Logistic Regression offers balanced performance with interpretability, and Decision Trees provide transparent decision pathways valuable for clinical explanation.
Rather than a definitive superiority of any single algorithm, the experimental evidence suggests that context-dependent selection and strategic integration through ensemble methods yield optimal results. As cancer classification research evolves toward more complex multi-modal data and personalized prediction tasks, these classical supervised learners continue to serve as essential benchmarks, component algorithms in ensemble systems, and accessible entry points for methodological development in computational oncology. Their enduring relevance underscores the importance of mastering these fundamental tools while innovating toward increasingly sophisticated analytical frameworks.
Ensemble methods represent a cornerstone of modern machine learning, operating on the principle that multiple models working in concert can achieve superior accuracy and robustness compared to any single algorithm [31] [32]. These methods are particularly valuable in high-stakes domains like medical diagnostics and cancer classification, where improved prediction accuracy can directly impact patient outcomes [33]. For researchers and clinicians working in oncology, selecting the appropriate ensemble algorithm is crucial for developing reliable classification systems.
This guide provides a comprehensive comparison of three powerful ensemble techniques—Random Forest, Gradient Boosting, and CatBoost—within the context of cancer classification research. We examine their underlying architectures, performance metrics, and implementation considerations through the lens of recent experimental studies, enabling informed algorithm selection for medical prediction tasks.
Understanding Ensemble Methods and Their Significance
Ensemble methods combine multiple machine learning models to produce more accurate and stable predictions than individual models. Their effectiveness stems from the mathematical principle of the bias-variance tradeoff, where combining models helps balance oversimplification (high bias) and overfitting to noise (high variance) [32]. In healthcare applications like cancer classification, this translates to more reliable models that generalize better to new patient data.
The three main families of ensemble methods are:
- Bagging (Bootstrap Aggregating): Trains multiple models in parallel on different data subsets and aggregates their predictions, effectively reducing variance [31].
- Boosting: Trains models sequentially, with each new model focusing on correcting errors made by previous ones, reducing both bias and variance [32].
- Stacking: Combines predictions from multiple different models using a meta-learner that learns optimal weighting schemes [34].
The following diagram illustrates the fundamental differences between the bagging and boosting approaches, which form the basis for the algorithms discussed in this guide.
Algorithm Deep Dive: Architectures and Mechanisms
Random Forest: The Democratic Approach
Random Forest employs a bagging methodology where multiple decision trees are constructed in parallel, each trained on a random subset of the training data and features [31] [35]. This enforced diversity prevents individual trees from becoming too specialized and ensures the collective "forest" possesses robust predictive capabilities. For classification tasks like cancer detection, the final prediction is determined by majority voting across all trees in the forest [35].
Key characteristics of Random Forest include:
- Parallel Training: All trees are built independently, enabling potential parallelization [31].
- Feature Randomness: At each split, the algorithm randomly selects a subset of features for consideration, further decorrelating the trees [35].
- Built-in Validation: Each tree is trained on approximately two-thirds of the data, with the remaining "out-of-bag" samples serving as natural validation sets [35].
Gradient Boosting: The Sequential Learner
Gradient Boosting builds models sequentially, with each new tree specifically trained to correct the errors made by its predecessors [32] [35]. Unlike Random Forest's democratic approach, boosting employs a mentorship model where successive models focus on challenging instances that previous models misclassified. This sequential error correction makes boosting algorithms particularly powerful for capturing complex patterns in data.
The algorithm works by:
- Fitting an initial weak learner to the data
- Computing the residuals (errors) between predictions and actual values
- Training subsequent models to predict these residuals
- Combining all models in a weighted manner to form the final predictor [35]
CatBoost: The Categorical Data Specialist
CatBoost is a recent gradient boosting variant specifically designed to handle categorical features efficiently [36]. It modifies the standard gradient boosting approach to avoid prediction shift and employs an innovative method called "Ordered Boosting" that processes data in a permuted order to reduce overfitting [36]. For healthcare datasets containing mixed data types (including categorical variables like patient demographics, symptom categories, and diagnostic codes), CatBoost's specialized handling can provide significant advantages.
CatBoost's distinctive features include:
- Ordered Target Statistics: Effectively encodes categorical features without manual preprocessing [36].
- Prediction Shift Reduction: Implements ordered boosting to prevent target leakage [36].
- Efficient GPU Support: Optimized for accelerated training on graphics processing units [36].
Performance Comparison in Cancer Classification
Experimental Framework from Lung Cancer Classification Study
A rigorous 2024 study directly compared CatBoost and Random Forest for lung cancer classification using a Bayesian Optimization-based hyperparameter tuning approach [33]. The experimental methodology consisted of:
- Data Collection: Acquisition of lung cancer patient medical records and diagnostic data
- Data Preprocessing: Handling missing values, normalization, and feature engineering
- Data Partitioning: 10-fold cross-validation to ensure robust performance estimation
- Model Training: Implementation of CatBoost and Random Forest with both default and tuned hyperparameters
- Hyperparameter Tuning: Bayesian Optimization to efficiently explore hyperparameter spaces
- Performance Evaluation: Comprehensive assessment using multiple classification metrics [33]
The following diagram illustrates this experimental workflow, which is typical in medical classification research:
Quantitative Performance Results
Table 1: Performance Comparison of Ensemble Methods for Lung Cancer Classification [33]
| Algorithm | Hyperparameter Tuning | Accuracy | Precision | Recall | F-Measure | AUC |
|---|---|---|---|---|---|---|
| Random Forest | Default | 0.94462 | 0.94885 | 0.94652 | 0.94425 | 0.99859 |
| Random Forest | Bayesian Optimization | 0.97106 | 0.97339 | 0.97185 | 0.97011 | 0.99974 |
| CatBoost | Default | 0.94585 | 0.95001 | 0.94725 | 0.94559 | 0.99861 |
| CatBoost | Bayesian Optimization | 0.96142 | 0.96389 | 0.96205 | 0.96078 | 0.99915 |
Table 2: Broader Algorithm Comparison Across Multiple Datasets [36]
| Algorithm | Training Speed | Generalization Accuracy | Categorical Feature Handling | Hyperparameter Sensitivity |
|---|---|---|---|---|
| Random Forest | Medium | High | Requires encoding | Low |
| XGBoost | Medium | Very High | Requires encoding | High |
| LightGBM | Very Fast | High | Requires encoding | Medium |
| CatBoost | Slow | Very High | Native handling | Low |
The results demonstrate that Random Forest with Bayesian Optimization achieved the highest performance across all metrics for lung cancer classification, slightly outperforming CatBoost [33]. Both algorithms significantly benefited from hyperparameter tuning, with Random Forest showing a 2.8% improvement in accuracy and CatBoost a 1.6% improvement after optimization [33].
Notably, the study found that hyperparameter tuning was more crucial for gradient-boosting variants than for Random Forest, with default CatBoost performing competitively with tuned versions of other algorithms [36]. This has practical implications for researchers with limited computational resources for extensive hyperparameter optimization.
Implementation Considerations for Medical Research
Hyperparameter Tuning with Bayesian Optimization
The significant performance gains observed in the lung cancer classification study highlight the importance of proper hyperparameter tuning [33]. Bayesian Optimization has emerged as a superior approach for this task, as it builds a probabilistic model of the objective function to direct the search toward promising hyperparameters more efficiently than random or grid search [33] [34].
Key hyperparameters for each algorithm include:
- Random Forest: Number of trees, maximum depth, minimum samples split, and minimum samples leaf [33] [35]
- Gradient Boosting variants: Learning rate, number of trees, maximum depth, and subsampling rate [36]
The following workflow illustrates the Bayesian Optimization process for hyperparameter tuning:
The Research Toolkit for Cancer Classification
Table 3: Essential Research Reagents and Computational Tools
| Item | Function | Implementation Example |
|---|---|---|
| Bayesian Optimization Framework | Efficient hyperparameter tuning | BayesianOptimization Python package [33] |
| Cross-Validation Strategy | Robust performance estimation | 10-fold cross-validation [33] |
| Data Preprocessing Pipeline | Handling missing values, normalization, feature engineering | Scikit-learn preprocessing modules [37] |
| Ensemble Algorithm Libraries | Implementation of Random Forest, CatBoost, and other ensemble methods | Scikit-learn, CatBoost, XGBoost, LightGBM [32] [35] |
| Model Interpretation Tools | Feature importance analysis, model explainability | SHAP, LIME, built-in feature importance [35] |
Ensemble methods—particularly Random Forest, Gradient Boosting, and its variant CatBoost—offer powerful approaches for cancer classification tasks. The experimental evidence demonstrates that:
Random Forest with Bayesian Optimization currently delivers state-of-the-art performance for lung cancer classification, achieving an accuracy of 0.97106, precision of 0.97339, and AUC of 0.99974 [33].
Hyperparameter tuning is essential for maximizing performance, with Bayesian Optimization providing an efficient framework for this process [33] [34].
Algorithm selection involves trade-offs: While Random Forest excelled in the specific lung cancer classification task, CatBoost offers advantages for datasets rich in categorical features, and LightGBM provides exceptional training speed for large-scale datasets [36].
For medical researchers developing cancer classification systems, we recommend implementing a comparative approach that tests multiple ensemble methods with rigorous hyperparameter tuning. The choice of algorithm should consider dataset characteristics, computational resources, and interpretability requirements. As ensemble methods continue to evolve, their application in oncology promises to enhance early detection, improve diagnostic accuracy, and ultimately contribute to better patient outcomes.
In the field of cancer research, the accurate classification of cancer types is a critical step toward personalized treatment and improved patient outcomes. Deep learning models, particularly Convolutional Neural Networks (CNNs) and Recurrent Neural Networks (RNNs), have emerged as powerful tools for analyzing complex medical data. These architectures leverage different strengths: CNNs excel at identifying spatial hierarchies in data, making them ideal for image analysis, while RNNs handle sequential information, capturing temporal dependencies and context. This guide provides an objective comparison of CNN and RNN performance, supported by experimental data from recent cancer classification studies, to inform researchers, scientists, and drug development professionals in selecting and applying these algorithms effectively.
CNNs and RNNs are founded on distinct architectural principles, making them suited to different types of data and analytical tasks.
- Convolutional Neural Networks (CNNs): CNNs are primarily designed for processing spatial data with a grid-like topology, such as images. Their architecture is built around convolutional layers that use filters to scan input data and detect local patterns—such as edges, colors, and textures—at various levels of abstraction. Through operations like convolution and pooling, CNNs progressively build up a hierarchy of features, from simple to complex, which allows them to excel in tasks like image recognition and classification [38]. This makes them exceptionally well-suited for analyzing medical images, including computed tomography (CT) scans and dermoscopic images.
- Recurrent Neural Networks (RNNs): RNNs are specialized for sequential data or time-series data. Their core feature is a feedback loop within the network's nodes (recurrent cells), which allows them to maintain a 'memory' of previous inputs in the sequence. This architecture enables RNNs to model temporal dynamics and contextual relationships where the order of information is critical. However, basic RNNs can struggle with long-range dependencies due to issues like vanishing gradients. Advanced variants like Long Short-Term Memory (LSTM) networks address this by using gating mechanisms to preserve information over longer sequences, making them powerful for tasks like natural language processing, speech recognition, and analyzing genetic sequences [38] [39].
The following diagram illustrates the fundamental architectural differences and data flow in CNNs and RNNs:
Performance Comparison in Cancer Classification
Empirical studies across various cancer types demonstrate the performance of CNNs and RNNs, both as standalone models and in hybrid configurations.
Performance on Medical Imaging Data
CNNs are the established standard for image-based cancer diagnosis. Their performance is benchmarked in the table below, which compiles results from recent studies on lung and skin cancer classification.
Table 1: CNN Performance in Image-Based Cancer Classification
| Cancer Type | Data Modality | Model Architecture | Key Performance Metrics | Citation |
|---|---|---|---|---|
| Lung Cancer | CT Scans (2D) | Multiple 2D CNNs (e.g., InceptionV3) | Best AUROC: 0.79 | [40] |
| Lung Cancer | CT Scans (3D) | Multiple 3D CNNs (e.g., ResNet) | Best AUROC: 0.86 | [40] |
| Lung Cancer | CT Scans | Custom CNN | Accuracy: 99.27%, Precision: 99.44%, Recall: 98.56% | [41] |
| Skin Cancer | Dermoscopic Images | CNN-based Classifiers | Performance equivalent or superior to human experts | [42] |
Performance on Sequential and Genomic Data
RNNs and hybrid models demonstrate strong capabilities in classifying non-image data, such as gene expression sequences.
Table 2: RNN and Hybrid Model Performance in Genomic Cancer Classification
| Cancer Type | Data Modality | Model Architecture | Key Performance Metrics | Citation |
|---|---|---|---|---|
| Brain Cancer | Gene Expression Data | 1D-CNN + RNN | Accuracy: 90% | [43] |
| Brain Cancer | Gene Expression Data | BO + 1D-CNN + RNN | Accuracy: 100% | [43] |
| Skin Cancer | Dermoscopic Images | Hybrid CNN-LSTM | High accuracy across precision, recall, and F1-score | [44] |
| Skin Cancer | Dermoscopic Images | CNN-RNN with ResNet-50 backbone | Average Recognition Accuracy: 99.06% | [45] |
Experimental Protocols and Methodologies
This section details the experimental setups from key studies cited in this guide, providing a blueprint for reproducible research.
Protocol 1: Lung Cancer Classification from CT Scans
A comprehensive benchmark study evaluated 2D and 3D CNNs for lung cancer risk prediction (malignant-benign classification) using a subset of the National Lung Screening Trial (NLST) dataset [40].
- Dataset: 253 participants from the NLST LDCT arm, with CT scans preprocessed into 2D-image and 3D-volume formats based on radiologist-annotated nodules. The cohort was split into 150 patients for training and 103 for testing.
- Model Training: The study implemented and compared ten 3D models (e.g., ResNet, R2Plus1D) and eleven 2D models (e.g., InceptionV3, ViTs). Models were pretrained on large-scale datasets like ImageNet and Kinetics, then fine-tuned on the NLST data.
- Evaluation: Performance was measured using the Area Under the Receiver Operating Characteristic curve (AUROC). The study concluded that 3D CNNs generally outperformed 2D models, with the best 3D model achieving an AUROC of 0.86.
Protocol 2: Brain Cancer Classification from Gene Expression Data
A study on brain cancer classification employed a hybrid 1D-CNN and RNN model on gene expression data from the Curated Microarray Database (CuMiDa) [43].
- Dataset: The GSE50161 brain cancer dataset from CuMiDa, containing 130 samples with 54,676 genes each, categorized into five classes (including healthy tissue).
- Model Architecture and Training:
- 1D-CNN Layer: Processed the raw gene expression sequences to extract local, high-level features.
- RNN Layer (LSTM/GRU): Analyzed the feature sequences captured by the CNN to model long-range dependencies and contextual information within the genomic data.
- Bayesian Optimization (BO): A hyperparameter tuning strategy was applied to optimize the model, significantly boosting performance.
- Evaluation: The hybrid model achieved 90% accuracy. When enhanced with Bayesian hyperparameter optimization, the model's accuracy reached 100%, surpassing traditional machine learning models.
Protocol 3: Skin Cancer Classification via Hybrid LSTM-CNN
A novel approach for skin cancer classification used a hybrid model that integrated LSTM networks with CNNs on the HAM10000 dataset of 10,015 skin lesion images [44].
- Data Preprocessing: Each skin lesion image was divided into a sequence of patches. This patching technique allowed the model to treat the image as a sequence of spatial segments.
- Model Architecture and Training:
- LSTM Component: Processed the sequence of image patches to capture temporal dependencies and relationships between different spatial regions.
- CNN Component: Applied time-distributed convolutional layers to extract spatial features (e.g., texture, edges, color) from each individual patch.
- Classification: A final Softmax layer provided a probability distribution over the possible skin cancer classes.
- Evaluation: The model's performance was evaluated using accuracy, recall, precision, F1-score, and ROC curve analysis, demonstrating superior results compared to models using only CNN or LSTM.
The workflow for a typical hybrid CNN-RNN model in medical data analysis is summarized below:
The Scientist's Toolkit: Essential Research Reagents and Materials
The following table lists key resources and computational tools essential for conducting deep learning research in cancer classification.
Table 3: Key Research Reagents and Computational Tools
| Item Name | Function/Application | Specification Notes |
|---|---|---|
| CuMiDa | A curated benchmark of cancer gene expression datasets for evaluating machine learning algorithms. | Contains 78 datasets across 13 cancer types; ideal for genomic classification tasks [43]. |
| NLST Dataset | A large, annotated dataset of low-dose CT scans from a lung cancer screening trial. | Essential for training and validating lung cancer detection models; includes nodule annotations [40]. |
| HAM10000 | A large, public collection of multi-source dermatoscopic images of skin lesions. | Contains 10,015 images; used for training and benchmarking skin cancer classification models [44]. |
| ISIC Archive | An extensive repository of dermoscopic images for skin cancer analysis. | Provides thousands of images with metadata; supports algorithm development and testing [45]. |
| Bayesian Hyperparameter Optimization | An automated strategy for selecting optimal model parameters to maximize performance. | Used to fine-tune deep learning models, significantly improving accuracy as demonstrated in [43]. |
| ResNet-50 | A deep CNN architecture known for its effectiveness in feature extraction from images. | Often used as a backbone or feature extractor in hybrid models for medical imaging [45]. |
| Data Augmentation | Techniques to artificially expand the size and diversity of a training dataset. | Mitigates overfitting in medical image analysis where data can be limited [44] [45]. |
CNNs and RNNs offer complementary strengths for cancer classification. CNNs are the undisputed choice for spatial data analysis, such as interpreting CT scans or identifying skin lesions from images, with 3D CNNs showing a distinct performance advantage for volumetric data. In contrast, RNNs, particularly in hybrid models with CNNs, unlock the potential of sequential and structured data like gene expression profiles, achieving remarkable accuracy. The emerging trend of hybrid architectures, which leverage CNN for spatial feature extraction and RNN for sequential modeling, consistently delivers state-of-the-art performance across diverse data types. For researchers, the selection between a CNN, RNN, or a hybrid model should be guided by the fundamental nature of the data—spatial or sequential—and the specific clinical question at hand.
The integration of multiomics data—encompassing genomics, transcriptomics, epigenomics, and proteomics—has become a cornerstone in advancing cancer classification research. This integration presents a significant computational challenge due to the high-dimensionality, heterogeneity, and complex interdependencies of the data types. Machine learning (ML) provides powerful tools to address these challenges, with stacking ensemble methods and advanced fusion techniques emerging as state-of-the-art approaches for building comprehensive and accurate classification models. These methods move beyond single-omics or single-model analyses by strategically combining multiple data types and algorithms to capture a more holistic view of cancer biology, leading to improved diagnostic and prognostic capabilities for researchers and clinicians. This guide objectively compares the performance, experimental protocols, and practical implementation of these leading methodologies within the context of cancer classification.
Performance Comparison of Multiomics Integration Techniques
Different multiomics integration strategies offer distinct advantages and trade-offs in performance, complexity, and biological interpretability. The table below provides a comparative overview of three primary integration paradigms.
Table 1: Comparison of Multiomics Integration Techniques for Cancer Classification
| Integration Type | Description | Reported Performance (Accuracy) | Key Advantages | Key Limitations |
|---|---|---|---|---|
| Early Integration | Simple concatenation of raw features from multiple omics into a single matrix prior to model training. | Varies widely; often lower than advanced methods due to the "curse of dimensionality." | Simple to implement; allows for immediate analysis of feature interactions. | Highly vulnerable to overfitting; requires robust feature selection to handle high dimensionality [46]. |
| Late Integration | Separate models are trained on each omics type, and their predictions are combined (e.g., by voting or averaging). | Generally strong, but dependent on the fusion method. | Leverages omics-specific patterns; modular and flexible design. | May fail to capture complex, non-linear interactions between different omics layers [47] [46]. |
| Middle Integration (Advanced Fusion) | Uses machine learning to integrate data without initial concatenation, often learning a joint representation. | Highest performing; e.g., Stacking Ensembles (98%) [4] [48] and GNNs (superior to baselines) [47] [49]. | Effectively captures complex, non-linear cross-omics interactions; robust to high-dimensional data. | Computationally intensive; complex model tuning and implementation [47] [49]. |
Middle integration techniques, particularly stacking ensembles and graph-based models, consistently demonstrate superior performance in comparative studies. For instance, a stacking ensemble model integrating RNA sequencing, somatic mutation, and DNA methylation data achieved a remarkable 98% accuracy in classifying five common cancer types, outperforming models trained on individual omics data [4] [48]. Similarly, novel Graph Neural Network (GNN) frameworks have been shown to outperform other state-of-the-art baseline models in terms of accuracy, F1 score, precision, and recall on TCGA pan-cancer data [47].
Experimental Protocols and Performance Data of Featured Techniques
This section details the methodologies and experimental outcomes of two leading middle-integration approaches: Stacking Ensembles and Graph Neural Networks.
Stacking Ensemble Techniques
Stacking, or stacked generalization, is an ensemble meta-learning technique that combines multiple base classifiers through a meta-learner.
Table 2: Experimental Performance of Stacking Ensemble Models
| Study & Focus | Base Learners | Meta-Learner | Omics Data Types | Cancer Types / Task | Reported Performance |
|---|---|---|---|---|---|
| Stacked Deep Learning Ensemble [4] [48] | SVM, K-Nearest Neighbors (KNN), Artificial Neural Network (ANN), CNN, Random Forest (RF) | Not Specified | RNA Sequencing, Somatic Mutation, DNA Methylation | 5 types (e.g., Breast, Colorectal) | Accuracy: 98% (Multiomics) vs. 96% (single-omics best) |
| MASE-GC for Gastric Cancer [50] | SVM, RF, Decision Tree, AdaBoost, CNN | XGBoost | Exon Expression, mRNA Expression, miRNA Expression, DNA Methylation | Gastric Cancer (TCGA-STAD) | Accuracy: 98.1%, Precision: 0.9845, Recall: 0.992, F1-Score: 0.9883 |
| Ensemble ML on Exome Data [51] | KNN, SVM, Multilayer Perceptron (MLP) | Majority Voting | Exome Sequencing (Mutation Data) | 5 types (e.g., Ovarian, Pancreatic) | Accuracy: 82.91% (increased to 0.92 metric value with GAN-augmented data) |
Protocol Summary: A typical stacking ensemble workflow involves two main stages. First, in the base learning stage, multiple heterogeneous models (e.g., SVM, RF, CNN) are trained on the multiomics data. Second, in the meta-learning stage, the predictions (class probabilities or labels) from these base models are used as input features to train a meta-classifier (e.g., XGBoost, logistic regression), which makes the final prediction [4] [50]. Robust preprocessing is critical and often includes data normalization, feature extraction using autoencoders to reduce dimensionality, and handling class imbalance with techniques like SMOTE (Synthetic Minority Over-sampling Technique) [4] [51] [50].
Diagram 1: Stacking ensemble workflow for multiomics data.
Graph-Based Fusion Techniques
Graph-based models represent multiomics data as a graph, where nodes can be patients, genes, or other biological entities, and edges represent relationships or similarities.
Protocol Summary: A prominent approach is the use of Graph Convolutional Networks (GCNs) or Graph Attention Networks (GATs). The workflow typically involves:
- Graph Construction: Building a patient similarity network (PSN) using algorithms like Similarity Network Fusion (SNF), which integrates multiple omics types to create a fused graph structure where nodes represent patients [49].
- Feature Learning: Using autoencoders to extract compact, latent feature representations from each high-dimensional omics dataset [49].
- Graph Neural Network Training: The latent features and the PSN are fed into a GCN or GAT. The GNN learns by propagating and transforming information across the graph, effectively capturing high-order relationships between patients and their multiomics profiles [47] [49]. Deep GCN architectures with residual connections can be used to overcome the over-smoothing problem of shallow GNNs and capture more complex relationships [49].
Table 3: Experimental Performance of Graph-Based Fusion Models
| Study & Model | GNN Type | Omics Data Types | Graph Structure | Cancer Types / Task | Performance Highlights |
|---|---|---|---|---|---|
| Multimodal GNN Framework [47] | GCN & GAT | mRNA Expression, CNV, miRNA Expression | Heterogeneous multi-layer graph with intra-omic (GGI) and inter-omics (miRNA-gene) connections | Pan-cancer & Breast Cancer (BRCA) molecular subtype classification | Superior accuracy, F1, precision, and recall vs. baseline models. |
| DeepMoIC [49] | Deep GCN | Copy Number Variation, mRNA Expression, DNA Methylation | Patient Similarity Network (PSN) from SNF | Pan-cancer and 3 cancer subtype datasets | Consistently outperformed state-of-the-art models across all datasets. |
Diagram 2: Graph-based fusion with GNNs for multiomics data.
Successfully implementing multiomics integration models requires a suite of data, software, and computational resources.
Table 4: Essential Research Reagents and Resources for Multiomics Cancer Classification
| Category | Item / Resource | Function / Application | Example Sources |
|---|---|---|---|
| Data Resources | The Cancer Genome Atlas (TCGA) | Primary source of multiomics data from thousands of tumor samples across >30 cancer types. | [4] [47] [46] |
| LinkedOmics | Provides multiomics data from all 32 TCGA cancer types and CPTAC cohorts. | [4] [48] | |
| International Cancer Genome Consortium (ICGC) | Complements TCGA with multiomics data from an international consortium. | [46] | |
| Biological Knowledge Bases | Gene-Gene Interaction (GGI) Networks | Provides intra-omic connections for constructing biological graphs (e.g., from BioGrid). | [47] |
| miRNA-Gene Target Networks | Provides inter-omics connections for constructing biological graphs (e.g., from miRDB). | [47] | |
| Computational Tools & Techniques | Python & Scikit-learn | Core programming language and library for implementing classic ML models and preprocessing. | [4] |
| Deep Learning Frameworks (TensorFlow, PyTorch) | Essential for building and training complex models like CNNs, Autoencoders, and GNNs. | [4] [49] | |
| Graph Neural Network Libraries (e.g., PyTorch Geometric) | Specialized libraries for efficient implementation of GCNs, GATs, and other GNN variants. | - | |
| Synthetic Minority Over-sampling Technique (SMOTE) | Algorithm to address class imbalance in datasets by generating synthetic minority class samples. | [4] [51] [50] | |
| Hardware | High-Performance Computing (HPC) / Cloud Platforms | Crucial for handling the computational load of deep learning models and large multiomics datasets. | [4] |
The comparative analysis presented in this guide underscores the transformative potential of advanced middle-integration techniques for multiomics cancer classification. Stacking ensembles excel through their model-agnostic flexibility, leveraging the strengths of diverse algorithms to achieve benchmark-setting accuracy, as demonstrated by results exceeding 98% [4] [50]. In parallel, graph-based fusion techniques, particularly GNNs, offer a powerful paradigm for directly modeling the complex, non-Euclidean relationships inherent in biological systems, leading to robust performance in subtype classification tasks [47] [49]. The choice between these leading approaches depends on the specific research objectives, available data structures, and computational resources. Stacking ensembles provide a powerful, general-purpose framework, while GNNs are particularly suited for investigations where the explicit modeling of biological networks is critical. Together, these methodologies are paving the way for more precise, reliable, and biologically insightful tools for cancer research and personalized medicine.
Navigating Practical Hurdles: Feature Selection, Imbalanced Data, and Model Explainability
The analysis of high-dimensional data presents a fundamental challenge in modern cancer research. Gene expression data from microarray technology, which allows simultaneous measurement of tens of thousands of genes across relatively few patient samples, epitomizes this curse of dimensionality [52]. The presence of numerous irrelevant, redundant, or noisy features can severely degrade the performance of classification algorithms, potentially obscuring critical biomarkers and reducing diagnostic accuracy [53] [54]. Feature selection (FS) addresses this challenge by identifying a compact subset of highly discriminative features, which not only improves classification performance but also reduces computational costs and enhances the interpretability of models—a crucial consideration for clinical applications [54] [55].
Within this context, nature-inspired algorithms have emerged as powerful optimization tools for feature selection problems. These algorithms mimic natural processes and collective behaviors to efficiently navigate complex search spaces [53] [56]. Swarm Intelligence (SI), a subclass of nature-inspired algorithms, leverages the collective behavior of decentralized, self-organized systems [57]. By simulating the cooperative strategies of social insects, bird flocks, and other biological systems, SI algorithms can effectively explore the vast solution spaces of high-dimensional feature selection problems where traditional methods may struggle [56] [57].
Fundamental Principles of Swarm Intelligence
Swarm Intelligence systems operate based on several core principles that enable simple individual agents to collectively solve complex problems. Understanding these principles is essential for appreciating how SI algorithms tackle feature selection [57]:
Self-Organization: Complex global patterns emerge from local interactions among individuals following simple rules, without centralized control. In Ant Colony Optimization, for example, ants deposit pheromone trails while foraging, collectively finding optimal paths through this indirect communication [57].
Decentralization: Unlike systems controlled by central authorities, coordination in SI systems occurs through local interactions between agents based on their perception of the environment and neighboring agents [57].
Adaptation and Flexibility: SI systems can adapt in real-time to changing environments. The Artificial Bee Colony algorithm demonstrates this when bee agents immediately scout new food sources once existing ones become depleted [57].
Emergence: Complex global behaviors that are not explicitly programmed arise from the collective actions of individuals following simple rules. Examples include intricate flocking patterns in birds or bridge-building in ants [57].
These principles collectively contribute to the robustness and flexibility of SI systems, making them particularly suitable for dynamic optimization problems like feature selection in complex biomedical datasets [57].
Critical Analysis of Swarm Intelligence Algorithms for Feature Selection
Established Swarm Intelligence Algorithms
Table 1: Comparison of Established Swarm Intelligence Algorithms for Feature Selection
| Algorithm | Inspiration Source | Key Mechanism | Advantages | Limitations | Representative Applications |
|---|---|---|---|---|---|
| Particle Swarm Optimization (PSO) [52] [57] | Bird flocking, fish schooling | Particles adjust positions based on personal and neighborhood best experiences | Simple implementation, fast convergence, few parameters to adjust | May converge prematurely to local optima | Optimizing machine learning models, control systems, robotics [57] |
| Ant Colony Optimization (ACO) [54] [57] | Ant foraging behavior | Probabilistic path selection based on pheromone trails and heuristic information | Effective for combinatorial problems, positive feedback reinforces good solutions | Slow convergence for large problems, parameter sensitivity difficult to tune | Network routing, job-shop scheduling [57] |
| Cuckoo Search (CS) [53] [52] | Brood parasitism of cuckoo species | Combination of Lévy flight random walks and host egg discovery | Powerful global exploration via Lévy flights, few parameters | May suffer from slow convergence in some applications | Engineering design optimization, feature selection [53] |
| Shuffled Frog Leaping (SFL) [52] | Frog foraging behavior | Combines local search of PSO with competitiveness mixing of shuffled complex evolution | Memetic approach balances exploration and exploitation | May reflect same worst solutions without modification | Feature selection in gene expression data [52] |
| Grey Wolf Optimizer (GWO) [55] [58] | Social hierarchy and hunting behavior of grey wolves | Simulates alpha, beta, delta leadership hierarchy with encircling prey mechanism | Strong exploitation capabilities, social hierarchy guides search | May lack sufficient exploration in high-dimensional spaces | Feature selection, engineering design [58] |
Emerging and Hybrid Approaches
Table 2: Emerging and Hybrid Nature-Inspired Algorithms for Feature Selection
| Algorithm | Inspiration Source | Key Innovations | Performance Advantages |
|---|---|---|---|
| Shuffled Frog Leaping with Lévy Flight (SFLLF) [52] | Combines frog leaping with cuckoo flight patterns | Incorporates Lévy flight to prevent premature convergence | Outperforms PSO, CS, and SFL in cancer classification accuracy with K-NN classifier [52] |
| Improved Binary Grey Wolf Optimization (IBGWO) [58] | Enhanced grey wolf social hierarchy | Enhanced opposition-based learning initialization, local search strategy, novel update mechanism | Outperforms other algorithms on 12 of 16 benchmark datasets [58] |
| Human Learning Optimization (HLO) [55] | Human learning processes | Mimics human learning mechanisms for optimization | Superior mean fitness performance compared to other nature-inspired algorithms [55] |
| Poor and Rich Optimization (PRO) [55] | Wealth dynamics in human societies | Simulates economic competition and mobility | Strong performance in feature selection without compromising classification accuracy [55] |
| Modified Initialization Approaches [59] | Statistical analysis enhanced with SI | Uses t-test and Wilcoxon rank sum for initial population generation | Improves binary bat, grey wolf, and whale algorithms in accuracy, feature reduction, and stability [59] |
Experimental Framework and Performance Evaluation
Standardized Evaluation Methodology
To ensure fair comparison of feature selection algorithms, researchers typically employ a standardized experimental framework. Most studies utilize publicly available benchmark datasets from repositories like the UCI Machine Learning Repository, with particular emphasis on high-dimensional gene expression data for cancer classification [52] [58]. The evaluation process generally follows this protocol:
Dataset Partitioning: Data is divided into training and testing sets, often using k-fold cross-validation (typically 10-fold) to ensure robust performance estimation [52].
Feature Ranking and Pre-Selection: For extremely high-dimensional data (e.g., microarray data with thousands of genes), initial filtering is performed using univariate statistical measures including T-statistics, Signal-to-Noise Ratio (SNR), or F-test values to select top-m ranked features before applying swarm intelligence techniques [52].
Wrapper-Based Evaluation: The feature subsets selected by nature-inspired algorithms are evaluated using a classifier, with K-Nearest Neighbors (K-NN) being a common choice due to its simplicity and effectiveness [55] [52]. Classification performance is measured primarily by accuracy.
Multi-Objective Assessment: Algorithms are compared based on multiple criteria including classification accuracy, number of selected features, fitness value, convergence behavior, and computational cost [55].
Comparative Performance Analysis
Table 3: Experimental Results of Nature-Inspired Algorithms on Cancer Gene Expression Datasets
| Algorithm | Average Classification Accuracy | Average Feature Reduction | Convergence Speed | Computational Complexity | Stability |
|---|---|---|---|---|---|
| Human Learning Optimization (HLO) [55] | High | Moderate | Fast | Moderate | High |
| Poor and Rich Optimization (PRO) [55] | High | High | Moderate | Moderate | High |
| Grey Wolf Optimizer (GWO) [55] | High | Moderate | Fast | Low | Moderate |
| Shuffled Frog Leaping with Lévy Flight (SFLLF) [52] | Highest (among PSO, CS, SFL) | High | Moderate | Moderate | High |
| Improved Binary GWO (IBGWO) [58] | Highest (on 12/16 datasets) | High | Fast | Moderate | High |
| Standard PSO [52] | Moderate | Moderate | Fast | Low | Moderate |
| Cuckoo Search [52] | Moderate | High | Slow | Moderate | Moderate |
The experimental results consistently demonstrate that human-inspired algorithms such as HLO and PRO, along with enhanced variants like IBGWO and SFLLF, generally outperform traditional approaches across multiple performance metrics [55] [58]. The incorporation of specialized initialization techniques and mechanisms to maintain diversity (such as Lévy flights) significantly improves performance by balancing exploration and exploitation [52] [59].
Implementation Workflows and Signaling Pathways
The application of swarm intelligence algorithms to feature selection problems follows a systematic workflow that can be visualized through the following diagram:
The feature selection process for cancer classification involves multiple interconnected components and decision points, as illustrated below:
Table 4: Essential Research Reagents and Computational Tools for Swarm Intelligence-Based Feature Selection
| Resource Category | Specific Tools & Techniques | Function/Purpose | Application Context |
|---|---|---|---|
| Benchmark Datasets [52] [58] | UCI Machine Learning Repository, Microarray gene expression data (e.g., leukemia, lymphoma, breast cancer) | Provides standardized testing ground for algorithm comparison and validation | Evaluation of algorithm performance on real-world high-dimensional data |
| Statistical Filtering Methods [52] [59] | T-statistics, Signal-to-Noise Ratio (SNR), F-test, Wilcoxon rank sum test | Preliminary feature ranking and dimensionality reduction before SI optimization | Pre-processing step for extremely high-dimensional data (e.g., gene expression with thousands of features) |
| Classification Algorithms [55] [52] | K-Nearest Neighbors (K-NN), Support Vector Machines (SVM), Random Forests | Fitness evaluation within wrapper-based feature selection approaches | Assessing quality of selected feature subsets based on classification performance |
| Performance Metrics [55] [52] | Classification accuracy, feature count, fitness value, convergence curves, computational time | Quantitative comparison of algorithm performance across multiple dimensions | Comprehensive evaluation of trade-offs between different objectives in feature selection |
| Implementation Frameworks [58] | MATLAB, Python (scikit-learn, DEAP), Java | Algorithm development and experimentation platform | Prototyping and testing of novel SI algorithms and modifications |
The comprehensive analysis presented in this guide demonstrates that swarm intelligence and nature-inspired algorithms offer powerful solutions to the challenge of high-dimensionality in cancer classification research. Through their decentralized, self-organizing principles, these algorithms effectively navigate complex feature spaces to identify compact, discriminative feature subsets that enhance classification performance while maintaining biological interpretability [57].
The experimental evidence indicates that human-inspired algorithms such as Human Learning Optimization and Poor and Rich Optimization show particular promise, often outperforming traditional nature-inspired approaches [55]. Furthermore, hybrid and enhanced variants of established algorithms—including Improved Binary Grey Wolf Optimization and Shuffled Frog Leaping with Lévy Flight—demonstrate how incorporating specialized initialization techniques, local search strategies, and diversity preservation mechanisms can significantly boost performance [52] [58].
As cancer research continues to generate increasingly complex and high-dimensional data, swarm intelligence algorithms for feature selection will play an ever more critical role in extracting biologically meaningful patterns. Future research directions will likely focus on multi-objective optimization frameworks that simultaneously optimize accuracy, feature set size, stability, and biological relevance [54], as well as adaptive mechanisms that automatically adjust algorithm parameters during execution. The integration of these sophisticated feature selection approaches with deep learning architectures and explainable AI principles will further enhance their utility in clinical decision support systems, ultimately contributing to more precise and personalized cancer diagnosis and treatment.
Cancer classification models using machine learning consistently face the dual challenge of data scarcity and class imbalance, particularly when differentiating between tumor subtypes or identifying rare cancer forms. Class imbalance occurs when the distribution of classes in a dataset is highly non-uniform, leading machine learning models to become biased toward the majority class [60] [61]. In oncology applications, this often manifests when one class of samples (e.g., normal tissue) is significantly outnumbered by another (e.g., tumor tissue) [61]. For instance, multi-omics cancer datasets from The Cancer Genome Atlas (TCGA) frequently exhibit pronounced imbalances, with normal samples representing only 6.4-9.7% of total specimens [61].
The accuracy paradox describes the phenomenon where a model achieves high overall accuracy by simply predicting the majority class, while failing to identify critical minority class instances—a potentially catastrophic outcome in cancer diagnostics where missing a malignant case could have severe consequences [60]. While imbalanced data affects many domains, the stakes are particularly high in clinical settings where model performance directly impacts patient outcomes [62] [63].
Understanding Resampling Techniques
Fundamental Approaches
Resampling methods constitute the primary strategy for addressing class imbalance, falling into two broad categories: oversampling (adding examples to the minority class) and undersampling (removing examples from the majority class) [60]. In clinical contexts where data is often already limited, oversampling is generally preferred over undersampling, which risks discarding potentially valuable information from the majority class [60] [63].
Table 1: Core Resampling Techniques for Imbalanced Data
| Technique | Type | Core Mechanism | Advantages | Limitations |
|---|---|---|---|---|
| Random Oversampling | Oversampling | Duplicates existing minority class instances | Simple implementation; Fast computation | High risk of overfitting; No new information |
| Random Undersampling | Undersampling | Randomly removes majority class instances | Reduces computational cost; Balances classes | Potentially discards useful information |
| SMOTE | Oversampling | Creates synthetic samples via interpolation between minority instances | Generates new data points; Reduces overfitting vs. random oversampling | May create noisy samples; Not always effective for high-dimensional data |
| ADASYN | Oversampling | Generates samples adaptively based on learning difficulty | Focuses on hard-to-learn instances; Adaptive nature | Higher computational complexity; Can introduce noise |
The SMOTE Algorithm and Its Variants
The Synthetic Minority Oversampling Technique (SMOTE) represents a significant advancement beyond simple oversampling by generating synthetic examples rather than merely duplicating existing ones [60]. SMOTE operates by selecting a minority class instance and identifying its k-nearest neighbors (typically k=5) from the same class, then creating new synthetic points along the line segments connecting the original instance to its neighbors [60] [64]. This interpolation mechanism effectively increases the minority class population while encouraging the classifier to create more generalized decision regions [60].
Several specialized SMOTE variants have emerged to address specific challenges:
- Borderline-SMOTE: Focuses specifically on minority instances near the class boundary, as these are most critical for establishing an optimal decision surface [65].
- SMOTE-Tomek Links: A hybrid approach that combines SMOTE oversampling with Tomek Links undersampling to clean overlapping data points between classes, resulting in clearer class separation [60].
- SMOTE-ENN: Another hybrid method that applies Edited Nearest Neighbors (ENN) after SMOTE, removing both majority and minority samples that are misclassified by their nearest neighbors, performing more extensive data cleaning [60].
- GANified-SMOTE: A recent innovation that integrates SMOTE with Generative Adversarial Networks (GANs) to produce more diverse and realistic synthetic samples, potentially overcoming some limitations of traditional SMOTE [65].
Experimental Comparison in Cancer Classification Context
Performance Metrics and Experimental Protocol
When evaluating classification performance on imbalanced cancer datasets, traditional accuracy metrics can be misleading. Instead, researchers should employ comprehensive evaluation criteria including precision (positive predictive value), recall (sensitivity), F1-score (harmonic mean of precision and recall), AUC-ROC (area under the receiver operating characteristic curve), and MCC (Matthews correlation coefficient) [61] [63]. These metrics provide a more nuanced view of model performance, particularly for the minority class.
Table 2: Experimental Performance of Resampling Techniques on Cancer Datasets
| Study Context | Best Performing Technique | Key Metrics | Classifier Used | Comparison Techniques |
|---|---|---|---|---|
| Multi-omics cancer data (RNA-seq, CNV, methylation) [61] | SMOTE | Accuracy >99%; AUC ≥0.999 | SGD with hinge loss | Random Undersampling, NearMiss, Tomek Links, Cost-Sensitive Training |
| Clinical datasets (various diseases) [63] | GNUS (Gaussian Noise Up-Sampling) | MCC, F1, AUC-ROC | Logistic Regression, SVM, Random Forest | SMOTE, ADASYN, No Augmentation |
| Bank customer churn dataset [60] | SMOTE + Classifiers | Significant recall improvement | Logistic Regression, Decision Tree, Random Forest | None (Compared pre/post SMOTE) |
| High-dimensional gene expression data [66] | Random Undersampling | Classification accuracy | k-NN, SVM, Random Forests, DLDA | SMOTE, No Resampling |
A typical experimental protocol for comparing resampling techniques in cancer classification involves:
- Data Collection: Acquire cancer datasets with inherent class imbalance (e.g., TCGA data with normal vs. tumor samples) [61].
- Data Preprocessing: Handle missing values, normalize features, and reduce dimensionality (often using Principal Component Analysis) to address the "curse of dimensionality" common in omics data [61].
- Resampling Application: Apply various resampling techniques exclusively to the training data to avoid data leakage, maintaining the test set in its original imbalanced state to reflect real-world conditions [60].
- Model Training and Validation: Implement multiple classifier algorithms using repeated cross-validation to ensure robust performance estimation [63].
- Statistical Evaluation: Compare techniques across multiple metrics, with particular emphasis on recall and AUC-ROC for clinical relevance [61].
Detailed Methodologies from Key Studies
Multi-Omics Cancer Classification Study [61]: This comprehensive analysis evaluated 18 machine learning methods on TCGA datasets for liver cancer (LIHC), breast cancer (BRCA), and colon adenocarcinoma (COAD). The datasets exhibited significant imbalance, with normal samples representing only 6.4-9.7% of total cases. After substantial dimensionality reduction from over 54,000 features to a few hundred principal components, five imbalance correction techniques were compared. The implementation used WEKA software with 10-fold cross-validation, with SMOTE demonstrating superior performance across cancer types when combined with Stochastic Gradient Descent for learning binary class SVM with hinge loss.
Clinical Dataset Augmentation Study [63]: This investigation compared SMOTE, ADASYN, and Gaussian Noise Up-Sampling (GNUS) across ten clinical datasets from various medical domains, including breast cancer diagnostics, cervical cancer, and fertility. The methodology employed 1000-times repeated Monte Carlo cross-validation with Logistic Regression, Support Vector Machines (with linear, radial basis function, and polynomial kernels), and Random Forests. GNUS operated by randomly selecting samples from the minority class and adding Gaussian noise with ( \overline{x}={\overline{x}}_i\ast 0.001 ) and sd = sdi ∗ 0.001. The study found that while GNUS generally performed as well as or better than SMOTE and ADASYN, augmentation did not improve classification in all cases.
Technical Implementation and Workflow
Research Reagent Solutions
Table 3: Essential Tools for Imbalanced Data Research
| Tool/Technique | Function | Implementation Example |
|---|---|---|
| imbalanced-learn (imblearn) | Python library providing SMOTE and other resampling algorithms | from imblearn.over_sampling import SMOTE |
| Principal Component Analysis (PCA) | Dimensionality reduction for high-dimensional omics data | R prcomp() function [61] |
| WEKA | Java-based platform with built-in resampling algorithms | SMOTE, Random Undersampling filters [61] |
| Monte Carlo Cross-Validation | Robust validation technique for small datasets | 1000-times repeated random sub-sampling [63] |
| TCGA Data Access | Source of multi-omics cancer data with inherent imbalance | TCGA-Assembler R package [61] |
Implementation Workflows
Experimental Workflow for Comparing Resampling Techniques
Critical Considerations for Clinical Applications
High-Dimensional Data Challenges
The performance of resampling techniques varies significantly with data dimensionality. While SMOTE generally benefits low-dimensional data, its effectiveness diminishes with high-dimensional datasets, such as gene expression data with thousands of variables [66]. Theoretical analysis reveals that SMOTE does not change the expected value of the minority class while decreasing its variability (( \text{var}(Xj^{\text{SMOTE}}) = \frac{2}{3} \text{var}(Xj) )), which can impact classifiers relying on class-specific variances [66]. For high-dimensional omics data, combining SMOTE with aggressive dimensionality reduction or feature selection often yields better results than applying SMOTE alone [66] [61].
Algorithm Selection Guidelines
The optimal resampling strategy depends on dataset characteristics and analytical goals:
- For low-dimensional clinical data with moderate sample sizes: SMOTE and its variants typically outperform random oversampling [60] [63].
- For high-dimensional omics data (p ≫ n scenarios): Random undersampling may surprisingly outperform SMOTE, particularly when combined with robust feature selection [66].
- For complex, non-linear data distributions: Advanced techniques like GANified-SMOTE or GNUS may generate more realistic synthetic samples [65] [63].
- When interpretability is paramount: Hybrid approaches like SMOTE+Tomek or SMOTE+ENN can create clearer class separation [60].
Resampling Technique Selection Guide
Addressing class imbalance remains crucial for developing reliable cancer classification models. While SMOTE generally outperforms basic resampling approaches, no single technique dominates across all scenarios. The emerging evidence suggests that Gaussian Noise Up-Sampling (GNUS) and GAN-based methods show particular promise for clinical applications where data scarcity and high dimensionality coexist [65] [63].
Future research directions should focus on developing context-aware resampling algorithms that automatically adapt to dataset characteristics, and multi-modal augmentation strategies that simultaneously address imbalance across different data types (e.g., genomic, imaging, and clinical data). As cancer classification models continue to evolve toward clinical implementation, robust handling of class imbalance will remain foundational to ensuring equitable model performance across all patient subgroups and cancer types.
Researchers should select resampling techniques through systematic empirical evaluation rather than defaulting to any single method, as the optimal approach depends on specific data characteristics, analytical goals, and clinical requirements. The experimental frameworks and comparative data presented in this review provide a foundation for making these critical methodological decisions in cancer classification research.
Overfitting presents a fundamental challenge in developing robust machine learning (ML) and deep learning (DL) models for cancer classification. This phenomenon occurs when a model learns not only the underlying patterns in the training data but also its noise and random fluctuations, resulting in poor performance on unseen data. The high-dimensionality of omics data and the often limited number of patient samples exacerbate this problem in computational oncology [4]. This guide provides a comprehensive comparison of mitigation strategies—regularization, cross-validation, and dropout—framed within the context of cancer classification research, offering experimental data and methodologies to inform researcher selection and implementation.
Theoretical Foundations of Overfitting Mitigation
The Overfitting Problem in Cancer Data
Cancer classification datasets, particularly those from high-throughput sequencing technologies like RNA sequencing and DNA methylation arrays, are characterized by a "large p, small n" problem, where the number of features (p) vastly exceeds the number of samples (n) [4]. This high-dimensional landscape creates ample opportunity for models to memorize dataset-specific variations rather than learning generalizable biological signatures. For instance, microarray gene expression data may contain over 20,000 genes profiled across only a few hundred patients, creating an environment where overfitting can drastically inflate training performance while compromising clinical applicability [10] [67] [68].
Core Mitigation Frameworks
Three principal frameworks have emerged to address overfitting in cancer classification research:
- Regularization: Techniques that constrain model complexity by adding penalty terms to the loss function, discouraging over-reliance on any single feature.
- Cross-Validation: Resampling methods that repeatedly partition data to assess model generalizability and optimize hyperparameters.
- Dropout: A neural network-specific technique that randomly omits units during training to prevent complex co-adaptations.
Comparative Analysis of Mitigation Techniques
Regularization Techniques
Regularization methods introduce constraints on model parameters to prevent overfitting, with L1 (Lasso) and L2 (Ridge) being among the most widely applied.
Table 1: Comparative Performance of Regularization Techniques in Cancer Classification
| Technique | Cancer Type | Model | Performance | Reference |
|---|---|---|---|---|
| L2 Regularization | Breast Cancer | CNN | Improved generalization with 256-feature convolutional block | [69] |
| StepCox + Ridge | Hepatocellular Carcinoma | Cox Regression | C-index: 0.68 (training), 0.65 (validation) | [70] |
| - | Renal Cancer | DEGCN | Accuracy: 97.06% ± 2.04% (10-fold CV) | [71] |
Cross-Validation Approaches
Cross-validation provides a robust framework for evaluating model generalizability by repeatedly partitioning data into training and validation sets.
Table 2: Cross-Validation Applications in Cancer Classification Studies
| Validation Method | Cancer Type | Classifiers | Key Findings | Reference |
|---|---|---|---|---|
| 10-Fold Cross-Validation | Renal, Breast, Gastric | DEGCN | Accuracy: 89.82% ± 2.29% (breast), 88.64% ± 5.24% (gastric) | [71] |
| 5-Fold Cross-Validation | Lung Cancer | Random Forest | Accuracy: 98.93% with synthetic data augmentation | [24] |
| Nested Cross-Validation | Multiple Cancers | SVM, Random Forest | SVMs outperformed RFs across 22 microarray datasets | [67] [68] |
Dropout Implementation
Dropout techniques randomly disable neurons during training, forcing the network to learn redundant representations and preventing overfitting.
Table 3: Dropout Efficacy in Deep Learning for Cancer Classification
| Application | Architecture | Dropout Rate | Impact on Performance | Reference |
|---|---|---|---|---|
| Multi-omics Feature Extraction | Autoencoder | 0.3 | Effectively handled overfitting in high-dimensional RNA-seq data | [4] |
| Breast Cancer Classification | CNN | Not specified | Combined with L2 regularization and data augmentation | [69] |
Experimental Protocols and Methodologies
Data Preprocessing and Feature Extraction
The foundational step in mitigating overfitting begins with proper data preprocessing. In multi-omics cancer classification, this typically involves:
Normalization: RNA sequencing data often undergoes transcripts per million (TPM) normalization to eliminate technical variations while preserving biological signals [4]. The TPM calculation is represented as: TPM = 10^6 × (reads mapped to transcript / transcript length) / Σ (reads mapped to transcript / transcript length)
Feature Extraction: For high-dimensional omics data, dimensionality reduction is critical. Autoencoders have demonstrated effectiveness in compressing RNA sequencing data while preserving essential biological properties. A typical architecture includes five dense layers with 500 nodes each, ReLU activation, and a dropout rate of 0.3 to prevent overfitting during feature learning [4].
Handling Class Imbalance
Class imbalance in patient data significantly contributes to overfitting, as models become biased toward majority classes. Two primary approaches address this:
- Algorithmic: Ensemble methods like random forests and stacking ensembles inherently mitigate imbalance by aggregating predictions across multiple subsets [4].
- Data-level: Techniques include Synthetic Minority Oversampling Technique (SMOTE) and downsampling. Studies comparing these approaches have found downsampling particularly effective for microarray and omics data [4].
Integrated Regularization Framework
A comprehensive regularization strategy combines multiple techniques:
- Architectural Regularization: In CNN architectures for breast cancer classification, adding convolutional blocks with increasing filters (e.g., 256 features) while reducing learning rate decay factors has proven effective [69].
- Graph-based Regularization: For multi-omics integration, models like DEGCN employ densely connected graph convolutional networks with residual connections to mitigate gradient vanishing and excessive smoothing [71].
The following diagram illustrates a comprehensive workflow integrating these mitigation techniques:
Research Reagent Solutions
Table 4: Essential Research Materials and Computational Tools
| Resource | Type | Application in Cancer Research | Function | |
|---|---|---|---|---|
| The Cancer Genome Atlas (TCGA) | Data Repository | Multi-omics cancer data | Provides RNA sequencing, somatic mutation, and methylation data for model training | [4] |
| LinkedOmics | Data Repository | Multi-omics integration | Complementary data source for somatic mutation and methylation profiles | [4] |
| Python 3.10 | Programming Language | Model implementation | Primary language for implementing deep learning architectures | [4] |
| libSVM | Software Library | Support Vector Machines | Optimized implementation for SVM classification with various kernels | [67] |
| Scikit-learn | Software Library | Machine Learning | Provides implementations of RF, SVM, and cross-validation methods | [71] |
Performance Comparison Across Cancer Types
Multi-Omics Integration Performance
The integration of multiple data types significantly enhances classification accuracy while reducing overfitting through complementary biological signals.
Table 5: Multi-Omics Classification Performance Across Cancer Types
| Cancer Type | Model | Data Types | Accuracy | Regularization Approach | |
|---|---|---|---|---|---|
| Multiple Cancers | Stacking Ensemble | RNA-seq, Methylation, Mutations | 98% | Ensemble learning, autoencoder feature extraction | [4] |
| Renal Cancer | DEGCN | CNV, RNA-seq, RPPA | 97.06% ± 2.04% | Dense GCN connections, VAE dimensionality reduction | [71] |
| Breast Cancer | DEGCN | Multi-omics | 89.82% ± 2.29% | Transfer learning from renal cancer model | [71] |
Traditional ML vs. Deep Learning
The choice between traditional machine learning and deep learning approaches depends on data characteristics and sample size.
Traditional ML Excellence: For microarray data with limited samples, SVMs consistently outperform random forests when properly regularized and validated. A rigorous comparison across 22 datasets showed SVMs achieved superior performance in 15 datasets, with an average AUC of 0.775 versus 0.742 for RFs in binary classification tasks [10] [67] [68].
Deep Learning Advantages: With larger sample sizes and imaging data, CNNs and specialized architectures demonstrate remarkable accuracy. For kidney tumor classification, SVM achieved 98.5% accuracy with proper optimization, while CNN-based approaches reached 99.44% accuracy on CT images [72].
Implementation Guidelines
Technique Selection Framework
Choosing appropriate overfitting mitigation strategies depends on data modality and sample size:
- High-Dimensional Omics Data: Implement autoencoder feature extraction with dropout (rate 0.3-0.5) followed by ensemble methods with nested cross-validation [4].
- Medical Imaging Data: Employ CNN architectures with progressive filter increases, L2 regularization, and aggressive data augmentation [69].
- Multi-Omics Integration: Utilize graph-based architectures with dense connections and similarity network fusion for natural regularization [71].
Emerging Trends and Future Directions
The field is evolving toward more sophisticated regularization approaches:
- Federated Learning: Emerging frameworks enable collaborative model training across institutions while preserving data privacy, inherently regularizing through distributed optimization [24].
- Explainable AI Integration: Multi-scale CNNs combined with explainable AI techniques provide both regularization and interpretability, crucial for clinical adoption [24].
- Synthetic Data Augmentation: CTGAN and other generative approaches create synthetic patient data to address class imbalance and improve generalization, with random forest classifiers achieving 98.93% accuracy in lung cancer detection [24].
The following diagram illustrates the relationship between data types and recommended mitigation strategies:
The integration of artificial intelligence (AI) in oncology presents a critical paradox: as diagnostic models grow more complex and accurate, their inner workings become more opaque, creating a "black box" problem that hinders clinical adoption [73]. This transparency gap is particularly problematic in cancer diagnosis, where high-stakes decisions demand not only superior performance but also interpretability that clinicians can understand and trust [74]. Explainable AI (XAI) has emerged as a transformative solution to this challenge, bridging the gap between complex algorithmic predictions and clinically actionable insights.
The fundamental challenge lies in the trade-off between model performance and interpretability. While deep learning models often deliver state-of-the-art accuracy, their decision-making processes remain largely inscrutable to human experts [75]. XAI addresses this limitation through techniques that illuminate the reasoning behind AI predictions, enabling validation against medical knowledge and building the confidence necessary for integration into clinical workflows. This comparative analysis examines current XAI methodologies, their performance characteristics, and implementation frameworks specifically for cancer classification, providing researchers and clinicians with evidence-based guidance for deploying trustworthy AI systems in oncology.
Comparative Analysis of XAI Approaches in Cancer Diagnostics
Performance Benchmarking of XAI-Integrated Models
Recent research demonstrates that incorporating XAI methodologies does not compromise diagnostic accuracy and often enhances it through improved model design. The table below summarizes quantitative performance metrics across multiple studies implementing XAI for breast cancer classification:
Table 1: Performance Comparison of XAI-Integrated Cancer Classification Models
| Study & Model Architecture | Dataset | Accuracy | Precision | Recall | F1-Score | XAI Method |
|---|---|---|---|---|---|---|
| Hybrid DL (DENSENET121, Xception, VGG16) | Breast ultrasound | 97.00% | - | - | - | Grad-CAM++ [76] |
| Deep Neural Network with ReLU | Wisconsin FNA | 99.20% | 100.00% | 97.70% | 98.80% | SHAP & LIME [77] |
| Multi-View Transformer with Mutual Learning | BreakHis & BACH | +0.90-2.26% vs baselines | - | - | +3.21-4.75% | Attention maps [78] |
| CatBoost-MLP Neural Network | WBCD | - | - | - | - | SHAP [79] |
| Proposed XAI Framework | Cancer image classification | 97.72% | 90.72% | 93.72% | 96.72% | Rule-based explanations [80] |
The performance data reveals that XAI-integrated models achieve clinically viable accuracy levels exceeding 97% across multiple imaging modalities, with one deep neural network reaching remarkable 99.2% accuracy on fine needle aspirate (FNA) data [77]. More importantly, these models deliver this performance while maintaining interpretability—a crucial advancement for clinical implementation.
XAI Technique Selection Framework
Choosing appropriate XAI techniques requires understanding their specific strengths and clinical applications. The following table compares major explanation methods used in cancer diagnostics:
Table 2: XAI Technique Comparison for Cancer Classification
| XAI Method | Scope | Interpretability Level | Clinical Application | Key Advantages |
|---|---|---|---|---|
| SHAP (SHapley Additive exPlanations) | Global & Local | Feature importance scores | Identifying critical diagnostic features across populations and for individual cases [77] [73] | Theory-based consistent attributions; Quantifies feature contributions [77] |
| LIME (Local Interpretable Model-agnostic Explanations) | Local | Instance-specific feature importance | Explaining individual patient predictions [77] [75] | Human-interpretable explanations; Model-agnostic flexibility [75] |
| Grad-CAM++ | Local | Visual heatmaps | Highlighting suspicious regions in medical images [76] | Visualizes discriminative regions; Particularly effective for CNN-based architectures [76] |
| Attention Mechanisms | Global & Local | Feature importance weights | Identifying relevant patterns in whole slide images [78] | Naturally integrated into transformer architectures; Reveals global context [78] |
| Counterfactual Explanations | Local | "What-if" scenarios | Exploring alternative diagnoses and treatment planning [73] | Intuitive and actionable; Supports clinical decision-making [73] |
Each technique offers distinct advantages for different clinical contexts. SHAP provides mathematically rigorous feature attribution, making it valuable for understanding model behavior across populations, while LIME offers intuitive local explanations suitable for individual case review [77] [75]. Visual methods like Grad-CAM++ directly support radiological and pathological analysis by highlighting regions of interest in images [76].
Experimental Protocols and Methodologies
Standardized XAI Implementation Workflow
Implementing XAI for cancer classification follows a systematic methodology to ensure both performance and interpretability. The following diagram illustrates the standardized workflow:
This workflow begins with comprehensive data preprocessing, including feature scaling and selection techniques such as ANOVA, which has been shown to identify significant prognostic features in breast cancer data [79]. Subsequent model selection must balance complexity with explainability needs, with hybrid approaches often providing optimal performance-transparency tradeoffs.
Model Architecture Design Patterns
Successful XAI implementation employs specific architectural patterns that enhance explainability without sacrificing performance:
Hybrid Deep Learning Frameworks Research demonstrates that combining multiple convolutional neural networks (CNNs) creates more robust feature representations. One study integrated DENSENET121, Xception, and VGG16 architectures, achieving 97% accuracy in breast cancer detection from ultrasound images—approximately 13% improvement over individual models [76]. This fusion strategy enhances feature representation while the accompanying Grad-CAM++ implementation provides visual explanations of model focus areas.
Dual-Branch Networks for Local and Global Context The MVT-OFML (Multi-View Transformer Online Fusion Mutual Learning) framework combines ResNet-50 for local feature extraction with transformers for global context modeling [78]. This architecture acknowledges that cancer diagnosis requires both detailed cellular-level analysis (handled by CNN components) and tissue-level architectural understanding (managed by transformer components). The mutual learning mechanism facilitates knowledge sharing between branches, enhancing both performance and the richness of generated explanations.
Ensemble Methods with Built-in Explainability The CatBoost-MLP approach leverages CatBoost's sophisticated handling of categorical data and built-in explainability features, combined with a multi-layer perceptron's classification capabilities [79]. This ensemble is particularly effective for structured clinical data, with SHAP values quantifying feature importance and revealing interactions between diagnostic variables.
The Researcher's XAI Toolkit
Implementing effective XAI systems requires specialized tools and frameworks. The following table catalogs essential resources for developing clinically trustworthy cancer classification systems:
Table 3: Essential XAI Research Tools and Frameworks
| Tool/Framework | Primary Function | Key Features | Implementation Considerations |
|---|---|---|---|
| SHAP Library | Model explanation | Unified approach to explain model outputs; Supports multiple model types [77] [73] | Computationally intensive for large datasets; TreeSHAP variant efficient for tree-based models [73] |
| LIME Package | Local explanations | Creates locally faithful explanations; Works on tabular, text, and image data [77] [75] | Explanations can be sensitive to perturbation parameters; Requires careful parameter tuning [75] |
| InterpretML | Model interpretation | Unified framework for explainable models; Supports Explainable Boosting Machines (EBMs) [73] | Particularly effective for creating inherently interpretable models alongside black-box explanations [73] |
| Grad-CAM++ | Visual explanations | Generates heatmaps highlighting important regions in images [76] | Specifically designed for CNN-based models; Requires access to model internals [76] |
| Transformer Attention Visualization | Self-attention mechanisms | Visualizes attention weights in transformer architectures [78] | Naturally integrated into transformer models; Reveals global context understanding [78] |
Selection criteria should consider model type, data modality, and explanation requirements. For comprehensive projects requiring both global and local explanations, SHAP provides the most theoretically grounded approach [73]. For image-based classification, Grad-CAM++ offers intuitive visualizations [76], while transformer architectures benefit from integrated attention mechanisms [78].
Clinical Integration Pathway
Successfully translating XAI research into clinical practice requires addressing both technical and implementation challenges. The following diagram outlines the pathway from model development to clinical deployment:
Addressing Implementation Challenges
Data Quality and Diversity XAI systems require diverse, representative training data to ensure generalizability. Studies have noted that models trained on limited demographic groups may fail to generalize across populations [74]. XAI techniques can help identify these limitations by revealing which features drive predictions, allowing researchers to detect potential biases before clinical deployment.
Explanation Consistency and Reliability For XAI to build trust, explanations must be consistent and clinically plausible. Research shows that some local explanation methods can produce inconsistent results for similar cases [75]. Establishing quantitative metrics for explanation quality and stability is an ongoing research challenge that must be addressed for robust clinical implementation.
Regulatory and Compliance Considerations As regulatory frameworks for medical AI evolve, explainability will play a crucial role in compliance. Techniques like SHAP and LIME can provide the transparency needed to satisfy regulatory requirements for algorithm auditing and validation [73], particularly in domains requiring justification of diagnostic decisions.
The implementation of explainable AI represents a paradigm shift in clinical cancer diagnostics, moving from opaque black-box models to transparent, interpretable systems that foster trust and facilitate integration into healthcare workflows. As the comparative analysis demonstrates, modern XAI techniques enable diagnostic accuracy exceeding 97% while providing clinically meaningful explanations through feature importance scores, visual heatmaps, and case-based reasoning.
The most successful implementations combine multiple architectural approaches—such as hybrid CNNs for feature fusion, dual-branch networks for local and global context, and ensemble methods with built-in explainability—tailored to specific clinical contexts and data modalities. As XAI methodologies continue to mature, they will play an increasingly vital role in bridging the gap between algorithmic predictions and clinical decision-making, ultimately enhancing patient care through more trustworthy and transparent AI systems.
Future developments should focus on standardizing explanation evaluation metrics, improving computational efficiency for real-time clinical use, and establishing frameworks for continuous monitoring of explanation quality in deployed systems. By addressing these challenges, the research community can accelerate the adoption of clinically trustworthy AI that enhances rather than replaces human expertise.
Benchmarking Performance: Accuracy Metrics, Comparative Studies, and Clinical Validation
The accurate classification of cancer types using machine learning (ML) is a cornerstone of modern computational oncology, directly influencing diagnostic accuracy, therapeutic decisions, and ultimately, patient outcomes. Selecting appropriate evaluation metrics is not merely a technical formality but a critical scientific decision that determines how model performance is measured, interpreted, and validated for clinical relevance. Within the context of cancer classification research, no single metric provides a complete picture of model effectiveness; each illuminates different aspects of performance. This guide provides a structured comparison of four fundamental metrics—Accuracy, F1-Score, C-index, and ROC-AUC—framed within experimental paradigms from recent cancer classification studies. We objectively analyze their computational definitions, interpretative values, and inherent limitations when applied to genomic, imaging, and clinical cancer data, supported by quantitative findings from contemporary research.
The choice of evaluation metric is profoundly influenced by dataset characteristics and clinical priorities. For instance, Accuracy provides an intuitive overall correctness measure but becomes misleading with imbalanced datasets, where one class significantly outnumbers others [81]. In such cases—common in cancer diagnostics where healthy patients far outnumber cancer patients—metrics like F1-score and ROC-AUC that focus on classification quality rather than sheer volume become essential [82]. Furthermore, in survival analysis contexts common in oncology trials, the C-index (Concordance index) measures how well a model predicts event ordering, making it invaluable for prognostic studies [83]. Understanding these nuances enables researchers to select metrics that align with both their methodological approach and translational objectives.
Metric Definitions and Comparative Analysis
Conceptual Foundations and Mathematical Formulations
Accuracy quantifies the proportion of correct predictions (both positive and negative) among all predictions made. It is calculated as (True Positives + True Negatives) / Total Predictions [82]. While intuitively simple and easily explainable to non-technical stakeholders, accuracy provides a reliable performance summary only when datasets exhibit balanced class distribution and all error types carry equal clinical consequence [81].
F1-Score represents the harmonic mean of precision and recall, balancing the trade-off between these two competing objectives [82]. The formula is F1 = 2 × (Precision × Recall) / (Precision + Recall), where Precision = TP / (TP + FP) and Recall = TP / (TP + FN) [81]. This metric is particularly valuable when false positives and false negatives have significant implications, such as in cancer diagnosis where misclassification in either direction carries serious consequences [82].
ROC-AUC (Receiver Operating Characteristic - Area Under Curve) measures a model's ability to distinguish between classes across all possible classification thresholds [83]. The ROC curve plots the True Positive Rate (Sensitivity) against the False Positive Rate (1-Specificity) at various threshold settings [83] [84]. The AUC quantifies the entire area under this curve, providing a threshold-independent performance measure that indicates how well the model ranks positive instances higher than negative instances [82] [84].
C-index (Concordance index) evaluates the ranking quality of survival predictions by measuring the proportion of all comparable patient pairs where the model's prediction aligns with the observed outcomes [83]. In survival analysis contexts common in cancer prognosis studies, it assesses whether patients with higher risk scores experience events earlier than those with lower scores, providing a measure of predictive discrimination for time-to-event data.
Comparative Performance in Cancer Classification Studies
Table 1: Performance metrics reported in recent cancer classification studies
| Study & Cancer Focus | ML Model | Accuracy | F1-Score | ROC-AUC | C-index | Clinical Context |
|---|---|---|---|---|---|---|
| Multi-Cancer Classification (GraphVar) [17] | Multi-representation Deep Learning | 99.82% | 99.82% | Not reported | Not reported | Classification of 33 cancer types using genomic features |
| Skin Cancer Detection [6] | Convolutional Neural Network | 92.5% | Not reported | Not reported | Not reported | Dermatological image classification |
| Lung Cancer Detection [24] | Random Forest with CTGAN | 98.93% | 0.99 | Not reported | Not reported | Predictive modeling using synthetic data augmentation |
Table 2: Strategic selection of evaluation metrics based on research context
| Research Context | Recommended Primary Metrics | Supporting Metrics | Rationale |
|---|---|---|---|
| Balanced multi-class cancer classification | Accuracy, F1-score (per class) | Confusion matrix | Provides overall and class-specific performance in balanced scenarios |
| Imbalanced datasets (rare cancer detection) | F1-score, ROC-AUC, Precision-Recall AUC | Sensitivity, Specificity | Focuses on minority class performance without inflation from majority class |
| Survival analysis and prognosis | C-index | Time-dependent ROC curves | Measures concordance between predictions and observed event times |
| Model ranking and threshold selection | ROC-AUC | Sensitivity at fixed specificity | Evaluates performance across all decision thresholds |
The quantitative findings from recent cancer studies demonstrate several important patterns. The GraphVar framework achieved exceptional performance (99.82% Accuracy and F1-score) across 33 cancer types by integrating multiple representation modalities [17], suggesting that comprehensive feature engineering can drive near-perfect classification in well-defined genomic contexts. For image-based cancer diagnosis, CNN architectures attained 92.5% accuracy in skin cancer detection [6], while ensemble methods like Random Forest with synthetic data augmentation reached 98.93% accuracy in lung cancer prediction [24]. These results highlight how both algorithmic selection and data augmentation strategies significantly impact metric outcomes.
Experimental Protocols and Methodologies
Protocol 1: Multi-Cancer Genomic Classification
The GraphVar study established a comprehensive protocol for multi-cancer classification using genomic data [17]. Their methodology began with data acquisition from The Cancer Genome Atlas (TCGA), encompassing 10,112 patient samples across 33 cancer types, followed by rigorous data curation to eliminate duplicates and ensure patient uniqueness. The framework then generated two complementary data representations: variant maps that encoded mutation types as pixel intensities in spatial arrangements reflecting genomic positions, and numeric feature matrices capturing allele frequencies and mutation spectra. The model architecture integrated a ResNet-18 backbone for processing imaging data with a Transformer encoder for numeric features, followed by a fusion module that combined both representations before final classification. The implementation utilized Python 3.10 with PyTorch 2.2.1, and the dataset was partitioned into training (70%), validation (10%), and test (20%) sets with stratified sampling to preserve class distribution across splits [17].
Protocol 2: Skin Cancer Detection from Dermatological Images
A comparative analysis of ML models for automated skin cancer detection established a protocol focusing on image-based classification [6]. The methodology employed dermoscopic images processed through advanced preprocessing techniques to enhance feature visibility and standardize inputs. The study compared multiple algorithms, including Convolutional Neural Networks (CNNs), Support Vector Machines (SVMs), and Random Forests, with CNNs demonstrating superior performance. The experimental design incorporated diverse datasets to ensure model robustness and generalizability across different demographic groups and imaging conditions. The CNN architecture was specifically optimized for dermatological image classification through transfer learning approaches, though the study noted limitations regarding model interpretability and dataset diversity that should be addressed in future research [6].
Protocol 3: Lung Cancer Prediction with Synthetic Data Augmentation
A recent study on AI-driven predictive modeling for lung detection established a protocol leveraging synthetic data augmentation to address class imbalance [24]. The methodology employed Conditional Tabular Generative Adversarial Networks (CTGAN) to generate synthetic features, which were then classified using a Random Forest (RF) classifier—an approach termed CTGAN-RF. The experimental design included extensive comparative evaluation against nine classification algorithms (XGBoost, SVM, KNN, etc.) using various data balancing methods including SMOTE, Borderline-SMOTE, and SMOTE ENN alongside unbalanced data configurations. The protocol implemented 5-fold cross-validation to ensure reliability, with the proposed CTGAN-RF model achieving superior performance compared to traditional classifiers in handling class imbalance and improving prediction accuracy [24].
Diagram 1: Metric selection workflow for cancer classification research
Essential Research Reagents and Computational Tools
Table 3: Essential research reagents and computational tools for cancer classification research
| Tool/Category | Specific Examples | Function in Research | Implementation Considerations |
|---|---|---|---|
| Deep Learning Frameworks | PyTorch, TensorFlow | Model architecture development and training | PyTorch used in GraphVar for flexibility [17] |
| Data Augmentation | CTGAN, SMOTE | Addressing class imbalance in genomic and clinical data | CTGAN-RF achieved 98.93% accuracy in lung cancer detection [24] |
| Model Architectures | ResNet-18, Transformer, CNN | Feature extraction from images and genomic data | ResNet-18 backbone in GraphVar for variant map processing [17] |
| Evaluation Libraries | scikit-learn, SciPy | Calculation of metrics and statistical testing | scikit-learn used for performance metrics in GraphVar [17] |
| Genomic Data Platforms | TCGA, ICGC | Source of curated cancer genomic datasets | TCGA provided 10,112 samples across 33 cancer types [17] |
| Visualization Tools | Matplotlib, Grad-CAM | Result plotting and model interpretability | Grad-CAM used to localize important genomic regions [17] |
Diagram 2: Experimental workflow for cancer classification research
The establishment of performance metrics in cancer classification research requires careful alignment between statistical properties, dataset characteristics, and clinical requirements. Based on our comparative analysis of recent studies, we recommend ROC-AUC as a primary metric for model selection and ranking tasks, particularly when working with moderately imbalanced datasets and when both sensitivity and specificity are clinically relevant. The F1-score should be prioritized when working with severely imbalanced datasets or when false positives and false negatives carry significant clinical consequences, as it directly optimizes for the trade-off between precision and recall. For survival analysis and prognostic studies, the C-index remains the standard for evaluating concordance between predicted and observed event times. While Accuracy provides intuitive summary statistics, it should be interpreted cautiously and never relied upon exclusively, particularly given the inherently imbalanced nature of many cancer classification scenarios.
The experimental protocols and performance data summarized in this guide demonstrate that metric selection profoundly influences model assessment and optimization directions. Researchers should adopt a multi-metric evaluation framework that includes both threshold-dependent and threshold-independent measures to gain comprehensive insights into model performance. Furthermore, the consistent reporting of all relevant metrics—rather than selective highlighting of optimal results—will enhance reproducibility and facilitate meaningful comparisons across studies. As cancer classification models advance toward clinical implementation, thoughtful metric selection will play an increasingly critical role in validating their reliability, robustness, and translational potential.
The integration of machine learning (ML) into oncology represents a paradigm shift in cancer research and clinical practice. Accurately predicting patient outcomes and classifying cancer types are fundamental to enabling personalized treatment and improving survival rates. While traditional statistical models like the Cox Proportional Hazards (CPH) regression have long been the cornerstone of survival analysis, ML algorithms offer the potential to automatically learn complex patterns from large, high-dimensional datasets. This guide provides an objective, data-driven comparison of ML and traditional algorithms across various cancer types, summarizing recent evidence to inform researchers and drug development professionals.
Methodology of Comparative Studies
The findings summarized in this guide are derived from systematic evaluations and comparative studies. The methodologies generally follow a consistent pattern to ensure a fair comparison, which can be broken down into several key phases.
Figure 1: General Workflow for Algorithm Comparison Studies
Data Sourcing and Preprocessing
Studies typically utilize large, well-annotated cancer datasets. Common sources include the Surveillance, Epidemiology, and End Results (SEER) database, The Cancer Genome Atlas (TCGA), and curated datasets like the Wisconsin Breast Cancer Dataset (WBCD) [85] [86] [87]. Data preprocessing is critical and often involves handling missing values through techniques like median imputation, denoising images with adaptive filters, and augmenting data to address class imbalances [88] [89]. Feature selection methods such as Principal Component Analysis (PCA) or Mutual Information Gain are frequently employed to reduce dimensionality and remove multicollinearity [88].
Model Training and Evaluation
A diverse set of algorithms is selected for head-to-head comparison. For survival prediction, CPH models are benchmarked against ML survival models like Random Survival Forests (RSF) and DeepSurv. For classification tasks, algorithms range from traditional classifiers like Logistic Regression and Support Vector Machines (SVM) to ensemble methods like Random Forests, Gradient Boosting, and advanced deep learning architectures [85] [86] [87]. Models are trained on a subset of the data (e.g., 70%) and their performance is rigorously validated on a held-out test set (e.g., 30%). To ensure robustness, studies often use stratified k-fold cross-validation (e.g., 5-fold or 10-fold) and report performance metrics as averages across folds [90].
Comparative Performance Across Cancer Types
A 2025 meta-analysis of 7 studies provided a high-level summary of ML performance against the traditional Cox model for predicting cancer survival outcomes [85].
Table 1: Summary of ML vs. CPH Model Performance in Cancer Survival Prediction (Meta-Analysis)
| Comparison Metric | Pooled Result | Number of Studies | Conclusion |
|---|---|---|---|
| Standardized Mean Difference (C-index/AUC) | 0.01 (95% CI: -0.01 to 0.03) | 7 | No superior performance of ML over CPH. |
| Commonly Used ML Models | Random Survival Forest (76%), Deep Learning (38%), Gradient Boosting (24%) | 21 | RSF is the most popular ML model for survival analysis. |
The meta-analysis concluded that while ML models are being widely adopted, they demonstrated similar performance to the traditional CPH regression, with a negligible standardized mean difference [85]. This suggests that the choice of model may depend more on the specific dataset and research question than on a consistent performance advantage of one approach over the other.
Cancer Classification and Detection
In contrast to survival prediction, ML models show more varied and sometimes superior performance in classification tasks, such as distinguishing between benign and malignant tumors or classifying cancer subtypes.
Table 2: Algorithm Performance in Cancer Classification and Detection
| Cancer Type | Best Performing Model(s) | Reported Performance | Key Comparative Findings |
|---|---|---|---|
| Breast Cancer (WBCD) | Gradient Boosting Classifier (GBC) [86] | Accuracy: 99.12% [86] | GBC outperformed 10 other algorithms, including SVM (95%), RF, and XGBoost (88.1%). |
| Neural Network [87] | Highest Predictive Accuracy | Random Forest showed the best balance between model fit and complexity. | |
| Osteosarcoma | Extra Trees Algorithm [88] | AUC: 97.8%, Reliability: 97.8% | Outperformed seven other ML algorithms. PCA feature selection was superior to ANOVA and mutual information. |
| Lung Cancer (CT Images) | Hybrid DCNN + LSTM [89] | Accuracy: 98.75% | Combined feature extraction and temporal learning. Outperformed standard CNNs and traditional ML. |
| Quantum-inspired ELM [89] | Detection Rate: 96.7% | Showed reduced computational cost compared to traditional algorithms. | |
| Prostate Cancer (Radiomics) | Deep Learning / Radiomics [91] | High potential for automated Gleason grading. | Research volume has grown exponentially since 2021, but clinical validation is ongoing. |
Emerging Applications: AI in Imaging and Staging
Beyond classification and survival prediction, AI is making inroads into specialized oncology tasks.
- Tumor Segmentation: A 2025 meta-analysis of 11 studies found that AI-assisted segmentation of head and neck tumors using PET/CT was significantly more accurate than PET-only imaging, with improvements in the Dice Similarity Coefficient (DSC) of 0.05 and a reduction in Hausdorff Distance (HD95) by approximately 3 mm [92].
- Cancer Staging: A 2025 study evaluated Large Language Models (LLMs) for head and neck cancer staging. ChatGPT achieved the highest concordance with clinician-assigned stages (85.6%, Cohen’s kappa=0.797), outperforming DeepSeek (67.3%) and Grok (75.2%) [93].
Figure 2: Multimodal AI for Head and Neck Tumor Segmentation
Essential Research Reagents and Computational Tools
The experiments cited rely on a suite of data, computational tools, and algorithms.
Table 3: Key Research Reagent Solutions in Computational Oncology
| Resource Category | Specific Examples | Function and Application |
|---|---|---|
| Public Databases | SEER Database [85] [87], TCGA [94], WBCD [86] [94], LIDC-IDRI [94] | Provide large-scale, annotated datasets for training and validating ML models on patient outcomes, genomics, and medical images. |
| Algorithm Libraries | Scikit-learn [90], XGBoost [86] [94], PyTorch/TensorFlow | Open-source libraries that provide implementations of classic ML algorithms and deep learning frameworks for model development. |
| Validation Frameworks | Stratified K-Fold Cross-Validation [90], Grid Search [88] | Techniques for robust hyperparameter tuning and performance evaluation, ensuring model generalizability. |
| Performance Metrics | C-index [85], AUC [85] [88] [90], Accuracy [86], Dice Score [92] | Standardized metrics to quantitatively compare the discrimination power and accuracy of different models. |
The evidence from recent literature presents a nuanced picture. For the specific task of overall survival prediction, sophisticated ML models do not consistently outperform the well-established CPH regression, indicating that the latter remains a robust and reliable method [85]. However, in image-based classification and detection tasks—such as identifying breast cancer, osteosarcoma, or lung cancer from scans—certain ML algorithms, particularly ensemble methods like Gradient Boosting and advanced deep learning hybrids, can achieve exceptional, state-of-the-art accuracy [86] [88] [89]. Furthermore, emerging applications in AI-powered tumor segmentation and clinical staging demonstrate the potential of these technologies to augment and refine complex clinical workflows [92] [93]. The choice of the optimal algorithm is therefore highly context-dependent, influenced by the cancer type, data modality, and specific clinical or research question at hand.
In cancer classification research, the transition from single-omics analysis to multiomics data integration represents a paradigm shift enabled by advanced machine learning algorithms. While individual omics layers—such as genomics, transcriptomics, and epigenomics—provide valuable insights into specific molecular mechanisms, they offer inherently limited perspectives on the complex, interconnected biological processes driving oncogenesis. Multiomics integration strategies synergistically combine these disparate data modalities to construct a more holistic model of tumor biology, promising enhanced classification accuracy and more reliable prognostic capabilities. This comparison guide objectively evaluates the performance differential between single-omics and multiomics approaches, providing researchers with evidence-based insights for selecting appropriate data integration strategies in cancer computational biology.
Performance Comparison: Single-Omics vs. Multiomics Models
Quantitative evidence from recent studies consistently demonstrates that multiomics integration yields substantial improvements in classification accuracy across various cancer types and machine learning frameworks.
Table 1: Performance Comparison of Single-Omics vs. Multiomics Models in Cancer Classification
| Study & Cancer Focus | Multiomics Accuracy | Single-Omics Accuracy | Performance Gap | Data Modalities Integrated |
|---|---|---|---|---|
| Stacked Ensemble Model (5 Cancers) [4] | 98% | RNA-seq: 96%Methylation: 96%Somatic Mutation: 81% | +2% to +17% | RNA sequencing, DNA methylation, somatic mutations |
| Explainable AI (30 Cancers) [95] | 96.67% | Not specified (external validation) | Significant improvement reported | Gene expression, miRNA, methylation |
| Deep Learning (Cancer Subtyping) [96] | VAE: 91.86% | SDAE: 43.97% | +47.89% | Multiomics feature selection |
| Breast Cancer Survival Prediction [97] | 94% (6-omics) | Single-omics: Failed to predict high-risk patients | Dramatic improvement for risk stratification | Clinical features plus 6 omics types |
The performance advantage of multiomics integration extends beyond simple accuracy metrics. A biologically informed deep learning framework demonstrated that cancer-associated multi-omics latent variables enabled complete separation of 30 cancer types in t-SNE clustering, while individual omics data (gene expression, miRNA, and methylation) showed significant intermingling of cancer types [95]. This suggests multiomics data captures complementary biological signals that provide more discriminative power for precise cancer classification.
Experimental Protocols and Methodologies
Stacked Ensemble Learning Approach
A comprehensive study investigating five common cancer types in Saudi Arabia implemented a stacking ensemble learning methodology with distinct phases [4]:
Data Preprocessing Pipeline:
- Data Collection: RNA sequencing data was obtained from The Cancer Genome Atlas (TCGA), while somatic mutation and methylation data were sourced from the LinkedOmics database [4].
- Normalization: Transcripts per million (TPM) normalization was applied to RNA sequencing data to eliminate systematic experimental bias and technical variation while preserving biological diversity [4].
- Feature Extraction: An autoencoder with five dense layers (500 nodes each, ReLU activation) reduced the high dimensionality of omics data while preserving essential biological properties [4].
- Class Imbalance Handling: Both downsampling and SMOTE (Synthetic Minority Over-sampling Technique) were employed to address class imbalance issues [4].
Ensemble Construction: The stacking ensemble integrated five established machine learning methods: support vector machine (SVM), k-nearest neighbors (KNN), artificial neural network (ANN), convolutional neural network (CNN), and random forest (RF) [4]. This approach leveraged the diverse strengths of each algorithm, with the ensemble meta-learner optimizing the final prediction based on all base models.
Biologically Informed Multiomics Integration
An alternative framework employed biologically driven feature selection combined with deep learning [95]:
Feature Selection Process:
- Gene set enrichment analysis identified genes involved in molecular functions, biological processes, and cellular components (p < 0.05) [95].
- Univariate Cox regression analysis screened for survival-associated genes using clinical and gene expression data from TCGA [95].
- miRNA molecules targeting these survival-associated genes and CpG sites in promoter regions were identified to connect mRNA, miRNA, and methylation data [95].
Integration Architecture:
- A customized autoencoder (CNC-AE) processed concatenated inputs from three data matrices: expression of prognostic genes, miRNA expression, and methylation levels of CpG sites [95].
- The encoder network transformed each data type into separate vectors, which passed through corresponding hidden layers before bottleneck layers of 64 dimensions for each cancer type [95].
- The resulting cancer-associated multi-omics latent variables (CMLV) were used for model construction, achieving minimal reconstruction loss (MSE: 0.03-0.29) [95].
Figure 1: Multiomics Integration Workflow for Cancer Classification
Late Integration Framework
For survival and drug response prediction in breast cancer, a late multiomics integration approach demonstrated robust performance [97]:
Feature Selection and Modeling:
- Neighborhood component analysis (NCA), a supervised feature selection algorithm, selected relevant features from each omics dataset individually [97].
- Selected features from multiple omics types were fed into neural network-based classifier and regressor models [97].
- The survival prediction model utilized a feed-forward neural network with two hidden layers (seven nodes each) and two output neurons, optimized using Bayesian optimization with 10-fold cross-validation [97].
- The drug response prediction model employed a neural network regressor with two hidden layers (11 nodes each), trained using Levenberg-Marquardt backpropagation with 5-fold cross-validation [97].
Integration Strategies and Computational Architectures
Multiomics data integration employs three principal strategies with distinct methodological approaches and applications in cancer classification research.
Table 2: Multiomics Integration Strategies in Cancer Research
| Integration Strategy | Methodology | Advantages | Limitations | Representative Methods |
|---|---|---|---|---|
| Early Integration | Simple concatenation of features from each omics layer into a single matrix [46] | Simple implementation; Reveals interactions between omics layers [96] | High-dimensionality challenges; Dominance of certain data types | Autoencoder-based feature combination [95] |
| Intermediate Integration | Machine learning models consolidate data without simple concatenation or result merging [46] | Preserves data structure while modeling complex relationships | Computational complexity; Model interpretability challenges | DeepMoIC [49]; MAUI [98]; MOFA+ [98] |
| Late Integration | Modeling performed separately on each omics layer with final result merging [46] | Flexibility in modeling approach per data type; Simpler implementation | May miss cross-omics interactions; Requires separate modeling | Weighted-average decision fusion [99]; DeepProg [97] |
Intermediate integration methods, particularly those utilizing deep learning architectures, have demonstrated remarkable efficacy in cancer subtype classification. The DeepMoIC framework exemplifies this approach by combining autoencoders for feature extraction with graph convolutional networks (GCNs) to model patient similarity networks [49]. This architecture effectively handles non-Euclidean data structures and captures higher-order relationships between omics data samples, addressing key limitations of shallow network architectures.
Successful implementation of multiomics cancer classification requires specific computational resources and biological datasets.
Table 3: Essential Research Resources for Multiomics Cancer Classification
| Resource Category | Specific Tools/Databases | Function and Application |
|---|---|---|
| Data Resources | The Cancer Genome Atlas (TCGA) [4] [46] | Provides multiomics data for >20,000 tumors across 33 cancer types |
| LinkedOmics [4] | Offers multiomics data from 32 TCGA cancer types and 10 CPTAC cohorts | |
| ICGC, COSMIC, DepMap [46] | Complementary databases with multiomics data and drug sensitivity information | |
| Computational Frameworks | DeepProg [98] | Ensemble framework of deep-learning and machine-learning models for survival prediction |
| DeepMoIC [49] | Deep graph convolutional network approach for cancer subtype classification | |
| Autoencoder architectures [4] [95] | Dimensionality reduction while preserving essential biological properties | |
| Methodological Approaches | Similarity Network Fusion (SNF) [49] | Constructs patient similarity networks from multiple omics data types |
| Stacked Ensemble Learning [4] | Combines multiple machine learning models to enhance predictive performance | |
| Neighborhood Component Analysis [97] | Supervised feature selection for identifying relevant multiomics features |
Technical Pathways for Multiomics Analysis
The computational workflow for multiomics analysis involves sophisticated data transformation pipelines that convert diverse molecular measurements into predictive features.
Figure 2: Comparative Analysis of Single-Omics vs. Multiomics Computational Pathways
The empirical evidence consistently demonstrates that multiomics data integration significantly outperforms single-omics approaches across diverse cancer classification tasks. Performance improvements range from modest accuracy gains of 2-5% in already-effective models to dramatic 15-20% enhancements in more challenging classification scenarios, with certain architectures achieving up to 47% improvement over suboptimal single-omics implementations [4] [96]. The strategic selection of integration approaches—whether early, intermediate, or late integration—should be guided by specific research objectives, computational resources, and analytical requirements. As multiomics technologies continue to evolve, the development of increasingly sophisticated integration methodologies will further enhance our capacity for precise cancer classification, ultimately advancing personalized oncology and targeted therapeutic interventions.
The transition of machine learning (ML) models from experimental research to clinical practice represents the most significant challenge in modern computational oncology. While algorithms frequently demonstrate exceptional performance on retrospective benchmark datasets, their real-world clinical utility depends on robust validation across diverse patient populations and healthcare settings. This guide provides a systematic comparison of contemporary ML approaches for cancer classification, focusing explicitly on their documented path toward clinical deployment. We objectively evaluate performance through the critical lenses of robustness, generalizability, and real-world efficacy, synthesizing experimental data from recent peer-reviewed studies to offer a clear-eyed assessment of the current state of the field.
Comparative Performance of Machine Learning Algorithms in Cancer Classification
The performance of ML models varies significantly based on the cancer type, data modality, and architectural complexity. The following tables synthesize quantitative results from recent studies, providing a direct comparison of key metrics.
Table 1: Performance Comparison of Deep Learning Models on Histopathology Image Classification
| Model | Dataset | Cancer Type | Accuracy | AUC | Key Strength |
|---|---|---|---|---|---|
| Novel-MultiScaleAttention [100] | BreakHis (8-class) | Breast Cancer | 0.9363 | 0.9956 | Superior multi-scale feature fusion |
| YOLOv11 (base) [100] | BreakHis (8-class) | Breast Cancer | 0.8915 | 0.9812 | Balanced speed/accuracy |
| Enhanced CNN [101] | Private CT Dataset | Lung Cancer | 1.000 | N/R | Exceptional on specific dataset |
| ResNet50 [102] | INbreast | Breast Cancer | 0.8800 | N/R | Strong baseline performance |
| EfficientNetB0 [101] | Private CT Dataset | Lung Cancer | 0.9790 | N/R | High parameter efficiency |
| HyFusion-X (XGBoost) [102] | INbreast | Breast Cancer | 0.9706 | N/R | Hybrid feature advantage |
Table 2: Performance of Traditional ML and Ensemble Methods
| Model | Application Context | Data Type | Sensitivity | Specificity | Notes |
|---|---|---|---|---|---|
| Gradient Boosting [103] | Crowdfunding Success Prediction | Textual Narratives | 0.786-0.798 | N/R | Best for imbalanced text data |
| Random Forest [103] | Crowdfunding Success Prediction | Textual Narratives | 0.754 | N/R | Robust feature importance |
| ANN [104] | Lung Cancer Classification | CT Images | Highest accuracy | N/R | Superior to KNN, RF in study |
| Eagle Prey Optimization [105] | Gene Selection for Cancer Classification | Microarray Data | High (varies by dataset) | High (varies by dataset) | Optimized feature selection |
Experimental Protocols and Methodologies
A critical factor in assessing a model's deployment potential is the rigor of its validation methodology. The following section details the experimental protocols employed in the cited studies.
Histopathology Image Analysis with Novel-MultiScaleAttention
The Novel-MultiScaleAttention model for breast cancer histopathology images was evaluated using a comprehensive protocol [100]:
- Datasets: Rigorous benchmarking on two distinct datasets: a large binary classification dataset (Breast Cancer - v1, N=16,652 images) and the challenging 8-class subset of the BreakHis dataset (N=4,914 images).
- Preprocessing: Implementation of stain normalization and augmentation techniques to account for variability in histological staining protocols and improve generalization.
- Model Architecture: Designed with a dedicated attention mechanism to capture discriminative features across cellular, structural, and architectural scales, mimicking pathological reasoning.
- Validation: Performance compared against state-of-the-art baselines including YOLO11base, ResNet18, EfficientNet, and MobileNet. Evaluation included not only accuracy but also computational efficiency and detailed error analysis.
- Generalizability Assessment: Explicit testing on two distinct datasets of varying complexity to evaluate robustness across different imaging conditions and cancer subtypes.
Hybrid Feature Fusion for Multi-Modal Breast Imaging
The HyFusion-X framework demonstrates an innovative approach to multi-modal data integration [102]:
- Data Modalities: Separate evaluation on both mammogram (Mini-DDSM, INbreast) and ultrasound (Rodrigues, BUSI) datasets within a unified framework.
- Feature Extraction: Fusion of deep features from pre-trained models (ResNet50, InceptionV3, MobileNetV2) with traditional texture features (Gabor filters, wavelet transforms).
- Preprocessing Pipeline: Included image resizing, scaling, normalization, and Contrast Limited Adaptive Histogram Equalization (CLAHE) for enhancement. Tumor segmentation performed using Otsu's multi-thresholding.
- Feature Selection: Systematic statistical feature selection reduced the initial 218,072 features to a robust set of 600 optimal features.
- Classification: Ensemble classifiers (XGBoost, AdaBoost, CatBoost) were utilized on the integrated feature set, with performance evaluated separately for each imaging modality.
Generalizability Assessment Using Trial Emulation
The TrialTranslator framework addresses one of the most pressing challenges in clinical translation: assessing the generalizability of RCT results to real-world populations [106]:
- Methodology: Uses machine learning-based trial emulations applied to a nationwide database of electronic health records.
- Risk Stratification: Emulates RCTs across three prognostic phenotypes (low, medium, and high-risk) identified through machine learning models.
- Application: Evaluated 11 landmark RCTs for the four most prevalent advanced solid malignancies.
- Key Finding: Revealed that patients in low-risk and medium-risk phenotypes exhibited survival times and treatment benefits similar to RCTs, while high-risk phenotypes showed significantly lower survival times and treatment benefits.
- Validation: Included robustness assessments with patient subgroups, holdout validation, and semi-synthetic data simulation.
Visualizing Experimental Workflows
The following diagrams illustrate key experimental workflows and methodological relationships described in the research, providing a visual reference for the comparative analysis.
ML Deployment Pipeline in Healthcare
Hybrid Feature Fusion Framework
The Scientist's Toolkit: Essential Research Reagents and Solutions
Successful development and validation of cancer classification models requires a standardized set of computational and data resources. The following table catalogs key solutions referenced in the evaluated studies.
Table 3: Essential Research Reagents and Computational Solutions
| Resource/Solution | Type | Primary Function | Example Implementation |
|---|---|---|---|
| SEDAR Schema [107] | Data Infrastructure | Standardized EHR data schema enabling longitudinal feature extraction | Modular Azure repository with 18 structured tables for ML-ready healthcare data |
| TrialTranslator [106] | Validation Framework | ML-based trial emulation to assess generalizability of RCT results to real-world patients | Evaluates treatment effects across risk phenotypes in EHR data |
| Eagle Prey Optimization (EPO) [105] | Feature Selection | Bio-inspired algorithm for high-dimensional gene selection in microarray data | Identifies minimal gene subsets with maximal discriminative power for cancer classification |
| Whole Slide Image (WSI) Databases [100] [108] | Data Resource | Digitized histopathology slides for computational pathology | BreakHis, TCGA for training and validating histopathology ML models |
| Pre-trained CNN Models [102] [101] | Model Architecture | Transfer learning from natural images to medical domain | ResNet50, InceptionV3, EfficientNet for feature extraction or fine-tuning |
| MLOps Platforms [107] | Deployment Infrastructure | Productionizing ML systems with versioning, monitoring, and reproducibility | PREDICT program's orchestrated pipeline for model training, evaluation, and deployment |
Discussion: Synthesis of Comparative Findings
The path to clinical deployment requires navigating critical challenges in model robustness, generalizability, and real-world efficacy. Several key themes emerge from our comparative analysis:
Performance-Generalizability Trade-offs
Models achieving exceptional performance on controlled datasets frequently face challenges in broader clinical deployment. The Enhanced CNN reporting 100% accuracy on a specific lung cancer dataset [101] exemplifies this phenomenon, where perfect performance may reflect dataset specificity rather than clinical readiness. In contrast, the TrialTranslator framework [106] explicitly addresses this concern by systematically evaluating performance across risk strata, revealing significantly diminished treatment benefits in high-risk phenotypes that are typically excluded from RCTs.
Architectural Complexity versus Interpretability
Complex architectures like the Novel-MultiScaleAttention model [100] demonstrate superior performance in capturing multi-scale histopathological features, but introduce interpretability challenges in clinical contexts. Conversely, ensemble methods applied to carefully selected features [102] [103] often provide more transparent decision pathways while maintaining competitive performance.
Data Modality Integration
The HyFusion-X approach [102] demonstrates that strategic fusion of multiple data modalities and feature types (deep learning + traditional texture features) can enhance robustness across diverse clinical environments. This aligns with the recognition in clinical practice that diagnosis relies on integrating multiple information sources rather than single-modality assessment.
The transition from benchmark performance to clinical efficacy requires a fundamental reorientation of validation paradigms. Based on our comparative analysis, the most promising path forward integrates several key principles: (1) explicit evaluation of performance across clinically relevant patient subgroups and data domains, (2) implementation of MLOps frameworks that maintain model integrity in evolving clinical environments [107], and (3) adoption of hybrid approaches that leverage both traditional feature engineering and modern deep learning where each is most effective. The models demonstrating the strongest potential for clinical deployment are those validated not merely on aggregate performance metrics, but through frameworks that explicitly assess their behavior across the heterogeneity of real-world patient populations and clinical scenarios.
Conclusion
The comparative analysis of machine learning algorithms for cancer classification reveals a rapidly evolving field where ensemble methods and strategically designed deep learning models consistently achieve high performance. The successful integration of multiomics data and the application of sophisticated feature selection techniques, such as nature-inspired algorithms, are pivotal for managing high-dimensionality and improving biological interpretability. However, the transition from research to clinical practice hinges on overcoming key challenges, including data imbalance, model explainability, and robust external validation. Future directions must focus on developing standardized benchmarking frameworks, fostering collaborative efforts to build larger and more diverse datasets, and creating regulatory pathways for AI tools that are both accurate and transparent. For researchers and drug development professionals, this means prioritizing the development of clinically actionable, trustworthy AI systems that can truly personalize oncology care and accelerate therapeutic discovery.
References
- 1. A Survey on Human Cancer Categorization Based on Deep Learning - PMC [https://www.ncbi.nlm.nih.gov/pmc/articles/PMC9271903/]
- 2. Convergence of evolving artificial intelligence and machine ... learning [https://pmc.ncbi.nlm.nih.gov/articles/PMC11785769/]
- 3. Realizing the promise of machine in learning ... precision oncology [https://bmccancer.biomedcentral.com/articles/10.1186/s12885-025-13621-2]
- 4. JMIR Bioinformatics and Biotechnology - Stacked Deep Learning Ensemble for Multiomics Cancer Type Classification: Development and Validation Study [https://bioinform.jmir.org/2025/1/e70709]
- 5. Frontiers | Comparative analysis of machine techniques on... learning [https://www.frontiersin.org/journals/oncology/articles/10.3389/fonc.2025.1596718/full]
- 6. Analysis of Comparative Models for Automated... Machine Learning [https://inlibrary.uz/index.php/tajmspr/article/view/60551]
- 7. Boosting Skin Cancer Classification: A Multi-Scale Attention and Ensemble Approach with Vision Transformers [https://www.mdpi.com/1424-8220/25/8/2479]
- 8. SGA-Driven feature selection and random forest classification for enhanced breast cancer diagnosis: A comparative study | Scientific Reports [https://www.nature.com/articles/s41598-025-95786-1]
- 9. Frontiers | Machine -based learning and prognostic models... diagnostic [https://www.frontiersin.org/journals/immunology/articles/10.3389/fimmu.2025.1581982/full]
- 10. A comprehensive comparison of random forests and support vector machines for microarray-based cancer classification | BMC Bioinformatics | Full Text [https://bmcbioinformatics.biomedcentral.com/articles/10.1186/1471-2105-9-319]
- 11. Applications of Neural Networks in Biomedical Data Analysis - PMC [https://pmc.ncbi.nlm.nih.gov/articles/PMC9313085/]
- 12. Identifying and training deep on... learning neural networks [https://pmc.ncbi.nlm.nih.gov/articles/PMC11264291/]
- 13. Deep Learning Applications in Clinical Cancer Detection: A Review of Implementation Challenges and Solutions - PMC [https://pmc.ncbi.nlm.nih.gov/articles/PMC12351333/]
- 14. Applications of Neural Networks in Biomedical Data Analysis - PubMed [https://pubmed.ncbi.nlm.nih.gov/35884772/]
- 15. Ensemble learning - Wikipedia [https://en.wikipedia.org/wiki/Ensemble_learning]
- 16. Ensemble Learning - Multiple ML Models for Better Prediction - GeeksforGeeks [https://www.geeksforgeeks.org/machine-learning/a-comprehensive-guide-to-ensemble-learning/]
- 17. A multi-representation deep-learning framework for accurate multicancer classification | Journal of Translational Medicine | Full Text [https://translational-medicine.biomedcentral.com/articles/10.1186/s12967-025-07325-1]
- 18. Performance-weighted-voting model: An ensemble ... machine learning [https://pmc.ncbi.nlm.nih.gov/articles/PMC8320732/]
- 19. Predicting cancer risk using machine learning on lifestyle and genetic data | Scientific Reports [https://www.nature.com/articles/s41598-025-15656-8]
- 20. MLOmics: Cancer Multi-Omics Database for Machine Learning | Scientific Data [https://www.nature.com/articles/s41597-025-05235-x]
- 21. GitHub - chenzRG/Cancer-Multi-Omics-Benchmark [https://github.com/chenzRG/Cancer-Multi-Omics-Benchmark]
- 22. Advancing breast cancer prediction: Comparative ... | PLOS One [https://journals.plos.org/plosone/article?id=10.1371/journal.pone.0326221]
- 23. A comparative study of machine learning algorithms for breast ... [https://jmai.amegroups.org/article/view/9770/html]
- 24. AI-Driven Predictive Modeling for Lung Cancer Detection and... [https://link.springer.com/article/10.1007/s44196-025-00879-4]
- 25. Breast Cancer Prediction Based on Multiple Machine Learning Algorithms - PMC [https://pmc.ncbi.nlm.nih.gov/articles/PMC11005507/]
- 26. of Comparison Learning Models for Machine of Classification ... Breast [https://pmc.ncbi.nlm.nih.gov/articles/PMC11965882/]
- 27. Lung - Datasets - PLCO - The Cancer Data Access System [https://cdas.cancer.gov/datasets/plco/21/]
- 28. NLSTseg: A Pixel-level Lung Cancer Dataset Based on NLST LDCT Images | Scientific Data [https://www.nature.com/articles/s41597-025-05742-x]
- 29. Accuracy Assessment of Several Machine Learning Algorithms for Breast Cancer Diagnosis | Mathematical Statistician and Engineering Applications [https://www.philstat.org/index.php/MSEA/article/view/2378]
- 30. Predictive modeling for breast cancer classification in the context of Bangladeshi patients by use of machine learning approach with explainable AI | Scientific Reports [https://www.nature.com/articles/s41598-024-57740-5]
- 31. Mastering Random : A Deep Dive with Forest ... Gradient Boosting [https://pub.towardsai.net/mastering-random-forest-a-deep-dive-with-gradient-boosting-comparison-2fc50427b508]
- 32. Ensemble Methods: Random , Forests & More... Gradient Boosting [https://www.futureskillguides.com/ensemble-methods-random-forests-gradient-boosting-guide/]
- 33. Comparison of CatBoost and Random Methods for Lung... Forest [https://jeeemi.org/index.php/jeeemi/article/view/382]
- 34. Air Quality Forecasting Using Machine Learning: Comparative ... [https://link.springer.com/article/10.1007/s11270-025-08122-8]
- 35. vs Decision Tree: Which Is Better? - Data-Nizant Random Forest [https://datanizant.com/random-forest-vs-decision-tree/]
- 36. A comparative analysis of gradient algorithms-Bohrium boosting [https://www.bohrium.com/paper-details/a-comparative-analysis-of-gradient-boosting-algorithms/812575753571926017-2496]
- 37. Flowchart for basic Machine Learning models - GeeksforGeeks [https://www.geeksforgeeks.org/machine-learning/flowchart-for-basic-machine-learning-models/]
- 38. CNN vs. RNN: How are they different? | TechTarget [https://www.techtarget.com/searchenterpriseai/feature/CNN-vs-RNN-How-they-differ-and-where-they-overlap]
- 39. RNN vs. CNN: Which Neural Network Is Right for Your Project? [https://www.springboard.com/blog/data-science/rnn-vs-cnn/]
- 40. A benchmark of deep learning approaches to predict lung cancer risk using national lung screening trial cohort | Scientific Reports [https://www.nature.com/articles/s41598-024-84193-7]
- 41. Enhancing Clinical Outcomes Using Deep Learning Solution for Accurate Lung Cancer Classification | Sensing and Imaging [https://link.springer.com/article/10.1007/s11220-025-00548-y]
- 42. Skin cancer via classification ... convolutional neural networks [https://pubmed.ncbi.nlm.nih.gov/34509059/]
- 43. Leveraging hybrid 1D- CNN and RNN approach for classification of... [https://link.springer.com/article/10.1007/s40747-024-01555-4]
- 44. Enhanced melanoma and non-melanoma skin cancer ... classification [https://www.nature.com/articles/s41598-025-08954-8?error=cookies_not_supported&code=44e9313a-0ddd-4ebf-8f6a-e8f13c891982]
- 45. CMC | Free Full-Text | Enhancing Skin Cancer Diagnosis with Deep... [https://www.techscience.com/cmc/v79n1/56271/html]
- 46. Machine learning for multi-omics data integration in cancer - PMC [https://pmc.ncbi.nlm.nih.gov/articles/PMC8829812/]
- 47. A multimodal graph neural network framework for cancer molecular subtype classification | BMC Bioinformatics | Full Text [https://bmcbioinformatics.biomedcentral.com/articles/10.1186/s12859-023-05622-4]
- 48. Stacked Deep Learning Ensemble for Multiomics Cancer Type Classification: Development and Validation Study - PMC [https://pmc.ncbi.nlm.nih.gov/articles/PMC12342693/]
- 49. DeepMoIC: multi - omics via deep graph convolutional... data integration [https://bmcgenomics.biomedcentral.com/articles/10.1186/s12864-024-11112-5]
- 50. Frontiers | MASE-GC: a multi - omics autoencoder and stacking ... [https://www.frontiersin.org/journals/cell-and-developmental-biology/articles/10.3389/fcell.2025.1704237/full]
- 51. Implementation of ensemble machine learning algorithms on exome datasets for predicting early diagnosis of cancers | BMC Bioinformatics | Full Text [https://bmcbioinformatics.biomedcentral.com/articles/10.1186/s12859-022-05050-w]
- 52. A Comparative Analysis of Swarm Techniques for... Intelligence [https://pmc.ncbi.nlm.nih.gov/articles/PMC4137534/]
- 53. - Nature : A Study | SpringerLink Inspired Feature Selection Algorithms [https://link.springer.com/chapter/10.1007/978-981-16-6605-6_55]
- 54. 进化多目标特征选择 - gjwqz - 博客园 [https://www.cnblogs.com/gjwqz/p/18521007]
- 55. A comparative evaluation of nature - inspired for algorithms ... feature [https://pubmed.ncbi.nlm.nih.gov/38187288/]
- 56. (PDF) Nature and Its Applications Inspired Swarm Intelligence [https://www.academia.edu/9757631/Nature_Inspired_Swarm_Intelligence_and_Its_Applications]
- 57. : Swarm - Intelligence Solutions... | Medium Algorithms Nature Inspired [https://medium.com/@vaishnavi.gosavi23/swarm-intelligence-algorithms-for-modern-problem-solving-ee5a779a1554]
- 58. -Based Swarm : An... | SpringerLink Intelligence Feature Selection [https://link.springer.com/chapter/10.1007/978-3-030-82153-1_9]
- 59. Improving nature - inspired for algorithms (2021) feature selection [https://scispace.com/papers/improving-nature-inspired-algorithms-for-feature-selection-49g602zmia]
- 60. for Imbalanced Classification with Python, Technique Smote [https://www.analyticsvidhya.com/blog/2020/10/overcoming-class-imbalance-using-smote-techniques/]
- 61. Performance analysis of data resampling on class imbalance and classification techniques on multi-omics data for cancer classification - PMC [https://pmc.ncbi.nlm.nih.gov/articles/PMC10903850/]
- 62. Machine Learning and AI in Cancer Prognosis, Prediction, and Treatment Selection: A Critical Approach - PMC [https://pmc.ncbi.nlm.nih.gov/articles/PMC10312208/]
- 63. Gaussian noise up-sampling is better suited than SMOTE and ADASYN for clinical decision making | BioData Mining | Full Text [https://biodatamining.biomedcentral.com/articles/10.1186/s13040-021-00283-6]
- 64. And Downsampling: Correcting The Imbalances In Upsampling ... Data [https://www.opensourceforu.com/2024/04/upsampling-and-downsampling-correcting-the-imbalances-in-data/]
- 65. Enhancing Imbalanced Data : A Augmentation Study of... Comparative [https://journals.mmupress.com/index.php/jiwe/article/view/2167]
- 66. SMOTE for high-dimensional class-imbalanced data | BMC Bioinformatics | Full Text [https://bmcbioinformatics.biomedcentral.com/articles/10.1186/1471-2105-14-106]
- 67. Are Random Forests Better than Support Vector Machines for Microarray-Based Cancer Classification? - PMC [https://pmc.ncbi.nlm.nih.gov/articles/PMC2655823/]
- 68. A comprehensive comparison of random forests and support vector machines for microarray-based cancer classification - PMC [https://pmc.ncbi.nlm.nih.gov/articles/PMC2492881/]
- 69. A Comparative Analysis of CNN Architectures and Regularization ... [https://iieta.org/journals/isi/paper/10.18280/isi.290630]
- 70. Frontiers | Performance of AI-based machine models for... learning [https://www.frontiersin.org/journals/pharmacology/articles/10.3389/fphar.2025.1719479/full]
- 71. A densely connected framework for cancer subtype classification [https://bmcbioinformatics.biomedcentral.com/articles/10.1186/s12859-025-06230-0]
- 72. Optimized machine learning based comparative analysis of predictive models for classification of kidney tumors | Scientific Reports [https://www.nature.com/articles/s41598-025-15414-w]
- 73. Explainable AI ( XAI ) Models: Examples, Techniques , Tools & Key... [https://cubig.ai/blogs/explainable-ai-xai-models-examples-techniques-tools-key-projects]
- 74. Breast Cancer Diagnosis: A Comprehensive Exploration of Explainable Artificial Intelligence (XAI) Techniques [https://arxiv.org/html/2406.00532v1]
- 75. of Classification Models:Explainable AI Interpretability | Keylabs XAI [https://keylabs.ai/blog/interpretability-of-classification-models-explainable-ai-xai/]
- 76. -enabled hybrid deep learning architecture for breast... Explainable AI [https://pubmed.ncbi.nlm.nih.gov/41112281/]
- 77. Bridging Accuracy and Interpretability: Deep Learning with XAI for... [https://arxiv.org/html/2510.21780v1]
- 78. Frontiers | Explainable multi-view transformer framework with mutual... [https://www.frontiersin.org/journals/oncology/articles/10.3389/fonc.2025.1626785/full]
- 79. XAI-driven CatBoost multi-layer perceptron neural network for analyzing breast cancer | Scientific Reports [https://www.nature.com/articles/s41598-024-79620-8]
- 80. Explainable Artificial Intelligence (XAI) Model for Cancer Image Classification [https://www.sciopen.com/article/10.32604/cmes.2024.051363]
- 81. Understanding the F1 Score and AUC-ROC Curve | Keylabs [https://keylabs.ai/blog/understanding-the-f1-score-and-auc-roc-curve/]
- 82. vs F vs 1 vs PR AUC: Which Evaluation... Score ROC AUC Accuracy [https://neptune.ai/blog/f1-score-accuracy-roc-auc-pr-auc]
- 83. Receiver operating characteristic - Wikipedia [https://en.wikipedia.org/wiki/Receiver_operating_characteristic]
- 84. AUC and the ROC Curve in Machine Learning | DataCamp [https://www.datacamp.com/tutorial/auc]
- 85. a systematic literature review and meta-analysis - PMC [https://pmc.ncbi.nlm.nih.gov/articles/PMC12570641/]
- 86. Comparison of Classification Success Rates of Different ... [https://pmc.ncbi.nlm.nih.gov/articles/PMC9924317/]
- 87. A comparative analysis of parametric survival models and ... [https://www.nature.com/articles/s41598-025-15696-0]
- 88. A comparative assessment of machine learning models ... [https://www.sciencedirect.com/science/article/pii/S2772442524000820]
- 89. Enriched lung cancer classification approach using an ... [https://www.nature.com/articles/s41598-025-07322-w]
- 90. Machine learning algorithms predict breast cancer incidence risk [https://bmccancer.biomedcentral.com/articles/10.1186/s12885-025-14444-x]
- 91. Algorithms on the rise: a machine learning–driven survey ... [https://www.frontiersin.org/journals/oncology/articles/10.3389/fonc.2025.1675459/full]
- 92. Application of artificial intelligence in head and neck tumor ... [https://bmccancer.biomedcentral.com/articles/10.1186/s12885-025-14881-8]
- 93. Confirmation of Large Language Models in Head and Neck ... [https://pmc.ncbi.nlm.nih.gov/articles/PMC12468830/]
- 94. A review and comparative study of cancer detection using ... [https://bmcbioinformatics.biomedcentral.com/articles/10.1186/s12859-023-05235-x]
- 95. Biologically explainable multi-omics feature demonstrates greater learning potential by identifying tissue of origin, stages, and subtypes for pan-cancer classification | Scientific Reports [https://www.nature.com/articles/s41598-025-24352-6]
- 96. (PDF) Comparative Analysis of Deep Learning for Algorithm ... Cancer [https://www.academia.edu/124417252/Comparative_Analysis_of_Deep_Learning_Algorithm_for_Cancer_Classification_using_Multi_omics_Feature_Selection]
- 97. Deep learning assisted multi-omics integration for survival and drug-response prediction in breast cancer | BMC Genomics | Full Text [https://bmcgenomics.biomedcentral.com/articles/10.1186/s12864-021-07524-2]
- 98. DeepProg: an ensemble of deep-learning and machine-learning models for prognosis prediction using multi-omics data | Genome Medicine | Full Text [https://genomemedicine.biomedcentral.com/articles/10.1186/s13073-021-00930-x]
- 99. A Fusion-Based Multiomics Approach for... | medRxiv Classification [https://www.medrxiv.org/content/10.1101/2025.05.02.25326847v1]
- 100. Optimizing YOLOv11 for automated classification of breast cancer in medical images | Scientific Reports [https://www.nature.com/articles/s41598-025-24850-7]
- 101. Deep learning-based approach to diagnose lung cancer using CT-scan images - ScienceDirect [https://www.sciencedirect.com/science/article/pii/S2666521224000553]
- 102. HyFusion-X: hybrid deep and traditional feature fusion with ensemble classifiers for breast cancer detection using mammogram and ultrasound images | Scientific Reports [https://www.nature.com/articles/s41598-025-22262-1]
- 103. JMIR AI - Leveraging Large Language Models and Machine ... Learning [https://ai.jmir.org/2025/1/e73448]
- 104. Lung Cancer Classification and Prediction Using Machine Learning and Image Processing - PMC [https://pmc.ncbi.nlm.nih.gov/articles/PMC9424001/]
- 105. Frontiers | Cancer in high dimensional microarray gene... classification [https://www.frontiersin.org/journals/genetics/articles/10.3389/fgene.2025.1528810/full]
- 106. Evaluating generalizability of oncology trial results to real - world ... [https://pubmed.ncbi.nlm.nih.gov/39753967/]
- 107. Frontiers | A roadmap to implementing machine learning in healthcare: from concept to practice [https://www.frontiersin.org/journals/digital-health/articles/10.3389/fdgth.2025.1462751/full]
- 108. Current AI technologies in cancer diagnostics and treatment [https://molecular-cancer.biomedcentral.com/articles/10.1186/s12943-025-02369-9]