Mastering Histone ChIP-seq in Primary Cells: A Comprehensive Guide from Bench to Bioinformatics
Chromatin Immunoprecipitation followed by sequencing (ChIP-seq) is the gold standard for genome-wide profiling of histone modifications, providing critical insights into the epigenetic mechanisms governing cell identity, development, and disease.
Mastering Histone ChIP-seq in Primary Cells: A Comprehensive Guide from Bench to Bioinformatics
Abstract
Chromatin Immunoprecipitation followed by sequencing (ChIP-seq) is the gold standard for genome-wide profiling of histone modifications, providing critical insights into the epigenetic mechanisms governing cell identity, development, and disease. This article delivers a comprehensive workflow for successfully applying ChIP-seq to precious primary cell samples, which present unique challenges compared to cell lines. We cover foundational epigenomic principles, detailed methodological protocols optimized for limited input material, rigorous troubleshooting and quality control practices, and advanced data analysis and validation strategies. Tailored for researchers and drug development professionals, this guide integrates established ENCODE consortium guidelines with cutting-edge advancements to ensure the generation of high-quality, biologically relevant epigenomic data.
The Epigenomic Landscape: Decoding Histone Modifications and Their Biological Significance
Histone post-translational modifications (PTMs) are covalent, reversible modifications to histone proteins that serve as fundamental epigenetic regulators of chromatin architecture and gene expression [1]. These modifications are dynamically installed, interpreted, and removed by specific enzymes—commonly termed "writers," "readers," and "erasers"—to control DNA accessibility. The combinatorial pattern of these marks helps define distinct chromatin states, such as active enhancers, actively transcribed regions, and repressive heterochromatin, which orchestrate cellular identity and function [2]. In primary cell research, mapping the genomic locations of these modifications is crucial for understanding cell type-specific gene regulatory programs. Chromatin Immunoprecipitation followed by sequencing (ChIP-seq) has become a foundational method for creating genome-wide maps of histone modifications, providing critical insights into epigenetic landscapes in health and disease [3] [4].
Key Histone Modifications and Their Biological Functions
The major types of histone modifications include acetylation, methylation, phosphorylation, and ubiquitination, each conferring unique functional outcomes on chromatin state. Their properties and roles are summarized in the table below.
Table 1: Major Types of Histone Modifications and Their Biological Functions
| Modification Type | Example Residues | Catalyzing Enzymes (Writers) | Removing Enzymes (Erasers) | General Chromatin Association |
|---|---|---|---|---|
| Acetylation | H3K9, H3K27, H4K5, H4K12 [1] | Histone Acetyltransferases (HATs) [1] | Histone Deacetylases (HDACs) [1] | Transcriptionally active, open chromatin [1] |
| Methylation | H3K4, H3K9, H3K27, H3K36 [1] | SET1, EZH2, PRMTs [1] | Lysine Demethylases (KDMs) [1] | Context-dependent: H3K4me3/ H3K36me3 (active); H3K9me3/ H3K27me3 (repressive) [1] |
| Phosphorylation | H2A.X (Ser139) [1] | ATM, ATR, Aurora B, MSK1 kinases [1] | PP1, PP2A phosphatases [1] | DNA damage response, cell cycle control, stress signaling [1] |
| Ubiquitination/SUMOylation | H2AK119 [1] | PRC1 [1] | Deubiquitinases [1] | Transcriptional repression, stress response [1] |
Acetylation, one of the most studied PTMs, neutralizes the positive charge on lysine residues, weakening histone-DNA interactions and promoting an open, transcriptionally permissive chromatin state [1]. In contrast, methylation does not alter charge and its effect is entirely dependent on the specific residue modified and the degree of methylation (e.g., mono-, di-, or trimethylation). For instance, H3K4me3 is a hallmark of active promoters, while H3K27me3 is a key repressive mark associated with gene silencing [1]. Phosphorylation is highly dynamic and is integral to rapid cellular responses, such as DNA damage signaling, where γ-H2AX (phosphorylated H2A.X) forms foci at sites of double-strand breaks [1].
Quantitative ChIP-seq Frameworks for Histone Modification Analysis
A significant challenge in ChIP-seq has been the lack of a robust quantitative framework to compare histone modification abundance across different samples or experimental conditions [3] [5]. Recent methodological advances have focused on establishing such scales, moving beyond qualitative mapping to true quantitation.
Sans Spike-in Quantitative ChIP (siQ-ChIP)
The siQ-ChIP approach establishes an absolute quantitative scale without requiring exogenous spike-in reagents [3]. It is based on the principle that the chromatin immunoprecipitation reaction follows a sigmoidal binding isotherm governed by mass conservation laws. The core of the method involves a simplified calculation of a proportionality constant, α, which converts sequenced read counts into an absolute scale representing the immunoprecipitation reaction efficiency [3]. The simplified expression for α is:
α = (vin / (V - vin)) * (mIP / min) * (mloaded,in / mloaded)
Where v_in is the input sample volume, V - v_in is the IP reaction volume, m_IP is the full IP mass, m_in is the input mass, and m_loaded is the mass loaded onto the sequencer [3]. This calculation allows the final sequencing data to be projected onto the genome as a probability density, where the signal directly represents the fraction of total chromatin captured at each genomic location [3].
Orthologous Chromatin Spike-in (PerCell ChIP-seq)
The PerCell ChIP-seq methodology uses cells from a closely related species (e.g., mouse or zebrafish cells mixed with human cells) as an internal spike-in control added at a fixed ratio prior to chromatin fragmentation and immunoprecipitation [5]. This approach allows for highly quantitative comparisons across experimental conditions by normalizing the experimental ChIP-seq signals to the spike-in signals. A key advantage is its ability to correct for global changes in histone modification levels, which is particularly important when studying epigenetic drug treatments or comparing cells with different ploidies [5]. The method is coupled with a bioinformatic pipeline that separates and analyzes the experimental and spike-in sequencing reads, enabling normalized quantitative comparisons [5].
Table 2: Comparison of Quantitative ChIP-seq Normalization Approaches
| Feature | siQ-ChIP [3] | PerCell ChIP-seq [5] |
|---|---|---|
| Core Principle | Internal scaling based on IP reaction thermodynamics | External scaling using orthologous cellular spike-in |
| Quantitative Scale | Absolute (IP efficiency) | Relative to spike-in chromatin |
| Key Reagents | None (uses experimental metrics) | Cells from a closely related species |
| Best Suited For | Absolute quantification of IP abundance | Cross-condition/cross-species quantitative comparisons |
| Protocol Complexity | Simplified wet-lab, requires specific calculations | More complex wet-lab, standardized bioinformatics |
Experimental Protocols for ChIP-seq in Primary Cells
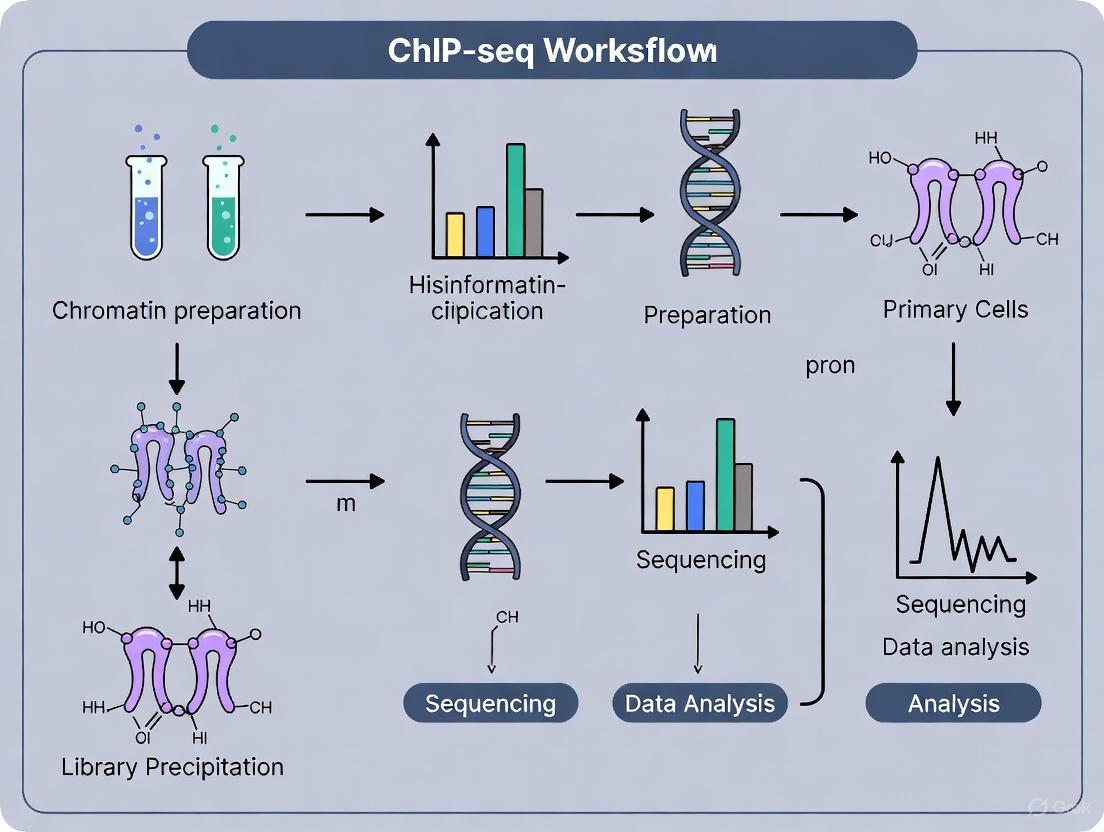
Standard ChIP-seq Workflow for Histone Modifications
The following diagram outlines the core steps of a standard ChIP-seq protocol.
Detailed Protocol: H3K27ac Profiling from FFPE Tissues
Archived Formalin-Fixed Paraffin-Embedded (FFPE) tissues are a valuable resource for studying histone modifications in pathological contexts. The following protocol has been optimized for H3K27ac profiling from such samples, which is critical for identifying active enhancers and super-enhancers in diseased tissues [6].
- Single-Cell Preparation from FFPE Blocks: Cut 4-5 sections of 10-20 μm thickness from the FFPE block. Deparaffinize with xylene and rehydrate through a graded ethanol series. Perform antigen retrieval using heat-induced epitope retrieval (HIER) in appropriate buffer (e.g., citrate-based buffer). Dissociate the tissue into a single-cell suspension using enzymatic digestion (e.g., collagenase) and mechanical disruption [6].
- Fluorescence-Activated Cell Sorting (FACS): Stain the single-cell suspension with fluorescently-conjugated antibodies against specific cell surface markers to identify and isolate the target cell population (e.g., tumor cells). This step is crucial for removing interference from non-target cells in the tissue. Sort the desired population into a collection tube containing PBS with 2% FBS [6].
- On-Bead Chromatin Immunoprecipitation: Crosslink the sorted cells with 1% formaldehyde for 10 minutes at room temperature. Quench the crosslinking with glycine. Pellet the cells and lyse them in ChIP lysis buffer. Shear the chromatin to an average size of 200-500 bp using focused ultrasonication. Incubate the sheared chromatin with an antibody specific to H3K27ac, followed by incubation with Protein A/G magnetic beads. Wash the beads with low-salt, high-salt, and LiCl wash buffers, followed by a final TE buffer wash [6].
- DNA Elution and Library Preparation: Elute the immunoprecipitated chromatin from the beads using elution buffer (e.g., 1% SDS, 0.1 M NaHCO3). Reverse the crosslinks by incubating at 65°C with high salt. Treat with RNase A and Proteinase K, then purify the DNA using a silica membrane-based kit. Construct sequencing libraries from the purified DNA using a commercial library prep kit compatible with low-input samples. The resulting libraries are quantified and sequenced on an appropriate platform [6].
This FACS-assisted protocol significantly improves the specificity of H3K27ac profiles from complex tissues by eliminating confounding signals from non-target cell types, yielding a more accurate representation of the tumor cell epigenome [6].
Advanced Profiling: Single-Cell and Multi-Omic Methods
Bulk ChIP-seq provides a population-average view, masking cellular heterogeneity. To address this, methods like Target Chromatin Indexing and Tagmentation (TACIT) have been developed for genome-coverage single-cell profiling of histone modifications [2]. TACIT is based on in situ chromatin immunoprecipitation and has been used to profile seven core histone modifications (H3K4me1, H3K4me3, H3K27ac, H3K27me3, H3K36me3, H3K9me3, H2A.Z) across thousands of individual cells from mouse early embryos [2]. Furthermore, Combined TACIT (CoTACIT) enables the simultaneous profiling of multiple histone modifications (e.g., H3K27ac, H3K27me3, H3K9me3) in the same single cell through sequential rounds of antibody binding and tagmentation [2]. This multi-modal data can be integrated with single-cell RNA sequencing to chart a comprehensive epigenetic and transcriptional landscape, revealing cell fate priming and lineage specification at unprecedented resolution [2].
Data Analysis, Standards, and Quality Control
Robust bioinformatic analysis is essential for interpreting ChIP-seq data. Repositories like the ENCODE consortium have established rigorous standards and pipelines for histone ChIP-seq data processing [4].
The H3NGST Automated Analysis Pipeline
For researchers lacking extensive bioinformatics expertise, web-based platforms like H3NGST (Hybrid, High-throughput, and High-resolution NGS Toolkit) offer a fully automated, end-to-end solution [7]. Users can initiate an analysis by simply providing a public BioProject accession number (e.g., PRJNA, SRX, GSM). The pipeline automatically performs:
- Raw Data Retrieval: Downloads data from the Sequence Read Archive (SRA).
- Quality Control & Pre-processing: Uses FastQC and Trimmomatic for adapter removal and quality trimming.
- Sequence Alignment: Aligns reads to a user-specified reference genome (e.g., hg38, mm10) using BWA-MEM.
- Peak Calling & Annotation: Identifies enriched regions using HOMER, which is suited for both narrow (e.g., H3K4me3) and broad (e.g., H3K27me3) histone marks, and annotates peaks with genomic features [7].
ENCODE Quality Metrics and Standards
The ENCODE consortium provides definitive guidelines for generating high-quality histone ChIP-seq data [4]. Adherence to these standards is critical for data reproducibility and integrity.
Table 3: ENCODE Quality Control Standards for Histone ChIP-seq [4]
| Parameter | Minimum Requirement | Ideal Target |
|---|---|---|
| Biological Replicates | 2 (isogenic or anisogenic) | 2 or more [4] |
| Input Control | Required (matching replicate structure) | Required [4] |
| Read Depth (Narrow Marks, e.g., H3K4me3) | 20 million usable fragments per replicate | >20 million [4] |
| Read Depth (Broad Marks, e.g., H3K27me3) | 45 million usable fragments per replicate | >45 million [4] |
| Library Complexity (NRF) | - | >0.9 [4] |
| Library Complexity (PBC1) | - | >0.9 [4] |
| Library Complexity (PBC2) | - | >10 [4] |
Key QC metrics include the FRiP (Fraction of Reads in Peaks) score, which indicates the signal-to-noise ratio, and library complexity metrics (NRF, PBC1, PBC2), which assess the redundancy and PCR amplification bias in the library [4]. The required sequencing depth varies by the type of histone mark, with broad domains requiring more than twice the depth of narrow marks for sufficient coverage [4].
The Scientist's Toolkit: Essential Research Reagents and Materials
Table 4: Key Research Reagent Solutions for Histone Modification ChIP-seq
| Reagent / Material | Function / Application | Examples / Notes |
|---|---|---|
| Validated Antibodies | Specific immunoprecipitation of the target histone PTM. | Critical for success. Should be validated per ENCODE standards (e.g., by siRNA knockdown or peptide competition) [4]. |
| Protein A/G Magnetic Beads | Efficient capture of antibody-bound chromatin complexes. | Preferred over sepharose beads for reduced background and easier handling. |
| Orthologous Cells (e.g., Mouse) | Internal spike-in control for quantitative comparisons (PerCell). | Added at a fixed ratio (e.g., 3:1 human:mouse) before sonication [5]. |
| Chromatin Shearing Reagents | Fragment chromatin to optimal size (200-500 bp). | Sonication shearing kits or enzymatic (e.g., MNase) fragmentation assays. |
| Library Prep Kits | Prepare sequencing libraries from low-input IP DNA. | Select kits compatible with low DNA amounts (e.g., from Th5 transposase-based methods). |
| FACS Sorting Reagents | Isolation of specific cell types from heterogeneous samples (e.g., FFPE). | Fluorescently-labeled antibodies against cell surface markers [6]. |
| Bioinformatic Pipelines | Data processing, peak calling, and annotation. | H3NGST (web-based) [7], ENCODE Histone Pipeline [4], PerCell Nextflow pipeline [5]. |
The field of histone modification analysis has evolved from qualitative mapping to sophisticated quantitative and single-cell resolution profiling. Techniques like siQ-ChIP and PerCell ChIP-seq enable rigorous comparison of epigenetic states across conditions, while methods like TACIT and CoTACIT unveil cellular heterogeneity and multi-layered regulatory logic. Adherence to established experimental and computational standards, such as those from ENCODE, ensures the generation of robust, reproducible data. As these technologies become more accessible and integrated into studies of primary cells—from developmental biology to disease modeling and drug discovery—they will continue to deepen our understanding of epigenetic regulation and open new avenues for therapeutic intervention.
The eukaryotic genome is packaged into chromatin, a complex of DNA and histone proteins. The core unit of chromatin is the nucleosome, consisting of approximately 146 base pairs of DNA wrapped around a histone octamer composed of two copies each of histones H2A, H2B, H3, and H4 [8]. Post-translational modifications (PTMs) to the N-terminal tails of these histones constitute a critical regulatory layer beyond the genetic code, influencing gene expression by altering chromatin structure and recruiting effector proteins [8] [9]. This complex language of histone modifications, often referred to as the "histone code," dictates the transcriptional state of local genomic regions and can be deciphered genome-wide using Chromatin Immunoprecipitation followed by sequencing (ChIP-seq) [10] [9].
ChIP-seq has become the method of choice for profiling histone modifications and transcription factor binding sites. The technique involves crosslinking proteins to DNA in living cells, fragmenting the chromatin, immunoprecipitating the protein-DNA complexes with specific antibodies, and then sequencing the associated DNA [10]. For the study of primary cells and tissues, which are often limited in quantity, optimized microscaled ChIP-seq protocols have been developed that can generate high-quality profiles from as little as 10,000 to 100,000 cells [11]. This application note details the key activating and repressive histone marks—H3K4me3, H3K27ac, H3K27me3, and H3K9me3—within the context of ChIP-seq for primary cell research, providing detailed protocols, data standards, and visualization tools for the scientific and drug development communities.
Functional Annotation of Key Histone Marks
Histone modifications encode specific functional information depending on the modified residue and the type of modification. The table below summarizes the core functions and genomic locations of the key histone marks discussed in this application note.
Table 1: Functional annotation of key histone modifications
| Histone Modification | Function | Primary Genomic Location | Associated Chromatin State |
|---|---|---|---|
| H3K4me3 | Transcriptional activation [9] | Promoters [8] [9] | Euchromatin [9] |
| H3K27ac | Transcriptional activation [9] | Active enhancers and promoters [9] | Euchromatin [9] |
| H3K36me3 | Transcriptional activation [9] | Gene bodies [10] [9] | Euchromatin [9] |
| H3K27me3 | Transcriptional repression [10] [9] | Promoters in gene-rich regions [10] [9] | Facultative heterochromatin [10] |
| H3K9me3 | Transcriptional repression [10] [9] | Satellite repeats, telomeres, pericentromeres [9] | Constitutive heterochromatin [9] |
Activating Marks
- H3K4me3 (Histone H3 Lysine 4 trimethylation): This is a highly conserved mark associated with the transcription start sites (TSSs) of genes that are either actively transcribed or poised for transcription [8]. Its presence is a hallmark of promoter regions and is a key signal used in genome annotation efforts [8].
- H3K27ac (Histone H3 Lysine 27 acetylation): This mark distinguishes active enhancers and promoters from their inactive or poised counterparts [9]. Unlike H3K4me3, H3K27ac is not a permanent signal but is dynamically regulated in response to cellular cues and is a strong indicator of regulatory element activity.
- H3K36me3 (Histone H3 Lysine 36 trimethylation): This modification is enriched across the transcribed regions or "bodies" of active genes [10] [9]. It is deposited during transcription elongation and is linked to mRNA processing and the prevention of spurious transcription initiation from within gene bodies.
Repressive Marks
- H3K27me3 (Histone H3 Lysine 27 trimethylation): Mediated by the Polycomb Repressive Complex 2 (PRC2), this mark is a temporary, developmentally regulated repressive signal [9]. It is crucial for silencing developmental regulators, including Hox and Sox genes, in embryonic stem cells and is typically found in facultative heterochromatin in gene-rich regions [10] [9].
- H3K9me3 (Histone H3 Lysine 9 trimethylation): This mark is a permanent signal for constitutive heterochromatin formation in gene-poor regions [9]. It plays a vital role in silencing repetitive elements such as satellite repeats, telomeres, and pericentromeres, thereby maintaining genomic stability [9].
The following diagram illustrates the canonical genomic locations and opposing functions of these key histone marks.
ChIP-Seq Experimental Framework for Primary Cells
Conducting robust ChIP-seq experiments on primary cells, which are often scarce, requires a meticulously optimized and scalable protocol. The following section outlines a semiautomated, microscaled framework that reduces technical variability and enables profiling with limited cell inputs [11].
Reagent and Material Solutions
Table 2: Essential research reagents for ChIP-seq in primary cells
| Reagent/Material | Function/Application | Examples & Notes |
|---|---|---|
| Crosslinking Reagent | Crosslinks proteins to DNA in living cells [11]. | Formaldehyde (37%); crosslinking time is critical [11]. |
| ChIP-Grade Antibodies | Immunoprecipitation of specific histone marks [10]. | Must be validated for specificity [12]; e.g., CST #9751S for H3K4me3 [10]. |
| Magnetic Beads | Capture of antibody-protein-DNA complexes [11]. | Protein A/G beads; enable automation and reduce hands-on time [11]. |
| Chromatin Shearing Kit | Fragmentation of crosslinked chromatin [11]. | Sonication is most common; optimized lysis buffers included [11]. |
| Library Prep Kit | Preparation of sequencing libraries from ChIP DNA [11]. | Often includes tagmentation enzymes for faster workflows (ChIPmentation) [11]. |
| Protease Inhibitors | Prevention of protein degradation during isolation [11]. | Added fresh to all buffers (e.g., PMSF, Aprotinin, Leupeptin) [10]. |
| Sodium Butyrate | Inhibition of histone deacetylases (HDACs) [11]. | Preserves acetylation marks like H3K27ac during processing [11]. |
Semiautomated ChIP-Seq Protocol
The protocol below is adapted for a semiautomated system using a ChIP liquid-handler, enabling the parallel processing of up to 48 samples with minimal hands-on time and high reproducibility [11]. The workflow from cell fixation to sequencing library preparation is summarized in the following diagram.
Cell Fixation and Chromatin Preparation
- Cell Fixation: For a cell suspension of 1-2 × 10^6 cells/mL, add formaldehyde (1:10 vol:vol) to a final concentration of 1% and rotate for 10 minutes at room temperature [11]. Quench the crosslinking reaction by adding 2.5M glycine (1:20 vol:vol) and incubate on ice for 5 minutes [11].
- Cell Lysis and Chromatin Shearing: Pellet the fixed cells and resuspend in a complete lysis buffer. Transfer the suspension to a low-binding tube and sonicate using a focused ultrasonicator. A typical shearing program consists of multiple cycles (e.g., 6-10 cycles, validated per cell type) of 16 seconds ON and 32 seconds OFF per cycle to achieve an optimal fragment size of 200-500 bp [8] [11].
- Shearing Efficiency Check: Centrifuge the sonicated samples and transfer the supernatant. Decrosslink a small aliquot (equivalent to ~250 ng of chromatin) with RNase A and proteinase K. Analyze the DNA fragment size distribution on a 1.2% agarose gel to confirm a successful smear centered around 250 bp [11]. Quantify the sheared chromatin using a fluorescence-based assay and aliquot for storage at -80°C [11].
Automated Chromatin Immunoprecipitation
This protocol is designed for a ChIP liquid-handler, which automates the immunoprecipitation and washing steps, drastically reducing variability [11].
- Chromatin Input Preparation: Thaw chromatin aliquots on ice. For each sample, dilute 500 ng of sheared chromatin in a total volume of 200 μL of complete tC1 buffer (supplemented with protease inhibitors and 20 mM sodium butyrate) in a ChIP 8-tube strip [11].
- Antibody Preparation: Dilute the ChIP-validated antibody in tBW1 buffer to a concentration that delivers 0.5 μg of antibody per immunoprecipitation reaction [11].
- Automated Immunoprecipitation: The liquid handler performs the subsequent steps: it adds the antibody solution to the chromatin, incubates the mixture to form complexes, and then adds magnetic protein A/G beads to capture the complexes. The system then performs a series of automated washes with different buffers to remove non-specifically bound DNA [11].
- Decrosslinking and DNA Elution: After the final wash, the protein-DNA complexes are eluted from the beads. The eluate is decrosslinked by incubating with proteinase K, and the ChIP DNA is purified using a standard PCR purification kit [11].
Library Preparation and Sequencing
- Library Preparation via Tagmentation: The purified ChIP DNA is used to prepare sequencing libraries. The protocol utilizes a "ChIPmentation" step, where a Tn5 transposase simultaneously fragments and ligates adapters to the ChIP DNA, significantly streamlining the library prep process [11].
- Library Amplification and QC: The tagmented DNA is amplified with a limited number of PCR cycles using indexed primers. The final libraries are purified and quantified. Their quality and size distribution should be assessed, for example, on a Bioanalyzer, before sequencing [11].
- Sequencing Depth Recommendations: The required sequencing depth depends on the nature of the histone mark. According to ENCODE standards, for broad marks like H3K27me3 and H3K9me3, a minimum of 45 million usable fragments per replicate is required. For narrow marks like H3K4me3 and H3K27ac, a minimum of 20 million fragments per replicate is standard [12].
Quality Control and Data Analysis Standards
Rigorous quality control is paramount for generating reliable and interpretable ChIP-seq data, especially in large-scale studies involving primary cells.
Key Quality Control Metrics
The ENCODE consortium has established stringent quality metrics for ChIP-seq data [12].
Table 3: Essential quality control metrics for ChIP-seq data
| QC Metric | Description | ENCODE Preferred Value |
|---|---|---|
| NRF (Non-Redundant Fraction) | Measures library complexity [12]. | > 0.9 [12] |
| PBC1 (PCR Bottlenecking Coefficient 1) | Measures library complexity based on unique locations [12]. | > 0.9 [12] |
| PBC2 (PCR Bottlenecking Coefficient 2) | Measures library complexity based on read positions [12]. | > 10 [12] |
| FRiP (Fraction of Reads in Peaks) | Measures signal-to-noise ratio [12]. | Varies by mark; e.g., >0.72 for H3K9me3 [13] |
| IDR (Irreproducible Discovery Rate) | Measures replicate concordance for peaks [12]. | Rescue/Self-consistency ratios < 2 [12] |
ChIP-Seq Analysis Pipeline
The ENCODE Histone ChIP-seq pipeline provides a standardized method for data analysis. The key steps include [12]:
- Mapping: Sequencing reads are aligned to a reference genome (e.g., GRCh38 for human).
- Signal Tracking: Two nucleotide-resolution signal tracks are generated: fold-change over control and a p-value track based on the null hypothesis that the signal is present in the control [12].
- Peak Calling: For histone marks, a "relaxed" set of peaks is called, which is then used for subsequent statistical comparison of biological replicates. The final output is a set of replicated peaks identified through either true biological replicates or pseudoreplicates [12].
Advanced and Emerging Technologies
While ChIP-seq remains a gold standard, new methods are emerging that offer unique insights. Single-cell multi-omic technologies represent the cutting edge of epigenetic analysis. For instance, scEpi2-seq is a novel technique that enables the simultaneous detection of histone modifications and DNA methylation in the same single cell [13]. This method uses a pA-MNase fusion protein targeted by antibodies to specific histone marks, followed by TET-assisted pyridine borane sequencing (TAPS) for methylation detection [13]. Application of this technology has revealed how DNA methylation maintenance is influenced by the local chromatin context, such as the characteristically low methylation levels within H3K27me3 and H3K9me3 domains compared to H3K36me3-marked regions [13]. Such tools are poised to revolutionize our understanding of epigenetic interplay in complex primary cell populations.
The genomic DNA of eukaryotic cells is packaged into chromatin, whose fundamental repeating unit is the nucleosome—an octamer of core histone proteins (H2A, H2B, H3, and H4) around which approximately 147 base pairs of DNA are wrapped [14]. The N-terminal tails of these histone proteins undergo dynamic post-translational modifications (PTMs) that constitute a major component of the epigenetic machinery, regulating DNA-templated processes without altering the underlying DNA sequence [14]. These histone modifications, including acetylation, methylation, phosphorylation, and ubiquitylation, form a "histone code" that dictates the transcriptional state of local genomic regions by directly altering chromatin structure or by recruiting effector proteins [14] [9]. The enzymatic regulators of this code include "writer" complexes that add modifications, "eraser" enzymes that remove them, and "reader" proteins that recognize specific marks and translate them into functional outcomes [14]. Dysregulation of these processes has been intimately associated with diseases such as cancer, making the precise characterization of histone PTMs essential for understanding both normal biology and disease pathogenesis [14] [15].
This application note details how specific histone modifications are systematically mapped to distinct genomic regulatory elements—promoters, enhancers, and gene bodies—using chromatin immunoprecipitation followed by sequencing (ChIP-seq) and related technologies. We focus specifically on methodologies optimized for primary cells, where material is often limited, and frame our protocols within the broader context of drug discovery and development research, where understanding the epigenetic landscape offers novel therapeutic opportunities.
Histone Modification Signatures Define Functional Genomic Elements
Specific combinations of histone modifications create a chromatin environment that predicts the function of the underlying genomic sequence. Table 1 summarizes the primary histone marks used to identify promoters, enhancers, and gene bodies.
Table 1: Key Histone Modifications and Their Genomic Locations
| Histone Modification | Genomic Function | Primary Genomic Location | Associated State |
|---|---|---|---|
| H3K4me3 [9] | Transcriptional Activation | Promoters [9] | Active / Poised |
| H3K27ac [16] [17] | Transcriptional Activation | Enhancers, Promoters [16] [17] | Active |
| H3K4me1 [16] [9] | Enhancer Marking | Enhancers [16] [9] | Primed / Active |
| H3K27me3 [9] | Transcriptional Repression | Promoters [9] | Polycomb-Repressed |
| H3K9me3 [9] | Transcriptional Repression | Heterochromatin [9] | Constitutively Silenced |
| H3K36me3 [9] | Transcriptional Elongation | Gene Bodies [9] | Actively Transcribed |
| H2B N-terminus ac (H2BNTac) [17] | Enhancer Marking (CBP/p300-specific) | Active Enhancers [17] | Active |
Promoters
Active promoters are typically characterized by a high abundance of H3K4me3 and histone acetylation marks, such as H3K9ac and H3K27ac [9]. The trimethylation of H3K4 is catalyzed by the MLL/COMPASS family of methyltransferases and is recognized by readers that facilitate an open chromatin state. Notably, some active promoters, particularly those of ubiquitously expressed "housekeeping" genes, can be distinguished from enhancers by their lower enrichment for certain marks like H2B N-terminus multisite lysine acetylation (H2BNTac), which is more specific to enhancers and a subset of promoters regulated by CBP/p300 [17]. Repressed promoters, particularly those of developmental genes in stem cells, are often marked by H3K27me3, deposited by the Polycomb Repressive Complex 2 (PRC2) [9].
Enhancers
Enhancers are distal cis-regulatory elements that stimulate gene expression from a distance. Active enhancers display a characteristic chromatin signature including an open conformation, enrichment of H3K4me1, and acetylation of H3K27 (H3K27ac) [16]. The monomethyltransferase MLL3/4 is primarily responsible for placing H3K4me1 at enhancers, while the histone acetyltransferases CBP/p300 catalyze H3K27ac [16]. Recent research has established H2B N-terminus multisite lysine acetylation (H2BNTac) as a highly specific signature of active enhancers, outperforming H3K27ac in predicting CBP/p300 target genes and enhancer strength [17]. Two mechanisms underlie this specificity: H2BNTac is directly catalyzed by CBP/p300, and H2A-H2B dimers undergo rapid exchange during transcription-coupled nucleosome remodeling, making this a dynamic mark of enhancer activity [17].
Gene Bodies
The regions within transcribed genes, or gene bodies, are marked by modifications associated with transcriptional elongation. H3K36me3 is a well-established mark that is enriched across the transcribed regions of active genes [9]. This trimethylation, mediated by methyltransferases like SETD2, is involved in coordinating mRNA processing and preventing spurious initiation from cryptic promoters within the gene body.
Experimental Protocols for Mapping Histone Modifications
Chromatin Immunoprecipitation Followed by Sequencing (ChIP-seq)
ChIP-seq is the gold-standard method for genome-wide mapping of histone modification landscapes [18] [19]. The protocol involves cross-linking proteins to DNA, fragmenting chromatin, immunoprecipitating the protein-DNA complex with an antibody specific to a histone mark, and then sequencing the associated DNA.
Diagram: ChIP-seq Workflow for Histone Modifications
A critical challenge, especially in primary cell research, is the large number of cells required for standard ChIP-seq protocols. To address this, carrier ChIP-seq (cChIP-seq) has been developed. This robust, small-scale method uses a DNA-free recombinant histone carrier (e.g., recombinant H3 with a specific modification) to maintain an optimal working scale for the immunoprecipitation reaction, eliminating the need to re-optimize antibody and bead ratios for limited cell numbers [20]. The cChIP-seq protocol enables high-quality epigenomic mapping from as few as 10,000 cells, with results equivalent to reference maps generated from tens of millions of cells [20].
Advanced and Integrated Methodologies
Micro-C-ChIP combines Micro-C (an MNase-based version of Hi-C) with chromatin immunoprecipitation to map 3D genome organization at nucleosome resolution for defined histone modifications [21]. This method reveals how genomic elements marked by specific histone modifications, such as H3K4me3-marked promoters and H3K27me3-marked repressed domains, interact in three-dimensional space, providing a more functional context for the histone mark [21].
siQ-ChIP (sans spike-in Quantitative ChIP) introduces an absolute, physical quantitative scale for ChIP-seq data without requiring spike-in reagents [3]. This method is based on the equilibrium binding reaction in the IP of chromatin fragments, allowing for direct comparison of histone modification abundance across samples and conditions. This is particularly valuable in drug discovery for precisely quantifying changes in the epigenome following therapeutic treatment [3].
The Scientist's Toolkit: Essential Research Reagents and Materials
Successful ChIP-seq for histone modifications relies on a suite of specific reagents and tools. The following table details key solutions for researchers designing such experiments.
Table 2: Research Reagent Solutions for Histone Modification ChIP-seq
| Research Reagent | Function / Application | Examples / Notes |
|---|---|---|
| Histone Modification-Specific Antibodies [17] [20] | Immunoprecipitation of specific histone PTMs; Critical for ChIP-seq specificity. | Validate for specificity (e.g., check for cross-reactivity [17]); Common targets: H3K4me3, H3K27ac, H3K27me3, H2BK5ac. |
| Recombinant Histone Carrier [20] | Enables ChIP from limited cell numbers (e.g., 10,000 cells) in cChIP-seq. | DNA-free recombinant histone (e.g., recH3K4me3); Prevents unwanted carrier DNA in sequencing libraries. |
| CBP/p300 Inhibitor (A-485) [17] | Pharmacological inhibition to study functional role of specific histone acetyltransferases. | Validates CBP/p300-specific marks like H3K27ac and H2BNTac; Tool for probing enhancer mechanisms. |
| Chromatin Fragmentation Enzyme (MNase) [21] | Digests chromatin to nucleosome-resolution fragments; Used in Micro-C-ChIP. | Superior to sonication for nucleosome-scale resolution in 3D genome mapping. |
| Quantitative ChIP Normalization Tools (siQ-ChIP) [3] | Enables absolute quantification of histone PTM abundance from ChIP-seq data without spike-ins. | Uses inherent properties of the IP reaction and sequencing data to establish a physical quantitative scale. |
| Mass Spectrometry Platforms [14] [15] | Unbiased identification and quantification of histone PTMs, including novel modifications. | Used for creating quantitative atlases of histone modifications across cell types or disease states. |
Data Analysis and Interpretation: From Sequencing Reads to Biological Insight
Following sequencing, the resulting reads are aligned to a reference genome. "Peak calling" algorithms are then used to identify genomic regions with significant enrichment of sequenced fragments compared to a background control (input DNA) [19]. For histone marks with sharp, punctate distributions like H3K4me3, peak locations directly indicate putative promoters. For broader marks like H3K27me3, specialized tools are required to define large repressive domains.
After peak calling, the data is interpreted in the context of known genomic annotations (e.g., using gene ontology analysis) and integrated with other datasets such as RNA-seq to correlate histone modification states with gene expression outcomes. As shown in Table 1, the combination of marks is highly informative. For example, a promoter with both H3K4me3 (activation-associated) and H3K27me3 (repression-associated) is considered "bivalent" – poised for activation upon the right developmental cue [9]. The relationship between histone modifications and the 3D structure of the genome is crucial, as enhancers often loop to physically contact their target promoters to stimulate expression [16] [21]. Methodologies like Micro-C-ChIP directly probe these relationships.
Diagram: Integrating Histone Marks to Annotate Functional Genomic Elements
The precise mapping of histone modifications to genomic regulatory elements is a cornerstone of modern epigenetics research. ChIP-seq and its advanced derivatives, such as cChIP-seq for limited primary cells and Micro-C-ChIP for 3D chromatin structure, provide powerful tools to decipher the functional histone code. The emergence of quantitative methods like siQ-ChIP and highly specific marks like H2BNTac for enhancers further refines our ability to model gene regulatory networks. For researchers in drug development, these protocols and insights offer a pathway to identify novel epigenetic drivers of disease and to characterize the mechanism of action of epigenetic therapies, ultimately enabling more targeted and effective treatments.
Why Primary Cells? Capting Authentic Biology Beyond Cell Line Artifacts
In the field of epigenetics research, Chromatin Immunoprecipitation followed by sequencing (ChIP-seq) has become a foundational methodology for mapping histone modifications and transcription factor binding across the genome [5]. The integrity of this research hinges on the cellular models used. While immortalized cell lines are common, primary cells—isolated directly from living tissue—provide a biologically relevant system that maintains the authentic epigenetic landscape of the source tissue, making them superior for capturing in vivo biology [22]. This application note details the critical advantages of primary cells in histone modification studies and provides standardized protocols for robust ChIP-seq in these models.
The Critical Role of Primary Cells in Epigenetic Research
Biological Relevance and Authenticity
Primary cells are isolated directly from tissue sources and have a finite lifespan in culture. Unlike cell lines that undergo genetic and epigenetic drift to achieve immortality, primary cells retain the morphological characteristics, gene expression profiles, and signaling pathways of their tissue of origin [22]. This preservation is paramount for epigenetics, as the chromatin landscape is a direct reflection of a cell's differentiation state, environmental exposure, and physiological function.
For histone modification studies, this authenticity translates to:
- Native patterns of histone post-translational modifications (HPTMs) such as H3K27ac, H3K4me3, and H3K27me3.
- Physiologically relevant relationships between transcription factors, chromatin remodelers, and histone modifiers.
- Accurate modeling of how disease states or drug treatments alter the epigenome in a native context.
Limitations of Cell Lines in Epigenomics
Immortalized cell lines, while convenient and easy to propagate, often accumulate genetic mutations and undergo colonial selection, leading to altered phenotypes that may not represent the original tissue [22]. In the context of ChIP-seq, this can manifest as:
- Global shifts in histone modification levels due to aberrant expression of histone-modifying enzymes.
- Erasure of tissue-specific enhancer and promoter marks, skewing binding profiles.
- Compromised biological conclusions with limited clinical translatability.
Table 1: Primary Cells vs. Cell Lines for ChIP-seq Research
| Parameter | Primary Cells | Cell Lines |
|---|---|---|
| In Vivo Characteristics | Retained [22] | Often Lost [22] |
| Genetic & Epigenetic Drift | Low [22] | High (due to immortalization and long-term culture) [22] |
| Donor Variability | Captures natural biological diversity [22] | Single genetic background |
| Ideal Use Case | Disease modeling, drug discovery, personalized medicine [22] | Method development, large-scale pilot screens |
Optimized ChIP-seq Workflow for Primary Cells
The following diagram illustrates the core ChIP-seq workflow, highlighting steps that require special consideration when using primary cells.
Detailed Protocol: Histone Modification ChIP-seq in Primary Cells
Key Reagents:
- Crosslinking Reagent: Formaldehyde solution (37%) [10].
- Lysis Buffers: Cell Lysis Buffer (5 mM PIPES pH 8, 85 mM KCl, 1% igepal) and Nuclei Lysis Buffer (50 mM Tris-HCl pH 8, 10 mM EDTA, 1% SDS), supplemented with fresh protease inhibitors [10].
- ChIP-Grade Antibodies: Validate antibodies for specificity. Examples include H3K27me3 (CST #9733S) and H3K4me3 (CST #9751S) [10].
- Magnetic Beads: Protein A/G magnetic beads for immunoprecipitation.
Step-by-Step Procedure:
Cell Harvest & Crosslinking
Chromatin Preparation & Fragmentation
- Lyse cells in Cell Lysis Buffer to isolate nuclei.
- Resuspend nuclei in Nuclei Lysis Buffer.
- Sonication: Shear chromatin to an average fragment size of 200-500 bp using a focused ultrasonicator (e.g., Bioruptor). Optimization Note: The shearing efficiency is influenced by local chromatin structure, with active functional regions often being more sensitive [23].
Immunoprecipitation (IP)
- Dilute sheared chromatin 10-fold in IP Dilution Buffer.
- Incubate with 1-5 µg of target-specific, validated antibody overnight at 4°C with rotation.
- Add Protein A/G magnetic beads and incubate for 2 hours.
- Wash beads sequentially with Low Salt, High Salt, and LiCl Immune Complex Wash Buffers, followed by a TE Buffer wash.
DNA Elution & Purification
- Elute ChIP DNA from beads with Elution Buffer (1% SDS, 50 mM NaHCO3).
- Reverse crosslinks by incubating at 65°C for 4-6 hours (or overnight).
- Treat with RNase A and Proteinase K.
- Purify DNA using a PCR purification kit (e.g., QIAquick from QIAGEN) [10].
Library Preparation & Sequencing
- Construct sequencing libraries from the purified ChIP DNA using a commercial kit compatible with your sequencing platform (e.g., Illumina).
- The ENCODE Consortium recommends a minimum of 20 million usable fragments for narrow histone marks (like H3K4me3) and 45 million for broad marks (like H3K27me3) per replicate [4].
Advanced Quantitative Normalization: The PerCell Spike-In Method
A significant challenge in ChIP-seq is the quantitative comparison of signal between samples. The PerCell method enables this by using a cellular spike-in from a closely related orthologous species (e.g., mouse chromatin in human cells) [5].
- Workflow: Mix a fixed ratio of primary cells with spike-in cells (e.g., 3:1 human:mouse) prior to sonication.
- Advantage: This controls for technical variations in chromatin fragmentation, IP efficiency, and library preparation, allowing for highly quantitative comparisons of histone modification abundance across experimental conditions [5].
- Bioinformatic Analysis: A dedicated Nextflow pipeline separates sequencing reads by species and uses the spike-in reads for internal normalization [5].
Application in Drug Discovery & Development
Chromatin mapping is increasingly critical in pharmaceutical research for identifying disease mechanisms and monitoring drug responses [24]. Primary cells are indispensable for this, as shown in the following case study.
Case Study: Defining a New Drug Mechanism in Cancer [24]
- Challenge: Understand how the chemotherapeutic drug Eribulin modulates the epithelial-to-mesenchymal transition (EMT) in aggressive triple-negative breast cancer (TNBC).
- Method: CUT&RUN (a low-input, high-resolution chromatin profiling assay) was performed on primary patient-derived xenograft models and patient samples to map the transcription factor ZEB1.
- Finding: Eribulin disrupted the interaction between ZEB1 and SWI/SNF chromatin remodelers, reducing ZEB1 binding at EMT genes.
- Impact: This chromatin-level finding explained the observed sensitization of tumors to chemotherapy, highlighting how epigenetic profiling in primary systems can uncover mechanisms of therapeutic resistance and inform drug development [24].
The Scientist's Toolkit: Essential Research Reagent Solutions
Table 2: Key Reagents for Primary Cell ChIP-seq
| Reagent / Solution | Function / Application | Examples & Notes |
|---|---|---|
| Cryopreserved Primary Cells | Provides a reliable, consistent source of biologically relevant cells; avoids challenges of self-isolation. | Commercially sourced (e.g., Lonza); allows selection based on donor demographics (age, health status) [22]. |
| Specialized Cell Culture Media | Supports growth and retention of phenotypic markers in primary cells. | Formulated media (e.g., Lonza's BulletKit) containing growth factors and hormones tailored to specific cell types [22]. |
| Validated ChIP-Grade Antibodies | Specifically immunoprecipitates the target histone modification or protein. | Essential for success; use antibodies characterized for ChIP-seq (e.g., ENCODE Consortium standards) [10] [4]. |
| Chromatin Shearing Reagents | Fragments chromatin to appropriate size for sequencing. | Focused ultrasonicator (e.g., Bioruptor) or enzymatic kits. Requires optimization for each primary cell type. |
| PerCell Spike-in Reagents | Enables quantitative normalization between ChIP-seq samples. | Orthologous cells (e.g., mouse for human studies) mixed at a fixed ratio prior to sonication [5]. |
| Library Preparation Kits | Prepares the immunoprecipitated DNA for high-throughput sequencing. | Select kits compatible with low DNA input, a common scenario with precious primary cell samples. |
The use of primary cells in ChIP-seq for histone modification analysis is no longer just a best practice—it is a necessity for research that aims to deliver clinically and biologically meaningful insights. By retaining the authentic epigenome of their tissue of origin, primary cells enable accurate disease modeling, reliable drug mechanism discovery, and the development of personalized treatment strategies. Coupled with robust, quantitative protocols like the PerCell method, primary cell ChIP-seq provides a powerful platform for advancing our understanding of epigenetic regulation in health and disease.
Chromatin Immunoprecipitation followed by sequencing (ChIP-seq) has become the foundational method for identifying protein-DNA interactions and mapping histone modifications across the genome. This technology enables researchers to capture a snapshot of the chromatin state by precisely determining where DNA-associated proteins, including post-translationally modified histones, bind to the genomic DNA. The fundamental principle of ChIP-seq involves the selective immunoprecipitation of protein-bound DNA fragments, which are then sequenced and mapped to the reference genome to identify enriched regions. Since its emergence in 2007, ChIP-seq has revolutionized our understanding of chromatin biology by providing high-resolution maps of epigenetic landscapes that govern gene expression patterns in development, disease, and cellular differentiation.
For researchers investigating histone modifications in primary cells, ChIP-seq offers the critical ability to decipher the epigenetic code that defines cell identity and function. The technique has been extensively utilized by large consortia such as ENCODE and Roadmap Epigenomics to create reference epigenomic profiles across diverse cell types and tissues. These maps reveal how histone modifications encode functional elements across the genome, from active promoters marked by H3K4me3 to enhancers marked by H3K27ac and repressed domains marked by H3K27me3. The continuous methodological advancements in ChIP-seq protocols have progressively enhanced its application to rare cell populations, including primary cells with limited availability, making it an indispensable tool for modern epigenetic research in biologically relevant systems [25] [26].
Fundamental Principles and Workflow
The core ChIP-seq protocol involves a series of carefully optimized steps designed to preserve authentic protein-DNA interactions while minimizing technical artifacts. The fundamental workflow can be divided into six major stages, each critical for obtaining high-quality data that accurately reflects the in vivo chromatin state.
Key Experimental Steps
Crosslinking: Cells are treated with formaldehyde to create covalent bonds between DNA and its associated proteins, thereby preserving these interactions through subsequent processing steps. The crosslinking time must be optimized to balance sufficient fixation with excessive crosslinking that can mask epitopes or reduce DNA accessibility [26].
Cell Lysis and Chromatin Fragmentation: Cells are lysed, and chromatin is fragmented into manageable sizes, typically 200-600 base pairs. While sonication is most commonly used, alternative enzymatic approaches (e.g., MNase digestion) can provide more uniform fragmentation, particularly for nucleosome-based studies [13] [26].
Immunoprecipitation: The fragmented chromatin is incubated with a specific antibody targeting the protein or histone modification of interest. Antibody-bound complexes are then captured using magnetic beads or other solid supports. The antibody specificity is arguably the most critical factor determining experimental success, as non-specific antibodies can generate substantial false-positive signals [26] [4].
Crosslink Reversal and DNA Purification: The immunoprecipitated DNA-protein complexes are heated to reverse the formaldehyde crosslinks, and proteins are degraded, leaving the purified DNA fragments for downstream processing.
Library Preparation and Sequencing: The purified DNA fragments undergo library preparation where sequencing adapters are added, followed by high-throughput sequencing to generate short reads that represent the ends of immunoprecipitated fragments [26].
Computational Analysis: The sequenced reads are aligned to a reference genome, and regions of significant enrichment (peaks) are identified through specialized algorithms that compare ChIP signals to input controls [4].
Visualizing the ChIP-seq Workflow
The following diagram illustrates the complete ChIP-seq workflow from cell preparation to data analysis:
Essential Research Reagents and Materials
Successful ChIP-seq experiments require carefully selected reagents and materials, each serving specific functions in the multi-step protocol. The table below details the essential components of a ChIP-seq experiment and their critical roles in capturing an accurate chromatin snapshot.
Table 1: Essential Research Reagents for ChIP-seq Experiments
| Reagent/Material | Function | Considerations for Histone Modifications |
|---|---|---|
| Specific Antibody | Binds the target protein or histone modification for immunoprecipitation | Must be validated for ChIP; quality varies even between lots of the same antibody [26] |
| Formaldehyde | Crosslinks proteins to DNA to preserve in vivo interactions | Crosslinking time must be optimized; over-crosslinking can mask epitopes [26] |
| Magnetic Beads | Solid support for antibody capture and washing | Protein A/G beads most common; efficiency affects background noise |
| MNase or Sonication | Fragments chromatin to appropriate sizes | MNase preserves nucleosome structure; sonication is more general [13] |
| Sequencing Adapters | Enable amplification and sequencing of IP'd DNA | Compatibility with sequencing platform essential |
| Input DNA | Control for background signal and open chromatin | Matched control from same cell type without IP [4] |
For histone modification studies, antibody validation is particularly crucial. The ENCODE consortium has established rigorous standards for antibody characterization, including immunoblot analysis, peptide binding tests, and demonstration of expected genome annotation enrichments. Primary cells present additional challenges due to their limited availability and potential heterogeneity, making efficient library preparation methods essential. Techniques such as linear amplification (LinDA) have been successfully applied to as few as 10,000 cells for abundant histone marks like H3K4me3, enabling epigenetic profiling of rare cell populations [26] [4].
Quality Control and Data Standards
Rigorous quality control is essential for generating biologically meaningful ChIP-seq data, particularly when working with primary cells where sample availability may be limited. The ENCODE consortium has established comprehensive standards for ChIP-seq experiments that serve as benchmarks for the field. These standards address key aspects of experimental design, sequencing depth, and data quality metrics.
Key Quality Metrics
The following metrics are essential for evaluating ChIP-seq data quality, with specific thresholds for histone modification studies:
Table 2: ChIP-seq Quality Control Metrics and Standards
| Quality Metric | Description | Recommended Threshold |
|---|---|---|
| FRiP (Fraction of Reads in Peaks) | Proportion of sequenced reads falling in called peaks | >1% for transcription factors; >5-30% for histone marks [4] |
| NRF (Non-Redundant Fraction) | Measure of library complexity | >0.9 (indicates minimal PCR amplification bias) [4] |
| PBC (PCR Bottlenecking Coefficient) | Additional measure of library complexity | PBC1 >0.9; PBC2 >10 (indicates sufficient sequencing depth) [4] |
| Cross-correlation | Correlation between Watson and Crick strand signals | High enrichment indicates specific binding |
| Replicate Concordance | Consistency between biological replicates | >75% overlap between peak calls from two replicates [26] |
Sequencing Depth Requirements
The required sequencing depth varies significantly depending on the nature of the histone modification being studied. Narrow marks like H3K4me3 and H3K27ac typically require 20-40 million usable fragments per replicate, while broad marks like H3K27me3 and H3K36me3 require 45 million usable fragments per replicate due to their extensive genomic distribution. H3K9me3 represents a special case as it is enriched in repetitive regions, requiring careful interpretation as many reads map to non-unique genomic locations [4].
For studies involving primary cells, where biological material may be limited, the ENCODE standards permit the use of pseudoreplicates when true biological replicates are not feasible. In this approach, reads from a single experiment are randomly partitioned, and peak calling is performed on each partition to assess reproducibility. However, true biological replicates remain the gold standard for robust identification of chromatin states [4].
Advanced Applications and Protocol Variations
The standard ChIP-seq protocol has been adapted and enhanced to address specific research challenges, particularly for studying histone modifications in complex biological systems. These advanced applications have significantly expanded the utility of ChIP-seq in primary cell research.
Single-Cell and Low-Input Methods
Traditional ChIP-seq requires substantial cell numbers (typically millions), limiting its application to rare cell populations. Low-input protocols have been developed to address this limitation. The Nano-ChIP-seq protocol successfully profiles histone modifications like H3K4me3 with as few as 10,000 cells, while linear amplification-based approaches (LinDA) have been applied to 10,000 cells for H3K4me3 profiling. These techniques employ specialized amplification methods to maintain representation while minimizing biases, enabling epigenetic profiling of rare primary cell types [26].
More recently, single-cell ChIP-seq methods have emerged, though they remain technically challenging. These approaches are complemented by alternative techniques such as CUT&RUN and CUT&Tag, which provide high signal-to-noise ratios at lower sequencing depths by using protein A-MNase or protein A-Tn5 transposase fusions targeted to specific histone modifications by antibodies. These methods are particularly valuable for primary cell studies where material is limited [13] [25].
Multi-Omic Approaches
The development of methods that simultaneously capture multiple epigenetic layers represents a major advancement. scEpi2-seq enables joint profiling of histone modifications and DNA methylation in single cells by leveraging TET-assisted pyridine borane sequencing (TAPS). This approach reveals how different epigenetic marks interact to regulate chromatin states, providing insights into epigenetic interactions during cell type specification in systems like the mouse intestine [13].
Enhanced Resolution Methods
ChIP-exo utilizes lambda exonuclease to digest protein-bound DNA to a fixed distance from bound proteins, achieving single-basepair resolution—a 90-fold improvement over standard ChIP-seq. This method also significantly increases the signal-to-noise ratio (40-fold improvement), reducing background signal and enabling more precise mapping of histone modification boundaries [26].
Data Analysis and Interpretation
The analysis of ChIP-seq data for histone modifications involves specialized computational approaches that account for the distinct characteristics of different epigenetic marks. The ENCODE consortium has developed separate pipelines for analyzing transcription factor binding (punctate signals) and histone modifications (which can be either punctate or broad).
Analysis Pipelines for Histone Modifications
The histone ChIP-seq pipeline is designed to resolve both punctate binding and longer chromatin domains. Key steps include:
Read Alignment: Processed reads are aligned to a reference genome, with removal of duplicates and poorly mapping reads.
Signal Tracking: Two versions of nucleotide-resolution signal coverage tracks are generated: fold-change over control and signal p-value.
Peak Calling: For replicated experiments, relaxed peak calls are generated for each replicate individually and for pooled replicates, with subsequent statistical comparison to identify reproducible peaks [4].
Differential Binding Analysis
Comparing histone modification patterns across biological conditions requires specialized differential analysis tools. A comprehensive assessment of 33 computational tools revealed that performance is strongly dependent on peak characteristics and biological context. For comparisons where equal fractions of regions show increased and decreased signals (e.g., different cell states), bdgdiff (MACS2), MEDIPS, and PePr showed the highest performance. However, tool selection should be guided by the specific histone mark and biological question [27].
Methods like MAnorm enable quantitative comparison by using common peaks between samples as an internal reference for normalization. This approach has shown strong correlation between quantitative binding differences and changes in expression of target genes, validating its utility for understanding functional epigenetic regulation [28].
ChIP-seq technology provides an powerful framework for capturing snapshots of chromatin states by mapping the genomic locations of histone modifications and chromatin-associated proteins. The continuous refinement of protocols—particularly those enabling application to limited cell numbers—has dramatically expanded the utility of ChIP-seq for studying primary cells, which represent physiologically relevant models for understanding epigenetic regulation in health and disease. When implemented with appropriate quality controls and analysis methods, ChIP-seq generates robust maps of the epigenetic landscape that reveal how histone modifications pattern the genome to regulate cellular identity and function. As the field advances, multi-omic approaches that simultaneously capture multiple epigenetic layers promise to provide increasingly comprehensive views of chromatin biology in primary cell systems.
A Robust ChIP-seq Workflow for Primary Cells: From Crosslinking to Sequencing
Quantitative Foundations for Experimental Design
Successful Chromatin Immunoprecipitation followed by sequencing (ChIP-seq) for histone modifications in primary cells requires meticulous upfront planning, with three parameters being particularly critical: cell number, cell viability, and antibody validation. These factors establish the foundation for generating reproducible, high-quality epigenomic data.
Table 1: Key Quantitative Standards for Histone ChIP-seq in Primary Cells
| Experimental Parameter | Minimum Requirement | Recommended Standard | Contextual Notes |
|---|---|---|---|
| Starting Cell Number | 0.5 - 1 million cells per IP [6] | 1 - 5 million cells [12] | Requirement increases with expected losses from cell sorting/tissue dissociation. |
| Cell Viability | >90% [6] | >95% | High viability is critical for chromatin integrity and to minimize background noise. |
| Sequencing Depth (Broad Marks) | 20 million fragments [12] | 45 million fragments [12] | Applies to H3K27me3, H3K36me3 [12]. |
| Sequencing Depth (Narrow Marks) | 10 million fragments [12] | 20 million fragments [12] | Applies to H3K27ac, H3K4me3, H3K9ac [12]. |
| Sequencing Depth (H3K9me3) | 45 million total mapped reads [12] | >45 million reads [12] | Exception due to enrichment in repetitive regions [12]. |
| Library Complexity (NRF) | >0.9 [12] | >0.9 [12] | Non-Redundant Fraction indicates library quality. |
| PCR Bottlenecking (PBC1) | >0.9 [12] | >0.9 [12] | Measures library complexity from sequence duplication. |
Detailed Experimental Protocols
Protocol 1: Cell Preparation and Viability Assessment for Primary Cells
This protocol is optimized for processing challenging primary tissue samples, such as formalin-fixed paraffin-embedded (FFPE) specimens, to obtain high-viability single-cell suspensions suitable for ChIP-seq.
Reagents and Materials:
- Primary tissue sample (e.g., FFPE lymph node tissue for nTFHL-AI lymphoma study [6])
- Dissociation buffer (e.g., containing collagenase)
- Fluorescence-Activated Cell Sorting buffer (PBS with low SDS concentration [6])
- DNase I
- Viability dye (e.g., Propidium Iodide)
- Antibodies for cell sorting (lineage-specific surface markers)
Procedure:
- Single-Cell Preparation: Mechanically dissociate the primary tissue sample and incubate with a dissociation buffer containing collagenase and DNase I to create a single-cell suspension [6].
- Heat-Assisted Antigen Retrieval: For FFPE samples, apply heat treatment to enhance antigen retrieval for subsequent fluorescent labeling [6].
- Fluorescent Labeling: Incubate cells with fluorescently-conjugated antibodies targeting specific cell surface markers to enable target cell population isolation.
- Viability Staining: Add a viability dye (e.g., Propidium Iodide) to distinguish live from dead cells.
- Cell Sorting: Using Fluorescence-Activated Cell Sorting, isolate the target population of live cells based on forward/side scatter properties, positive marker expression, and viability dye exclusion. Collect cells into ChIP-compatible buffer [6].
- Quality Control: Count sorted cells and reassess viability using a hemocytometer or automated cell counter. Confirm >90% viability before proceeding to crosslinking [6].
Protocol 2: Antibody Validation for Histone Modification ChIP-seq
This multi-tiered validation protocol ensures antibody specificity and performance for histone modification ChIP-seq applications, going beyond basic ChIP-qPCR validation.
Reagents and Materials:
- Candidate antibody for histone modification
- Isotype control antibody
- Input chromatin control
- Positive and negative control genomic loci
- Crosslinked chromatin from appropriate cell lines
- Protein A/G magnetic beads
- ChIP-seq library preparation kit
Procedure:
- Initial ChIP-qPCR Screening: Perform standard ChIP-qPCR validation across multiple known positive and negative control genomic loci to confirm basic target enrichment [29].
- Genome-Wide Sensitivity Assessment: Proceed to full ChIP-seq to analyze the signal-to-noise ratio of target enrichment across the entire genome. The antibody must provide a minimum number of defined enrichment peaks and pass a minimum signal-to-noise threshold compared to the input chromatin control [29].
- Motif and Pattern Analysis: For sequence-specific factors, perform motif analysis of enriched chromatin fragments. For histone modifications, confirm expected genomic distribution patterns (e.g., H3K27ac at enhancers, H3K4me3 at promoters) [29].
- Comparative Specificity Testing: Compare enrichment patterns using multiple antibodies against distinct epitopes of the same target protein or different subunits of the same multiprotein complex [29].
- Orthogonal Validation: Compare enrichment patterns to published ChIP-seq datasets (e.g., from ENCODE) generated using different antibodies for the same histone modification [29].
- Spike-In Controlled Experiments (Optional): For experiments measuring global histone modification changes, include spike-in controls from an ancestral species (e.g., Drosophila chromatin) to normalize for technical variations in ChIP efficiency [30].
Experimental Workflow Visualization
Research Reagent Solutions
Table 2: Essential Research Reagents for Histone ChIP-seq
| Reagent Category | Specific Examples | Function in Experiment | Validation Considerations |
|---|---|---|---|
| Crosslinkers | Formaldehyde (FA), Disuccinimidyl Glutarate (DSG) [31] | Stabilize protein-DNA interactions; DSG enhances capture of indirect binders [31]. | Dual-crosslinking (dxChIP-seq) improves signal for chromatin factors [31]. |
| Validated Antibodies | CST SimpleChIP validated antibodies [29] | Specifically target histone modifications for immunoprecipitation. | Must pass multi-step genomic validation including motif analysis and comparison to ENCODE data [29]. |
| Spike-In Controls | Drosophila chromatin (Active Motif, 53083) [30] | Normalize for technical variation between samples during massive changes. | Essential for experiments capturing global histone acetylation changes [30]. |
| Chromatin Shearing | Focused ultrasonicator, MNase [31] | Fragment chromatin to appropriate size (200-600 bp). | Optimized concentration and settings prevent over-fragmentation [31]. |
| Cell Sorting | FACS antibodies for specific lineages [6] | Isolate target cell populations from heterogeneous tissues. | Lineage-specific markers must be validated for target tissue. |
The rigorous application of these standards for cell number, viability, and antibody validation establishes a critical foundation for generating biologically meaningful ChIP-seq data from primary cells. By implementing these detailed protocols and quantitative benchmarks, researchers can significantly enhance the reliability and reproducibility of their epigenomic studies, ultimately contributing to more robust insights into gene regulatory mechanisms in development, disease, and drug response.
Within the context of a broader thesis on histone modifications in primary cells, mastering the chromatin immunoprecipitation followed by sequencing (ChIP-seq) technique is paramount. This protocol details the critical wet-lab procedures—crosslinking, chromatin shearing, and immunoprecipitation—required to generate high-quality data for epigenomic analysis [10]. In primary cells, where cell numbers are often limited and the epigenomic landscape is a direct reflection of their in vivo state, a robust and optimized protocol is essential for capturing authentic protein-DNA interactions [32] [4]. The following sections provide a detailed methodology, optimized for histone modifications, to ensure the reliability and reproducibility of your ChIP-seq data.
The Scientist's Toolkit: Research Reagent Solutions
The following table catalogs the essential reagents and materials required for a successful ChIP-seq experiment, with a particular focus on the needs of research and drug development professionals.
Table 1: Essential Research Reagents and Materials for ChIP-seq
| Item | Function/Application in ChIP-seq | Key Considerations |
|---|---|---|
| ChIP-Grade Antibodies [32] [4] | Immunoprecipitation of the histone-modified nucleosome or protein of interest. | Specificity is critical; validate for ChIP application. Use 1-10 µg per IP [33]. |
| Protein A/G Magnetic Beads [33] | Capture of the antibody-target complex. | Beads are blocked with BSA to reduce non-specific binding [33]. |
| Formaldehyde (37%) [33] [34] | Reversible crosslinking of proteins to DNA, "freezing" interactions. | A 1% final concentration is standard; quench with 125 mM glycine [33] [34]. |
| Protease Inhibitors [33] [10] | Prevent degradation of proteins and histone modifications during processing. | Add fresh to all lysis and wash buffers. |
| Micrococcal Nuclease (MNase) [32] | Enzymatic shearing of chromatin. An alternative to sonication. | Provides reproducible fragmentation but can be less random than sonication [32]. |
| Magnetic Rack [33] | Separation of bead-bound complexes during washing steps. | Enables efficient buffer changes and clean-up. |
| Glycine [33] | Quenches formaldehyde to stop the crosslinking reaction. | -- |
| SDS and Triton X-100/NP-40 [33] | Detergents in lysis and wash buffers for cell membrane dissolution and non-specific binding reduction. | Buffer composition varies for histone vs. non-histone targets [33]. |
| PMSF, Aprotinin, Leupeptin [10] [34] | Specific protease inhibitors to protect chromatin complexes. | -- |
Step-by-Step Experimental Protocol
Stage 1: Bead and Antibody Preparation
Before cell harvesting, prepare the capture beads to streamline the procedure later. This protocol uses a mix of Protein A and Protein G magnetic beads for comprehensive antibody binding [33].
Materials:
- ChIP-grade primary antibody against your histone modification of interest (e.g., H3K4me3, H3K27me3) [10]
- Protein A & Protein G Magnetic Beads
- Ice-cold PBS
- Blocking Buffer: 0.5% w/v BSA in RIPA-150
- RIPA-150: 50 mM Tris-HCl pH=8.0, 150 mM NaCl, 1 mM EDTA, 0.1% SDS, 1% Triton X-100 or NP-40, 0.1% sodium deoxycholate [33]
Procedure:
- Prepare Bead Slurry: For each ChIP sample, combine 12.5 µL of Protein A beads and 12.5 µL of Protein G beads in a tube [33].
- Wash Beads: Place the tube on a magnetic rack for ~1 minute. Aspirate and discard the supernatant. Wash the beads twice with an excess of ice-cold PBS [33].
- Block Beads: Resuspend the beads in 1 mL of Blocking Buffer. Incubate for 30 minutes at 4°C with gentle rotation to minimize non-specific binding [33].
- Wash with RIPA-150: Wash the blocked beads twice with 1 mL of RIPA-150 buffer [33].
- Bind Antibody: Resuspend the beads for each sample in 500 µL of RIPA-150. Add the recommended amount of your ChIP-grade antibody (e.g., 4 µg for histone targets [33]). Incubate for ~6 hours or overnight at 4°C with gentle rotation [33].
Stage 2: Harvesting and Cross-Linking Cells
This step preserves the in vivo interactions between histones and DNA using formaldehyde.
Materials:
- Primary cells (~1x10⁷ cells per IP is a good starting point; can be optimized down) [33] [10]
- Ice-cold PBS
- Formaldehyde (37%)
- Glycine (1M or solid)
Procedure:
- Harvest & Wash: For adherent primary cells, gently rinse twice with 10-20 mL of ice-cold PBS. For suspension cells, pellet cells (1500 g, 4°C, 5 min) and resuspend in PBS [33].
- Cross-link: Add formaldehyde to the cell suspension to a final concentration of 1%. Incubate for 10 minutes at room temperature with gentle swirling or agitation. Perform this step in a fume hood. [33] [34]
- Quench: Add glycine to a final concentration of 125 mM and incubate for 5 minutes at room temperature with gentle agitation [33] [34].
- Wash Cells: Discard the liquid and wash the cells twice with ice-cold PBS to remove residual cross-linker. Cell pellets can be flash-frozen and stored at -80°C at this point [32].
Stage 3: Cell Lysis and Nuclear Isolation
Isolating the nuclear fraction reduces cytoplasmic contaminants, improving the signal-to-noise ratio.
Materials:
- Nuclear Extraction Buffer 1: 50 mM HEPES-NaOH pH=7.5, 140 mM NaCl, 1 mM EDTA, 10% Glycerol, 0.5% NP-40, 0.25% Triton X-100, 1x protease inhibitors [33]
- Nuclear Extraction Buffer 2: 10 mM Tris-HCl pH=8.0, 200 mM NaCl, 1 mM EDTA, 0.5 mM EGTA, 1x protease inhibitors [33]
Procedure:
- First Lysis: Pellet the cross-linked cells (1,500 x g, 5 mins, 4°C). Resuspend the pellet in ~2 mL of Nuclear Extraction Buffer 1 per 1x10⁷ cells. Incubate for 15 minutes at 4°C with rocking. This gentle buffer disrupts the cell membrane [33].
- Second Lysis: Pellet the cells again. Resuspend the pellet in ~2 mL of Nuclear Extraction Buffer 2. Incubate for 15 minutes at 4°C with rocking. This step removes residual cytoplasmic components [33].
Stage 4: Chromatin Shearing (Sonication)
Shearing chromatin to the appropriate fragment size is critical for resolution and efficiency.
Materials:
- Sonication Buffer for Histone Targets: 50 mM Tris-HCl pH=8.0, 10 mM EDTA, 1% SDS, protease inhibitors [33]
- Non-Histone Sonication Buffer: 10 mM Tris-HCl pH=8.0, 100 mM NaCl, 1 mM EDTA, 0.5 mM EGTA, 0.1% sodium deoxycholate, 0.5% sodium lauroylsarcosine, protease inhibitors [33]
- Sonicator (e.g., Bioruptor, Diagenode) [10]
- Refrigerated centrifuge
Procedure:
- Resuspend Pellet: Pellet the nuclei (1,500 g, 5 mins, 4°C). Carefully resuspend the pellet in the appropriate sonication buffer. For histone targets, use 350 µL of Histone Sonication Buffer per 1x10⁷ cells [33].
- Sonicate: Transfer the suspension to an appropriate sonication tube. Sonicate on ice to shear DNA to an average fragment size of 150–300 bp for histone targets [33].
Optimization Note: Sonication conditions (time, power, pulse duration) MUST be empirically determined for your specific cell type, sonicator, and protein of interest. Run an aliquot on an agarose gel to verify fragment size distribution [32] [34].
Stage 5: Immunoprecipitation
This is the core step where the protein-DNA complex of interest is selectively purified.
Materials:
- Prepared antibody-bead complex (from Stage 1)
- Sheared chromatin (from Stage 4)
- IP Dilution Buffer: 50 mM Tris-HCl pH=7.4, 150 mM NaCl, 1% igepal, 0.25% deoxycholic acid, 1 mM EDTA pH 8, protease inhibitors [10]
- Wash Buffers (low salt, high salt, LiCl, TE) [34]
Procedure:
- Dilute Chromatin: Dilute the sheared chromatin in IP Dilution Buffer to reduce SDS concentration and adjust salt conditions for antibody binding [10].
- Pre-clear (Optional): Incubate the diluted chromatin with bare beads for 1 hour to reduce non-specific binding.
- Immunoprecipitate: Add the diluted chromatin to the tube containing the antibody-bound beads from Stage 1. Incubate overnight at 4°C with gentle rotation [33] [34].
- Wash Beads: Place the tube on a magnetic rack. Discard the supernatant. Wash the beads sequentially with increasing stringency [34]:
- Wash once with 1 mL of low-salt Wash Buffer.
- Wash once with 1 mL of high-salt Wash Buffer.
- Wash once with 1 mL of LiCl Wash Buffer.
- Wash twice with 1 mL of TE Buffer.
Keep buffers cold and perform washes quickly to maintain complex integrity.
- Elute DNA: After the final wash, elute the protein-DNA complexes from the beads. A common method is to resuspend beads in Chelex resin or elution buffer and incubate at 65°C with shaking [34].
- Reverse Cross-links & Purify DNA: Incubate the eluate at 65°C for several hours or overnight to reverse the formaldehyde cross-links. Subsequently, treat with RNase A and Proteinase K, and purify the DNA using a silica-based column or phenol-chloroform extraction [32] [34]. The purified DNA is now ready for qPCR validation or library preparation for sequencing.
Workflow Visualization & Quality Control
Experimental Workflow
The following diagram illustrates the logical flow of the major stages in the ChIP-seq protocol, from cell preparation to ready-to-sequence DNA.
Quantitative Data and Quality Standards
Adherence to the following quantitative guidelines and quality control checkpoints is essential for generating publication-quality data, especially when working with valuable primary cell samples.
Table 2: Key Quantitative Parameters and Quality Control Standards
| Parameter | Recommended Standard | Notes / Purpose |
|---|---|---|
| Cells per IP | 1x10⁷ (optimizable) [33] | Starting point; can be scaled down. |
| Crosslinking Time | 10 minutes [33] [34] | Balance between efficient crosslinking and shearing efficiency. |
| Shearing Size (Histones) | 150–300 bp [33] | Ideal fragment size for histone modifications. |
| Antibody per IP (Histones) | 4 µg [33] | Amount may vary by antibody; follow manufacturer's advice. |
| Sequencing Depth (Broad Marks) | 45 million usable fragments/replicate [4] | Standard for marks like H3K27me3 and H3K36me3. |
| Sequencing Depth (Narrow Marks) | 20 million usable fragments/replicate [4] | Standard for marks like H3K4me3 and H3K27ac. |
| Library Complexity (NRF) | >0.9 [4] | Non-Redundant Fraction; indicates good library diversity. |
| PCR Bottlenecking (PBC1) | >0.9 [4] | Indicates minimal loss of library complexity due to over-amplification. |
This detailed protocol for crosslinking, chromatin shearing, and immunoprecipitation provides a solid foundation for generating robust ChIP-seq data for histone modification studies in primary cells. By carefully following these steps, adhering to the quantitative standards, and rigorously performing quality controls, researchers can ensure that their downstream sequencing results accurately reflect the in vivo epigenomic state, thereby enabling meaningful biological insights and accelerating discovery in basic research and drug development.
In chromatin immunoprecipitation followed by sequencing (ChIP-seq) for histone modifications, antibody specificity is the foundational element determining data quality and biological validity. The challenging nature of commercial antibodies, often described as "the Wild West" in terms of validation, necessitates rigorous verification by researchers themselves [35]. For scientists studying histone modifications in primary cells—where material is often precious and limited—selecting and validating antibodies that specifically recognize target epitopes without cross-reactivity is paramount to generating meaningful epigenomic profiles. The ENCODE Consortium has established comprehensive standards that provide a critical framework for antibody characterization, ensuring that data generated across different laboratories maintains consistency, reliability, and reproducibility [36] [37].
The consequences of using non-specific antibodies extend beyond simple experimental failure. They can lead to misinterpretation of biological mechanisms, erroneous conclusions about histone modification patterns, and ultimately, reduced reproducibility in epigenomic research. This application note provides a comprehensive guide to navigating antibody selection, implementing specificity tests, and ensuring ENCODE compliance for ChIP-seq studies focused on histone modifications in primary cells.
Understanding Antibody Validation Frameworks
The Five Pillars of Antibody Specificity
The International Working Group on Antibody Validation has established five principal strategies—often called the "five pillars"—for determining antibody specificity [38]. These methodologies provide complementary approaches to verify that an antibody binds specifically to its intended target.
Genetic Strategies: This approach involves comparing antibody binding signals in wild-type cells versus cells where the target gene has been knocked out using CRISPR or RNA interference [38]. A specific antibody should show significantly reduced or absent binding in knockout cells. While considered a gold-standard technique, creating reliable knockout cell lines can be laborious, though the availability of ready-made KO cell lines is accelerating this validation method [38].
Orthogonal Strategies: These strategies involve assessing target protein abundance using antibody-independent methods such as transcriptomics or targeted proteomics, then comparing these results with antibody-based detection across a range of relevant samples [38]. While this method can be high-throughput, it presents interpretation challenges since the relationship between mRNA and protein abundance is non-linear and often variable.
Independent Antibody Strategies: This method compares the binding pattern of the antibody being validated with that of a second, independent antibody recognizing a non-overlapping epitope on the same target protein [38]. The convergence of results from multiple antibodies against different epitopes provides strong evidence of specificity. Recombinant antibodies are particularly suitable for this approach due to their high batch-to-batch consistency [38].
Expression of Tagged Proteins: This technique involves expressing the target protein with a fusion tag (e.g., GFP, c-Myc) and comparing the signal from the antibody under validation with the tag-specific signal [38]. While powerful, this approach requires significant technical expertise and carries the risk that the tag itself may alter the characteristics or localization of the target protein.
Immunoprecipitation-Mass Spectrometry (IP-MS): IP-MS involves isolating proteins bound by an antibody through immunoprecipitation followed by mass spectrometric identification of all captured proteins [38]. This method comprehensively reveals both the intended target and any off-target binding, though results can be complicated to interpret when the target protein exists in complexes with other proteins.
ENCODE Compliance Framework
The ENCODE Consortium has implemented a rigorous, standardized system for antibody characterization to address well-documented problems with specificity and reproducibility in antibody-based assays [39] [36]. The basic organizational unit in this system is the antibody lot, defined as a unique lot-productID-source combination, with each lot receiving a unique ENCODE accession number [36]. Unless an antibody targets a histone modification, ENCODE standards require characterization in each cell type and species used in experiments [36].
The ENCODE portal provides detailed antibody characterization standards tailored to different protein categories, including specific guidelines for histone modifications and chromatin-associated proteins established in October 2016 [37]. Each antibody lot undergoes multiple supporting characterizations—which may include dot blot assays, immunoblots, and/or mass spectrometry results—that are reviewed against current standards, with the outcome reflected in its status [36]. The eligibility of an antibody lot for use in ENCODE projects depends on having characterizations that comply with current standards for the specific cell/tissue type and species being investigated [36].
Table: ENCODE Antibody Characterization Status Definitions
| Status | Definition | Use in ENCODE |
|---|---|---|
| Compliant | Characterization complies with attached standards document | Approved for use |
| Not Compliant | Characterization fails to meet standards requirements | Not approved for use |
| Not Reviewed | From previous/external projects, not reviewed by current ENCODE | Not approved for current use without re-review |
| Exempt from Standards | Granted exemption by ENCODE Antibody Review Panel | Case-by-case approval |
| Pending DCC Review | Completed by lab, awaiting review | Decision pending |
Experimental Protocols for Antibody Validation
Binary Validation Using Knockout Cell Lines
Principle: Genetic knockout (KO) validation provides the most direct evidence of antibody specificity by comparing signals in target-expressing cells versus genetically matched cells lacking the target protein [40] [38].
Protocol:
- Cell Line Selection: Identify appropriate positive and negative control cell lines. For histone modifications, this may involve using cells known to possess specific epigenetic marks versus those that do not. When possible, use CRISPR-engineed knockout cell lines where the histone-modifying enzyme has been deleted, resulting in loss of the specific modification [38].
- Sample Preparation: Culture positive and negative control cells under identical conditions. Crosslink proteins to DNA using 1% formaldehyde for 10 minutes at room temperature, then quench with 125 mM glycine [10].
- Chromatin Preparation: Harvest cells and lyse using cell lysis buffer (5 mM PIPES pH 8, 85 mM KCl, 1% igepal) followed by nuclei lysis buffer (50 mM Tris-HCl pH 8, 10 mM EDTA, 1% SDS) with fresh protease inhibitors [10].
- Chromatin Fragmentation: Sonicate chromatin to 200-500 bp fragments using a focused ultrasonicator (e.g., Bioruptor UCD-200). Verify fragment size by agarose gel electrophoresis [10].
- Immunoprecipitation: Incubate chromatin with the antibody being validated. Include positive control antibodies for known histone modifications (e.g., H3K4me3, H3K27me3) and a negative control (normal IgG) [10].
- Analysis: Reverse crosslinks, purify DNA, and analyze by quantitative PCR at genomic regions known to contain the modification. Specific antibodies will show enrichment in positive control cells but not in knockout cells.
Troubleshooting: If the target protein is essential for cell viability, inducible knockout systems or RNAi approaches may be necessary, though these come with limitations such as transient suppression [40] [38].
Orthogonal Validation for Histone Modifications
Principle: Orthogonal strategies cross-reference antibody-based results with data from non-antibody-based methods, providing independent verification of antibody specificity [40] [38].
Protocol:
- Sample Preparation: Divide primary cell samples into aliquots for parallel analysis by ChIP-seq and mass spectrometry.
- Chromatin Immunoprecipitation: Perform standard ChIP-seq as described in section 3.1.
- Mass Spectrometry Sample Preparation: In parallel, acid-extract histones from the same primary cell population. Derivatize with propionic anhydride to improve sequence coverage and sensitivity for PTM analysis.
- LC-MS/MS Analysis: Separate derivatized histone samples using reverse-phase nano-liquid chromatography coupled to tandem mass spectrometry.
- Data Integration: Compare the genomic distribution patterns obtained by ChIP-seq with the quantitative modification data from mass spectrometry. A specific antibody will show ChIP-seq enrichment at genomic locations consistent with the modification abundance measured by MS.
Advantages and Limitations: While orthogonal validation provides strong corroborating evidence, it requires specialized instrumentation and expertise in mass spectrometry, which may not be accessible to all laboratories [38].
Multiple Antibody Validation Strategy
Principle: Using two or more antibodies against distinct, non-overlapping epitopes on the same histone modification provides strong evidence of specificity when they yield comparable results [40].
Protocol:
- Antibody Selection: Select at least two antibodies raised against different epitopes on the same histone modification. For example, for H3K27me3 validation, choose antibodies targeting different peptide sequences surrounding the modified residue.
- Parallel Staining: Split primary cell samples and perform identical ChIP-seq procedures in parallel using the different antibodies.
- Comparison Analysis: Sequence immunoprecipitated DNA from all antibodies simultaneously. Analyze data for correlation of enrichment profiles across the genome.
Interpretation: High correlation between enrichment profiles from independent antibodies targeting the same modification indicates specific recognition of the intended target. Low correlation suggests at least one antibody exhibits off-target binding.
Diagram Title: Antibody Validation Strategy Selection Workflow
ENCODE Standards for Histone ChIP-seq
Experimental Guidelines
The ENCODE Consortium has established rigorous experimental guidelines for ChIP-seq assays to ensure data quality and reproducibility [37] [4]. For histone modification studies in primary cells, these standards include specific requirements for replicates, controls, sequencing depth, and quality metrics.
Biological Replicates: Experiments must include two or more biological replicates, which can be isogenic (from the same genetic background) or anisogenic (from different genetic backgrounds) [4]. This requirement ensures that observed patterns are reproducible across different samples. Exceptions may be granted for assays using EN-TEx samples where experimental material is limited.
Control Experiments: Each ChIP-seq experiment must include a corresponding input control experiment with matching run type, read length, and replicate structure [4]. The input control consists of genomic DNA processed without immunoprecipitation and is essential for distinguishing specific enrichment from background noise.
Antibody Characterization: Antibodies must be characterized according to ENCODE standards specific for histone modifications and chromatin-associated proteins established in October 2016 [37] [4]. This characterization must include evidence of specificity for the intended histone modification.
Library Quality Metrics: Library complexity is measured using the Non-Redundant Fraction (NRF) and PCR Bottlenecking Coefficients (PBC1 and PBC2) [4]. Preferred values are NRF > 0.9, PBC1 > 0.9, and PBC2 > 10, indicating high-complexity libraries with minimal PCR amplification bias.
Target-Specific Standards
ENCODE provides distinct standards for different types of histone modifications based on their genomic distribution patterns [4]. These classifications determine the required sequencing depth and analytical approaches.
Table: ENCODE Standards for Histone Modifications by Category
| Category | Required Fragments per Replicate | Example Modifications | Genomic Distribution |
|---|---|---|---|
| Broad Marks | 45 million | H3K27me3, H3K36me3, H3K4me1, H3K9me3 | Large genomic domains (e.g., repressed regions, gene bodies) |
| Narrow Marks | 20 million | H3K4me3, H3K27ac, H3K9ac | Focal regions (e.g., promoters, enhancers) |
| Exceptions | 45 million | H3K9me3 | Broad marks enriched in repetitive regions |
The exceptional case of H3K9me3 requires special consideration in tissues and primary cells because this modification is enriched in repetitive regions of the genome [4]. Compared to other broad marks, there are relatively few H3K9me3 peaks in non-repetitive regions, resulting in many ChIP-seq reads that map to non-unique genomic positions. Consequently, H3K9me3 experiments in tissues and primary cells require 45 million total mapped reads per replicate to ensure sufficient coverage of unique regions [4].
ENCODE-Compliant ChIP-seq Protocol for Primary Cells
Primary Cell-Specific Considerations: Working with primary cells presents unique challenges for ChIP-seq, including limited material, inability to genetically manipulate, and potential heterogeneity in cell populations. The following protocol is optimized for histone modification analysis in primary cells while maintaining ENCODE compliance.
Step-by-Step Protocol:
- Cell Crosslinking: Resuspend 1-10 million primary cells in culture medium. Add formaldehyde directly to the culture to a final concentration of 1% and incubate for 10 minutes at room temperature with gentle agitation. Quench crosslinking by adding glycine to a final concentration of 125 mM [10].
- Chromatin Preparation: Wash cells twice with cold PBS. Resuspend cell pellet in cell lysis buffer (5 mM PIPES pH 8, 85 mM KCl, 1% igepal) with fresh protease inhibitors and incubate on ice for 15 minutes. Pellet nuclei and resuspend in nuclei lysis buffer (50 mM Tris-HCl pH 8, 10 mM EDTA, 1% SDS) with protease inhibitors [10].
- Chromatin Shearing: Transfer chromatin to Bioruptor microtubes and sonicate using a focused ultrasonicator (e.g., Bioruptor UCD-200) for 15-20 cycles (30 seconds ON, 30 seconds OFF) at high power. Verify fragment size distribution (200-500 bp) by agarose gel electrophoresis [10].
- Immunoprecipitation: Dilute sheared chromatin 10-fold in IP dilution buffer (50 mM Tris-HCl pH 7.4, 150 mM NaCl, 1% igepal, 0.25% deoxycholic acid, 1 mM EDTA) with protease inhibitors. Add 1-5 μg of validated antibody and incubate overnight at 4°C with rotation [10].
- Bead Capture and Washes: Add protein A/G magnetic beads and incubate for 2 hours. Wash beads sequentially with low salt wash buffer, high salt wash buffer, LiCl wash buffer, and TE buffer [10].
- Elution and Reverse Crosslinking: Elute chromatin in elution buffer (50 mM NaHCO₃, 1% SDS) at 65°C for 30 minutes with shaking. Add NaCl to 200 mM and incubate at 65°C overnight to reverse crosslinks [10].
- DNA Purification: Treat with RNase A for 30 minutes at 37°C, followed by proteinase K for 2 hours at 55°C. Purify DNA using QIAquick PCR purification kit and quantify by Qubit fluorometer [10].
Quality Control Checkpoints:
- Chromatin Quality: Assess DNA fragment size distribution after sonication.
- Antibody Efficiency: Test ChIP efficiency by qPCR at positive and negative control genomic regions.
- Library Quality: Verify library size distribution using Bioanalyzer before sequencing.
Diagram Title: ENCODE-Compliant ChIP-seq Workflow for Primary Cells
The Scientist's Toolkit: Research Reagent Solutions
Table: Essential Reagents for Validated Histone ChIP-seq
| Reagent Category | Specific Examples | Function & Importance |
|---|---|---|
| Validated Antibodies | CST #9751S (H3K4me3), CST #9733S (H3K27me3), Diagenode #pAb-037-050 (H3K4me1) | Target-specific immunoprecipitation; core determinant of data quality [10] |
| Cell Lines | Knockout cell lines (CRISPR-engineered), Transfected cell lines with tagged proteins | Critical controls for antibody validation; establish specificity [38] |
| Chromatin Shearing | Bioruptor UCD-200, Covaris S220 | DNA fragmentation to optimal size (200-500 bp); affects resolution and efficiency [10] |
| Magnetic Beads | Protein A/G magnetic beads | Antibody capture and purification; reduce background binding [10] |
| Library Prep Kits | Illumina ChIP-seq Library Prep | Sequencing library construction; maintain complexity and minimize bias [10] |
| Control Primers | Positive/Negative genomic region primers | qPCR validation of ChIP efficiency; quality control checkpoint [10] |
Navigating antibody selection for histone modification studies requires a systematic approach that integrates multiple validation strategies while adhering to ENCODE compliance standards. The framework presented in this application note—combining genetic, orthogonal, and independent antibody validation methods—provides a robust foundation for establishing antibody specificity. For researchers working with primary cells, where material is limited and experimental opportunities are precious, investing time in comprehensive antibody validation is not merely a best practice but an essential step toward generating meaningful, reproducible epigenomic data. As antibody validation technologies and standards continue to evolve, maintaining rigor in reagent selection and validation will remain crucial for advancing our understanding of epigenetic mechanisms in health and disease.
In the context of ChIP-seq for histone modifications in primary cells research, library preparation from low-input samples presents a significant technical challenge. Primary cells are often limited in quantity, and the intricate process of cross-linking, chromatin shearing, and immunoprecipitation can lead to substantial DNA loss. This application note details optimized protocols and methodologies to maximize library complexity and yield, ensuring high-quality data from scarce material. The strategies outlined herein are critical for generating statistically robust epigenomic profiles, particularly in clinically relevant primary cell samples where material is precious.
Key Methodologies for Low-Input ChIP-seq
Several advanced methodologies have been developed to address the challenges of low-input ChIP-seq, particularly for histone modification studies in primary cells. The table below summarizes the core characteristics of these approaches.
Table 1: Comparison of Low-Input Chromatin Profiling Methods
| Method | Recommended Input | Key Principle | Advantages for Low-Input Samples |
|---|---|---|---|
| PerCell ChIP-seq [41] | Utilizes cellular spike-in ratios | Integration of orthologous species' chromatin for normalization | Enables highly quantitative comparisons across cell states; provides internal normalization. |
| CUT&RUN [1] [42] | Lower cell numbers than ChIP-seq | Antibody-directed tethering of protein A-Tn5 transposase to modified nucleosomes. | Faster protocol; more sensitive; requires significantly reduced read pairs (4-8 million) per sample. [42] |
| scEpi2-seq [13] | Single-cell resolution | Joint readout of histone modifications and DNA methylation using TET-assisted pyridine borane sequencing. | Multi-omic profiling from single cells; high fraction of reads in peaks (FRiP >0.72). |
| Refined Tissue ChIP-seq [43] | Solid tissues (e.g., colorectal cancer) | Optimized tissue homogenization and chromatin extraction. | Overcomes limitations of chromatin fragmentation from complex tissue matrices; highly reproducible. |
Leveraging Spike-ins for Quantitative Normalization
For traditional low-input ChIP-seq, the PerCell method combines the use of well-defined cellular spike-in ratios of orthologous species’ chromatin with a flexible bioinformatic pipeline. [41] This strategy facilitates highly quantitative comparisons of chromatin sequencing across experimental conditions by providing an internal reference for signal scaling, overcoming the normalization challenges inherent in comparing samples with different starting quantities or quality. [41]
Alternative Enzymatic Methods: CUT&RUN
The CUT&RUN method is a powerful alternative to ChIP-seq for low-input scenarios. [1] It uses antibody-directed tethering of protein A-Micrococcal Nuclease (MNase) or protein A-Tn5 transposase to specific histone modifications in permeabilized cells. [1] [42] This in-situ cleavage or tagmentation is highly efficient, allowing for high-resolution chromatin profiling from as few as 10 cells, and requires only 4 to 8 million read pairs per sample, reducing sequencing costs. [1] [42]
Experimental Protocol: Refined ChIP-seq for Scarce Tissues and Primary Cells
The following protocol is optimized for challenging, low-input samples like primary cells and solid tissues, with an emphasis on maximizing yield at every step. [43]
Frozen Tissue and Cell Preparation
Materials:
- Frozen tissue sample or pelleted primary cells
- Cold 1x PBS supplemented with protease inhibitors
- Biosafety cabinet (BSC), ice, sterile Petri dishes, sterile scalpel blades
- Option A: Sterile Dounce tissue grinder (7-mL)
- Option B: gentleMACS Dissociator with C-tubes [43]
Procedure:
- Sample Transfer: Keep samples on ice at all times. Transfer frozen tissue to a Petri dish placed firmly on ice within a BSC.
- Mincing: Using two sterile scalpels, mince the tissue sample on the Petri dish until finely diced.
- Homogenization:
- Dounce Homogenization: Transfer minced tissue to a cold Dounce grinder. Add 1 mL of cold PBS with protease inhibitors. Shear tissue with 8-10 even strokes of the pestle. Rinse the grinder with 2-3 mL of buffer and collect the homogenate in a 50 mL tube. [43]
- gentleMACS Homogenization: Transfer minced tissue to a C-tube with 1 mL of cold PBS with protease inhibitors. Tap the upside-down tube to ensure contact with the blade. Run the preconfigured "htumor03.01" program. Pour the contents into a 50 mL conical tube. [43]
Cross-linking, Chromatin Extraction, and Shearing
Procedure:
- Cross-linking: Cross-link cells/tissue with 1% formaldehyde for 10 minutes at room temperature. Quench the reaction with glycine.
- Chromatin Extraction: Lyse cells using an optimized buffer composition to preserve chromatin integrity and minimize degradation. Critical for maximizing recovery from low-input samples. [43]
- Chromatin Shearing:
- Goal: Achieve consistent fragment lengths between 100 and 300 bp, preferably under 500 bp, for the tightest peaks. [42]
- Recommendation: Use a Covaris-style closed-tube sonicator for consistent fragment lengths and to avoid contamination or sample loss associated with probe sonicators. [42]
- QC Check: Run an aliquot of the sheared chromatin (input control) on a Bioanalyzer or agarose gel to verify fragment size distribution before proceeding to immunoprecipitation. [42]
Immunoprecipitation and Library Construction
Procedure:
- Immunoprecipitation (IP): Incubate sheared chromatin with a validated, high-specificity antibody against the target histone modification (e.g., H3K27me3, H3K4me3). Use robust washing steps to minimize background noise.
- Reverse Cross-linking: Purify ChIP-ed DNA. At this stage, samples are often in very low concentration. [42]
- Library Construction with UMIs:
- For the highest accuracy data, especially for low-input samples, construct sequencing libraries with UMI-bearing (Unique Molecular Identifier) sequencing adapters. [42]
- Function: UMIs allow for the accurate detection and removal of PCR duplicate reads, which are more prevalent in low-input libraries, thus providing a more accurate representation of true library complexity. [42]
- Sequencing: Paired-end sequencing is recommended over single-end, as it provides significant advantages in ChIP-seq data analysis. The first nine bases of the forward and reverse reads will be used to parse the UMI sequences. [42]
The Scientist's Toolkit: Research Reagent Solutions
Table 2: Essential Reagents and Kits for Low-Input ChIP-seq Library Preparation
| Item/Category | Function | Example & Notes |
|---|---|---|
| Protease Inhibitors | Prevents protein degradation during sample preparation. | Added to PBS during tissue homogenization and lysis buffers to preserve chromatin-bound proteins. [43] |
| Validated Antibodies | Specific immunoprecipitation of target histone mark. | Critical for IP efficiency and specificity. Verify enrichment by qPCR before sequencing. [42] |
| UMI Adapters | Accurate removal of PCR duplicates. | Especially recommended for low-input samples to distinguish true biological fragments from amplification artifacts. [42] |
| Dounce Homogenizer | Mechanical tissue disruption. | 7-mL grinder with Pestle A for effective manual homogenization of soft tissues. [43] |
| gentleMACS Dissociator | Automated, standardized tissue homogenization. | Uses predefined programs (e.g., "htumor03.01") for consistent cell extraction from complex matrices. [43] |
| MGI-Specific Adaptors | Library construction for DNBSEQ platforms. | Part of a cost-effective and efficient sequencing alternative for large cohort studies. [43] |
Workflow and Data Quality Control
The following diagram illustrates the logical workflow and decision points for a successful low-input ChIP-seq experiment, from sample preparation to sequencing.
Low-Input ChIP-seq Experimental Workflow
Data Quality Control and Sequencing Recommendations
- Sequencing Depth: For transcription factor ChIP-seq, the ENCODE project recommends a minimum of 20 million uniquely mapping reads per sample. For histone marks, which cover broader domains, this may be sufficient or higher depths may be required. Depending on prep quality, about 75% of reads can be expected to be uniquely mapping. [42]
- Replicates: Analyze at least two biological replicates to ensure statistical robustness. [42]
- Controls: Sequence one "input control" per cell line or sample type. [42]
- Quality Metrics: For methods like scEpi2-seq, high-quality cells should be selected based on the number of unique reads and average methylation level per cell, with Fraction of Reads in Peaks (FRiP) values often exceeding 0.7 indicating high specificity. [13]
In the analysis of histone modifications via Chromatin Immunoprecipitation followed by sequencing (ChIP-seq), sequencing depth—the number of mapped reads per replicate—stands as a paramount determinant of data quality and biological validity. The Encyclopedia of DNA Elements (ENCODE) Consortium, through extensive empirical testing and standardization, has established distinct sequencing depth requirements for different classes of histone modifications. These modifications are broadly categorized as narrow marks, which produce sharp, punctate signals at specific genomic locations like promoters and enhancers, and broad marks, which form extensive domains across gene bodies and repressed regions [44] [45]. For researchers investigating primary cells, where sample material is often limited, adhering to these evidence-based standards is crucial for generating reproducible and interpretable genome-wide maps of the epigenome. This application note synthesizes the current ENCODE guidelines to provide a clear framework for experimental design in the study of histone modifications.
ENCODE Sequencing Depth Standards
The ENCODE Consortium has systematically defined sequencing depth requirements based on the nature of the chromatin mark. These standards ensure sufficient coverage to confidently identify enriched regions across the genome.
Table 1: ENCODE Sequencing Depth Standards for Histone Modifications. This table summarizes the key quantitative standards for usable fragments per biological replicate.
| Histone Mark Category | Minimum ENCODE Standard | Ideal ENCODE Standard | Examples of Histone Marks |
|---|---|---|---|
| Narrow Marks | 20 million usable fragments | >20 million usable fragments [4] [12] | H3K4me3, H3K27ac, H3K9ac, H2AFZ [4] [12] |
| Broad Marks | 20 million usable fragments [12] | 45 million usable fragments [4] [12] | H3K27me3, H3K36me3, H3K4me1, H3K9me2 [4] [12] |
| Exception (H3K9me3) | 45 million mapped reads | 45 million mapped reads [4] [12] | H3K9me3 (due to enrichment in repetitive regions) [4] [12] |
It is critical to distinguish between narrow and broad marks, as this classification directly dictates the necessary sequencing effort. Narrow marks, such as H3K4me3 and H3K27ac, are typically associated with specific regulatory elements like promoters and enhancers, generating sharp, peak-like signals [45]. In contrast, broad marks like H3K27me3 (associated with facultative heterochromatin) and H3K36me3 (associated with transcribed gene bodies) cover large genomic domains spanning thousands of bases [44] [45]. The increased sequencing depth for broad marks is required to distinguish true enrichment from background noise across these extensive regions. The mark H3K9me3 is a special case; although a broad mark, it is enriched in repetitive regions of the genome. In tissues and primary cells, this results in a significant proportion of ChIP-seq reads mapping to non-unique locations, necessitating a high number of total mapped reads (45 million) to adequately cover the non-repetitive, enriched regions [4] [12].
Additional Experimental Design Considerations
Beyond raw sequencing depth, several other factors are essential for a robust ChIP-seq experimental design:
- Biological Replicates: ENCODE guidelines strongly recommend a minimum of two biological replicates to ensure the reproducibility of findings. Replicates should be isogenic (derived from the same source) or anisogenic, and must match in terms of read length and sequencing run type [4] [12] [44].
- Control Experiments: Each ChIP-seq experiment must include a corresponding input control experiment with matching run type, read length, and replicate structure. This control accounts for sequencing background and biases introduced by chromatin fragmentation and sequencing [4] [12] [44].
- Library Complexity: Quality control metrics such as the Non-Redundant Fraction (NRF) and PCR Bottlenecking Coefficients (PBC1 and PBC2) are used to assess library complexity. ENCODE prefers values of NRF > 0.9, PBC1 > 0.9, and PBC2 > 10, indicating a high-complexity library with minimal PCR duplication [4] [12].
- Platform Consistency: The sequencing platform should be indicated, and replicates should be sequenced using the same platform. Variations between platforms (e.g., HiSeq2000 vs. HiSeq4000) can introduce technical artifacts and are not considered comparable [12].
- Read Length and Mapping: The minimum read length should be 50 base pairs, though longer reads are encouraged. The pipeline can process reads as short as 25 base pairs. A good measure for a successful experiment is that approximately 70% of the quality-trimmed reads map uniquely to the reference genome [12] [46].
Experimental Protocol: Histone ChIP-seq in Primary Cells
The following protocol is adapted for primary cells, where material may be limited, based on ENCODE standards and established methodologies [10].
Reagents and Equipment
Table 2: The Scientist's Toolkit: Essential Reagents for Histone ChIP-seq.
| Item | Function / Description | Examples / Notes |
|---|---|---|
| Crosslinking Reagent | Covalently links proteins to DNA in living cells. | Formaldehyde (37%); Quenched with Glycine. |
| Chromatin Shearing Device | Fragments chromatin to desired size (100-300 bp). | Bioruptor (Diagenode) or equivalent sonicator. |
| Validated Antibodies | Immunoprecipitation of target histone mark. | H3K27me3: CST #9733; H3K4me3: CST #9751 [10]. |
| Protein A/G Beads | Capture antibody-target complexes. | Magnetic beads recommended for ease of use. |
| Cell Lysis Buffers | Lyse cells and isolate nuclei. | Contains PIPES, KCl, and Igepal; plus protease inhibitors. |
| Nuclei Lysis Buffer | Lyse nuclei and release chromatin. | Contains Tris-HCl, EDTA, and SDS [10]. |
| DNA Purification Kit | Purify immunoprecipitated DNA for sequencing. | QIAquick PCR Purification Kit (QIAGEN) or similar. |
| Library Prep Kit | Prepare sequencing libraries from ChIP DNA. | Illumina-compatible kits. |
Step-by-Step Procedure
- Cross-linking: Resuspend ~1-10 million primary cells in culture medium. Add formaldehyde (37% stock) to a final concentration of 1% and incubate for 10 minutes at room temperature to crosslink. Quench the reaction by adding glycine to a final concentration of 0.125 M and incubate for 5 minutes [10].
- Cell Lysis and Chromatin Preparation: Pellet the cells and wash with cold PBS. Resuspend the cell pellet in Cell Lysis Buffer (containing protease inhibitors) and incubate on ice for 15 minutes. Pellet the nuclei and resuspend in Nuclei Lysis Buffer. This buffer contains SDS to lyse the nuclei and release chromatin [10].
- Chromatin Shearing: Sonicate the chromatin using a Bioruptor or equivalent sonicator to shear DNA to a fragment size of 100-300 bp. This is a critical step that must be optimized for each cell type and sonicator.
- Immunoprecipitation (IP): Clarify the sonicated lysate by centrifugation. Dilute the supernatant 10-fold in IP Dilution Buffer (to reduce SDS concentration). Take a small aliquot as "Input" control and store at -20°C. To the remaining lysate, add the validated, ChIP-grade antibody (see Table 2 for examples) and incubate overnight at 4°C with rotation [10].
- Capture and Washes: Add Protein A/G magnetic beads and incubate for 2 hours. Capture beads on a magnet and wash sequentially with Low Salt Wash Buffer, High Salt Wash Buffer, and LiCl Wash Buffer, followed by a final wash in TE Buffer.
- Elution and Decrosslinking: Elute the immunoprecipitated complexes from the beads using Elution Buffer (1% SDS, 0.1M NaHCO3). Reverse crosslinks by adding NaCl to a final concentration of 0.2 M and incubating at 65°C overnight.
- DNA Purification: Treat the sample with RNase A and Proteinase K. Purify the ChIP DNA using a QIAquick PCR purification kit or similar. The purified DNA is now ready for library preparation.
- Library Preparation and Sequencing: Prepare sequencing libraries from the ChIP and Input DNA using an Illumina-compatible library prep kit. Quantify the libraries and sequence on an appropriate Illumina platform to the recommended depth outlined in Table 1.
Diagram 1: Histone ChIP-seq wet-lab workflow for primary cells.
Data Analysis and Quality Control Pipeline
The ENCODE Consortium provides standardized processing pipelines for histone ChIP-seq data, which differ from transcription factor pipelines in their peak calling and replicate analysis methods [4] [12].
ENCODE Histone Analysis Pipeline
The core of the ENCODE histone pipeline involves generating signal tracks and identifying enriched regions (peaks/domains), with specific steps for replicated and unreplicated experiments.
Diagram 2: Computational workflow for ENCODE histone mark analysis.
Key Outputs and Quality Assessment
The pipeline produces several key file formats and quality metrics that researchers must evaluate:
- Signal Tracks (bigWig): The pipeline generates nucleotide-resolution signal coverage tracks, expressed as fold-change over control and as a statistical p-value track, which are vital for visualization and downstream analysis [4] [12].
- Peak/Domain Calls (BED/bigBed): For replicated experiments, the pipeline produces a final set of replicated peaks. These are peaks from a pooled analysis that are consistently observed in both biological replicates or in two pseudoreplicates derived from the pooled data [4] [12].
- Critical Quality Metrics:
- FRiP (Fraction of Reads in Peaks): Measures the enrichment of the experiment. While threshold varies, a higher FRiP indicates a more successful IP.
- Library Complexity (NRF, PBC1, PBC2): As mentioned, NRF > 0.9, PBC1 > 0.9, and PBC2 > 10 are preferred, indicating minimal PCR duplication and high library complexity [4] [12].
- Irreproducible Discovery Rate (IDR): For assessing replicate concordance. An IDR threshold of 0.05 is often used to define a high-confidence set of peaks [12].
Adherence to ENCODE sequencing depth standards and experimental guidelines is not a mere formality but a foundational requirement for generating biologically meaningful and reproducible maps of histone modifications in primary cells. The distinction between narrow (20 million fragments minimum) and broad (45 million fragments ideal) marks, along with rigorous antibody validation and replicate design, provides a robust framework for researchers. By following the detailed protocols and quality control metrics outlined in this document, scientists can ensure their ChIP-seq data is of the highest quality, enabling accurate insights into the epigenetic mechanisms governing cell identity, development, and disease.
In chromatin immunoprecipitation followed by sequencing (ChIP-seq) for histone modifications, the use of appropriate control samples is not merely a technical formality but a fundamental necessity for accurate data interpretation. Control samples enable researchers to distinguish specific immunoprecipitation signals from background noise arising from technical artifacts, including antibody nonspecificity, chromatin accessibility biases, and sequencing idiosyncrasies [47] [48]. For researchers investigating epigenetic mechanisms in primary cells—where material is often precious and heterogeneity cannot be ignored—selecting the optimal control strategy is particularly critical. The Encyclopedia of DNA Elements (ENCODE) Consortium, a leading authority in epigenomic standardization, explicitly mandates that each ChIP-seq experiment include a corresponding input control experiment with matching run type, read length, and replicate structure [4]. While input DNA (Whole Cell Extract or WCE) remains the most prevalent control, alternative approaches including IgG mock immunoprecipitations and Histone H3 pull-downs offer distinct advantages and limitations that researchers must carefully consider within their experimental context [47] [49]. This application note provides a structured comparison of these three primary control strategies, offering evidence-based guidance and detailed protocols optimized for primary cell research.
Control Sample Comparison: Mechanisms and Applications
The three principal control types—Input DNA, IgG, and Histone H3 pull-down—function through distinct mechanisms to establish experimental baseline signals.
- Input DNA (WCE): This control consists of sheared chromatin that is taken prior to the immunoprecipitation step and does not undergo IP [47]. It captures biases inherent in the chromatin preparation, including sonication efficiency, sequencing depth, and genomic DNA composition.
- IgG Control: A mock immunoprecipitation using a non-specific immunoglobulin G (IgG) antibody [47] [48]. This control accounts for non-specific antibody binding and bead-related background, emulating more steps in the ChIP protocol than input DNA.
- Histone H3 Pull-down: An immunoprecipitation using an antibody against the core histone H3, which maps the underlying distribution of nucleosomes along the genome [47]. This control is specific to histone modification ChIP-seq and normalizes for the background distribution of histones themselves.
Comparative Analysis of Control Samples
The table below synthesizes key characteristics, advantages, and limitations of each control type to inform experimental design.
Table 1: Comparative analysis of control samples for histone modification ChIP-seq
| Control Type | Key Mechanism | Advantages | Limitations | Ideal Use Cases |
|---|---|---|---|---|
| Input DNA (WCE) [47] [4] | Pre-IP chromatin; measures background against uniform genome. | - Most common and widely accepted [47]- ENCODE consortium recommended [4]- Simple protocol, no IP required- No epitope cross-reactivity concerns | - Misses biases from immunoprecipitation process [47]- May not perfectly match ChIP background | - Standard histone mark profiling |
| IgG Control [47] [48] | Mock IP with nonspecific antibody; accounts for nonspecific binding. | - Captures background from IP process [47]- Useful for identifying non-specific antibody binding | - Can be difficult to obtain sufficient DNA for sequencing [47]- Does not normalize for histone density | - Testing new antibodies with unknown specificity- Experiments concerned with high background |
| Histone H3 Pull-down [47] | IP against core histone H3; measures signal relative to nucleosome occupancy. | - Normalizes for the underlying distribution of histones [47]- Generally more similar to histone modification ChIP-seq profiles [47]- Accounts for background affinity of modification antibodies to histones | - Specific to histone modification ChIP-seq- Requires an additional, validated H3 antibody- May over-normalize in nucleosome-sparse regions | - Quantitative comparisons of global mark changes (e.g., upon drug inhibition) [50]- Studies focused on relative enrichment per nucleosome |
Note: A comparative study found that while H3 pull-downs share more features with histone modification ChIP-seq profiles, the practical differences between H3 and WCE controls often have a negligible impact on the quality of a standard analysis [47].
Decision Workflow and Experimental Design
The following diagram illustrates the decision-making pathway for selecting an appropriate control strategy based on experimental goals and constraints.
Detailed Protocols for Primary Cell Research
Input DNA (WCE) Preparation from Primary Cells
This protocol is adapted for primary cells, such as hematopoietic stem and progenitor cells isolated from mouse fetal liver [47].
- Crosslinking: Begin with ~250,000 formaldehyde-crosslinked primary cells.
- Cell Lysis and Chromatin Preparation: Lyse cells in a suitable buffer (e.g., 5 mM PIPES pH 8, 85 mM KCl, 1% igepal) supplemented with fresh protease inhibitors (e.g., PMSF, aprotinin, leupeptin) [10].
- Chromatin Shearing: Sonicate crosslinked chromatin using a focused ultrasonicator (e.g., Covaris) to achieve a fragment size distribution of 100-1000 bp. Critical: Verify fragment size on a 1% agarose gel post-sonication [49].
- Input Sample Collection: Remove a fraction of the sheared chromatin (equivalent to 1-10% of the total volume) to serve as the input control. Reverse crosslinks, purify DNA using a commercial kit (e.g., ChIP Clean and Concentrator, Zymo), and quantify [47].
- Sequencing Library Preparation: Proceed to prepare a sequencing library from the purified DNA using a standard kit (e.g., Illumina TruSeq DNA Sample Prep Kit). The ENCODE consortium recommends a minimum of 45 million usable fragments per replicate for broad histone marks like H3K27me3 [4].
Histone H3 Pull-down for Normalization
This protocol runs in parallel to the target histone modification ChIP.
- Shared Initial Steps: Crosslinking, lysis, and chromatin shearing are performed identically to section 4.1 and in parallel with the experimental ChIP sample.
- Immunoprecipitation: Incubate the sheared chromatin with a validated antibody against core Histone H3 (e.g., AbCam H3 antibody) overnight at 4°C [47].
- Capture and Wash: Add Protein G magnetic beads (ensure they are not blocked with DNA if for sequencing) and incubate. Wash beads comprehensively with IP dilution buffer and other appropriate wash buffers [10] [49].
- Elution and DNA Cleanup: Reverse crosslinks and purify immunoprecipitated DNA alongside the experimental ChIP and input samples to ensure identical processing [47].
- Library Preparation and Sequencing: Prepare libraries for all samples simultaneously. Sequence the H3 control to a depth comparable to the experimental ChIP samples for effective normalization.
Specialized Technique: Spike-in Chromatin Normalization
For experiments where global histone mark levels are expected to change significantly, such as upon inhibition of a histone methyltransferase (e.g., EZH2), a spike-in normalization method is recommended [50]. This method allows for precise quantitative comparisons.
- Principle: A constant amount of chromatin from a different species (e.g., Drosophila melanogaster) is added to each ChIP reaction as an internal standard.
- Protocol Modification: Spike a defined quantity of D. melanogaster chromatin into each ChIP reaction from the primary cells. Perform a combined immunoprecipitation using two antibodies: one against the target histone mark in the primary cells, and another against a mark unique to the spike-in chromatin (e.g., D. melanogaster-specific H2Av) [50].
- Data Analysis: The sequencing reads mapping to the spike-in genome provide a scaling factor to normalize the ChIP-seq data from the experimental genome, correcting for global changes and technical variability [50].
The Scientist's Toolkit: Essential Reagents and Materials
Table 2: Key research reagent solutions for controlled ChIP-seq
| Reagent / Solution | Function & Importance | Example Products & Specifications |
|---|---|---|
| ChIP-Validated Antibodies | Critical for specific enrichment. Must be validated for ChIP-seq application. | For modifications: CST #9733S (H3K27me3), Millipore #07-352 (H3K9ac) [10]. For H3 Control: AbCam H3 antibody [47]. |
| Protein G Magnetic Beads | Capture antibody-target complexes. Magnetic beads are preferred for low background and ease of use, especially for ChIP-seq. | SimpleChIP Kits Magnetic Beads; must be DNA-free to avoid contaminating sequencing libraries [49]. |
| Chromatin Shearing Platform | Fragment chromatin to optimal size (150-900 bp). Ensures efficient IP and resolution. | Covaris sonicator (focused ultrasonication) or enzymatic digestion (Micrococcal Nuclease) [47] [49]. |
| Crosslinking Reagents | "Freeze" protein-DNA interactions in vivo. | Formaldehyde (37%) for crosslinking; Glycine for quenching [10]. |
| Protease Inhibitors | Prevent proteolytic degradation of chromatin and epitopes during preparation. | Cocktail including PMSF, Aprotinin, Leupeptin [10]. |
| Specialized Kits | Provide optimized, standardized buffers and protocols for robust performance. | SimpleChIP Plus Sonication or Enzymatic IP Kits (CST); ChIP Clean and Concentrator kits (Zymo) [47] [49]. |
Selecting the optimal control for histone modification ChIP-seq is a strategic decision that directly impacts data validity. For most standard applications in primary cell research, Input DNA (WCE) serves as a robust and universally accepted control. When investigating global changes in histone mark abundance or normalizing specifically for nucleosome occupancy, the Histone H3 pull-down provides superior normalization. Meanwhile, IgG controls remain valuable for troubleshooting antibody-specificity issues. Adherence to consortium standards like those from ENCODE—including the use of biological replicates and stringent quality controls such as the FRiP score—is paramount for generating reliable, publication-quality epigenomic data [4]. By applying the decision workflow and detailed protocols outlined herein, researchers can design and execute ChIP-seq experiments with the confidence that their findings are built upon a solid experimental foundation.
Solving Common Pitfalls: Quality Control and Optimization Strategies
Chromatin Immunoprecipitation followed by sequencing (ChIP-seq) has become the foundational method for genome-wide profiling of histone modifications, providing critical insights into the epigenetic regulatory landscape of primary cells. However, the complexity of ChIP-seq workflows, from immunoprecipitation to library preparation and sequencing, introduces multiple potential sources of variation that can significantly impact data quality and interpretation. For researchers investigating histone modifications in primary cells—where sample material is often limited—implementing robust quality control (QC) metrics is particularly crucial for ensuring biologically meaningful results. The ENCODE Consortium and other large-scale epigenomic projects have established standardized QC metrics that enable objective assessment of ChIP-seq data quality, facilitating meaningful comparisons across experiments and studies. This protocol focuses on four essential QC parameters: FRiP score, NSC, RSC, and library complexity measures, providing researchers with a comprehensive framework for quality assessment specifically tailored to histone modification studies in primary cell systems.
Core QC Metrics: Definitions and Interpretations
Fraction of Reads in Peaks (FRiP)
Fraction of Reads in Peaks (FRiP) is defined as the proportion of all mapped reads that fall within identified peak regions relative to the total mapped reads. This metric serves as a direct measure of the signal-to-noise ratio in a ChIP-seq experiment, reflecting the efficiency of the immunoprecipitation step. A higher FRiP score indicates more successful target-specific enrichment. For histone modifications, which typically display broad genomic domains, FRiP score interpretation differs from transcription factor studies. The ENCODE Consortium has established specific FRiP standards based on the type of histone mark being investigated [4].
Table 1: ENCODE Standards for FRiP Scores in Histone ChIP-seq
| Histone Mark Type | Minimum Usable Fragments per Replicate | Expected FRiP Range | Representative Marks |
|---|---|---|---|
| Narrow Peaks | 20 million | Variable, but typically >1% | H3K4me3, H3K27ac, H3K9ac |
| Broad Peaks | 45 million | Variable, but typically >5% | H3K27me3, H3K36me3, H3K4me1 |
| H3K9me3 (exception) | 45 million | Lower due to repetitive regions | H3K9me3 |
Strand Cross-Correlation Metrics: NSC and RSC
Normalized Strand Coefficient (NSC) and Relative Strand Correlation (RSC) are quality metrics derived from cross-correlation analysis of sequencing reads mapping to forward and reverse strands [51]. Strand cross-correlation profiles measure the degree of clustering of reads along the genome, with characteristic peaks corresponding to the average fragment length used for sequencing.
The NSC is calculated as the ratio of the maximum cross-correlation value to the background cross-correlation. It provides a normalized measure of signal strength, with higher values indicating stronger nucleosome enrichment. The RSC is calculated as the ratio of the fragment-length cross-correlation to the background cross-correlation, providing a measure of signal-to-noise that accounts for background characteristics.
Table 2: Interpretation Guidelines for NSC and RSC Values
| Metric | Calculation | Poor Quality | Moderate Quality | High Quality |
|---|---|---|---|---|
| NSC | Max cross-correlation / background | <1.05 | 1.05-1.8 | >1.8 |
| RSC | Fragment-length cross-correlation / background | <0.8 | 0.8-1.2 | >1.2 |
Theoretical characterization of strand cross-correlation has revealed that these metrics are influenced by multiple factors including total mapped reads, the ratio of signal reads, number of peaks, and length of read-enriched regions [51]. For histone marks with broad domains, these metrics require careful interpretation as the enrichment patterns differ from the punctate binding of transcription factors.
Library Complexity Metrics
Library complexity measures the diversity of unique DNA fragments present in a sequencing library, which is particularly important for histone ChIP-seq in primary cells where material is limited and amplification can introduce biases. Low complexity libraries result from excessive PCR amplification of limited starting material and provide less information content per sequenced read. The ENCODE Consortium recommends three primary metrics for assessing library complexity [4]:
- Non-Redundant Fraction (NRF): The proportion of unique mapped reads relative to total mapped reads.
- PCR Bottlenecking Coefficient 1 (PBC1): The ratio of unique genomic locations to distinct reads.
- PCR Bottlenecking Coefficient 2 (PBC2): The ratio of genomic locations covered by exactly one read to locations covered by exactly two reads.
Table 3: Library Complexity Metrics and Standards
| Metric | Calculation | Poor | Acceptable | Preferred |
|---|---|---|---|---|
| NRF | Unique mapped reads / Total mapped reads | <0.5 | 0.5-0.9 | >0.9 |
| PBC1 | Unique locations / Distinct reads | <0.5 | 0.5-0.9 | >0.9 |
| PBC2 | 1-read locations / 2-read locations | <1 | 1-3 | >10 |
Experimental Protocols for Quality Assessment
Protocol: Comprehensive QC Workflow for Histone ChIP-seq
Title: Histone ChIP-seq QC Workflow
Materials and Reagents:
- Primary cells of interest
- Validated histone modification-specific antibodies [10]
- Formaldehyde for crosslinking (37% w/w)
- Glycine for stopping crosslinking
- Cell lysis buffer: 5 mM PIPES pH 8, 85 mM KCl, 1% igepal
- Nuclei lysis buffer: 50 mM Tris-HCl pH 8, 10 mM EDTA, 1% SDS
- Protease inhibitors: PMSF, aprotinin, leupeptin
- Protein A/G magnetic beads
- QIAquick PCR purification kit (QIAGEN)
- Library preparation kit compatible with your sequencing platform
Procedure:
Cell Crosslinking and Chromatin Preparation
- Crosslink 1-10 million primary cells with 1% formaldehyde for 10 minutes at room temperature
- Quench with 125 mM glycine for 5 minutes
- Wash cells with ice-cold PBS containing protease inhibitors
- Resuspend cell pellet in cell lysis buffer and incubate on ice for 15 minutes
- Pellet nuclei and resuspend in nuclei lysis buffer
- Sonicate chromatin to 100-500 bp fragments using a Bioruptor or equivalent sonication system
- Centrifuge to remove insoluble debris and transfer soluble chromatin to a new tube
Chromatin Quality Assessment
- Reverse crosslinks for a small aliquot (10%) of sheared chromatin
- Purify DNA using QIAquick columns and quantify
- Analyze fragment size distribution using Bioanalyzer or TapeStation
- Confirm majority of fragments are between 100-500 bp
Immunoprecipitation and Library Preparation
- Dilute chromatin in IP dilution buffer with protease inhibitors
- Incubate with validated histone modification-specific antibody overnight at 4°C [44]
- Add protein A/G magnetic beads and incubate for 2 hours
- Wash beads sequentially with low salt, high salt, and LiCl wash buffers
- Elute ChIP DNA and reverse crosslinks
- Purify DNA and proceed to library preparation according to manufacturer's instructions
- Sequence libraries using an appropriate Illumina platform
Protocol: Computational QC Assessment
Software Requirements:
- FastQC for initial read quality assessment
- SAMtools for file processing and indexing
- BEDTools for genomic operations
- SPP or similar package for cross-correlation analysis [51]
- Peak caller appropriate for histone marks (e.g., BroadPeak for broad domains)
Procedure:
Data Preprocessing and Alignment
- Perform quality control on raw FASTQ files using FastQC
- Trim adapters and low-quality bases if necessary
- Align reads to appropriate reference genome (e.g., GRCh38 for human)
- Filter aligned BAM files to remove duplicates, low mapping quality reads, and multimapping reads
Library Complexity Calculation
- Calculate Non-Redundant Fraction (NRF):
- Calculate PCR Bottlenecking Coefficients:
- Compare calculated values to ENCODE standards (Table 3)
Strand Cross-Correlation Analysis
- Separate aligned reads by strand
- Calculate cross-correlation at various shift distances
- Identify peak correlation at fragment length
- Calculate NSC and RSC values:
- Compare values to quality thresholds (Table 2)
FRiP Score Calculation
- Call peaks using an appropriate algorithm for histone marks
- Calculate the total reads falling within peaks:
- Compare to expected ranges for specific histone marks (Table 1)
The Scientist's Toolkit: Essential Research Reagents
Table 4: Key Research Reagent Solutions for Histone ChIP-seq
| Reagent Category | Specific Examples | Function & Importance |
|---|---|---|
| Validated Antibodies | Anti-H3K4me3 (CST #9751S), Anti-H3K27ac (Millipore #07-352), Anti-H3K27me3 (CST #9733S) | Critical for specific enrichment; must be validated per ENCODE guidelines [44] |
| Chromatin Shearing Reagents | MNase for enzymatic digestion, Sonication buffers | Generate appropriately sized chromatin fragments (100-300 bp optimal) |
| Library Prep Kits | Illumina TruSeq ChIP Library Preparation Kit | Convert immunoprecipitated DNA to sequenceable libraries with high complexity |
| Spike-in Controls | Drosophila chromatin, Defined nucleosome standards | Enable quantitative comparisons between samples [41] [52] |
| Quality Assessment Tools | Bioanalyzer/TapeStation, Qubit fluorometer | Accurately quantify DNA and assess fragment size distribution |
Advanced Applications and Interpretation Guidelines
Special Considerations for Primary Cells
Working with primary cells presents unique challenges for histone ChIP-seq QC. Limited cell numbers often result in lower library complexity, making careful interpretation of PBC metrics essential. For studies with extremely low cell counts (≤10,000 cells), specialized low-input protocols such as Mint-ChIP may be necessary [52]. These approaches incorporate carrier chromatin and linear amplification steps to maintain complexity while working with minimal material. When analyzing data from primary cells, expect moderately lower NRF and PBC values compared to cell lines, while maintaining the same standards for NSC, RSC, and FRiP when possible.
Integrated Metric Interpretation
Successful quality assessment requires integrated interpretation of all metrics rather than evaluating each in isolation. For example:
- A high FRiP score with low NSC suggests potential over-amplification of a small number of genuine peaks
- Good library complexity with low RSC may indicate poor antibody specificity or insufficient enrichment
- High NSC with low FRiP is characteristic of histone marks with very broad domains like H3K27me3
Recent advances in quantitative epigenomics have introduced spike-in normalization methods using exogenous chromatin standards, enabling more accurate comparison of histone modification levels across different samples and conditions [41]. These approaches are particularly valuable for drug development applications where quantitative assessment of epigenetic changes is essential.
Visualization and Data Integration
Title: QC Metric Relationships
The interdependent nature of ChIP-seq QC metrics necessitates comprehensive assessment. As illustrated, experimental factors influence multiple QC measurements, which collectively determine overall data quality. This framework is particularly important for histone modification studies in primary cells, where sample limitations can affect multiple quality parameters simultaneously. Implementation of the standardized protocols and interpretation guidelines presented here will enable researchers to generate high-quality, reproducible histone ChIP-seq data suitable for publication and regulatory submission in drug development contexts.
Chromatin Immunoprecipitation followed by sequencing (ChIP-seq) has become the method of choice for generating genome-wide profiles of histone modifications in primary cells, providing critical insights into the epigenetic mechanisms governing cell identity, development, and disease states. However, a common challenge faced by researchers is obtaining a low signal-to-noise ratio in their immunoprecipitation (IP) experiments, which can compromise data quality and lead to failed experiments. This issue is particularly prevalent when working with primary cells, where sample material is often limited and chromatin accessibility may vary significantly across cell types. This application note provides a systematic framework for troubleshooting failed IPs, with a specific focus on optimizing ChIP-seq for histone modification studies in primary cells.
Before embarking on troubleshooting, it is essential to understand the potential sources of noise in ChIP-seq experiments. Signal-to-noise ratio is directly correlated with cell number and antibody quality, with higher cell numbers generally yielding better ratios [53]. Background noise can originate from multiple sources: non-specific antibody binding, suboptimal chromatin fragmentation, insufficient crosslinking, or technical artifacts during library preparation and sequencing. For histone modifications, which typically yield broader enrichment domains compared to transcription factors, distinguishing true biological signal from background requires careful experimental design and appropriate analytical approaches [4] [54].
The ENCODE consortium has established stringent quality metrics to evaluate ChIP-seq data, including the Fraction of Reads in Peaks (FRiP), which should typically exceed 1% for histone marks, with higher values (5% or more) indicating stronger enrichments [4] [44]. Other critical quality controls include measures of library complexity (Non-Redundant Fraction >0.9) and reproducibility between biological replicates [4] [44]. When these metrics fall below acceptable thresholds, systematic troubleshooting of the wet laboratory procedures is necessary.
Critical Troubleshooting Areas and Solutions
Antibody Validation and Selection
Antibody quality is arguably the most important factor determining ChIP-seq success. Antibodies must demonstrate both high sensitivity and specificity for the target epitope to generate robust signal over background.
Table 1: Antibody Validation Criteria Based on ENCODE Guidelines [44]
| Validation Method | Pass Criteria | Functional Implications |
|---|---|---|
| Immunoblot Analysis | Single band at expected molecular weight, containing ≥50% of total signal | Indicates specificity for target protein without cross-reactivity |
| Immunofluorescence | Nuclear staining pattern consistent with expected protein localization | Confirms proper cellular localization and accessibility in nuclear context |
| Peptide Blocking | Significant reduction in ChIP signal when antibody pre-incubated with target peptide | Confirms epitope specificity of the immunoprecipitation |
| Knockout/Knockdown Control | Loss of ChIP signal in cells lacking target protein | Provides definitive evidence of antibody specificity |
For histone modifications, it is crucial to select antibodies that have been validated specifically for ChIP-seq applications, as antibodies that work for ChIP-PCR may not always perform adequately for sequencing-based approaches [53]. The ENCODE consortium recommends that antibodies demonstrate at least 5-fold enrichment at positive control regions compared to negative controls in ChIP-PCR assays before being used for ChIP-seq studies [44].
Chromatin Preparation and Fragmentation Optimization
Proper chromatin preparation and fragmentation are essential for achieving high-resolution binding profiles while maintaining epitope accessibility. The optimal fragmentation strategy depends on the specific histone modification being studied and the cell type used.
Table 2: Troubleshooting Chromatin Fragmentation Issues [55]
| Problem | Possible Causes | Recommended Solutions |
|---|---|---|
| Under-fragmented chromatin | Insufficient sonication/MNase digestion; over-crosslinking | Perform sonication time course; increase MNase concentration; reduce crosslinking time |
| Over-fragmented chromatin | Excessive sonication; too much MNase | Reduce sonication cycles/duration; decrease MNase concentration or digestion time |
| Low chromatin yield | Insufficient starting material; incomplete cell lysis | Increase cell input; verify complete nuclear lysis microscopically; optimize lysis buffer |
| Variable fragment sizes | Inconsistent sonication; nuclear clumping | Ensure uniform sonication using focused ultrasonicator; filter nuclei after preparation |
For histone modifications, micrococcal nuclease (MNase) digestion of native chromatin is often preferred as it generates mononucleosome-sized fragments, providing high-resolution mapping of nucleosome modifications [53]. However, the digestion conditions must be carefully optimized for each cell type. A recommended approach is to perform a MNase titration experiment using 0-10μL of diluted enzyme per 100μL nuclei preparation, followed by agarose gel analysis to identify conditions yielding predominantly mononucleosomal fragments (150-200 bp) [55].
For cross-linked chromatin, sonication conditions must be optimized to achieve fragments between 150-300 bp, which are ideal for most sequencing platforms [10] [53]. It is critical to avoid over-sonication, as this can damage chromatin structure and reduce immunoprecipitation efficiency, particularly for transcription factors [53]. The Bioruptor UCD-200 or equivalent focused ultrasonicator is recommended for consistent and reproducible shearing [10].
Experimental Design and Controls
Proper experimental design including appropriate controls is essential for distinguishing true signal from background noise.
Input DNA Controls: Chromatin inputs (non-immunoprecipitated genomic DNA) serve as the optimal control for most ChIP-seq experiments, as they account for biases in chromatin fragmentation and sequencing efficiency [53] [44]. Input DNA should be sequenced to a depth equivalent to the ChIP samples.
Biological Replicates: At least two biological replicates (samples prepared from independent biological samples) are essential to ensure reproducibility and statistical robustness [4] [44]. The ENCODE consortium requires biological replicates for all ChIP-seq experiments, with high concordance measured by metrics such as the Irreproducible Discovery Rate (IDR) [44].
Spike-in Controls: For experiments where global changes in histone modifications are expected (e.g., after HDAC inhibitor treatment), spike-in controls using chromatin from a different species (e.g., Drosophila S2 cells for human studies) are essential for proper normalization [56]. These controls account for differences in total histone content and immunoprecipitation efficiency between samples.
Negative Control Antibodies: Non-immune IgG or antibodies blocked with specific peptides provide negative controls for non-specific immunoprecipitation [57]. However, these are generally considered less informative than input DNA for normalization in sequencing applications [53].
The following diagram illustrates a comprehensive workflow for ChIP-seq troubleshooting, integrating quality control checkpoints:
Cell Number Considerations
The appropriate cell number for ChIP-seq depends on the abundance of the target histone modification and the antibody quality. While conventional protocols typically require 1-10 million cells, alternative approaches have been successfully used with as few as 10,000-100,000 cells for abundant histone modifications like H3K4me3 [53]. For primary cells where material is limited, using the minimal cell number that yields sufficient DNA (10-100 ng) for library preparation is recommended. The table below provides guidelines for different histone modifications:
Table 3: Recommended Cell Numbers for Histone Modification ChIP-seq [10] [53]
| Histone Modification Abundance | Examples | Recommended Cell Number | Notes |
|---|---|---|---|
| High abundance/localized | H3K4me3, H3K9ac | 1-2 million | Strong, localized signals require fewer cells |
| Medium abundance | H3K27me3, H3K36me3 | 2-5 million | Broader domains require moderate coverage |
| Low abundance/diffuse | H3K4me1, H3K9me3 | 5-10 million | Weak or diffuse signals need higher input |
Protocol for Systematic IP Optimization
Materials and Reagents
Table 4: Essential Reagents for Histone ChIP-seq in Primary Cells
| Reagent/Category | Specific Examples | Function and Selection Criteria |
|---|---|---|
| Crosslinking Reagents | Formaldehyde (37%), Glycine | Preserve protein-DNA interactions; 1% final concentration, 10min RT optimal for most histones [10] [57] |
| Chromatin Shearing | Micrococcal nuclease (enzymatic), Bioruptor (sonication) | Fragment chromatin; MNase preferred for histone mapping, sonication for cross-linked factors [55] [53] |
| Histone Modification Antibodies | H3K4me3 (CST #9751S), H3K27me3 (CST #9733S) | Target-specific immunoprecipitation; use ChIP-seq validated antibodies with demonstrated specificity [10] [44] |
| Protein A/G Beads | Magnetic or agarose beads | Antibody capture; select based on antibody species and isotype for optimal binding [57] |
| Protease Inhibitors | PMSF, Aprotinin, Leupeptin | Prevent protein degradation; add fresh to all buffers before use [10] [57] |
| Spike-in Control | Drosophila S2 chromatin | Normalization for global changes; essential when treating with epigenetic modifiers [56] |
Step-by-Step Optimization Protocol
Crosslinking Optimization:
- Prepare three aliquots of primary cells (1×10^6 cells each)
- Crosslink with 1% formaldehyde for 10, 20, and 30 minutes at room temperature
- Quench with 125mM glycine for 5 minutes
- Process through standard ChIP protocol and compare enrichment at positive control regions
- Select the crosslinking time that yields the highest signal-to-noise ratio [57]
Chromatin Fragmentation Assessment:
- After chromatin preparation, remove 50μL aliquot for fragmentation analysis
- Reverse crosslinks by adding 6μL 5M NaCl and 2μL RNAse A, incubate at 37°C for 30min
- Add 2μL Proteinase K, incubate at 65°C for 2 hours
- Analyze DNA fragment size on 1% agarose gel
- Ideal fragmentation should show a smear between 150-900bp, with the majority between 150-300bp [55]
Antibody Titration:
- Set up a series of IP reactions with varying antibody amounts (e.g., 0.5μg, 1μg, 2μg, 5μg)
- Process through standard ChIP protocol and quantify enrichment at positive and negative control regions by qPCR
- Calculate the signal-to-noise ratio (enrichment at positive region ÷ enrichment at negative region)
- Select the antibody concentration that yields the highest ratio without significantly increasing background [53] [57]
Comprehensive Quality Control:
- After sequencing, compute standard QC metrics including FRiP scores, NSC/RSC values, and library complexity measures
- Compare replicates using correlation analysis and IDR for narrow peaks or overlap analysis for broad marks
- Visualize enrichment profiles at positive control regions and known markers using genome browsers
- Only proceed with biological interpretation if QC metrics meet ENCODE standards [4] [44]
Advanced Applications: Spike-in Controlled ChIP-seq
For experiments involving treatments that cause global changes in histone modification levels (e.g., HDAC inhibitors), conventional normalization approaches fail, making spike-in controls essential. The following protocol adapts the approach described by Wu et al. (2021) for histone acetylation studies [56]:
Spike-in Chromatin Preparation:
- Culture Drosophila S2 cells in Schneider's media supplemented with 10% FBS at 21°C
- Harvest 6×10^7 cells and crosslink with 1% formaldehyde for 10 minutes
- Quench with glycine, wash with PBS, and flash-freeze cell pellets
- Prepare chromatin using the same fragmentation protocol as experimental samples
Spike-in Experimental Procedure:
- Mix experimental primary cells (5×10^7) with Drosophila S2 chromatin (equivalent to 1×10^7 cells)
- Process through standard ChIP protocol with anti-histone modification antibody
- During sequencing analysis, use the SPIKER tool or similar approaches to normalize based on spike-in reads
This approach enables accurate quantification of global histone modification changes that would otherwise be obscured by variations in cell number and IP efficiency.
Troubleshooting low signal-to-noise ratios in ChIP-seq experiments requires systematic investigation of multiple experimental parameters, with antibody quality, chromatin preparation, and appropriate controls being the most critical factors. By implementing the validation protocols and optimization strategies outlined in this application note, researchers can significantly improve the quality and reliability of their histone modification ChIP-seq data from primary cells. As the field advances, incorporation of spike-in controls and adherence to established quality metrics will further enhance the reproducibility and biological relevance of epigenomic studies.
Irreproducible Discovery Rate (IDR) analysis is a critical statistical framework in the analysis of chromatin immunoprecipitation followed by sequencing (ChIP-seq) data, particularly for histone modifications. This method provides a robust measure of replicability between biological replicates by comparing the ranks of enriched regions (peaks) identified in each replicate [12]. For the study of histone modifications in primary cells, which often exhibit substantial biological variability, IDR analysis is indispensable for distinguishing consistent, high-confidence epigenetic signals from background noise and irreproducible findings.
The ENCODE Consortium, which sets widely adopted standards for ChIP-seq experiments, mandates IDR analysis for replicated experiments to ensure the reliability of published chromatin states [12]. This protocol outlines the application of IDR analysis specifically for broad histone marks, such as H3K27me3 and H3K9me3, which play crucial roles in gene regulation and are frequently investigated in primary cell systems [58] [12].
IDR Analysis: Theoretical Framework and Experimental Design
The IDR Statistical Foundation
IDR analysis models the joint distribution of peak statistics (typically -log10(p-value) or signal value) from two replicates as a mixture of two components: a reproducible component representing true signal and an irreproducible component representing noise. The method estimates the probability that a peak pair is part of the irreproducible component, effectively controlling the rate of falsely significant peak pairs across replicates [12].
This approach is particularly advantageous for histone modification data because it:
- Does not assume identical peak sets between replicates
- Accounts for differences in signal strength between experiments
- Provides a principled way to rank peaks by reproducibility
- Performs well with both narrow and broad histone marks
Experimental Design Considerations
For IDR analysis to yield meaningful results, proper experimental design is essential. The ENCODE Consortium provides specific guidelines for histone ChIP-seq experiments [12]:
Table 1: ENCODE Experimental Standards for Histone ChIP-seq
| Parameter | Broad Marks (e.g., H3K27me3) | Narrow Marks (e.g., H3K4me3) | Exceptions |
|---|---|---|---|
| Biological Replicates | ≥2 recommended | ≥2 recommended | EN-TEx samples exempt |
| Usable Fragments per Replicate | ≥45 million (minimum) | ≥20 million (minimum) | H3K9me3: 45 million mapped reads |
| Read Length | ≥50 base pairs | ≥50 base pairs | Longer reads encouraged |
| Input Control | Required, matching replicate structure | Required, matching replicate structure | Must match read type/length |
| IDR Quality Metrics | Rescue ratio and self-consistency ratio <2 | Rescue ratio and self-consistency ratio <2 | One ratio <2 acceptable |
Additionally, library complexity must meet quality thresholds with Non-Redundant Fraction (NRF) >0.9, PBC1 >0.9, and PBC2 >3 (preferably >10) to ensure data quality sufficient for IDR analysis [12].
Computational Workflow for IDR Analysis
Preprocessing and Peak Calling
The IDR analysis pipeline begins with quality-controlled sequencing data that has been processed through the standard ChIP-seq workflow:
Figure 1: IDR analysis workflow for histone modifications.
Before IDR analysis, specific quality control metrics must be assessed to ensure data suitability [12]:
Table 2: Pre-IDR Quality Control Checkpoints
| QC Metric | Assessment Method | Threshold | Purpose |
|---|---|---|---|
| Library Complexity | NRF, PBC1, PBC2 | NRF>0.9, PBC1>0.9, PBC2>3 | Ensure sufficient sequencing depth |
| Mapping Statistics | Percentage mapped reads | >80% | Verify alignment efficiency |
| Fragment Length | Cross-correlation analysis | Strong nucleosomal periodicity | Confirm ChIP quality |
| Chromatin Accessibility | ATAC-seq or similar | Cell-type specific baselines | Context for histone marks |
For histone modifications with broad domains like H3K27me3, peak callers must be appropriately configured. MACS2 is commonly used with the --broad flag and adjusted q-value thresholds (e.g., --broad-cutoff 0.1) to accommodate the extended nature of these chromatin marks.
Implementing IDR Analysis
The core IDR analysis compares ranked peak lists from biological replicates. The ENCODE pipeline implements this through the following steps [12]:
Peak List Preparation: Generate sorted, ranked lists of peaks from each biological replicate using a consistent ranking metric (typically p-value or signal value).
Pseudoreplicate Generation: For assessing self-consistency, the pooled reads from replicates are randomly partitioned to create pseudoreplicates.
IDR Calculation: Execute the IDR algorithm comparing both true replicates and pseudoreplicates.
Threshold Application: Identify peaks passing the IDR threshold (typically ≤0.05 or ≤0.01) for subsequent analysis.
The output includes a set of high-confidence peaks that show reproducible enrichment across biological replicates, with associated IDR values indicating their reproducibility rank.
Research Reagent Solutions
Table 3: Essential Reagents for Histone ChIP-seq in Primary Cells
| Reagent Category | Specific Examples | Function & Importance |
|---|---|---|
| Histone Modification Antibodies | Anti-H3K27me3, Anti-H3K4me3, Anti-H3K9me3 | Highly specific antibodies are essential for precise mapping of histone marks; must be validated according to ENCODE standards [12] |
| Chromatin Shearing Reagents | Formaldehyde, Sonication buffers, Micrococcal Nuclease | Proper cross-linking and fragmentation are critical for resolution of histone-marked domains; protocol optimization needed for primary cells [43] |
| Chromatin Immunoprecipitation Kits | MagNA ChIP kit, EZ-ChIP | Standardized reagents for consistent immunoprecipitation across replicates |
| Library Preparation Kits | Illumina TruSeq ChIP, NEB Next Ultra II | High-complexity libraries essential for meeting ENCODE fragment requirements [12] |
| Primary Cell Culture Media | Cell-type specific media with cytokines | Maintain native epigenetic states during cell processing |
| Quality Control Assays | Bioanalyzer, Qubit dsDNA HS assay | Quantification and qualification of DNA before sequencing |
Interpretation and Quality Assessment
Evaluating IDR Results
Successful IDR analysis yields several key outputs that require careful interpretation:
Table 4: Interpreting IDR Analysis Outputs
| Output Metric | Interpretation Guideline | Optimal Range |
|---|---|---|
| IDR Thresholded Peaks | High-confidence reproducible peaks | Varies by mark and cell type |
| Rescue Ratio | Measures rescue of true signals in pooled analysis | <2 recommended [12] |
| Self-Consistency Ratio | Measures internal consistency of peaks | <2 recommended [12] |
| IDR Value Distribution | Should show clear separation of reproducible and irreproducible components | Sharp decrease in number of peaks with decreasing IDR |
For the IDR analysis to be considered successful, the rescue ratio and self-consistency ratio should ideally both be below 2, though the ENCODE standards allow one of these ratios to be below 2 if the other exceeds this threshold slightly [12].
Troubleshooting Common Issues
Several issues may arise during IDR analysis of histone modification data:
High Rescue Ratio (>2): Often indicates substantial differences between replicates, possibly due to technical artifacts or biological variability. Solution: Examine raw data quality and consider whether additional replicates are needed.
Low Peak Overlap Despite High-Quality Replicates: May occur with broad histone marks where peak calling boundaries are ambiguous. Solution: Adjust peak caller parameters or consider alternative analysis methods for broad domains.
Insufficient Numbers of IDR Peaks: Could result from overly stringent thresholding or genuinely low reproducibility. Solution: Examine negative control regions to establish appropriate significance thresholds.
Integration with Downstream Analyses
The high-confidence peaks identified through IDR analysis serve as the foundation for subsequent biological interpretation. For histone modifications in primary cells, these peak sets can be integrated with complementary epigenetic data:
Figure 2: Integration of IDR peaks with multi-omics data.
Recent advances in computational models, such as the General Expression Transformer (GET), demonstrate how chromatin accessibility data combined with sequence information can predict gene expression patterns across cell types [59]. IDR-curated histone modification peaks provide high-confidence inputs for such models, enhancing their predictive power for understanding transcriptional regulation in primary cells.
Protocol Variations for Specific Histone Marks
The standard IDR protocol requires adjustments for specific histone modifications due to their distinct genomic distributions:
H3K9me3: Requires special consideration as it is enriched in repetitive regions, necessitating higher sequencing depth (45 million mapped reads per replicate for tissues and primary cells) and careful handling of multi-mapping reads [12].
Bivalent Marks (H3K4me3/H3K27me3): In stem cells and primary cells, these co-occurring marks require careful peak calling as they mark developmentally poised genes [58].
Broad vs. Narrow Domains: The peak calling parameters must be adjusted prior to IDR analysis—MACS2 with
--broadflag for extended domains like H3K27me3 versus standard calling for punctate marks like H3K4me3.
This protocol provides a comprehensive framework for implementing IDR analysis in histone ChIP-seq studies using primary cells, ensuring robust, reproducible identification of epigenetic regulatory elements for basic research and drug development applications.
In primary cell research, mapping histone modifications via Chromatin Immunoprecipitation followed by sequencing (ChIP-seq) provides critical insights into the epigenetic mechanisms governing cell identity, development, and disease states. The integrity of these insights, however, is profoundly dependent on the precision of peak calling—the computational process that identifies genomic regions significantly enriched for a specific histone mark. The choice of algorithm and its parameters is not a one-size-fits-all endeavor; it must be tailored to the distinct enrichment profiles of different histone modifications. An ill-suited peak caller can misrepresent the epigenomic landscape, leading to flawed biological interpretations. This Application Note provides a structured framework for selecting and optimizing peak calling tools to achieve maximum precision in histone mark analysis, with a specific focus on the challenges and standards relevant to primary cell research.
The Criticality of Peak Shape in Histone Modifications
Histone modifications generate distinct patterns of ChIP-seq enrichment, broadly categorized by the ENCODE consortium as narrow (point-source), broad, or mixed marks [4] [44]. This classification is the primary determinant for selecting an appropriate peak calling algorithm.
- Narrow Marks: These are typically associated with specific regulatory elements like active promoters or enhancers. They produce sharp, well-defined peaks over short genomic regions. Examples include H3K4me3 (promoters) and H3K9ac (active enhancers) [60] [27].
- Broad Marks: These often cover large genomic domains, such as repressed or actively transcribed regions. They generate wide, sometimes diffuse, enrichment signals. Key examples are H3K27me3 (facultative heterochromatin) and H3K36me3 (transcribed gene bodies) [4] [27].
- Mixed Marks: Some factors or modifications, like RNA polymerase II, can exhibit both narrow and broad binding patterns in different genomic contexts [44].
Table 1: Common Histone Modifications and Their Peak Characteristics
| Histone Mark | Peak Shape | Genomic Association | Biological Role |
|---|---|---|---|
| H3K4me3 | Narrow | Promoters | Transcriptional activation |
| H3K27ac | Narrow | Active enhancers and promoters | Enhancer activity |
| H3K9ac | Narrow | Promoters | Transcriptional activation |
| H3K4me1 | Narrow/Broad | Enhancers | Enhancer marking |
| H3K27me3 | Broad | Gene bodies | Transcriptional repression |
| H3K36me3 | Broad | Gene bodies | Transcriptional elongation |
| H3K9me3 | Broad | Repetitive regions, heterochromatin | Constitutive heterochromatin |
A Strategic Workflow for Peak Caller Selection
The following diagram outlines a systematic decision workflow to guide researchers in selecting and validating a peak calling strategy for their specific histone mark.
Comparative Performance of Peak Calling Algorithms
Independent benchmarking studies have evaluated numerous peak callers across different histone marks and biological scenarios. Performance is often measured by metrics such as the Area Under the Precision-Recall Curve (AUPRC), sensitivity, precision, and motif enrichment within called peaks [61] [27].
Table 2: Peak Caller Performance and Recommended Use Cases
| Tool | Best For | Key Features & Strengths | Considerations |
|---|---|---|---|
| MACS2 (Model-based Analysis for ChIP-Seq) | Narrow peaks (default) and broad peaks (with --broad flag) [60] [61] |
Widely used, highly cited, good all-around performance on transcription factors and sharp histone marks. | The default mode is suboptimal for very broad marks; requires the broad option for H3K27me3, H3K36me3 [27]. |
| BCP (Bayesian Change Point) / MUSIC (MUltiScale enrIchment Calling) | Broad histone marks (H3K27me3, H3K36me3) [61] | Specifically designed for multi-scale enrichment patterns; powerful for domains of histone modification [61]. | Less frequently used than MACS2, potentially requiring more computational expertise. |
| SICER2 | Broad histone marks [27] | Window-based approach that clusters nearby enriched regions; effective for identifying large domains [27] [62]. | May not be as sensitive for sharp, punctate marks. |
| GEM (Genome wide Event finding and Motif discovery) | Narrow peaks, especially for pinpointing exact binding locations [61] | Incorporates genome sequence information to improve resolution; high fraction of peaks near binding motifs [61]. | |
| WACS (Weighted Analysis of ChIP-seq) | Scenarios with multiple or complex controls [63] | Extends MACS2 by optimally weighting multiple control datasets to better model experimental noise [63]. | Most beneficial when biases are poorly captured by a single input control. |
For differential peak analysis between biological conditions, tool performance is highly dependent on the biological scenario. In a 2022 comprehensive benchmark, bdgdiff (MACS2), MEDIPS, and PePr showed high median performance across various scenarios, including comparisons of primary cell states or global changes after perturbations [27].
Optimizing Parameters and Experimental Design
Sequencing Depth and Quality Control
The ENCODE consortium has established rigorous standards for ChIP-seq experiments, which are highly applicable to primary cell studies [4] [44].
- Sequencing Depth: For narrow histone marks, 20 million usable fragments per replicate is recommended. For broad marks, a deeper 45 million fragments per replicate is required, with H3K9me3 being a noted exception due to its enrichment in repetitive regions [4].
- Quality Metrics: Essential quality control metrics include the FRiP (Fraction of Reads in Peaks) score, which should be reported for each experiment. Library complexity is measured by the Non-Redundant Fraction (NRF > 0.9) and PCR Bottlenecking Coefficients (PBC1 > 0.9, PBC2 > 10) [4] [44].
- Controls and Replication: A matched input DNA control is essential for accurate peak calling. Biological replicates are mandatory for confident identification of enriched regions, with reproducibility assessed by metrics like the Irreproducibility Discovery Rate (IDR) [60] [4] [44].
Antibody Validation
The specificity of the ChIP-seq experiment hinges entirely on the antibody. ENCODE guidelines require rigorous validation through primary and secondary tests. For histone modifications, this typically involves immunoblotting or immunofluorescence to confirm specificity, and the use of the antibody in a successful ChIP-seq experiment that produces the expected genomic pattern serves as a critical functional validation [44].
The Scientist's Toolkit: Essential Research Reagents and Materials
The following table details key reagents and materials required for a robust ChIP-seq experiment in primary cells, as derived from established protocols [10] [44] [64].
Table 3: Key Research Reagent Solutions for Histone ChIP-seq
| Reagent/Material | Function | Example & Notes |
|---|---|---|
| Crosslinking Reagent | Covalently links proteins to DNA in living cells, "freezing" interactions. | Formaldehyde (37%). The cross-linking time may need optimization for primary cells [10]. |
| ChIP-Grade Antibody | Immunoprecipitates the histone modification of interest. | Must be rigorously validated (e.g., CST #9751S for H3K4me3; Diagenode #pAb-037-050 for H3K4me1) [10] [44]. |
| Protein A/G Magnetic Beads | Captures the antibody-protein-DNA complex. | More efficient and easier to handle than sepharose beads. |
| Cell Lysis & Nuclei Lysis Buffers | Lyses cells and releases chromatin for fragmentation. | Must include protease inhibitors (e.g., PMSF, Aprotinin) [10]. |
| Sonication Device | Shears chromatin to optimal fragment size (100-300 bp). | Bioruptor (Diagenode) or focused ultrasonicator. Efficiency must be checked empirically [10]. |
| DNA Purification Kit | Purifies immunoprecipitated DNA for sequencing library prep. | QIAquick PCR Purification Kit (QIAGEN) or similar [10]. |
| Input DNA | Control sample representing the whole-genome chromatin background. | A portion of the sonicated chromatin set aside before immunoprecipitation. Non-negotiable for accurate peak calling [4] [44]. |
Achieving peak calling precision in histone mark ChIP-seq is a deliberate process that integrates experimental rigor and informed bioinformatic analysis. For researchers working with precious primary cell samples, this is paramount. The strategy can be summarized as follows: First, classify your histone mark as narrow or broad. Second, select a tool from the recommended algorithms, such as MACS2 for narrow marks or SICER2/BCP for broad domains. Third, adhere to community standards for sequencing depth, replication, and quality control, including the mandatory use of a matched input control. By following this structured approach, scientists can ensure their epigenetic data is robust, reproducible, and accurately reflects the biological state of their primary cells, thereby solidifying the foundation for all subsequent scientific discoveries.
Chromatin Immunoprecipitation followed by sequencing (ChIP-seq) has become an indispensable technique for mapping histone modifications and transcription factor binding sites genome-wide. However, the analytical phase of ChIP-seq is fraught with potential pitfalls that can compromise data integrity and lead to erroneous biological conclusions. Within the context of researching histone modifications in primary cells—where material is often precious and limited—two areas demand particular vigilance: the proper use of control samples and the systematic filtering of genomic blacklist regions. These technical considerations are not merely procedural formalities but are fundamental to producing biologically valid results that accurately reflect the epigenomic landscape of primary cell types, which is essential for understanding cellular identity in health, disease, and drug response.
The Critical Role of Controls in ChIP-seq Analysis
Understanding Control Types and Their Misapplication
Controls in ChIP-seq experiments serve to distinguish true biological enrichment from background noise arising from technical biases. The misuse of controls represents one of the most prevalent mistakes in ChIP-seq analysis [54].
Table 1: Types of Controls in ChIP-seq and Their Proper Use
| Control Type | Definition | Appropriate Use | Common Misuses |
|---|---|---|---|
| Input DNA | Genomic DNA from cross-linked and sheared chromatin, non-immunoprecipitated. | The standard control for most ChIP-seq experiments, including those for histone modifications. Corrects for sequencing biases, open chromatin, and mappability. | Using low-quality or low-coverage input; using no control at all; failing to sequence input deeply enough. |
| IgG | Immunoprecipitation with a non-specific antibody (e.g., immunoglobulin G). | Can be valuable for transcription factor ChIP to account for non-specific antibody binding. | Using IgG for histone marks, where input DNA is strongly preferred. |
| Mock IP | ChIP performed in a genetic background lacking the antigen or without antibody. | Helps identify regions prone to non-specific enrichment during the IP process. | Not commonly required for most histone modification studies where input DNA suffices. |
Misuse of controls directly leads to artifactual findings. For instance, a project profiling H3K27ac in liver tissue claimed novel enhancer activation in pericentromeric regions, but this signal was later identified as background artifact resulting from the complete absence of an input DNA control [54]. Without the proper reference, peak-calling algorithms like MACS2 cannot differentiate true biological signal from technical noise.
Consequences of Inadequate Controls
The repercussions of control misuse are severe and multifaceted:
- Inflation of False Positives: Peaks appear in high-mappability or GC-rich regions due to background rather than real enrichment [54].
- Spurious Biological Claims: As in the H3K27ac example, findings that contradict established biology often trace back to control issues.
- Compromised Normalization: Downstream analyses, including differential binding assessments, become unreliable when normalization is based on flawed background models.
Best Practices for Control Experiments
To ensure controls fulfill their purpose, researchers should adhere to the following protocols:
- Always include a control: Input DNA is the gold standard for histone modification ChIP-seq.
- Ensure high quality and depth: Input controls should be sequenced to a depth at least equal to, and ideally greater than, the IP samples. A 1:1 or 2:1 ChIP-to-input read ratio is recommended [54].
- Validate control quality: Before peak calling, assess control library complexity and coverage uniformity. If input control is unavailable or of poor quality, apply computational corrections like GC bias normalization (e.g., using deepTools) as a last resort [54].
The diagram below outlines a logical workflow for selecting and implementing the appropriate control in a ChIP-seq experiment.
Genomic Blacklist Regions: An Essential Filtering Step
Definition and Origin of Blacklist Regions
The ENCODE blacklist comprises a comprehensive set of genomic regions in human, mouse, worm, and fly genomes that consistently exhibit anomalous, high signal levels in next-generation sequencing experiments, independent of cell line or experimental conditions [65]. These regions are characterized by:
- Unstructured signal: High signal that does not form coherent peaks.
- Technical artifacts: Arising from issues like repetitive sequences, under-representation in the reference genome, nuclear mitochondrial DNA segments (NUMTs), and satellite repeats [65].
- Assembly problems: Many problematic regions correspond to gaps or inaccuracies in the genome assembly.
Despite improvements in newer genome assemblies, blacklisted regions persist, primarily in hard-masked telomeric and pericentromeric regions, and remain a critical source of aberrant signals [66]. Failing to filter them introduces significant noise and bias.
Impact of Neglecting Blacklist Filtering
The consequences of not removing blacklist regions are demonstrably severe across multiple analytical dimensions:
- Skewed Peak Calls: A high proportion of peaks can fall into these artifact-prone regions, misleading researchers. In extreme cases, some ENCODE experiments had up to 87% of reads mapping to blacklisted regions [65].
- Distorted Biological Interpretation: Top-ranked peaks may localize to satellite repeats or centromeric regions, leading to spurious claims of regulatory function. In a study on human keratinocytes, top H3K27ac peaks in the centromeric region of chr9 disappeared after blacklist filtering [54].
- Correlation Artifacts: Blacklist regions can sequester a large portion of ChIP-seq reads, creating an illusion of high correlation between biologically unrelated factors. For example, the removal of blacklist regions eliminated spurious correlations between the repressor REST and various activating transcription factors, revealing a more biologically plausible correlation structure [65].
Best Practices for Blacklist Implementation
- Always Filter: Removing blacklist regions is still considered a best-practice step in ChIP-seq analysis [66].
- Use Assembly-Specific Lists: Blacklists are specific to genome assemblies (e.g., hg19, GRCh38). Lift-over from an old assembly is not valid [65].
- Apply Early: Filtering should occur before any threshold application, normalization, or peak calling [65].
- Choose the Right Tool: Standard tools like
bedtools intersector functionality within deepTools can be used for filtering.
Greenscreen: An Alternative for Species Without Blacklists
For researchers working with model or non-model organisms that lack a curated ENCODE blacklist, the "greenscreen" method provides a robust alternative [67]. This method uses a small number of input control samples (as few as two) and standard peak-calling with MACS2 to identify regions with consistently high artifactual signals. Greenscreen performs as effectively as the blacklist while covering less of the genome and can be readily applied to any species [67].
Table 2: Comparison of Genomic Filtering Methods
| Feature | ENCODE Blacklist | Greenscreen |
|---|---|---|
| Basis | Systematic analysis of hundreds of input samples from ENCODE [65]. | Peak calling on available input samples from the researcher's own experiments [67]. |
| Coverage | Comprehensive for human (hg19, hg38), mouse (mm9, mm10), worm, and fly. | Applicable to any species or genome build. |
| Resource Intensity | High (requires many samples and computational resources to generate). | Low (effective with as few as 2 input samples). |
| Ease of Implementation | Simple filtering if available for your organism. | Easy to generate using common ChIP-seq tools (MACS2). |
| Recommended Use Case | Default choice for supported organisms. | Essential for organisms without a blacklist; a valid alternative for supported ones. |
The Scientist's Toolkit: Essential Research Reagents and Computational Tools
Table 3: Key Reagents and Tools for Robust ChIP-seq Analysis
| Item | Function | Considerations for Primary Cells |
|---|---|---|
| High-Quality Antibodies | Specific immunoprecipitation of the target histone mark. | Validate for specificity in your primary cell type; low antibody efficiency is a major source of failure. |
| Input DNA | Control for technical biases in sequencing and background signal. | Generate from the same primary cell batch as IP samples; ensure sufficient quantity and quality. |
| Cell Sorting/FACS | Purification of specific cell populations from heterogeneous primary tissues. | Critical for FFPE tissues or mixed populations to avoid confounding signals from non-target cells [6]. |
| MACS2 | Standard software for peak calling from aligned reads. | Choose parameters based on mark: use --broad for broad histone marks like H3K27me3 [54]. |
| ENCODE Blacklist | Bed file of problematic regions for filtering. | Always use the version matching your genome assembly. |
| bedtools | Command-line toolkit for genomic arithmetic, including filtering. | Use bedtools intersect -v to remove blacklisted peaks/regions [66]. |
| PhantomPeakTools | Calculate NSC and RSC scores to assess enrichment quality. | An RSC < 0.5 indicates no enrichment; do not proceed if QC fails [54]. |
The path to generating reliable and biologically meaningful ChIP-seq data, particularly from valuable primary cell samples, is paved with rigorous analytical practices. The misuse of controls and the neglect of genomic blacklist regions are not minor oversights but fundamental errors that can invalidate an entire study's conclusions. By adhering to the protocols outlined—employing high-quality, deeply sequenced input controls; systematically filtering artifact-prone genomic regions using assembly-specific blacklists or the greenscreen method; and implementing comprehensive quality control metrics—researchers can safeguard their data against these common pitfalls. In the context of drug development and primary cell research, where epigenetic mechanisms are increasingly central, such analytical rigor is not optional but essential for building accurate models of gene regulation and for identifying robust therapeutic targets.
From Data to Biological Insight: Validation, Analysis, and Emerging Technologies
For researchers employing ChIP-seq for histone modifications in primary cells, benchmarking against large-scale public consortia like the Encyclopedia of DNA Elements (ENCODE) is a critical step for validating data quality and biological significance. The ENCODE consortium has established comprehensive, freely accessible resources featuring over 23,000 functional genomics experiments, providing a robust foundation for comparative analysis [68]. For histone modification studies, particularly in challenging primary cell systems, leveraging these curated datasets allows scientists to contextualize their findings against rigorously validated standards, ensuring that observed patterns reflect genuine biology rather than technical artifacts. This application note provides a detailed framework for correlating histone ChIP-seq data with ENCODE resources, complete with standardized protocols and quality metrics tailored for the primary cell research community.
ENCODE Standards for Histone ChIP-seq
The ENCODE consortium has developed specialized processing pipelines and quality standards for histone ChIP-seq data, distinct from those for transcription factor binding studies. These standards are essential benchmarks for any experimental dataset.
Experimental Design and Sequencing Standards
Table 1: ENCODE Experimental Standards for Histone ChIP-seq
| Parameter | Broad Mark Standards | Narrow Mark Standards | Exceptions |
|---|---|---|---|
| Biological Replicates | Minimum of two biological replicates (isogenic or anisogenic) [4] | Minimum of two biological replicates (isogenic or anisogenic) [4] | EN-TEx samples may be exempt due to material limitations [4] |
| Input Controls | Required, with matching run type, read length, and replicate structure [4] | Required, with matching run type, read length, and replicate structure [4] | Must be processed through same pipeline as experimental samples [4] |
| Read Depth | 45 million usable fragments per replicate [4] | 20 million usable fragments per replicate [4] | H3K9me3 requires 45 million total mapped reads in tissues/primary cells [4] |
| Read Length | Minimum 50 base pairs (25 base pairs processable) [4] | Minimum 50 base pairs (25 base pairs processable) [4] | Longer read lengths encouraged [4] |
| Library Complexity | NRF > 0.9, PBC1 > 0.9, PBC2 > 10 [4] | NRF > 0.9, PBC1 > 0.9, PBC2 > 10 [4] | Critical quality metric for data release [4] |
Table 2: ENCODE Classification of Histone Modifications
| Broad Marks | Narrow Marks | Special Cases |
|---|---|---|
| H3F3A | H2AFZ | H3K9me3 |
| H3K27me3 | H3ac | |
| H3K36me3 | H3K27ac | |
| H3K4me1 | H3K4me2 | |
| H3K79me2 | H3K4me3 | |
| H3K79me3 | H3K9ac | |
| H3K9me1 | ||
| H3K9me2 | ||
| H4K20me1 |
Antibody Validation Requirements
Antibody characterization must follow ENCODE consortium standards specific to histone modifications and chromatin-associated proteins (October 2016 standards) [4]. All antibodies used in ENCODE experiments undergo rigorous validation for specificity and performance, which researchers should verify when selecting reagents for their own studies. When benchmarking, using the same antibody sources as corresponding ENCODE experiments significantly improves correlation metrics.
Experimental Protocols for Robust Histone Modification Profiling
ENCODE-Compliant Histone ChIP-seq Protocol
This protocol is optimized for primary cells, accounting for typically limited starting material.
Day 1: Cross-linking and Cell Lysis
- Cell Preparation: Harvest 1-10 million primary cells per immunoprecipitation. Centrifuge at 500 × g for 5 minutes at 4°C.
- Cross-linking: Resuspend cell pellet in 10 mL cold PBS with 1% formaldehyde. Incubate for 10 minutes at room temperature with gentle rotation.
- Quenching: Add 1 mL of 1.25 M glycine to a final concentration of 0.125 M. Incubate for 5 minutes at room temperature with rotation.
- Washing: Centrifuge at 500 × g for 5 minutes at 4°C. Wash pellet twice with 10 mL cold PBS.
- Cell Lysis: Resuspend cell pellet in 1 mL Cell Lysis Buffer (10 mM Tris-HCl pH 8.0, 10 mM NaCl, 0.2% NP-40) with protease inhibitors. Incubate on ice for 15 minutes.
- Nuclear Pellet: Centrifuge at 2000 × g for 5 minutes at 4°C. Resuspend nuclear pellet in 1 mL Nuclear Lysis Buffer (50 mM Tris-HCl pH 8.0, 10 mM EDTA, 1% SDS) with protease inhibitors.
Day 1: Chromatin Shearing and Immunoprecipitation
- Chromatin Fragmentation: Sonicate chromatin to 200-500 bp fragments using optimized conditions (typically 6-10 cycles of 30-second pulses at high intensity with 30-second rest intervals on ice).
- Centrifugation: Centrifuge sonicated lysate at 16,000 × g for 10 minutes at 4°C. Transfer supernatant to new tube.
- Dilution: Dilute chromatin 10-fold in ChIP Dilution Buffer (16.7 mM Tris-HCl pH 8.0, 167 mM NaCl, 1.2 mM EDTA, 1.1% Triton X-100, 0.01% SDS).
- Pre-clearing: Add 50 μL protein A/G beads per sample. Rotate for 1 hour at 4°C. Centrifuge at 2000 × g for 2 minutes, transfer supernatant.
- Antibody Incubation: Add 2-5 μg validated histone modification antibody. Rotate overnight at 4°C.
Day 2: Capture, Washes, and Elution
- Bead Capture: Add 60 μL protein A/G beads. Rotate for 2 hours at 4°C.
- Washing: Pellet beads and sequentially wash with:
- 1 mL Low Salt Wash Buffer (20 mM Tris-HCl pH 8.0, 150 mM NaCl, 2 mM EDTA, 1% Triton X-100, 0.1% SDS)
- 1 mL High Salt Wash Buffer (20 mM Tris-HCl pH 8.0, 500 mM NaCl, 2 mM EDTA, 1% Triton X-100, 0.1% SDS)
- 1 mL LiCl Wash Buffer (10 mM Tris-HCl pH 8.0, 250 mM LiCl, 1 mM EDTA, 1% NP-40, 1% sodium deoxycholate)
- 1 mL TE Buffer (10 mM Tris-HCl pH 8.0, 1 mM EDTA)
- Each wash: rotate 5 minutes at 4°C, centrifuge at 2000 × g for 2 minutes
- Elution: Add 250 μL Elution Buffer (100 mM NaHCO₃, 1% SDS). Vortex gently, incubate 15 minutes at room temperature with rotation. Centrifuge, transfer supernatant. Repeat elution, combine supernatants.
- Reverse Cross-linking: Add 20 μL of 5 M NaCl to eluates. Incubate overnight at 65°C.
Day 3: DNA Purification and Quality Control
- Protein Digestion: Add 10 μL of 0.5 M EDTA, 20 μL of 1 M Tris-HCl pH 6.5, and 2 μL Proteinase K (20 mg/mL). Incubate 1 hour at 45°C.
- DNA Purification: Purify DNA using PCR purification kit. Elute in 30 μL Elution Buffer.
- Quality Control: Assess DNA concentration by fluorometry. Verify fragment size distribution (200-500 bp) using Bioanalyzer/TapeStation.
Emerging Methods: CUT&Tag for Low-Input Primary Cells
For primary cell applications with limited material, CUT&Tag offers a promising alternative with demonstrated correlation to ENCODE ChIP-seq data.
Protocol Highlights:
- Cell Input: 50,000-100,000 primary cells per assay (200-fold lower than ChIP-seq) [69]
- Permeabilization: Use digitonin for nuclear membrane permeabilization
- Antibody Validation: Critical - use ChIP-seq validated antibodies (e.g., Abcam-ab4729 for H3K27ac) [69]
- Control Considerations: Include negative control (IgG) and positive control (H3K27me3 recommended) [69]
- Sequencing Depth: 10-20 million reads for histone modifications, significantly lower than ChIP-seq requirements [69]
Performance Notes: Recent benchmarking shows CUT&Tag recovers approximately 54% of ENCODE ChIP-seq peaks for histone modifications H3K27ac and H3K27me3, with identified peaks representing the strongest ENCODE peaks and showing similar functional enrichments [69].
Computational Pipeline for ENCODE Correlation
Data Processing and Alignment
The ENCODE uniform processing pipeline provides the standard framework for comparative analysis:
Primary Analysis Steps:
- Adapter Trimming: Use Trimmomatic or Cutadapt to remove adapter sequences
- Quality Control: FastQC assessment of read quality
- Alignment: Map to GRCh38 (human) or mm10 (mouse) using BWA or Bowtie2 [4]
- Duplicate Marking: Identify PCR duplicates using Picard Tools
- Filtering: Remove low-quality reads and duplicates
ENCODE-Specific Requirements:
- Read Filtering: Remove reads with mapping quality < 30 [4]
- Strand Cross-Correlation: Calculate NSC and RSC metrics [4]
- Library Complexity: Calculate NRF, PBC1, and PBC2 [4]
Peak Calling and Signal Generation
The histone analysis pipeline differs significantly from transcription factor pipelines:
Replicated Experiments:
- Initial Peak Calling: Perform relaxed peak calling on individual replicates and pooled reads
- Irreproducible Discovery Rate: Use IDR analysis to identify consistent peaks
- Final Peak Set: Create consensus peak set with thresholded FDR < 0.05 [4]
Unreplicated Experiments:
- Pseudoreplication: Split reads into two pseudoreplicates
- Peak Concordance: Identify peaks overlapping ≥50% between pseudoreplicates [4]
Output Files:
- bigWig: Fold-change over control and signal p-value tracks [4]
- BED/narrowPeak: Final peak calls with statistical support [4]
Benchmarking Metrics and Correlation Analysis
Quantitative Comparison Framework
Table 3: Key Metrics for ENCODE Correlation Benchmarking
| Metric Category | Specific Metrics | Target Values | Calculation Method |
|---|---|---|---|
| Sequencing Quality | Total reads, Mapping rate, Duplicate rate | >20M reads, >70% mapping, <50% duplicates [4] | FastQC, SAMtools |
| Library Complexity | NRF, PBC1, PBC2 | NRF>0.9, PBC1>0.9, PBC2>10 [4] | ENCODE pipeline [4] |
| Peak Quality | FRiP score, Peak number, Peak width | FRiP>0.01 (histones), mark-dependent numbers [4] | Fraction of reads in peaks |
| Reproducibility | IDR rate, Pearson correlation | IDR<0.05, R²>0.8 between replicates [4] | IDR analysis, deepTools |
| ENCODE Concordance | Peak recall, Precision, Jaccard index | Recall>0.5 for CUT&Tag [69] | BEDTools overlap |
Step-by-Step Correlation Protocol
Data Retrieval:
- Identify Relevant ENCODE Datasets: Use the ENCODE portal (encodeproject.org) to find experiments with same histone mark, cell type, and antibody [68]
- Download Processed Data: Access bigWig, narrowPeak, and quality metric files via portal or API [68]
Comparative Analysis:
- Genomic Interval Overlap: Use BEDTools to calculate overlap between candidate peaks and ENCODE peak sets
- Signal Correlation: Compute genome-wide correlation of bigWig signals using deepTools multiBigwigSummary
- Functional Concordance: Compare genomic annotations (promoter, enhancer, heterochromatin) using ChIPseeker
- Motif Enrichment: Verify similar transcription factor motif enrichment using HOMER
Interpretation Guidelines:
- High Correlation: >70% peak overlap with similar genomic distribution indicates robust data
- Moderate Correlation: 40-70% overlap may reflect biological differences or technical variability
- Low Correlation: <40% overlap warrants investigation of experimental or analytical issues
The Scientist's Toolkit: Research Reagent Solutions
Table 4: Essential Reagents for Histone Modification Studies
| Reagent Category | Specific Examples | Function & Importance | ENCODE Validation |
|---|---|---|---|
| Histone Antibodies | H3K27ac (Abcam-ab4729), H3K27me3 (Cell Signaling-9733) [69] | Target-specific immunoprecipitation; critical for specificity | Used in ENCODE reference datasets [69] |
| Chromatin Shearing Reagents | Covaris microTUBEs, Diagenode Bioruptor | DNA fragmentation to optimal size (200-500 bp) | Compatible with standard protocols [4] |
| Library Prep Kits | Illumina TruSeq ChIP Library Prep Kit, NEB Next Ultra II | Sequencing library construction with minimal bias | Validated in uniform processing pipelines [4] |
| Positive Control Primers | ARGHAP22, COX4I2, MTHFR, ZMYND8 for H3K27ac [69] | qPCR validation of successful IP | Derived from strongest ENCODE peaks [69] |
| Spike-in Controls | Drosophila chromatin, S. pombe cells [41] | Normalization for quantitative comparisons across conditions | Enables cross-sample quantification [41] |
Advanced Applications and Future Directions
Single-Cell Histone Modification Profiling
Emerging technologies like Target Chromatin Indexing and Tagmentation (TACIT) enable genome-coverage single-cell profiling of histone modifications, with applications demonstrated in early embryo development studies [2]. While not yet part of standard ENCODE pipelines, these methods represent the cutting edge for primary cell research where cellular heterogeneity is a significant factor.
Cross-Method Benchmarking Considerations
Recent systematic evaluations reveal that CUT&Tag demonstrates higher signal-to-noise ratios compared to ChIP-seq, though with potential biases toward accessible chromatin regions [70]. When benchmarking against ENCODE data, researchers should consider:
- Peak Caller Optimization: MACS2 with q-value threshold 1×10⁻⁵ and 'nolambda, nomodel' parameters shows best performance for CUT&Tag data [69]
- Antibody Concordance: Maximum correlation achieved when using identical antibody sources [69]
- Sequencing Depth Normalization: Compare datasets at equivalent sequencing depths
The ENCODE data portal continues to evolve with enhanced search interfaces, custom collection pages, and improved visualization tools to facilitate these comparative analyses [68]. By adhering to the standards and protocols outlined in this application note, researchers can confidently benchmark their histone modification data against public repositories, ensuring robust, reproducible findings that advance our understanding of epigenetic regulation in primary cells.
The accurate identification of enriched regions, or "peak calling," is a critical step in the analysis of chromatin immunoprecipitation followed by sequencing (ChIP-seq) data. The performance of peak calling algorithms is not universal; it is strongly influenced by the genomic distribution of the target protein. This application note provides a structured comparison of three prominent peak callers—MACS2, SICER2, and SEACR—for the analysis of transcription factors and histone modifications in primary cells. We summarize quantitative performance data into actionable tables, provide detailed experimental protocols, and offer clear guidelines to help researchers and drug development professionals select the optimal tool based on their specific epigenetic mark, thereby enhancing the reliability of downstream analysis in drug target identification and biomarker discovery.
In ChIP-seq experiments, peak calling algorithms serve as the computational foundation for transforming aligned sequencing reads into biologically interpretable regions of protein-DNA interaction. The choice of algorithm can significantly impact the outcome of the analysis, as different tools are optimized for different types of genomic signals. Transcription factors (TFs) typically bind at specific, well-defined loci, producing "narrow" peaks. In contrast, histone modifications can exhibit either "sharp" patterns (e.g., H3K4me3, H3K27ac) or "broad" domains (e.g., H3K27me3, H3K36me3) that can span several kilobases [27]. Using an algorithm designed for narrow peaks to call broad domains can result in the fragmentation of a single enriched region into multiple, artificially narrow peaks, leading to a loss of biological context and erroneous interpretations [60] [71].
This guide focuses on three widely used tools: MACS2 (Model-based Analysis of ChIP-Seq), a versatile and widely adopted tool; SICER2 (Spatial Clustering for Identification of ChIP-Enriched Regions), designed specifically for broad marks; and SEACR (Sparse Enrichment Analysis for CUT&RUN), which is optimized for high-signal-to-noise data like CUT&Tag [71]. Understanding their relative strengths and weaknesses is essential for generating robust epigenetic data in primary cell research, where sample material is often limited.
Performance Comparison and Algorithm Selection Guide
The performance of peak-calling algorithms is highly dependent on the nature of the epigenetic mark. The following table synthesizes key findings from independent benchmark studies to guide tool selection.
Table 1: Peak Caller Performance and Recommended Use Cases
| Peak Caller | Optimal Mark Type | Key Strengths | Key Limitations | Overall Recommendation |
|---|---|---|---|---|
| MACS2 | Sharp/Narrow (TFs, H3K4me3, H3K9ac, H3K27ac) [27] [71] | High sensitivity for narrow peaks; widely used with extensive community support [60]. | Can fragment broad domains; performance may drop with low-fidelity marks (e.g., H3K4ac) [60]. | Primary choice for transcription factors and sharp histone marks. Use --broad flag for mixed-profile marks like H3K27ac. |
| SICER2 | Broad (H3K27me3, H3K36me3, H3K79me2) [27] | Robustly identifies spatially clustered, diffuse enrichment regions; less prone to fragmentation [27]. | Lower sensitivity for sharp, punctate peaks [27]. | Specialized tool for broad histone marks. Essential for mapping repressive polycomb domains. |
| SEACR | All (Especially for CUT&Tag/CUT&RUN) [71] | Excels with high signal-to-noise data; minimal background; fast processing [71]. | "Stringent" mode may miss weaker peaks; "Relaxed" mode requires careful validation [71]. | Top performer for CUT&Tag data. Use for both sharp and broad marks in enzyme-tethering assays. |
A benchmark study evaluating differential ChIP-seq tools confirmed that the choice of external peak caller (MACS2 vs. SICER2) prior to differential analysis had a profound impact on results. The study found that SICER2 was the preferred peak caller for preparing input for differential analysis of broad histone marks, whereas MACS2 was superior for transcription factors and sharp marks [27]. Furthermore, a comparative analysis of five peak callers on 12 histone modifications revealed that while most tools performed well on canonical point-source marks, their performance dropped significantly on low-fidelity marks like H3K4ac and H3K79me1/me2, underscoring the need for careful tool selection based on the specific mark being studied [60].
Detailed Experimental Protocols
Standard ChIP-seq Analysis Workflow with Peak Calling
The following protocol outlines a standard bioinformatic pipeline for analyzing ChIP-seq data from primary cells, from raw sequencing reads to called peaks.
Table 2: Key Research Reagents and Computational Tools
| Item Name | Function / Explanation | Example or Note |
|---|---|---|
| Bowtie2 | Aligns sequencing reads to a reference genome. | Critical for accurate mapping; requires a pre-built genome index (e.g., hg19, hg38) [60]. |
| SAMtools | Manipulates and indexes aligned sequence files (SAM/BAM). | Used for sorting, indexing, and filtering aligned reads [60]. |
| BEDTools | A versatile toolkit for genomic arithmetic. | Used to compare peaks from replicates, calculate coverage, and intersect genomic intervals [60]. |
| ENCODE Blacklist | A set of regions with artifactual signal. | Removing peaks overlapping these regions is essential for quality control [60] [71]. |
| MACS2 | Peak calling for transcription factors and sharp histone marks. | Default parameters are a good starting point (q=0.01) [60]. |
| SICER2 | Peak calling for broad histone marks. | Uses clustering approach to identify broad domains [27]. |
Procedure:
- Quality Control & Trimming: Use FastQC to assess raw read quality. Trim low-quality bases and adapters with tools like Trimmomatic or cutadapt.
- Alignment: Align the high-quality reads to the appropriate reference genome (e.g., GRCh38) using Bowtie2 [60].
- Post-Processing: Convert the SAM file to BAM, sort, and index using SAMtools.
- Filtering: Remove reads mapping to the ENCODE blacklist regions using BEDTools [60] [71].
- Peak Calling:
- For TFs/Sharp Marks (MACS2):
- For Broad Marks (SICER2):
- For CUT&Tag Data (SEACR):
- Irreproducible Discovery Rate (IDR) Analysis: For experiments with replicates, use IDR analysis to identify high-confidence peaks by assessing consistency between replicates [60].
The workflow below illustrates the logical pathway from raw data to interpreted results, highlighting the critical decision point for algorithm selection.
Protocol for Differential Peak Analysis
Comparing ChIP-seq signals between two biological conditions (e.g., treated vs. untreated primary cells) requires a dedicated differential analysis workflow.
Procedure:
- Consistent Peak Calling: Call peaks on each sample and replicate individually using one of the protocols above. A common practice is to create a consensus peak set by taking the union of all peaks called across all samples.
- Read Counting: Count the number of reads mapping to each peak in each sample using a tool like
featureCountsor BEDTools multicov. - Differential Analysis: Input the count matrix into a differential analysis tool. While tools like DESeq2 were developed for RNA-seq, they have been successfully adapted for differential ChIP-seq analysis [27]. Alternatively, use a dedicated differential ChIP-seq tool.
- Interpretation: Annotate the differentially bound regions with genomic features (e.g., promoters, enhancers) and perform pathway analysis to understand the biological implications.
Advanced Applications and Emerging Methods
The field of epigenomics is rapidly evolving with new technologies that present both opportunities and challenges for peak calling.
Analysis of CUT&Tag and CUT&RUN Data: These enzyme-tethering methods produce data with a much higher signal-to-noise ratio and lower background than traditional ChIP-seq [70] [71]. While MACS2 can be applied, benchmarks show that SEACR is particularly well-suited for these methods as it is designed to leverage the sparse background [71]. A specialized tool, GoPeaks, has also been developed specifically for histone modification CUT&Tag data and shows improved sensitivity for marks like H3K27ac compared to standard algorithms [71].
Single-Cell Multi-Omic Profiling: Emerging techniques like scMTR-seq and TACIT now enable the joint profiling of multiple histone modifications and transcriptomes in single cells [72] [2]. Analyzing such data involves computational aggregation of single-cell signals to create pseudobulk tracks, which can then be analyzed with the peak callers discussed herein. These methods are revolutionizing our ability to deconvolve epigenetic heterogeneity in complex primary cell populations [2].
There is no single "best" peak caller for all scenarios. The optimal choice is dictated by the biological target and the technology used. Based on current benchmarking evidence, we recommend: MACS2 for transcription factors and sharp histone marks, SICER2 for broad histone marks, and SEACR for CUT&Tag and CUT&RUN assays. Adhering to these guidelines, using standardized protocols, and rigorously applying quality control measures will ensure the generation of high-quality, reproducible peak calls. This, in turn, provides a solid foundation for impactful discovery in basic research and drug development, particularly when working with precious primary cell samples.
Within the context of ChIP-seq for histone modifications in primary cells research, integrative analysis with RNA-seq data has emerged as a powerful paradigm for deciphering the epigenetic mechanisms driving gene regulation. This approach is particularly valuable in cancer research, where epigenetic alterations often precede and drive tumorigenesis. In primary tumors and patient-derived models, establishing robust correlations between histone marks and transcriptional outputs can reveal novel therapeutic targets and biomarkers [73]. This Application Note provides a detailed protocol for executing such an integrative analysis, enabling researchers to move beyond mere cataloging of epigenetic features toward understanding their functional consequences on gene expression.
The critical importance of this approach is exemplified by studies in glioblastoma stem cells (GSCs), where machine learning models revealed that H3K27Ac alone could accurately predict gene expression across patient samples, suggesting a common enhancer activation landscape defines transcriptional programs in heterogeneous tumors [74]. Similarly, in HPV-positive head and neck squamous cell carcinoma (HNSCC), integrated analysis of chromatin alterations with gene expression changes uncovered viral integration sites and dysregulated cancer pathways not apparent from genetic analysis alone [73]. These findings underscore the power of integrated epigenomic-transcriptomic analysis in primary disease models.
Key Histone Modifications and Their Functional Correlates
Histone Marks with Established Roles in Gene Regulation
Table 1: Key histone modifications and their transcriptional associations
| Histone Mark | Associated Function | Correlation with Expression | Genomic Context |
|---|---|---|---|
| H3K27Ac | Active enhancer and promoter mark | Positive | Enhancers, promoters |
| H3K4me3 | Active promoter mark | Positive | Transcription start sites |
| H3K4me1 | Poised/active enhancer mark | Context-dependent | Enhancers |
| H3K27me3 | Facultative heterochromatin (Polycomb) | Negative | Developmentally regulated genes |
| H3K9me3 | Constitutive heterochromatin | Negative | Repetitive regions, telomeres |
The histone mark H3K27Ac is a key epigenetic modification associated with active transcription and enhancer activation. This acetylation mark, catalyzed by histone acetyltransferases (HATs) such as CBP/p300, distinguishes active enhancers from poised or inactive ones, facilitating the recruitment of transcriptional coactivators and RNA Polymerase II [74]. By weakening histone-DNA interactions, H3K27Ac promotes chromatin accessibility, enabling transcription factors to engage with regulatory elements and drive gene expression [74]. The presence of H3K27Ac at enhancers and promoters is critical for context-dependent gene activation in development, differentiation, and response to environmental signals, with its dysregulation frequently observed in cancer [74].
H3K4me3 marks predominantly transcription start sites of genes that are either actively transcribed or poised for transcription, a highly conserved feature across taxa from yeast to humans [8]. In Arabidopsis, rice, and maize, trimethylation at lysine 4 of histone H3 occurred predominantly at gene promoters [8].
Recent research has revealed that different histone modifications can drive the formation of immiscible phase-separated chromatin compartments in the nucleus. H3K27me3-marked facultative heterochromatin and H3K9me3-marked constitutive heterochromatin form distinct, coexisting condensates through liquid-liquid phase separation mechanisms, providing a physical basis for chromatin compartmentalization and its impact on gene expression [75].
Experimental Workflow for Integrated Analysis
Sample Preparation and Quality Control
The initial phase of integrative analysis requires careful sample preparation and rigorous quality control to generate robust, interpretable data.
Primary Cell Considerations
Working with primary cells presents unique challenges for chromatin studies. The chromatin integrity, digestion rate, and strength of DNA-protein binding highly depend on the preservation and processing of the patient's primary cancer tissue [73]. When using patient-derived xenograft (PDX) models, validation of similarity to parental tissue is essential. In HNSCC studies, Pearson correlation coefficients of 0.83-0.9 between PDX and parental tumor RNA-seq profiles confirmed the models' appropriateness [73].
For ChIP-seq experiments, cell number requirements must be strictly observed. Each immunoprecipitation (IP) preparation should contain a consistent number of cells, typically 4×10⁶ cells, with verification by automated cell counting systems [73].
Quality Control Metrics
Table 2: Essential quality control parameters for sequencing data
| Data Type | QC Metric | Target Value | Tool |
|---|---|---|---|
| RNA-seq | Sequencing depth | >20 million reads | FastQC |
| RNA-seq | Mapping rate | >80% | HISAT2/STAR |
| RNA-seq | rRNA alignment rate | <5% | featureCounts |
| ChIP-seq | Library complexity | High NSC, low RSC | phantompeakqualtools |
| ChIP-seq | Fragment size | 200-400 bp | Bioanalyzer |
| ChIP-seq | IP efficiency | Compared to input | featureCounts |
For single-cell RNA-seq data, quality control involves filtering low-quality cells based on three key covariates: the number of counts per barcode (count depth), the number of genes per barcode, and the fraction of counts from mitochondrial genes per barcode [76]. Cells with a low number of detected genes, low count depth, and high fraction of mitochondrial counts may have broken membranes, indicating dying cells [76]. Automatic thresholding via MAD (median absolute deviations) provides a robust filtering approach, marking cells as outliers if they differ by 5 MADs from the median [76].
Computational Analysis Pipeline
The computational workflow for integrative analysis involves both established tools and novel algorithms designed specifically for correlating epigenetic and transcriptomic data.
Diagram 1: Integrated analysis workflow for correlating histone marks with RNA-seq data
ChIP-seq Processing
Begin with raw FASTQ files and perform quality control using FastQC. Adapter sequences and low-quality bases should be trimmed using Trimmomatic [77]. Align reads to an appropriate reference genome using specialized aligners such as BWA or Bowtie2. For peak calling, MACS2 is widely used for identifying regions of significant histone enrichment compared to input controls [73].
For super-enhancer identification, the ROSE (Rank Ordering of Super Enhancers) algorithm can be employed. This involves defining enhancer regions based on significant ChIP-seq peak accumulation, merging adjacent enhancers to form composite super-enhancers, and ranking them by signal intensity to distinguish those surpassing a threshold as super-enhancers [78].
RNA-seq Processing
Process RNA-seq data through a similar quality control pipeline using FastQC, followed by trimming with Trimmomatic. Alignment to the reference genome can be performed using splice-aware aligners such as HISAT2 or STAR [77]. Following alignment, gene quantification should be performed using featureCounts or HTSeq, generating count matrices for differential expression analysis [77].
Differential expression analysis is typically performed using DESeq2 or edgeR in R, generating lists of significantly up- and down-regulated genes under experimental conditions. Data visualization methods such as heatmaps (using pheatmap) and volcano plots (using ggplot2) help identify patterns of interest [77].
Integration Methods and Tools
Correlation-Based Approaches
The fundamental approach for integrating histone mark and RNA-seq data involves calculating correlation coefficients between histone mark signal intensity and gene expression levels within defined genomic windows. The SE-to-gene Links platform incorporates the peak-to-gene links methodology to examine correlations between super-enhancers and gene expression [78]. This approach accepts RNA-seq and ChIP-seq data as inputs and assesses correlations within a defined genomic range, typically ±1 Mbp from transcription start sites [78]. By applying statistical thresholds (e.g., false discovery rate < 0.05 and correlation coefficient r > 0.5), researchers can identify high-confidence peak-to-gene associations from the broader set of candidates [78].
In practice, the SE-to-gene Links workflow involves: (1) input data integration of ChIP-seq and RNA-seq data with preprocessing to ensure quality and consistency; (2) super-enhancer detection using the ROSE algorithm; (3) correlation analysis between SEs and gene expression levels; (4) filtered SE prioritization using statistical thresholds; and (5) SE-to-gene Links network mapping for advanced analyses [78].
Machine Learning Approaches
Machine learning (ML)-based gene expression prediction has been used to extract patterns from epigenomics big data and distinguish the contribution of multiple epigenetic markers [74]. The CIPHER (Cross patient-Informed Prediction of Human Epigenetic Regulation) framework employs XGBoost to predict gene expression across patient-derived GSCs using multiple epigenetic features including ATAC-seq, CTCF ChIP-seq, RNAPII ChIP-seq, and H3K27Ac ChIP-seq [74]. Notably, feature importance analysis revealed that H3K27Ac alone was sufficient to accurately predict gene expression across patient samples, suggesting that enhancer activity landscapes can serve as a blueprint for transcriptional regulation in GSCs [74].
The Scientist's Toolkit
Research Reagent Solutions
Table 3: Essential reagents and resources for integrated ChIP-seq and RNA-seq studies
| Category | Reagent/Resource | Specification | Application |
|---|---|---|---|
| Antibodies | H3K27Ac antibody | High specificity, ChIP-grade | Active enhancer marking |
| Antibodies | H3K4me3 antibody | High specificity, ChIP-grade | Active promoter marking |
| Antibodies | H3K27me3 antibody | High specificity, ChIP-grade | Facultative heterochromatin |
| Kits | Chromatin IP kit | Magnetic beads format | Efficient chromatin IP |
| Kits | RNA library prep | PolyA selection/rRNA depletion | RNA-seq library construction |
| Kits | ChIP-seq library prep | Low input compatible | ChIP-seq library construction |
| Software | Bioconductor packages | ChIPseeker, DESeq2 | Data analysis |
| Software | SEgene platform | Peak-to-gene links | Super-enhancer correlation |
| Databases | AnnotationHub | Organism databases | Gene annotation |
Bioconductor provides comprehensive resources for annotation through packages like AnnotationHub, which facilitates access to experimental data and annotation information including ChIP-seq peaks for various histone modifications [79]. For example, researchers can retrieve H3K4me1 peak locations from the EpigenomeRoadMap Project through AnnotationHub using the access code AH28856 [79].
The biomaRt package enables seamless access to Ensembl annotation, allowing researchers to retrieve gene identifiers, genomic coordinates, and other relevant information for integrating across datasets [80]. This is particularly valuable for matching histone mark peaks with their potential target genes.
Application to Disease Research
Case Study: Glioblastoma Stem Cells
In glioblastoma stem cells (GSCs), integrative analysis revealed that epigenetic mechanisms play a crucial role in driving transcript expression and shaping phenotypic plasticity, contributing to tumor heterogeneity and therapeutic resistance [74]. These mechanisms dynamically regulate the expression of key oncogenic and stemness-associated genes, enabling GSCs to adapt to environmental cues and evade targeted therapies [74]. Machine learning analysis demonstrated that the distribution of H3K27Ac peaks across the genomes of all patients was remarkably similar, suggesting that GSCs share a common distributional pattern of enhancer activity that defines their underlying transcriptomic expression pattern [74].
Case Study: HPV-Positive Head and Neck Cancer
In HPV-positive head and neck squamous cell carcinoma (HNSCC), integrated analysis of whole-genome ChIP-Seq and RNA-Seq data enabled unprecedented characterization of the complex network of molecular changes resulting from chromatin alterations that drive HPV-related tumorigenesis [73]. This approach detected differential histone enrichment associated with tumor-specific gene expression variation, sites of HPV integration in the human genome, and HPV-associated histone enrichment sites upstream of cancer driver genes [73]. The integrated analysis revealed strong disease-specific distribution of H3K4me3 and H3K27ac histone marks, which correlated with differential gene expression of nearby cancer-related genes and their associated pathways [73].
Advanced Integration Techniques
Network-Based Analysis
For advanced analyses, the SE-to-gene Links platform can construct a network of SE-gene interactions, providing insights into SE clusters and their functional implications within the genomic landscape [78]. This network visualization facilitates the identification of central SEs with potentially critical regulatory roles across multiple samples or patient cohorts. In colorectal cancer datasets, this approach identified merged SE regions across samples, highlighting genomic loci with substantial SE concentration such as chr7:748,439-998,341, which contained genes with documented links to colorectal cancer like CYP2W1 [78].
Cross-Patient Prediction Frameworks
The CIPHER framework demonstrates that cross-patient prediction is a critical method to advance the understanding of complex epigenetic mechanisms and correlate the findings to human disease [74]. When a cross-patient prediction model is generalized across datasets, this model is scalable and can be used as a tool across various populations or research settings without requiring extensive fine-tuning [74]. This approach is particularly valuable for identifying common epigenetic vulnerabilities across heterogeneous tumor populations.
Integrative analysis of histone marks with RNA-seq expression data represents a powerful approach for unraveling the epigenetic basis of gene regulation in primary cells and disease models. The protocols and methodologies outlined in this Application Note provide researchers with a comprehensive framework for executing these analyses, from experimental design through computational integration. As demonstrated in multiple cancer contexts, this approach can reveal epigenetic drivers of disease pathogenesis and identify novel therapeutic targets. The continuing development of more sophisticated computational methods, including machine learning and network-based approaches, promises to further enhance our ability to extract biological insights from multi-omics data integration.
Chromatin Immunoprecipitation followed by sequencing (ChIP-seq) has long been the gold standard for mapping histone modifications and protein-DNA interactions in epigenetics research. However, when working with primary cells—which are often limited in quantity and sensitive to manipulation—ChIP-seq presents significant challenges. Its requirement for millions of cells, extensive optimization, and high background noise frequently make it impractical for studying rare cell populations or precious clinical samples [81] [82]. These limitations have driven the development of innovative technologies that overcome these barriers while providing superior data quality.
Among these new approaches, Cleavage Under Targets and Tagmentation (CUT&Tag) has emerged as a powerful alternative that addresses the core limitations of ChIP-seq for primary cell research. This method utilizes an enzyme-tethering strategy that enables high-resolution epigenomic profiling from far fewer cells while delivering exceptional signal-to-noise ratios [83] [84]. For researchers investigating histone modifications in primary cells, CUT&Tag offers a streamlined workflow that bypasses the most challenging aspects of ChIP-seq, including cross-linking, chromatin fragmentation, and immunoprecipitation [85]. This application note explores the advantages of CUT&Tag over traditional ChIP-seq and provides detailed methodologies for implementing this technique in primary cell systems.
Why Switch from ChIP-seq to CUT&Tag? A Quantitative Comparison
When evaluating chromatin profiling methods for primary cell research, CUT&Tag demonstrates clear advantages across multiple performance metrics. The technique fundamentally differs from ChIP-seq by performing targeted chromatin profiling in intact nuclei using a protein A-Tn5 transposase fusion protein that simultaneously fragments DNA and inserts sequencing adapters at sites of antibody binding [83] [86]. This in situ approach eliminates several rate-limiting steps while dramatically improving efficiency.
Table 1: Quantitative Comparison of ChIP-seq and CUT&Tag Performance Characteristics
| Parameter | ChIP-seq | CUT&Tag |
|---|---|---|
| Cell Input Requirements | 1-10 million cells [69] | 100 - 100,000 cells [83] [86] |
| Protocol Duration | 3-5 days [81] | 1-2 days [85] [86] |
| Sequencing Depth Required | 20-40 million reads [81] | 2-8 million reads [81] [86] |
| Background Noise | High [81] [83] | Exceptionally low [83] [84] |
| Single-Cell Compatibility | Limited [69] | Yes [87] [83] |
| Cross-linking Required | Yes [81] | No (native conditions) [85] |
| Library Preparation | Multi-step in vitro process [81] | Simplified in vivo tagmentation [86] |
The practical implications of these differences are substantial for researchers working with primary cells. CUT&Tag's reduced cell input requirements enable profiling of rare cell types, such as specific immune populations or patient-derived cells, that would be impossible to study using ChIP-seq [81] [82]. Furthermore, the significantly lower sequencing depth needed for CUT&Tag translates to substantial cost savings, allowing more targets to be profiled within the same budget [85]. Perhaps most importantly, CUT&Tag's low background and high signal-to-noise ratio provide cleaner data with enhanced ability to distinguish true biological signals from technical artifacts [83].
Recent benchmarking studies have demonstrated that CUT&Tag effectively recovers chromatin features identified by ChIP-seq, with one comprehensive analysis showing that CUT&Tag recovers approximately 54% of known ENCODE ChIP-seq peaks for histone modifications H3K27ac and H3K27me3 [69]. Importantly, the peaks identified by CUT&Tag typically represent the strongest ENCODE peaks and show the same functional and biological enrichments as those identified by ChIP-seq [69].
The CUT&Tag method builds upon enzyme-tethering principles but introduces key innovations that optimize it for modern epigenomics research. As illustrated below, the entire procedure occurs in intact nuclei, preserving native chromatin context while enabling targeted tagmentation specifically at antibody-bound sites.
Key Technological Advantages
The CUT&Tag workflow offers several distinct advantages that make it particularly suitable for primary cell research:
In Situ Tagmentation: Unlike ChIP-seq, which requires chromatin extraction and fragmentation, CUT&Tag performs tagmentation within intact nuclei, preserving native chromatin structure and protein-DNA interactions [83] [84].
Targeted Sequencing Library Construction: The protein A/G-Tn5 fusion protein is tethered specifically to antibody-bound chromatin, ensuring that sequencing adapters are inserted primarily at sites of interest rather than throughout the genome [83].
High-Salt Conditions: The CUT&Tag protocol utilizes high salt concentrations (300 mM NaCl) during incubation and wash steps to minimize nonspecific Tn5 activity in accessible chromatin regions, dramatically reducing background signal [85] [84].
Streamlined Library Preparation: Since adapter ligation occurs during tagmentation, the method skips traditional library preparation steps, reducing processing time and potential sample loss [86].
Notably, CUT&Tag has demonstrated enhanced sensitivity for certain heterochromatic regions compared to ChIP-seq. Recent research has shown that CUT&Tag detects robust levels of H3K9me3 over repetitive elements and retrotransposons that are typically underrepresented in ChIP-seq datasets due to the technical biases of cross-linking and sonication [88]. This advantage is particularly valuable for comprehensive epigenomic characterization of primary cells.
Detailed CUT&Tag Protocol for Primary Cells
This section provides a comprehensive protocol for performing CUT&Tag on primary cells, incorporating specific adaptations for sensitive or fragile cell types such as immune cells.
Sample Preparation and Cell Processing
Proper sample preparation is critical for successful CUT&Tag experiments with primary cells:
Cell Counting and Viability: Accurately count cells using a hemocytometer or automated cell counter. For primary cells, viability should exceed 90% for optimal results [89]. For low viability samples, implement dead cell removal using magnetic bead-based separation [82].
Cell Input Recommendations:
Nuclei Isolation for Sensitive Cells: For fragile primary cells (e.g., activated lymphocytes), isolate nuclei before proceeding with CUT&Tag. Gently resuspend cell pellet in nuclei isolation buffer (10 mM Tris-Cl pH 7.5, 10 mM NaCl, 3 mM MgCl₂, 0.1% Tween-20, 1% BSA, protease inhibitors) and incubate on ice for 10 minutes [82]. Centrifuge at 600×g for 5 minutes and resuspend in Wash Buffer.
Cryopreservation Considerations: Primary cells can be frozen before CUT&Tag analysis. Freeze cells in FBS with 10% DMSO using a controlled-rate freezer, then store in liquid nitrogen. Upon thawing, wash cells twice in complete wash buffer before use [82].
CUT&Tag Step-by-Step Procedure
Table 2: CUT&Tag Reaction Setup and Reagents
| Component | Function | Considerations for Primary Cells |
|---|---|---|
| Concanavalin A Magnetic Beads | Immobilizes nuclei/cells | Avoid vortexing; gentle pipetting only [89] |
| Primary Antibody | Binds target epitope | Must be validated for CUT&Tag; titrate for optimal signal [85] |
| Secondary Antibody | Amplifies signal | Species-matched; enhances pA-Tn5 binding [85] |
| pA/G-Tn5 Transposase | Targeted tagmentation | Pre-loaded with sequencing adapters [86] |
| Magnesium Chloride | Activates tagmentation | Optimize incubation time (1-2 hours) [89] |
| Digitonin | Permeabilizes membranes | Concentration may require optimization for different cell types [89] |
Day 1: Cell Binding and Antibody Incubation
Activate Concanavalin A Beads: Resuspend ConA beads to homogeneous slurry and transfer 10 μL per reaction to a 1.5 mL tube. Add 100 μL ice-cold Bead Activation Buffer, place on magnetic rack for 30 seconds to 2 minutes, and remove supernatant. Repeat wash, then resuspend in original volume (10 μL per reaction) of Bead Activation Buffer [89].
Bind Cells to Beads: Add 100,000 cells in 100 μL Complete Wash Buffer (10× Wash Buffer, 100× Spermidine, 200× Protease Inhibitor Cocktail in nuclease-free water) to activated beads. Mix gently by pipetting and incubate for 15 minutes at room temperature [89].
Primary Antibody Binding: Briefly centrifuge tube to collect liquid, place on magnetic rack, and remove supernatant. Resuspend in 50 μL Antibody Binding Buffer containing primary antibody at predetermined dilution (typically 1:50-1:100). Incubate overnight at 4°C with gentle rotation [89] [85].
Day 2: Secondary Antibody Binding and Tagmentation
Wash Unbound Antibody: Place tube on magnetic rack, remove supernatant, and wash twice with 1 mL Digitonin Wash Buffer. After final wash, resuspend in 50 μL Digitonin Wash Buffer containing species-matched secondary antibody (1:100 dilution). Incubate for 1 hour at room temperature [89].
pA/G-Tn5 Binding: Wash twice with 1 mL Digitonin Wash Buffer to remove unbound secondary antibody. Resuspend in 50 μL Digitonin Wash Buffer containing pA/G-Tn5 (1:250 dilution). Incubate for 1 hour at room temperature [89] [86].
Tagmentation: Wash twice with 1 mL Digitonin Wash Buffer and once with 1 mL Digitonin Tagmentation Buffer. Resuspend in 50 μL Digitonin Tagmentation Buffer. Incubate at 37°C for 1 hour to activate tagmentation [89].
Reaction Termination and DNA Purification: Add 50 μL of Tagmentation Stop Buffer (10% SDS, 0.5 M EDTA, 2 mg/mL Proteinase K) to each reaction. Mix gently and incubate at 50°C for 1 hour to release DNA fragments. Purify DNA using SPRI magnetic beads or phenol-chloroform extraction [89] [85].
Library Amplification: Amplify purified DNA using indexing primers and PCR master mix (12-15 cycles typically sufficient). Purify final libraries using SPRI beads [89] [85].
Quality Control and Sequencing
- Library Quantification: Use fluorometric methods (Qubit) for accurate DNA quantification [85].
- Fragment Size Distribution: Analyze on Bioanalyzer or TapeStation; expect peak at ~300 bp (mononucleosome fragments + adapters) [85].
- Sequencing Parameters: Paired-end sequencing (2×50 bp or 2×75 bp) on Illumina platforms; aim for 2-8 million reads per library depending on target [81] [86].
Essential Reagents and Equipment for CUT&Tag
Successful implementation of CUT&Tag requires specific reagents and equipment optimized for the technique:
Table 3: Essential Research Reagent Solutions for CUT&Tag
| Reagent/Equipment | Function | Recommended Specifications |
|---|---|---|
| Concanavalin A Magnetic Beads | Immobilizes nuclei for magnetic handling | Paramagnetic; 1-5 μm diameter [89] |
| Validated Primary Antibodies | Target-specific epitope recognition | CUT&Tag-validified; high specificity [85] |
| pA/G-Tn5 Transposase | Targeted fragmentation and adapter ligation | Pre-loaded with Illumina adapters [86] |
| Digitonin Solution | Permeabilizes nuclear membrane | High-purity; titrate for different cell types [89] |
| Magnetic Separation Rack | Magnetic bead handling | Compatible with 1.5-2.0 mL tubes |
| Indexing Primers and PCR Master Mix | Library amplification | Dual-indexed to enable multiplexing [86] |
| SPRI Magnetic Beads | DNA size selection and purification | Enable fragment size selection [85] |
Critical Considerations for Primary Cell Applications
Working with primary cells presents unique challenges that require specific adaptations to the standard CUT&Tag protocol:
Protocol Modifications for Sensitive Cell Types
Light Fixation for Fragile Cells: For particularly sensitive primary cells (e.g., activated lymphocytes), implement gentle fixation (0.1-0.5% formaldehyde for 1-2 minutes) before nuclei isolation to stabilize protein-DNA interactions without epitope masking [82]. Quench with 0.125 M glycine.
Reduced Cell Input Adaptations: When working with fewer than 10,000 cells, modify wash steps to minimize sample loss. After initial cell centrifugation, remove most supernatant, leaving ≤40 μL per reaction, then proceed directly with antibody binding [89].
Cell Type-Specific Digitonin Optimization: Different primary cells may require digitonin concentration optimization. Perform a titration experiment (0.01-0.1%) to determine the concentration that permeabilizes >90% of cells while maintaining nuclear integrity [89].
Experimental Design and Controls
Antibody Validation: Always include positive control (e.g., H3K4me3 or H3K27me3) and negative control (IgG) reactions to assess assay performance and background levels [85].
Target Compatibility: CUT&Tag works exceptionally well for histone modifications. For transcription factors in primary cells, particularly those with weak DNA binding, CUT&RUN may be more reliable due to its performance under lower salt conditions [81] [86].
Single-Cell Adaptations: For heterogeneous primary cell populations, consider single-cell CUT&Tag (scCUT&Tag) by combining with droplet-based platforms (10x Genomics) to resolve cell-to-cell heterogeneity [87].
CUT&Tag represents a significant advancement over traditional ChIP-seq for profiling histone modifications in primary cells. Its dramatically reduced cell input requirements, streamlined workflow, lower sequencing costs, and superior data quality make it particularly suitable for studying rare cell populations and precious clinical samples. While the method requires careful optimization and validation for each primary cell type, its implementation enables epigenomic studies that were previously technically challenging or impossible with ChIP-seq. As the field continues to evolve, CUT&Tag and its derivatives are poised to become the new standard for epigenomic profiling in primary cell systems, providing unprecedented insights into gene regulatory mechanisms in health and disease.
In ChIP-seq studies of histone modifications in primary cells, the identification of enriched genomic regions (peaks) is merely the first step. The primary challenge lies in assigning biological meaning to these peaks. Functional annotation bridges this gap by connecting peaks to candidate target genes, elucidating their involvement in biological pathways, and inferring the underlying regulatory logic. This process is critical for transforming descriptive genomic data into actionable biological insights, particularly in drug development where understanding the mechanistic basis of a disease or treatment response is paramount.
Application Notes: From Peaks to Biological Insight
A typical functional annotation workflow for an H3K27ac ChIP-seq dataset from a primary immune cell type (e.g., CD4+ T-cells) yields a distribution of peaks across various genomic contexts. The table below summarizes expected outcomes from a representative analysis of 20,000 peaks.
Table 1: Genomic Distribution of H3K27ac Peaks in Primary Human CD4+ T-cells
| Genomic Feature | Percentage of Peaks (%) | Putative Functional Role |
|---|---|---|
| Promoter (≤ 1kb from TSS) | 15-25% | Direct enhancement of transcription initiation |
| Promoter (1-3kb from TSS) | 5-10% | Alternative promoter regulation |
| Intronic | 35-45% | Enhancer activity, regulation of host gene |
| Intergenic | 25-35% | Distal enhancers, likely cell-type specific |
| Exonic / 3' UTR | 1-3% | Potential regulatory overlap with genic features |
| Other (e.g., TTS) | <2% | Less characterized regulatory roles |
TSS: Transcription Start Site; TTS: Transcription Termination Site
Pathway and Ontology Enrichment Analysis
Following gene assignment, enrichment analysis identifies biological pathways and processes disproportionately represented by the candidate target genes. This highlights the higher-order functions of the active genomic regions marked by the histone modification.
Table 2: Top Enriched Pathways from GO Biological Process for H3K27ac Peaks
| Gene Ontology Term | Adjusted P-value (FDR) | Fold Enrichment | Associated Genes (Example) |
|---|---|---|---|
| T cell activation | 1.5e-12 | 8.5 | CD3E, CD28, LCK, IL2RA |
| Inflammatory response | 4.2e-09 | 6.2 | TNF, IL6, NLRP3 |
| Cytokine production | 2.1e-07 | 5.8 | IFNG, IL4, IL17A |
| Cell-cell adhesion | 7.8e-05 | 4.1 | ICAM1, ITGAL |
FDR: False Discovery Rate
Experimental Protocols
Protocol: Functional Annotation of ChIP-seq Peaks using ChIPpeakAnno
This protocol details the use of the Bioconductor package ChIPpeakAnno in R to annotate peaks with genomic features and link them to nearby genes.
Materials:
- A list of ChIP-seq peaks in BED or GRanges format.
- Reference genome annotation (e.g., TxDb.Hsapiens.UCSC.hg38.knownGene).
- R environment with Bioconductor installed.
Procedure:
- Load Packages and Data:
- Annotate Peaks to Genomic Features:
- Add Gene Symbols and Entrez IDs:
- Generate Summary Statistics and Visualizations:
Protocol: Pathway Enrichment Analysis with clusterProfiler
This protocol uses the clusterProfiler package to perform Gene Ontology and KEGG pathway enrichment analysis on the list of genes derived from peak annotation.
Procedure:
- Extract Gene List:
- Perform Gene Ontology (GO) Enrichment:
- Visualize Enrichment Results:
- Perform KEGG Pathway Enrichment:
Visualizing the Regulatory Logic
Title: From Peak to Phenotype Logic
Title: Functional Annotation Workflow
Title: T-cell Signaling Pathway
The Scientist's Toolkit: Research Reagent Solutions
Table 3: Essential Reagents and Tools for Functional Annotation Studies
| Item | Function & Application |
|---|---|
| ChIP-Validated Antibodies (e.g., H3K27ac, H3K4me3) | High-specificity antibodies for immunoprecipitation of specific histone modifications in primary cells. Critical for data quality. |
| Primary Cell Isolation Kits (e.g., CD4+ T-cell isolation) | Magnetic bead-based kits for rapid, high-purity isolation of specific cell populations from complex tissues. |
| Crosslinking Reagents (e.g., Formaldehyde) | For fixing protein-DNA interactions in cells prior to ChIP-seq. |
| Chromatin Shearing Reagents (Enzymatic or Sonication) | For fragmenting crosslinked chromatin to optimal size (200-500 bp) for immunoprecipitation. |
| High-Fidelity DNA Library Prep Kits | For preparing sequencing libraries from low-input ChIP DNA, minimizing bias. |
| Genome Annotation Databases (e.g., Ensembl, RefSeq) | Provide the coordinates of genes, transcripts, and other features essential for peak annotation. |
| Pathway Analysis Software (e.g., clusterProfiler, Metascape) | Tools for statistical enrichment analysis of gene lists against GO, KEGG, Reactome, etc. |
| Motif Discovery Tools (e.g., HOMER, MEME-ChIP) | For identifying transcription factor binding motifs within ChIP-seq peaks. |
Conclusion
Executing robust ChIP-seq for histone modifications in primary cells is a multifaceted process that demands careful experimental design, rigorous quality control, and biologically informed data analysis. By adhering to established guidelines for antibody validation, sequencing depth, and replication, researchers can generate high-quality epigenomic maps that reveal the authentic regulatory landscape of any tissue. The future of epigenomic profiling lies in the integration of these datasets with other genomic modalities and the adoption of emerging, low-input technologies like CUT&Tag, which promise to further illuminate cell-type-specific mechanisms in development and disease. For drug development professionals, these precise epigenetic profiles offer unprecedented opportunities to identify novel therapeutic targets and biomarkers, ultimately paving the way for more personalized medicine approaches.
References
- 1. Histone Modifications as Individual-Specific Epigenetic ... [https://pmc.ncbi.nlm.nih.gov/articles/PMC12385217/]
- 2. Genome-coverage single-cell histone modifications for ... [https://www.nature.com/articles/s41586-025-08656-1]
- 3. Streamlined quantitative analysis of histone modification ... [https://www.nature.com/articles/s41598-023-34430-2]
- 4. Histone ChIP-seq Data Standards and Processing Pipeline [https://www.encodeproject.org/chip-seq/histone/]
- 5. Highly quantitative measurement of differential protein ... [https://pmc.ncbi.nlm.nih.gov/articles/PMC12272247/]
- 6. Improved ChIP Sequencing for H3K27ac Profiling and ... [https://pubmed.ncbi.nlm.nih.gov/39844037/]
- 7. a fully automated, web-based platform for end-to-end ChIP- ... [https://pmc.ncbi.nlm.nih.gov/articles/PMC12512806/]
- 8. An optimized ChIP‐Seq framework for profiling histone ... [https://pmc.ncbi.nlm.nih.gov/articles/PMC8961045/]
- 9. Histone modifications [https://www.abcam.com/en-us/technical-resources/guides/epigenetics-guide/histone-modifications]
- 10. Using ChIP-Seq Technology to Generate High-Resolution ... [https://pmc.ncbi.nlm.nih.gov/articles/PMC4151291/]
- 11. A Semiautomated ChIP-Seq Procedure for Large-scale ... [https://pmc.ncbi.nlm.nih.gov/articles/PMC7870284/]
- 12. Histone ChIP-seq Data Standards and Processing Pipeline ... [https://www.encodeproject.org/chip-seq/histone-encode4/]
- 13. Single-cell multi-omic detection of DNA methylation and ... [https://www.nature.com/articles/s41592-025-02847-4]
- 14. Quantitative Proteomic Analysis of Histone Modifications - PMC [https://pmc.ncbi.nlm.nih.gov/articles/PMC4502928/]
- 15. A quantitative atlas of histone modification signatures from ... [https://epigeneticsandchromatin.biomedcentral.com/articles/10.1186/1756-8935-6-20]
- 16. The chromatin signatures of enhancers and their dynamic ... [https://pmc.ncbi.nlm.nih.gov/articles/PMC9828845/]
- 17. Acetylation of histone H2B marks active enhancers and ... [https://www.nature.com/articles/s41588-023-01348-4]
- 18. - ChIP Analysis for Identifying Seq -Wide Genome ... Histone [https://pubmed.ncbi.nlm.nih.gov/28735395/]
- 19. - ChIP Analysis: Seq Histone Modifications [https://www.news-medical.net/life-sciences/ChIP-Seq-Analysis-Histone-Modifications.aspx]
- 20. cChIP- seq : a robust small-scale method for investigation of histone ... [https://bmcgenomics.biomedcentral.com/articles/10.1186/s12864-015-2285-7]
- 21. Deciphering histone mark-specific fine-scale chromatin ... [https://pmc.ncbi.nlm.nih.gov/articles/PMC12546738/]
- 22. Why Primary Cells are better than Cell Lines? [https://labmal.com/2023/04/10/why-primary-cells-are-better-than-cell-lines/]
- 23. Application of ChIP-Seq and related techniques to the study of ... [https://pmc.ncbi.nlm.nih.gov/articles/PMC3137373/]
- 24. Looking to boost your drug discovery and development ... [https://www.epicypher.com/resources/blog/looking-to-boost-your-drug-discovery-and-development-pipelines-heres-how/]
- 25. ChIP–seq captures the chromatin landscape [https://www.nature.com/articles/d42859-020-00104-6]
- 26. ChIP-seq and Beyond: new and improved methodologies ... [https://pmc.ncbi.nlm.nih.gov/articles/PMC3591838/]
- 27. Comprehensive assessment of differential ChIP-seq tools ... [https://genomebiology.biomedcentral.com/articles/10.1186/s13059-022-02686-y]
- 28. a robust model for quantitative comparison of ChIP-Seq data ... [https://pmc.ncbi.nlm.nih.gov/articles/PMC3439967/]
- 29. ChIP-seq Validated Antibodies [https://www.cellsignal.com/applications/chip-and-chip-seq/chip-seq-antibodies?srsltid=AfmBOooPLcZVONTLzFbDpFuQOtknRnubR_Nvi1u8bDxim2dJPn6gF2E0]
- 30. Protocol to apply spike-in ChIP-seq to capture massive ... [https://www.sciencedirect.com/science/article/pii/S2666166721003889]
- 31. Protocol for double-crosslinking ChIP-seq to improve data ... [https://pmc.ncbi.nlm.nih.gov/articles/PMC12603744/]
- 32. A Step-by-Step Guide to Successful Chromatin ... [https://www.thermofisher.com/us/en/home/life-science/antibodies/antibodies-learning-center/antibodies-resource-library/antibody-application-notes/step-by-step-guide-successful-chip-assays.html]
- 33. Cross-linking ChIP-seq protocol [https://www.abcam.com/en-us/technical-resources/protocols/cross-linking-chip-seq]
- 34. Chromatin Immunoprecipitation (ChIP) Protocol [https://www.rndsystems.com/resources/protocols/chromatin-immunoprecipitation-chip-protocol]
- 35. Five easy and effective methods to validate antibodies [https://www.nature.com/articles/d42473-020-00065-4]
- 36. Antibody characterization process [https://www.encodeproject.org/help/antibody_characterization_process/]
- 37. Current ENCODE Experiment Guidelines [https://www.encodeproject.org/about/experiment-guidelines/]
- 38. Five pillars to determine antibody specificity [https://www.abcam.com/en-us/stories/articles/five-pillars-to-determine-antibody-specificity]
- 39. Data standards [https://www.encodeproject.org/data-standards/]
- 40. Tools to Confirm Antibody Specificity | Validation - CST Blog [https://blog.cellsignal.com/tools-to-confirm-antibody-specificity]
- 41. Highly quantitative measurement of differential protein ... [https://www.sciencedirect.com/science/article/pii/S2667237525000888]
- 42. How should I prepare and sequence samples for ChIP-seq? [https://dnatech.ucdavis.edu/faqs/how-should-i-prepare-samples-for-chip-seq]
- 43. Refined ChIP‐Seq Protocol for High‐Quality Chromatin ... [https://pmc.ncbi.nlm.nih.gov/articles/PMC12628287/]
- 44. ChIP-seq guidelines and practices of the ENCODE and ... [https://pmc.ncbi.nlm.nih.gov/articles/PMC3431496/]
- 45. Detecting broad domains and narrow peaks in ChIP-seq data ... [https://bmcbioinformatics.biomedcentral.com/articles/10.1186/s12859-016-0991-z]
- 46. CHiP-seq considerations - NGS Analysis - NYU [https://learn.gencore.bio.nyu.edu/chipseq-analysis/chip-seq-considerations/]
- 47. A comparison of control samples for ChIP-seq of histone modifications - PMC [https://pmc.ncbi.nlm.nih.gov/articles/PMC4174756/]
- 48. Computational methodology for ChIP-seq analysis - PMC [https://pmc.ncbi.nlm.nih.gov/articles/PMC4346130/]
- 49. Chromatin IP Frequently Asked Questions | Cell Signaling Technology [https://www.cellsignal.com/learn-and-support/frequently-asked-questions/chip-faqs]
- 50. An Alternative Approach to ChIP-Seq Normalization Enables ... [https://journals.plos.org/plosone/article?id=10.1371/journal.pone.0166438]
- 51. Theoretical characterisation of strand cross-correlation in ... [https://pmc.ncbi.nlm.nih.gov/articles/PMC7510163/]
- 52. A multiplexed system for quantitative comparisons of ... [https://pmc.ncbi.nlm.nih.gov/articles/PMC4707994/]
- 53. ChIP-Seq: Technical Considerations for Obtaining High ... [https://pmc.ncbi.nlm.nih.gov/articles/PMC3541830/]
- 54. Ten Common Mistakes in ChIP-seq Data Analysis [https://www.accurascience.com/blogs_35_0.html]
- 55. Chromatin Immunoprecipitation Troubleshooting Guide [https://www.cellsignal.com/learn-and-support/troubleshooting/chip-troubleshooting-guide?srsltid=AfmBOoqgyzE4Sz2IGeBG3qVz1YCC293DWg1aoNq_5xWHeX7yL2ozxdVt]
- 56. Protocol to apply spike-in ChIP-seq to capture massive ... [https://pmc.ncbi.nlm.nih.gov/articles/PMC8313745/]
- 57. ChIP-Seq Kit Troubleshooting Guide | Boster Bio [https://www.bosterbio.com/protocol-and-troubleshooting/chromatin-immunoprecipitation-chip-troubleshooting-guide?srsltid=AfmBOopKVC3kORPt4L4Iza7fMWeRebxZnbKiVOAbNvGWf1CMFe95M4Vi]
- 58. Histone Modifications in Stem Cell Development and Their ... [https://pmc.ncbi.nlm.nih.gov/articles/PMC7724464/]
- 59. A foundation model of transcription across human cell types [https://www.nature.com/articles/s41586-024-08391-z]
- 60. Comparative analysis of commonly used peak calling ... [https://pmc.ncbi.nlm.nih.gov/articles/PMC7808876/]
- 61. Features that define the best ChIP-seq peak calling algorithms [https://pmc.ncbi.nlm.nih.gov/articles/PMC5429005/]
- 62. Pipeline and Tools for ChIP-Seq Analysis [https://www.cd-genomics.com/pipeline-and-tools-comparison-for-chip-seq-analysis.html]
- 63. WACS: improving ChIP-seq peak calling by optimally ... [https://bmcbioinformatics.biomedcentral.com/articles/10.1186/s12859-020-03927-2]
- 64. Genome-Wide Profiling of Histone Modifications with ChIP-Seq - PubMed [https://pubmed.ncbi.nlm.nih.gov/31541441/]
- 65. The ENCODE Blacklist: Identification of Problematic ... [https://www.nature.com/articles/s41598-019-45839-z]
- 66. Is blacklisted regions filtering in ChIP-seq still needed? ... [https://www.biostars.org/p/361297/]
- 67. Greenscreen: A simple method to remove artifactual signals ... [https://pmc.ncbi.nlm.nih.gov/articles/PMC9709979/]
- 68. Data navigation on the ENCODE portal [https://www.nature.com/articles/s41467-025-64343-9]
- 69. CUT&Tag recovers up to half of ENCODE ChIP-seq ... [https://www.nature.com/articles/s41467-025-58137-2]
- 70. Benchmark of chromatin–protein interaction methods in ... [https://pmc.ncbi.nlm.nih.gov/articles/PMC12106302/]
- 71. GoPeaks: histone modification peak calling for CUT&Tag [https://genomebiology.biomedcentral.com/articles/10.1186/s13059-022-02707-w]
- 72. Combinatorial profiling of multiple histone modifications ... [https://pmc.ncbi.nlm.nih.gov/articles/PMC12327464/]
- 73. Integrated analysis of whole-genome ChIP-Seq and RNA-Seq ... [https://pmc.ncbi.nlm.nih.gov/articles/PMC6029614/]
- 74. Machine learning on multiple epigenetic features reveals ... [https://pmc.ncbi.nlm.nih.gov/articles/PMC12352877/]
- 75. Histone marks enable formation of immiscible phase- ... [https://www.sciencedirect.com/science/article/pii/S2211124725007740]
- 76. 6. Quality Control [https://www.sc-best-practices.org/preprocessing_visualization/quality_control.html]
- 77. A Guide to Basic RNA Sequencing Data Processing and ... [https://pmc.ncbi.nlm.nih.gov/articles/PMC12067304/]
- 78. SEgene identifies links between super enhancers and ... [https://www.nature.com/articles/s41540-025-00533-x]
- 79. Accessing annotations in Bioconductor [https://biodatascience.github.io/compbio/bioc/anno.html]
- 80. Accessing Ensembl annotation with biomaRt [https://www.bioconductor.org/packages/release/bioc/vignettes/biomaRt/inst/doc/accessing_ensembl.html]
- 81. ChIP-seq vs. CUT&RUN vs. CUT&Tag: Which should you ... [https://www.epicypher.com/resources/blog/chip-seq-vs-cutrun-vs-cuttag-which-should-you-use/]
- 82. Optimized CUT&RUN protocol for activated primary mouse ... [https://pmc.ncbi.nlm.nih.gov/articles/PMC12021426/]
- 83. CUT&Tag for efficient epigenomic profiling of small ... [https://www.nature.com/articles/s41467-019-09982-5]
- 84. Cut&tag: a powerful epigenetic tool for chromatin profiling - PMC [https://pmc.ncbi.nlm.nih.gov/articles/PMC10730171/]
- 85. The Complete Guide to CUT&Tag Experiments [https://www.epicypher.com/resources/blog/the-complete-guide-to-cuttag-experiments/]
- 86. CUT&Tag Overview: Profile Chromatin Faster [https://www.cellsignal.com/applications/cut-tag-overview?srsltid=AfmBOop4ilDIPH6KT1_oIFSpaqFxE2-uJ6YRZpD_yTB3pSWNLiDXN8Lf]
- 87. Single-cell CUT&Tag profiles histone modifications and ... [https://pmc.ncbi.nlm.nih.gov/articles/PMC7611252/]
- 88. CUT&Tag overcomes biases of ChIP and establishes ... [https://pmc.ncbi.nlm.nih.gov/articles/PMC12605858/]
- 89. CUT&Tag Kit Protocol [https://www.cellsignal.com/learn-and-support/protocols/cut-tag-kit-protocol?srsltid=AfmBOoom-Xpz-xWJJwjrCnqkfzmRuFrTza53z4Q-T0uc7THuL2i-A0qe]