MIQE Guidelines for qPCR Validation: Ensuring Reproducibility in Research and Drug Development
This article provides a comprehensive guide to the MIQE (Minimum Information for Publication of Quantitative Real-Time PCR Experiments) guidelines, a critical framework for ensuring the reproducibility and reliability of qPCR...
MIQE Guidelines for qPCR Validation: Ensuring Reproducibility in Research and Drug Development
Abstract
This article provides a comprehensive guide to the MIQE (Minimum Information for Publication of Quantitative Real-Time PCR Experiments) guidelines, a critical framework for ensuring the reproducibility and reliability of qPCR data. Tailored for researchers, scientists, and drug development professionals, it covers the foundational principles of MIQE, including the recent MIQE 2.0 update. It offers detailed methodological advice for assay design and application in regulated environments like cell and gene therapy, outlines best practices for troubleshooting and optimization, and establishes a rigorous approach for assay validation. By demystifying these standards, the article aims to empower scientists to produce robust, transparent, and publication-ready qPCR results that uphold the integrity of scientific literature and regulatory submissions.
Understanding MIQE: The Foundation of Reproducible qPCR Science
In the world of molecular biology, the quantitative polymerase chain reaction (qPCR) emerged as a transformative technology, becoming a ubiquitous mainstay of research laboratories worldwide. By the early 2000s, qPCR had progressed from its first-generation PCR roots to become the "Gold standard" for nucleic acid quantification [1]. However, this rapid adoption and the technique's perceived maturity concealed a growing problem. The relegation of qPCR materials and methods to online supplements in scientific papers was becoming commonplace, leading to publications containing insufficient technical information for work to be reproduced [2]. This lack of transparency, combined with the frequent use of flawed protocols, created an environment where the publication of technically questionable and irreproducible results was increasingly likely [2]. The scientific community needed a corrective measure, a set of standards that would restore rigor and credibility to qPCR experiments. This set of standards would become known as the MIQE guidelines.
The Catalyzing Event: Unreproducible Science and the Measles Virus Controversy
The direct impetus for creating the MIQE guidelines was a specific scientific controversy that exposed critical flaws in how qPCR experiments were being conducted and reported. In 2002, a paper was published that claimed to have detected measles virus in children with autism using RT-qPCR [3]. This finding was significant and, if true, would have had major implications for public health and autism research.
However, when other scientists attempted to verify these results, they proved to be completely unreproducible [3]. Further scrutiny revealed that the authors of the original study had not themselves attempted to reproduce their results. Moreover, the raw data was found to contain a large amount of errors and basic mistakes in analysis [3]. This incident highlighted a broader crisis in qPCR-based research: the low quality of data being submitted to academic journals, which was increasingly common as Next Generation Sequencing technologies made such experiments more affordable and widespread [3]. The measles virus controversy demonstrated that without strict standards, even high-impact claims could be built on unreliable foundations, ultimately wasting scientific resources and potentially misdirecting entire research fields.
The Formulation of a Solution: Birth of the MIQE Guidelines
In response to these challenges, Stephen Bustin led an international consortium of scientists in 2009 to devise the Minimum Information for Publication of Quantitative Real-Time PCR Experiments, or MIQE, guidelines [3] [4]. The primary objective was to provide a standardized framework for conducting and reporting qPCR experiments, thereby ensuring a baseline level of quality and transparency [3]. The guidelines were not intended to point out pitfalls but to help researchers publish high-end, reproducible papers [1].
The MIQE guidelines were structured as a comprehensive checklist covering all aspects of a qPCR experiment, from initial sample acquisition to final data analysis [3] [2]. To prioritize requirements, items were categorized as either Essential (E) for publication or Desirable (D) for best practice [3]. The guidelines emphasized that full disclosure of all reagents, sequences, and analysis methods was non-negotiable for independent verification and reproducibility [4].
Core Philosophical Framework of MIQE
The driving philosophy behind MIQE can be summarized by a quote from PCR's inventor, Kary Mullis: "Law shuttles between freeing us and enslaving us" [1]. The MIQE guidelines represent the law for qPCR technique. They enslave molecular biologists into a strict path with financial burdens, but they free us from the 'human-errors' that can compromise our results [1]. By imposing a rigorous standard, the guidelines seek to make PCR a more infallible tool, which is especially critical when research findings impact human health and clinical decision-making [1].
Evolution and Adoption: The Journey Following the 2009 Publication
After their publication in Clinical Chemistry in 2009, the MIQE guidelines began to influence the scientific community, though adoption faced initial hurdles.
Refinements and Expansions
Recognizing that the comprehensive guidelines could be daunting, a MIQE précis was published in 2010, offering an abridged set of recommendations for reporting key parameters of established assays [2]. This was followed by the development of specialized guidelines for emerging technologies, including digital PCR (dPCR) and single-cell qPCR [3]. The guidelines have continued to evolve, with a new MIQE 2.0 version announced to address advances in reagents, methods, and instrumentation [5].
Impact and Challenges in the Scientific Community
An analysis on the tenth anniversary of MIQE revealed that while qPCR had become a truly global technique with publications from 184 countries, the adoption of MIQE guidelines was uneven [1]. Despite over 5,977 citations of the original MIQE publication by 2018, compliance remained a challenge [1]. A key finding, however, was that researchers who followed the MIQE guidelines had better chances of publishing in higher-impact, highly-cited journals [1]. This demonstrated a clear value proposition for adherence to the standards.
Commercial manufacturers also responded by aligning their products with MIQE. Bio-Rad created a mobile app for tracking MIQE checklist compliance, and New England Biolabs designed their "Dots in Boxes" qPCR systems around the guidelines [3]. Furthermore, Thermo Fisher Scientific provided resources for their TaqMan assays to facilitate compliance with MIQE sequencing disclosure requirements [6].
Table: Key Milestones in the Development and Adoption of MIQE Guidelines
| Year | Milestone | Significance |
|---|---|---|
| 2002 | Paper claims measles virus detection in autism with RT-qPCR | Later found unreproducible; catalyzed MIQE creation [3] |
| 2009 | Original MIQE guidelines published in Clinical Chemistry | Established first minimum standards for qPCR experiments [4] |
| 2010 | MIQE précis published | Provided simplified, abridged guidelines for routine reporting [2] |
| 2013 | dPCR MIQE guidelines released | Extended principles to digital PCR technology [3] |
| 2014-2017 | Bustin notes ongoing reproducibility issues | Highlighted continued need for stricter adherence [3] |
| 2020 | 10th anniversary analysis shows MIQE papers have higher impact | Demonstrated value of compliance via higher CiteScores [1] |
| 2024/2025 | MIQE 2.0 guidelines announced | Updated recommendations for modern technologies and applications [5] |
Essential MIQE Components: A Researcher's Checklist
The MIQE guidelines are organized into several critical sections that form the backbone of a reliable qPCR experiment. The following workflow outlines the essential components and their relationships:
Sample and Nucleic Acid Integrity
The foundation of any reliable qPCR experiment begins with proper sample handling. Essential information includes a detailed description of the sample, dissection methods, processing procedures, and storage conditions [3]. For RNA templates, it is critical to report the RNA integrity number (RIN) or similar quality indicators, as comparing degraded and intact RNA yields misleading results [3] [2]. Furthermore, the absence of inhibitors must be tested using either an "alien" spike or a dilution series [2].
Assay Design and Validation
This is a cornerstone of MIQE compliance. Researchers must provide database accession numbers, amplicon size, and primer sequences for each target [2]. For newly designed assays, primer specificity must be validated both in silico (e.g., BLAST analysis) and empirically (e.g., via sequencing or melt curve analysis) [2]. Perhaps most critically, the PCR efficiency of each assay must be determined using a calibration curve, with reported slope, y-intercept, and correlation coefficient [3] [2]. The dynamic range and the limit of detection (LOD) should also be established [3].
Reverse Transcription and qPCR Protocol
The reverse transcription step requires full disclosure of reaction conditions, including the amount of RNA, primer type and concentration, reverse transcriptase used, and incubation times [3]. The qPCR protocol itself must detail all reaction conditions, reagents (including kits and manufacturers), and thermocycling parameters [3].
Data Analysis and Normalization
The final, and often most variable, phase is data analysis. MIQE mandates specifying the software and method used for quantification cycle (Cq) determination [3]. A crucial requirement is the justification for the choice and number of reference genes used for normalization, which must be experimentally validated for the specific experimental conditions [3] [2]. Normalization against a single, unvalidated reference gene is strongly discouraged. The handling of outliers and the statistical methods for evaluating precision must also be transparently reported [3] [2].
Table: Essential Research Reagent Solutions for MIQE-Compliant qPCR
| Reagent / Tool Category | Specific Example | Function in MIQE Compliance |
|---|---|---|
| Nucleic Acid Quantification Kits | Applied Biosystems TaqMan Assays | Provide unique Assay ID and amplicon context sequence for full disclosure [6] |
| Reverse Transcription Kits | Various manufacturer kits | Enable standardized cDNA synthesis; requires reporting of all components and conditions [3] |
| qPCR Master Mixes | SYBR Green I mixes, probe-based mixes | Core reaction components; concentration and manufacturer must be reported [3] |
| RNA Integrity Tools | Bioanalyzer systems, RIN algorithms | Assess sample quality (e.g., RIN/RQI values) to ensure comparable RNA integrity [2] |
| Oligonucleotide Design Tools | Primer design software, BLAST | Ensures specific assay design; requires reporting of in silico validation methods [2] |
| Data Analysis Software | Specialist qPCR analysis programs | Facilitates efficiency calculation, Cq determination, and outlier identification [3] [2] |
Fifteen years after their introduction, the MIQE guidelines have made an undeniable contribution to improving the trustworthiness, consistency, and transparency of published qPCR results [7]. They were born from a necessity to rescue a fundamental laboratory technique from a crisis of irreproducibility, triggered by a high-profile failure to detect measles virus in autism research. While challenges related to awareness, resources, and publication pressures continue to affect consistent application, the evidence is clear: MIQE compliance correlates with higher quality publications [1].
The philosophy underpinning MIQE is not one of restrictive bondage but of liberation from avoidable error. As the technology evolves with new applications in diagnostics, treatment, and basic research, the principles of MIQE—rigor, transparency, and reproducibility—remain as relevant as ever. The forthcoming MIQE 2.0 guidelines [5] promise to refine these principles for the next generation of qPCR applications, ensuring that this cornerstone molecular biology technique continues to yield reliable and impactful scientific discoveries.
Quantitative real-time PCR (qPCR) stands as one of the most pivotal technologies in molecular biology, forming the backbone of research and clinical diagnostics worldwide. The reliability of qPCR data, however, is entirely dependent on methodological rigor. To address this, the Minimum Information for Publication of Quantitative Real-Time PCR Experiments (MIQE) guidelines were established in 2009 to standardize the reporting and execution of qPCR experiments. After 16 years of widespread adoption and over 17,000 citations, an international consortium of experts has published MIQE 2.0 in 2025, a significant revision designed to address emerging technologies and applications [8] [9]. This in-depth technical guide explores the key advancements between these two versions, providing researchers, scientists, and drug development professionals with a clear framework for implementing these updated standards in qPCR validation research.
The Evolution of MIQE: From 2009 to 2025
The original MIQE guidelines, published in Clinical Chemistry in 2009, were created to combat the troubling lack of reproducibility and transparency in qPCR-based publications [5]. They provided the scientific community with a standardized checklist of essential information required to assess and verify qPCR results. Their influence has been profound, shaping journal editorial policies and even contributing to the development of ISO standards for molecular diagnostics [8].
However, the technology and applications of qPCR have expanded dramatically into new domains. This evolution, coupled with persistent deficiencies in the quality of published qPCR data—a problem starkly highlighted during the COVID-19 pandemic—necessitated a comprehensive update [8] [9]. MIQE 2.0, therefore, is not a mere revision but a critical response to the urgent need for enhanced reliability in molecular data that underpins decisions in biomedicine, pharmacology, and public health [8].
Core Conceptual Advancements in MIQE 2.0
The transition from MIQE to MIQE 2.0 reflects a shift in philosophy from establishing basic reporting standards to enforcing deeper methodological rigor and data integrity in the face of modern challenges.
- Emphasis on Reproducibility Over Speed: MIQE 2.0 confronts a persistent "complacency" surrounding qPCR, where the technique is often treated as an infallible "black box" [8] [9]. The updated guidelines reinforce that without full methodological rigor, data cannot be trusted, asserting that "if the data cannot be reproduced, they are not worth publishing" [9].
- Addressing Emerging Applications: The original MIQE was primarily geared toward gene expression analysis. MIQE 2.0 explicitly extends its scope to cover the complexities of new qPCR applications, such as advanced molecular diagnostics, requiring the entire workflow to adapt accordingly [8] [5].
- Streamlined and Clarified Reporting: While promoting completeness, MIQE 2.0 aims to reduce the burden on researchers by simplifying and clarifying reporting requirements. The goal is to encourage comprehensive disclosure without being unduly onerous, thus promoting wider adoption and more robust science [5].
The following table summarizes the major technical updates and advancements introduced in the MIQE 2.0 guidelines.
Table 1: Key Technical Differences Between MIQE (2009) and MIQE 2.0 (2025)
| Aspect | MIQE (2009) | MIQE 2.0 (2025) |
|---|---|---|
| Overall Focus | Established baseline reporting standards for qPCR experiments. | Enhances rigor for emerging applications; promotes a cultural shift towards transparency [8] [5]. |
| Data Analysis & Reporting | Emphasized reporting Cq (Ct) values and basic efficiency calculations. | Mandates conversion of Cq values into efficiency-corrected target quantities and reporting with prediction intervals. Requires disclosure of detection limits and dynamic range for each target [5]. |
| Raw Data | Encouraged provision of raw data. | Strongly encourages instrument manufacturers to enable raw data export to allow for independent re-analysis [5]. |
| Assay Validation | Outlined core validation parameters. | Provides clearer and more detailed recommendations for assay design, validation, and in-silico analysis tailored to modern applications [8] [5]. |
| Sample Handling & Technology | Covered sample handling and nucleic acid quality. | Explicitly explains how the entire qPCR workflow must adapt to new technologies, reagents, and consumables [5]. |
| Normalization | Established the importance of using validated reference genes. | Outlines strengthened best practices for normalization and quality control, criticizing the use of unvalidated reference genes [8] [9]. |
Detailed Methodologies for qPCR Assay Validation
Adherence to MIQE 2.0 requires rigorous validation of qPCR assays. The following detailed protocols are essential for generating trustworthy data, particularly in a drug development context.
Determining Amplification Efficiency and Dynamic Range
Purpose: To ensure the qPCR assay amplifies target DNA with high and consistent efficiency across a defined concentration range, which is fundamental for accurate quantification [10].
Protocol:
- Prepare a standard curve using a commercial standard or a sample of known concentration [10].
- Create a serial dilution series spanning at least 6 to 8 orders of magnitude (e.g., seven 10-fold dilutions) [10].
- Run each dilution in triplicate on the qPCR instrument.
- Plot the log of the starting template quantity against the Cq value obtained for each dilution.
- From the slope of the standard curve, calculate the amplification efficiency using the formula: ( E = (10^{-1/slope} - 1) \times 100\% ).
- MIQE 2.0 Compliance: The calculated efficiency must be between 90% and 110%, and the linearity of the standard curve (R²) should be ≥ 0.980 to be considered acceptable. The dynamic range defined by this curve must be reported [10].
Assessing Inclusivity and Exclusivity (Cross-reactivity)
Purpose: To verify that the assay reliably detects all intended target variants (inclusivity) and does not amplify non-targets (exclusivity), which is critical for diagnostic specificity and sensitivity [10].
Protocol:
- Inclusivity Testing:
- In-silico Analysis: Using genetic databases, check that the oligonucleotide, probe, and amplicon sequences are complementary to all known strains/isolates of the target. For example, an influenza A assay must be checked against H1N1, H3N2, etc. [10].
- Experimental Validation: Test the assay against a panel of up to 50 well-defined, certified strains that represent the genetic diversity of the target organism. The assay must produce a positive signal for all [10].
- Exclusivity Testing:
- In-silico Analysis: Check for sequence similarities between the assay oligonucleotides and genetically related non-target organisms (e.g., ensuring an influenza A assay does not match influenza B sequences) [10].
- Experimental Validation: Test the assay against a panel of closely related non-target species and common contaminants. The assay must yield no amplification signal from these samples [10].
Establishing Limits of Detection and Quantification
Purpose: To define the lowest amount of target that can be reliably detected (LoD) and accurately quantified (LoQ), which is essential for assessing assay sensitivity, especially for low-abundance targets like biomarkers or trace pathogens [10].
Protocol:
- Prepare multiple replicates (e.g., n≥12) of samples with low target concentrations.
- The Limit of Detection (LoD) is defined as the lowest concentration at which ≥95% of replicates test positive [10].
- The Limit of Quantification (LoQ) is defined as the lowest concentration at which the target can be quantified with acceptable precision and accuracy, typically with a coefficient of variation (CV) < 25-35% [10].
- MIQE 2.0 Compliance: Both the LoD and LoQ must be determined and reported for each target, as these values are now explicit requirements under the updated guidelines [5].
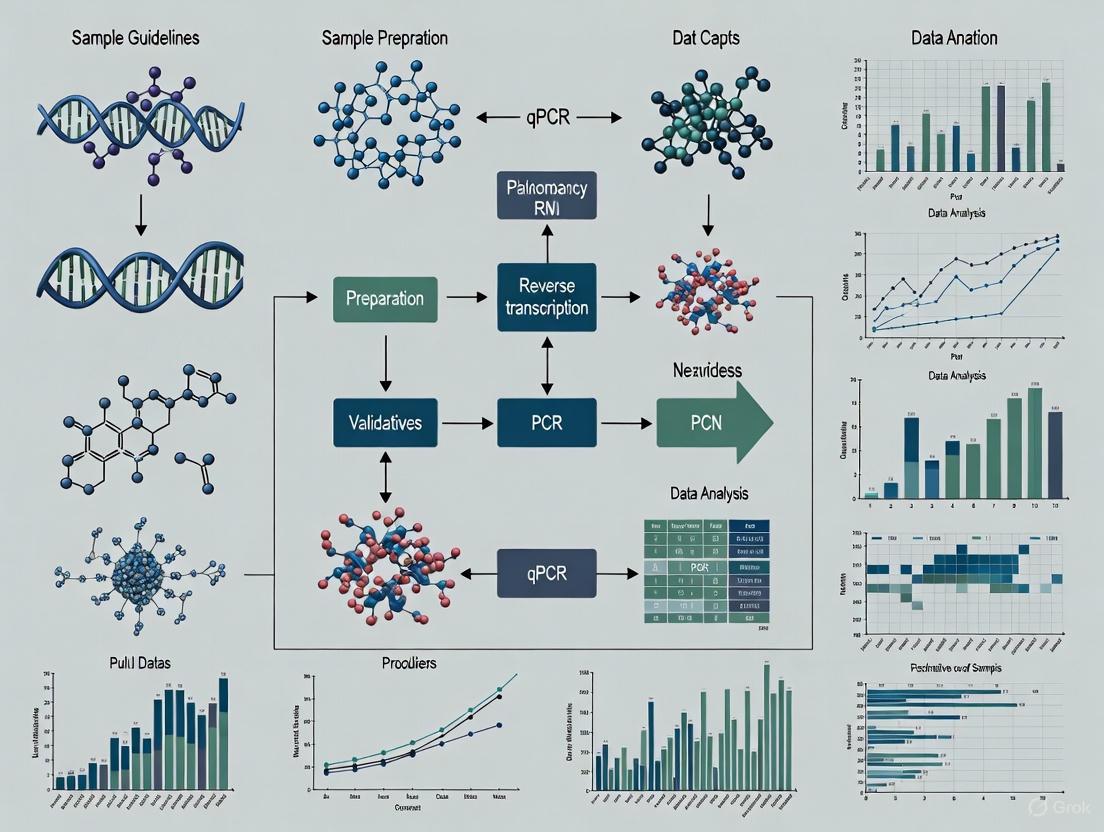
The qPCR Experimental Workflow under MIQE 2.0
The following diagram illustrates the critical stages of a qPCR experiment, highlighting key control points mandated by the MIQE 2.0 guidelines to ensure data reliability and reproducibility.
The Scientist's Toolkit: Essential Reagents and Materials
Successful implementation of MIQE 2.0-compliant qPCR requires careful selection of reagents and materials. The following table details key components for robust assay validation.
Table 2: Essential Research Reagent Solutions for qPCR Validation
| Item | Function & Importance in Validation | MIQE 2.0 Consideration |
|---|---|---|
| Certified Reference Standards | Samples with known, certified concentrations of the target used to generate standard curves for determining efficiency, dynamic range, LoD, and LoQ [10]. | Essential for traceable and accurate quantification. The source and provenance of standards must be documented. |
| Validated Primer/Probe Sets | Oligonucleotides designed for high specificity and efficiency. Predesigned assays (e.g., TaqMan) must be properly annotated. | Must provide the Assay ID and amplicon context sequence for full compliance [6]. In-house designs require full in-silico and experimental validation. |
| Nucleic Acid Quality Assessment Kits | Kits (e.g., Bioanalyzer, TapeStation) to quantitatively assess RNA Integrity Number (RIN) or DNA Integrity Number (DIN). | Mandatory for reporting sample quality. Prevents inaccurate results from degraded samples [8] [9]. |
| Reverse Transcriptase Enzymes | High-efficiency enzymes for cDNA synthesis in RT-qPCR. | A major source of variability. The enzyme and reaction conditions must be specified to ensure reproducibility [8]. |
| Validated Reference Gene Panels | A set of candidate reference genes tested for stable expression under specific experimental conditions. | Prevents normalization errors. Genes must be validated for stability; using a single, unvalidated "housekeeping" gene is unacceptable [8] [9]. |
The advent of MIQE 2.0 represents a pivotal evolution in the standards governing quantitative PCR. It moves beyond the foundational reporting framework of the original MIQE to address the pressing need for unwavering methodological rigor in an era of expanded qPCR applications. For researchers and drug development professionals, adopting MIQE 2.0 is not merely about complying with a publication checklist; it is about embracing a culture of transparency and robustness that is fundamental to generating trustworthy data. The credibility of molecular diagnostics and the integrity of the research that supports it now depend on the collective will to implement these updated guidelines as a standard in practice, not just in name [8] [9]. By integrating the detailed protocols, workflows, and reagent considerations outlined in this guide, scientists can ensure their qPCR data are robust, reproducible, and reliable, thereby upholding the highest standards of scientific inquiry.
The Minimum Information for Publication of Quantitative Real-Time PCR Experiments (MIQE) guidelines are a standardized framework designed to ensure the integrity, consistency, and transparency of quantitative PCR (qPCR) results [4]. Established in 2009 and recently updated, these guidelines provide a set of core principles that are critical for advancing reproducible science [4] [5]. The necessity for such guidelines arose from a widespread lack of consensus on how to optimally perform and interpret qPCR experiments, a problem exacerbated by insufficient experimental detail in many publications, which impedes critical evaluation and replication of results [4]. The core principles of Transparency, Standardization, and Reproducibility form the foundation of the MIQE guidelines. By mandating comprehensive disclosure of all relevant experimental conditions, reagents, and analysis methods, the guidelines empower reviewers and other scientists to assess the validity of the protocols used and reproduce the findings with confidence [4] [5]. Adherence to MIQE is therefore not merely a bureaucratic hurdle for publication; it is a fundamental practice for ensuring the reliability and credibility of scientific data in molecular biology, clinical diagnostics, and drug development.
The Evolution of MIQE: From 2009 to MIQE 2.0
The MIQE guidelines were first published in 2009 to address the critical lack of standardization in qPCR experiments [4]. The original publication highlighted how the sensitivity of qPCR to subtle experimental variations made it particularly vulnerable to irreproducible results if essential experimental details were omitted [4] [11]. The primary goal was to provide a checklist for authors, reviewers, and editors to ensure that all necessary information was provided to evaluate the quality of qPCR data. The original guidelines successfully established a new norm for rigorous reporting in the field.
Building on this foundation, the MIQE 2.0 guidelines were released to maintain relevance amid technological advancements [5]. The expansion of qPCR into new domains has driven the development of new reagents, methods, and instruments, necessitating revised best practices [5]. MIQE 2.0 incorporates updates, simplifications, and new recommendations tailored to these evolving complexities. A key advancement in MIQE 2.0 is the emphasis on data analysis and reporting. The guidelines now strongly recommend that instrument manufacturers enable the export of raw data to facilitate thorough re-evaluation [5]. Furthermore, they stipulate that quantification cycle (Cq) values should be converted into efficiency-corrected target quantities and reported with prediction intervals [5]. The guidelines also clarify and streamline reporting requirements to encourage comprehensive disclosure without imposing an undue burden on researchers, thereby promoting more rigorous and reproducible qPCR research [5].
Implementing the Core Principles in qPCR Workflows
Principle 1: Transparency
Transparency in MIQE requires the full disclosure of all reagents, sequences, analysis methods, and raw data to enable independent verification of experimental results [4] [5]. This principle is foundational to the scientific method, as it allows for the critical assessment and replication of work. For assay design, this means providing the exact primer and probe sequences or, for commercially available assays like TaqMan, the unique Assay ID and the corresponding amplicon context sequence [6]. Thermo Fisher Scientific supports this by providing an Assay Information File (AIF) for each predesigned assay, which contains the required context sequence [6]. Furthermore, MIQE 2.0 encourages instrument manufacturers to enable the export of raw data files, allowing reviewers and other researchers to perform their own analyses and confirm reported findings [5]. Transparency extends to the analysis phase, where the guidelines recommend reporting Cq values as efficiency-corrected target quantities with associated prediction intervals, rather than just raw Cq values [5]. This level of disclosure ensures that every step of the qPCR process, from sample to result, is open for scrutiny.
Principle 2: Standardization
Standardization involves adhering to consistent, well-defined experimental and analytical protocols across laboratories to minimize technical variability and enable direct comparison of results between different studies [4]. The MIQE guidelines provide a detailed checklist that covers every aspect of a qPCR experiment, creating a common language and set of practices for the field. Key areas for standardization include:
- Sample Quality: Documenting sample collection, storage, and nucleic acid extraction methods, as well as providing quality metrics like RNA Integrity Number (RIN) for RNA samples.
- Assay Validation: For each primer pair, providing information on PCR efficiency, correlation coefficient, and dynamic range [5].
- Data Analysis: Using standardized methods for quantification, such as the efficiency-corrected comparative Cq method, and clearly defining normalization strategies with validated reference genes [5].
The following diagram illustrates the integrated workflow encompassing these standardized steps, from sample preparation to final result reporting, ensuring consistency and reliability throughout the qPCR process.
Principle 3: Reproducibility
Reproducibility is the ultimate goal of the MIQE guidelines, ensuring that experiments can be reliably repeated within the same laboratory and independently verified by other research groups [4]. Reproducibility is achieved through the combined application of transparency and standardization. Key to this is the comprehensive reporting of experimental details, which allows other scientists to recreate the exact conditions of the experiment. The guidelines emphasize that full disclosure of all reagents, sequences, and analysis methods is necessary to enable other investigators to reproduce results [4]. MIQE 2.0 further strengthens this by outlining best practices for normalization and quality control, and by requiring that detection limits and dynamic ranges for each target are reported based on the chosen quantification method [5]. A novel experimental design proposed in research, which uses dilution-replicates instead of identical replicates, can also enhance reproducibility by allowing for more robust estimation of PCR efficiency across all test samples, thereby accounting for inter-run variation without the need for a common control in every run [11]. This design takes advantage of the fact that each qPCR reaction yields a Cq value reflecting both initial target gene quantity and reaction efficiency, providing a more resilient framework for obtaining consistent results [11].
Experimental Design and Analysis Protocols
Efficient Experimental Design with Dilution Replicates
Traditional qPCR experimental design involves running multiple identical replicates of each sample to account for technical variation, alongside separate standard curves on diluted samples to determine PCR efficiency for each primer pair. However, this approach can be costly and labor-intensive, especially with a large number of samples and targets [11]. An efficient alternative design employs dilution-replicates instead of identical replicates [11]. In this design, a single reaction is performed on several dilutions for every test sample, similar to a standard curve but without identical replicates at each dilution [11]. This design is based on the mathematical relationship of the qPCR amplification curve, described by the equation:
Cq = -log(d)/log(E) + log(T/Q(0)) / log(E) [11]
Where:
- Cq is the quantification cycle
- d is the dilution factor
- E is the PCR efficiency
- T is the threshold
- Q(0) is the initial quantity
A plot of Cq versus log(d) produces a straight line with a slope of -1/log(E), from which efficiency (E) can be calculated. The y-intercept, log(T/Q(0)) / log(E), provides an estimate of the initial quantity, Q(0) [11]. This means that each sample's dilution series simultaneously provides an estimate of both the PCR efficiency and the initial target quantity, eliminating the need for separate efficiency determination. This design can result in fewer total reactions while also providing a built-in mechanism to identify and exclude outliers from the analysis, as anomalies at high dilutions become apparent in the standard curve plot [11].
Robust Data Analysis and Efficiency Estimation
Accurate data analysis is critical for reliable qPCR results. The MIQE 2.0 guidelines emphasize that Cq values should be converted into efficiency-corrected target quantities and reported with prediction intervals [5]. This is crucial because small variations in the estimated PCR efficiency (E) can lead to large errors in the calculated initial quantity. For example, a 0.05 error in E (where E=2 represents 100% efficiency) can result in a 53–110% misestimate of the initial quantity after 30 cycles [11]. The dilution-replicate experimental design enables a robust method for efficiency estimation called the collinear fit of standard curves [11]. By assuming that the PCR efficiency for a given primer pair is constant across all samples, the standard curves from all samples can be fit simultaneously with the constraint of equal slopes. This provides a globally estimated PCR efficiency (E) with a high degree of freedom, making it more accurate and reliable than estimates from a single, separately run standard curve [11]. This global efficiency is then used to calculate the efficiency-corrected relative quantities for each sample, leading to more robust and reproducible gene expression quantification. The following table summarizes the key differences between the traditional and dilution-replicate experimental designs.
Table 1: Comparison of Traditional and Dilution-Replicate qPCR Experimental Designs
| Aspect | Traditional Design | Dilution-Replicate Design |
|---|---|---|
| Replicate Strategy | Multiple identical replicates per sample [11] | Multiple dilutions per sample (dilution-replicates) [11] |
| Efficiency (E) Determination | Separate standard curves from 2-3 independent samples [11] | Estimated from each sample's dilution series [11] |
| Handling of Inter-Run Variation | Requires a common control sample in each run [11] | Built-in efficiency estimation in each run makes a common control less critical [11] |
| Outlier Management | Difficult; may require repeating entire reactions [11] | Easier; outliers can be identified in the standard curve plot and excluded [11] |
| Total Number of Reactions | Can be high due to technical replicates and separate standard curves [11] | Can be reduced by integrating efficiency estimation into sample analysis [11] |
Successful and MIQE-compliant qPCR experiments rely on a suite of essential reagents and resources. The following table details key components of the research reagent solutions, their specific functions, and their role in adhering to the core principles of the MIQE guidelines.
Table 2: Essential Research Reagent Solutions for MIQE-Compliant qPCR
| Reagent / Resource | Function | MIQE Compliance & Notes |
|---|---|---|
| High-Quality Nucleic Acids | Template for the qPCR reaction. | Sample quality and integrity must be documented (e.g., with RIN for RNA). Foundational for reproducibility [4] [5]. |
| Validated Primers & Probes | Sequence-specific amplification and detection. | Transparency requires disclosure of sequences or Assay ID with context sequence [6]. Assays must be validated for efficiency and dynamic range [5]. |
| Reverse Transcription Kit | For RNA templates, synthesizes complementary DNA (cDNA). | The kit and reaction conditions must be fully reported to ensure standardization and reproducibility [4]. |
| qPCR Master Mix | Contains enzymes, dNTPs, buffers, and salts for efficient amplification. | The specific master mix and volume used in the reaction must be stated to enable experimental replication [4] [6]. |
| TaqMan Assays | Predesigned, optimized assays for specific targets. | Provide a unique Assay ID; the associated amplicon context sequence is provided for full sequence disclosure compliance [6]. |
| Assay Information File (AIF) | Document provided with TaqMan assays. | Contains the amplicon context sequence, essential for complying with MIQE guidelines on assay sequence disclosure [6]. |
The relationships between these core components and the MIQE principles are visualized in the following diagram, which shows how standardized reagents and transparent reporting converge to generate reproducible results.
The MIQE guidelines, built upon the core principles of Transparency, Standardization, and Reproducibility, provide an indispensable framework for conducting and reporting rigorous qPCR experiments. From their initial introduction to the recent MIQE 2.0 update, these guidelines have evolved to address the complexities of modern qPCR applications, offering clear recommendations for sample handling, assay validation, and data analysis [4] [5]. By diligently following these guidelines, researchers can avoid common pitfalls that lead to irreproducible results, thereby ensuring the integrity of their data and the credibility of their conclusions. The adoption of efficient experimental designs, such as the dilution-replicate method, and robust analysis techniques, like global efficiency calculation, further enhances the reliability of qPCR findings [11]. Ultimately, the consistent application of the MIQE principles across basic research and drug development is not just about meeting publication requirements—it is a fundamental commitment to scientific excellence and the advancement of reliable knowledge.
The Minimum Information for Publication of Quantitative Real-Time PCR Experiments (MIQE) guidelines establish a standardized framework for the design, execution, and reporting of qPCR assays, with the primary goal of ensuring the reproducibility and credibility of experimental results [6]. In 2025, the MIQE 2.0 revision was published to address the expansion of qPCR into new domains and the development of new reagents, methods, and instruments [5]. Transparent, clear, and comprehensive description of all experimental details is necessary to ensure the repeatability and reproducibility of qPCR results [5]. Non-compliance with these guidelines poses a significant threat to data integrity, leading to irreproducible findings, wasted resources, and erroneous conclusions that can misdirect scientific progress and clinical decision-making.
This guide outlines the concrete consequences of non-compliance, provides validated protocols to adhere to MIQE standards, and presents a practical toolkit for researchers to safeguard the integrity of their qPCR data.
The Consequences of Non-Compliance
Failure to adhere to MIQE guidelines can lead to catastrophic failures in data interpretation at multiple levels, from basic research to clinical application.
Scientific and Clinical Consequences
- Irreproducible Results and Retractions: The powerful, exponential nature of PCR amplification means that without proper validation, minor contaminants or assay inefficiencies can be dramatically amplified, leading to false results. Historically, this has led to severe misinterpretations, such as the erroneous belief in the 1990s that DNA had been extracted from dinosaur bones, when in fact modern contaminating DNA was being amplified [10].
- Misdiagnosis and Poor Patient Management: In a clinical context, an unvalidated qPCR assay can have direct consequences for patient care. For example, a test for influenza A that lacks proper inclusivity validation might fail to detect the H3N2 variant, leading to misdiagnosis. Similarly, if exclusivity (cross-reactivity) is not validated, an influenza A assay might also detect influenza B, causing patients infected with influenza B to be misdiagnosed as positive for influenza A [10].
- Stalled Drug Development and Wasted Resources: The misuse of qPCR in clinical and pre-clinical research can result in investing millions of dollars in a drug candidate that only seemed promising due to faulty qPCR data [10]. This wastes immense resources and delays the development of effective therapies.
Economic and Regulatory Costs
The economic impact of non-compliance extends beyond wasted research funds.
- Direct Financial Costs: Core facilities charge substantial set-up fees to cover the necessary regulatory, quality control, and validation work required for compliant qPCR services. For instance, an annual viral load set-up fee per target can be over $5,000 for internal academic users and over $8,000 for external users [12]. These costs represent the minimal investment for generating reliable data; skipping this validation leads to far greater costs downstream.
- Regulatory Rejection: Regulatory bodies like the FDA and EMA recommend qPCR for critical safety assessments of gene and cell therapies, such as biodistribution and vector shedding studies [13]. However, a guidance void exists for parameters like accuracy, precision, and repeatability, leading to conflicting institutional interpretations. A lack of consensus on "best practices" for assay validation can result in regulatory rejection of submitted data [13]. The lack of technical standardization remains a huge obstacle in the translation of qPCR-based tests from research to the clinic [14].
Table 1: Economic Costs of qPCR Compliance vs. Non-Compliance
| Aspect | Compliance Cost (Investment) | Non-Compliance Cost (Consequence) |
|---|---|---|
| Assay Setup | ~$5,265 annual set-up fee per target [12] | Data rejection by regulators; need for complete re-analysis |
| Sample Analysis | ~$230 per clinical sample for 5 targets [12] | Misdiagnosis leading to patient mismanagement and liability |
| Research & Development | Investment in robust validation protocols | Wasted millions on misguided drug candidates [10] |
| Publication | Transparent reporting of all MIQE elements | Retraction of publications; loss of scientific credibility |
Essential Methodologies for MIQE-Compliant qPCR
Core Validation Parameters and Protocols
To avoid the consequences of non-compliance, key assay performance characteristics must be rigorously validated.
Table 2: Essential qPCR Validation Parameters and Protocols
| Validation Parameter | Experimental Protocol | Acceptance Criteria |
|---|---|---|
| Inclusivity | Assess the ability to detect all intended target strains/isolates. Test against a panel of up to 50 well-defined (certified) strains reflecting the genetic diversity of the target species. Perform both in silico analysis (checking sequence databases) and experimental validation [10]. | The assay must reliably detect all target variants (e.g., Influenza A H1N1, H1N2, H3N2) without failure [10]. |
| Exclusivity (Cross-reactivity) | Assess the ability to exclude genetically similar non-targets. Test against a panel of common cross-reactive species that are not of interest. Perform both in silico analysis and experimental bench testing [10]. | The assay must not amplify non-targets (e.g., an Influenza A assay must not amplify Influenza B) [10]. |
| Linear Dynamic Range | Prepare a seven 10-fold dilution series of a DNA standard of known concentration, run in triplicate. Plot the resulting Ct values against the logarithm of the template concentration [10]. | The plot should fit a straight line over 6–8 orders of magnitude. Linearity (R²) values of ≥ 0.980 are typically acceptable [10]. |
| Amplification Efficiency (E) | Calculate from the slope of the standard curve generated in the linear dynamic range experiment using the formula: E = 10^(-1/slope) - 1 [13]. | A slope between -3.6 and -3.1, corresponding to an efficiency of 90%–110%, is generally acceptable [13]. |
| Limit of Detection (LOD) / Limit of Quantification (LOQ) | Determine the minimum detectable concentration (LOD) and the minimum concentration that can be accurately quantified (LOQ) through serial dilution of the target [10]. | LOD and LOQ must be established and reported for each target, based on the chosen quantification method [5]. |
Data Analysis and Reporting Standards
MIQE 2.0 provides updated and clarified recommendations for data analysis and reporting to ensure transparency.
- Raw Data: Instrument manufacturers are encouraged to enable the export of raw data to facilitate thorough analyses and re-evaluation by manuscript reviewers and other researchers [5].
- Cq Value Conversion: Quantification cycle (Cq) values should not be reported as an endpoint. They must be converted into efficiency-corrected target quantities and reported with prediction intervals [5].
- Normalization: Best practices for normalization and quality control are outlined, and reporting requirements have been clarified and streamlined to encourage researchers to provide all necessary information without undue burden [5].
- Assay Disclosure: To fully comply with MIQE guidelines, providing the probe or amplicon context sequence is required in addition to a unique assay identifier. For commercially available assays like TaqMan, the Assay Information File (AIF) contains this required context sequence [6].
The following workflow diagram summarizes the critical path for establishing a MIQE-compliant qPCR assay, highlighting key decision points and validation steps.
The Scientist's Toolkit: Research Reagent Solutions
Selecting the appropriate reagents and understanding their function is fundamental to generating reliable data.
Table 3: Essential Reagents and Materials for qPCR Validation
| Item | Function | Key Considerations |
|---|---|---|
| Sequence-Specific Primers & Probe | Binds specifically to the target DNA sequence for amplification and detection. The probe contains a reporter dye for real-time detection [13]. | Design and test at least three unique sets. Probe-based qPCR (e.g., TaqMan) offers superior specificity over dye-based methods (e.g., SYBR Green) [13]. |
| Master Mix | Provides the optimal buffer, salts, dNTPs, and DNA polymerase for efficient amplification [13]. | Use a master mix compatible with your chemistry (probe vs. dye). A hot-start enzyme is often recommended to reduce non-specific amplification. |
| Reference Standard DNA | A sample of known concentration used to generate the standard curve for absolute quantitation of target copy number [13]. | Should be highly pure and accurately quantified. Used to define the linear dynamic range and calculate amplification efficiency [10] [13]. |
| Matrix/Background DNA | Genomic DNA extracted from naive (untreated) animal tissues. Added to standard and QC samples to mimic the composition of actual biodistribution samples [13]. | Ensures that the PCR efficiency calculated from the standard curve is representative of the efficiency in the sample context, checking for inhibition [13]. |
| Nuclease-Free Water | Serves as the solvent for reactions, ensuring no enzymatic degradation of reagents. | Critical for preventing the degradation of primers, probes, and templates, which would compromise sensitivity and efficiency. |
| Quality Control (QC) Samples | Samples with known copy numbers run alongside unknowns on every qPCR plate to monitor inter-assay precision and accuracy. | Typically include high, mid, and low concentration QCs. They are essential for validating each run [13]. |
Adherence to MIQE guidelines is not a bureaucratic hurdle but a fundamental prerequisite for data integrity in qPCR research. The high cost of non-compliance—manifesting as irreproducible science, clinical misdiagnoses, and massive financial waste—far outweighs the investment in rigorous assay validation. As qPCR technology continues to evolve and find new applications, the principles enshrined in MIQE 2.0 provide a critical roadmap for researchers to generate reliable, trustworthy data that can confidently advance scientific knowledge and patient care.
Implementing MIQE: A Step-by-Step Guide to qPCR Assay Design and Execution
In the framework of the Minimum Information for Publication of Quantitative Real-Time PCR Experiments (MIQE) guidelines, the integrity of the initial sample and the extracted nucleic acids is not merely a preliminary step but the foundational determinant of experimental success [4] [6]. The MIQE guidelines were established to address a lack of consensus and insufficient experimental detail in qPCR publications, thereby ensuring the reliability, integrity, and reproducibility of results [4]. Within this context, the pre-analytical phase—encompassing sample collection, nucleic acid extraction, and quality assessment—is critical. High-quality nucleic acid preparation is universally acknowledged as the single most important step for ensuring successful PCR [15]. Contaminants or degradation at this stage can irreversibly compromise data fidelity, leading to inaccurate quantification and erroneous biological conclusions. This guide details the protocols and metrics essential for validating sample and nucleic acid integrity, aligning with the rigorous reporting standards mandated by MIQE for qPCR validation research.
Nucleic Acid Quality Assessment: Quantitative Metrics and Methods
The assessment of nucleic acid quality involves specific quantitative benchmarks. Adherence to these metrics is a core requirement for MIQE-compliant reporting, providing reviewers and other scientists with the necessary information to evaluate the validity of the protocols used [4].
Table 1: Key Quantitative Metrics for Nucleic Acid Quality Assessment
| Metric | Target Value for High Quality | Measurement Technique | Interpretation and Rationale |
|---|---|---|---|
| A260/A280 Ratio | 1.8 - 2.0 [15] | UV Spectrophotometry | Indicates protein contamination. A ratio significantly lower than 1.8 suggests residual phenol or protein, while a ratio higher than 2.0 may indicate RNA contamination in a DNA sample or solvent issues. |
| A260/A230 Ratio | > 2.0 | UV Spectrophotometry | Suggests the presence of contaminants such as salts, EDTA, or carbohydrates. A low ratio can signal the presence of reaction inhibitors. |
| PCR Efficiency | 90% - 110% [16] | qPCR Standard Curve | Calculated via a standard curve of serial dilutions. Efficiency outside this range can lead to inaccurate quantification and must be reported. Lower efficiencies suggest the presence of inhibitors or poor assay design. |
For RNA expression analysis via RT-qPCR, the process begins with extracting high-quality RNA and reverse transcribing it to complementary DNA (cDNA) [17]. The integrity of the RNA template is paramount for the reverse transcription enzyme to produce a cDNA yield that is both high and proportional to the starting RNA amount, ensuring accurate downstream quantification [15]. Furthermore, when the starting material is RNA, specific steps like DNase I treatment are recommended to reduce potential false-positive signals from genomic DNA (gDNA) contamination [15].
Experimental Protocols for Integrity Verification
Protocol: Assessment of Nucleic Acid Purity via Spectrophotometry
Principle: This method utilizes UV absorbance to quantify nucleic acid concentration and detect common contaminants based on their specific absorbance profiles.
Materials:
- Purified DNA or RNA sample
- UV-transparent cuvette
- UV/Vis Spectrophotometer
- Nuclease-free water (diluent)
Methodology:
- Blank the spectrophotometer using nuclease-free water.
- Dilute a small aliquot (typically 1-2 µL) of the nucleic acid sample in nuclease-free water. A 1:20 or 1:50 dilution is often appropriate.
- Measure the absorbance at 230 nm, 260 nm, and 280 nm.
- Record the values and calculate the following:
- Nucleic Acid Concentration: For DNA, A260 of 1.0 ≈ 50 µg/mL. For RNA, A260 of 1.0 ≈ 40 µg/mL.
- Purity Ratios: A260/A280 and A260/A230.
Data Interpretation: Compare the calculated ratios to the target values listed in Table 1. Any significant deviation indicates potential contamination that must be addressed before proceeding with qPCR.
Protocol: Validation of PCR Efficiency
Principle: PCR amplification efficiency is calculated from a standard curve generated by serially diluting a known amount of DNA template [16]. This is a critical assay validation step required by MIQE.
Materials:
- Template DNA (or cDNA) of known concentration
- qPCR master mix (e.g., SYBR Green or TaqMan)
- Target-specific primers
- Real-time PCR instrument
Methodology:
- Prepare a stock solution of your DNA template and then create a serial dilution series (e.g., 1:10, 1:100, 1:1000, 1:10000) [16].
- Perform qPCR for each dilution, ideally with three technical replicates.
- The qPCR instrument software will plot the log of the starting template quantity (or its dilution factor) against the Ct (Threshold Cycle) value for each dilution.
- Obtain the slope of the resulting standard curve.
Calculation:
- Apply the slope to the efficiency formula [16]:
Efficiency (%) = (10^(-1/slope) - 1) x 100
Interpretation: An efficiency between 90% and 110% is considered acceptable [16]. Lower values suggest inhibition or suboptimal reaction conditions, while values exceeding 110% may indicate pipetting errors, inhibitor presence, or non-specific amplification.
Workflow Diagram: From Sample to Quantifiable Data
The following diagram illustrates the complete workflow for ensuring sample and nucleic acid integrity, from collection to the final verifiable data, incorporating key quality control checkpoints.
The Scientist's Toolkit: Essential Reagents and Materials
Table 2: Key Research Reagent Solutions for Nucleic Acid Integrity
| Item | Function and Importance |
|---|---|
| DNase I | An enzyme that degrades trace amounts of genomic DNA during RNA purification. This step is crucial for preventing false-positive signals in gene expression analysis (RT-qPCR) [15]. |
| URacil-N-Glycosylase (UNG) | An enzyme used in qPCR master mixes to prevent carryover contamination from previous PCR products. It cleaves DNA strands containing dUTP (which is incorporated in place of dTTP), which are then unable to be amplified [15]. |
| Hot-Start Taq DNA Polymerase | A modified polymerase that remains inactive at room temperature. This prevents non-specific amplification and primer-dimer formation during reaction setup, thereby improving assay specificity, sensitivity, and overall efficiency [15]. |
| ROX Passive Reference Dye | A dye included in some qPCR master mixes to normalize for non-PCR-related fluctuations in fluorescence between wells. This corrects for pipetting inaccuracies or well-to-well volume differences and is required for certain instrument platforms [15]. |
| TaqMan Assays | Predesigned probe-based assays that provide high specificity by utilizing a gene-specific probe in addition to primers. They are available with detailed annotation and amplicon context sequences, facilitating compliance with MIQE guidelines on assay disclosure [6]. |
Within the MIQE framework, the journey to robust and publishable qPCR data unequivocally begins at the very first step: safeguarding sample and nucleic acid integrity. By meticulously following the documented protocols for quality assessment, rigorously validating PCR efficiency, and fully disclosing all relevant experimental conditions as outlined in the MIQE checklist, researchers can ensure the credibility and reproducibility of their findings. This commitment to rigor from sample collection onwards is what ultimately fortifies the scientific literature and enables true scientific progress.
Within the framework of MIQE (Minimum Information for Publication of Quantitative Real-Time PCR Experiments) guidelines, robust quantitative PCR (qPCR) validation research demands assays that are specific, sensitive, and efficient [4] [2]. The exquisite specificity and sensitivity that make qPCR a powerful technique are fundamentally controlled by the properties of the primers and probes used [18]. Poor design, combined with a failure to optimize reaction conditions, is a primary source of reduced technical precision and can lead to both false-positive and false-negative results, ultimately compromising the integrity of scientific data [18]. The MIQE guidelines were established to provide a standardized framework for documenting all aspects of qPCR experiments, from sample preparation to data analysis, thereby ensuring the reproducibility and credibility of research findings [6] [4]. This guide details the strategies for achieving optimal primer and probe specificity, a core requirement for any qPCR assay that aims to be MIQE-compliant and yield biologically relevant results.
Core Principles of Primer and Probe Design
The journey to a specific qPCR assay begins with adhering to foundational design principles. These parameters govern the binding efficiency and selectivity of your oligonucleotides, forming the basis for a successful experiment.
Primer Design Guidelines
Primers are the cornerstone of any PCR assay, and their careful design is non-negotiable for specificity. The following table summarizes the key characteristics to target:
Table 1: Key Design Parameters for PCR Primers
| Parameter | Recommended Ideal | Rationale |
|---|---|---|
| Length | 18–30 bases [19] | Balances specificity with adequate melting temperature. |
| Melting Temperature (Tm) | 60–64°C (ideal 62°C) [19] | Optimized for typical cycling conditions and enzyme function. |
| Tm Difference Between Primers | ≤ 2°C [19] | Ensures both primers bind simultaneously and efficiently. |
| GC Content | 35–65% (ideal 50%) [19] | Provides sufficient sequence complexity while avoiding stable secondary structures. |
| 3' End Sequence | Avoid regions of 4 or more consecutive G residues [19] | Prevents the formation of stable, non-specific G-quadruplex structures. |
Probe Design Guidelines
For hydrolysis probe-based assays (e.g., TaqMan), the probe must meet its own set of criteria to ensure specific detection of the amplicon.
Table 2: Key Design Parameters for qPCR Probes
| Parameter | Recommended Ideal | Rationale |
|---|---|---|
| Location | Close to, but not overlapping, a primer-binding site [19] | Ensures efficient cleavage by the 5'→3' exonuclease activity of the polymerase. |
| Melting Temperature (Tm) | 5–10°C higher than primers [19] | Guarantees the probe is fully bound before primer extension begins. |
| GC Content | 35–65%; avoid G at the 5' end [19] | Prevents quenching of the 5' fluorophore, which would reduce signal. |
| Quenching | Use of double-quenched probes is recommended [19] | Incorporation of an internal quencher (e.g., ZEN, TAO) lowers background and increases signal-to-noise ratio. |
Amplicon and Target Considerations
The characteristics of the amplified region itself are equally critical for assay specificity.
- Amplicon Length: Typically, 70–150 base pairs are ideal, as this length is easily amplified with standard cycling conditions and provides enough sequence space for designing primers and a probe with appropriate Tm [19].
- Amplicon Location: When working with RNA, design assays to span an exon-exon junction wherever possible. This dramatically reduces the risk of amplifying contaminating genomic DNA [19] [18].
- Target Identification: The first step in assay design is the unambiguous identification of the target sequence using curated databases (e.g., NCBI RefSeq with prefixes like NC, NG, NM_) [18]. It is crucial to account for known splice variants, paralogues, and pseudogenes to ensure the assay amplifies the intended target and nothing else. Always report the database accession number used for design in publications [18].
The Design Workflow: From Sequence to Specific Assay
Achieving a specific and robust assay requires a systematic workflow that combines in silico design with empirical validation. The following diagram illustrates this comprehensive process.
In Silico Design and Analysis
The initial phase involves computational steps to create and refine candidate oligonucleotides.
- Define Assay Properties: Before designing primers, determine the desired amplicon location and length based on the target transcript and the need to avoid genomic DNA amplification [18].
- Design Oligonucleotides: Use specialized software to generate candidate primers and probes that conform to the guidelines in Tables 1 and 2. The critical variable for primer performance is its annealing temperature (Ta), which must be established experimentally, not solely relied upon from in silico Tm calculations [18].
- Analyze Specificity and Secondary Structures:
- Specificity Check: Perform an in silico specificity check using BLAST to ensure the selected primers are unique to the desired target sequence [19] [2]. However, be aware that BLAST may miss thermodynamically important hybridisation events and is not infallible [18].
- Secondary Structure Analysis: Screen all primers and probes for self-dimers, cross-dimers, and hairpins. The free energy (ΔG) for any such structures should be weaker (more positive) than –9.0 kcal/mol [19]. Tools like the IDT OligoAnalyzer are essential for this purpose.
Experimental Validation and Optimization
A perfect in silico design does not guarantee wet-lab success. Empirical validation is a MIQE-mandated step [2].
- Optimize Reaction Conditions: Systematically optimize the concentrations of primers and MgCl₂, as well as the annealing temperature [2] [18]. A robust assay will perform well over a broad temperature range, whereas an assay with a narrow optimum is more susceptible to yielding variable results [18].
- Validate Assay Performance:
- Specificity: Validate primer specificity empirically, ideally by DNA sequencing of the amplicon, or at a minimum by gel electrophoresis or analysis of melting curves for SYBR Green assays [2].
- Efficiency and Dynamic Range: Construct a standard curve using a serial dilution (at least 5 orders of magnitude) of a known amount of template [2] [20]. The PCR efficiency is calculated from the slope of the standard curve using the formula: Efficiency (%) = (10^(-1/slope) - 1) x 100 [20]. MIQE-compliant assays should have an efficiency between 90% and 110% [2] [20].
- Sensitivity and Linearity: Report the linear dynamic range and the limit of detection (LOD) based on the standard curve [2].
Successful qPCR assay design and validation rely on a suite of specific reagents and in silico tools. The following table details key resources.
Table 3: Essential Reagents and Tools for qPCR Assay Development
| Item / Resource | Function / Purpose | Example / Note |
|---|---|---|
| High-Quality DNA Polymerase | Enzymatic amplification of the target sequence. | Often purchased as a master mix containing buffer, dNTPs, and enzyme. |
| Optical Plates/Tubes | Compatible with real-time thermal cyclers for fluorescence detection. | Must be clear and free of auto-fluorescence. |
| Fluorogenic Probes & Dyes | Detection of accumulating amplicon in real-time. | Hydrolysis probes (e.g., TaqMan), intercalating dyes (e.g., SYBR Green). |
| Quenching Molecules | Suppress fluorophore emission until probe cleavage. | TAMRA, BHQ; double-quenched probes use an internal quencher (ZEN, TAO) [19]. |
| Primer Design Software | In silico generation and analysis of oligonucleotides. | IDT PrimerQuest, Primer3. |
| Oligo Analysis Tools | Analyze Tm, dimers, hairpins, and secondary structures. | IDT OligoAnalyzer, UNAFold [19]. |
| Sequence Databases | Source of curated target sequences for design. | NCBI RefSeq (e.g., NM_ accessions) [18]. |
| Specificity Check Tools | Verify oligonucleotide specificity against genomic databases. | NCBI BLAST [19]. |
MIQE Compliance: Reporting Your Assay
The MIQE guidelines are not just a laboratory practice but also a publication standard. Full disclosure enables critical evaluation and repetition of experiments [4]. The following diagram outlines the key reporting nodes for primer and probe design within the MIQE framework.
For primer and probe design, the following information is essential for MIQE compliance and should be included in publications, either in the main text or as supplementary data [6] [2]:
- Primer and Probe Sequences: Report the exact sequences and database accession numbers used for design. For commercially predesigned assays (e.g., TaqMan), providing the assay ID is typically sufficient, but the probe or amplicon context sequence must also be available to fully comply with MIQE [6].
- Amplicon Details: Include the amplicon size and location, specifying if it crosses an exon-exon junction [6] [2].
- In Silico Validation: Note the software used for design and the results of specificity checks (e.g., BLAST analysis) [2].
- Empirical Validation Data:
- PCR Efficiency and Linearity: Report the slope, y-intercept, PCR efficiency, and R² of the standard curve [2] [20].
- Specificity Evidence: Describe the method used to confirm specificity (e.g., sequencing, melt curve analysis) [2].
- Dynamic Range and LOD: State the linear dynamic range and the limit of detection [2].
By meticulously following these design strategies and adhering to MIQE reporting standards, researchers can develop qPCR assays with optimal specificity, ensuring the generation of reliable, reproducible, and credible data that advances scientific knowledge.
In the landscape of molecular biology, Reverse Transcription quantitative Polymerase Chain Reaction (RT-qPCR) stands as a cornerstone technique for precise gene expression analysis. Its significance in biomedical research, clinical diagnostics, and drug development necessitates rigorous standardization to ensure the reliability and reproducibility of generated data. The Minimum Information for Publication of Quantitative Real-Time PCR Experiments (MIQE) guidelines provide this critical framework [5] [9]. Originally published in 2009 and recently revised as MIQE 2.0, these guidelines establish a standardized set of recommendations for the design, execution, and reporting of qPCR experiments [5]. Adherence to MIQE principles is not merely a procedural formality but a fundamental aspect of scientific integrity, designed to combat methodological failures and build a foundation of trusted evidence for research and development decisions [9]. This guide details the essential components and conditions of the RT-qPCR protocol within the context of these vital validation standards.
Core Principles of RT-qPCR and MIQE
The RT-qPCR Workflow
RT-qPCR is a two-step process that first involves the reverse transcription of RNA into complementary DNA (cDNA), followed by the quantitative amplification of this cDNA [21] [22]. The accuracy of the final quantitative data is contingent upon meticulous attention to every stage of this workflow, from sample acquisition to data analysis.
The Role of MIQE 2.0 Guidelines
The updated MIQE 2.0 guidelines address advances in technology and emerging applications, offering clear recommendations for sample handling, assay design, validation, and data analysis [5]. A core principle is the necessity of transparent and comprehensive reporting of all experimental details to ensure repeatability and reproducibility [5]. MIQE 2.0 emphasizes that quantification cycle (Cq) values should be converted into efficiency-corrected target quantities and reported with prediction intervals [5]. Despite widespread awareness of MIQE, compliance remains patchy, a concerning issue given that qPCR results underpin decisions in diagnostics and public health [9].
Essential Components and Reagents
RNA Template: The Foundational Starting Material
The quality of the RNA template is the single most critical factor for successful RT-qPCR.
- Quality and Integrity: RNA must be free of degradation, which can be assessed via gel electrophoresis (showing intact 28S and 18S ribosomal RNAs with a 2:1 ratio) or more quantitatively using an RNA Integrity Number (RIN), where values of 8-10 indicate high-quality RNA [23].
- Purity Assessment: Absorbance ratios measured by UV spectroscopy are used to evaluate the presence of contaminants. Target ratios are A260/A280 ≈ 2.0 for pure RNA and A260/A230 > 1.8 to indicate minimal organic compound contamination [23]. Fluorometer-based methods (e.g., Qubit assays) offer greater accuracy for quantification [23].
- gDNA Removal: Trace amounts of genomic DNA (gDNA) can cause high background and false positives. Treatment with a DNase is strongly recommended. ezDNase Enzyme is an example of a double-strand-specific DNase that offers a shorter workflow and less risk of RNA damage compared to traditional DNase I [23].
Reverse Transcription (RT) Reagents
The conversion of RNA to cDNA is a potential source of significant technical variation.
- Reverse Transcriptase Selection: Common enzymes include AMV RT, MMLV RT, and engineered MMLV RT (e.g., SuperScript IV). Key differentiators are RNase H activity (lower is better for synthesizing long cDNA), reaction temperature (higher temperatures help denature RNA with secondary structure), and reaction time. Engineered MMLV RT offers low RNase H activity, a high reaction temperature of 55°C, and a short 10-minute incubation [23].
- Primer Selection: The choice of primer for reverse transcription dictates cDNA representation and must be documented per MIQE guidelines.
- Oligo(dT) Primers: Consist of 12-18 deoxythymidines that anneal to the poly(A) tails of eukaryotic mRNAs. Ideal for full-length cDNA cloning but unsuitable for degraded RNA or RNAs without poly(A) tails (e.g., prokaryotic RNA, miRNAs). Can cause 3' end bias [23].
- Random Primers: Typically random hexamers that anneal anywhere on any RNA species. Suitable for degraded RNA, RNAs without poly(A) tails, and RNA with secondary structures. However, they yield shorter cDNA fragments and may overestimate mRNA copy number [23].
- Gene-Specific Primers: Offer the most specific priming but are limited to targeted genes [23]. A mixture of oligo(dT) and random hexamers is often used in two-step RT-qPCR to balance the benefits of each [23].
qPCR Reagents and Detection Chemistry
The qPCR reaction requires careful optimization and validation of its components.
- Master Mix: A pre-mixed solution containing DNA polymerase, dNTPs, buffers, and cations (e.g., Mg2+). Using a commercial master mix saves time and improves reproducibility [24]. The master mix may also include a passive reference dye (e.g., ROX) to normalize for well-to-well signal variance [24].
- Detection Methods: The choice of chemistry balances specificity, cost, and flexibility.
- DNA Intercalating Dyes (e.g., SYBR Green): Bind non-specifically to double-stranded DNA (dsDNA). They are versatile and cost-effective but require post-amplification melt-curve analysis to confirm amplification specificity, as they will detect any dsDNA, including primer-dimers [25] [24] [22].
- Hydrolysis Probes (e.g., TaqMan Probes): Target-specific oligonucleotides with a 5' fluorescent reporter and a 3' quencher. The DNA polymerase's 5' exonuclease activity cleaves the probe during amplification, separating the reporter from the quencher and generating fluorescence. This method offers high specificity and enables multiplexing (detecting multiple targets in one reaction) but requires custom probe design [25] [22].
- Other Probe Types: Molecular beacons (hairpin-shaped probes) and locked nucleic acid (LNA) probes (with increased thermal stability) offer alternative high-specificity options [22].
Table 1: Key Research Reagent Solutions and Their Functions
| Reagent Category | Specific Examples | Primary Function | Key Considerations |
|---|---|---|---|
| Reverse Transcriptase | SuperScript IV, AMV RT | Synthesizes cDNA from an RNA template | RNase H activity, reaction temperature, processivity |
| RT Primers | Oligo(dT), Random Hexamers, Gene-Specific | Initiates cDNA synthesis from the RNA template | Defines cDNA representation; choice depends on RNA type and application |
| qPCR Master Mix | TaqMan Fast Advanced, SYBR Green Supermix | Provides core components for DNA amplification | Includes polymerase, dNTPs, buffer; may include dye or reference dye |
| Detection Chemistry | SYBR Green, TaqMan Probes | Generates fluorescent signal proportional to amplicon production | Specificity (probes) vs. flexibility (dyes); cost and multiplexing capability |
| gDNA Removal | DNase I, ezDNase Enzyme | Eliminates contaminating genomic DNA | Prevents false-positive amplification; specificity for dsDNA is beneficial |
Detailed Experimental Protocol and Workflow
Reverse Transcription Reaction
- Template Preparation: Use 10 ng–1 µg of high-quality, DNase-treated total RNA. The input amount should be consistent across samples and justified [23] [26].
- Reaction Setup: In a nuclease-free tube, combine RNA template, reverse transcriptase, reaction buffer, dNTPs, RNase inhibitor, and selected primers (e.g., 2.5 µM random hexamers and/or 2.5 µM oligo(dT) [23].
- Incubation Conditions:
- Annealing: Incubate at 25°C for 5-10 minutes for primer binding.
- Extension: Incubate at the enzyme's optimal temperature (e.g., 50–55°C for engineered MMLV RT) for 10-60 minutes.
- Enzyme Inactivation: Heat to 85°C for 5 minutes [23].
- Output: The resulting cDNA can be diluted and used immediately in qPCR or stored at -20°C.
Quantitative PCR (qPCR) Setup
- Reaction Assembly: Typically performed in a 96- or 384-well plate. A standard 20 µL reaction contains:
- Essential Controls:
- No-Template Control (NTC): Contains all components except template cDNA. Checks for contaminating DNA.
- No-Reverse Transcription Control (NRT): Contains RNA that was not reverse transcribed. Checks for gDNA contamination.
- Positive Control: A sample with a known expression level of the target.
- Endogenous Control: One or more validated reference genes for normalization [22].
Thermal Cycling Conditions
The cycling profile depends on the detection chemistry and polymerase used.
Table 2: Standard qPCR Thermal Cycling Protocols
| Step | Temperature | Duration | Purpose | Notes |
|---|---|---|---|---|
| Initial Denaturation | 95°C | 2–10 minutes | Activates hot-start polymerase; fully denatures complex templates | Duration depends on polymerase [25]. |
| Amplification Cycles (40-50 cycles) | ||||
| › Denaturation | 95°C | 10–15 seconds | Melts dsDNA into single strands | |
| › Annealing/Extension | 60°C | 30–60 seconds | Primers and probes bind; polymerase extends | Single step for hydrolysis probes; separate steps (e.g., 72°C) for some dyes [25]. |
Data Analysis and MIQE Compliance
- Quantification Cycle (Cq): The cycle number at which the fluorescence signal crosses the threshold. A lower Cq indicates a higher starting template concentration [25] [22].
- PCR Efficiency: Must be calculated from a standard curve of serial dilutions. The percent efficiency should be 90–110% (slope of -3.6 to -3.1), which equates to a doubling of product per cycle. Assumptions of 100% efficiency are invalid [24] [9].
- Quantification Methods:
- Absolute Quantification: Determines the exact copy number of the target by comparing Cq values to a standard curve of known concentrations.
- Relative Quantification: Determines the change in target expression relative to a control sample and a reference gene. The comparative ΔΔCq method is commonly used, where RQ (Relative Quantity) = 2^(-ΔΔCq) [22].
- Normalization: Must be performed against one or more validated reference genes (e.g., GAPDH, ACTB) that are stably expressed across all experimental conditions. Normalization is non-negotiable for accurate relative quantification [9].
Workflow and Logical Relationships
The following diagram illustrates the complete RT-qPCR workflow, highlighting critical checkpoints mandated by MIQE guidelines for ensuring data validity.
Diagram: The RT-qPCR Workflow and Critical MIQE Checkpoints. This diagram outlines the sequential steps of the RT-qPCR protocol, integrating essential quality control points (red diamonds) and methodological choices (green rectangles) required for generating MIQE-compliant, reproducible data.
The power of RT-qPCR as a tool for gene expression analysis is undeniable, but this power is contingent upon methodological rigor. The MIQE guidelines provide the essential framework for this rigor. By meticulously adhering to the protocols outlined here—prioritizing RNA quality, validating assays, including appropriate controls, employing proper normalization, and reporting with full transparency—researchers and drug development professionals can ensure their RT-qPCR data are robust, reproducible, and reliable. In an era where molecular data directly impact research credibility, therapeutic development, and diagnostic decisions, integrating MIQE principles into laboratory practice is not just best practice; it is a professional imperative.
Quantitative polymerase chain reaction (qPCR) has become a cornerstone technology in the development and regulatory bioanalysis of cell and gene therapies (CGTs). These advanced therapy medicinal products (ATMPs) represent a paradigm shift in treating diseases by introducing genetic material or modified cells into a patient's body. Gene therapy works by introducing a normal copy of a defective gene into target cells, enabling them to produce functional proteins to combat diseases ranging from cancer and cystic fibrosis to diabetes and hemophilia [27]. The core of these therapies often involves viral vectors, with adeno-associated virus (AAV) vectors being the most common delivery system, though other systems like replication-competent viral vectors and microbial vectors are also employed [27].
In this context, qPCR and its digital counterpart (dPCR) serve as critical tools for characterizing key aspects of CGT products, including biodistribution, transgene expression, viral shedding, and cellular kinetics [28] [29]. These applications are vital for establishing both the safety and efficacy profiles of investigational therapies. The exceptional sensitivity and specificity of qPCR allows for the detection of administered nucleic acid sequences across a wide dynamic range, making it particularly suitable for tracking vector-derived sequences against a background of endogenous genetic material [27]. However, the regulated bioanalysis supporting drug development demands rigorous validation of these analytical methods, which is where the Minimum Information for Publication of Quantitative Real-Time PCR Experiments (MIQE) guidelines provide an essential framework [30] [4].
The MIQE Framework and Regulatory Context
Evolution of MIQE Guidelines
The MIQE guidelines were first established in 2009 to address widespread inconsistencies in qPCR experimental design, execution, and reporting [4]. These guidelines emerged from recognizing that insufficient methodological detail in publications prevented proper evaluation and replication of findings across laboratories [30]. The original publication included an 85-point checklist that defined standardized nomenclature, optimization procedures, validation requirements, and analysis protocols for qPCR experiments [4]. This framework subsequently formed the basis for the international standard ISO20395:2019, which outlines requirements for evaluating the performance of nucleic acid quantification methods [30].
In 2025, the MIQE guidelines underwent a significant revision to address technological advances that have transformed qPCR methodologies since the original publication [30]. MIQE 2.0 represents an evolution from focusing primarily on reporting criteria to emphasizing good practices for assay design [30]. Key updates include requirements for publishing confidence intervals for critical parameters like limit of detection and PCR efficiency, making raw data available for verification, and converting Cq values to efficiency-corrected target quantities rather than relying solely on raw Cq values for statistical analysis [30].
Regulatory Landscape for Cell and Gene Therapies
The regulatory environment for CGTs is rapidly evolving, with 2025 marking a pivotal year characterized by increased regulatory caution and refinement of approval pathways [31] [32]. The U.S. Food and Drug Administration (FDA) has recently released several draft guidance documents specifically addressing CGT development, including:
- "Expedited Programs for Regenerative Medicine Therapies for Serious Conditions" (September 2025)
- "Postapproval Methods to Capture Safety and Efficacy Data for Cell and Gene Therapy Products" (September 2025)
- "Innovative Designs for Clinical Trials of Cellular and Gene Therapy Products in Small Populations" (September 2025) [31] [33]
These documents reflect regulators' efforts to balance accelerated access with thorough safety assessment, particularly following high-profile safety events such as the temporary clinical hold placed on Sarepta's Elevidys gene therapy for Duchenne muscular dystrophy after patient fatalities [32]. In this stringent regulatory climate, robust analytical methods validated according to recognized standards like MIQE become increasingly critical for successful product development and approval.
qPCR Assay Design and Development for CGT Applications
Primer and Probe Design Strategies
The foundation of a reliable qPCR assay lies in careful primer and probe design, particularly for CGT applications where distinguishing between endogenous and therapeutic genetic elements is often essential. Specificity is paramount, and several strategies have been developed to achieve this:
- Targeting Non-Natural Junctions: Primers should be positioned over non-natural junctions (e.g., promoter-target junctions or gene-post-translational enhancement element junctions) to prevent nonspecific binding to endogenous DNA or RNA [34]. For exon-skipping therapies, targeting the unnatural exon-exon junction provides specificity [34].
- Codon-Optimized Sequences: When the transgene is codon-optimized and has a different sequence than the endogenous gene, primers and probes should target regions with the least similarity to the endogenous sequence [34].
- Universal Assays: In early development, designing primers and probes to target the vector backbone independently of the delivered transgene creates a universal PCR assay that reduces development efforts across multiple projects [34].
The choice between probe-based qPCR (e.g., TaqMan) and dye-based methods (e.g., SYBR Green) significantly impacts assay reliability. Probe-based assays are generally preferred in regulated bioanalysis due to their reduced risk of false-positive signals compared to dye-based approaches [27]. This specificity advantage stems from the requirement that the probe must bind to its complementary sequence in addition to primer binding for signal generation. For dye-based qPCR, careful primer design and post-amplification melt curve analysis can partially mitigate specificity concerns [27].
Sample Processing and Nucleic Acid Extraction
Robust sample processing is a critical pre-analytical step that directly impacts qPCR results. The entire workflow—from sample collection to nucleic acid extraction—must be optimized and controlled:
- Sample Collection: The type of anticoagulant (for blood), collection tube (e.g., PAXgene for RNA preservation), and handling conditions must be standardized [34].
- Tissue Processing: Homogenization or lysis methods must be appropriate for specific tissue types to ensure efficient nucleic acid release while maintaining integrity [34].
- Nucleic Acid Extraction: The choice of extraction method depends on whether DNA or RNA is targeted, modification status, nucleic acid length, and other features [27] [34]. Ideally, extraction recovery should be validated using the actual test item rather than control spikes, as these may perform differently [34]. Automation using liquid handlers improves standardization and reproducibility [34].
- Reverse Transcription: For RNA targets, the selection of reverse transcriptase enzyme and priming method (gene-specific, oligo(dT), or random hexamers) significantly influences cDNA synthesis efficiency and subsequent quantification accuracy [34].
Experimental Workflow
The diagram below illustrates the complete qPCR assay workflow for cell and gene therapy applications, from sample collection through data analysis:
Method Validation in Accordance with MIQE Principles
Key Performance Parameters
Method validation confirms that an assay is suitable for its intended purpose and generates reliable, reproducible results. The table below summarizes the key performance characteristics and their recommended acceptance criteria for qPCR assays in regulated bioanalysis:
Table 1: qPCR Assay Validation Parameters and Acceptance Criteria
| Performance Characteristic | Experimental Approach | Acceptance Criteria |
|---|---|---|
| Specificity | In silico analysis (BLAST), gel electrophoresis, testing with non-specific targets | No amplification with non-specific targets; amplicons of expected size [27] |
| Accuracy | Analysis of quality control (QC) samples at multiple concentrations | -50% to +100% relative error (RE) for interpolated copies in qPCR [34] |
| Precision | Intra-assay and inter-assay testing with replicates | ≤30% CV for QCs; ≤50% CV for LLOQ [34] |
| PCR Efficiency | Calibration curve from serial dilutions | 90-110% efficiency (slope of -3.1 to -3.6) [34] |
| Linearity | Calibration curve with 6-8 points over 3-4 log range | R² ≥ 0.98 [27] [34] |
| Limit of Detection (LOD) | Analysis of multiple replicate dilutions | Concentration detected in 95% of replicates [27] |
| Lower Limit of Quantification (LLOQ) | Analysis of multiple replicate dilutions at low concentrations | Quantified with ≤50% CV and accuracy within -50% to +100% RE [34] |
| Robustness | Variation of experimental conditions (analysts, days, instruments) | Precision and accuracy maintained within acceptance criteria [34] |
Establishing Sensitivity and Specificity
The limit of blank (LOB) and limit of detection (LOD) are critical parameters for establishing assay sensitivity. LOB is defined as the concentration at which a sample is negative with 95% confidence, while LOD represents the concentration at which a sample is positive with 95% confidence [34]. These are determined empirically by analyzing multiple replicate dilutions of the target template [27].
Specificity is demonstrated when 100% of unspiked matrices (samples without the analyte) show results below the LOD, and at least 8 out of 10 spiked samples at the LLOQ concentration meet precision and accuracy criteria [34]. Specificity should be evaluated early in method development using in silico tools like BLAST, followed by experimental confirmation through gel electrophoresis to verify amplicon size and testing with non-specific targets to ensure no amplification occurs [27].
Controls and Quality Assurance
Appropriate controls are essential for generating reliable qPCR data. The MIQE guidelines emphasize the inclusion of:
- No-template controls (NTC): Contain all reaction components except the template nucleic acid to detect contamination or non-specific amplification [27].
- Negative controls: Samples of the biological matrix without the analyte to assess specificity in the relevant sample background [34].
- Positive controls: Samples with known concentrations of the target to monitor assay performance across runs [27].
- Reverse transcription negative controls (RT-negative): For RNA applications, reactions without reverse transcriptase to detect contaminating DNA that could lead to false-positive results [34].
For clinical diagnostics and regulated bioanalysis, MIQE 2.0 specifically addresses the importance of using multiple negative controls and exogenous spike-ins to validate results [30]. In multiplex assays, incorporating reference genes or external templates as in-sample controls can confirm the robustness of the sample preparation workflow and validate negative test results [30].
Applications in Cell and Gene Therapy Development
Biodistribution and Cellular Kinetics
Biodistribution (BD) studies are fundamental to understanding where CGT products localize in the body after administration, informing both efficacy and safety assessments. These studies clarify cell survival time, engraftment, and distribution sites, providing crucial data for predicting clinical outcomes based on non-clinical findings [29]. A multi-site evaluation study demonstrated that both qPCR and ddPCR methods could effectively quantify human cells in mouse tissues, with accuracy (relative error) generally within ±50% and precision (coefficient of variation) generally less than 50% [29].
For cell therapies, cellular kinetics (CK) tracks the persistence, expansion, and clearance of administered therapeutic cells. In the case of CAR-T cells, this monitoring provides insights into the relationship between cell persistence and therapeutic response or potential toxicities. Both qPCR and dPCR platforms are extensively used for these applications, with each offering distinct advantages depending on the specific requirements for sensitivity, precision, and dynamic range [28].
Vector Shedding and Transgene Expression
Vector shedding studies determine whether gene therapy vectors are excreted or released from patients through biological fluids, which is critical for assessing transmission risk to untreated individuals [28]. Regulatory agencies require shedding data to inform appropriate containment measures and prevent unintended environmental exposure [27]. The FDA's "Design and Analysis of Shedding Studies for Virus or Bacteria-Based Gene Therapy and Oncolytic Products" guidance outlines expectations for these assessments [33].
Transgene expression analysis measures the production of therapeutic genetic material in target tissues, providing direct evidence of pharmacological activity. For these applications, reverse transcription qPCR (RT-qPCR) is commonly employed to quantify expression levels of the delivered transgene. Careful assay design is essential to distinguish between endogenous and therapeutic gene expression, particularly when the transgene complements an existing cellular function [28] [34].
Comparative Analysis of qPCR and dPCR
Digital PCR (dPCR) has emerged as a complementary technology to qPCR, offering absolute quantification without the need for standard curves. The table below compares the applications and performance characteristics of both platforms in CGT bioanalysis:
Table 2: Comparison of qPCR and dPCR Applications in Cell and Gene Therapy Bioanalysis
| Application | qPCR Approach | dPCR Approach | Considerations |
|---|---|---|---|
| Biodistribution | Quantification via standard curve | Absolute quantification without standard curve | Both show similar tissue distribution profiles [29] |
| Vector Shedding | Interpolated copy number from calibration curve | Direct counting of target molecules | dPCR may offer better precision at low copy numbers [28] |
| Transgene Expression | Relative or absolute quantification with efficiency correction | Absolute quantification with resistance to PCR inhibitors | dPCR preferred when inhibitor presence is suspected [28] |
| Cellular Kinetics | Interpolated results with relative error of -50% to +100% | Absolute copy numbers with relative error ≤30% for QCs [34] | dPCR provides improved accuracy for low-abundance targets [34] |
Primer Design Strategies for CGT Applications
The diagram below illustrates different primer and probe design strategies for distinguishing therapeutic genetic elements from endogenous counterparts in cell and gene therapy applications:
Essential Research Reagent Solutions
Successful implementation of qPCR assays for CGT bioanalysis requires careful selection of reagents and materials. The following table outlines key components and their functions in regulated method development:
Table 3: Essential Research Reagents for qPCR Assay Development in Cell and Gene Therapy
| Reagent Category | Specific Examples | Function and Selection Criteria |
|---|---|---|
| Nucleic Acid Extraction | PAXgene tubes, EDTA tubes, commercial extraction kits | Sample preservation and nucleic acid isolation; selection based on sample type (tissue, blood, liquid biopsy) and analyte (DNA, RNA, miRNA) [34] |
| Reverse Transcriptase | Gene-specific primers, oligo(dT), random hexamers | cDNA synthesis from RNA templates; enzyme selection impacts efficiency and representation [34] |
| Polymerase & Master Mixes | Probe-based kits (TaqMan), dye-based kits (SYBR Green) | DNA amplification; probe-based preferred for specificity in regulated work [27] |
| Primers & Probes | Target-specific oligonucleotides, dual-labeled probes | Specific target detection; should be optimized for efficiency and specificity [27] [34] |
| Quantification Standards | Plasmid DNA, in vitro transcribed RNA, reference materials | Calibration curve generation; should mimic patient sample amplicon when possible [34] |
| Quality Controls | Synthetic oligonucleotides, cell lines with known copy numbers | Assay performance monitoring; used in QC samples for validation and sample analysis [34] |
The application of qPCR in regulated bioanalysis for cell and gene therapy development continues to evolve alongside scientific advances and regulatory refinements. The recently updated MIQE 2.0 guidelines provide an enhanced framework for ensuring analytical validity, with increased emphasis on data transparency, rigorous assay design, and appropriate statistical treatment of results [30]. These principles align with regulatory trends emphasizing more comprehensive safety assessment and post-approval monitoring, as evidenced by recent FDA draft guidances on capturing long-term safety and efficacy data for CGT products [31].
The growing adoption of artificial intelligence and machine learning in regulatory review and bioanalysis presents both opportunities and challenges for qPCR applications in CGT development [31]. AI tools can enhance data analysis, identify patterns in large datasets, and potentially predict assay performance, but require careful validation to ensure reliability and transparency [31]. Meanwhile, ongoing efforts toward global regulatory harmonization, such as the FDA's Gene Therapies Global Pilot Program (CoGenT), aim to streamline development pathways while maintaining rigorous standards [31].
As the CGT field addresses challenges related to product safety, manufacturing scalability, and equitable access, robust bioanalytical methods grounded in MIQE principles will remain essential for generating reliable data to support regulatory submissions and ultimately bring transformative therapies to patients in need.
Beyond the Basics: Troubleshooting Common qPCR Pitfalls with MIQE
Identifying and Overcoming Inhibition and Contamination
In quantitative PCR (qPCR), inhibition and contamination are not merely technical inconveniences; they are fundamental adversaries to data integrity and experimental reproducibility. Within the framework of the MIQE (Minimum Information for Publication of Quantitative Real-Time PCR Experiments) guidelines, addressing these challenges is a non-negotiable prerequisite for generating publishable and clinically relevant data [5] [9]. The recently published MIQE 2.0 guidelines reiterate that transparent, clear, and comprehensive description of all experimental details—including those governing sample quality and assay specificity—is essential to ensure the repeatability and reproducibility of qPCR results [5]. The pervasive lack of technical standardization remains a huge obstacle in translating qPCR-based assays from research use only (RUO) to in vitro diagnostics (IVD), directly impacting clinical management in diagnosis, prognosis, and therapeutic monitoring [14]. This guide provides researchers and drug development professionals with a detailed, actionable framework for identifying, quantifying, and overcoming inhibition and contamination, thereby aligning laboratory practices with the rigorous standards demanded by MIQE and the evolving landscape of molecular diagnostics.
Understanding Inhibition and Contamination in qPCR
Inhibition occurs when substances present in a sample or reagent prevent or reduce the efficiency of the PCR amplification. Inhibitors can act on the DNA polymerase, chelate essential co-factors like magnesium ions, or interfere with DNA denaturation and primer annealing.
Contamination involves the unintended introduction of exogenous nucleic acids into the reaction, leading to false-positive results or inaccurate quantification. The exponential amplification power of PCR, which can theoretically produce 1000 billion strands from a single molecule, makes it exceptionally vulnerable to contamination, as tragically demonstrated by early researchers who mistakenly amplified contaminating modern DNA instead of putative dinosaur DNA [10].
Consequences for Data Integrity and Clinical Translation
The consequences of unaddressed inhibition and contamination are severe. Inhibition can lead to:
- Reduced Analytical Sensitivity: A higher limit of detection, potentially resulting in false negatives [14].
- Underestimation of Target Quantity: Lower amplification efficiency leads to higher Cq values and an inaccurate representation of the true target concentration [35].
- Poor Precision and Reproducibility: Increased variability between technical replicates undermines data reliability.
Contamination directly compromises analytical specificity—the ability of a test to distinguish the target from non-target analytes [14]. This can lead to false positives, misdiagnosis, and poor patient management [10]. In the context of drug development, such errors can result in the wasting of millions of dollars on drug candidates that only seemed promising due to flawed data [10].
Identification and Detection of Inhibition
Systematic Workflow for Identification
A systematic approach is required to diagnose inhibition. The following workflow provides a step-by-step method for its identification and initial characterization.
Key Indicators and Diagnostic Methods
Several analytical methods, aligned with MIQE's emphasis on data inspection and validation, can be used to detect inhibition.
1. Amplification Curve Analysis: Visually inspect amplification plots for abnormal shapes, such as a sigmoidal curve with a reduced slope or a late "take-off" point, which indicates reduced amplification efficiency [35] [36]. The baseline should be set using the fluorescence intensity during early cycles (e.g., 5 to 15) to establish a constant background, and the threshold should be set within the parallel, logarithmic phase of all amplification plots [35] [36].
2. Efficiency Calculation via Standard Curve: A core MIQE requirement is reporting the amplification efficiency for each assay [5]. This is determined using a serial dilution of a known template. The slope of the plot of Cq versus the logarithm of the template concentration is used to calculate efficiency: Efficiency (%) = (10^(-1/slope) - 1) x 100 [36]. Per MIQE, efficiencies between 90% and 110% are generally acceptable, with an ideal R² value of ≥0.980 for the standard curve [10] [36]. Significant deviation from this range suggests potential inhibition or suboptimal assay conditions.
3. External/Internal Control (Spiking) Assay: This is a definitive test for inhibition. A known quantity of a control DNA or RNA sequence (non-competitive or competitive) is added to the sample. A significant delay in the Cq of the spiked control in the test sample compared to a no-inhibitor control (e.g., water) confirms the presence of inhibitors. This directly tests the analytical sensitivity of the assay in the sample matrix [14].
4. RNA Integrity Assessment (for RT-qPCR): For gene expression studies, RNA quality is paramount. Degraded RNA can mimic inhibition and cause inaccurate results. MIQE guidelines require the reporting of RNA quality assessment, which can be done using methods like the RNA Integrity Number (RIN) [9].
Table 1: Common qPCR Inhibitors and Their Sources
| Inhibitor Category | Specific Examples | Common Sources | Primary Mechanism of Action |
|---|---|---|---|
| Blood Components | Hemoglobin, Heparin, IgG | Blood, serum, plasma | Binds to polymerase; Heparin co-purifies with nucleic acids |
| Cellular Components | Lactoferrin, Myoglobin, Proteases | Tissues, biopsies, feces | Degrades polymerase or nucleic acids |
| Environmental Substances | Humic acids, phenolic compounds | Soil, plants | Interacts with nucleic acids or proteins |
| Laboratory Reagents | Phenol, EDTA, SDS, Ethanol | Nucleic acid extraction | Denatures polymerase; Chelates Mg²⁺ ions |
Overcoming Inhibition: Strategies and Protocols
A Tiered Strategy for Mitigation
Overcoming inhibition requires a logical, tiered approach, starting with the most effective method and proceeding to more specialized solutions.
Detailed Methodologies for Inhibition Overcoming
1. Optimized Nucleic Acid Extraction: The most effective strategy is to remove inhibitors during sample purification.
- Protocol: Compare the performance of at least two different extraction kits (e.g., silica-column based vs. magnetic-bead based) using a spiked control. For difficult samples like stool or soil, use kits specifically validated for those matrices. Incorporate additional wash steps with ethanol-based buffers to remove residual contaminants. The efficiency of extraction should be validated as part of the assay's analytical precision [14].
2. Sample Dilution: Diluting the nucleic acid template reduces the concentration of the inhibitor relative to the target.
- Protocol: Perform a 2-fold to 10-fold dilution of the extracted nucleic acid. Re-run the qPCR and re-calculate the efficiency. Note that this also dilutes the target, which may push low-abundance targets below the assay's limit of detection (LOD). The linear dynamic range of the assay must be established to ensure quantification remains accurate after dilution [10] [35].
3. Use of Reaction Enhancers: Certain additives can counteract the effects of inhibitors.
- Protocol: Supplement the master mix with additives such as Bovine Serum Albumin (BSA, 0.1-0.5 mg/mL) to bind phenols, or T4 gene 32 protein to stabilize single-stranded DNA. The concentration must be optimized, as some enhancers can become inhibitory themselves.
4. Polymerase Selection: Some DNA polymerases are more robust to specific inhibitors than others.
- Protocol: Test alternative polymerases (e.g., recombinant Tth polymerase for blood-derived samples) side-by-side with the standard enzyme. Report the polymerase source and formulation as required by MIQE [5].
Table 2: Troubleshooting Guide for Inhibition
| Symptom | Potential Cause | Recommended Solution | MIQE-Compliant Validation |
|---|---|---|---|
| High Cq values, low yield | General inhibition | Optimize extraction; dilute template | Report Cq values and efficiency for diluted samples [5] |
| Failed amplification | Strong inhibition (e.g., heparin) | Change extraction kit; use a robust polymerase | Use and report a spiked control to confirm removal [14] |
| Low efficiency (<<90%) | Mg²⁺ chelation or polymerase inhibition | Use reaction enhancers (BSA); adjust MgCl₂ | Report the calculated efficiency from a standard curve [36] |
| Inconsistent replicates | Variable inhibitor carryover | Improve extraction consistency; add more replicates | Report repeatability (intra-assay precision) [14] |
Preventing and Detecting Contamination
Contamination Prevention Workflow
Preventing contamination is fundamentally more effective than eliminating it. A strict laboratory workflow is essential.
Protocols for Contamination Control
1. Physical Segregation: As shown in the workflow, physically separate the laboratory into dedicated pre-PCR, PCR amplification, and post-PCR areas. Equipment (pipettes, centrifuges, lab coats) must be dedicated to each area and never moved from a post-PCR to a pre-PCR area.
2. Procedural Controls:
- Use of Uracil-N-Glycosylase (UNG): Incorporate dUTP in place of dTTP during PCR. In subsequent reactions, pre-treat with UNG, which cleaves uracil-containing contaminants from previous reactions, before the amplification step by inactivating it at high temperature.
- Aerosol-Reducor Tips: Use filter tips for all liquid handling steps to prevent aerosol-borne contamination.
- Rigorous Cleaning: Decontaminate surfaces and equipment with a 10% bleach solution or DNA-degrading solutions.
3. Experimental Controls: MIQE guidelines mandate the inclusion of specific controls to detect contamination [5].
- No-Template Control (NTC): Contains all reaction components except the nucleic acid template. Any amplification in the NTC indicates contamination of reagents or master mix.
- No-Reverse-Transcription Control (NRT, for RT-qPCR): Contains RNA template but no reverse transcriptase. Amplification in this control indicates genomic DNA contamination.
- Positive Control: A known, low-copy number positive sample to ensure the assay is functioning correctly.
MIQE-Compliant Experimental Design and Validation
Integrating Solutions into a Cohesive Workflow
For a qPCR assay to be MIQE-compliant, the strategies for handling inhibition and contamination must be formally validated and documented. This is particularly critical for Clinical Research (CR) assays, which fill the gap between Research Use Only (RUO) and In Vitro Diagnostics (IVD) [14].
1. Assay Validation for Inclusivity and Exclusivity:
- Inclusivity measures the assay's ability to detect all intended target strains/isolates. Validation involves testing against a panel of well-defined strains (international standards recommend up to 50) to ensure no variants are missed [10].
- Exclusivity (Cross-reactivity) assesses the assay's ability to exclude genetically similar non-targets. This is tested by running the assay against a panel of near-neighbor organisms that are not of interest [10]. Both tests should be performed in silico (using genetic databases to check oligonucleotide sequences) and experimentally at the bench [10].
2. Establishing Analytical Performance: As part of the "fit-for-purpose" validation, the following parameters must be established and reported [14]:
- Limit of Detection (LoD): The lowest concentration of the target that can be reliably detected. Determined by testing a dilution series of the target and using statistical methods (e.g., probit analysis).
- Dynamic Range: The range of template concentrations over which the fluorescent signal is directly proportional to the input, typically 6-8 orders of magnitude for a well-optimized assay. Established using a dilution series [10] [35].
- Precision: The closeness of agreement between repeated measurements (repeatability within a run, reproducibility between runs).
The Scientist's Toolkit: Essential Reagents and Materials
Table 3: Research Reagent Solutions for Inhibition and Contamination Management
| Item/Tool | Function/Description | Application in Inhibition/Contamination Control |
|---|---|---|
| Silica-Column/Magnetic Bead Kits | Nucleic acid purification systems | Selective binding of nucleic acids to separate them from inhibitors in the sample matrix. |
| BSA (Bovine Serum Albumin) | Reaction enhancer | Binds to and neutralizes common inhibitors like phenols and humic acids in the reaction mix. |
| UNG (Uracil-N-Glycosylase) | Enzyme for contamination control | Pre-digests PCR products from previous reactions by cleaving uracil-containing DNA, preventing carryover contamination. |
| Aerosol-Resistant (Filter) Tips | Pipette tips with an internal barrier | Prevent aerosol-borne contaminants and sample cross-contamination during liquid handling. |
| Synthetic DNA/RNA Controls | Non-biological nucleic acid sequences | Used as exogenous spikes to test for inhibition and as positive controls without risk of biological contamination. |
| NTC (No-Template Control) | Control reaction without sample | Essential for detecting DNA contamination in reagents, master mix, or the laboratory environment. |
Navigating the challenges of inhibition and contamination is a cornerstone of generating robust, reliable, and reproducible qPCR data. By integrating the systematic identification protocols, tiered mitigation strategies, and rigorous contamination controls outlined in this guide, researchers can align their work with the exacting standards of the MIQE 2.0 guidelines. This commitment to methodological rigor transcends academic exercise—it is the foundation upon which credible scientific discovery, valid diagnostic applications, and successful drug development are built. As the field moves forward, embracing these practices as non-negotiable elements of the qPCR workflow is imperative for upholding the integrity of molecular research and its translation into clinical practice.
Achieving and Reporting Precise PCR Efficiency
The Minimum Information for Publication of Quantitative Real-Time PCR Experiments (MIQE) guidelines establish that transparent and comprehensive reporting of all experimental details is fundamental to ensuring the repeatability and reproducibility of qPCR results [4] [5]. Within this framework, the accurate determination and reporting of PCR amplification efficiency is not merely a technical formality, but a cornerstone for reliable quantitative analysis. PCR efficiency (E) is defined as the fraction of target molecules that are successfully copied in a single PCR cycle [37]. In an ideal reaction, every template molecule is duplicated each cycle, yielding an efficiency of 1 (or 100%). However, numerous factors in practice can cause efficiency to deviate from this ideal, potentially leading to substantial inaccuracies in calculated gene expression levels [38]. Following MIQE principles, specifically the updated MIQE 2.0 guidelines, researchers are encouraged to convert quantification cycle (Cq) values into efficiency-corrected target quantities and to report these with prediction intervals [5]. This guide details the methodologies for achieving, assessing, and reporting precise PCR efficiency, providing the essential technical rigor required for robust qPCR validation research.
The Critical Role of PCR Efficiency in Quantitative Accuracy
The precision of PCR efficiency directly governs the accuracy of any subsequent quantification. The core mathematical relationship in qPCR shows that the original template quantity is proportional to (1 + E)^(-Cq) [39] [37], where E is the efficiency and Cq is the quantification cycle. This exponential relationship means that even minor deviations in the assumed efficiency value can lead to significant miscalculations of fold-changes in gene expression.
A seemingly small discrepancy in efficiency can produce dramatic errors. For instance, if the true efficiency of an assay is 90% (E=0.9) but is assumed to be 100% (E=1.0) in the 2^(-ΔΔCq) calculation, the resulting error at a Cq of 25 can be as high as 261%, leading to a 3.6-fold under-estimation of the true expression level [38]. This effect is exacerbated when comparing multiple assays, such as a target gene and a reference gene, that have different efficiencies. The ΔΔCq method is only valid when the amplification efficiencies of the target and reference gene are approximately equal [39] [38]. If efficiencies differ, the calculated normalized expression levels will be systematically biased. Therefore, precise efficiency determination is not an optional step but a mandatory prerequisite for accurate quantification, a principle strongly emphasized by the MIQE guidelines to maintain the integrity of the scientific literature [4] [7].
Table 1: Impact of PCR Efficiency Assumptions on Calculated Quantity
| True Efficiency | Assumed Efficiency in Calculation | Cq Value | Error in Calculated Quantity |
|---|---|---|---|
| 90% | 100% | 20 | Significant Under-estimation |
| 100% | 90% | 20 | Significant Over-estimation |
| 95% | 95% | Any | Minimal |
Determining PCR Efficiency: Methodologies and Protocols
The Standard Curve Method
The most robust and widely accepted method for determining PCR efficiency is through the use of a standard curve [37]. This protocol involves creating a dilution series of a known template and analyzing the resulting Cq values.
Experimental Protocol:
- Template Preparation: Create a serial dilution of your template (e.g., purified PCR product, genomic DNA, or cDNA). A 10-fold dilution series is most common, typically spanning at least 6 to 7 orders of magnitude [37]. The template should ideally reflect the sample matrix and structure of experimental samples.
- qPCR Run: Amplify each dilution in the series using the qPCR assay to be validated. To ensure precision, perform a minimum of 3-4 technical replicates for each dilution point [37].
- Data Plotting and Slope Calculation: Plot the obtained Cq values (Y-axis) against the logarithm of the initial template concentration (X-axis). Perform a linear regression analysis on the data points to obtain the slope of the standard curve.
- Efficiency Calculation: Calculate the PCR efficiency (E) using the formula derived from the underlying qPCR mathematics [39] [37] [38]:
E = 10^(-1/slope) - 1The result is often expressed as a percentage:%Efficiency = (E - 1) * 100.
Table 2: Interpretation of Standard Curve Slope and Efficiency
| Slope | Calculated Efficiency (E) | Efficiency (%) | Interpretation |
|---|---|---|---|
| -3.32 | 2.00 | 100% | Ideal, doubling every cycle |
| -3.58 | 1.90 | 90% | Typically acceptable range |
| -3.10 | 2.11 | 111% | Typically acceptable range |
| -4.00 | 1.68 | 68% | Unacceptable; assay requires optimization |
The following workflow outlines the key steps in this method, from preparation to analysis:
Alternative and Supporting Methods
While the standard curve is the gold standard, other methods can provide valuable insights.
- Visual Assessment of Amplification Curves: This qualitative method involves plotting amplification curves on a logarithmic Y-axis. Assays with high and similar efficiencies will produce parallel curves during the geometric phase of amplification. Non-parallel curves indicate differing or sub-optimal efficiencies [39]. This method is useful for a quick, visual confirmation but does not yield a numerical value.
- The User Bulletin #2 Method for Comparative Assays: This approach is useful when comparing two assays (e.g., a target and a reference gene). It involves generating standard curves for both assays from the same dilution series and then subtracting their slopes. A difference of zero indicates identical efficiencies, which, given proper assay design, most likely signifies 100% efficiency for both [39]. However, this method does not correct for all potential errors in dilution preparation.
Troubleshooting Common PCR Efficiency Problems
Low PCR Efficiency (<90%)
Sub-optimal efficiency is often a result of issues in assay design or reaction components.
- Cause: Primers with non-optimal design leading to secondary structures (e.g., dimers, hairpins), inappropriate melting temperatures (Tm), or non-specific binding [39] [40].
- Solution: Redesign primers using specialized software (e.g., Primer Express) or select pre-validated assays (e.g., TaqMan Assays) that are guaranteed to have ~100% efficiency [39].
- Cause: Non-optimal reaction conditions, including inadequate concentrations of magnesium ions, dNTPs, or polymerase enzyme [37].
- Solution: Systematically optimize the concentrations of all reaction components and ensure the use of a high-quality master mix.
PCR Efficiency Exceeding 100%
Efficiencies calculated to be significantly above 110% are typically artifacts rather than true biological phenomena.
- Cause: Presence of PCR inhibitors in more concentrated samples. Inhibitors flatten the standard curve by causing higher-concentration samples to have higher Cq values than expected, resulting in a shallower slope and a calculated efficiency >100% [40]. Common inhibitors include carryover ethanol, phenol, heparin, or hemoglobin from the nucleic acid purification process.
- Solution: Purify the template sample to remove inhibitors. Assess sample purity spectrophotometrically (A260/A280 ratio of ~1.8 for DNA, ~2.0 for RNA) [40]. If inhibition is observed, exclude the inhibited concentrated samples from the standard curve calculation or use a master mix more tolerant to inhibitors.
- Cause: Errors in preparing the serial dilution series [37] [40].
- Solution: Use precise pipetting techniques, ensure pipettes are properly calibrated, and use larger volumes during dilution to minimize sampling error [37].
The decision tree below guides the systematic investigation of efficiency issues:
The Scientist's Toolkit: Essential Reagents and Materials
Table 3: Key Research Reagent Solutions for qPCR Efficiency Analysis
| Item | Function & Importance |
|---|---|
| High-Quality Nucleic Acid Template | The starting material for standard curves. Should be pure (assessed via A260/A280 ratios) and free of inhibitors to ensure accurate efficiency measurement [40]. |
| Validated Assays (TaqMan) or Design Software (Primer Express) | Pre-designed, validated assays guarantee high efficiency. Design software ensures primers and probes meet criteria (e.g., Tm, length, specificity) for optimal, efficient amplification [39]. |
| qPCR Master Mix | A optimized ready-to-use solution containing polymerase, dNTPs, salts, and buffer. A high-quality, robust master mix is crucial for consistent, efficient amplification across samples and plates [39]. |
| Calibrated Precision Pipettes | Essential for creating accurate serial dilution series. Pipette calibration error is a major source of slope inaccuracy; using larger transfer volumes can reduce this error [37]. |
| Standard Curve Quantification Software | Instrument software or standalone tools that automate the calculation of standard curve slope and PCR efficiency, reducing manual calculation errors [41]. |
Reporting PCR Efficiency within the MIQE Guidelines
Adherence to MIQE guidelines is critical for publishing rigorous and reproducible qPCR data. The following items related to PCR efficiency must be explicitly reported [4] [5] [42]:
- Assay Validation Data: For each assay, provide details of the validation process, including the method used to determine efficiency (e.g., standard curve) and the resulting value.
- Precise Efficiency Values: Report the calculated PCR efficiency for each assay (e.g., 95.5% or E=1.96). The MIQE 2.0 guidelines further recommend reporting efficiency-corrected target quantities with associated prediction intervals [5].
- Standard Curve Details: Disclose the source and nature of the standard material (e.g., "plasmid DNA with insert"), the dilution factor and range covered, the number of technical replicates, and the linear regression statistics (e.g., R² value) for the standard curve [37].
- Full Assay Characteristics: Disclose all primer and probe sequences, or provide a reference to a database like RTPrimerDB if commercial assays with undisclosed sequences are used (though this is discouraged) [42].
- Data Transparency: Make raw Cq data available, either as a supplement or in a public repository, to allow for independent re-evaluation [5].
By meticulously following these experimental and reporting standards, researchers and drug development professionals can ensure that their qPCR data on PCR efficiency is both technically sound and presented with the transparency required for scientific validation and impact.
Reverse transcription quantitative real-time PCR (RT-qPCR) has become the gold standard for rapid and reliable quantification of gene expression due to its high sensitivity, specificity, and reproducibility [43] [44]. However, the accuracy of this technique is highly dependent on appropriate normalization to offset technical confounding variations that may result from sample-to-sample and run-to-run differences in RNA extraction, reverse transcription efficiency, and pipetting errors [45]. Without proper normalization, biological interpretation of RT-qPCR data becomes fundamentally unreliable.
The MIQE (Minimum Information for Publication of Quantitative Real-Time PCR Experiments) guidelines establish that using stably-expressed internal reference genes is crucial for data normalization [5] [6]. These guidelines emphasize transparent reporting of all experimental details to ensure repeatability and reproducibility of qPCR results. The revised MIQE 2.0 guidelines further stress that "Cq values should be converted into efficiency-corrected target quantities and reported with prediction intervals" with clear "best practices for normalization and quality control" [5].
A critical insight from current research is that normalization of RT-qPCR data remains problematic when based on pre-experimental determination of particular reference genes [45]. Expression stability of candidate reference genes varies significantly across different sample sets and experimental conditions, necessitating post-experimental validation for robust data normalization [45] [44]. This technical guide provides a comprehensive framework for selecting and validating reference genes within the context of MIQE guidelines for qPCR validation research.
Theoretical Foundation: Why Reference Gene Validation Matters
The Compositional Nature of qPCR Data
qPCR data are fundamentally compositional—the total amount of RNA input is fixed, meaning any change in the amount of a single RNA necessarily translates into opposite changes in all other RNA levels [46]. This mathematical property makes interpreting changes in a single gene's expression without reference impossible. Normalization using internal reference genes that are stably expressed across all experimental conditions provides the necessary reference frame for accurate biological interpretation.
Pitfalls of Traditional Housekeeping Genes
Many researchers traditionally rely on single "housekeeping" genes assumed to maintain constant expression (e.g., GAPDH, ACTB, 18S rRNA). However, substantial evidence shows these genes often exhibit significant expression variability under different experimental conditions [47] [43] [44]. For example, a study in peach found that commonly used reference genes GAPDH and ACT performed poorly and were less stable across different sample types [43]. Similarly, in spinach, 18S rRNA—though frequently used—showed fluctuating expression under several treatments [44].
This variability has serious consequences. If an unstable reference gene is used for normalization, it can significantly distort the apparent expression levels of target genes, potentially leading to incorrect biological conclusions [45] [43]. The combinatorial effect of using different numbers of reference genes can substantially alter the interpretation of biological phenomena, as demonstrated by the finding that "GstD1, InR and Hsp70 expression exhibits an age-dependent increase in fly heads; however their relative expression levels are significantly affected by normalization factors using different numbers of reference genes" [45].
Statistical Tools for Reference Gene Evaluation
Several statistical algorithms have been developed specifically to assess the expression stability of candidate reference genes. The table below summarizes the most widely used tools:
Table 1: Statistical Tools for Reference Gene Evaluation
| Tool | Statistical Approach | Output Metrics | Key Advantage |
|---|---|---|---|
| geNorm | Pairwise comparison of expression ratios | Stability measure (M); Optimal number of genes (V) | Determines optimal number of reference genes needed [43] [44] |
| NormFinder | Variance modeling within and between sample groups | Stability value | Particularly sensitive to systematic variation between sample groups [43] [44] |
| BestKeeper | Analysis of raw Cq values and correlation coefficients | Standard deviation (SD) and coefficient of variation (CV) | Works directly with Cq values without requiring transformation [44] |
| ΔCt Method | Pairwise comparison of Cq values | Mean SD and stability ranking | Simple comparative approach [48] |
| RefFinder | Comprehensive algorithm integrating multiple methods | Comprehensive ranking | Provides integrated stability ranking from multiple approaches [49] [48] |
| Equivalence Test-Based Method | Network analysis of equivalence tests on expression ratios | Maximal cliques of stable genes | Controls error of selecting inappropriate genes; accounts for compositional nature of data [46] |
Integrated Analysis Approach
Current best practices recommend using multiple algorithms concurrently to identify the most stable reference genes. Different methods often produce varying gene rankings, so an integrated approach provides more reliable results [48]. For example, a study in barnyard millet applied five different algorithms (geNorm, NormFinder, BestKeeper, ΔCt, and RefFinder) to identify optimal reference genes under different abiotic stress conditions [48].
The equivalence test-based method represents a particularly advanced approach that addresses the compositional nature of RT-qPCR data. This method uses equivalence tests to prove that pairs of genes experience the same expression change between conditions, then builds a network where genes are connected if their ratio remains equivalent across conditions. The largest set of completely interconnected genes (maximal clique) is selected as the optimal reference set [46].
Experimental Protocol for Reference Gene Validation
Candidate Gene Selection and Primer Validation
The reference gene validation process begins with selecting appropriate candidate genes. The following workflow outlines the complete experimental protocol:
Figure 1: Experimental Workflow for Reference Gene Validation
Candidate Gene Selection
Select 10-20 candidate reference genes spanning different functional classes to avoid co-regulation. Include both traditional housekeeping genes (e.g., GAPDH, ACTB, 18S rRNA) and less conventional candidates. For example, studies in plants have successfully used genes such as elongation factor 1-alpha (EF1α), ubiquitin-conjugating enzyme (UBC), and tubulin (TUB) [44] [48]. In Norway spruce, novel candidates like conserved oligomeric Golgi complex (COG7) and tubby-like F-box protein (TULP6) have shown exceptional stability [49].
Primer Design and Validation
Design primers according to MIQE guidelines with the following criteria:
- Amplicon length: 80-150 bp
- Primer melting temperature (Tm): 58-62°C
- GC content: 40-60%
- Avoid primer-dimer and secondary structure formation
Validate primer specificity through:
- Melt curve analysis showing single peak
- Agarose gel electrophoresis confirming single amplicon of expected size
- Efficiency calculation using dilution series (R² > 0.99, efficiency 90-110%)
As emphasized in MIQE guidelines, "transparent, clear, and comprehensive description and reporting of all experimental details are necessary to ensure the repeatability and reproducibility of qPCR results" [5].
RNA Quality Control and Reverse Transcription
RNA quality profoundly impacts RT-qPCR results. Ensure RNA integrity through:
- Spectrophotometric assessment (A260/280 ratio ~2.0)
- Microfluidic analysis (RNA Integrity Number > 7.0)
- Verification of absence of genomic DNA contamination
Use consistent reverse transcription conditions across all samples with sufficient replicates. The MIQE guidelines recommend detailed reporting of "sample handling, assay design, and validation" to ensure technical consistency [5].
Data Analysis and Interpretation
Stability Analysis and Ranking
After RT-qPCR analysis, input Cq values into multiple stability evaluation algorithms. The following diagram illustrates the analytical workflow for data processing and interpretation:
Figure 2: Data Analysis Workflow for Reference Gene Selection
Different algorithms provide complementary insights:
- geNorm determines the optimal number of reference genes through pairwise variation analysis
- NormFinder identifies stable genes while considering systematic variation between sample groups
- BestKeeper evaluates stability based on raw Cq variation
A comprehensive ranking integrating results from all methods provides the most reliable reference gene selection.
Determining the Optimal Number of Reference Genes
A key finding from reference gene studies is that the optimal number of reference genes is experiment-specific. The geNorm algorithm calculates a pairwise variation value (Vn/Vn+1) to determine whether adding another reference gene improves normalization stability. A common threshold is Vn/Vn+1 < 0.15, indicating that n reference genes are sufficient [43].
Research has demonstrated that "the NF variation across samples does not exhibit a continuous decrease with pairwise inclusion of more reference genes, suggesting that either too few or too many reference genes may detriment the robustness of data normalization" [45]. The optimal number can range from as few as 2 to more than 10 depending on the experimental system [45].
Alternative Normalization Strategies
Global Mean Normalization
For high-throughput qPCR experiments profiling dozens to hundreds of genes, global mean (GM) normalization can be a robust alternative. This method assumes that the average expression of a large set of randomly selected genes remains constant across samples [50].
A 2025 study comparing normalization methods in canine gastrointestinal tissues found that "the lowest mean coefficient of variation observed across all tissues and conditions corresponded to the GM method" [50]. The study further recommended that "implementation of the GM method is advisable when a set greater than 55 genes is profiled" [50].
Data-Driven Normalization Methods
Other data-driven approaches adapted from microarray analysis include:
- Quantile Normalization: Assumes the overall distribution of gene expression is similar across samples and forces each sample to have the same distribution [47]
- Rank-Invariant Set Normalization: Identifies genes with stable rank order across samples and uses them to calculate normalization factors [47]
These methods are particularly valuable when standard housekeeping genes are regulated by experimental conditions [47].
Validation of Selected Reference Genes
Experimental Validation
After identifying putative reference genes, validate their suitability by normalizing target genes with known expression patterns. For example, in barnyard millet under abiotic stress, the stability of selected reference genes was confirmed by analyzing the expression pattern of Cu-ZnSOD (SOD1), which "varied according to reference genes and the number of reference genes used, thus highlighting the importance of the choice of a reference gene in such experiments" [48].
Reporting Guidelines
Comply with MIQE guidelines by reporting:
- Complete assay information including amplicon context sequences
- PCR efficiency and correlation coefficients for each assay
- Cq values and raw data availability
- Detailed description of normalization strategy and justification of reference gene selection
- Stability values and statistical analysis for selected reference genes
As emphasized by MIQE, "instrument manufacturers are encouraged to enable the export of raw data to facilitate thorough analyses and re-evaluation by manuscript reviewers and interested researchers" [5].
Research Reagent Solutions
Table 2: Essential Reagents and Tools for Reference Gene Validation
| Reagent/Tool | Function | Application Notes |
|---|---|---|
| High-Quality RNA Extraction Kit | Isolation of intact, pure RNA | Ensure consistent yield and purity across all samples; verify integrity [44] |
| Reverse Transcription Kit | cDNA synthesis with high efficiency | Use consistent lot and standardized protocol; include genomic DNA removal steps [44] |
| qPCR Master Mix | Amplification with fluorescent detection | Select appropriate chemistry (SYBR Green or probe-based); optimize concentration [43] |
| Validated Primer Sets | Specific amplification of target sequences | Design for similar annealing temperatures; verify specificity and efficiency [48] |
| Stability Analysis Software | Statistical evaluation of gene expression stability | Utilize multiple algorithms (geNorm, NormFinder, BestKeeper) for comprehensive assessment [43] [48] |
| RNA Quality Assessment Tools | Verification of RNA integrity | Spectrophotometer for purity; bioanalyzer for integrity number [44] |
Robust normalization through careful selection and validation of reference genes is fundamental to generating reliable RT-qPCR data. The process requires systematic experimental design, rigorous statistical analysis, and thorough validation within specific experimental contexts. By adhering to MIQE guidelines and employing the strategies outlined in this technical guide, researchers can ensure their gene expression data are both accurate and biologically meaningful.
The field continues to evolve with new statistical methods and alternative normalization approaches, but the core principle remains: reference genes must be validated for each specific experimental condition rather than assumed based on convention or previous studies. This rigorous approach to normalization ensures that subsequent biological conclusions rest on a solid technical foundation.
The quantification cycle (Cq) value, while a fundamental output of any quantitative PCR (qPCR) experiment, represents merely a starting point for robust data interpretation. Relying solely on raw Cq values without proper context, validation, and analysis compromises experimental integrity and can lead to biologically erroneous conclusions. The Minimum Information for Publication of Quantitative Real-Time PCR Experiments (MIQE) guidelines were established to address this critical issue by providing a standardized framework for conducting and reporting qPCR experiments, ensuring reproducibility and credibility of results [4] [6]. Moving beyond simple Cq values requires a comprehensive understanding of amplification kinetics, assay validation, and appropriate quantification models, all framed within the rigorous context of MIQE compliance. This paradigm shift is essential for researchers, scientists, and drug development professionals seeking to generate meaningful, publication-quality data that accurately reflects biological reality.
Core Concepts: Understanding the Amplification Curve
The qPCR amplification curve represents the accumulation of DNA amplicons over the complete duration of the experiment, with fluorescence intensity plotted against cycle number [51]. Proper interpretation of this curve's components is foundational to moving beyond simplistic Cq analysis.
Table 1: Key Components of a qPCR Amplification Curve
| Component | Description | Interpretation Significance |
|---|---|---|
| Baseline | The initial cycles (typically 5-15) where fluorescence signal remains at background levels [51] [52]. | Establishes the background fluorescence against which true amplification is measured; incorrect setting can drastically alter Cq values [52]. |
| Threshold | The fluorescence level set significantly above the baseline to indicate a statistically significant increase in amplification signal [51]. | Must be set within the exponential phase of all compared amplification curves; defines the Cq value [52]. |
| Exponential Phase | The portion of the curve where amplification efficiency is maximal and reproducible. | The most reliable region for quantitative analysis; threshold should be set within this phase [52]. |
| Plateau Phase | The final cycles where amplification efficiency declines and fluorescence signal stabilizes [51]. | Not suitable for quantification due to reaction-limiting factors; highlights why endpoint analysis is unreliable. |
Establishing Robust Analysis Parameters
Baseline Correction and Threshold Setting
Accurate baseline determination is crucial, as improperly set baselines can significantly distort Cq values. The baseline should be defined using fluorescence intensity from early cycles (e.g., cycles 5-15) where amplification remains at background levels, avoiding the initial cycles (1-5) which may contain reaction stabilization artifacts [52]. Modern qPCR instruments typically perform this automatically, but verification is essential.
Threshold setting requires more nuanced decision-making. The threshold must be:
- Positioned sufficiently above the baseline to avoid background fluorescence interference
- Set within the exponential phase of all amplification curves
- At a point where compared amplification curves demonstrate parallel log-linear phases [52]
When amplification curves are parallel, the ΔCq between samples remains constant regardless of the specific threshold position within the exponential phase. However, when curves are non-parallel—often occurring at higher Cq values or due to efficiency differences—the calculated ΔCq becomes highly dependent on threshold placement, compromising result reliability [52].
Calculating PCR Efficiency
PCR efficiency, representing the proportion of template amplified in each cycle, fundamentally impacts Cq values and consequent biological interpretations [51]. Efficiency is calculated using a dilution series of a known template amount, with the resulting Cq values plotted against the logarithm of the dilution factor.
Table 2: Protocol for PCR Efficiency Calculation Using Serial Dilutions
| Step | Procedure | Technical Replicates | Output |
|---|---|---|---|
| 1. Sample Preparation | Prepare serial dilutions (e.g., 1:10, 1:100, 1:1000, 1:10000) of template [51]. | N/A | Dilution series |
| 2. qPCR Run | Amplify all dilution samples using the same qPCR conditions. | Minimum of 3 replicates per dilution | Cq values for each replicate |
| 3. Data Analysis | Calculate average Cq for each dilution; plot against log10(dilution factor) [51]. | N/A | Standard curve with slope and R² |
| 4. Efficiency Calculation | Apply formula: Efficiency (%) = (10^(-1/slope) - 1) × 100 [51]. | N/A | PCR efficiency percentage |
The resulting standard curve slope is used to calculate efficiency with the formula: Efficiency (%) = (10^(-1/slope) - 1) × 100 [51]. Acceptable efficiency typically falls between 85-110%, with efficiencies outside this range indicating potential issues with template quality, reaction inhibitors, or assay optimization [51].
Quantitative Analysis Strategies
Absolute vs. Relative Quantification
qPCR data analysis follows two primary quantification paradigms, each with distinct applications and requirements.
Absolute Quantification determines the exact template copy number in a sample by comparing Cq values to a standard curve of known concentrations [51]. This method is essential for applications requiring exact copy numbers, such as viral load quantification or gene copy number determination [51]. The standard curve must use reference materials with amplification efficiency matching the unknown samples to avoid quantification errors.
Relative Quantification compares target gene expression between different experimental conditions (e.g., treated vs. control) relative to a stably expressed reference gene [51] [52]. This approach, more common in gene expression studies, calculates expression fold changes without determining absolute copy numbers.
Methods for Relative Quantification
Two principal methods exist for relative quantification, each with specific efficiency assumptions:
1. Livak Method (ΔΔCq Model) This method assumes nearly perfect and equal amplification efficiencies for both target and reference genes (90-100%) [51]. The fold change is calculated as: Fold Change = 2^(-ΔΔCq) where ΔΔCq = (Cttargettreatment - Ctreferencetreatment) - (Cttargetcontrol - Ctreferencecontrol) [51]
2. Pfaffl Method (Efficiency-Adjusted Model) When amplification efficiencies differ between target and reference genes or deviate from 100%, the Pfaffl method incorporates actual efficiency values [52]: Fold Change = (Etarget)^(ΔCttarget) / (Ereference)^(ΔCtreference) where E represents the amplification efficiency (e.g., 1.95 for 95% efficiency) and ΔCt represents the difference in Cq values between control and treatment samples [52].
Table 3: Comparison of Relative Quantification Methods
| Parameter | Livak (ΔΔCq) Method | Pfaffl (Efficiency-Adjusted) Method |
|---|---|---|
| Efficiency Assumption | Assumes equal efficiencies between 90-100% for target and reference genes [51]. | Accommodates different efficiencies for target and reference genes [52]. |
| Calculation Formula | 2^(-ΔΔCq) | (Etarget)^ΔCttarget / (Ereference)^ΔCtreference |
| When to Use | Ideal when validated assays demonstrate near-perfect and matched efficiencies. | Necessary when efficiency differs from 100% or between target/reference genes. |
| Data Requirements | Cq values for target and reference genes in all samples. | Cq values plus experimentally determined efficiency values for each assay. |
Implementing MIQE Compliance in Data Analysis
Adherence to MIQE guidelines ensures experimental rigor and data reliability by mandating comprehensive reporting of all critical experimental parameters [4]. For data analysis specifically, MIQE compliance requires:
Essential MIQE Checklist for Data Analysis
Assay Validation Documentation
- PCR efficiency values with confidence intervals for all assays
- Linear dynamic range of the assay
- Proof of specificity (e.g., melt curve analysis, gel electrophoresis)
- Slope and correlation coefficient (R²) of standard curves
Experimental Detail Reporting
- Cq determination method (threshold setting protocol)
- Baseline correction procedures
- Number and consistency of technical and biological replicates
- Outlier identification and treatment procedures
Data Transparency
- Raw Cq values for all replicates
- Normalization strategy justification
- Reference gene validation evidence
- Statistical methods for significance testing
For publications, providing the unique assay identifier (e.g., TaqMan Assay ID) is typically sufficient, though some journals may require full amplicon context sequences for complete MIQE compliance [6].
The Scientist's Toolkit: Essential Research Reagents and Materials
Table 4: Essential Reagents and Materials for MIQE-Compliant qPCR
| Reagent/Material | Function | MIQE Compliance Consideration |
|---|---|---|
| Validated Assays | Specific primer/probe sets for target amplification. | Provide assay IDs and context sequences; ensure specificity documentation [6]. |
| High-Quality Polymerase | Enzyme for DNA amplification with consistent performance. | Report manufacturer, lot number, and concentration; impacts efficiency [6]. |
| Standard Curve Materials | Known concentration standards for efficiency calculation. | Use appropriate matrix-matched standards; document source and preparation [51]. |
| Reference Genes | Stably expressed genes for normalization in relative quantification. | Validate stability across experimental conditions; use multiple genes when possible [51]. |
| Quality RNA/DNA | Template nucleic acids of documented purity and integrity. | Report quality metrics (RIN, A260/A280); crucial for reproducible efficiency [4]. |
| Passive Reference Dye | Internal fluorescence normalization (e.g., ROX). | Normalizes for well-to-well variation; required for normalized reporter (Rn) calculation [51]. |
Moving beyond simple Cq values represents an essential evolution in qPCR data analysis, transforming this ubiquitous technique from a qualitative tool to a robust quantitative method. By implementing proper baseline and threshold setting, calculating and accounting for PCR efficiency, selecting appropriate quantification models, and adhering to MIQE guidelines, researchers can generate biologically meaningful, reproducible data that withstands scientific scrutiny. This comprehensive approach to qPCR data analysis ensures that conclusions reflect true biological differences rather than analytical artifacts, advancing scientific discovery and drug development with greater confidence and reliability.
Validation and Comparative Analysis: MIQE in qPCR vs. dPCR and Regulated Environments
The Minimum Information for Publication of Quantitative Real-Time PCR Experiments (MIQE) guidelines establish a standardized framework for ensuring the reproducibility, reliability, and credibility of qPCR experiments [6]. Originally published in 2009 and recently updated as MIQE 2.0, these guidelines provide researchers with detailed recommendations for experimental design, assay validation, and data reporting [8] [5]. The MIQE guidelines were developed by an international consortium of multidisciplinary experts to address widespread methodological inconsistencies and transparency issues in qPCR-based research [8]. Compliance with MIQE is crucial because qPCR is not merely a niche technique but arguably the most commonly employed molecular tool in life science and clinical laboratories, underpinning decisions in biomedical research, diagnostics, pharmacology, agriculture, and public health [8].
The core philosophy of MIQE centers on the principle that without methodological rigor, qPCR data cannot be trusted [8]. This is particularly relevant for the validation parameters of amplification efficiency, linear dynamic range, and limits of detection and quantification (LOD/LOQ), which form the foundation for any reliable qPCR assay. The revised MIQE 2.0 guidelines reflect recent advances in qPCR technology and provide clarified, streamlined recommendations for sample handling, assay design, validation, and data analysis [5]. These guidelines emphasize that transparent, clear, and comprehensive reporting of all experimental details is necessary to ensure both the repeatability and reproducibility of qPCR results [5].
Amplification Efficiency
Definition and Importance
Amplification efficiency (PCR efficiency) is a critical parameter in qPCR that measures the rate at which a target sequence is amplified during the exponential phase of the reaction [10]. Ideal amplification efficiency is 100%, meaning the target quantity doubles with each PCR cycle, corresponding to a reaction with a slope of -3.32 in a standard curve [10]. In practice, MIQE guidelines recommend that primer pair efficiency must fall between 90% and 110% for reliable quantification [10]. Proper efficiency validation is essential because assumptions about efficiency rather than empirical measurement represent a fundamental methodological failure that compromises data integrity [8].
Efficiency deviations from the ideal 100% indicate potential issues with reaction components or conditions. Reduced efficiency may result from primer-dimer formation, inhibitors in the sample, suboptimal reagent concentrations, or poor primer design [10]. Conversely, efficiency values exceeding 110% often indicate assay artifacts such as primer-dimer formation or nonspecific amplification. These issues are particularly problematic in diagnostic settings where qPCR is used to infer pathogen load, expression status, or treatment response, as unreliable efficiency measurements can lead to incorrect clinical interpretations [8].
Experimental Protocol for Efficiency Determination
The standard method for determining amplification efficiency involves generating a dilution series of the target nucleic acid:
- Preparation of Standard Curve: Create a minimum of five 10-fold serial dilutions of the target template, ideally spanning the entire expected concentration range in experimental samples [10]. Each dilution should be run in triplicate to assess technical variability.
- Template Source: Use a commercial standard or a sample with known concentration. The template should be identical to the experimental target in terms of sequence and background matrix to accurately reflect assay performance [10].
- Data Analysis: Plot the mean quantification cycle (Cq) value for each dilution against the logarithm of the initial template concentration. The slope of the resulting standard curve is used to calculate PCR efficiency according to the formula: Efficiency = [10(-1/slope) - 1] × 100% [10].
- Acceptance Criteria: The standard curve should demonstrate a linear dynamic range of 6-8 orders of magnitude with a correlation coefficient (R²) of ≥0.980 [10]. The efficiency should fall within the 90-110% range with narrow confidence intervals.
Table 1: Acceptance Criteria for Amplification Efficiency Validation
| Parameter | Requirement | Calculation Method | Importance |
|---|---|---|---|
| Efficiency Range | 90-110% | Efficiency = [10(-1/slope) - 1] × 100% | Ensures accurate quantification |
| Standard Curve R² | ≥0.980 | Linear regression of Cq vs. log concentration | Verifies linear relationship |
| Slope | -3.1 to -3.6 | From standard curve plot | Corresponds to 90-110% efficiency |
| Confidence Intervals | Reported for efficiency | Statistical analysis of replicate data | Indicates measurement precision |
Figure 1: Workflow for qPCR amplification efficiency validation. This process requires running a standard curve with serial dilutions and calculating efficiency from the slope.
Linear Dynamic Range
Definition and Significance
The linear dynamic range of a qPCR assay defines the range of template concentrations over which the fluorescent signal is directly proportional to the initial amount of target nucleic acid [10]. This parameter determines the span of concentrations that can be accurately quantified without additional sample dilution or concentration. The linear dynamic range should typically span 6-8 orders of magnitude for a well-optimized qPCR assay, with the lower end bounded by the limit of quantification and the upper end by the point where reaction components become limiting [10].
Establishing the linear dynamic range is crucial for both research and diagnostic applications. In gene expression studies, failure to validate this range can lead to overinterpretation of small fold-changes, particularly at low expression levels where technical variance may exceed biologically meaningful differences [8] [53]. The MIQE guidelines emphasize that establishing and reporting confidence intervals throughout the dynamic range is essential for transparency and for distinguishing reliable quantification from technical noise [53].
Experimental Protocol for Dynamic Range Determination
The linear dynamic range is determined concurrently with amplification efficiency using the same serial dilution series:
- Dilution Series Preparation: Prepare a minimum of five 10-fold serial dilutions of the target template in the same matrix as experimental samples [10]. Some applications may require 7-8 dilutions to fully characterize the range.
- qPCR Run: Amplify all dilutions in triplicate using identical thermal cycling conditions and reagent batches.
- Data Analysis: Plot the mean Cq values against the logarithm of the initial template concentration. Perform linear regression analysis to determine the correlation coefficient (R²) and assess linearity.
- Range Determination: The linear dynamic range is defined by the concentrations where the R² value remains ≥0.980 and the amplification efficiency stays between 90-110% [10].
- Verification: Include samples with known concentrations at both the upper and lower limits of the reported dynamic range in subsequent experiments to verify maintained performance.
Table 2: Requirements for Linear Dynamic Range Validation
| Parameter | Standard Requirement | Enhanced Requirement | Purpose |
|---|---|---|---|
| Dilution Series | Five 10-fold dilutions | Seven 10-fold dilutions | Characterize full range |
| Linearity (R²) | ≥0.980 | ≥0.990 | Verify proportional response |
| Dynamic Range | 4-5 log units | 6-8 log units | Enable broad quantification |
| Replicates | Triplicate per dilution | Quintuplicate per dilution | Assess technical variability |
| Matrix Effects | Test in buffer | Test in biological matrix | Verify performance in sample |
Limit of Detection (LOD) and Limit of Quantification (LOQ)
Definitions and Clinical Relevance
The Limit of Detection (LOD) represents the lowest concentration of target nucleic acid that can be reliably detected but not necessarily quantified, while the Limit of Quantification (LOQ) defines the lowest concentration that can be accurately measured with stated precision and accuracy [10]. These parameters are particularly critical in diagnostic applications where distinguishing true low-level signals from background noise directly impacts clinical decision-making [8].
The MIQE 2.0 guidelines emphasize the importance of establishing and reporting detection limits and dynamic ranges for each target, based on the chosen quantification method [5]. This is especially relevant for low-copy targets where technical variability, stochastic amplification, and efficiency fluctuations confound quantification [53]. Recent studies demonstrate that variability increases markedly at low input concentrations, often exceeding the magnitude of biologically meaningful differences, making proper LOD/LOQ determination essential for data interpretation [53].
Experimental Protocol for LOD and LOQ Determination
Determining LOD and LOQ requires a systematic approach with sufficient replication at low template concentrations:
- Dilution Series Preparation: Prepare a minimum of twelve replicate reactions at each of 3-5 low concentrations near the expected detection limit, using the same matrix as experimental samples [10].
- qPCR Analysis: Run all replicates in the same assay to minimize inter-assay variability.
- LOD Determination: The LOD is typically defined as the lowest concentration where ≥95% of replicates produce a detectable amplification signal (Cq value).
- LOQ Determination: The LOQ is determined as the lowest concentration where results demonstrate acceptable precision (CV ≤35%) and accuracy (measured concentration within 20-25% of expected value) [10].
- Statistical Analysis: Apply appropriate statistical models (e.g., probit analysis for LOD) to compute confidence intervals for both parameters.
Figure 2: Methodology for determining Limit of Detection (LOD) and Limit of Quantification (LOQ). Multiple replicates at low concentrations are essential for statistical reliability.
The Scientist's Toolkit: Essential Reagents and Materials
Successful qPCR validation requires specific high-quality reagents and materials. The following table outlines essential components and their functions in the validation process:
Table 3: Essential Research Reagent Solutions for qPCR Validation
| Reagent/Material | Function in Validation | Quality Requirements |
|---|---|---|
| Nucleic Acid Standards | Template for standard curves; defines dynamic range | Certified concentration; identical to target sequence |
| qPCR Master Mix | Provides enzymes, dNTPs, buffer for amplification | MIQE-compliant; minimal batch-to-batch variation |
| Sequence-Specific Primers | Target amplification; determine efficiency & specificity | HPLC-purified; verified sequence; minimal dimers |
| Hydrolysis Probes | Specific detection; multiplexing capability | Dual-labeled; quenched; compatible with system |
| Nuclease-Free Water | Reaction preparation; dilution series | Certified nuclease-free; minimal background DNA |
| qPCR Plates/Tubes | Reaction vessel; optical properties critical | Certified for qPCR; minimal well-to-well variation |
| Inhibition Controls | Detect PCR inhibitors in sample matrices | Non-competitive internal controls |
Advanced Considerations and Methodological Pitfalls
Statistical Approaches and Data Analysis
The MIQE 2.0 guidelines emphasize that Cq values should be converted into efficiency-corrected target quantities and reported with prediction intervals [5]. While the 2−ΔΔCT method remains widely used, recent evidence suggests that Analysis of Covariance (ANCOVA) enhances statistical power and is not affected by variability in qPCR amplification efficiency [54]. ANCOVA represents a flexible multivariable linear modeling approach that generally offers greater statistical power and robustness compared to 2−ΔΔCT [54].
Instrument manufacturers are encouraged to enable the export of raw data to facilitate thorough analyses and re-evaluation by manuscript reviewers and interested researchers [5]. Sharing qPCR analysis code and data improves reproducibility, and researchers are encouraged to provide fully documented analysis scripts that start from raw input and produce final figures and statistical tests [54]. General-purpose data repositories (e.g., figshare) and code repositories (e.g., GitHub) facilitate adherence to FAIR (Findable, Accessible, Interoperable, Reproducible) principles and promote transparency in qPCR research [54].
Common Validation Pitfalls and Solutions
Despite widespread awareness of MIQE guidelines, compliance remains patchy, and methodological failures persist in the literature [8]. Common pitfalls include:
- Assumed Efficiencies: Assuming rather than empirically measuring PCR efficiencies remains prevalent [8]. This practice is unacceptable as efficiency directly impacts quantification accuracy.
- Inadequate Dynamic Range: Employing a dynamic range that doesn't encompass expected sample concentrations leads to either undetected low-abundance targets or saturation effects at high concentrations.
- Poor LOD/LOQ Characterization: Failing to properly establish and report LOD/LOQ parameters, particularly for low-copy targets where stochastic effects dominate [53].
- Inappropriate Normalization: Using reference genes that are neither stable nor validated represents a fundamental methodological failure that compromises all subsequent data interpretation [8].
The MIQE guidelines provide an essential framework for ensuring the validity, reproducibility, and reliability of qPCR data through rigorous validation of efficiency, dynamic range, and detection limits. The recent MIQE 2.0 update reflects technological advances while reinforcing core principles of methodological rigor [5]. As qPCR continues to be a cornerstone technique across diverse fields including clinical diagnostics, biomedical research, and drug development, adherence to these validation standards becomes increasingly critical [8]. The credibility of molecular diagnostics and the integrity of the research that supports it depends on the collective will to ensure that qPCR results are not just published, but are also robust, reproducible, and reliable [8].
The development of cell and gene therapies (CGTs) relies heavily on polymerase chain reaction (PCR) assays to answer critical bioanalytical questions regarding the safety and efficacy of these novel therapeutic modalities. Specifically, quantitative PCR (qPCR) and digital PCR (dPCR) are indispensable for assessing biodistribution, shedding, and persistence or cellular kinetics. The "context of use" (COU)—the specific purpose and application of an assay—is a foundational concept that dictates the stringency and design of method validation. In the absence of formal regulatory guidance for these molecular assays, the scientific community depends on best practices outlined in the MIQE (Minimum Information for Publication of Quantitative Real-Time PCR Experiments) guidelines and subsequent industry white papers to ensure the generation of reliable, reproducible, and defensible data for regulatory submissions. This guide provides a tailored framework for the validation of qPCR and dPCR assays supporting CGT development, framed within the broader principles of MIQE.
Core Validation Parameters for Biodistribution, Shedding, and Persistence Assays
Method validation confirms that an assay is suitable for its intended purpose. The following parameters, with acceptance criteria calibrated for biodistribution, shedding, and persistence studies, should be addressed. These parameters align with the spirit of MIQE guidelines, which emphasize comprehensive reporting and technical rigor.
Table 1: Key Validation Parameters and Acceptance Criteria for PCR Assays in Cell and Gene Therapy
| Validation Parameter | Description | Typical Acceptance Criteria | Context-Specific Considerations |
|---|---|---|---|
| Accuracy and Precision | Measures closeness to true value (accuracy) and reproducibility (precision). | Intra-/inter-run precision: ±25-30% RSD; Accuracy: 70-130% [55]. | Criteria may be tightened for critical low-abundance targets in persistence studies [55]. |
| Lower Limit of Quantification (LLOQ) | The lowest concentration quantified with acceptable accuracy and precision. | LLOQ of 12 copies/reaction for dPCR and 48 copies/reaction for qPCR has been successfully applied [56]. | LLOQ must be demonstrated in the presence of the biological matrix (e.g., tissue gDNA) to confirm sensitivity in a realistic background [55]. |
| Specificity | Ability to measure the analyte unequivocally in the presence of other components. | No amplification in naïve matrices or with non-targeting primers/probes [55]. | Critically assessed against host genomic DNA to ensure the assay does not amplify endogenous sequences [55]. |
| Matrix Effects | Assessment of how the biological sample affects the assay's ability to quantify the analyte. | Quantitative results should be comparable across different relevant matrices [55]. | Essential for biodistribution studies, where the assay must perform in a wide range of tissues and biofluids [56] [55]. |
| Cross-Validation between qPCR and dPCR | Direct comparison of quantitative results from both platforms. | Quantitative results should show a high degree of correlation (e.g., R² > 0.95) [56]. | dPCR may be favored for its absolute quantification and superior tolerance for matrix effects, while qPCR offers a wider dynamic range [56] [55]. |
Detailed Experimental Protocol for Method Validation
The following protocol provides a generalizable methodology for validating a qPCR or dPCR assay for biodistribution studies, based on cross-industry recommendations [55].
1. Assay Design and Primer/Probe Selection
- Target Selection: Design primers and probes to uniquely identify the therapeutic construct. For gene therapies, target the junction between the transgene and a vector-specific sequence (e.g., a promoter or untranslated region) to distinguish it from any endogenous gene [55].
- In Silico Design: Use specialized software (e.g., PrimerQuest, Primer3) to design at least three candidate primer/probe sets. Customize parameters to match expected reaction conditions (cation concentration, etc.). Use tools like NCBI's Primer BLAST for an initial specificity check against the host genome [55].
- Empirical Screening: Test all candidate sets using gDNA or total RNA extracted from naïve host tissues (e.g., mouse, human) to empirically confirm specificity and select the best-performing set. The same primer/probe set can typically be used for both qPCR and dPCR, though platform-specific mastermix compatibility must be verified [55].
2. Sample Preparation and DNA Extraction
- Tissue Homogenization: Homogenize target and non-target tissues (e.g., liver, spleen, gonads) from dosed animals in a suitable buffer.
- DNA Extraction: Extract genomic DNA from homogenates using a validated method (e.g., column-based or magnetic bead kits). The extraction method must be efficient and reproducible, as it directly impacts the accuracy of the vector genome copy number measurement [56].
- Quality and Quantity Assessment: Measure the concentration and purity of the extracted gDNA using spectrophotometry (e.g., Nanodrop) or fluorometry (e.g., Qubit). Confirm DNA integrity by gel electrophoresis or other relevant methods.
3. Method Validation Experiments
- Standard Curve (for qPCR): Prepare a serial dilution of a known standard (e.g., plasmid DNA containing the target sequence) in a solution of naïve gDNA that matches the sample matrix. The curve should span the expected dynamic range, including the LLOQ. Acceptable qPCR efficiency is typically 90–110%, with a correlation coefficient (R²) ≥ 0.98 [55].
- LLOQ Determination: Analyze multiple replicates (e.g., n=5) of the LLOQ candidate concentration. The concentration is acceptable if both precision (RSD ≤ 25-30%) and accuracy (70-130%) meet pre-defined criteria [56] [55].
- Accuracy and Precision: Assess using Quality Control (QC) samples at low, mid, and high concentrations prepared in the relevant matrix. Analyze multiple replicates (n≥3) in at least three independent runs. Calculate intra-run (repeatability) and inter-run (intermediate precision) precision as RSD, and accuracy as percent deviation from the theoretical value [55].
- Specificity: Test gDNA from a panel of naïve tissues and biofluids to ensure no non-specific amplification.
- Cross-Validation: Select a subset of study samples and analyze them using both the validated qPCR and dPCR methods. Perform linear regression analysis to demonstrate correlation [56].
Experimental Workflow and Signaling Pathways
The following diagram illustrates the logical workflow for developing, validating, and applying a PCR assay to support a biodistribution study for a gene therapy product.
The Scientist's Toolkit: Essential Research Reagent Solutions
A successful PCR assay relies on high-quality, well-characterized critical reagents. The following table details key materials and their functions in the context of biodistribution and persistence assays.
Table 2: Key Research Reagent Solutions for PCR Assay Development
| Reagent / Material | Function / Description | Criticality in Validation |
|---|---|---|
| Primers and Hydrolysis Probe (e.g., TaqMan) | Primers flank the target sequence for amplification; the probe, with a fluorescent reporter/quencher, provides specific detection. | The sequence defines assay specificity. Must be validated to ensure no off-target amplification in host gDNA. Batch-to-batch consistency is crucial [55]. |
| Synthetic Standard (Plasmid DNA, gBlock) | A well-characterized material containing the target sequence used to generate the standard curve for qPCR and determine copy number. | Serves as the primary reference for quantification. Must be sequenced confirmed and quantified with high accuracy. Its integrity directly impacts assay accuracy [55]. |
| Matrix-Matched Naïve gDNA | Genomic DNA extracted from untreated (naïve) tissues of the study species. Used as a diluent for standards and for specificity testing. | Critical for mimicking the sample matrix and identifying matrix effects. Confirms that the quantification of the standard is accurate in the presence of background gDNA [55]. |
| Platform-Specific Mastermix | A optimized buffered solution containing DNA polymerase, dNTPs, and salts. Specific mastermixes are required for qPCR and dPCR. | Formulation affects PCR efficiency and fluorescence signal. The mastermix must be compatible with the chosen platform and probe chemistry. Lot consistency should be monitored [55]. |
| Positive Control Template | A control sample with a known, medium concentration of the target, run in every assay to monitor inter-run performance. | Essential for demonstrating the ongoing precision and reliability of the assay during the analysis of unknown study samples [55]. |
The validation of qPCR and dPCR assays for biodistribution, shedding, and persistence is not a one-size-fits-all process. It is a rigorous, COU-driven exercise that ensures data quality and integrity from the bench to the regulatory filing. By adhering to the structured parameters, experimental protocols, and reagent management practices outlined in this guide—which are built upon the foundation of MIQE principles and recent industry consensus—researchers can develop robust, fit-for-purpose analytical methods. This tailored approach is paramount for accurately characterizing the complex pharmacokinetics and safety profiles of cutting-edge cell and gene therapies, thereby accelerating their path to patients.
Quantitative PCR (qPCR) and digital PCR (dPCR) represent two powerful evolutional stages in nucleic acid amplification technologies, enabling precise quantification of genetic targets across diverse applications in research, clinical diagnostics, and drug development. While both methods build upon the fundamental principles of polymerase chain reaction, they differ significantly in their quantification methodologies, performance characteristics, and technical requirements. qPCR, also known as real-time PCR, monitors amplification progress during early exponential phases using fluorescence detection, relying on standard curves for relative or absolute quantification [5]. In contrast, dPCR employs a limiting dilution approach, partitioning samples into thousands of individual reactions and applying Poisson statistics to provide absolute nucleic acid quantification without requiring standard curves [57] [58].
The Minimum Information for Publication of Quantitative PCR Experiments (MIQE) guidelines were established to address the critical need for standardization, transparency, and reproducibility in qPCR experiments [5] [9]. First published in 2009 and recently updated to MIQE 2.0 in 2025, these guidelines provide a comprehensive framework for experimental design, execution, and reporting [5]. The expansion of dPCR technology prompted the development of complementary dMIQE guidelines in 2013, with a significant update in 2020, offering platform-specific recommendations for digital PCR experiments [57] [58]. These guidelines have become essential tools for ensuring methodological rigor, with MIQE being one of the most widely cited methodological publications in molecular biology, accumulating over 17,000 citations to date [9].
Adherence to MIQE and dMIQE guidelines is particularly crucial given the pervasive role of PCR technologies in biomedical decision-making. Despite widespread awareness of these guidelines, compliance remains inconsistent, leading to serious deficiencies in experimental transparency, assay validation, and data reporting that undermine the reliability of published results [9]. This technical guide provides a comprehensive comparison of qPCR and dPCR technologies while delineating the specific MIQE requirements for each platform, offering researchers a practical framework for implementing these standards in their experimental workflows.
Fundamental Principles and Comparative Performance Metrics
Core Technological Differences
The fundamental distinction between qPCR and dPCR lies in their approach to quantification. qPCR relies on monitoring the accumulation of fluorescent signals during the amplification process, with the quantification cycle (Cq) representing the point at which fluorescence exceeds a background threshold [5]. This Cq value correlates with the initial target concentration but requires comparison to standard curves or reference genes for absolute or relative quantification, respectively. The technique demands careful validation of amplification efficiency, typically ranging between 90-110%, as deviations significantly impact quantification accuracy [5] [9].
dPCR revolutionizes this paradigm by dividing the reaction mixture into numerous partitions, effectively creating endpoint PCR reactions where each partition contains either zero or one or more target molecules [57] [58]. Following amplification, partitions are scored as positive or negative based on fluorescence intensity, and the absolute initial target concentration is calculated using Poisson statistics to account for the random distribution of molecules across partitions [57]. This approach eliminates the need for standard curves and reduces dependence on amplification efficiency, provided that partitions with target molecules successfully amplify [58].
Performance Characteristics and Applications
The different quantification approaches confer distinct performance advantages to each technology. qPCR offers a wide dynamic range (typically 5-6 logs), relatively high throughput, and well-established multiplexing capabilities [5] [6]. It remains the preferred method for gene expression analysis, pathogen detection with moderate sensitivity requirements, and applications requiring high sample throughput.
dPCR excels in scenarios demanding exceptional precision, sensitivity, and absolute quantification. Key performance advantages include superior precision for detecting small-fold differences (as low as 1.2-fold), enhanced sensitivity for rare variant detection, and exceptional tolerance to PCR inhibitors [57] [58]. These characteristics make dPCR particularly valuable for liquid biopsy applications, copy number variation analysis, rare mutation detection, and quality control of reference materials where maximal accuracy is required [57].
Table 1: Performance Comparison Between qPCR and dPCR
| Parameter | qPCR | dPCR |
|---|---|---|
| Quantification Method | Relative to standard curve or reference genes | Absolute using Poisson statistics |
| Dynamic Range | 5-6 logs | 4-5 logs |
| Precision | Moderate | High (especially for small fold-changes) |
| Sensitivity | Moderate (detects down to ~10 copies) | High (detects single molecules) |
| Impact of PCR Efficiency | Critical (requires 90-110%) | Less critical (if target amplifies) |
| Tolerance to Inhibitors | Moderate | High |
| Multiplexing Capability | Well-established | Developing |
| Throughput | High | Moderate |
| Absolute Quantification | Requires standard curve | Yes, without standard curve |
| Key Applications | Gene expression, pathogen detection with moderate sensitivity requirements | Rare variant detection, copy number variation, liquid biopsy, reference material QC |
Statistical Foundations of dPCR
The statistical principle governing dPCR quantification centers on the Poisson distribution, which models the random and independent distribution of target molecules among partitions [57]. This model assumes that each molecule has an equal probability of occupying any partition, and that partitions function independently. The fundamental equation, P(0) = e^(-λ), where P(0) is the proportion of negative partitions and λ is the average number of target molecules per partition, enables calculation of the absolute target concentration in the original sample [57].
The accuracy of Poisson-based quantification depends heavily on partition number and volume consistency. A minimum of 10,000 partitions is recommended to minimize statistical uncertainty, with performance improvements becoming more gradual beyond this threshold [57]. Similarly, consistent partition volumes are essential for maintaining the validity of Poisson assumptions, as volume variations introduce biases in target molecule distribution and quantification [57]. These statistical requirements represent critical dMIQE checklist items that must be reported to ensure experimental validity.
MIQE and dMIQE Guidelines: Essential Requirements
MIQE 2.0: Updated Guidelines for qPCR
The recently published MIQE 2.0 guidelines reflect substantial evolution from the original 2009 recommendations, addressing technological advances and emerging applications while simplifying reporting requirements [5]. A central emphasis involves complete transparency throughout the experimental workflow, with requirements for comprehensive documentation of sample handling, nucleic acid quality assessment, assay validation, and data analysis procedures [5] [9].
Key updates in MIQE 2.0 include streamlined reporting requirements designed to encourage compliance without unduly burdening researchers, enhanced guidance on sample handling and quality assessment, refined recommendations for assay design and validation, and clarified data analysis procedures with emphasis on proper statistical treatment [5]. Particularly important is the requirement that Cq values be converted to efficiency-corrected target quantities reported with prediction intervals, along with detection limits and dynamic ranges for each target [5]. Instrument manufacturers are specifically encouraged to enable raw data export to facilitate independent re-analysis—a critical step toward enhancing reproducibility [5].
dMIQE: Digital PCR-Specific Requirements
The dMIQE guidelines establish additional checklist items specific to dPCR technology, addressing partition-based quantification, statistical considerations, and instrument-specific parameters [57] [58]. These requirements acknowledge the distinct methodological framework of dPCR while maintaining alignment with core MIQE principles of transparency and reproducibility.
Essential dMIQE requirements include documentation of partition characteristics (number, volume, volume consistency), data analysis parameters (threshold setting method, rain handling), and statistical reporting (mean copies per partition, confidence intervals) [57] [59]. The guidelines emphasize clear discrimination between positive and negative partitions, as ambiguous classification increases "rain" and compromises quantification accuracy [57]. Proper threshold setting and validation of partition uniformity represent critical validation steps that must be documented for publication [57].
Table 2: Core MIQE and dMIQE Reporting Requirements
| Category | MIQE (qPCR) Requirements | dMIQE (dPCR) Requirements |
|---|---|---|
| Sample & Nucleic Acids | Extraction method, quantification, quality/integrity assessment | Same as MIQE plus dilution method (gravimetric/volumetric) |
| Assay Design | Primer/probe sequences or assay ID with amplicon context sequence, location, validation data | Same as MIQE |
| Instrument & Protocol | Instrument manufacturer/model, reaction volume, thermocycling parameters | Partition number, volume, volume variance/SD |
| Data Analysis | Cq determination method, efficiency calculation, normalization method, statistical methods | Threshold setting method, rain handling, mean copies/partition, Poisson confidence intervals |
| Validation | Specificity, linear dynamic range, limit of detection, amplification efficiency | Specificity, limit of detection, partition volume uniformity |
| Data Transparency | Raw data availability, complete amplification plots | Raw data availability, scatter plots, threshold justification |
Experimental Design and Workflow Considerations
Sample Preparation and Quality Assessment
Robust sample preparation and quality assessment represent foundational requirements across both qPCR and dPCR platforms, with inadequate attention to these preliminary steps representing a frequent source of experimental failure [9]. MIQE and dMIQE guidelines mandate comprehensive documentation of sample collection, storage conditions, nucleic acid extraction methodology, and quality assessment metrics [5] [59]. For RNA targets, assessment of RNA integrity and purity is particularly critical, as degradation significantly impacts quantification accuracy, especially for longer transcripts [9].
While both technologies are susceptible to poor sample quality, dPCR typically demonstrates greater tolerance to moderate levels of PCR inhibitors due to its endpoint detection nature and the statistical advantage of partition-based reactions [58]. Nevertheless, both platforms require implementation of appropriate inhibition controls and assessment of extraction efficiency, particularly when working with challenging sample matrices or low target concentrations [5] [58].
Assay Design and Validation
Proper assay design and validation constitute another critical component of the MIQE framework, with requirements for in silico specificity analysis, empirical validation of amplification efficiency, and determination of linear dynamic range [5] [6]. For both qPCR and dPCR, primer and probe sequences must be disclosed, either directly or through provision of amplicon context sequences with commercially available assays [6]. The MIQE 2.0 guidelines specifically note that publication of a unique identifier such as the TaqMan Assay ID is typically sufficient, though the probe or amplicon context sequence must also be available upon request [6].
Assay validation requirements differ between platforms, reflecting their distinct quantification approaches. qPCR assays require construction of standard curves spanning the experimental dynamic range, with demonstration of consistent amplification efficiency (90-110%) and correlation coefficients >0.98 [5] [9]. dPCR assays necessitate validation of partition uniformity, clear separation between positive and negative populations, and justification of partition number based on desired precision and dynamic range [57] [58].
Data Analysis and Normalization Strategies
Data analysis approaches diverge significantly between qPCR and dPCR, reflecting their fundamental technological differences. qPCR data analysis centers on Cq value determination, efficiency correction, and appropriate normalization [5]. The updated MIQE 2.0 guidelines specifically recommend that Cq values be converted to efficiency-corrected target quantities and reported with prediction intervals to convey measurement uncertainty [5]. Normalization remains particularly challenging in qPCR, with requirements for validation of reference gene stability across experimental conditions [9]. Failure to implement proper normalization represents one of the most common methodological flaws in qPCR studies, potentially leading to biologically implausible claims of 1.2- to 1.5-fold changes without statistical justification [9].
dPCR data analysis employs binary classification of partitions followed by Poisson correction to account for multiple target molecules per partition [57]. The requirement for clear separation between positive and negative populations is paramount, with ambiguous "rain" populations potentially introducing quantification errors [57]. Normalization in dPCR typically involves accounting for input volume and partition count rather than reference genes, though appropriate controls remain essential for accounting of technical variability [57] [58]. Both technologies require transparent reporting of data analysis software, version information, and any custom algorithms or settings employed [5] [59].
The Scientist's Toolkit: Essential Reagents and Materials
Successful implementation of qPCR or dPCR experiments requires careful selection of reagents and materials that meet MIQE standards for quality and performance. The following table outlines essential components for both platforms, with special attention to items requiring explicit documentation according to MIQE/dMIQE guidelines.
Table 3: Essential Research Reagent Solutions for qPCR and dPCR
| Component | Function | MIQE Reporting Requirements |
|---|---|---|
| Nucleic Acid Extraction Kits | Isolation of high-quality DNA/RNA from samples | Manufacturer, catalog number, version; extraction method details [5] [59] |
| Quality Assessment Tools (e.g., Bioanalyzer, spectrophotometer) | Assessment of nucleic acid quantity, purity, and integrity | Instrument/method used, quality metrics (RIN, A260/A280, etc.) [5] [9] |
| PCR Master Mixes | Provides enzymes, buffers, nucleotides for amplification | Manufacturer, catalog number, version; concentration of key components [5] [59] |
| Sequence-Specific Assays (primers, probes) | Target-specific amplification and detection | Sequences or assay ID with context sequence; modifications; manufacturer [5] [6] |
| Reference Genes (for qPCR normalization) | Normalization of technical variation | Identity, validation of stability across sample types [5] [9] |
| Quantification Standards (for qPCR standard curves) | Generation of standard curves for absolute quantification | Source, sequence verification, concentration determination method [5] |
| Partitioning Reagents/Oils (for dPCR) | Creation of microreactions in dPCR systems | Manufacturer, catalog number; partition characteristics [57] [58] |
| Inhibition Controls | Assessment of PCR inhibition in samples | Type of control, implementation method [5] [58] |
Implementation Challenges and Compliance Strategies
Common Implementation Pitfalls
Despite the clear value proposition of MIQE guidelines, widespread adoption faces significant challenges, with compliance remaining inconsistent across the scientific literature [9]. Common deficiencies include inadequate documentation of sample quality assessment, failure to validate reference gene stability in qPCR experiments, omission of amplification efficiency calculations, inappropriate normalization methods, and insufficient statistical justification for reported fold-changes [9]. These shortcomings are particularly problematic in molecular diagnostics, where unreliable quantification can directly impact clinical decision-making [9].
The perception of MIQE compliance as burdensome represents a significant barrier to implementation, though the MIQE 2.0 update specifically aims to streamline reporting requirements without compromising essential information [5]. Journal editors and reviewers frequently lack the specialized expertise to consistently enforce MIQE standards, contributing to variable quality control in published qPCR data [9]. Additionally, instrument manufacturers sometimes limit raw data accessibility, impeding independent re-analysis that MIQE guidelines specifically recommend [5].
Strategies for Successful Implementation
Achieving robust MIQE compliance requires systematic approaches to experimental planning, execution, and documentation. Researchers should integrate MIQE checklists during experimental design phases rather than as afterthoughts during manuscript preparation [5] [59]. Template laboratory protocols incorporating required MIQE documentation fields streamline data collection throughout the experimental workflow. For qPCR experiments, particular attention should focus on rigorous validation of reference genes across all experimental conditions—a frequently neglected requirement with profound implications for data interpretation [9].
dPCR implementations require special consideration of partition-level validation, including demonstration of volume uniformity and clear threshold separation between positive and negative populations [57]. The statistical underpinnings of dPCR necessitate appropriate partition numbers (typically ≥10,000) to minimize quantification uncertainty, with explicit reporting of confidence intervals around absolute copy number determinations [57]. Both technologies benefit from transparent data sharing practices, with deposition of raw data in publicly accessible repositories when possible [5].
The MIQE and dMIQE guidelines provide indispensable frameworks for ensuring methodological rigor, transparency, and reproducibility in quantitative PCR applications. While qPCR and dPCR share common foundational principles, their distinct quantification approaches necessitate platform-specific validation and reporting requirements. The recent publication of MIQE 2.0 guidelines reflects ongoing evolution in qPCR technology and applications, offering updated recommendations for sample handling, assay validation, and data analysis [5]. Similarly, the dMIQE guidelines establish comprehensive standards for partition-based digital PCR, addressing Poisson statistical requirements and partition characterization [57].
Successful implementation of these guidelines requires recognizing that they represent minimum standards rather than aspirational goals—essential information that enables critical evaluation and replication of experimental findings [5] [9]. As qPCR and dPCR continue to evolve and expand into new applications, adherence to MIQE principles will remain critical for maintaining scientific integrity, particularly in diagnostic and regulatory contexts where decisions directly impact human health [9]. The scientific community must collectively strengthen implementation through education, reviewer training, and institutional support, transforming MIQE compliance from an occasional consideration to a fundamental component of quantitative molecular research.
The evolution of Minimum Information for Publication of Quantitative Real-Time PCR Experiments (MIQE) guidelines represents a critical framework for ensuring reliability, reproducibility, and transparency in quantitative PCR (qPCR) and quantitative reverse transcription PCR (qRT-PCR) experiments within pharmaceutical development and clinical research. This white paper examines the current regulatory and industry landscape surrounding qPCR validation, tracing the progression from the original 2009 MIQE guidelines to the recently published MIQE 2.0 revisions in 2025. We analyze the growing consensus on the need for standardized validation protocols that bridge the gap between Research Use Only (RUO) applications and In Vitro Diagnostic (IVD) requirements, with particular emphasis on the emerging concept of Clinical Research (CR) assays. For researchers, scientists, and drug development professionals, this document provides detailed methodological guidance for assay validation and a forward-looking perspective on the integration of these standards into regulatory frameworks for biomarker qualification, clinical trial assays, and companion diagnostic development.
The MIQE guidelines, first published in 2009, were developed to address widespread concerns about the lack of standardization and reproducibility in qPCR experiments [4]. At their core, these guidelines establish minimum information requirements for publishing qPCR studies, targeting the reliability of results to ensure scientific integrity and promote consistency between laboratories [4]. The original MIQE paper highlighted that insufficient experimental detail in publications impeded critical evaluation of results and experimental replication, a problem particularly acute in preclinical and clinical research contexts.
The recent release of MIQE 2.0 in 2025 marks a significant evolution of these standards, reflecting substantial advances in qPCR technology and its expansion into numerous new domains [5]. These revised guidelines offer updated recommendations for sample handling, assay design, validation, and data analysis, with an emphasis on transparent and comprehensive reporting of all experimental details to ensure both repeatability and reproducibility [5]. A key advancement in MIQE 2.0 is the explicit guidance that quantification cycle (Cq) values should be converted into efficiency-corrected target quantities and reported with prediction intervals, along with detection limits and dynamic ranges for each target [5].
Parallel to the MIQE evolution, the CardioRNA COST Action consortium published complementary guidelines in 2022 specifically addressing the validation of qRT-PCR assays in clinical research [14]. These guidelines aim to fill the critical standardization gap between RUO applications and fully regulated IVD assays, proposing an intermediate Clinical Research (CR) assay validation level appropriate for biomarker development in clinical trials [14]. This progression recognizes that while thousands of noncoding RNA-based biomarker studies have been published, few have successfully translated into clinical practice, primarily due to irreproducibility and insufficient technical standardization [14].
Table 1: Evolution of qPCR Guideline Frameworks
| Guideline Framework | Publication Year | Primary Focus | Key Advances |
|---|---|---|---|
| Original MIQE [4] | 2009 | Minimum information for publication | First standardized checklist; emphasis on experimental transparency |
| CardioRNA Consensus [14] | 2022 | Clinical research validation | Bridge between RUO and IVD; fit-for-purpose validation |
| MIQE 2.0 [5] | 2025 | Technology updates & simplified reporting | Efficiency-corrected quantification; prediction intervals; updated data analysis |
Current Regulatory Landscape for qPCR Validation
The regulatory environment for qPCR-based assays exists on a spectrum from basic research to clinically approved diagnostics, with varying requirements at each stage. For drug development professionals, understanding this continuum is essential for proper assay deployment throughout the therapeutic development pipeline.
Regulatory Framework Spectrum
At the foundation lies the Research Use Only (RUO) designation, where assays are typically less controlled and standardized without regulatory compliance obligations [14]. These represent the starting point for biomarker discovery but are insufficient for clinical decision-making. At the opposite end, In Vitro Diagnostic (IVD) assays must comply with stringent regulations such as the European In Vitro Diagnostic Regulation (IVDR 2017/746) and FDA requirements [14]. These regulations mandate comprehensive analytical and clinical validation with formally established performance characteristics.
The emerging Clinical Research (CR) assay category occupies the crucial middle ground, representing laboratory-developed tests that have undergone more thorough validation than typical RUO assays but haven't achieved full IVD certification [14]. These assays are particularly relevant for clinical trials where investigational biomarkers are used for patient stratification, monitoring therapeutic response, or evaluating toxicity. The European regulatory framework, based on IVDR and the Clinical Trials Regulation 2014/536, leaves a gray area relative to laboratory assays used in clinical trials, making the CR assay concept particularly valuable for establishing appropriate validation standards in this context [14].
Fit-for-Purpose Validation Principles
A central concept in modern qPCR validation is the "fit-for-purpose" (FFP) approach, defined as "a conclusion that the level of validation associated with a medical product development tool is sufficient to support its context of use" [14]. This principle recognizes that the stringency of validation should be appropriate to the biomarker's intended application, with different requirements for exploratory research versus clinical decision-making.
The context of use (COU) framework, as outlined by FDA and EMA guidelines, provides a structured approach for defining a biomarker's utility [14]. COU elements include: (1) what aspect of the biomarker is measured and in what form, (2) the clinical purpose of the measurements, and (3) the interpretation and decision/action based on the measurements [14]. This framework enables researchers to align validation rigor with clinical application, potentially accelerating the translation of promising biomarkers into qualified tools for drug development.
Essential Validation Parameters and Experimental Protocols
Comprehensive qPCR assay validation requires systematic evaluation of multiple performance parameters using standardized experimental designs. The following section outlines critical validation components with detailed methodological guidance.
Assay Specificity and Reactivity
Inclusivity and exclusivity (cross-reactivity) represent fundamental validation parameters that ensure an assay detects all intended targets while excluding genetically similar non-targets [10].
Inclusivity Experimental Protocol:
- In silico phase: Using available genetic databases (e.g., GenBank, BLAST), perform comprehensive alignment of oligonucleotide, probe, and amplicon sequences against all known target variants [10]. Document percentage identity and any mismatches, particularly in primer-binding regions.
- Experimental phase: Test assay performance against a well-characterized panel of target strains/isolates. International standards recommend using up to 50 certified strains reflecting the genetic diversity of the target organism [10]. For each strain, determine amplification efficiency, Cq values, and any anomalies in amplification curves.
- Acceptance criteria: The assay should reliably detect all target variants with consistent efficiency (90-110%) and without significant Cq value deviations (>2 cycles between variants).
Exclusivity Experimental Protocol:
- In silico phase: Analyze oligonucleotide sequences against closely related non-target species to identify potential cross-reactive sequences [10]. Pay particular attention to conserved genomic regions.
- Experimental phase: Test the assay against a panel of closely related non-target organisms and samples with known potential interferents [10]. For clinical assays, this should include samples from patients with related conditions or co-infections.
- Acceptance criteria: No amplification should occur with non-target templates, or Cq values should be significantly delayed (>10 cycles compared to positive targets) with no efficiency-corrected false positives.
Dynamic Range and Linearity
The linear dynamic range defines the template concentration range over which the fluorescent signal is directly proportional to DNA template concentration [10].
Experimental Protocol:
- Prepare a seven 10-fold dilution series of DNA standard with known concentration in triplicate [10]. The standard should be characterized (e.g., spectrophotometrically quantified) and representative of the target.
- Amplify each dilution across the expected concentration range, ensuring sufficient replicates for statistical analysis.
- Plot Cq values against the logarithm of the template concentration.
- Calculate linear regression and determine the correlation coefficient (R²) [10].
- Acceptance criteria: A well-optimized assay should demonstrate a linear range of 6-8 orders of magnitude with R² ≥ 0.980 [10]. Primer efficiency should fall between 90-110%.
Sensitivity and Limit of Detection
Analytical sensitivity represents the minimum detectable concentration of the target analyte, typically expressed as the limit of detection (LOD) [14].
Experimental Protocol:
- Prepare a dilution series of the target template at concentrations approaching the expected detection limit (e.g., 1-100 copies/reaction).
- Analyze a minimum of 12-24 replicates at each concentration level near the detection limit.
- Calculate the LOD as the lowest concentration where ≥95% of replicates test positive [14].
- For qualitative detection, the limit of quantification (LOQ) represents the lowest concentration where quantitative results meet predefined precision criteria (typically <25% CV).
Table 2: Essential qPCR Validation Parameters and Criteria
| Validation Parameter | Experimental Design | Acceptance Criteria | Industry Standard Reference |
|---|---|---|---|
| Inclusivity [10] | In silico analysis + testing of up to 50 target strains | Detection of all relevant variants; efficiency 90-110% | International standards |
| Exclusivity/Cross-reactivity [10] | Testing against genetically similar non-targets | No amplification or significantly delayed Cq (>10 cycles) | MIQE 2.0 [5] |
| Linear Dynamic Range [10] | 7-point 10-fold dilution series in triplicate | R² ≥ 0.980; 6-8 orders of magnitude | MIQE 2.0 [5] |
| Amplification Efficiency [10] | From dilution series slope calculation | 90-110% | MIQE 2.0 [5] |
| Limit of Detection [14] | 12-24 replicates at low concentrations | ≥95% detection at LOD | Clinical Research Guidelines [14] |
| Precision (Repeatability) [14] | Multiple replicates across runs, days, operators | CV <25% at LOQ, <15% at higher concentrations | Clinical Research Guidelines [14] |
Analytical and Clinical Performance Requirements
For qPCR assays intended for clinical research or diagnostic applications, establishing both analytical and clinical performance characteristics is essential. The CardioRNA consortium guidelines provide a comprehensive framework for this validation tier [14].
Analytical Performance Metrics
Analytical precision (closeness of repeated measurements) should be evaluated under multiple conditions:
- Repeatability: Same operator, same equipment, short time interval
- Intermediate precision: Different days, different operators, same equipment
- Reproducibility: Different laboratories, equipment, and operators
Analytical trueness (closeness to true value) should be established using certified reference materials when available, or through comparison to established reference methods [14].
Analytical specificity encompasses both exclusivity (cross-reactivity) as described previously and assessment of potential interferents including hemoglobin, lipids, common medications, and genomic DNA in RT-PCR applications [14].
Clinical Performance Metrics
For assays with clinical applications, establishing diagnostic accuracy is imperative:
- Diagnostic sensitivity (true positive rate): Proportion of actual positives correctly identified
- Diagnostic specificity (true negative rate): Proportion of actual negatives correctly identified
- Positive predictive value (PPV): Ability to identify disease in individuals with positive results
- Negative predictive value (NPV): Ability to identify absence of disease in individuals with negative results [14]
It is important to note that predictive values are dependent on disease prevalence and must be interpreted in the appropriate clinical context.
Implementation Workflow and Industry Solutions
Successfully implementing validated qPCR assays requires systematic workflows and appropriate reagent solutions. The following section outlines standardized processes and available industry tools.
Figure 1: Comprehensive qPCR Assay Development and Validation Workflow
Industry Reagent Solutions for MIQE Compliance
Multiple industry providers offer reagents and platforms designed to facilitate MIQE-compliant qPCR experiments. Thermo Fisher Scientific, for example, provides extensive resources for MIQE adherence, particularly through their TaqMan assay portfolio [6].
Table 3: Essential Research Reagent Solutions for qPCR Validation
| Reagent Solution | Function and Features | MIQE Compliance Support |
|---|---|---|
| TaqMan Assays [6] | Predesigned qPCR assays with unique assay IDs | Provides amplicon context sequence; >296K peer-reviewed citations |
| Assay Information File (AIF) [6] | Comprehensive assay documentation | Contains required context sequences for MIQE compliance |
| TaqMan Assay Search Tool [6] | Online assay annotation resource | Provides Entrez Gene ID, gene symbol, RefSeq IDs, amplicon length |
| RNA Extraction Kits | Standardized nucleic acid purification | Ensures sample quality and integrity documentation |
| Quantification Standards | Reference materials for calibration | Enables efficiency correction and dynamic range determination |
MIQE-Compliant Reporting Framework
Adherence to MIQE guidelines requires comprehensive documentation of experimental details. Thermo Fisher Scientific facilitates this process through their assay information ecosystem [6]. For predesigned TaqMan assays, publication of the unique Assay ID is typically sufficient and widely accepted, though MIQE guidelines also permit providing the probe or amplicon context sequence [6]. The AIF provided with each assay contains the required context sequence, accessible through the TaqMan File Downloads portal [6].
For laboratory-developed assays, MIQE 2.0 emphasizes that raw data should be exportable to facilitate thorough analysis and re-evaluation by manuscript reviewers and interested researchers [5]. Additionally, the guidelines specify that Cq values should be converted into efficiency-corrected target quantities and reported with prediction intervals [5].
Future Perspectives and Regulatory Directions
The evolution of qPCR validation guidelines points toward several significant trends that will shape future regulatory and industry practices.
Increasing Regulatory Harmonization
As qPCR-based biomarkers continue to demonstrate utility throughout the drug development continuum, regulatory bodies are moving toward more explicit guidance for their validation. The gray area between RUO and IVD is gradually being addressed through frameworks like the CR assay concept, which provides a structured pathway for biomarker development within clinical trials [14]. Future guidelines will likely establish more explicit requirements for this intermediate validation tier, potentially incorporating risk-based approaches that align validation rigor with potential clinical impact.
Technology Integration and Standardization
Emerging technologies including digital PCR and next-generation sequencing are creating new opportunities and challenges for qPCR validation. MIQE 2.0 already reflects the need to address technological advancements in qPCR instrumentation and reagents [5]. Future guidelines will need to establish standards for orthogonal method verification and integration of multiple technology platforms within validation frameworks.
Data Transparency and Computational Reproducibility
MIQE 2.0's emphasis on data accessibility and re-analysis points toward increasing requirements for computational reproducibility in qPCR studies [5]. Future guidelines will likely mandate more comprehensive data deposition, including raw fluorescence data, amplification curves, and analysis scripts alongside traditional publication formats. This transition will enable more robust peer review and facilitate the meta-analyses necessary for biomarker qualification.
The MIQE guidelines and complementary frameworks for qPCR validation represent an evolving consensus on standards necessary to ensure reliability and reproducibility in molecular assays critical to pharmaceutical development and clinical research. The recent introduction of MIQE 2.0 and Clinical Research assay guidelines provides researchers with updated, pragmatic frameworks for validation appropriate to different stages of the diagnostic and therapeutic development pipeline.
For the AAPS community, these guidelines offer a pathway to enhance the rigor of qPCR-based biomarker studies, improving their potential for successful translation into clinically useful tools. By adopting these standards proactively and contributing to their continued evolution, drug development professionals can accelerate the qualification of novel biomarkers and strengthen the evidence base supporting regulatory decision-making.
Conclusion
The MIQE guidelines provide an indispensable framework for transforming qPCR from a simple technical procedure into a robust, reproducible, and scientifically rigorous assay. Adherence to these principles, particularly the updated MIQE 2.0 recommendations, is no longer optional but a fundamental requirement for generating trustworthy data in both basic research and regulated drug development. For the field to advance, a cultural shift is necessary—one where researchers, reviewers, and journal editors collectively demand the transparency and rigor that MIQE embodies. By fully integrating these guidelines, the scientific community can overcome persistent challenges in data reproducibility, accelerate the development of sophisticated therapies like cell and gene treatments, and firmly uphold the integrity of biomedical science.
References
- 1. The MIQE Guidelines' tenth anniversary: The good and bad ... [https://www.sciencedirect.com/science/article/abs/pii/S2452014420300443]
- 2. MIQE précis: Practical implementation of minimum standard ... [https://bmcmolbiol.biomedcentral.com/articles/10.1186/1471-2199-11-74]
- 3. MIQE [https://en.wikipedia.org/wiki/MIQE]
- 4. The MIQE guidelines: minimum information for publication ... [https://pubmed.ncbi.nlm.nih.gov/19246619/]
- 5. MIQE 2.0: Revision of the Minimum Information for ... [https://pubmed.ncbi.nlm.nih.gov/40272429/]
- 6. MIQE Guidelines | Thermo Fisher Scientific - US [https://www.thermofisher.com/us/en/home/life-science/pcr/real-time-pcr/real-time-pcr-assays/why-choose-taqman-assays/publish-real-time-pcr-results.html]
- 7. Improving the quality of quantitative polymerase chain ... [https://www.sciencedirect.com/science/article/pii/S0098299724000086]
- 8. MIQE 2.0 and the Urgent Need to Rethink qPCR Standards [https://pmc.ncbi.nlm.nih.gov/articles/PMC12154065/]
- 9. MIQE 2.0 and the Urgent Need to Rethink qPCR Standards [https://www.mdpi.com/1422-0067/26/11/4975]
- 10. Quantitative PCR validation for research scientists: Part 1 of 2 [https://virologyresearchservices.com/2023/01/13/quantitative-pcr-validation-part-1-of-2/]
- 11. Efficient experimental design and analysis of real-time ... [https://pmc.ncbi.nlm.nih.gov/articles/PMC3710343/]
- 12. Services & Fees | Vironomics Core [https://www.med.unc.edu/vironomics/services/services_and_fees/]
- 13. qPCR and qRT-PCR analysis: Regulatory points to ... [https://pmc.ncbi.nlm.nih.gov/articles/PMC7786041/]
- 14. Consensus guidelines for the validation of qRT-PCR ... [https://pmc.ncbi.nlm.nih.gov/articles/PMC8792405/]
- 15. Universal SYBR Green qPCR Protocol [https://www.sigmaaldrich.com/US/en/technical-documents/protocol/genomics/qpcr/sybr-green-qpcr?srsltid=AfmBOorHhDQmLF6Cfs6lh4cQC_y-YA6kYX3j5fgu1Vs5pydn9WoU9erP]
- 16. How To Interpret RT-qPCR Results [https://www.goldbio.com/blogs/articles/how-to-interpret-rt-qpcr-results?srsltid=AfmBOorhQlmYGcBR-7CCyzjqncvlfffkHT9MoTxbSAW8howw8sai6C_1]
- 17. Introduction to Quantitative PCR (qPCR) Gene Expression ... [https://www.thermofisher.com/us/en/home/life-science/pcr/real-time-pcr/real-time-pcr-learning-center/gene-expression-analysis-real-time-pcr-information/introduction-gene-expression.html]
- 18. qPCR primer design revisited - PMC - PubMed Central - NIH [https://pmc.ncbi.nlm.nih.gov/articles/PMC5702850/]
- 19. Rules and Tips for PCR & qPCR Primer Design | IDT [https://www.idtdna.com/page/support-and-education/decoded-plus/how-to-design-primers-and-probes-for-pcr-and-qpcr/]
- 20. How To Interpret RT-qPCR Results [https://www.goldbio.com/blogs/articles/how-to-interpret-rt-qpcr-results?srsltid=AfmBOoqjPGpMyK__3nObg1j6JSHXSqDfjUOYXz15JZ_izGwgJOOmtlj_]
- 21. Guidelines for RNA Analysis by Reverse Transcription ... [https://pubmed.ncbi.nlm.nih.gov/40699418/]
- 22. Insights into qPCR: Protocol, Detection Methods, and Analysis [https://www.the-scientist.com/insights-into-qpcr-protocol-detection-methods-and-analysis-71478]
- 23. Reverse Transcription Reaction Setup [https://www.thermofisher.com/us/en/home/life-science/cloning/cloning-learning-center/invitrogen-school-of-molecular-biology/rt-education/reverse-transcription-setup.html]
- 24. A Practical Overview of qPCR [https://www.aatbio.com/resources/assaywise/2022-11-1/a-practical-overview-of-qpcr]
- 25. Quantitative PCR Basics [https://www.sigmaaldrich.com/US/en/technical-documents/technical-article/genomics/qpcr/quantitative-pcr?srsltid=AfmBOopvHPMNRAgH7Ica7ZuPWbPlDdTaBZxqdZCJgxgx2elLgy8Gq_wZ]
- 26. Reverse transcription-quantitative polymerase chain ... [https://bio-protocol.org/exchange/minidetail?id=4494869&type=30]
- 27. Validation of qPCR Assays for Gene Therapy [https://www.bioagilytix.com/blog/validation-of-qpcr-assays-for-gene-therapy/]
- 28. Recommendations for Method Development and ... [https://pubmed.ncbi.nlm.nih.gov/38316745/]
- 29. Using qPCR and ddPCR to study biodistribution of cell ... [https://www.sciencedirect.com/science/article/pii/S1465324924008648]
- 30. What do the new MIQE 2.0 guidelines mean for qPCR ? [https://blog.biosearchtech.com/miqe-2.0-for-qpcr]
- 31. From the Editors — Cell Therapy Regulation in 2025 [https://www.isctglobal.org/telegrafthub/blogs/isct-head-office1/2025/10/07/from-the-editors-cell-therapy-regulation-in-2025-a]
- 32. 2025 Marks Technology, Regulatory, and Disease Area ... [https://www.healthadvances.com/insights/blog/2025-marks-technology-regulatory-and-disease-area-shifts-in-cell-and-gene-therapy]
- 33. Cellular & Gene Therapy Guidances [https://www.fda.gov/vaccines-blood-biologics/biologics-guidances/cellular-gene-therapy-guidances]
- 34. qPCR and dPCR assay design and validation services [https://tataa.com/technologies/method-development-and-validation/]
- 35. PCR/qPCR Data Analysis [https://www.sigmaaldrich.com/US/en/technical-documents/technical-article/genomics/qpcr/data-analysis?srsltid=AfmBOooecWwZJVpPtPShq56T7Cu7diKPKGbh7sMTPy7lDs0zpHQ34woL]
- 36. How To Interpret RT-qPCR Results [https://www.goldbio.com/blogs/articles/how-to-interpret-rt-qpcr-results?srsltid=AfmBOor7Nha05xkvqJDO3y_S_0Nunt516q8quvNsNJ8uhIqTseOPotiH]
- 37. How good is a PCR efficiency estimate [https://pmc.ncbi.nlm.nih.gov/articles/PMC4822216/]
- 38. PCR efficiency | Determining amplification efficiencies [https://www.qiagen.com/us/knowledge-and-support/knowledge-hub/bench-guide/pcr/pcr-quantification/determining-amplification-efficiencies]
- 39. Efficiency of Real-Time PCR [https://www.thermofisher.com/us/en/home/life-science/pcr/real-time-pcr/real-time-pcr-learning-center/real-time-pcr-basics/efficiency-real-time-pcr-qpcr.html]
- 40. Understanding qPCR Efficiency and Why It Exceeds 100% [https://biosistemika.com/blog/qpcr-efficiency-over-100/]
- 41. QPCR Standard Curve Slope to Efficiency Calculator [https://www.agilent.com/store/biocalculators/calcSlopeEfficiency.jsp?srsltid=AfmBOorvFgeVIJd3THoHkXSHbkbL4ijYZACGN99nYjKMf_LY7TPDTDl_]
- 42. MIQE: Real-Time PCR Experiment Standards [https://www.sigmaaldrich.com/US/en/technical-documents/technical-article/genomics/qpcr/minimum-information-for-publication-of-quantitative-real-time-pcr-experiments?srsltid=AfmBOopQcIcFumo2emys-mdkutN8nzmv63cHoy1Z68gBfRx9zYE-zfGO]
- 43. Selection of reliable reference genes for gene expression ... [https://pmc.ncbi.nlm.nih.gov/articles/PMC3224724/]
- 44. Selection and Validation of Reference Genes for RT-qPCR ... [https://pmc.ncbi.nlm.nih.gov/articles/PMC7875621/]
- 45. Robust RT-qPCR Data Normalization - Research journals [https://journals.plos.org/plosone/article?id=10.1371/journal.pone.0017762]
- 46. Selecting reference genes in RT-qPCR based on ... [https://www.nature.com/articles/s41598-019-52217-2]
- 47. Data-driven normalization strategies for high-throughput ... [https://pmc.ncbi.nlm.nih.gov/articles/PMC2680405/]
- 48. Selection and validation of reliable reference genes for ... [https://www.nature.com/articles/s41598-023-40526-6]
- 49. Robust reference gene selection in Norway spruce [https://www.frontiersin.org/journals/forests-and-global-change/articles/10.3389/ffgc.2024.1458554/full]
- 50. Evaluation of normalisation strategies for qPCR data ... [https://www.nature.com/articles/s41598-025-06657-8]
- 51. How To Interpret RT-qPCR Results [https://www.goldbio.com/blogs/articles/how-to-interpret-rt-qpcr-results?srsltid=AfmBOooNTiNnFqR9QaM_gOA2A5zbrA-YCIEtd6hel15qzt7xMo4uABa4]
- 52. PCR/qPCR Data Analysis [https://www.sigmaaldrich.com/US/en/technical-documents/technical-article/genomics/qpcr/data-analysis?srsltid=AfmBOoryS_5y9i1vm5g55j3jzmhhoKI2OUGaB3NigEcmO3kf57EY_q2j]
- 53. IJMS | Special Issue : Advancing Molecular Science ... [https://www.mdpi.com/journal/ijms/special_issues/Y19113O08M]
- 54. Analyzing qPCR data: Better practices to facilitate rigor and ... [https://www.sciencedirect.com/science/article/pii/S2405580825004431]
- 55. Recommendations for Method Development and ... [https://link.springer.com/article/10.1208/s12248-023-00880-9]
- 56. Method validation and assessment of the biodistribution ... [https://pubmed.ncbi.nlm.nih.gov/40893162/]
- 57. Mastering dMIQE Guidelines for the Publication of dPCR ... [https://www.thermofisher.com/us/en/home/life-science/pcr/digital-pcr/education/basic-research/mastering-dmiqe-guidelines.html]
- 58. The digital MIQE guidelines: Minimum Information for ... [https://pubmed.ncbi.nlm.nih.gov/23570709/]
- 59. MIQE Guidelines for Digital PCR [https://bitesizebio.com/20356/miqe-guidelines-for-digital-pcr/]