Optimized ChIP-seq Library Preparation for Histone Marks: From Foundational Principles to Advanced Troubleshooting
This article provides a comprehensive guide for researchers and drug development professionals on Chromatin Immunoprecipitation followed by sequencing (ChIP-seq) library preparation, with a specific focus on histone modifications.
Optimized ChIP-seq Library Preparation for Histone Marks: From Foundational Principles to Advanced Troubleshooting
Abstract
This article provides a comprehensive guide for researchers and drug development professionals on Chromatin Immunoprecipitation followed by sequencing (ChIP-seq) library preparation, with a specific focus on histone modifications. It covers the foundational principles of ChIP-seq, detailing optimized protocols for both cell lines and challenging solid tissues. The content delivers methodical comparisons of low-input library preparation kits, systematic troubleshooting for common issues like high background and low signal, and established guidelines for data validation and quality control from consortia like ENCODE. By integrating comparative study data, refined protocols for tissue samples, and expert recommendations, this resource aims to empower scientists to generate high-quality, reproducible histone mark data for advancing epigenetic research and biomarker discovery.
Understanding ChIP-seq for Histone Marks: Core Principles and Experimental Design
Chromatin Immunoprecipitation followed by sequencing (ChIP-seq) has revolutionized our understanding of genome-wide protein-DNA interactions by enabling researchers to map transcription factor binding sites and histone modifications with unprecedented precision. This application note details optimized methodologies for ChIP-seq library preparation, with particular emphasis on overcoming the unique challenges associated with complex plant tissues when studying histone marks. We present a standardized framework encompassing experimental design, antibody validation, critical procedural steps, and quality control metrics essential for generating robust, publication-quality data. The protocols described herein integrate cost-effective strategies with rigorous standards established by major consortia to ensure reliability and reproducibility in histone marks research.
ChIP-seq combines chromatin immunoprecipitation with high-throughput DNA sequencing to identify genomic regions associated with specific DNA-binding proteins or histone modifications. The fundamental principle involves crosslinking proteins to DNA in living cells, followed by chromatin fragmentation, target-specific immunoprecipitation, and sequencing of the enriched DNA fragments. This powerful methodology allows researchers to characterize chromatin-associated features on a genome-wide basis, providing critical insights into epigenetic regulation and gene expression mechanisms [1].
Histone modifications represent a particularly important application of ChIP-seq technology, as post-translational modifications to histone tails (including methylation, acetylation, and phosphorylation) create a complex "histone code" that influences chromatin structure and transcriptional activity [1]. Successful ChIP-seq for histone marks requires careful optimization to address challenges specific to plant materials, including unique cellular attributes that can impair protocol success. The efficient coupling of sample and library preparation presented in this note provides a robust framework for acquiring representative sequencing data from even complex plant tissues [1].
Materials and Methods
Research Reagent Solutions
Table 1: Essential Research Reagents for ChIP-seq Experiments
| Reagent Category | Specific Examples | Function and Importance |
|---|---|---|
| Antibodies | Transcription factor-specific antibodies, Histone modification-specific antibodies | Specifically enrich for protein-DNA complexes of interest; critical for IP specificity and sensitivity [2] |
| Crosslinking Agents | Formaldehyde | Covalently crosslink proteins to DNA in living cells to preserve in vivo interactions [3] |
| Chromatin Shearing Reagents | Enzymatic digestion mixes, Sonication buffers | Fragment chromatin to optimal size (100-300 bp) for immunoprecipitation and sequencing [2] |
| Immunoprecipitation Materials | Protein A/G beads, Magnetic beads | Capture antibody-target complexes and separate from non-specific chromatin [3] |
| Library Preparation Kits | Commercial NGS library preparation kits | Prepare immunoprecipitated DNA for high-throughput sequencing [1] |
| Quality Control Assays | QPCR controls, Fragment analyzers | Verify enrichment efficiency and library quality before sequencing [2] |
Experimental Protocol for Histone Modifications in Plant Tissues
Crosslinking and Nuclei Extraction
Begin with fresh or frozen plant tissue, immediately treating with formaldehyde to crosslink histone proteins to associated DNA. The crosslinking time must be optimized for different plant species and tissue types to balance sufficient crosslinking with excessive background. Following crosslinking, isolate nuclei using optimized extraction buffers that account for the unique challenges of plant cells, including cell walls and abundant secondary metabolites. Efficient nuclei extraction is particularly crucial for complex plant materials where cellular attributes can impair protocol success [1].
Chromatin Shearing and Immunoprecipitation
Shear the isolated chromatin to fragments of 100-300 base pairs using either sonication or enzymatic digestion. Determine optimal fragmentation efficiency through agarose gel analysis or bioanalyzer traces. For immunoprecipitation, incubate sheared chromatin with validated antibodies specific to the histone modification of interest. The ENCODE consortium emphasizes that antibody quality governs ChIP experiment success, requiring rigorous validation through immunoblot analysis demonstrating that the primary reactive band contains at least 50% of the signal observed [2].
Library Preparation and Sequencing
Reverse crosslinks and purify immunoprecipitated DNA, then proceed to library preparation using commercially available kits. Recent advancements identify time as a critical parameter for effective coupling of ChIP-seq sample preparation with library generation. This cost-effective strategy enables robust NGS library construction in-house, particularly important for complex plant materials [1]. The resulting libraries should undergo quality control before sequencing, with the ENCODE consortium recommending 20 million usable fragments per replicate for transcription factors, though histone modifications may have different requirements [4].
ChIP-seq Experimental Workflow for Plant Histone Modifications
Critical Experimental Considerations
Antibody Validation Standards
Comprehensive antibody validation is paramount for successful ChIP-seq experiments. The ENCODE and modENCODE consortia have established rigorous characterization protocols requiring both primary and secondary validation methods. For antibodies directed against histone modifications, the primary characterization should demonstrate specificity through either immunoblot analysis showing a single major band or immunofluorescence showing the expected nuclear pattern [2].
Immunoblot analyses must meet specific quality thresholds, with the guideline that the primary reactive band should contain at least 50% of the total signal observed. When band sizes deviate more than 20% from expected molecular weights or multiple bands are present, additional validation through siRNA knockdown, mutant analysis, or mass spectrometry identification is required to confirm specificity [2]. These stringent measures ensure that observed binding patterns genuinely reflect the histone modification of interest rather than cross-reactivity artifacts.
Experimental Design and Controls
Appropriate experimental controls and replicate strategies are fundamental to generating biologically meaningful ChIP-seq data. The ENCODE guidelines mandate that each ChIP-seq experiment includes a corresponding input control experiment with matching run type, read length, and replicate structure [4]. This input DNA, prepared from crosslinked and fragmented chromatin without immunoprecipitation, controls for technical biases in sequencing and analysis.
Biological replication remains essential for distinguishing consistent binding patterns from stochastic background. The current standards require two or more biological replicates, with concordance measured using Irreproducible Discovery Rate (IDR) analysis. Experiments pass quality thresholds when both rescue and self-consistency ratios are less than 2 [4]. For histone modification studies in complex plant tissues, where biological variability may be heightened, additional replicates may be necessary to achieve statistical robustness.
Critical Parameter for Efficient Protocol Coupling
Data Analysis and Quality Assessment
Bioinformatics Pipeline
ChIP-seq data analysis follows a structured computational workflow beginning with quality assessment of raw sequencing reads using tools like FastQC. Following quality control, reads are aligned to a reference genome using aligners such as Bowtie2, with a target of 70% or higher uniquely mapped reads considered optimal [3]. The aligned reads in BAM format are then filtered to remove duplicates and multimapping reads, followed by peak calling using specialized algorithms like MACS2 that identify statistically enriched genomic regions [3].
For histone modifications, which often exhibit broad enrichment domains rather than sharp peaks, specialized peak callers may be necessary to accurately capture these patterns. The resulting peak calls undergo annotation to determine genomic context, distance from transcriptional start sites, and potential functional associations. Motif discovery can further reveal sequence patterns associated with the observed histone marks, providing insights into regulatory mechanisms [3].
Quality Control Metrics
Rigorous quality assessment is essential for validating ChIP-seq data integrity and biological relevance. Key metrics include library complexity measurements (Non-Redundant Fraction >0.9, PBC1>0.9, PBC2>10), fraction of reads in peaks (FRiP), and replicate concordance through IDR analysis [4]. The ENCODE consortium has established specific thresholds for these metrics, with experiments requiring 20 million usable fragments per replicate for transcription factors, though histone mark experiments may have different depth requirements due to their distinct genomic distribution patterns [4].
Table 2: ChIP-seq Quality Control Standards and Metrics
| Quality Metric | Target Value | Measurement Purpose | Technical Considerations |
|---|---|---|---|
| Library Complexity (NRF) | >0.9 | Measures diversity of unique DNA fragments | Values <0.8 indicate potential amplification bias [4] |
| PCR Bottlenecking (PBC1) | >0.9 | Assesses library complexity based on duplicate reads | Low values suggest limited library complexity [4] |
| PCR Bottlenecking (PBC2) | >3 (optimal >10) | Further evaluates library complexity and amplification | Critical for determining required sequencing depth [4] |
| Fraction of Reads in Peaks (FRiP) | Varies by target | Measures enrichment efficiency | Higher values indicate better antibody specificity [4] |
| IDR Consistency Ratio | <2 | Quantifies reproducibility between replicates | Applies to both rescue and self-consistency ratios [4] |
| Uniquely Mapped Reads | >70% (optimal) | Assesses alignment quality and potential contamination | Organism-specific considerations important [3] |
This application note has detailed comprehensive protocols for ChIP-seq library preparation focused specifically on histone marks research in complex plant tissues. The integrated approach emphasizing antibody validation, experimental optimization, and rigorous quality assessment provides a robust framework for generating high-quality genome-wide protein-DNA interaction data. By addressing the unique challenges of plant materials and highlighting the critical coupling between sample and library preparation steps, these methods enable researchers to obtain reliable, reproducible results that advance our understanding of epigenetic regulation in diverse biological systems. The standardized workflows and quality metrics presented align with consortium-established guidelines while incorporating recent methodological advances for efficient in-house implementation.
Histone post-translational modifications represent a fundamental epigenetic mechanism that regulates chromatin structure and genome function without altering the underlying DNA sequence. These modifications, including methylation, acetylation, phosphorylation, and ubiquitination, occur primarily on the amino-terminal tails of histone proteins and mediate essential processes such as gene expression, DNA repair, and replication. Abnormal histone modification patterns have been correlated with misregulation of gene expression in various human diseases, including cancer, immunodeficiency disorders, and developmental conditions. The genome-wide investigation of these epigenetic marks has been revolutionized by Chromatin Immunoprecipitation followed by sequencing (ChIP-seq), which provides researchers with a powerful tool to map protein-DNA interactions across the entire genome. This application note details why ChIP-seq is indispensable for histone mark research and provides detailed protocols for its implementation within the broader context of ChIP-seq library preparation for epigenomic studies.
The Biological Significance of Histone Marks
Histone modifications function through at least two primary mechanisms: by altering the electrostatic charge of histones, causing structural changes or affecting DNA binding properties; or by creating binding sites for protein recognition modules that influence chromatin function. These epigenetic modifications serve as critical regulators of cell identity, development, lineage specification, and disease states. Key histone modifications with distinct functional associations include:
Table 1: Major Histone Modifications and Their Functional Associations
| Histone Mark | Chromatin State | Genomic Location | Biological Function |
|---|---|---|---|
| H3K4me3 | Active | Promoters | Transcription activation |
| H3K4me1 | Active | Enhancers | Enhancer activity |
| H3K27ac | Active | Enhancers/Promoters | Active enhancers and promoters |
| H3K36me3 | Active | Gene bodies | Transcriptional elongation |
| H3K27me3 | Repressive | Broad domains | Polycomb-mediated silencing |
| H3K9me3 | Repressive | Broad domains | Heterochromatin formation |
Different combinations of histone marks can provide detailed information about chromatin states and functions. For example, the presence of both the active chromatin mark H3K4me3 and the repressive mark H3K9me3 at a promoter can identify imprinted genes, illustrating the complex regulatory information encoded in histone modification patterns [5]. These modifications undergo global changes during developmental transitions and in disease states, making them critical biomarkers for understanding cellular differentiation and pathogenesis.
ChIP-seq Methodology for Histone Marks
Fundamental Workflow
The standard ChIP-seq procedure involves multiple critical steps that must be optimized for histone modifications. The basic workflow includes: (1) crosslinking proteins to DNA in living cells using formaldehyde; (2) chromatin fragmentation by sonication or enzymatic digestion; (3) immunoprecipitation with histone modification-specific antibodies; (4) DNA purification and library preparation; and (5) high-throughput sequencing [2]. Unlike transcription factor ChIP-seq, which typically yields punctate binding signals, histone mark ChIP-seq often reveals broader enrichment patterns that can span entire gene bodies, requiring specialized analytical approaches [6].
Experimental Design Considerations
Antibody Validation
The quality of a ChIP experiment is governed by antibody specificity and the degree of enrichment achieved. The ENCODE consortium has established rigorous standards for antibody characterization, requiring both primary and secondary validation tests. For histone modifications, these typically include immunoblot analysis to demonstrate that the primary reactive band contains at least 50% of the signal observed, with appropriate size correspondence to the expected histone modification [2].
Sequencing Depth and Replicates
The ENCODE consortium has established specific standards for histone ChIP-seq experiments:
Table 2: ENCODE Sequencing Standards for Histone ChIP-seq
| Experiment Type | Minimum Reads per Replicate | Biological Replicates | Control Experiments |
|---|---|---|---|
| Narrow histone marks | 20 million fragments | 2 or more | Input DNA with matching characteristics |
| Broad histone marks | 45 million fragments | 2 or more | Input DNA with matching characteristics |
| H3K9me3 (exception) | 45 million total mapped reads | 2 or more | Input DNA with matching characteristics |
Experiments should have two or more biological replicates, either isogenic or anisogenic, with library complexity metrics meeting preferred values (NRF>0.9, PBC1>0.9, PBC2>10) to ensure data quality and reproducibility [7].
Advanced ChIP-seq Protocols
Double-Crosslinking ChIP-seq (dxChIP-seq)
For challenging chromatin factors, including those that do not bind DNA directly, double-crosslinking ChIP-seq has been developed to improve mapping efficiency and signal-to-noise ratio. This protocol incorporates disuccinimidyl glutarate (DSG) in the first step to stabilize protein complexes, followed by formaldehyde crosslinking to secure protein-DNA interactions [8]. The sequential use of DSG and FA is complementary: DSG first 'locks' protein-protein contacts with its ∼7.7 Å spacer that matches distances typical of protein-protein interfaces, and FA then secures protein-DNA interactions through its zero-length chemistry that strongly favors protein-DNA crosslink formation [8].
Optimized dxChIP-seq protocol:
- Crosslinking: Treat cells with 1.66 mM DSG for 18 minutes at room temperature
- Secondary crosslinking: Add 1% formaldehyde for 8 minutes at room temperature
- Quenching: Add glycine to a final concentration of 0.125 M
- Chromatin preparation: Lyse cells and isolate nuclei
- Shearing: Sonicate chromatin to 100-500 bp fragments
- Immunoprecipitation: Incubate with validated histone modification antibodies
- DNA purification: Reverse crosslinks and purify DNA
- Library preparation: Prepare sequencing libraries using compatible kits
This approach has proven effective for probing various histone modifications and chromatin-associated complexes that are difficult to capture with standard protocols [8].
Micro-C-ChIP for 3D Chromatin Organization
A recent innovation, Micro-C-ChIP, combines Micro-C with chromatin immunoprecipitation to map 3D genome organization at nucleosome resolution for defined histone modifications. This strategy leverages MNase-based chromatin fragmentation instead of restriction enzymes, enabling superior resolution of chromatin features including enhancer-promoter loops [9]. The method has been successfully applied to profile H3K4me3 and H3K27me3-specific 3D genome architecture in multiple cell types, identifying extensive promoter-promoter contact networks and resolving the distinct 3D architecture of bivalent promoters in embryonic stem cells [9].
Data Analysis and Interpretation
Specialized Analysis for Histone Modifications
Histone ChIP-seq data requires specialized analytical approaches distinct from transcription factor ChIP-seq. The ENCODE histone analysis pipeline can resolve both punctate binding and longer chromatin domains, with output suitable for chromatin segmentation models that classify functional genomic regions [7]. Key analytical considerations include:
- Peak calling: Broad peak detection must cope with the boundary problem where distance between start and end depends on underlying genomic regions
- Shape-based detection: Some algorithms classify gene regions according to peak shape characteristics specific to different histone marks
- Normalization: Appropriate normalization against input controls is essential for accurate identification of enriched regions
Quality Assessment
Rigorous quality control metrics must be assessed throughout the analytical pipeline:
- Sequence quality: FastQC evaluation of base call quality scores
- Alignment metrics: Percentage of uniquely mapped reads (70% or higher considered good)
- Library complexity: Non-Redundant Fraction (NRF>0.9), PCR Bottlenecking Coefficients (PBC1>0.9, PBC2>10)
- Enrichment measures: Fraction of Reads in Peaks (FRiP) scores
- Reproducibility: Correlation between biological replicates
The Scientist's Toolkit
Table 3: Essential Research Reagents for Histone ChIP-seq
| Reagent Category | Specific Examples | Function | Considerations |
|---|---|---|---|
| Crosslinkers | Formaldehyde, DSG | Fix protein-DNA interactions | DSG enhances protein-protein crosslinking |
| Antibodies | H3K4me3 (CST #9751S), H3K27me3 (CST #9733S), H3K9me3 (CST #9754S) | Target-specific enrichment | Must be ChIP-grade validated |
| Chromatin Shearing | Sonication (Bioruptor), MNase digestion | Fragment chromatin | MNase preserves nucleosome structure |
| Immunoprecipitation | Protein G Dynabeads, magnetic separation | Isolate antibody-bound complexes | Magnetic beads improve efficiency |
| Library Preparation | NEBNext Ultra II DNA library prep kit | Prepare sequencing libraries | Compatibility with sequencing platform |
| Quality Assessment | Qubit dsDNA HS assay, Bioanalyzer | Quantify and qualify DNA | Critical for sequencing success |
Applications in Drug Discovery and Development
The indispensability of ChIP-seq in histone mark research extends significantly to pharmaceutical applications. By comparing ChIP-seq profiles between disease and reference samples, researchers can identify differences in histone modification patterns that reveal disease mechanisms and potential therapeutic targets. This approach is particularly valuable in:
- Epigenetic drug development: Identifying changes in histone modification patterns in response to epigenetic therapies
- Biomarker discovery: Defining histone modification signatures associated with disease progression or treatment response
- Mechanism of action studies: Elucidating how existing therapeutics influence the epigenomic landscape
Abnormalities in the metabolism of post-translational modifications have been associated with misregulation of gene expression in multiple human diseases, including cancer, making histone modifications attractive targets for therapeutic intervention [10].
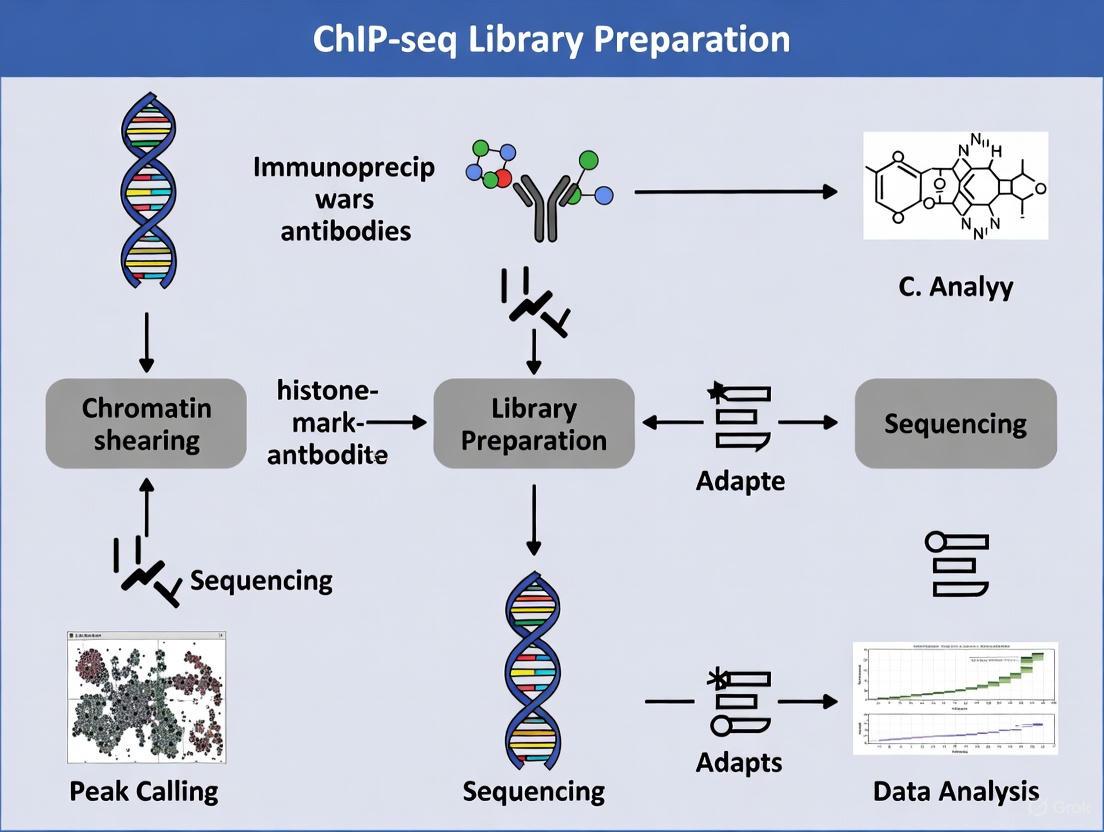
Visualizing the ChIP-seq Workflow
The following diagram illustrates the complete ChIP-seq workflow for histone mark analysis, from sample preparation through data analysis:
ChIP-seq Workflow for Histone Modifications
ChIP-seq technology remains indispensable for histone mark research due to its unparalleled ability to provide genome-wide, high-resolution maps of epigenetic modifications. When implemented with rigorous experimental design, appropriate controls, and validated reagents, histone ChIP-seq delivers critical insights into the regulatory mechanisms governing gene expression and chromatin architecture. The continued development of advanced methodologies, including dxChIP-seq and Micro-C-ChIP, further expands the applications of this powerful technology in basic research and drug development. As our understanding of the epigenetic code deepens, ChIP-seq will continue to be an essential tool for deciphering the complex relationships between histone modifications, chromatin organization, and cellular function in health and disease.
Chromatin Immunoprecipitation followed by sequencing (ChIP-seq) has emerged as the method of choice for generating genome-wide profiles of protein-DNA interactions and histone modifications. This technology provides critical insights into the epigenetic mechanisms that regulate gene expression without altering the underlying DNA sequence, which is particularly valuable for understanding cellular identity, developmental transitions, and disease states such as cancer [5]. For researchers investigating histone marks, ChIP-seq enables the precise mapping of modifications like H3K4me3 at promoters, H3K4me1 at enhancers, and H3K27me3 at repressed regions, revealing the dynamic nature of chromatin packaging and its functional consequences [5]. The workflow encompasses multiple stages, from stabilizing interactions in living cells to preparing sequencing libraries, with rigorous quality control checkpoints essential for generating reliable data. This protocol details the complete ChIP-seq procedure with a specific focus on applications in histone marks research, providing researchers and drug development professionals with a comprehensive framework for epigenomic investigation.
Materials: The Scientist's Toolkit
Research Reagent Solutions
The following table catalogs essential materials required for a successful ChIP-seq experiment targeting histone modifications.
| Item | Function/Application |
|---|---|
| Formaldehyde (37%) | Reversible cross-linking of proteins to DNA in living cells, preserving in vivo interactions for analysis [5]. |
| Glycine | Stopping reagent that quenches the cross-linking reaction by reacting with excess formaldehyde [5]. |
| Protease Inhibitors | Protects protein integrity during chromatin preparation and immunoprecipitation [5]. |
| ChIP-grade Antibodies | Antigen-specific enrichment of protein-DNA complexes. Critical for specificity [5] [2]. |
| Protein A/G Beads | Solid-phase matrix for antibody-mediated capture of target protein-DNA complexes. |
| IP Dilution Buffer | Provides optimal ionic and detergent conditions for the immunoprecipitation reaction [5]. |
| QIAGEN QIAquick Kit | Purification and recovery of DNA after cross-link reversal and proteinase K digestion [5]. |
| Illumina Library Prep Kit | Preparation of ChIP DNA for high-throughput sequencing, including end-repair, adapter ligation, and amplification. |
Experimental Protocol
Stage 1: Cross-linking and Chromatin Preparation
Methodology:
- Cross-linking: Resuspend approximately 1-5 million cells in a single-cell suspension. Add formaldehyde directly to the cell culture medium to a final concentration of 1%. Incubate for 8-10 minutes at room temperature with gentle agitation to facilitate covalent cross-linking between histones and DNA [5].
- Quenching: Stop the reaction by adding glycine to a final concentration of 0.125 M. Incubate for 5 minutes at room temperature while rotating. Pellet the cells and wash twice with ice-cold phosphate-buffered saline (PBS) [5].
- Cell Lysis: Resuspend the cell pellet in ice-cold Cell Lysis Buffer (e.g., 5 mM PIPES pH 8, 85 mM KCl, 1% Igepal) supplemented with fresh protease inhibitors (PMSF, aprotinin, leupeptin). Incubate on ice for 15 minutes. Pellet the nuclei by centrifugation [5].
- Nuclei Lysis and Chromatin Shearing: Lyse the nuclei in Nuclei Lysis Buffer (e.g., 50 mM Tris-HCl pH 8, 10 mM EDTA, 1% SDS) with protease inhibitors. Shear the chromatin to an average fragment size of 100-300 bp using a focused-ultrasonicator (e.g., Bioruptor, Covaris). The optimal shearing time and settings must be determined empirically for each cell type [5] [2].
Critical Step: After shearing, take a 50 µL aliquot of chromatin. Reverse the cross-links, treat with RNase A, purify the DNA, and analyze the fragment size distribution using a Bioanalyzer or TapeStation. This confirms efficient shearing before proceeding to the immunoprecipitation step [5].
Stage 2: Chromatin Immunoprecipitation (ChIP)
Methodology:
- Dilution: Dilute the sheared chromatin 10-fold in IP Dilution Buffer to reduce the concentration of SDS, which can interfere with antibody binding [5].
- Immunoprecipitation: For each ChIP reaction, incubate 1 µg of diluted chromatin with 1-5 µg of validated, ChIP-grade antibody specific to the histone mark of interest (e.g., H3K4me3, H3K27me3) [5]. Include a control with a non-specific IgG antibody. Rotate the mixture overnight at 4°C.
- Capture: Add Protein A or G magnetic beads (pre-blocked with BSA and sheared salmon sperm DNA) and incubate for 2 hours at 4°C with rotation.
- Washing: Pellet the beads and perform a series of washes to remove non-specifically bound material. A typical wash series includes: once with Low Salt Wash Buffer, once with High Salt Wash Buffer, once with LiCl Wash Buffer, and twice with TE Buffer [5] [3].
- Elution: Elute the protein-DNA complexes from the beads using a freshly prepared elution buffer (e.g., 50 mM NaHCO₃, 1% SDS). Incubate at 65°C for 15-30 minutes with vigorous shaking [5].
- Reverse Cross-linking and DNA Purification: Add NaCl to the eluate to a final concentration of 200 mM and incubate at 65°C overnight to reverse the cross-links. Treat with RNase A and Proteinase K. Purify the ChIP-enriched DNA using a spin column-based kit (e.g., QIAquick) and elute in a low-EDTA TE buffer or nuclease-free water [5].
Stage 3: Library Preparation and Sequencing
Methodology:
- Quality Control: Quantify the purified ChIP DNA using a fluorometric method (e.g., Qubit). A minimum of 1-10 ng of DNA is typically required to initiate library preparation [5].
- Library Preparation: Use a commercial library preparation kit compatible with your sequencing platform (e.g., Illumina). The key steps are:
- End Repair: Convert the sheared DNA fragments into blunt-ended fragments.
- A-tailing: Add a single 'A' nucleotide to the 3' ends of the blunt-ended fragments.
- Adapter Ligation: Ligate platform-specific sequencing adapters to the A-tailed fragments.
- Size Selection: Purify and select adapter-ligated DNA fragments in the desired size range (e.g., 200-400 bp) to exclude adapter dimers and optimize cluster generation.
- PCR Amplification: Perform limited-cycle PCR (e.g., 12-18 cycles) to amplify the library for sequencing [5].
- Sequencing: Validate the final library quality (e.g., via Bioanalyzer) and quantify it by qPCR. Sequence the library on an appropriate high-throughput platform (e.g., Illumina GA2, HiSeq) [5]. For histone marks, a sequencing depth of 20-40 million non-redundant reads is often sufficient for robust peak calling [2].
Data Analysis and Quality Control
Quality Control Metrics
The ENCODE consortium and other large-scale projects have established rigorous quality standards for ChIP-seq data. The following table summarizes key quantitative metrics and their acceptable thresholds [2] [11].
| Quality Metric | Description | Target Value / Threshold |
|---|---|---|
| Strand Cross-Correlation | Measures the correlation between forward and reverse strand tag densities at different shift sizes. | NCC (Normalized Cross-Correlation Coefficient) ≥ 0.8 [11] |
| Fraction of Reads in Peaks (FRiP) | The proportion of all mapped reads that fall into peak regions. | ≥ 1% for broad marks (H3K27me3); ≥ 5% for narrow marks (H3K4me3) [2] |
| PCR Bottlenecking Coefficient (PBC) | Measures library complexity by assessing the redundancy of read positions. | PBC1 (unique reads/total reads) > 0.9 [2] |
| Uniquely Mapped Reads | Percentage of sequenced reads that align uniquely to the reference genome. | ≥ 70% [3] |
| Peak Count | The total number of significant enrichment regions called. | Varies by factor and cell type; should be biologically plausible. |
Strand Cross-Correlation Analysis: This is a critical quality control step. High-quality ChIP-seq data from a point-source factor or histone mark will show a strong peak in the cross-correlation profile at the effective fragment length (the distance between forward and reverse strand peaks). A low ratio between the correlation at the fragment length peak versus the read length peak indicates a poor-quality IP [11].
Data Analysis Pipeline
The standard computational workflow for ChIP-seq data involves several key steps [3]:
- Quality Control (FastQC): Assess the quality of the raw sequencing reads.
- Alignment (Bowtie2): Map the sequenced reads to the reference genome.
- Post-Alignment Processing (Samtools/Sambamba): Convert SAM files to BAM, sort, and filter to retain only uniquely mapped, non-duplicate reads.
- Peak Calling (MACS2): Identify genomic regions with significant read enrichment compared to a control (input DNA) [3].
- Downstream Analysis: Annotate peaks with genomic features, perform motif discovery, and conduct comparative analyses between conditions.
Visual Workflow of the ChIP-seq Protocol
The following diagram provides a comprehensive overview of the complete ChIP-seq workflow, integrating both laboratory and computational procedures.
Diagram Title: Complete ChIP-seq Workflow and Quality Control
The ChIP-seq protocol outlined here provides a robust framework for investigating histone modifications on a genome-wide scale. Success hinges on careful execution at each stage, from using validated antibodies and optimizing chromatin shearing to implementing rigorous bioinformatic quality controls. As sequencing costs decrease and analytical methods become more sophisticated, ChIP-seq will continue to be a cornerstone technology in epigenetics, enabling deeper insights into gene regulatory mechanisms in health, disease, and in response to therapeutic interventions.
In chromatin immunoprecipitation followed by sequencing (ChIP-seq) experimental design, accurately defining whether your histone mark of interest exhibits point-source or broad-source characteristics is a fundamental determinant of success. This classification directly influences every subsequent stage of your research, from antibody selection and sequencing depth calculations to bioinformatic processing and biological interpretation. Point-source marks, such as transcription factor binding sites and certain histone modifications like H3K4me3 at promoters, produce sharp, discrete peaks representing highly localized protein-DNA interactions [12] [13]. In contrast, broad-source marks, including H3K27me3 and H3K79me2, form extensive genomic domains spanning thousands of bases, reflecting widespread chromatin states [14] [13]. Misclassification at this initial stage can lead to inappropriate experimental designs, suboptimal sequencing depths, and incorrect analytical approaches that fundamentally compromise data quality and biological insights.
Theoretical Foundation: Characteristics of Point-Source and Broad-Source Signals
Molecular and Genomic Features
The distinction between point-source and broad-source histone modifications stems from their fundamentally different biological roles and molecular distributions. Point-source modifications typically demarcate precise regulatory elements, including active promoters, enhancers, and insulator elements, where highly localized binding of transcription factors or chromatin-modifying complexes occurs [12] [13]. These marks generate sharp, narrow peaks in ChIP-seq data, often characterized by well-defined summit positions and high fold-enrichment over background.
Broad-source modifications define large chromatin domains associated with repressed (e.g., H3K27me3) or actively transcribed (e.g., H3K79me2) genomic regions [14]. These expansive patterns reflect stable epigenetic states maintained across multiple nucleosomes and often encompassing entire gene clusters. The undulating patterns observed in broad domains frequently correspond to well-positioned nucleosomes, creating a challenge for peak-calling algorithms designed for sharp, focal signals [13].
Comparative Analysis of Key Features
Table 1: Comparative Characteristics of Point-Source and Broad-Source Histone Modifications
| Feature | Point-Source Modifications | Broad-Source Modifications |
|---|---|---|
| Typical Examples | H3K4me3, transcription factor binding | H3K27me3, H3K79me2, H3K36me3 |
| Peak Width | Narrow (100-1000 bp) | Broad (kilobases to megabases) |
| Biological Role | Precise regulatory elements (promoters, enhancers) | Chromatin domain states (repressed, active) |
| Signal Pattern | Sharp, discrete peaks | Extended, often undulating domains |
| Data Characteristics | High fold-enrichment, defined summits | Lower fold-enrichment, diffuse boundaries |
| ENCODE Sequencing Depth Guidelines | 20 million reads (human) [12] | 40 million reads (human) [12] |
Experimental Design Implications
Sequencing Requirements and Quality Control
The fundamental differences between point-source and broad-source modifications necessitate distinct sequencing strategies. Point-source marks typically require lower sequencing depth (20 million uniquely mapped reads for human genomes according to ENCODE standards) but benefit from higher replicate numbers to capture discrete binding events with statistical confidence [12]. In contrast, broad-source marks demand approximately twice the sequencing depth (40 million reads) to adequately cover extended domains and distinguish true signal from background across large genomic regions [12].
Quality assessment must also be tailored to each mark type. The Fraction of Reads in Peaks (FRiP) serves as a critical quality metric, with recommended thresholds of >1% for both mark types, though broad marks often exhibit different distributions [12]. For point-source marks, cross-correlation analysis comparing Watson and Crick strand distributions effectively assesses sequencing quality, while for broad marks, cumulative enrichment (fingerprinting) provides a more appropriate assessment of signal-to-noise ratio across extended domains [14].
Antibody Validation and Selection
Antibody specificity represents a paramount concern in ChIP-seq experimental design, with validation requirements differing between mark types. For both categories, ENCODE guidelines recommend primary characterization via immunoblot or immunofluorescence analysis, followed by secondary validation through either factor knockdown, independent ChIP experiments, immunoprecipitation using epitope-tagged constructs, mass spectrometry, or binding site motif analyses [12].
Recent technological advancements have introduced alternatives to traditional ChIP-seq, including CUT&Tag, which offers potential advantages for both mark types, particularly in low-input scenarios. Benchmarking studies demonstrate that CUT&Tag recovers approximately 54% of ENCODE ChIP-seq peaks for histone modifications H3K27ac and H3K27me3, with detected peaks representing the strongest ENCODE peaks and showing equivalent functional enrichments [15].
Bioinformatics Analysis: Specialized Approaches for Each Mark Type
Peak Calling Strategies and Algorithms
The selection of appropriate peak-calling algorithms and parameters constitutes perhaps the most critical analytical distinction between point-source and broad-source histone marks.
Table 2: Peak-Calling Recommendations for Different Histone Mark Types
| Analysis Aspect | Point-Source Modifications | Broad-Source Modifications |
|---|---|---|
| Recommended Algorithms | MACS2, PeakSeq, ZINBA | MACS2 (broad mode), SICER, RSEG, epic2 |
| Key Parameters | Narrow peak calling, summit refinement | Broad region detection, gap allowance |
| MACS2 Settings | Standard peak calling (--call-sumits) |
Broad peak calling (--broad --broad-cutoff 0.1) [14] |
| Input Considerations | Matched input control essential | Input control critical for background estimation |
| Output Features | Defined peak summits, precise coordinates | Extended domains without clear summits |
For point-source marks, algorithms like MACS2 excel at identifying narrow enrichment regions through dynamic Poisson distribution modeling, generating outputs with precise genomic coordinates and well-defined peak summits [13]. These summits often correspond to transcription factor binding motifs or nucleosome-depleted regions at active promoters.
For broad-source marks, specialized tools including SICER and RSEG implement window-based approaches that merge eligible clusters in proximity, effectively capturing extended domains while accounting for spatial distribution patterns [14] [13]. When using MACS2 for broad marks, the --broad flag with appropriate cutoff values (e.g., --broad-cutoff 0.1) enables composite broad region detection by grouping nearby enriched areas into unified domains [14].
Normalization and Quantitative Comparison
Accurate normalization presents distinct challenges for each mark type. Point-source data typically employs input-based normalization methods like siQ-ChIP, which quantifies absolute immunoprecipitation efficiency genome-wide without relying on exogenous spike-in controls [16]. This mathematically rigorous approach facilitates both absolute and relative comparisons within and between samples.
For broad-source marks, specialized normalization strategies account for extensive domain architecture. The recently developed normalized coverage method enables robust relative comparisons by addressing technical biases inherent in broad mark profiling [16]. These normalization approaches are particularly crucial for comparative analyses across experimental conditions or time-course studies investigating dynamic chromatin state changes.
Integrated Experimental Workflow
The following workflow diagram illustrates the critical decision points throughout the ChIP-seq experimental and analytical pipeline for both point-source and broad-source histone modifications:
Research Reagent Solutions and Essential Materials
Table 3: Key Research Reagents and Materials for Histone Mark ChIP-seq
| Reagent/Material | Function/Purpose | Considerations for Mark Type |
|---|---|---|
| Specific Antibodies | Immunoprecipitation of target histone marks | Point-source: Validate for sharp peaks; Broad-source: Confirm broad domain detection [12] [15] |
| Chromatin Preparation Kits | Cell lysis, chromatin fragmentation | Point-source: Sonication optimization; Broad-source: MNase digestion for nucleosome resolution [17] |
| Library Preparation Kits | Sequencing library construction from ChIP DNA | Low-input protocols (e.g., Accel-NGS, ThruPLEX) benefit both types [18] |
| Spike-in Controls | Normalization reference | Semiquantitative; siQ-ChIP recommended as rigorous alternative [16] |
| Quality Control Tools | Assessment of data quality | Point-source: Cross-correlation; Broad-source: Cumulative enrichment [14] |
| Peak Calling Software | Identification of enriched regions | Point-source: MACS2; Broad-source: SICER, epic2, MACS2 broad mode [14] [13] |
Advanced Applications and Future Directions
Single-Cell and Low-Input Methodologies
Recent methodological advances have expanded ChIP-seq applications to limited cell populations. Low-input protocols including Accel-NGS 2S and ThruPLEX demonstrate robust performance for both point-source and broad-source marks at inputs as low as 0.1-1 ng ChIP DNA, maintaining sensitivity and specificity comparable to standard inputs [18]. For single-cell epigenomics, CUT&Tag technologies offer particular promise, operating at approximately 200-fold reduced cellular input and 10-fold lower sequencing depth requirements while maintaining signal specificity [15].
Multi-dimensional Integration
The true biological power of histone modification data emerges through integration with complementary genomic approaches. For point-source marks, correlation with ATAC-seq accessibility data and transcription factor binding motifs strengthens regulatory element predictions [19]. For broad-source marks, integration with chromatin conformation data (Hi-C, Micro-C) elucidates relationships between chromatin states and 3D genome architecture [17] [20]. Advanced computational methods now enable prediction of chromatin loops from epigenome data and data imputation to expand analytical possibilities [19].
The emerging methodology Micro-C-ChIP exemplifies this integrated approach, combining Micro-C with chromatin immunoprecipitation to map 3D genome organization at nucleosome resolution for defined histone modifications [17]. This technique has revealed extensive promoter-promoter contact networks and resolved distinct 3D architecture of bivalent promoters in embryonic stem cells, demonstrating how chromatin folding intersects with histone modification landscapes.
Strategic experimental planning grounded in the fundamental distinction between point-source and broad-source histone modifications establishes the foundation for rigorous, interpretable ChIP-seq research. By aligning sequencing strategies, quality control metrics, analytical approaches, and interpretation frameworks with the specific characteristics of each mark type, researchers can maximize biological insights while optimizing resource utilization. As epigenetic methodologies continue evolving toward single-cell resolution, multi-omics integration, and higher-dimensional chromatin mapping, this foundational understanding will remain essential for navigating the increasing complexity of epigenomic regulation.
In chromatin immunoprecipitation followed by sequencing (ChIP-seq) research for histone marks, the initial stages of antibody validation and sample preparation constitute the foundational pillar upon which all subsequent data and conclusions rest. The integrity of a ChIP-seq experiment is fundamentally dependent on two critical processes: the use of a特异性 (specific) and well-validated antibody, and the preparation of high-quality chromatin from cells or tissues. Inadequate attention to these initial steps can lead to irreproducible results, misleading conclusions, and a significant waste of resources. Within the framework of a broader thesis on ChIP-seq library preparation, mastering these protocols is not merely a preliminary task but a core scientific competency. The biomedical research community continues to grapple with a reproducibility crisis, a substantial portion of which is driven by poorly characterized antibody reagents [21]. Furthermore, working with tissues presents unique technical hurdles, including tissue heterogeneity, dense cell matrices, and challenges in chromatin fragmentation, which can compromise data quality if not properly addressed [22]. This application note provides detailed methodologies and validation strategies to ensure researchers can navigate these critical first steps with confidence, thereby laying the groundwork for robust and interpretable histone mark research.
Antibody Validation Strategies
The cornerstone of any successful ChIP-seq experiment is a highly validated antibody. It is estimated that over 4.5 million commercial tool antibodies are available, yet a vast number suffer from catastrophic deficits in specificity, activity, and identity, leading to widespread irreproducibility in biological sciences [21]. Antibody validation ensures that an antibody specifically recognizes its intended target histone modification and does not cross-react with other proteins or epitopes, thereby guaranteeing the specificity and repeatability of the research data [23].
Key Validation Methods
A multifaceted approach to antibody validation is essential. No single method is sufficient, and the choice of strategy should be aligned with the final application—in this case, ChIP-seq.
- Genetic Knockout Controls: This is considered one of the strongest validation technologies. Using cell lines or tissues where the gene encoding the target protein is knocked out provides a definitive negative control. The absence of a signal in the knockout model confirms the antibody's specificity. Newer CRISPR-Cas9 gene editing techniques allow for precise deletion of native antibody genes and introduction of new ones to reprogram hybridomas for desired specificities, providing a powerful tool for validating antibody-antigen targets [23].
- Mass Spectrometry (IP-MS): Immunoprecipitation followed by mass spectrometry offers a broader and deeper analysis of antibody specificity than classical methods. This technique identifies all proteins pulled down by the antibody, revealing any off-target binding and providing unbiased confirmation that the antibody is enriching only the correct histone-modified peptide [21].
- Western Blot Analysis: While a common validation technique, Western blotting requires careful interpretation. A recombinant protein control can be misleading if the data sheet is not read carefully, as it may not reflect the antibody's performance on an endogenous extract for a target of low abundance [24]. It is crucial to verify that the antibody detects a single band at the expected molecular weight in the relevant cell or tissue lysate.
- Use of Appropriate Controls: Dr. Giovanna Roncador emphasizes the criticality of using appropriate fit-for-purpose controls, both positive and negative, to validate antibodies in every experimental context [21]. For histone marks, this includes using cell lines known to possess or lack the specific modification.
Table 1: Key Antibody Validation Strategies and Their Applications
| Validation Method | Key Principle | Strength | Consideration for ChIP-seq |
|---|---|---|---|
| Genetic Knockout | Uses cells lacking the target epitope as a negative control. | High confidence in specificity; definitive negative control. | Consider histone variant complexity; may require specialized cell lines. |
| Mass Spectrometry (IP-MS) | Identifies all proteins bound by the antibody. | Unbiased; confirms on-target binding and reveals cross-reactivity. | Directly assesses performance in an IP context; highly relevant. |
| Western Blot | Detects antibody binding to denatured proteins on a membrane. | Assesses specificity for a single band of correct size. | Does not confirm performance in native, cross-linked chromatin. |
| Protein Arrays | Tests antibody binding against thousands of immobilized proteins. | High-throughput assessment of potential cross-reactivity. | Can screen many epitopes simultaneously but may lack native context. |
The Critical Shift to Recombinant Antibodies
A significant advancement in overcoming validation challenges is the shift towards recombinant antibodies. Unlike traditional monoclonal (mAbs) or polyclonal antibodies, recombinant antibodies are produced from known DNA sequences, ensuring long-term reproducibility and consistency—a feature that is very much the minority in the current commercial landscape [21]. Their sequence-defined nature allows for rigorous molecular identification, which can eliminate many of the shadowy issues associated with traditional antibodies and guarantee reproducible research [23] [21]. For therapeutic antibodies and critical research applications, thorough characterization is mandated by regulatory bodies to ensure specificity, stability, and safety [23].
Cell and Tissue Preparation Protocols
The quality of chromatin preparation is the second critical determinant of ChIP-seq success. The protocol must efficiently release and shear chromatin while preserving the native protein-DNA interactions. The workflow differs significantly between cell cultures and solid tissues, with the latter posing greater challenges due to tissue complexity and density [22].
Chromatin Preparation from Solid Tissues
The following protocol, optimized for solid tissues like colorectal cancer samples, provides a refined approach to overcome common limitations [22]. The entire process, from frozen tissue to sheared chromatin, is summarized in the workflow diagram below.
Materials:
- Frozen tissue samples (e.g., colorectal tumors, adjacent normal tissues)
- 1× phosphate-buffered saline (PBS), ice-cold, supplemented with protease inhibitors
- Biosafety cabinet (BSC), ice bucket with ice, sterile Petri dishes, sterile scalpel blades
- Option A (Manual): Sterile Dounce tissue grinder (7-mL), pestle A
- Option B (Automated): gentleMACS Dissociator and gentleMACS C-tubes
- 50-mL conical tubes, refrigerated benchtop centrifuge
Steps:
- Tissue Retrieval and Mincing: Transfer frozen tissue cryotubes from -80°C directly to ice. Within a biosafety cabinet, place a Petri dish on a stable ice platform and put the tissue sample in the dish. Using two sterile scalpels, mince the tissue until it is finely diced.
- Homogenization - Option A (Dounce Grinder):
- Transfer the minced tissue to a 7-mL Dounce grinder on ice.
- Add 1 mL of cold PBS with protease inhibitors to rinse the grinder walls.
- Shear the tissue with the A pestle using 8-10 even, controlled strokes. Avoid excessive speed to prevent splashing or breakage. Keep the grinder deeply sunk in ice.
- Add 2-3 mL of cold PBS and pour the contents into a new 50-mL tube. Rinse the grinder with more PBS and combine the washes.
- Homogenization - Option B (gentleMACS Dissociator):
- Transfer the minced tissue to a C-tube on ice.
- Add 1 mL of cold PBS with protease inhibitors.
- Tap the upside-down C-tube on the bench to ensure contact with the blade.
- Run the preconfigured "htumor03.01" program.
- Add 2-3 mL of cold PBS and pour the homogenate into a new 50-mL conical tube.
- Cell Pellet Collection: Centrifuge the homogenized cell suspension at 300 x g for 10 minutes at 4°C. Carefully aspirate the supernatant. The cell pellet is now ready for cross-linking.
Materials:
- FA Lysis Buffer: 50 mM HEPES-KOH pH 7.5, 140 mM NaCl, 1 mM EDTA, 1% Triton X-100, 0.1% Sodium deoxycholate, 0.1% SDS, plus fresh protease inhibitors.
- Formaldehyde (handle in a fume hood), Glycine.
Steps:
- Cross-linking: Resuspend the cell pellet in PBS. For every gram of tissue, use 10 mL of PBS and add formaldehyde to a final concentration of 1.5%. Rotate the tube at room temperature for 15 minutes. This step must be performed in a fume hood [25].
- Quenching: Stop the reaction by adding glycine to a final concentration of 0.125 M. Rotate for an additional 5 minutes.
- Washing: Centrifuge the samples at 100 x g for 5 minutes at 4°C. Aspirate the supernatant and wash the pellet with 10 mL of ice-cold PBS. Repeat the centrifugation and discard the wash buffer.
- Lysis and Shearing: Resuspend the cell pellet in FA Lysis Buffer (recommended volume: 750 μL per 1x10^7 cells). Lyse the cells on ice for at least 10 minutes. Shear the chromatin to an optimal fragment size (200-600 bp) using sonication. Parameters must be empirically determined for each tissue type and sonicator.
- Immunoprecipitation: Clarify the sheared chromatin by centrifugation. Incubate the supernatant with the validated, target-specific antibody (e.g., against a specific histone mark) and Protein A/G beads overnight at 4°C with rotation.
- Washing and Elution: Wash the beads sequentially with low-salt, high-salt, and LiCl wash buffers, followed by a final TE buffer wash. Elute the immunoprecipitated protein-DNA complexes from the beads using an elution buffer (e.g., 1% SDS, 0.1 M NaHCO3).
Tissue Selection and Quality Control
The choice of starting material profoundly impacts the ChIP-seq outcome. Fresh tissue is optimal as it allows immediate fixation, preserving native complexes. Frozen tissue (snap-frozen in liquid nitrogen) is a robust alternative, while FFPE (Formalin-Fixed Paraffin-Embedded) tissue presents greater challenges for chromatin extraction and is not recommended for this protocol [25]. A critical quality control checkpoint is verifying the success of tissue homogenization under a microscope to ensure a unicellular suspension has been obtained [25]. Furthermore, the yield and quality of the sheared chromatin must be assessed using methods like agarose gel electrophoresis or a Bioanalyzer to confirm the desired fragment size distribution before proceeding to library preparation.
Table 2: Troubleshooting Common Issues in Tissue Preparation for ChIP-seq
| Problem | Potential Cause | Recommended Solution |
|---|---|---|
| Low Chromatin Yield | Inefficient tissue dissociation or homogenization. | Optimize homogenization method (e.g., test different gentleMACS programs); increase number of Dounce strokes. |
| Poor Chromatin Shearing | Inadequate sonication optimization or over-cross-linking. | Empirically optimize sonication time and power; reduce cross-linking time. |
| High Background Noise | Non-specific antibody binding or insufficient washing. | Re-validate antibody specificity; increase number or stringency of washes post-IP. |
| Irreproducible Results | Variable starting tissue mass or inconsistent processing. | Standardize tissue mass (e.g., 30 mg per ChIP [25]); use precise, timed protocols. |
The Scientist's Toolkit: Essential Research Reagents and Materials
Successful execution of the protocols above relies on access to specific, high-quality reagents and equipment. The following table details key solutions and their functions in the context of antibody validation and tissue preparation for ChIP-seq.
Table 3: Essential Research Reagent Solutions for ChIP-seq
| Item | Function/Application | Example(s) |
|---|---|---|
| Validated Antibodies | Specifically immunoprecipitate the target histone mark. | Recombinant antibodies for histone modifications (H3K27ac, H3K4me3, etc.). |
| Protease Inhibitors | Prevent proteolytic degradation of proteins and histones during sample preparation. | Cocktails including PMSF, Aprotinin, Leupeptin added fresh to buffers. |
| FA Lysis Buffer | Cell lysis and provides the ionic conditions for the immunoprecipitation reaction. | HEPES-KOH, NaCl, EDTA, Triton X-100, Sodium deoxycholate, SDS [25]. |
| Homogenization Devices | Mechanically disrupt solid tissues to create a single-cell suspension. | Dounce Homogenizer (manual), gentleMACS Dissociator (automated) [22]. |
| Chromatin Shearing Instrument | Fragment chromatin to optimal size for sequencing. | Ultrasonic Sonicator (e.g., Bioruptor, Covaris). |
| Magnetic Beads | Separate antibody-protein-DNA complexes from solution. | Protein A or Protein G Magnetic Beads. |
| Library Prep Kit | Prepare the immunoprecipitated DNA for high-throughput sequencing. | NEBNext Ultra II FS DNA Library Prep Kit for Illumina [26]. |
The reliability of any ChIP-seq dataset for histone mark research is inextricably linked to the rigor applied in its initial stages. As detailed in these application notes, this requires an uncompromising approach to antibody validation, employing strategies like knockout controls and mass spectrometry to ensure specificity. Simultaneously, it demands a meticulous and optimized protocol for chromatin preparation from tissues, addressing challenges in homogenization, cross-linking, and shearing. By integrating these critical first steps—selecting recombinant antibodies where possible and adhering to standardized, reproducible tissue processing workflows—researchers can significantly enhance the quality and interpretability of their data. This foundational work not only strengthens individual research projects but also contributes to the broader scientific community's efforts to improve the reproducibility and translational potential of epigenetic studies.
Proven Protocols for Robust ChIP-seq Library Preparation
The reliability of any Chromatin Immunoprecipitation followed by sequencing (ChIP-seq) experiment for histone marks research is fundamentally determined by the initial sample preparation steps. Mastering the distinct protocols for handling cell cultures and solid tissues represents a critical competency for researchers investigating epigenomic landscapes. While cell cultures offer controlled experimental conditions, solid tissues provide physiologically native environments that reflect cellular heterogeneity and spatial organization missing in in vitro models [27]. The inherent challenges of solid tissues—including their complex cellular matrices, heterogeneity, and frequently low input material—demand refined approaches to chromatin extraction and processing [27]. This application note details optimized, standardized protocols for both sample types, ensuring high-quality chromatin profiling essential for generating biologically relevant data on histone modification patterns in health and disease.
Crosslinking Strategies: Standard and Enhanced Approaches
Single Crosslinking with Formaldehyde
For many standard ChIP-seq applications, particularly for histone modifications that are directly associated with DNA, single crosslinking with formaldehyde remains the most common approach. This method utilizes a 1% formaldehyde solution incubated with the sample for 10 minutes at room temperature under gentle rotation [28]. The reaction is subsequently quenched by adding glycine to a final concentration of 150 mM and incubating for an additional 5 minutes [28]. Formaldehyde operates as a zero-length crosslinker (∼2 Å bridge), primarily reacting with the ε-amino group of lysine side chains in proteins and the exocyclic amino groups of DNA bases, thereby directly securing protein-DNA interactions [8]. This approach is often sufficient for robust mapping of many histone marks.
Double-Crosslinking for Enhanced Complex Stabilization
For challenging targets or to better capture indirect associations within chromatin complexes, a double-crosslinking strategy provides superior stabilization. This sequential method first uses a protein-protein crosslinker followed by standard formaldehyde treatment [8]. A proven optimized protocol involves:
- Primary Crosslinking: Apply disuccinimidyl glutarate (DSG) at 1.66 mM for 18 minutes at room temperature [8]. DSG is a homobifunctional NHS-ester crosslinker with a ∼7.7 Å spacer that efficiently stabilizes protein-protein interfaces through stable amide bonds formed at lysine residues.
- Secondary Crosslinking: Follow immediately with 1% formaldehyde for 8 minutes at room temperature [8]. This sequential use of DSG and formaldehyde is complementary: DSG first 'locks' protein-protein contacts, and FA then secures protein-DNA interactions, together providing a more complete capture of protein complexes on DNA [8].
This enhanced crosslinking strategy is particularly valuable for mapping chromatin factors that lack direct DNA-binding activity and function as part of larger multi-protein complexes [8].
Table 1: Crosslinking Methods for Different Sample Types
| Method | Crosslinking Agent | Concentration | Incubation Time | Primary Application |
|---|---|---|---|---|
| Single Crosslinking | Formaldehyde | 1% | 10 minutes | Direct histone-DNA interactions [28] |
| Double Crosslinking | DSG (primary) | 1.66 mM | 18 minutes | Indirectly bound factors, multi-protein complexes [8] |
| Formaldehyde (secondary) | 1% | 8 minutes | ||
| Alternative Double Crosslinking | EGS (primary) | 1.5 mM | 30 minutes | Solid tissues, challenging targets [28] |
Sample-Specific Processing Methodologies
Cell Culture Protocols
Adherent Cells
Begin by trypsinizing and collecting approximately 10⁷ cells (up to 5×10⁷ cells) by centrifugation. Resuspend the cell pellet in 10 mL of ice-cold PBS [28]. Proceed immediately to the crosslinking step of your choice (single or double) to preserve native chromatin states.
Cells in Suspension
Pellet the cells (10⁷ cells, maximum of 5×10⁷ cells) and resuspend them directly in 10 mL of ice-cold PBS before crosslinking [28]. Ensure the cells are fully suspended to achieve uniform crosslinking.
Solid Tissue Protocols
Solid tissues present unique challenges including cellular heterogeneity, complex extracellular matrices, and frequent limitations in starting material. The following protocol is optimized for frozen tissue specimens:
Tissue Homogenization: Transfer 5–30 mg of fresh or flash-frozen tissue to a sterile 1.5 mL tube. Add a small volume (250 μL to 1.5 mL, proportional to tissue mass) of ice-cold PBS supplemented with protease inhibitors [28]. Disrupt the tissue completely using a mechanical homogenizer, taking care not to let the volume exceed 1.2 mL. If necessary, split the sample into multiple tubes.
Dilution and Crosslinking: Complete the volume of homogenized tissue with additional ice-cold PBS + protease inhibitors (scaling up to 1–6 mL proportionally to the initial amount of tissue) and transfer to an ice-cold 15 mL tube [28]. Proceed with crosslinking. For particularly complex tissues like colorectal cancer samples, double-crosslinking with EGS (1.5 mM for 30 minutes) followed by formaldehyde (1% for 10 minutes) may yield superior results [28] [27].
Chromatin Isolation and Shearing Optimization
Cell Lysis and Nuclear Extraction
Following crosslinking and quenching, pellet cells or tissue by centrifugation at 2,000×g for 10 minutes at 4°C [28]. Resuspend the pellet in an appropriate volume of cell lysis buffer (1 mL for small pellets from ~10⁷ cells; up to 5 mL for larger pellets) and incubate on ice for 10 minutes [28]. For tissues, transfer the suspension to a pre-chilled Dounce homogenizer and complete the disruption with 20 strokes of the pestle (Pestle B). Centrifuge the lysate at 2,000×g for 5 minutes at 4°C, remove the supernatant, and add nuclear lysis buffer (500 μL for small pellets; up to 3 mL for larger pellets). Incubate on ice for 10 minutes [28]. This two-step lysis ensures clean nuclear isolation critical for efficient chromatin shearing.
Chromatin Shearing by Sonication
Sonication efficiency is highly dependent on cell type, tissue composition, and sonicator model, making optimization essential. Reserve a 10–15 μL aliquot of the chromatin solution as a non-sonicated control before proceeding. Using a focused-ultrasonicator (e.g., Covaris E220 with 1 mL AFA fiber tubes), the following settings provide an excellent starting point for optimization: PIP = 75, Duty Factor = 2%, Cycles per Burst = 200, Time = 1 to 5 minutes [28]. Following sonication, centrifuge samples at 18,000×g for 10 minutes at 4°C to remove debris, and transfer the supernatant (sheared chromatin) to a fresh tube [28]. This chromatin can be flash-frozen in liquid nitrogen and stored at -80°C for up to one month.
Shearing Efficiency Verification
To verify successful fragmentation, treat reserved aliquots (sonicated and non-sonicated controls) with 10 μg of RNase A for 30 minutes at 37°C, followed by 20 μg of Proteinase K for 1 hour at 65°C [28]. Reverse crosslinks by incubating at 95°C for 10 minutes. Analyze the DNA fragment size on a 1% agarose gel. For NGS library preparation, the optimal fragment size should range from 200 to 500 base pairs [28]. Quantitative assessment can be performed using systems such as the Agilent Bioanalyzer High Sensitivity DNA kit [8].
Table 2: Troubleshooting Chromatin Preparation Challenges
| Problem | Potential Cause | Solution |
|---|---|---|
| Low Chromatin Yield | Inefficient tissue disruption | Increase homogenization intensity; pre-chill tissue in liquid N₂ before crushing |
| Poor Shearing Efficiency | Over-crosslinking | Reduce formaldehyde concentration or incubation time; optimize DSG/EGS exposure [8] |
| DNA Fragment Size Too Large | Insufficient sonication | Increase sonication time or power; optimize chromatin concentration during shearing [8] |
| Excessive Fragment Heterogeneity | Variable sonication or sample degradation | Ensure uniform sample cooling during sonication; always use fresh protease inhibitors |
Quality Control and Standards for ChIP-seq Libraries
Rigorous quality assessment is essential before progressing to sequencing. The ENCODE consortium has established comprehensive guidelines and quality metrics for ChIP-seq experiments [4] [29].
Library Complexity and Sequencing Depth
Library complexity is measured using the Non-Redundant Fraction (NRF) and PCR Bottlenecking Coefficients (PBC1 and PBC2). Preferred values are NRF > 0.9, PBC1 > 0.9, and PBC2 > 10 [4]. For transcription factor and histone mark experiments, each biological replicate should ideally contain 20 million usable fragments [4]. Experiments with 10-20 million fragments are considered low depth, 5-10 million insufficient, and below 5 million extremely low depth [4].
Critical ChIP-seq Quality Metrics
Strand Cross-Correlation (SCC): This ChIP-seq specific metric calculates the Pearson's correlation between tag density on forward and reverse strands at various shift values. It produces two peaks: a peak of enrichment corresponding to the predominant fragment length and a "phantom" peak corresponding to the read length [30]. From this analysis, the Normalized Strand Cross-correlation Coefficient (NSC) and Relative Strand Cross-correlation Coefficient (RSC) are derived. A high-quality experiment typically shows NSC > 1.05 and RSC > 0.8 [30] [29].
Fraction of Reads in Peaks (FRiP): This measures the fraction of all mapped reads that fall within identified peak regions relative to the total read count. A higher FRiP score indicates greater enrichment against background. While threshold varies by target, FRiP scores ≥ 0.01 are acceptable for transcription factors, while ≥ 0.1 are expected for histone marks with broader domains [4].
Irreproducible Discovery Rate (IDR): For replicated experiments, IDR analysis measures consistency between biological replicates. Experiments pass quality thresholds when both rescue and self-consistency ratios are less than 2 [4].
Table 3: Essential Quality Control Metrics for ChIP-seq
| Quality Metric | Calculation Method | Target Value | Interpretation |
|---|---|---|---|
| Non-Redundant Fraction (NRF) | Unique mapped reads / Total mapped reads | > 0.9 [4] | Measures library complexity |
| PCR Bottlenecking Coefficient 1 (PBC1) | Unique genomic locations / Distinct genomic locations | > 0.9 [4] | Assesses PCR amplification bias |
| PCR Bottlenecking Coefficient 2 (PBC2) | Distinct genomic locations / Unique genomic locations | > 10 [4] | Further measures library complexity |
| Fraction of Reads in Peaks (FRiP) | Reads in peaks / Total mapped reads | ≥ 0.01 (TF), ≥ 0.1 (Histones) [4] | Indicates enrichment efficiency |
| Normalized Strand Cross-correlation (NSC) | Cross-corr. at fragment length / Min. cross-corr. | > 1.05 [30] | Assesses signal-to-noise ratio |
| Relative Strand Cross-correlation (RSC) | (Frag. length cross-corr. - Min.) / (Phantom peak cross-corr. - Min.) | > 0.8 [30] | Normalized measure of enrichment |
The Scientist's Toolkit: Essential Research Reagent Solutions
Table 4: Key Research Reagents for ChIP-seq Sample Preparation
| Reagent / Kit | Manufacturer / Source | Function in Protocol |
|---|---|---|
| Formaldehyde, 16% (w/v), methanol-free | Thermo Scientific [8] | Standard protein-DNA crosslinking |
| Disuccinimidyl Glutarate (DSG) | Thermo Scientific [8] | Primary protein-protein crosslinker in double-crosslinking |
| cOmplete Protease Inhibitor Cocktail | Roche [8] | Protects chromatin from proteolytic degradation during extraction |
| Protein G Dynabeads | Fisher Scientific [8] | Solid support for antibody-based chromatin immunoprecipitation |
| ChIP DNA Clean & Concentrator | Zymo Research [8] | Purification of immunoprecipitated DNA before library construction |
| NEBNext Ultra II DNA Library Prep Kit | NEB [8] | Preparation of sequencing-ready libraries from immunoprecipitated DNA |
| Qubit dsDNA HS Assay Kit | Invitrogen [8] | Accurate quantification of low-concentration DNA samples |
| Agilent Bioanalyzer High Sensitivity DNA Kit | Agilent [8] | Assessment of DNA fragment size distribution and library quality |
Mastering sample preparation for both cell cultures and solid tissues enables researchers to generate high-quality, biologically relevant ChIP-seq data for histone marks research. The integrated workflow below summarizes the complete process from sample collection to sequencing-ready libraries, emphasizing the parallel paths for different sample types and critical decision points that determine experimental success.
By implementing these optimized protocols and adhering to established quality metrics, researchers can overcome the inherent challenges of both cell culture and solid tissue processing. This ensures the generation of robust, reproducible ChIP-seq libraries capable of providing meaningful insights into the epigenetic mechanisms governing gene regulation in development, health, and disease.
Chromatin immunoprecipitation followed by sequencing (ChIP-seq) has emerged as a powerful method for interrogating protein-chromatin interactions and mapping chromatin modifications across the genome, providing critical insights into the regulation of gene expression in health and disease [22] [31]. The success of any ChIP-seq experiment for histone marks research fundamentally depends on effective chromatin fragmentation, which must yield appropriately sized DNA fragments while preserving biological relevance. Chromatin shearing represents one of the most challenging yet critical steps in the ChIP-seq workflow, requiring a delicate balance to achieve desired fragmentation without disrupting protein-DNA interactions [31] [32]. This application note provides detailed methodologies and optimization strategies for the two primary chromatin fragmentation approaches—sonication and enzymatic digestion—within the context of preparing high-quality ChIP-seq libraries for histone marks research.
Fragmentation Method Fundamentals
Mechanical Sonication
Sonication utilizes acoustic energy to physically shear chromatin into smaller fragments. This method employs high-frequency sound waves to create cavitation bubbles in the chromatin solution, which collapse and generate shear forces that break DNA strands. Sonication provides truly randomized fragments and is widely used in cross-linked ChIP (XChIP) workflows [33]. While effective, sonication requires exposing chromatin to harsh, denaturing conditions including high heat and detergent, which can damage both antibody epitopes and genomic DNA if not properly controlled [34]. The method's consistency varies depending on the sonicator type, brand, and probe condition, with only seconds often separating under-processed from over-processed chromatin [34].
Enzymatic Digestion
Enzymatic fragmentation employs micrococcal nuclease (MNase), which specifically cuts the linker DNA between nucleosomes to generate chromatin fragments of defined sizes [34] [33]. Unlike sonication, MNase digestion operates under gentle conditions without requiring high heat or detergents, thereby better preserving antibody epitopes and DNA integrity [34]. This method produces a more uniform fragment size distribution centered around mononucleosomes (150-300 bp) but has higher affinity for internucleosome regions, resulting in less random fragmentation patterns [33]. Enzymatic digestion is simple to control when maintaining the recommended enzyme-to-cell number ratio and typically yields more consistent results between experiments [34].
Table 1: Comparison of Chromatin Fragmentation Methods for Histone Mark Studies
| Parameter | Sonication | Enzymatic Digestion |
|---|---|---|
| Principle | Physical shearing via acoustic energy | Biochemical cleavage at linker DNA |
| Fragment Distribution | Randomized fragments | Nucleosome-defined fragments |
| Typical Size Range | 200-1000 bp [32] | 150-300 bp (mononucleosomal) [31] |
| Optimal for | Cross-linked samples (XChIP) [32] | Both native and cross-linked samples [35] |
| Temperature Conditions | Requires strict temperature control [32] | Gentle, no high heat required [34] |
| Reproducibility | Variable between instruments and protocols [34] | Highly consistent with proper optimization [34] [36] |
| Risk of Protein Damage | Higher due to heat and denaturing conditions [34] | Lower due to gentle enzymatic process [34] |
| Equipment Needs | Specific sonication equipment | Standard laboratory equipment |
Method Selection Guidelines
The choice between sonication and enzymatic digestion should be guided by experimental goals, sample characteristics, and the specific histone marks being investigated. For most histone mark studies, enzymatic digestion is often preferred due to its ability to generate defined mononucleosomal fragments that provide higher resolution mapping [34] [36]. However, sonication remains valuable for projects requiring randomization across all genomic regions or when working with samples resistant to enzymatic digestion.
The following decision pathway provides a systematic approach for selecting the appropriate fragmentation method:
Optimization Strategies and Protocols
Sonication Optimization Protocol
Materials:
- Covaris E220 or Bioruptor sonication system
- Cold water bath or ice
- Chromatin extraction buffer
- Proteinase K
- Phenol:chloroform:isoamyl alcohol
- Ethanol
- Agarose gel or Bioanalyzer for quality assessment
Procedure:
- Sample Preparation: Begin with cross-linked chromatin from approximately 1×10⁶ cells in 130µL of lysis buffer. Ensure samples are kept ice-cold throughout preparation to prevent degradation [32].
Parameter Optimization: Perform initial optimization using a time course experiment with varied sonication cycles. For probe-based sonicators, select a tip appropriate for your sample volume (typically 1-2mm for volumes <200µL) [32].
Power Settings: Use pulsed sonication with intervals (e.g., 15-30 seconds on, 30-60 seconds off) to prevent overheating. Keep lysates ice-cold between cycles [32].
Fragment Analysis: After each optimization test, reverse cross-links with Proteinase K (65°C, 2 hours), purify DNA by phenol:chloroform extraction and ethanol precipitation, and analyze fragment size distribution by agarose gel electrophoresis or Bioanalyzer [32].
Optimal Range: Target DNA fragments between 200-500 bp for histone mark studies. Adjust power settings and cycle numbers until this range is consistently achieved [31] [32].
Critical Notes:
- Over-sonication can damage epitopes and reduce ChIP signal [32]
- Heterochromatin regions may be resistant to sonication, reducing yield from these areas [32]
- Avoid foaming during sonication by beginning with low power settings and gradually increasing [32]
Enzymatic Digestion Optimization Protocol
Materials:
- Micrococcal nuclease (MNase)
- MNase digestion buffer (10mM Tris-HCl, 2.5mM CaCl₂, pH 7.4)
- EDTA (0.5M, pH 8.0)
- Chromatin extraction reagents
- Agarose gel or Bioanalyzer for quality assessment
Procedure:
- Chromatin Preparation: Isolate nuclei from cross-linked or native cells. For tissue samples, begin with effective homogenization using a Dounce homogenizer or gentleMACS Dissociator [22].
MNase Titration: Set up a series of reactions with constant chromatin concentration (from ~1×10⁶ cells) and varying MNase concentrations (0.5-5 units/100µL) or digestion times (5-30 minutes) at 37°C [33].
Reaction Termination: Stop digestion by adding EDTA to a final concentration of 10mM and placing samples on ice.
Fragment Analysis: Purify DNA as described in the sonication protocol and analyze fragment size distribution. Target the majority of fragments between 150-300 bp, characteristic of mononucleosomes [31].
Scale-up: Once optimal conditions are identified, scale up the reaction for the full experimental dataset.
Critical Notes:
- Over-digestion may lead to loss of nucleosome-free regions and preferential digestion of open chromatin [36]
- MNase has sequence preferences (AT-rich > GC-rich) that can introduce bias
- Include appropriate controls to ensure digestion efficiency across genomic regions
Table 2: Troubleshooting Common Fragmentation Issues
| Problem | Potential Causes | Solutions |
|---|---|---|
| Large fragment size | Insufficient sonication/digestion | Increase cycles/enzyme concentration; verify cell lysis efficiency |
| Over-fragmentation | Excessive sonication/digestion | Reduce treatment intensity; optimize time course |
| High background noise | Epitope damage or non-specific fragmentation | Use gentler conditions; include proper controls |
| Inconsistent results | Variable sample handling or enzyme activity | Standardize protocols; aliquot enzymes properly |
| Low chromatin yield | Heterochromatin resistance or inadequate processing | Optimize cell lysis; consider alternative methods |
Impact on Downstream Applications
The choice of fragmentation method significantly influences downstream ChIP-seq results, particularly for histone mark studies. Enzymatic digestion typically provides more precise nucleosome positioning data, which is crucial for understanding chromatin organization around specific histone modifications [34]. Comparative studies have demonstrated that enzyme-digested chromatin often shows more robust enrichment of target DNA loci than sonicated chromatin, particularly for challenging targets [34].
For sequencing library preparation, both methods require similar sequencing depth, though enzymatic digestion may benefit from paired-end sequencing as computational PCR deduplication becomes more challenging with this method [36]. The more defined fragment size distribution from enzymatic digestion can also improve library complexity and sequencing efficiency.
Recent advances in protocol refinement have addressed tissue-specific challenges in chromatin fragmentation, with optimized procedures for solid tissues demonstrating that proper homogenization and processing are critical to preserve tissue-specific chromatin features [22]. These improvements are particularly relevant for histone mark studies in disease contexts such as cancer research.
The Scientist's Toolkit
Table 3: Essential Research Reagent Solutions for Chromatin Fragmentation
| Reagent/Equipment | Function | Application Notes |
|---|---|---|
| Micrococcal Nuclease (MNase) | Enzymatic digestion of linker DNA | Requires calcium for activation; titration essential [34] [33] |
| Formaldehyde | Cross-linking protein-DNA interactions | Zero-length crosslinker; concentration and time require optimization [35] [33] |
| Protease Inhibitors | Preserve protein integrity during processing | Essential in lysis and fragmentation buffers [22] [33] |
| Dounce Homogenizer | Tissue disruption and homogenization | Particularly important for solid tissue samples [22] |
| Sonicator (Bath or Probe) | Mechanical chromatin shearing | Requires optimization for each cell/tissue type [32] |
| Proteinase K | Reverse cross-links and digest proteins | Required for DNA purification after fragmentation [31] [32] |
| Magnetic Beads | Immunoprecipitation of target complexes | Protein A/G beads for antibody capture [31] |
| Bioanalyzer/TapeStation | Fragment size distribution analysis | Essential for quality control pre- and post-fragmentation [31] |
Successful chromatin fragmentation for ChIP-seq studies of histone marks requires careful method selection and rigorous optimization. While both sonication and enzymatic digestion can yield high-quality results, enzymatic approaches offer particular advantages for histone mark research due to their ability to generate defined mononucleosomal fragments under gentle conditions. By following the detailed protocols and optimization strategies outlined in this application note, researchers can achieve reproducible chromatin fragmentation that forms the foundation for robust, high-resolution ChIP-seq data, ultimately advancing our understanding of chromatin dynamics in gene regulation and disease mechanisms.
Chromatin Immunoprecipitation followed by sequencing (ChIP-seq) has become the foundational method for mapping histone modifications and protein-DNA interactions genome-wide. However, successful epigenomic profiling from limited cell populations remains technically challenging due to inefficient chromatin recovery and amplification biases introduced during library preparation. This application note provides a comparative analysis of commercially available low-input ChIP-seq library preparation kits, evaluating their performance across different histone marks with varying enrichment patterns. We present optimized protocols for challenging samples, including solid tissues and low cell numbers, and provide a decision framework for selecting appropriate methodologies based on experimental goals, target epitopes, and input requirements. The data and protocols summarized herein empower researchers to generate high-quality epigenomic data from scarce samples, enabling studies of rare cell populations and precious clinical specimens.
ChIP-seq technology has revolutionized our understanding of epigenetic regulation by enabling genome-wide mapping of histone modifications, transcription factor binding sites, and chromatin-associated proteins. Since its development in 2007, ChIP-seq has largely replaced microarray-based approaches (ChIP-chip) due to its higher resolution, greater sensitivity, and ability to interrogate repetitive genomic regions [37]. The core methodology involves: (1) crosslinking proteins to DNA in living cells; (2) chromatin fragmentation; (3) immunoprecipitation of protein-DNA complexes with specific antibodies; (4) library preparation of immunoprecipitated DNA; and (5) high-throughput sequencing [5] [37].
A significant technical challenge in ChIP-seq experiments emerges when working with limited starting material. Lower input DNA necessitates increased PCR amplification cycles, which introduces amplification biases and increases rates of PCR duplicates, ultimately reducing library complexity and compromising data quality [38] [39]. These challenges are particularly pronounced when studying rare cell populations, clinical biopsies, or developing high-throughput screening approaches. This review systematically evaluates commercial low-input ChIP-seq library preparation kits and provides refined protocols to overcome these limitations, with particular emphasis on applications for histone mark research.
Comparative Performance of Commercial Low-Input ChIP-seq Kits
Kit Performance Across Histone Modification Types
Recent systematic comparisons have revealed that commercial ChIP-seq library preparation kits perform differently depending on the specific histone mark being investigated and the amount of input DNA available [38]. The performance of four commercial kits—NEBNext Ultra II (NEB), KAPA HyperPrep (Roche), MicroPlex (Diagenode), and NEXTflex (Bioo/PerkinElmer)—was evaluated across three representative targets: H3K4me3 (sharp peaks), H3K27me3 (broad domains), and CTCF (punctate peaks with well-defined binding motifs) at input levels ranging from 0.1 to 10 ng [38].
Table 1: Optimal Kit Selection Based on Histone Mark and Input DNA
| Histone Mark Type | Recommended Kit | Optimal Input Range | Key Performance Advantages |
|---|---|---|---|
| Sharp peaks (e.g., H3K4me3) | NEBNext Ultra II | 0.1-10 ng | Consistent performance across input levels; high sensitivity for discrete peak calling |
| Broad domains (e.g., H3K27me3) | NEXTflex | 1-10 ng | Superior coverage of extended genomic regions; not optimal at very low inputs (<1 ng) |
| Transcription factors (e.g., CTCF) | MicroPlex | 0.1-10 ng | Excellent for well-defined binding motifs; effective even at lowest input levels |
| Unknown targets | NEBNext Ultra II | 0.1-10 ng | Most consistent performer across different enrichment patterns |
The NEB protocol demonstrated robust performance for H3K4me3 marks and potentially other histone modifications with sharp peak enrichment patterns [38]. The Bioo NEXTflex kit showed advantages for H3K27me3 and other broad domain histone modifications, though its performance declined significantly at very low DNA inputs (below 1 ng) [38]. The Diagenode MicroPlex kit performed optimally for CTCF and potentially other transcription factors with well-defined binding motifs [38]. For experiments targeting novel proteins or histone modifications with unknown enrichment patterns, the NEB protocol is recommended as it performed consistently well across all three targets tested at various input levels [38].
Technical Considerations for Low-Input Workflows
Library preparation for ChIP-seq DNA requires specialized approaches compared to standard DNA library construction due to the limited amount of input material [40]. Key modifications include end repair to generate blunt ends, dA-tailing for adapter ligation (for Illumina platforms), and optimized PCR amplification to preserve library complexity [40]. The choice of library preparation method significantly impacts overall outcomes, particularly when working with ultra-low input levels (0.1-1 ng) [38].
Tagmentation-based approaches, such as ChIPmentation, have emerged as powerful alternatives to traditional ligation-based methods [39]. These methods utilize Tn5 transposase pre-loaded with sequencing adapters (tagmentation) to simultaneously fragment DNA and incorporate adapter sequences in a single reaction, significantly streamlining the workflow. High-throughput ChIPmentation (HT-ChIPmentation) further improves upon standard tagmentation by eliminating the DNA purification step prior to library amplification and reducing reverse-crosslinking time from hours to minutes [39]. This modification maintains high library complexity even with very low cell numbers (2,500-10,000 cells), with >75% unique reads reported down to 2,500 cells [39].
Detailed Methodologies for Low-Input ChIP-seq
Tissue Processing and Chromatin Preparation from Limited Material
Working with solid tissues presents additional challenges for ChIP-seq due to tissue heterogeneity, complex extracellular matrices, and difficulties in chromatin fragmentation [22]. The following protocol has been optimized for low-input scenarios with solid tissues, particularly relevant for clinical samples like colorectal cancer biopsies:
Table 2: Essential Reagents for Tissue ChIP-seq
| Reagent/Category | Specific Examples | Function |
|---|---|---|
| Crosslinking Reagents | Formaldehyde (37%), Glycine | Fix protein-DNA interactions; quench crosslinking reaction |
| Chromatin Preparation | PIPES, KCl, IGEPAL, Protease Inhibitors | Cell lysis, nuclei isolation, chromatin fragmentation protection |
| Immunoprecipitation | Protein G Magnetic Beads, ChIP-grade antibodies | Target-specific chromatin capture |
| Library Construction | NEBNext Ultra II FS DNA Library Prep Kit | End repair, dA-tailing, adapter ligation, PCR amplification |
Basic Protocol 1: Frozen Tissue Preparation and Homogenization [22]
Tissue Preparation: Transfer frozen tissue cryotubes from -80°C directly to ice. In a biosafety cabinet, place tissue in a Petri dish on ice and mince with sterile scalpel blades until finely diced.
Homogenization Options:
- Dounce Homogenization: Transfer minced tissue to a 7ml Dounce grinder on ice. Add 1ml cold PBS with protease inhibitors. Shear tissue with 8-10 even strokes of the A pestle.
- gentleMACS Dissociator: Transfer minced tissue to a C-tube on ice. Add 1ml cold PBS with protease inhibitors. Run the "htumor03.01" predefined program.
Cell Recovery: Rinse homogenizer with 2-3ml cold PBS with protease inhibitors and transfer to 50ml conical tubes. Centrifuge at 4°C to pellet cells.
Basic Protocol 2: Chromatin Immunoprecipitation from Low-Input Tissues [22]
Crosslinking: Add 1/10 volume of fresh 11% formaldehyde solution to cells and incubate at room temperature for 10 minutes. Quench with 1/20 volume of 2.5M glycine.
Cell Lysis: Resuspend cell pellet in SDS lysis buffer (1% SDS, 10mM EDTA, 50mM Tris pH 8.1) with protease inhibitors. Incubate on ice for 10 minutes.
Chromatin Shearing: Sonicate using a Bioruptor Plus (Diagenode) with 22 cycles of 30 seconds on/30 seconds off at high power. Repeat for a total of 44 cycles. Clear lysates by centrifugation.
Immunoprecipitation: Pre-block protein G magnetic beads with 0.5% BSA in PBS. Incubate beads with 2-15μg antibody overnight at 4°C. Wash beads and incubate with chromatin for 4 hours to overnight.
HT-ChIPmentation for Ultra-Low Input Samples
HT-ChIPmentation combines chromatin immunoprecipitation with tagmentation-based library preparation in a highly efficient workflow suitable for very low cell numbers (1,000-10,000 cells) [39]:
Cell Fixation and Sorting: Fix cells with 1% PFA. FACS sort defined numbers of fixed cells directly into SDS lysis buffer.
Chromatin Immunoprecipitation: Sonicate fixed cells for 12 cycles of 30 seconds on/30 seconds off. Incubate with antibody-bound beads (2μl beads with 0.6μg H3K27Ac or 0.3μg CTCF antibody for <10k cells).
Tagmentation: Wash bead-bound chromatin and resuspend in tagmentation buffer. Add Tn5 transposase and incubate at 37°C for 5-10 minutes.
Adapter Extension: Perform adapter extension directly on bead-bound chromatin in extension buffer (10mM Tris, 5mM MgCl₂, 10% DMF) at 58°C for 5 minutes.
Reverse Crosslinking and Library Amplification: Add reverse crosslinking buffer (1% SDS, 10mM EDTA, 50mM Tris pH 8.0) and Proteinase K. Incubate at 58°C for 30 minutes. Directly amplify the supernatant using PCR.
This streamlined protocol eliminates DNA purification steps before library amplification, significantly reducing material loss and enabling library preparation from just a few thousand cells while maintaining data quality comparable to standard protocols [39].
Library Construction for Sequencing
Basic Protocol 3: Library Construction for Low-Input DNA [26]
For standard ligation-based library preparation from 1ng of ChIP DNA:
End Repair and dA-Tailing: Use NEBNext Ultra II FS DNA Library Prep Kit according to manufacturer guidelines. The isolated ChIP DNA is treated to remove overhangs and add 5' phosphates and 3' hydroxyls, followed by dA-tailing before adapter ligation [40].
Adapter Ligation: Ligate Illumina adapters to the dA-tailed DNA using reduced reaction volumes to maximize efficiency.
Library Amplification: Amplify with 12-15 cycles of PCR using indexed primers for multiplexing. Excessive amplification should be avoided to prevent bias.
Size Selection and Quality Control: Purify libraries using AMPure XP beads. Assess library quality and concentration using Bioanalyzer or TapeStation.
Data Analysis and Quality Control for Low-Input ChIP-seq
Essential Bioinformatics Pipeline
A standardized bioinformatics workflow is crucial for analyzing low-input ChIP-seq data [3]:
Quality Control: Assess raw sequencing data quality using FastQC. Evaluate base quality scores, adapter contamination, and GC content.
Alignment: Map reads to reference genome using Bowtie2 with local alignment parameters to enable soft-clipping. For percentage of uniquely mapped reads, 70% or higher is considered good, while 50% or lower is concerning [3].
Post-Alignment Processing: Convert SAM to BAM format using samtools. Sort and filter BAM files to retain only uniquely mapping, non-duplicate reads using sambamba.
Peak Calling: Identify enriched regions using MACS2 with parameters adjusted for specific histone marks (broad mode for H3K27me3, narrow mode for H3K4me3 and CTCF).
Differential Binding Analysis: Compare samples quantitatively using specialized tools like MAnorm, which employs a robust normalization strategy based on common peaks between samples [41].
Unique Considerations for Low-Input Data
Low-input ChIP-seq datasets typically exhibit higher rates of PCR duplicates and reduced library complexity. The MAnorm tool addresses normalization challenges specific to ChIP-seq data by using common peaks as an internal reference, effectively controlling for differences in signal-to-noise ratios between samples [41]. This approach demonstrates strong correlation between quantitative binding differences and changes in target gene expression, validating its utility for revealing biologically meaningful results [41].
Visualization of Low-Input ChIP-seq Workflows
Comparative Workflow Diagram: Traditional vs. Tagmentation Approaches
Protocol Selection Decision Framework
The evolving landscape of low-input ChIP-seq technologies has significantly expanded our ability to probe chromatin dynamics from limited biological samples. Based on current comparative data, we recommend:
For sharp histone marks (H3K4me3): NEBNext Ultra II demonstrates consistent performance across a wide input range (0.1-10 ng).
For broad histone marks (H3K27me3): NEXTflex provides superior coverage of extended domains at inputs above 1 ng, while NEBNext is preferred for sub-nanogram inputs.
For transcription factor binding sites: Diagenode MicroPlex offers excellent resolution even at the lowest input levels.
For high-throughput applications or minimal cell numbers: HT-ChIPmentation provides the most efficient workflow, enabling single-day processing of thousands of cells with minimal material loss.
Successful low-input ChIP-seq requires careful consideration of the entire experimental workflow—from tissue processing and chromatin preparation to library construction and data analysis. The protocols and comparisons presented here provide a framework for selecting appropriate methodologies based on specific research needs, enabling robust epigenomic profiling from challenging sample types relevant to both basic research and drug development applications.
Chromatin Immunoprecipitation followed by sequencing (ChIP-seq) is an indispensable technique for generating genome-wide maps of histone modifications and transcription factor binding sites. The reliability of downstream biological conclusions in histone mark research critically depends on the quality of sequencing libraries. This application note provides detailed, step-by-step protocols for constructing robust ChIP-seq libraries compatible with both Illumina and MGI high-throughput sequencing platforms, enabling researchers to make informed platform selections based on their experimental requirements.
ChIP-seq Library Construction Workflow
The following diagram illustrates the core workflow for constructing ChIP-seq libraries, highlighting critical decision points for different sequencing platforms.
Platform-Specific Protocols
Core Library Preparation Steps
The initial stages of library construction are largely consistent across platforms, with procedural variations occurring primarily during adapter ligation and subsequent steps [42]:
- DNA End Repair: Convert fragmented DNA to blunt-ended, 5'-phosphorylated fragments using T4 DNA polymerase, T4 polynucleotide kinase, and Klenow fragment [43] [44].
- dA-Tailing (Illumina): Add a single 'A' base to the 3' ends of blunted fragments using Klenow exo- enzyme, preventing adapter concatemerization and preparing fragments for T-overhang adapter ligation [44].
- Adapter Ligation: Ligate platform-specific adapters containing sequencing primer binding sites and barcodes (indexes) to facilitate sample multiplexing [42] [45].
Illumina-Compatible Library Construction
For Illumina platforms, the standard protocol utilizes A-tailed ligation chemistry [44]:
Step-by-Step Protocol:
Input DNA Requirements:
Adapter Ligation:
- Use T4 DNA ligase with Illumina-specific adapters
- Reaction time: 15 minutes at room temperature
- Follow with purification to remove unligated adapters
Library Amplification & Indexing:
- Number of PCR cycles: 4–12 cycles (dependent on input)
- Use Illumina-compatible index primers for sample multiplexing
- Purify amplified library with magnetic beads
Quality Control:
- Assess library size distribution using Bioanalyzer/TapeStation
- Quantify by fluorometry (Qubit) and qPCR for accurate sequencing loading
Recommended Illumina Kits:
- Nextera XT: For 1 ng input, 5.5-hour procedure [45]
- Illumina DNA Prep: 3–4 hours, compatible with 1–500 ng input [45]
- TruSeq DNA Nano: 6 hours, optimized for 100 ng input [45]
MGI-Compatible Library Construction
MGI platforms require specific adapter sequences and employ DNA Nanoball (DNB) technology [46] [47]:
Step-by-Step Protocol:
Platform-Specific Adapter Ligation:
- Use MGI-compatible adapters with specific overhangs
- Apply T4 DNA ligase under manufacturer-recommended conditions
Post-Ligation Processing:
- Purify ligated products with magnetic beads
- Amplify with MGI-indexed primers (8–12 cycles)
- Perform dual size selection to optimize insert distribution
DNA Nanoball (DNB) Generation:
- Convert linear DNA libraries to single-stranded circular templates
- Perform rolling circle amplification to generate DNBs
- Load DNBs onto MGI patterned flow cells
Quality Control:
- Validate library size distribution (typically 200–500 bp)
- Quantify by fluorometry and qPCR
- Assess circularization efficiency if required
Recommended MGI Kits:
- MGIEasy Universal Library Prep Set: Compatible with various input types [46]
- MGIEasy Fast Hybridization and Wash Kit: For exome capture applications [46]
Specialized Methods for Low-Input ChIP-seq
Histone mark studies often face material limitations. The following methods enable library construction from minimal ChIP DNA:
This versatile approach enables library construction from as little as 25 pg of input DNA:
Poly-C Tailing:
- Use terminal deoxynucleotidyl transferase (TDT) to add poly-C tails
- Incubate at 37°C for 35 minutes
Anchor Primer Extension:
- Add biotin-labeled anchor primer with 9 consecutive Gs
- Extension program: 95°C for 3 min; 47°C for 1 min, 68°C for 2 min (16 cycles)
Bead Capture & Ligation:
- Capture extension products using streptavidin magnetic beads
- Ligate platform-specific adapters
Final Amplification:
- Perform 12–15 PCR cycles with indexed primers
- Purify final library for sequencing
Performance Comparison of Library Preparation Methods
Quantitative Assessment of Low-Input Methods
Table 1: Performance metrics of ChIP-seq library preparation methods tested with 1 ng and 0.1 ng input H3K4me3 ChIP DNA [18]
| Method | Input DNA | Sensitivity (%) | Specificity (%) | Library Complexity | Unique Reads (%) |
|---|---|---|---|---|---|
| Accel-NGS 2S | 1 ng | >95 | >95 | High | Highest |
| Accel-NGS 2S | 0.1 ng | >90 | >90 | High | Highest |
| ThruPLEX | 1 ng | >95 | >95 | High | High |
| ThruPLEX | 0.1 ng | >90 | >90 | Medium-High | High |
| TELP | 1 ng | >90 | >90 | High | High |
| TELP | 0.1 ng | >85 | >85 | Medium-High | Medium-High |
| DNA SMART | 1 ng | >90 | >85 | Medium | Medium |
| DNA SMART | 0.1 ng | >85 | >80 | Medium | Medium |
| SeqPlex | 1 ng | ~80 | ~80 | Medium | Medium |
| SeqPlex | 0.1 ng | ~75 | ~75 | Low | Low |
| PCR-Free (Reference) | 100 ng | 100 | 100 | Highest | Highest |
Platform-Specific Performance Metrics
Table 2: Comparison of library construction characteristics across Illumina and MGI platforms
| Parameter | Illumina Systems | MGI Systems |
|---|---|---|
| Adapter Ligation | A-tailed ligation | Specific blunt-end or TA ligation |
| Amplification Requirement | Most kits require PCR (except PCR-free) | PCR typically required |
| Multiplexing Capacity | High (various index combinations) | High (UDB dual indexing) |
| Typical Input Range | 1 pg - 1 μg (kit-dependent) | 1 ng - 1 μg |
| Hands-on Time | 3-6 hours (varies by kit) | 3-4 hours |
| Automation Compatibility | High (various robotic systems) | High (MGISP-960 system) |
| Optimal Insert Size | 350-550 bp | 300-450 bp |
| Library Conversion | Not typically required | Possible from Illumina libraries |
Research Reagent Solutions
Table 3: Essential reagents and kits for ChIP-seq library construction
| Reagent/Kits | Function | Platform Compatibility | Key Features |
|---|---|---|---|
| Illumina DNA Prep | Library construction | Illumina | 3-4 hours, 1-500 ng input |
| Illumina TruSeq DNA Nano | Library construction | Illumina | 6 hours, 100 ng input, high complexity |
| IDT xGen DNA EZ Library Prep | Library construction | Illumina | <2 hours, 100 pg-1 μg input |
| MGIEasy Universal Library Prep Set | Library construction | MGI | Automated processing, UDB indexing |
| NEB Next Ultra II DNA Library Prep | Library construction | Illumina | 3 hours, high efficiency ligation |
| Terminal Deoxynucleotidyl Transferase | Homopolymer tailing | Both | Essential for TELP method |
| Streptavidin C1 Beads | Nucleic acid capture | Both | Used in TELP and capture-based methods |
| MGIEasy Fast Hybridization Kit | Target enrichment | MGI | 1-hour hybridization, exome capture |
Advanced Applications: Micro-C-ChIP for 3D Chromatin Architecture
Recent innovations combine ChIP with chromatin conformation capture techniques. The Micro-C-ChIP method enables mapping of 3D genome organization for specific histone modifications at nucleosome resolution [9]:
Workflow Overview:
- Dual Crosslinking: Stabilize protein-DNA and protein-protein interactions
- MNase Digestion: Fragment chromatin to nucleosome-resolution
- Proximity Ligation: Join spatially adjacent DNA fragments
- Chromatin Immunoprecipitation: Enrich for specific histone modifications (H3K4me3, H3K27me3)
- Library Construction: Prepare sequencing libraries using Illumina or MGI-compatible methods
This advanced method significantly reduces sequencing costs by focusing on histone mark-specific interactions while providing high-resolution contact maps, making it particularly valuable for time-course experiments and large cohort studies.
Successful ChIP-seq library construction for histone mark research requires careful selection of appropriate methods based on starting material, available resources, and sequencing platform. For standard inputs (>10 ng), conventional ligation-based methods provide excellent results, while low-input scenarios (<1 ng) benefit from specialized methods like TELP, Accel-NGS 2S, or ThruPLEX. Platform choice depends on institutional infrastructure, with both Illumina and MGI platforms producing high-quality data when libraries are prepared with platform-optimized protocols. The provided step-by-step guidelines enable researchers to generate robust ChIP-seq libraries for reliable identification of genome-wide histone modification patterns.
Chromatin Immunoprecipitation followed by sequencing (ChIP-seq) has become the gold standard method for genome-wide mapping of histone modifications, providing critical insights into the epigenetic regulation of gene expression. Within this framework, the preparation of high-quality sequencing libraries is a pivotal step that directly determines the success and reliability of the entire experiment. For researchers investigating histone marks, rigorous quality control (QC) at multiple stages of library preparation is not merely optional but essential for generating biologically meaningful data. This application note details the critical QC checkpoints—focusing on library yield, size, and complexity—that researchers must implement to ensure the integrity of their ChIP-seq data within the broader context of histone mark research. The procedures outlined here are designed to help scientists and drug development professionals overcome common challenges associated with library preparation, thereby enhancing the reproducibility and accuracy of their epigenetic studies.
The Scientist's Toolkit: Essential Reagents for ChIP-seq QC
Successful ChIP-seq library preparation and quality control rely on a foundation of specific, high-quality reagents. The following table catalogues the essential materials and their functions for assessing library yield, size, and complexity.
Table 1: Key Research Reagent Solutions for ChIP-seq Library QC
| Reagent/Material | Function in QC Process |
|---|---|
| ChIP-grade Antibodies (e.g., H3K4me3, H3K27me3) [5] | Specific immunoprecipitation of target histone-marked chromatin; primary determinant of experimental specificity. |
| NEBNext Ultra II FS DNA Library Prep Kit [26] | Preparation of sequencing-ready libraries from low-input ChIP DNA; impacts final library complexity and yield. |
| Protease Inhibitors (Aprotinin, Leupeptin, PMSF) [5] | Preserve chromatin integrity during extraction and processing by inhibiting endogenous proteases. |
| IP Dilution & Lysis Buffers [5] | Create optimal conditions for immunoprecipitation and chromatin fragmentation, affecting background noise and signal-to-noise ratio. |
| DNA Clean-up Kits (e.g., QIAquick) [5] | Purify DNA after immunoprecipitation and during library prep; crucial for removing enzymes and salts that inhibit downstream steps. |
| DNase-free RNase A [5] | Removes RNA contamination from the immunoprecipitated DNA sample, preventing false positives during sequencing. |
| Size Selection Beads (e.g., SPRI) | Post-library preparation purification to select for optimal fragment sizes (e.g., 200-500 bp), removing adapter dimers and overly large fragments. |
| High-Sensitivity DNA Assay Kits (e.g., for Qubit, Bioanalyzer) | Precisely quantify and profile the size distribution of final libraries, providing key QC metrics for yield and size. |
Critical Quality Control Checkpoints
A robust ChIP-seq QC protocol requires verification at multiple stages. The following workflow diagram outlines the key decision points in the process.
Checkpoint 1: Post-Immunoprecipitation DNA Assessment
Before library construction, the quantity and quality of the immunoprecipitated DNA must be evaluated.
- Procedure for DNA Quantification: Transfer 1-2 µL of the purified ChIP DNA to a tube for analysis. Using a fluorometric method (e.g., Qubit with dsDNA HS Assay) is critical, as it is more accurate for low-concentration samples and less susceptible to contaminants like RNA or salts compared to spectrophotometry (NanoDrop) [5]. Record the concentration in ng/µL. A successful H3K4me3 ChIP from one million cells typically yields 5-50 ng of DNA, but this can vary based on the abundance of the target mark.
Checkpoint 2: Post-Library Preparation Assessment
After adapter ligation and PCR amplification, the final library must be characterized for yield, size distribution, and complexity.
Protocol for Library Quantification and Size Profiling:
- Quantify Yield: Dilute 1 µL of the final library and measure its concentration using a Qubit dsDNA HS Assay. This provides the absolute concentration necessary for calculating pooling volumes for sequencing.
- Profile Size Distribution: Use a high-sensitivity instrument such as the Agilent Bioanalyzer or Fragment Analyzer. Load 1 µL of the diluted library onto a High-Sensitivity DNA chip. The resulting electrophoretogram should show a dominant peak in the 200-500 bp range, which represents the adapter-ligated fragments. A small peak around 125 bp indicates primer dimers, which can compete during sequencing and should be minimized [18].
Assessing Library Complexity: Library complexity refers to the number of unique DNA molecules in the library, which is vital for achieving sufficient sequencing depth. Low complexity, often resulting from excessive PCR amplification, leads to a high proportion of duplicate reads. Use computational tools like
Preseqto predict the complexity and potential yield of the library upon deeper sequencing [18]. A high-quality library will show a curve that continues to rise with increased sequencing depth, indicating a reservoir of unique molecules.
Checkpoint 3: Post-Sequencing Data Assessment
Once the library is sequenced, initial bioinformatic analyses provide the final and most comprehensive QC metrics.
Analysis of Mapping and Duplication:
- Process raw sequencing reads with a trimmer like
Trimmomaticto remove adapter sequences and low-quality bases [26]. - Align the cleaned reads to the reference genome using an aligner such as
BWA[26] [30]. - Calculate the percentage of reads that map uniquely to the genome. A low mapping rate (<70-80%) can indicate poor library quality or contamination.
- Use tools like
samtoolsto mark and remove PCR duplicates. A high duplicate rate (>20-50%, depending on sequencing depth) is a direct indicator of low library complexity [18] [30].
- Process raw sequencing reads with a trimmer like
Strand Cross-Correlation Analysis: This is a ChIP-specific QC metric that assesses the enrichment of genuine protein-DNA interactions.
- Run a tool like
phantompeakqualtoolson the aligned BAM file [30]. - The tool calculates two key metrics: the Normalized Strand Coefficient (NSC) and the Relative Strand Coefficient (RSC).
- Interpretation: For a high-quality transcription factor or histone mark ChIP, a high NSC (>1.05) and RSC (>0.8) are expected. An RSC value below 0.8 generally indicates a failed experiment with little enrichment [30].
- Run a tool like
Quantitative QC Standards and Performance
The following table synthesizes performance data from a comparative study of library preparation methods, providing benchmarks for researchers to evaluate their own libraries [18].
Table 2: Performance Metrics of Low-Input ChIP-seq Library Methods (1 ng Input, H3K4me3)
| Library Prep Method | Sensitivity (%) | Specificity (%) | Peaks Called (vs. Reference) | Notes on Performance |
|---|---|---|---|---|
| Accel-NGS 2S | >90 | >90 | ~18,000 - 21,000 | High sensitivity & specificity; high library complexity. |
| ThruPLEX | >90 | >90 | ~18,000 - 21,000 | High sensitivity & specificity; consistent performer. |
| DNA SMART | >90 | ~85 | ~18,000 - 21,000 | Good sensitivity, slightly lower specificity. |
| TELP | >90 | ~85 | ~18,000 - 21,000 | Good sensitivity, slightly lower specificity. |
| SeqPlex | ~80 | <80 | >35,000 | Lower sensitivity; higher background noise and false positives. |
| PCR-Free (Reference) | 100 | 100 | ~19,000 | Gold standard for minimum bias. |
Rigorous quality control is the cornerstone of a successful ChIP-seq experiment for histone mark research. By systematically implementing the described checkpoints for library yield, size, and complexity—from initial DNA quantification to post-sequencing bioinformatic analysis—researchers can confidently generate high-quality, reproducible data. Adherence to these protocols empowers scientists to draw robust biological conclusions about the epigenetic landscape, which is indispensable for both basic research and the discovery of novel therapeutic targets in drug development.
Solving Common ChIP-seq Problems: A Troubleshooting Guide for Histone Marks
In chromatin immunoprecipitation followed by sequencing (ChIP-seq), background noise presents a significant challenge that can obscure true biological signals, leading to misinterpretation of protein-DNA interactions and histone modification patterns. High background manifests as non-specific DNA enrichment, reduced signal-to-noise ratios, and false-positive peak calling, ultimately compromising data reliability and reproducibility. For researchers investigating histone marks, which are crucial regulators of gene expression and epigenetic inheritance, ensuring high-quality data is paramount. Background noise in ChIP-seq primarily originates from non-specific antibody binding, inefficient chromatin fragmentation, and suboptimal buffer conditions that fail to adequately wash away unbound cellular components [35] [48]. This application note details evidence-based strategies focusing on pre-clearing techniques and buffer optimization to mitigate these issues, providing robust protocols for generating publication-quality ChIP-seq data for histone mark research.
The complex nature of ChIP-seq introduces multiple potential sources of background noise throughout the experimental workflow. A thorough understanding of these sources is essential for effective troubleshooting and optimization.
Table 1: Primary Sources of Background Noise in ChIP-seq
| Noise Source | Impact on Data | Manifestation in Results |
|---|---|---|
| Non-specific Antibody Binding | Binds to non-target epitopes or directly to beads, enriching irrelevant DNA sequences. | Diffuse, weak peaks across the genome; high background in genome browser tracks. |
| Inefficient Chromatin Shearing | Produces large chromatin fragments that non-specifically entrap DNA. | Broad, poorly defined peaks; reduced peak resolution. |
| Insufficient Washing Stringency | Fails to remove non-specifically bound chromatin complexes after immunoprecipitation. | High background across all genomic regions; reduced signal-to-noise ratio. |
| Suboptimal Crosslinking | Over-crosslinking can mask epitopes and increase chromatin stickiness. | Reduced overall signal; increased non-specific background. |
Traditional ChIP-seq protocols, while powerful, are particularly prone to these issues due to multiple handling steps and the requirement for large cell inputs (typically millions of cells) [48]. The inherent limitations of standard formaldehyde crosslinking can exacerbate noise; formaldehyde's zero-length crosslinking chemistry (~2 Å) effectively captures direct protein-DNA interactions but poorly stabilizes protein complexes, potentially leading to the dissociation of indirectly bound factors and increased variability [8]. Furthermore, the sonication process can generate heterochromatin bias, as open chromatin regions are more easily fragmented than compacted regions, skewing representation [15].
Diagram: Logical relationship mapping primary noise sources in ChIP-seq experiments to their impact on final data quality. Addressing these sources through pre-clearing and buffer optimization is crucial for reliable results.
Strategic Approach I: Pre-clearing Methodologies
Pre-clearing is a proactive strategy to reduce background noise by removing chromatin fragments and cellular debris that exhibit non-specific binding tendencies before immunoprecipitation. This step minimizes competition for antibody binding sites and bead surfaces, leading to cleaner specific signals.
Bead-Based Pre-clearing Protocol
The following protocol is optimized for histone mark ChIP-seq and should be performed after chromatin shearing and prior to antibody incubation.
Materials Required:
- Protein A/G magnetic beads (untreated, without antibody)
- Pre-clearing buffer: RIPA-150 (50 mM Tris-HCl pH 8.0, 150 mM NaCl, 1 mM EDTA, 0.1% SDS, 1% Triton X-100, 0.1% sodium deoxycholate) [49]
- Sheared chromatin sample
- Rotating mixer at 4°C
- Magnetic rack
Step-by-Step Procedure:
- Bead Preparation: Transfer 20 µL of a 50:50 slurry of Protein A and Protein G magnetic beads to a clean microcentrifuge tube for each ChIP sample. Place the tube on a magnetic rack for ~1 minute, then carefully aspirate and discard the storage solution.
- Bead Washing: Wash the beads twice with 1 mL of ice-cold PBS. Remove the tube from the magnetic rack, resuspend the beads in PBS, return to the rack, and aspirate the supernatant once the beads have collected.
- Bead Blocking: Resuspend the washed beads in 1 mL of blocking buffer (0.5% w/v BSA in RIPA-150 with 1x protease inhibitors). Incubate for 30 minutes at 4°C with gentle rotation.
- Final Wash: Wash the blocked beads twice with 1 mL of RIPA-150 buffer, using the magnetic rack for separation.
- Pre-clearing Incubation: Resuspend the final bead pellet in 500 µL of RIPA-150. Add the entire volume of sheared chromatin (from ~1x10^7 cells, resuspended in 350 µL sonication buffer) to the beads. Incubate for 1-2 hours at 4°C with gentle rotation.
- Chromatin Recovery: Place the tube on a magnetic rack for 2 minutes to fully capture the beads. Carefully transfer the supernatant (the pre-cleared chromatin) to a new tube, avoiding bead transfer. The chromatin is now ready for immunoprecipitation.
This bead-based pre-clearing step effectively removes components that bind non-specifically to the Protein A/G matrix, significantly reducing one major source of background noise [35] [49]. The choice of RIPA-150 buffer for this step provides sufficient stringency to remove weakly interacting contaminants without disrupting genuine chromatin complexes.
Alternative Pre-clearing Strategies
For samples with persistently high background, sequential pre-clearing can be employed. This involves a second round of pre-clearing with fresh beads, which may be necessary for tissues with high lipid content or complex nuclear structures. Additionally, for non-histone targets where different buffer conditions are required, the pre-clearing buffer can be modified to match the immunoprecipitation buffer, ensuring compatibility.
Strategic Approach II: Buffer Optimization Strategies
The composition and stringency of buffers used throughout the ChIP-seq workflow critically influence background levels. Optimized buffers maintain the integrity of specific interactions while efficiently washing away non-specifically bound material.
Comprehensive Buffer Formulations
Table 2: Optimized ChIP-seq Buffer Recipes for Low Background
| Buffer Name | Composition | Function & Rationale |
|---|---|---|
| Nuclear Extraction Buffer 1 [49] | 50 mM HEPES-NaOH pH 7.5, 140 mM NaCl, 1 mM EDTA, 10% Glycerol, 0.5% NP-40, 0.25% Triton X-100, 1x Protease Inhibitors. | Initial Lysis: Gently lyses plasma membrane while keeping nuclei intact. Detergents remove cytoplasmic proteins that cause non-specific binding. |
| Nuclear Extraction Buffer 2 [49] | 10 mM Tris-HCl pH 8.0, 200 mM NaCl, 1 mM EDTA, 0.5 mM EGTA, 1x Protease Inhibitors. | Nuclear Wash: Higher salt concentration removes loosely associated nuclear proteins and nuclear membrane components. |
| Sonication Buffer (Histones) [49] | 50 mM Tris-HCl pH 8.0, 10 mM EDTA, 1% SDS, Protease Inhibitors. | Chromatin Shearing: SDS efficiently solubilizes chromatin for consistent shearing. EDTA inhibits nucleases. |
| Low Salt Wash Buffer | 20 mM Tris-HCl pH 8.0, 150 mM NaCl, 2 mM EDTA, 1% Triton X-100, 0.1% SDS. | 1st IP Wash: Removes non-specific, ionic interactions without disrupting antibody-antigen bonds. |
| High Salt Wash Buffer | 20 mM Tris-HCl pH 8.0, 500 mM NaCl, 2 mM EDTA, 1% Triton X-100, 0.1% SDS. | 2nd IP Wash: High NaCl concentration disrupts hydrophobic and non-specific protein-protein interactions. |
| LiCl Wash Buffer | 10 mM Tris-HCl pH 8.0, 250 mM LiCl, 1 mM EDTA, 0.5% NP-40, 0.5% Sodium Deoxycholate. | 3rd IP Wash: Chaotropic salt and different detergents remove residual contaminants that survive earlier washes. |
| TE Wash Buffer | 10 mM Tris-HCl pH 8.0, 1 mM EDTA. | Final IP Wash: Low-salt, detergent-free buffer prepares chromatin for elution by removing leftover wash salts/detergents. |
Advanced Double-Crosslinking Strategy
For challenging targets or complex tissues, a double-crosslinking approach (dxChIP-seq) can significantly enhance signal-to-noise ratio by improving the capture of protein complexes. This method is particularly valuable for histone modifications that involve reader complexes or are found in large chromatin domains [8].
dxChIP-seq Crosslinking Protocol:
- DSG Crosslinking: Prepare a fresh 1.66 mM disuccinimidyl glutarate (DSG) solution in DMSO diluted in PBS. Incubate cells with DSG for 18 minutes at room temperature with gentle agitation. DSG is a homobifunctional NHS-ester crosslinker with a ~7.7 Å spacer that efficiently stabilizes protein-protein interactions [8].
- Quenching: Remove DSG solution and wash cells once with PBS.
- Formaldehyde Crosslinking: Add 1% formaldehyde (methanol-free) and incubate for 8 minutes at room temperature. Formaldehyde provides the zero-length (~2 Å) crosslinks needed for protein-DNA capture.
- Quenching: Add glycine to a final concentration of 125 mM and incubate for 5 minutes to quench the crosslinking reaction.
- Washing: Wash cells twice with ice-cold PBS before proceeding to nuclear extraction.
This sequential crosslinking strategy first "locks" protein complexes with DSG before stabilizing protein-DNA interactions with formaldehyde, leading to more complete capture of chromatin-associated complexes and reduced loss of target material during washing steps, thereby improving the signal-to-noise ratio [8].
Integrated Low-Noise ChIP-seq Workflow
The following workflow integrates pre-clearing and optimized buffers into a complete, low-noise ChIP-seq protocol for histone marks.
Diagram: Integrated ChIP-seq workflow highlighting the critical noise-reduction steps of pre-clearing and stringent washing within the complete experimental process.
Quality Assessment and Validation
After implementing noise-reduction strategies, rigorous quality control is essential. For histone mark ChIP-seq, the enrichment should be significantly higher than background controls. Quantitative PCR (ChIP-qPCR) of known positive and negative genomic regions provides initial validation [48] [15]. Subsequently, sequencing data should be evaluated using established metrics. High-quality H3K27ac data, for instance, should show strong enrichment at active promoters and enhancers. Compare the fraction of reads in peaks (FRiP) to historical controls or public datasets like ENCODE; a FRiP score >0.3 is generally indicative of successful histone mark ChIP [15]. Visual inspection in a genome browser should show sharp, well-defined peaks for marks like H3K27ac and H3K4me3, and broader domains for H3K27me3, with low background between peaks.
Table 3: Key Research Reagent Solutions for Low-Noise ChIP-seq
| Reagent Category | Specific Product Examples | Function & Selection Criteria |
|---|---|---|
| ChIP-Grade Antibodies | Cell Signaling Technology RPB1 (total) N-terminal [8]; Abcam ab4729 (H3K27ac) [15]. | High specificity for target epitope is paramount. Use antibodies validated for ChIP-seq with cited performance data. |
| Magnetic Beads | Protein G Dynabeads [8]; Protein A/G magnetic beads [49]. | Consistent size and binding capacity for efficient IP and pre-clearing. Reduce non-specific binding. |
| Crosslinkers | 16% Formaldehyde, methanol-free (Thermo Scientific 28908) [8]; DSG (Thermo Scientific 20593) [8]. | High-purity, fresh crosslinkers are essential for efficient and reproducible fixation. |
| Protease Inhibitors | cOmplete Protease Inhibitor Cocktail (Roche) [8]. | Prevents proteolytic degradation of histone marks and transcription factors during processing. |
| Library Prep Kits | NEBNext Ultra II DNA Library Prep Kit [8]. | Optimized for efficient conversion of low-input ChIP DNA into high-complexity sequencing libraries. |
| Spike-In Controls | Spike-in chromatin (Active Motif 53083) & antibody (61686) [8]. | Enable normalization and quantitative comparisons between samples by controlling for technical variation. |
Concluding Remarks
Mitigating background noise is not merely a technical exercise but a fundamental requirement for generating biologically meaningful ChIP-seq data. The integrated application of bead-based pre-clearing and meticulously optimized buffer systems provides a robust framework for significantly improving signal-to-noise ratios in histone mark studies. The protocols and formulations detailed here, including the advanced double-crosslinking strategy, offer researchers a comprehensive toolkit for tackling the pervasive challenge of background noise. By systematically implementing these strategies, scientists can enhance the reliability, reproducibility, and quantitative power of their epigenomic studies, thereby accelerating discovery in gene regulation, development, and disease mechanisms.
For researchers mapping histone modifications, low signal-to-noise ratio is a pervasive challenge that can compromise data quality, leading to reduced sensitivity in peak calling and unreliable biological interpretations. This issue is particularly acute when working with complex samples such as solid tissues or rare cell populations, where material is limited [22]. The optimization of wet-lab procedures—specifically cross-linking, immunoprecipitation, and sonication—is paramount to success. Within the broader context of ChIP-seq library preparation for histone marks research, a meticulously optimized protocol ensures that the resulting libraries accurately represent the in vivo chromatin landscape, providing a solid foundation for downstream analysis and drug discovery efforts.
Quantitative Foundations: Key Parameter Optimization
Systematic studies have identified optimal ranges for critical ChIP-seq parameters. Adhering to these guidelines significantly improves signal strength and data reproducibility.
Table 1: Optimal Sonication Parameters for High-Quality ChIP-seq
| Parameter | Recommended Range | Impact on Quality | Supporting Evidence |
|---|---|---|---|
| Fragment Length | 100–300 bp [2] | Under-sonication: Risk of losing sites for some TFs (e.g., TAL1, POL2).Over-sonication: Consistently reduces ChIP-seq quality for all factors [50]. | Systematic study in mouse erythroid cells [50]. |
| Chromatin Shearing | Focused ultrasonication [51] | Ensures appropriate fragment size distribution for efficient immunoprecipitation and sequencing. | Protocol for double-crosslinking ChIP-seq [51]. |
Table 2: Performance of Low-Input Library Preparation Kits for Histone Marks
| Library Prep Method | H3K4me3 (Sharp Peaks) | H3K27me3 (Broad Domains) | General Performance |
|---|---|---|---|
| Accel-NGS 2S | High sensitivity & specificity, high library complexity at 0.1 ng input [18] | Information not specified | Best overall performance in low-input (0.1 ng) study [18] [38]. |
| ThruPLEX | High sensitivity & specificity [18] | Information not specified | Second-best performance in low-input study [38]. |
| NEB NEBNext Ultra II | Recommended for sharp peaks [38] | Good performance across input levels [38] | Consistent performer across different targets and input levels [38]. |
| Bioo NEXTflex | Not the best for sharp peaks [38] | Best for broad domains (at inputs ≥1 ng) [38] | Performance drops at very low DNA levels (0.1 ng) [38]. |
| Diagenode MicroPlex | Information not specified | Information not specified | Recommended for transcription factors like CTCF; suitable for low input [38]. |
Optimized Experimental Protocols
Protocol: Double-Crosslinking for Enhanced Detection
Double-crosslinking is a powerful strategy to stabilize protein-DNA complexes, particularly beneficial for capturing challenging chromatin targets or indirect interactions.
Summary of Steps: Cells are first cross-linked with a protein-protein cross-linker (e.g., DSG), followed by a second cross-linking step with formaldehyde to fix protein-DNA interactions. This two-step process helps to capture both direct and indirect binders [51].
Detailed Procedure:
- Prepare Cells: Harvest and wash adherent cells or tissue homogenates with cold PBS.
- First Cross-linking: Resuspend cell pellet in a buffer containing Disuccinimidyl Glutarate (DSG) at a recommended concentration. Incubate for a defined period (e.g., 45 minutes) at room temperature.
- Quenching: Quench the DSG reaction by adding Tris-HCl (pH 7.5) to a final concentration of 100 mM. Incubate for 15 minutes at room temperature.
- Second Cross-linking: Add formaldehyde (e.g., 1% final concentration) and incubate for a further 10-15 minutes at room temperature.
- Quenching: Quench the formaldehyde reaction by adding glycine to a final concentration of 125 mM and incubate for 5-10 minutes.
- Wash and Pellet: Centrifuge the cells and wash the pellet twice with cold PBS. The double-cross-linked cell pellet can now be used for chromatin extraction or frozen at -80°C for future use [51].
Protocol: Chromatin Extraction and Sonication from Solid Tissues
Working with tissues presents unique challenges due to cellular heterogeneity and dense matrices. This refined protocol ensures high-quality chromatin extraction.
Summary of Steps: Frozen tissue is minced and homogenized, followed by cross-linking and chromatin shearing. The protocol emphasizes maintaining cold conditions to preserve chromatin integrity [22].
Detailed Procedure:
- Tissue Preparation:
- Retrieve frozen tissue from -80°C and place immediately on ice.
- In a biosafety cabinet, mince the tissue on a Petri dish resting on ice using two sterile scalpels until it is finely diced.
- Homogenization (Two Options):
- Dounce Homogenization: Transfer minced tissue to a 7 ml Dounce grinder on ice. Add 1 ml of cold PBS with protease inhibitors. Shear the tissue with 8-10 even strokes of the pestle.
- GentleMACS Dissociator: Transfer minced tissue to a gentleMACS C-tube on ice. Add 1 ml of cold PBS with protease inhibitors. Run the preconfigured "htumor03.01" program.
- Cross-linking: Add formaldehyde to the homogenate (e.g., 1% final concentration) and incubate for 10-15 minutes. Quench with glycine.
- Chromatin Extraction: Pellet the cells and lyse them using an appropriate SDS lysis buffer.
- Chromatin Shearing:
- Shear the chromatin using a focused ultrasonicator (e.g., Diagenode Bioruptor).
- Critical Optimization: The extent of sonication must be optimized and monitored. An example shearing protocol is 22 cycles of 30 seconds "on" and 30 seconds "off" at high power, 4°C, repeated twice with a 15-minute rest on ice in between [38].
- Quality Control: Purify a small aliquot of sheared chromatin and analyze it using an Agilent Bioanalyzer to confirm the fragment size distribution is in the optimal 100-300 bp range [22] [38] [50].
Protocol: Immunoprecipitation and DNA Purification
This stage is critical for specific enrichment of target histone marks while minimizing background.
Summary of Steps: Sheared chromatin is incubated with a validated antibody, followed by capture using Protein A/G beads, stringent washing, and DNA purification [51] [22].
Detailed Procedure:
- Pre-clear Chromatin: Incubate sheared chromatin with Protein A or G beads for ~1 hour at 4°C to reduce non-specific binding. Centrifuge to remove the beads.
- Immunoprecipitation:
- Take a portion of the pre-cleared chromatin as "Input" and store at 4°C.
- Add the specific, validated antibody against your histone mark (e.g., H3K4me3) to the remaining chromatin. Incubate overnight at 4°C with rotation.
- Capture Complexes: The next day, add Protein A or G beads to the chromatin-antibody mixture and incubate for 2-4 hours at 4°C with rotation.
- Stringent Washes: Pellet the beads and carefully wash them with a series of cold wash buffers (e.g., Low Salt Immune Complex Wash Buffer, High Salt Immune Complex Wash Buffer, LiCl Immune Complex Wash Buffer, and TE Buffer) to remove non-specifically bound material.
- Elution and Reverse Cross-linking: Elute the immunoprecipitated material from the beads using a freshly prepared elution buffer (e.g., 1% SDS, 0.1 M NaHCO3). Combine the eluates and reverse the cross-links by adding NaCl and incubating at 65°C for several hours or overnight.
- DNA Purification: Treat the sample with RNase A and Proteinase K. Purify the DNA using a commercial PCR purification kit or by phenol-chloroform extraction. The purified DNA is now ready for library preparation [51] [22].
Workflow Visualization: Double-Crosslinking ChIP-seq
The following diagram illustrates the integrated workflow for an optimized double-crosslinking ChIP-seq protocol, incorporating the key steps and optimizations detailed in this note.
The Scientist's Toolkit: Essential Research Reagents
The selection of appropriate reagents is non-negotiable for achieving robust and reproducible ChIP-seq results.
Table 3: Essential Reagents for Optimized ChIP-seq
| Reagent / Kit | Function | Application Note |
|---|---|---|
| Validated Antibody | Specific immunoenrichment of target histone mark. | Primary test: >50% signal in immunoblot or expected immunofluorescence pattern [2]. |
| Protein A/G Beads | Capture of antibody-target complexes. | Ensure compatibility with antibody species and isotype. |
| Double-Crosslinkers | Stabilize multi-protein DNA complexes. | DSG (protein-protein) followed by formaldehyde (protein-DNA) [51]. |
| Protease Inhibitors | Prevent protein degradation during processing. | Must be added fresh to all buffers during cell lysis and chromatin prep. |
| Low-Input Library Prep Kits | Amplify limited ChIP DNA for sequencing. | Accel-NGS 2S and ThruPLEX show high performance for 0.1 ng input [18] [38]. |
| NEB NEBNext Ultra II | Library preparation. | Consistent performer for various marks (H3K4me3, H3K27me3) and input levels [38]. |
| Diagenode MicroPlex | Library preparation for low input. | Recommended for transcription factors; suitable for low-input studies [38]. |
| DNase-free RNase A | Degrade RNA in the purified ChIP DNA. | Prevents RNA contamination from interfering with library prep. |
| Proteinase K | Digest proteins after reverse cross-linking. | Essential for efficient release and purification of ChIP DNA. |
Chromatin Immunoprecipitation followed by sequencing (ChIP-seq) has become the gold standard method for genome-wide mapping of histone modifications and protein-DNA interactions. However, a significant technical challenge persists when working with limited biological material or samples that yield low-quality DNA, such as clinical biopsies, rare cell populations, or complex tissues. Within the broader context of optimizing ChIP-seq library preparation for histone marks research, this application note addresses the critical issues of managing low-input and low-quality DNA. We present refined, carrier-free protocols and purification strategies that enable researchers to generate high-quality sequencing libraries while maintaining data reproducibility and biological relevance, specifically for challenging sample types.
The Challenge of Low-Input and Low-Quality DNA in ChIP-seq
Successful ChIP-seq library construction for histone mark research faces two major bottlenecks when working with limited material: the quantity and quality of immunoprecipitated DNA. Traditional ChIP-seq protocols typically require 1-10 ng of input DNA for library preparation, necessitating large numbers of starting cells (often 100,000 or more) [18]. Working with low-input material increases the risk of PCR amplification biases, reduced library complexity, and higher duplicate read rates, ultimately compromising data quality [18].
The quality of purified ChIP DNA is equally critical. Traditional DNA purification methods using phenol/chloroform and ethanol precipitation can lead to organic carry-over and co-precipitation of inhibitors that interfere with downstream enzymatic steps during library preparation [52]. Furthermore, after decrosslinking, ChIP DNA becomes diluted, with some samples having volumes too large for effective amplification in a single reaction [52]. These challenges are particularly pronounced when studying histone modifications in complex tissues like colorectal cancer, where cell heterogeneity, dense matrices, and challenging chromatin fragmentation create additional obstacles [22].
Comparative Analysis of Low-Input ChIP-seq Methodologies
Performance Evaluation of Library Preparation Methods
We evaluated seven low-input DNA library preparation methods using five replicates of 1 ng and 0.1 ng input H3K4me3 ChIP material, compared to a PCR-free reference dataset [18]. The performance was assessed based on unmappable reads, amplification-derived duplicates, reproducibility, and sensitivity/specificity of peak calling.
Table 1: Performance Comparison of Low-Input ChIP-seq Library Preparation Methods
| Method | Sensitivity (%) | Specificity (%) | Library Complexity | Optimal Input Range |
|---|---|---|---|---|
| Accel-NGS 2S | >90 | High | High | 0.1-1 ng |
| ThruPLEX | >90 | High | High | 0.1-1 ng |
| DNA SMART | >90 | High | High | 0.1-1 ng |
| TELP | >90 | Moderate | High | 0.1-1 ng |
| SeqPlex | ~80 | Lower | Reduced at 0.1 ng | 1 ng |
| HTML-PCR | N/A | N/A | Low | Not recommended |
The study identified consistent high performance in a subset of tested reagents, with Accel-NGS 2S, ThruPLEX, and DNA SMART showing the most robust results across multiple metrics at both 1 ng and 0.1 ng input levels [18].
Template-Switching Technology for Ultralow Inputs
The DNA SMART ChIP-seq kit utilizes a modified version of SMART template-switching technology, providing a ligation-free method for adapter addition that is particularly effective for low-input samples (100 pg-10 ng) [53]. This approach demonstrates high sensitivity and reproducibility across various input levels.
Table 2: DNA SMART ChIP-seq Performance Across Input Amounts
| Input DNA | PCR Cycles | Library Yield (nM) | Useful Reads (%) | Peaks Identified |
|---|---|---|---|---|
| 4 ng | 12 | 44.5 | 68.2 | 16,738 |
| 1 ng | 13 | 19.2 | 64.4 | 16,811 |
| 0.25 ng | 15 | 12.0 | 50.3 | 17,277 |
| 0.05 ng | 18 | 14.3 | 23.8 | 19,601 |
Notably, libraries generated with this technology maintain high reproducibility, with >93% overlap between peaks identified from technical replicates at input levels greater than 100 pg [53].
Optimized Protocols for Low-Input and Challenging Samples
ChIPmentation: Streamlined Tagmentation-Based Approach
ChIPmentation combines chromatin immunoprecipitation with sequencing library preparation using Tn5 transposase ("tagmentation"), introducing sequencing-compatible adapters in a single-step reaction directly on bead-bound chromatin [54].
ChIPmentation Workflow Comparison
This protocol significantly reduces time, cost, and input requirements while maintaining data quality. The method has been successfully validated for multiple histone marks (H3K4me1, H3K4me3, H3K27ac, H3K27me3, and H3K36me3) and generates accurate profiles from as few as 10,000 cells for histone modifications and 100,000 cells for transcription factors [54]. The tagmentation reaction is highly robust over a 25-fold range of transposase concentrations, making it suitable for variable ChIP samples [54].
Double-Crosslinking ChIP-seq (dxChIP-seq) for Enhanced Sensitivity
For challenging chromatin targets, particularly those not directly bound to DNA, a double-crosslinking approach significantly improves mapping efficiency and signal-to-noise ratio [51]. This protocol employs two crosslinking agents to capture both direct and indirect protein-DNA interactions, followed by focused ultrasonication and optimized immunoprecipitation.
Optimized Tissue Processing for Complex Samples
Working with solid tissues presents additional challenges due to cellular heterogeneity and complex matrices. An optimized protocol for frozen tissue preparation incorporates refined homogenization techniques that preserve chromatin integrity [22].
Key Steps for Tissue Processing:
- Rapid Mincing: Finely dice frozen tissue samples under cold conditions using sterile scalpel blades [22]
- Controlled Homogenization: Use either a semi-automated gentleMACS Dissociator or manual Dounce homogenizer with predefined programs optimized for tissue disruption [22]
- Chromatin Extraction: Employ a series of extraction buffers with protease inhibitors to maintain protein-DNA interactions [55]
- Validated Sonication: Use focused ultrasonication to obtain DNA fragments of 150-500 bp, with size verification via agarose gel electrophoresis [55]
This approach has been successfully applied to colorectal cancer tissues and their adjacent normal tissues, providing high-quality chromatin for subsequent immunoprecipitation [22].
Critical Purification Strategies for Low-Quality DNA
Specialized Cleanup for ChIP DNA
Effective DNA purification is crucial after decrosslinking. Traditional methods often result in inhibitor carry-over or substantial DNA loss. Specialized cleanup kits optimized for ChIP applications, such as the ChIP DNA Clean & Concentrator, contain binding buffers that promote DNA absorption to columns in the presence of detergents, antibodies, and proteinases commonly used in ChIP protocols [52]. These systems enable:
- Recovery of low DNA amounts (sub-nanogram range)
- Elimination of enzymatic inhibitors
- Concentration of diluted samples into small elution volumes
- Removal of organic contaminants without ethanol precipitation
Rapid Elution Methods
The ChIP Elute Kit provides a fast alternative to traditional crosslinking reversal, recovering purified single-stranded DNA in approximately one hour compared to overnight protocols [53]. This approach yields DNA compatible with template-switching library preparation methods and maintains library quality comparable to traditional elution methods across input levels from 0.25 ng to 1 ng [53].
Integrated Workflow for Low-Input Histone Mark ChIP-seq
Low-Input ChIP-seq Method Selection Guide
The Scientist's Toolkit: Essential Research Reagents
Table 3: Key Reagent Solutions for Low-Input ChIP-seq
| Reagent/Kit | Primary Function | Application Note |
|---|---|---|
| DNA SMART ChIP-seq Kit | Ligation-free library prep | Template-switching technology; ideal for 100 pg-10 ng inputs [53] |
| ChIP Elute Kit | Rapid crosslink reversal | Recovers ssDNA in ~1 hour; compatible with SMART technology [53] |
| ChIP DNA Clean & Concentrator | DNA purification | Optimized for low DNA recovery; removes enzymatic inhibitors [52] |
| Tn5 Transposase | Tagmentation enzyme | Enables ChIPmentation; reduces hands-on time and input requirements [54] |
| AMPure XP Beads | Size selection and cleanup | SPRI-based cleanup; used in multiple library prep protocols [56] [57] |
| Dynabeads Protein G | Immunoprecipitation | Magnetic beads for antibody-based chromatin pulldown [55] |
Managing low-input and low-quality DNA in ChIP-seq experiments requires integrated strategies addressing both sample preparation and library generation. Through comparative analysis, we have identified robust methods such as Accel-NGS 2S, ThruPLEX, and DNA SMART that maintain high sensitivity and specificity with sub-nanogram inputs. Innovative approaches like ChIPmentation and template-switching technology significantly reduce input requirements while streamlining workflows. Coupled with specialized purification techniques and tissue-specific optimizations, these protocols enable reliable histone mark profiling from challenging samples, opening new possibilities for studying rare cell populations and clinical specimens in epigenetic research.
Within the framework of ChIP-seq library preparation for histone marks research, chromatin fragmentation is a critical step that directly influences data quality, resolution, and the accuracy of epigenetic profiling. This process involves breaking the genome into manageable fragments that are then immunoprecipitated with antibodies specific to histone modifications. The fragmentation method and its optimization determine the efficiency of antibody binding, the specificity of the immunoprecipitation, and the final resolution of the mapped histone marks. For researchers and drug development professionals investigating epigenetic mechanisms, mastering chromatin fragmentation is essential for generating reproducible and high-fidelity data. The two primary techniques for chromatin fragmentation are sonication (mechanical shearing) and enzymatic digestion with Micrococcal Nuclease (MNase). Each method presents distinct advantages and challenges; sonication offers random fragmentation but requires careful optimization to avoid damaging epitopes, while MNase provides nucleosome-specific cleavage but risks over-digestion or biased digestion based on chromatin accessibility. This application note provides a detailed, quantitative guide to optimizing the time courses for both sonication and MNase digestion, enabling scientists to establish robust and reliable ChIP-seq protocols for histone mark analysis.
The choice between sonication and MNase digestion depends on the experimental goals, the histone mark of interest, and the starting material. The table below summarizes the core characteristics of each method.
Table 1: Core Characteristics of Chromatin Fragmentation Methods
| Feature | Sonication (X-ChIP) | MNase Digestion (X-ChIP or N-ChIP) |
|---|---|---|
| Principle | Mechanical shearing of chromatin using high-frequency sound waves [58] | Enzymatic cleavage of linker DNA between nucleosomes [58] |
| Typical Fragment Size | 150–1000 base pairs [58] | Mono-nucleosomes (~150 bp) to multi-nucleosomes (150–750 bp) [58] |
| Ideal For | Crosslinked chromatin (X-ChIP) for both histone and non-histone proteins [58] | Native chromatin (N-ChIP) for histones; also applicable to crosslinked chromatin (X-ChIP) [58] |
| Key Advantages | Truly randomized fragmentation; universal application for crosslinked samples [58] | High resolution for nucleosome positioning; milder conditions preserve antibody epitopes [58] |
| Key Challenges | Requires extensive optimization; heat and detergent can damage chromatin and epitopes [58] | Risk of over-digestion generating sub-nucleosomal fragments; digestion bias [59] |
Optimizing Sonication Time Course
Detailed Protocol for Sonication Optimization
Sonication optimization is empirical and must be determined for each cell type or tissue. The following protocol outlines the key steps.
- Cell Crosslinking and Lysis: For X-ChIP, crosslink cells using 1% formaldehyde for 8–10 minutes at room temperature [8]. Quench the reaction with glycine. Wash the cells and lyse them using an appropriate lysis buffer (e.g., containing 50 mM HEPES-KOH pH 7.5, 150 mM NaCl, 1 mM EDTA, 1% Triton X-100, 0.1% Sodium deoxycholate, and 0.1% SDS) [60]. Isolate nuclei.
- Chromatin Shearing: Resuspend the chromatin in a sonication buffer. Using a focused-ultrasonicator or a water-bath sonicator, subject identical chromatin aliquots to varying numbers of sonication cycles. A typical test series involves cycles of 10 seconds of sonication followed by 30 seconds of recovery on ice [59]. The total number of cycles should be varied (e.g., 4, 8, 12, 16 cycles) to generate a time course.
- Reverse Crosslinking and DNA Purification: After sonication, reverse the crosslinks by adding SDS to a final concentration of 1% and incubating overnight at 65°C [59]. Digest proteins with Proteinase K (e.g., 100 μg/mL for 1 hour at 55°C) [59]. Purify the DNA using a commercial PCR purification kit or silica matrix [59].
- Fragment Size Analysis: Analyze the purified DNA using a high-sensitivity system such as the Agilent Bioanalyzer. This provides an electrophoretogram and digital sizing for precise determination of the fragment size distribution [60]. The ideal sonication produces a smear centered between 200 bp and 1000 bp, with a peak around 300-500 bp being suitable for histone mark ChIP-seq [58].
Quantitative Data for Sonication
The table below provides generalized starting points for sonication time courses. These parameters must be empirically optimized.
Table 2: Example Sonication Time Course Parameters
| Sonication Device | Starting Power Setting | Tested Cycle Parameters | Target Fragment Size | Key Assessment Metric |
|---|---|---|---|---|
| Focused-ultrasonicator with micro-tip [59] | 10-second "on" pulses | 4 to 16 cycles (30-second "off" recovery on ice between pulses) [59] | 200-1000 bp [58] | Bioanalyzer profile; minimal debris above 1000 bp |
| Water-bath sonicator | Per manufacturer's guidelines | Multiple 5-30 minute sessions | 200-1000 bp [58] | Bioanalyzer profile; peak around 300-500 bp |
The following workflow diagram illustrates the critical steps and decision points in the sonication optimization process.
Optimizing MNase Digestion Time Course
Detailed Protocol for MNase Digestion Optimization
MNase digestion is a more controlled method but requires titration to achieve the desired mononucleosome enrichment without over-digestion.
- Nuclei Preparation and Crosslinking: Isolate nuclei from cells by resuspending the cell pellet in an ice-cold NP-40-containing buffer (e.g., 50 mM Tris pH8, 2 mM EDTA, 0.1% NP40, 10% glycerol) [59]. For X-ChIP, crosslinking can be done prior to or after nuclei isolation. A gentle fixation (e.g., 0.1% formaldehyde for 1 minute) may be sufficient for some histone marks in fragile cells [61].
- Chromatin Digestion with Titrated MNase: Resuspend nuclei in MNase digestion buffer (e.g., 10 mM Tris pH 7.4, 15 mM NaCl, 60 mM KCl, 0.25 M sucrose, 0.5 mM DTT, 1 mM CaCl₂) [59]. Distribute the chromatin into several aliquots. Add a range of MNase concentrations to each aliquot. A robust titration uses 5-fold serial dilutions of MNase, for example, from 4 U to 0.0013 U per 10⁶ lysed nuclei [59]. Incubate the reactions at 25°C for 30 minutes with shaking [59].
- Reaction Stopping and DNA Purification: Stop the digestion by adding EDTA to a final concentration of 12.5 mM [59]. Reverse crosslinks (if performed) by adding SDS and incubating at 65°C overnight. Purify the DNA using a commercial kit [59].
- Fragment Size Analysis: Analyze the DNA on an agarose gel or, for higher resolution, using an Agilent Bioanalyzer. The ideal digestion for histone mark analysis should yield a strong band at ~150 bp (mononucleosomes), with minimal signal from sub-nucleosomal fragments (indicating over-digestion) or large fragments (indicating under-digestion) [59]. Select the MNase dose that produces the highest yield of mononucleosomal DNA for ChIP-seq [59].
Quantitative Data for MNase Digestion
The table below provides specific quantitative data from an established ChIP-MNase protocol.
Table 3: Example MNase Titration Parameters and Outcomes
| MNase Unit (per 10⁶ nuclei) | Incubation Conditions | Expected Result | Recommendation for ChIP-seq |
|---|---|---|---|
| 4 U | 25°C for 30 min with shaking [59] | Significant over-digestion; appearance of sub-nucleosomal fragments (<150 bp) [59] | Avoid - "nibbling" into nucleosome edges [59] |
| 0.064 U | 25°C for 30 min with shaking [59] | Mixed profile of mono- and di-nucleosomes | Potential candidate if mononucleosomes are purified |
| 0.0128 U | 25°C for 30 min with shaking [59] | Predominantly mononucleosomes (~150 bp) | Ideal - high yield of target fragments [59] |
| 0.0013 U | 25°C for 30 min with shaking [59] | Under-digestion; mostly di-/tri-nucleosomes | Requires further digestion |
The workflow for optimizing MNase digestion is summarized in the following diagram.
The Scientist's Toolkit: Essential Reagents and Materials
Successful optimization and execution of chromatin fragmentation require specific, high-quality reagents. The following table lists key solutions and their functions.
Table 4: Essential Research Reagent Solutions for Chromatin Fragmentation
| Reagent / Solution | Example Composition | Function in Protocol |
|---|---|---|
| Formaldehyde (FA) | 16-37% solution, methanol-free [8] | Reversible crosslinking of proteins to DNA in X-ChIP [8] |
| FA Lysis Buffer | 50 mM HEPES-KOH pH 7.5, 150 mM NaCl, 1 mM EDTA, 1% Triton X-100, 0.1% Na-deoxycholate, 0.1% SDS [60] | Cell lysis and nuclei preparation for sonication |
| MNase Digestion Buffer | 10 mM Tris pH 7.4, 15 mM NaCl, 60 mM KCl, 0.25 M sucrose, 0.5 mM DTT, 1 mM CaCl₂ [59] | Provides optimal ionic conditions and cofactor (Ca²⁺) for MNase enzyme activity |
| Nuclei Isolation Buffer (L1) | 50 mM Tris pH 8, 2 mM EDTA, 0.1% NP-40, 10% glycerol + protease inhibitors [59] | Gentle release of nuclei from fixed cells while maintaining integrity |
| Proteinase K | 100 μg/mL working concentration [59] | Digestion and removal of proteins after fragmentation and IP for clean DNA recovery |
| Magnetic Beads | Protein G Dynabeads [8] | Solid-phase support for antibody-based immunoprecipitation of chromatin complexes |
Advanced Application: Double-Crosslinking for Challenging Targets
For challenging histone marks or complexes that are not directly DNA-bound, a double-crosslinking strategy can significantly improve results. This approach uses a two-step fixation process.
- Primary Crosslinking with DSG: Treat cells with 1.66 mM Disuccinimidyl Glutarate (DSG) in DMSO for 18 minutes at room temperature [8]. DSG is a homobifunctional NHS-ester crosslinker that stabilizes protein-protein complexes with a ~7.7 Å spacer, effectively "locking" indirect interactions [8].
- Secondary Crosslinking with Formaldehyde: Without quenching the DSG, add formaldehyde to a final concentration of 1% and incubate for a further 8 minutes at room temperature [8]. This second step crosslinks the stabilized protein complexes to DNA.
- Quenching and Washing: Quench the reaction by adding glycine to a final concentration of 0.125–0.2 M. Wash the cells twice with cold PBS before proceeding to lysis and chromatin fragmentation [8] [61].
This dxChIP-seq protocol exploits complementary chemistries to provide a more complete capture of chromatin-associated complexes, enhancing the signal-to-noise ratio for difficult targets like those found in repressive chromatin states marked by H3K27me3 or H3K9me3 [8].
In chromatin immunoprecipitation followed by sequencing (ChIP-seq), the quality of final data is profoundly influenced by the initial library preparation steps. Two interconnected challenges routinely faced by researchers are PCR duplicates and low library complexity, both of which can compromise data integrity and lead to erroneous biological conclusions. PCR duplicates arise during the library amplification process when multiple identical copies of the same original DNA fragment are sequenced, artificially inflating coverage in specific genomic regions without providing additional biological information [62]. Library complexity refers to the number of unique DNA molecules represented in the final sequencing library relative to the total number of sequenced reads [63]. In optimal libraries, this ratio is high, meaning most sequenced reads originate from distinct genomic fragments, thereby providing maximal information about protein-DNA interactions across the genome.
The relationship between these two factors is inverse: as library complexity decreases, the proportion of PCR duplicates typically increases. This phenomenon becomes particularly problematic in ChIP-seq experiments investigating histone modifications, where the accurate detection of enrichment patterns—from sharp peaks (e.g., H3K4me3) to broad domains (e.g., H3K27me3)—depends on even, representative coverage across the genome [38]. When library complexity is compromised and PCR duplicates abound, the resulting data may exhibit false enrichment peaks, diminished signal-to-noise ratios, and reduced reproducibility between technical replicates, ultimately undermining the reliability of downstream analyses.
Diagnosing the Problem: Quantitative Assessment
Understanding the Origins of PCR Duplicates
PCR duplicates originate during the library preparation process, specifically during the PCR amplification steps required to generate sufficient material for sequencing [62]. The process begins with random fragmentation of chromatin, typically via sonication, followed by ligation of adapters to both ends of the fragments. During subsequent PCR amplification, multiple copies of the same original DNA fragment are created. The critical issue arises when these identical copies bind to different clusters on the flowcell during sequencing, generating redundant reads that do not represent independent biological fragments [62].
The rate of PCR duplication is directly influenced by the number of unique DNA molecules present at the start of library preparation and the number of PCR cycles performed. As illustrated in Table 1, fewer unique starting molecules and increased PCR cycles dramatically elevate duplication rates. Mathematical modeling using Poisson distribution demonstrates that with ideal starting material (approximately 7e10 unique molecules) and limited amplification (6 PCR cycles), the theoretical duplicate rate can be as low as 0.21%. However, this rate escalates to 15% or higher when starting with only 1e9 unique molecules and performing 12 PCR cycles [62].
Table 1: Theoretical Relationship Between Input Material, PCR Cycles, and Duplicate Rates
| Unique Starting Molecules | PCR Cycles | Amplification Factor | Expected PCR Duplicate Rate |
|---|---|---|---|
| 7e10 | 6 | 64-fold | 0.21% |
| 9e9 | 9 | 512-fold | 1.7% |
| 1e9 | 12 | 4096-fold | 15% |
Quantitative Metrics for Assessing Library Quality
Several quantitative metrics enable researchers to evaluate library complexity and PCR duplication rates in their ChIP-seq data. The nonredundant rate represents the proportion of unique, non-duplicate reads in the final dataset, with values closer to 1.0 indicating higher complexity [64]. Library complexity can be projected using tools like Preseq, which estimates how many additional unique reads would be expected with increased sequencing depth [18]. Flattening of these complexity curves indicates exhaustion of unique molecules and diminished returns from further sequencing.
The relationship between read redundancy and enrichment patterns provides critical diagnostic information for troubleshooting ChIP-seq experiments, as summarized in Table 2.
Table 2: Diagnostic Patterns of Read Redundancy in ChIP-seq Data and Recommended Actions
| Redundancy in Peaks | Redundancy in Background | Interpretation | Suggested Actions |
|---|---|---|---|
| No peaks | High | IP not working; limited background material | Increase IP stringency; validate antibody efficacy |
| No peaks | Low | IP not working; sufficient background material | Decrease IP stringency; validate antibody efficacy |
| Low | Low | Sufficient pre-PCR material | Data usable; consider increasing IP stringency for stronger enrichment |
| High | High | Limited pre-PCR material | Use more cells; pool multiple IPs before library prep |
| High | Low | Strong enrichment with molecular crowding | Data usable; reduce chromatin input for differential binding studies |
Quality control indicators specific to histone mark patterns provide additional validation. For H3K4me3, expected enrichment at transcription start sites (TSS) with characteristic nucleosome depletion at the TSS itself confirms robust signal [18]. Computational tools like NGS-QC generate QC-stamp scores that compare experimental data to established H3K4me3 profiles in databases, with higher scores indicating better concordance with expected patterns [18].
Experimental Solutions and Protocol Optimization
Library Preparation Methods for Enhanced Complexity
The choice of library preparation method significantly impacts the complexity of resulting ChIP-seq libraries, particularly when working with limited input material. Comparative studies have systematically evaluated multiple commercial kits specifically for ChIP-seq applications, measuring their performance across metrics including library complexity, duplicate rates, sensitivity, and specificity [18] [38].
Table 3 summarizes the performance characteristics of various library preparation methods tested with low-input ChIP DNA, providing a reference for selection based on experimental needs.
Table 3: Performance Comparison of Library Preparation Methods for Low-Input ChIP-seq
| Method | Input DNA Range | Key Features | Performance with 1 ng Input | Performance with 0.1 ng Input |
|---|---|---|---|---|
| Accel-NGS 2S/xGen 2S | 10 pg - 1 µg | Sequential ligation; no adapter titration; repairs damaged ends | Highest unique reads; high sensitivity/specificity | Best retention of complexity; consistent high QC scores |
| ThruPLEX | 100 pg - 50 ng | Stem-loop template design; minimal purification steps | High sensitivity/specificity; good complexity | Moderate complexity; good performance |
| DNA SMART ChIP-seq | 100 pg - 10 ng | Ligation-free; template-switching; compatible with ssDNA | Good yield and mapping rates | Reduced useful reads but maintained peak detection |
| NEBNext Ultra II | 100 pg - 1 µg | End repair, A-tailing, adapter ligation | Good for sharp peaks (H3K4me3) | Consistent across input levels for multiple targets |
| KAPA HyperPrep | 100 pg - 1 µg | End repair, A-tailing, adapter ligation | Moderate performance | Variable performance |
| Diagenode MicroPlex | 100 pg - 10 ng | Optimized for low input | Better for transcription factors (CTCF) | Better for transcription factors (CTCF) |
| NEXTflex | 100 pg - 1 µg | Dual indexing capability | Better for broad domains (H3K27me3) | Reduced performance at low inputs |
The xGen 2S DNA Library Prep Kit (previously Swift Accel-NGS 2S) demonstrates particularly robust performance for challenging ChIP-seq applications, enabling library construction from as little as 10 pg of input DNA while maintaining high complexity [65]. Its unique sequential ligation chemistry overcomes the requirement for adapter titration, thereby maintaining efficient ligation with low nanogram and picogram input quantities. This method also incorporates specialized end-repair capabilities for 5' and 3' termini that improve ligation efficiency of damaged samples, such as those derived from cross-linked chromatin [65].
Ligation-free approaches such as the DNA SMART ChIP-seq kit utilize template-switching technology to add sequencing adapters without ligation, particularly advantageous for low-input samples. This method employs SMARTScribe Reverse Transcriptase to copy the DNA template while adding additional nucleotides to the 3' end, enabling the DNA SMART Oligonucleotide to base-pair with these nucleotides and create an extended template [64]. This streamlined approach minimizes sample loss through reduced cleanup steps, with post-PCR size selection further enhancing library yield and complexity compared to pre-PCR size selection [64].
The Scientist's Toolkit: Essential Research Reagent Solutions
Table 4: Research Reagent Solutions for Overcoming PCR Duplicates and Low Complexity
| Reagent Solution | Function | Application Notes |
|---|---|---|
| xGen 2S DNA Library Prep Kit | High-complexity library construction | Ideal for damaged samples; sequential ligation; 10 pg - 1 µg input range [65] |
| DNA SMART ChIP-seq Kit | Ligation-free library preparation | Template-switching technology; compatible with ssDNA; 100 pg - 10 ng input [64] |
| ChIP Elute Kit | Rapid cross-link reversal and DNA elution | Recovers ssDNA in ~1 hour; compatible with DNA SMART kit [64] |
| Unique Molecular Identifiers (UMIs) | Molecular barcoding for duplicate identification | xGen 2S MID Adapters enable accurate PCR duplicate filtering [65] |
| NEBNext Ultra II Kit | Library preparation for sharp histone marks | Optimal for H3K4me3; consistent across input levels [38] |
| Diagenode MicroPlex Kit | Low-input library preparation | Particularly effective for transcription factor ChIP-seq [38] |
| Diagenode Bioruptor Plus | Ultrasonication for chromatin shearing | Standardized fragmentation; 200-700 bp fragment size [38] |
Optimized Protocol for Complex Histone Mark ChIP-seq Libraries
The following protocol integrates best practices for maximizing library complexity and minimizing PCR duplicates in histone mark ChIP-seq experiments:
Cell Fixation and Chromatin Preparation
Begin with double-crosslinking using dxChIP-seq methodology for enhanced mapping of chromatin factors [51]. For adherent cells (e.g., LNCaP) at 70-80% confluency, fix with 1% methanol-free formaldehyde in culture medium for 10 minutes at room temperature. Quench with 125 mM glycine for 5 minutes with gentle agitation. Wash twice with ice-cold PBS containing protease inhibitors. Resuspend cell pellets in SDS lysis buffer (1% SDS, 10 mM EDTA, 50 mM Tris pH 8.1, plus protease inhibitors) and incubate on ice for 10 minutes [38].
For chromatin shearing, transfer 300 µL aliquots to 1.5-mL tubes and sonicate using a Diagenode Bioruptor Plus with 22 cycles of 30 seconds on/30 seconds off at high power at 4°C. Allow samples to rest on ice for 15 minutes, then repeat with an additional 22 cycles. Confirm fragment size distribution (200-700 bp) using Agilent Bioanalyzer High Sensitivity DNA reagents [38].
Immunoprecipitation and DNA Recovery
For histone modifications, use 2-5 µg of specific antibody (e.g., anti-H3K4me3) per 1-2 million cells. Perform immunoprecipitation overnight at 4°C with rotation. The following day, wash beads sequentially with low salt immune complex wash buffer, high salt immune complex wash buffer, LiCl immune complex wash buffer, and TE buffer [66].
For DNA elution, use the ChIP Elute Kit for rapid recovery of ssDNA in approximately one hour instead of traditional overnight methods. This approach yields DNA compatible with ligation-free library preparation methods while maintaining high mapping rates and peak identification comparable to traditional methods [64].
Library Construction with Complexity Maximization
Quantify immunoprecipitated DNA using fluorometric methods. For the xGen 2S DNA Library Prep Kit, use 1-10 ng input DNA for optimal results with histone marks. Follow the indexing by ligation workflow with xGen 2S Full-Length Adapters when planning PCR-free sequencing from ≥100 ng input, or use the indexing by PCR workflow with xGen 2S Truncated Adapters for lower inputs [65].
When using the DNA SMART ChIP-seq Kit, utilize single-tube workflow with combined post-PCR size selection and cleanup to maximize yield and complexity. Employ the minimum number of PCR cycles necessary for library detection: typically 12-13 cycles for 1-4 ng input, 14-15 cycles for 0.25-0.5 ng input, and 16-18 cycles for ≤0.1 ng input [64].
Incorporate Unique Molecular Identifiers (UMIs) when working with limited input material (≤1 ng) or when planning deep sequencing (>20 million reads per sample). xGen 2S MID Adapters enable strand-specific molecular barcoding that distinguishes true biological duplicates from PCR-amplified duplicates during data analysis [65].
Workflow and Decision Pathway
The following diagram illustrates the integrated workflow for preventing and addressing PCR duplicates and low complexity in ChIP-seq experiments, incorporating key decision points and solutions:
ChIP-seq Experimental Workflow with Quality Control Decision Points
Successfully overcoming PCR duplicates and low complexity in ChIP-seq library preparation requires a multifaceted approach combining appropriate experimental design, optimized protocols, and rigorous quality assessment. The strategic selection of library preparation methods based on input requirements and target characteristics, coupled with implementation of molecular barcoding technologies for low-input scenarios, enables researchers to generate high-quality data even from challenging samples. By adhering to the principles and protocols outlined in this application note, researchers can ensure their histone mark ChIP-seq data maintains the complexity and reproducibility necessary for robust biological insights, ultimately advancing our understanding of chromatin dynamics in health and disease.
Ensuring Data Quality: Validation, Standards, and Best Practices
In chromatin immunoprecipitation followed by sequencing (ChIP-seq) for histone mark research, the establishment of rigorous experimental controls is not merely a supplementary step but a foundational requirement for generating biologically meaningful data [29]. The complexity of chromatin architecture in plant and animal tissues, combined with the technical variability inherent in multi-step protocols, necessitates controls that can distinguish specific enrichment from background noise and experimental artifacts [1] [3]. This application note examines two critical control strategies—input DNA normalization and biological replication—within the broader context of optimizing ChIP-seq library preparation for histone mark studies. We provide detailed methodologies, quality assessment metrics, and practical implementation guidelines to enable researchers to establish robust experimental frameworks that yield reproducible, high-quality data for drug discovery and basic research applications.
The Critical Role of Input DNA Controls
Input DNA controls, sometimes referred to as "mock IP" samples, consist of chromatin that has been processed identically to ChIP samples but without the immunoprecipitation step [3]. These controls serve multiple essential functions in ChIP-seq experimental design and data interpretation.
- Background Identification and Normalization: Input DNA accounts for technical artifacts arising from chromatin fragmentation biases, sequencing biases, and open chromatin regions that sequester non-histone proteins [3]. During peak calling, algorithms like MACS2 utilize input controls to distinguish true histone mark enrichment from background signal, substantially improving signal-to-noise ratio.
- Experimental Quality Assessment: Input libraries provide a reference point for assessing immunoprecipitation efficiency. Comparison between ChIP and input samples allows researchers to calculate quantitative metrics such as the Fraction of Reads in Peaks (FRiP), with higher FRiP scores indicating successful IP experiments [29].
- Library Complexity Verification: Input DNA serves as a quality control check for overall library complexity and sequencing depth adequacy before proceeding with immunoprecipitation steps.
Table 1: Input DNA Preparation Methods Comparison
| Method Aspect | Sonication-Based Protocol | Enzymatic Digestion Protocol |
|---|---|---|
| Chromatin Shearing | Acoustic shearing (Covaris) or sonication (Bioruptor) | MNase or other restriction enzymes |
| Advantages | Uniform fragmentation; compatibility with crosslinked samples | Sequence-specific cutting; no equipment requirement |
| Limitations | Equipment cost; potential overheating | Sequence bias; optimization required per cell type |
| Recommended Use | Crosslinked samples for histone modifications | Native ChIP for specific histone marks |
Biological Replicates: From Technical Validation to Biological Discovery
Biological replicates—independent samples processed through identical experimental conditions—are indispensable for distinguishing consistent biological effects from random variability in ChIP-seq experiments [29]. The use of biological replicates allows researchers to:
- Assess Experimental Reproducibility: Consistent peak calls across replicates provide confidence in identified binding sites or histone modifications.
- Employ Statistical Rigor: Tools like the Irreproducible Discovery Rate (IDR) framework quantify replicate consistency and help establish confidence thresholds for peak calling [29].
- Account for Biological Variability: True biological differences between samples or conditions can only be distinguished from noise through replication.
For histone mark studies, a minimum of two biological replicates is recommended, though three provides greater statistical power for detecting subtle changes in mark distribution [29]. Consistency between replicates is typically evaluated through correlation analyses and visualization tools such as profile plots and heatmaps, which can display read density patterns across genomic regions of interest [67].
Integrated Experimental Workflow
The successful integration of input controls and biological replicates requires careful planning throughout the ChIP-seq workflow. The following diagram illustrates the key decision points and processes involved in establishing these rigorous controls.
Figure 1: Integrated workflow for ChIP-seq experiments incorporating biological replicates and input DNA controls. Critical control points are highlighted in green, while key processes are shown in light gray. Decision points for quality assessment are highlighted in yellow.
Quality Assessment Metrics and Interpretation
Establishing quantitative thresholds for quality metrics ensures consistent evaluation of ChIP-seq experiments incorporating input controls and biological replicates. The ENCODE consortium provides extensive guidelines for these quality assessments [29].
Table 2: Key Quality Control Metrics for ChIP-seq Experiments
| Quality Metric | Target Value | Interpretation | Calculation Method |
|---|---|---|---|
| Fraction of Reads in Peaks (FRiP) | >1% for broad marks>5% for punctate marks | Measures signal-to-noise ratio; higher values indicate better enrichment | Reads in peaks / Total mapped reads |
| Non-Redundant Fraction (NRF) | >0.9 | Indicates library complexity; lower values suggest excessive PCR duplication | Non-redundant unique mapped reads / Total mapped reads |
| Irreproducible Discovery Rate (IDR) | <0.05 for high-confidence peaks | Quantifies reproducibility between replicates; lower values indicate better consistency | Statistical framework comparing peak ranks between replicates |
| Strand Cross-Correlation (SCC) | NSC >1.05 (broad marks)NSC >1.1 (punctate marks) | Assesses fragmentation quality; higher values indicate better signal-to-noise | Correlation between forward and reverse strand tag densities |
Data Visualization and Interpretation
Effective visualization strategies are essential for interpreting ChIP-seq data and confirming the quality of controls and replicates. The deepTools suite provides comprehensive solutions for creating informative visualizations [67].
- Profile Plots: These density plots evaluate read density patterns across defined genomic regions, such as transcription start sites (TSS), allowing direct comparison between replicates and conditions [67]. Consistent patterns across biological replicates increase confidence in observed enrichment.
- Heatmaps: Hierarchical clustering of signal intensity across genomic regions provides a global view of enrichment patterns and replicate consistency [67].
- Genome Browser Tracks: Visual inspection of aligned reads in genomic context allows researchers to verify peak calls and compare ChIP signal to input controls at specific loci.
The creation of bigWig files from BAM alignment files enables these visualizations through tools like bamCoverage and bamCompare [67]. The latter is particularly valuable as it normalizes ChIP signal against input controls, generating background-corrected tracks for visualization and analysis.
The Scientist's Toolkit: Essential Research Reagents
Table 3: Key Research Reagent Solutions for Controlled ChIP-seq Experiments
| Reagent/Kit | Function | Application Notes |
|---|---|---|
| Crosslinking Reagents | Protein-DNA fixation | Formaldehyde is most common; optimization of concentration and duration required per tissue type [1] |
| Chromatin Shearing Reagents | DNA fragmentation | Sonication-based kits or enzymatic fragmentation (MNase); must be optimized for histone marks [3] |
| Histone Modification Antibodies | Target immunoprecipitation | Specificity validation critical; use certified antibodies with demonstrated ChIP-seq performance |
| Magnetic Protein A/G Beads | Antibody-bound complex isolation | Consistent bead size and binding capacity essential for reproducible IP across replicates |
| Library Preparation Kits | NGS library construction | Commercial kits optimized for ChIP-seq improve efficiency and reduce bias [1] |
| Size Selection Beads | DNA fragment isolation | SPRI beads commonly used; ratio optimization critical for appropriate size selection |
The integration of properly designed input DNA controls and biological replicates transforms ChIP-seq from a descriptive technique to a quantitatively robust method for histone mark research. By implementing the detailed protocols, quality metrics, and visualization strategies outlined in this application note, researchers can significantly enhance the reliability and interpretability of their chromatin data. These rigorous controls are particularly crucial in drug development contexts, where decisions based on epigenetic profiling require the highest standards of experimental evidence. As ChIP-seq methodologies continue to evolve, the fundamental principles of proper experimental design—emphasizing controls and replication—will remain essential for generating biologically meaningful insights into chromatin dynamics and epigenetic regulation.
Within the framework of a thesis on ChIP-seq library preparation for histone marks research, rigorous benchmarking of performance metrics is paramount. Sensitivity, specificity, and reproducibility are the foundational pillars upon which reliable and biologically meaningful data are built. These metrics directly determine a study's capacity to accurately distinguish true histone modification signals from background noise and to yield consistent results across experimental replicates. Recent investigations have systematically quantified the factors influencing these metrics, providing critical, evidence-based guidance for experimental design and analysis in chromatin biology. This protocol synthesizes these findings into a practical workflow for benchmarking ChIP-seq performance, with a particular emphasis on applications in drug discovery and development where epigenetic perturbations are increasingly targeted.
Quantitative Benchmarking of ChIP-seq Performance
A critical evaluation of performance metrics informs every stage of experimental design, from determining the necessary sequencing depth to selecting the optimal number of biological replicates.
Sequencing Depth Guidelines
Sequencing depth is a primary determinant of both sensitivity and specificity. Insufficient depth leads to false negatives (poor sensitivity), whereas excessive depth yields diminishing returns on investment. Recommendations vary based on the biological target and the model organism's genome size [68].
Table 1: Recommended Sequencing Depth for ChIP-seq Experiments
| Biological Target | Minimum Reads (Human) | Recommended Reads (Human) | Minimum Reads (Drosophila) | Rationale |
|---|---|---|---|---|
| Transcription Factors | 10-20 million [69] | 15-20 million [69] | ~10 million [68] | Focal binding sites; lower depth sufficient with high-quality antibodies. |
| Narrow Histone Marks (e.g., H3K4me3) | 20 million [68] | 20-40 million [68] | ~20 million [68] | Enriched at specific, discrete regions like promoters. |
| Broad Histone Marks (e.g., H3K27me3) | 40 million [68] | >50 million [68] | N/A | Cover large genomic domains, requiring greater depth for full coverage. |
Replicate Number and Reproducibility
Reproducibility is a major challenge in ChIP-seq, especially for dynamic targets like in vivo DNA secondary structures. Evidence shows that the common practice of using only two biological replicates is often insufficient for robust and reproducible peak calling [69].
Table 2: Impact of Replicate Number on Data Reproducibility
| Number of Replicates | Impact on Detection Accuracy & Reproducibility | Recommendation |
|---|---|---|
| Two | Common but sub-optimal practice; considerable heterogeneity in peak calls observed with only a minority of peaks shared across all replicates [69]. | The minimum acceptable standard, but requires robust computational validation (e.g., IDR). |
| Three | Significantly improves detection accuracy compared to two-replicate designs [69]. | A substantial improvement over two replicates; recommended for robust studies. |
| Four | Proven sufficient to achieve reproducible outcomes with standard G4 ChIP-seq data; diminishing returns observed beyond this number [69]. | The recommended optimal standard for high-quality, reproducible datasets. |
Experimental Protocols for Benchmarking
The following protocols provide a detailed methodology for assessing reproducibility and for comparing ChIP-seq to emerging, low-input techniques.
Protocol: Assessing Reproducibility Using Computational Methods
This protocol utilizes multiple computational methods to evaluate the consistency of peak calls across biological replicates, a critical step for validating ChIP-seq data for histone marks.
- Peak Calling on Individual Replicates: Begin by performing peak calling on each biological replicate independently using a standard peak caller (e.g., MACS2).
- Consensus Peak Set Generation: Input the peak calls from all replicates into a reproducibility assessment tool. The choice of tool is critical:
- MSPC (Multiple Sample Peak Calling): Recommended as an optimal solution for reconciling inconsistent signals, as it integrates evidence from multiple replicates to rescue weak but consistent peaks by combining p-values [69].
- IDR (Irreproducible Discovery Rate): A common method for pairwise replicate comparisons, though it may be less suited for data with high inherent inter-replicate inconsistency [69].
- ChIP-R: Uses a rank-product test to evaluate reproducibility across numerous replicates [69].
- Validation with External Annotations: Validate the resulting consensus peaks by assessing their overlap with independent biological evidence. For example, highly reproducible peaks are strongly enriched in promoter regions and show high overlap with putative sequence motifs or other orthogonal datasets [69].
- Establish a Pseudo-Gold Standard: Define a high-confidence peak set based on peaks supported by multiple replicates and strong external annotation. This set serves as a benchmark for evaluating the precision and recall of different reproducibility methods [69].
Protocol: Comparative Benchmarking of ChIP-seq vs. CUT&Tag
This protocol outlines a systematic comparison between ChIP-seq and the enzyme-based method CUT&Tag for profiling histone modifications, such as H3K27me3 and H3K4me3 [70].
- Cell Preparation: Use a standardized cell source. For the model system of haploid round spermatids, isolate cells from adult mouse testes using counterflow centrifugal elutriation (CCE) to achieve high purity (>95%) [70].
- Parallel Library Construction:
- ChIP-seq: Perform crosslinking with formaldehyde, followed by chromatin shearing via sonication, immunoprecipitation with a target-specific antibody (e.g., H3K27me3, Cell Signaling Technology, 9733s), and library construction [70].
- CUT&Tag: Follow a commercial kit protocol (e.g., Hyperactive Universal CUT&Tag Assay Kit). Briefly, permeabilize cells, bind them to ConA beads, and incubate with a primary antibody overnight at 4°C. Subsequently, recruit a pA-Tn5 transposase complex to the antibody target, which simultaneously cleaves and inserts adapters into the surrounding DNA in a tagmentation reaction. Purify the DNA to obtain the sequencing library [70].
- Sequencing and Data Analysis: Sequence all libraries on a compatible platform (e.g., Illumina NovaSeq 6000, PE150). Process data through a uniform bioinformatics pipeline for alignment and peak calling.
- Performance Metric Evaluation:
- Signal-to-Noise Ratio: Calculate the enrichment of read density in peak regions versus background genomic regions. CUT&Tag typically demonstrates a higher signal-to-noise ratio [70].
- Peak Overlap and Uniqueness: Compare the genomic intervals identified by each method using tools like BEDTools. Identify peaks unique to each method and those shared.
- Correlation with Chromatin Accessibility: Integrate with ATAC-seq data from the same cell type. A strong correlation between CUT&Tag signal intensity and chromatin accessibility can indicate a bias towards detecting signals in open chromatin regions [70].
The Scientist's Toolkit: Research Reagent Solutions
Table 3: Essential Reagents and Tools for ChIP-seq Benchmarking Studies
| Item Name | Function/Description | Example/Supplier |
|---|---|---|
| H3K27me3 Antibody | Immunoprecipitation of a canonical repressive histone mark for benchmarking. | Cell Signaling Technology, 9733s [70] |
| H3K4me3 Antibody | Immunoprecipitation of a canonical active promoter mark for benchmarking. | Merck, 07-473 [70] |
| Hyperactive CUT&Tag Assay Kit | Commercial kit for performing CUT&Tag assays in comparative studies. | Vazyme Biotech, TD904 [70] |
| MSPC (Multiple Sample Peak Calling) | Computational tool for assessing reproducibility across multiple replicates. | Recommended for integrating weak but consistent signals [69] |
| ChIP-Atlas | Public database to integrate and compare your results with thousands of published datasets. | Useful for validation and genomic context analysis [71] |
| FastQC | Tool for initial quality control checks on raw sequencing data. | Assesses sequencing quality and adapter contamination [72] [68] |
| BWA-MEM | Read alignment tool for mapping sequencing reads to a reference genome. | Optimized for speed and support for paired-end reads [73] [72] |
| MACS2 | Widely-used peak calling algorithm for identifying enrichment regions. | Suitable for both transcription factor and histone modification data [72] [68] |
Workflow and Relationship Visualizations
Diagram 1: Benchmarking Workflow Logic. This diagram outlines the logical flow and key decision points for designing a robust ChIP-seq benchmarking study, from initial experimental design to final validation.
Diagram 2: Method Comparison Attributes. This diagram contrasts the core procedural differences and key performance attributes between traditional ChIP-seq and the newer CUT&Tag method, highlighting trade-offs like input needs and signal quality.
Within chromatin immunoprecipitation followed by sequencing (ChIP-seq) workflows for histone marks research, the specificity of the antibody reagent is the foundational determinant of data quality and biological validity. The ENCODE (Encyclopedia of DNA Elements) Consortium has established that the quality of a ChIP experiment is governed primarily by the specificity of the antibody and the degree of enrichment achieved [2]. Antibodies lacking sufficient characterization can produce misleading results due to two main deficiencies: poor reactivity against the intended target or cross-reactivity with other DNA-associated proteins [2]. For clinical and pharmaceutical research, where ChIP-seq data may inform drug discovery targets, adhering to rigorous, consensus-driven standards is not merely a best practice but a necessity for generating reproducible and reliable data. This application note details the implementation of ENCODE guidelines for antibody characterization, providing a structured framework for researchers in drug development.
ENCODE Antibody Characterization Framework
The Antibody Lot as the Fundamental Unit
The ENCODE project organizes antibody characterization around the antibody lot, defined as a unique lot-productID-source combination [74]. Each lot receives a unique ENCODE accession number, and characterization must be repeated for every new lot number used for ChIP-seq [2] [74]. This rigorous lot-level tracking ensures that performance validation is specific to the actual reagent used in experiments, a critical detail for maintaining consistency in long-term or multi-site drug development projects.
Tiered Characterization Strategy
ENCODE employs a two-test system for characterizing antibodies, comprising a primary and a secondary assay [2]. The workflow is designed to build a cumulative case for antibody specificity.
Target-Specific Characterization Standards
The required characterization tests differ based on the antibody target. ENCODE provides distinct standards for transcription factors, histone modifications, and RNA-binding proteins [75].
- For Transcription Factors (Primary Test): Immunoblot analysis is the primary method, performed on protein lysates from whole-cell extracts, nuclear extracts, or chromatin preparations. The guideline requires that the primary reactive band contains at least 50% of the total signal on the blot and ideally corresponds to the expected size of the target protein [2]. When bands deviate in size by more than 20%, additional validation through siRNA knockdown or mass spectrometry is required [2].
- For Transcription Factors (Secondary Test): Immunofluorescence staining must demonstrate the expected subcellular pattern (e.g., nuclear localization) and should only appear in cell types known to express the factor [2].
- For Histone Modifications: Characterization standards for histone modifications and chromatin-associated proteins were released in October 2016 [75]. While specific methodological details for histone marks were not exhaustively detailed in the search results, the overarching requirement remains that antibodies must be characterized in each cell type and species unless targeting a histone modification [74].
Experimental Protocols for Antibody Validation
Protocol: Immunoblot Analysis for Specificity Assessment
This protocol is adapted from ENCODE guidelines for the primary characterization of transcription factor antibodies [2].
Materials
- Research Reagent Solutions:
- RIPA Lysis Buffer
- Protease Inhibitor Cocktail
- Precast Polyacrylamide Gels (4-20%)
- PVDF or Nitrocellulose Membranes
- ECL or Chemiluminescent Substrate
- Species-Specific HRP-Conjugated Secondary Antibody
Procedure
- Prepare Protein Lysates: Harvest cells and lyse in RIPA buffer supplemented with protease inhibitors. Use a panel of cell lines, including at least one known to express the target protein and one known negative control.
- Separate Proteins: Load 20-50 µg of total protein per lane on a precast polyacrylamide gel. Perform electrophoresis at constant voltage until the dye front reaches the bottom.
- Transfer Proteins: Electrophoretically transfer proteins from the gel to a PVDF membrane using standard wet or semi-dry transfer systems.
- Block and Incubate: Block the membrane with 5% non-fat milk in TBST for 1 hour. Incubate with the primary antibody (the lot being characterized) at the manufacturer's recommended dilution overnight at 4°C.
- Detect Signal: Wash the membrane and incubate with an appropriate HRP-conjugated secondary antibody for 1 hour. Develop using a chemiluminescent substrate and image.
- Analyze Results: The antibody passes this primary test if a single major band constitutes >50% of the total signal and aligns with the expected molecular weight. Multiple bands or a smear indicate potential non-specificity [2].
Protocol: Immunofluorescence for Cellular Localization
This protocol serves as a secondary test for transcription factor antibodies or an alternative primary test [2].
Materials
- Research Reagent Solutions:
- Cell Culture-Treated Chamber Slides
- Phosphate-Buffered Saline (PBS)
- 4% Paraformaldehyde (PFA) in PBS
- Triton X-100
- Blocking Serum (e.g., Normal Goat Serum)
- Fluorescently-Labeled Secondary Antibody
- Mounting Medium with DAPI
Procedure
- Plate and Culture Cells: Seed cells onto chamber slides at an appropriate density and culture until 60-80% confluent.
- Fix and Permeabilize: Wash cells with PBS and fix with 4% PFA for 15 minutes. Permeabilize with 0.1% Triton X-100 in PBS for 10 minutes.
- Block and Incubate: Block cells with 2-5% serum for 30 minutes. Incubate with the primary antibody diluted in blocking buffer for 1-2 hours at room temperature.
- Stain and Mount: Wash and incubate with a fluorescently-labeled secondary antibody for 45 minutes in the dark. Counterstain nuclei with DAPI and mount with an anti-fade mounting medium.
- Image and Interpret: Image using a fluorescence microscope. The antibody passes if staining shows the expected subcellular localization (e.g., nuclear for transcription factors) and is present only in positive control cell lines [2].
ENCODE ChIP-seq Experimental Standards and Quality Metrics
Experimental Design Requirements
For a ChIP-seq experiment to be compliant with ENCODE standards, several key design elements must be incorporated [4].
- Biological Replication: Experiments must include two or more biological replicates (isogenic or anisogenic). Exemptions are made only for assays using EN-TEx samples due to limited material availability [4].
- Input Controls: Each ChIP-seq experiment requires a corresponding input control experiment with matching run type, read length, and replicate structure [4].
- Sequencing Depth: For transcription factors, each replicate should ideally yield 20 million usable fragments. The consortium categorizes read depths below this threshold as "low," "insufficient," or "extremely low" [4].
- Library Complexity: Library complexity is measured using the Non-Redundant Fraction (NRF) and PCR Bottlenecking Coefficients (PBC1 and PBC2). Preferred values are NRF > 0.9, PBC1 > 0.9, and PBC2 > 10 [4].
Data Quality Assessment Metrics
The ENCODE consortium uses several key metrics to assess the quality of ChIP-seq data, which are equally applicable for internal quality control in pharmaceutical research settings [76].
Table 1: Key Quality Metrics for ChIP-seq Data Assessment
| Metric | Description | Interpretation | Preferred Value |
|---|---|---|---|
| FRiP (Fraction of Reads in Peaks) | The fraction of all mapped reads that fall within peak regions. | Measures enrichment efficiency; higher values indicate better signal-to-noise. | Target-specific; higher is better. |
| NSC (Normalized Strand Cross-correlation) | Ratio of maximal cross-correlation value to background cross-correlation. | Measures enrichment; values < 1.1 indicate low quality, >1.1 is desirable. | > 1.1 [76] |
| RSC (Relative Strand Cross-correlation) | Ratio of fragment-length cross-correlation to phantom-peak cross-correlation. | Measures enrichment; values >1 indicate high quality, <1 indicate low quality. | > 1 [76] |
| PBC (PCR Bottlenecking Coefficient) | Measures library complexity as the ratio of genomic locations with exactly one read to locations with at least one read. | Higher values indicate better complexity; 0-0.5 is severe bottlenecking, 0.9-1.0 is minimal. | > 0.8 (Mild to no bottlenecking) [4] [76] |
| IDR (Irreproducible Discovery Rate) | Statistical method to assess reproducibility between replicates by ranking peaks and measuring consistency. | Lower IDR values indicate higher reproducibility; used to generate conservative and optimal peak sets. | Rescue and self-consistency ratios < 2 [4] |
Reporting and Metadata Standards
Compliant experiments must pass routine metadata audits before public release [4]. The ENCODE portal provides detailed metadata requirements, ensuring that all experimental conditions, reagent identifiers, and processing parameters are fully documented and traceable.
Implementation in Drug Development Research
The Scientist's Toolkit: Essential Reagents and Materials
Successful implementation of ENCODE-compliant ChIP-seq requires careful selection and documentation of critical reagents.
Table 2: Research Reagent Solutions for ENCODE-Compliant ChIP-seq
| Reagent/Material | Function in Workflow | Key Considerations |
|---|---|---|
| Characterized Antibody Lot | Specific immunoprecipitation of target histone mark or transcription factor. | Must have ENCODE "compliant" status or equivalent internal validation data for the specific cell type and species [74]. |
| Validated Cell Lines | Source of chromatin for ChIP-seq experiments. | Identity must be verified (e.g., by STR profiling); mycoplasma testing is essential [54]. |
| Chromatin Shearing Reagents | Fragment chromatin to optimal size (100-300 bp). | Sonication efficiency should be verified by agarose gel electrophoresis post-fragmentation. |
| Protein A/G Magnetic Beads | Capture antibody-chromatin complexes during immunoprecipitation. | Binding capacity should be matched to the amount of antibody used. |
| Library Preparation Kit | Prepare sequencing libraries from immunoprecipitated DNA. | Must be compatible with the sequencing platform; consider low-input protocols for rare cell types. |
| Control IgG or Input DNA | Control for non-specific immunoprecipitation and background noise. | Must be generated from the same cell type and processed identically to the ChIP sample [4]. |
Integrated Workflow for Compliant ChIP-seq
The following diagram illustrates the complete integrated workflow from antibody validation through to data reporting, highlighting key decision points based on ENCODE standards.
Implementation of ENCODE guidelines for antibody characterization and reporting standards provides a robust framework for generating high-quality, reproducible ChIP-seq data essential for drug development research. The core principles of rigorous antibody validation, appropriate experimental replication, standardized sequencing depth, and comprehensive quality metric reporting collectively ensure that results accurately reflect biological reality rather than technical artifacts. As the ENCODE standards continue to evolve, maintaining familiarity with current versions of experiment and antibody guidelines is essential for research professionals aiming to produce clinically relevant and scientifically valid epigenomic data.
In chromatin immunoprecipitation followed by sequencing (ChIP-seq) for histone mark research, sequencing depth—the number of reads aligned to the genome—serves as a fundamental determinant of data quality and biological discovery. Insufficient depth leads to false negatives and poor reproducibility, while excessive depth yields diminishing returns and unnecessary cost [77] [78]. For histone marks, which often display broad enrichment domains across the genome, determining the optimal number of read-pairs is particularly crucial. This application note synthesizes current standards and experimental data to provide definitive guidance on sequencing depth requirements, ensuring researchers can design robust ChIP-seq experiments capable of detecting biologically significant enrichment patterns for histone modifications.
The relationship between sequencing depth and peak detection follows a characteristic saturation curve, where initial increases in read count dramatically improve sensitivity until a point of diminishing returns is reached. Beyond this inflection point, additional sequencing provides minimal gains in novel peak discovery [77]. The precise location of this point varies significantly between histone marks, depending on their genomic distribution patterns, from broad domains (e.g., H3K36me3, H3K9me3) to more focal enrichments [77] [2]. This document establishes evidence-based protocols for determining sufficient read-pairs for your specific histone mark research objectives.
Establishing Sequencing Depth Standards
Quantitative Depth Recommendations by Histone Mark Type
Table 1: Recommended Sequencing Depth for Histone Mark ChIP-seq Experiments
| Histone Mark Type | Recommended Depth (Usable Fragments) | Key Considerations | Primary Use Cases |
|---|---|---|---|
| Broad Marks (e.g., H3K36me3, H3K27me3) | 45-60 million fragments per replicate [4] | Higher depth required to map extended domains; H3K9me3 has special requirements (see below) | Genome-wide mapping of repressive/active domains |
| H3K9me3 Exception | 45 million total mapped reads per replicate [79] | Enriched in repetitive regions; use total mapped reads instead of usable fragments for QC | Heterochromatin studies, repetitive region analysis |
| Focal Marks (e.g., H3K4me3, H3K27ac) | 20-45 million fragments per replicate [4] | Less depth required for sharp, localized enrichment patterns | Promoter/enhancer mapping, regulatory element identification |
Usable fragments are defined as uniquely mapped, deduplicated reads (single-end) or read-pairs (paired-end) [4] [79]. The exceptional case of H3K9me3 arises from its enrichment in repetitive genomic regions, which results in a substantial fraction of reads being filtered out during standard processing (multi-mapped reads, poor alignment scores). Consequently, while the sequencing effort should target 45 million total mapped reads, the resulting number of usable fragments will be substantially lower [79].
The Relationship Between Depth and Detection Sensitivity
Systematic evaluations demonstrate that sensitivity for detecting enriched regions improves with increasing sequencing depth, but follows a logarithmic rather than linear relationship. In one comprehensive assessment using Drosophila S2 cells, researchers generated ChIP-seq datasets for the broad mark H3K36me3 at approximately 1 read per mappable base pair (corresponding to ~2.4 billion reads in human) [77]. Even at this exceptional depth, approximately 1% of narrow peaks detected via tiling arrays were missed by ChIP-seq, highlighting that perfect sensitivity remains theoretically unattainable regardless of depth [77].
For most practical applications, the ENCODE consortium guidelines provide a robust framework. These standards were established through extensive empirical testing across multiple laboratories and represent the point where additional sequencing provides diminishing returns for detection capability [4] [2]. The recommended depths in Table 1 reliably enable detection of both strong and weak enrichment sites while maintaining cost-effectiveness.
Experimental Design and Protocol Implementation
Comprehensive ChIP-seq Workflow for Histone Marks
Diagram 1: End-to-end ChIP-seq workflow for histone marks
Detailed Protocol: ChIPmentation for Low-Input Samples
For studies with limited starting material, such as clinical biopsies or rare cell populations, the ChIPmentation protocol offers a robust alternative to standard ChIP-seq. This method combines chromatin immunoprecipitation with library preparation via Tn5 transposase ("tagmentation") in a single reaction directly on bead-bound chromatin [54].
Procedure:
- Cross-linking and Cell Lysis: Cross-link cells with 1% formaldehyde for 10 minutes at room temperature. Quench with 125 mM glycine. Wash cells and lyse using appropriate lysis buffer.
- Chromatin Shearing: Sonicate chromatin to 100-500 bp fragments using optimized sonication conditions (e.g., Covaris or Bioruptor).
- Immunoprecipitation: Incubate chromatin with validated antibody against target histone mark overnight at 4°C. Add protein A/G magnetic beads and incubate 2-4 hours.
- Bead Washes: Wash beads sequentially with:
- Low salt wash buffer
- High salt wash buffer
- LiCl wash buffer
- TE buffer
- Tagmentation Reaction: Resuspend beads in 30 µL tagmentation reaction buffer (10 mM Tris pH 8.0, 5 mM MgCl₂) containing 1 µL Tn5 transposase. Incubate at 37°C for 10 minutes.
- Post-Tagmentation Washes: Wash beads twice with appropriate wash buffer to remove transposase.
- DNA Elution and Purification: Elute DNA from beads using elution buffer (1% SDS, 100 mM NaHCO₃). Reverse cross-links by incubating at 65°C overnight with 200 mM NaCl. Treat with RNase A and proteinase K. Purify DNA using SPRI beads.
- Library Amplification: Amplify library with 12-15 PCR cycles using indexed primers. Perform size selection and cleanup before sequencing [54].
Advantages: ChIPmentation reduces time, cost, and input requirements compared to standard ChIP-seq, enabling high-quality profiles from as few as 10,000 cells for histone marks like H3K4me3 and H3K27me3 [54].
Quality Control and Optimization Strategies
Essential Quality Metrics for Histone Mark ChIP-seq
Table 2: Key Quality Control Metrics and Their Interpretation
| Quality Metric | Recommended Threshold | Calculation Method | Significance for Data Quality |
|---|---|---|---|
| Fraction of Reads in Peaks (FRiP) | >1% (histone marks) [4] | Reads in peaks / Total mapped reads | Measures enrichment efficiency; higher values indicate successful IP |
| Non-Redundant Fraction (NRF) | >0.9 [4] | Unique mapped positions / Total mapped reads | Indicates library complexity; low values suggest over-amplification |
| PCR Bottlenecking Coefficient (PBC) | PBC1 > 0.9, PBC2 > 10 [4] | PBC1: Unique locations / Unique readsPBC2: Unique locations / Deduplicated reads | Measures library complexity saturation; critical for assessing PCR duplicates |
| Strand Cross-Correlation | NSC > 1.05, RSC > 0.8 [30] | Normalized Strand Coefficient (NSC)Relative Strand Coefficient (RSC) | Assesses signal-to-noise ratio; higher values indicate stronger enrichment |
Control Experiments and Replicate Design
A robust experimental design must incorporate appropriate controls and replication strategies to ensure biologically meaningful results:
- Input Controls: Sequence genomic DNA without immunoprecipitation to control for technical biases introduced by chromatin fragmentation, sequencing, and mapping. Input DNA should be sequenced deeper than ChIP samples [78] [2].
- Biological Replicates: Include at least two independent biological replicates (isogenic or anisogenic) to distinguish reproducible binding from technical artifacts. Biological replicates are indispensable for estimating experimental variability [78] [4].
- Replicate Concordance: Assess reproducibility using Irreproducible Discovery Rate (IDR) analysis for consistent evaluation across experiments [4].
Diagram 2: Factors influencing ChIP-seq data quality
The Scientist's Toolkit: Essential Research Reagents and Computational Tools
Table 3: Key Research Reagent Solutions for Histone Mark ChIP-seq
| Reagent/Tool Category | Specific Examples | Function and Application Notes |
|---|---|---|
| Validated Antibodies | H3K4me3, H3K27ac, H3K36me3, H3K9me3, H3K27me3 | Must pass primary/secondary characterization; check ENCODE guidelines for approved antibodies [2] |
| Chromatin Shearing | Covaris sonicator, Micrococcal Nuclease | Sonication for cross-linked samples; MNase for nucleosome positioning studies |
| Library Prep Methods | Standard Illumina, ChIPmentation [54] | Standard protocols yield robust results; ChIPmentation preferred for low-input samples (10,000-100,000 cells) |
| Alignment Software | Bowtie, BWA, STAR | Map reads to reference genome; ensure >70% mapping rate for high-quality data [30] [80] |
| Peak Callers for Histone Marks | MACS2 (broad peak mode), SICER, Homer | Use broad peak calling algorithms for domains; focal marks can use narrow peak callers [77] [80] |
| Quality Assessment Tools | FastQC, phantompeakqualtools [30], ChIPQC | Comprehensive QC pipelines essential before biological interpretation |
Determining sufficient read-pairs for histone mark ChIP-seq requires consideration of both the specific histone mark being studied and the biological questions being addressed. The standards presented here, derived from systematic evaluations and consortium guidelines, provide a robust foundation for experimental design:
- Target 45-60 million usable fragments for broad histone marks like H3K36me3 and H3K27me3
- Sequence H3K9me3 to 45 million total mapped reads due to its enrichment in repetitive regions
- Implement rigorous quality control using FRiP, NRF, and cross-correlation metrics
- Include biological replicates and input controls as non-negotiable elements of experimental design
- Consider low-input protocols like ChIPmentation when working with limited biological material
By adhering to these evidence-based guidelines, researchers can ensure their ChIP-seq experiments generate high-quality, reproducible data capable of providing meaningful insights into histone modification landscapes across various biological systems and disease contexts.
Within chromatin immunoprecipitation followed by sequencing (ChIP-seq) experiments for histone mark research, data quality assessment is not merely a preliminary step but the foundation for biologically valid conclusions. Two complementary metrics—Transcription Start Site (TSS) Enrichment and peak calling accuracy—provide a robust framework for this evaluation. TSS Enrichment quantifies the signal-to-noise ratio by measuring the expected accumulation of reads at active gene promoters, a hallmark of informative histone marks like H3K4me3 and H3K27ac [81]. Peak calling accuracy, conversely, assesses the precision with which bioinformatics tools translate this enriched signal into discrete genomic intervals, a process highly dependent on the underlying enrichment pattern of the histone mark (e.g., sharp, broad, or mixed) [82]. For scientists and drug development professionals, a rigorous protocol for evaluating these metrics is critical for ensuring that subsequent analyses, such as differential binding assessment or integration with GWAS data, are built upon a reliable epigenomic landscape. This application note details standardized protocols for calculating TSS Enrichment, provides a comparative analysis of peak callers, and presents a decision framework for optimizing ChIP-seq library preparation and analysis tailored to histone mark profiling.
Protocol: Calculating TSS Enrichment Scores
Background and Principle
The TSS Enrichment Score is a quantitative measure of signal-to-noise in a ChIP-seq experiment. It leverages the well-established biological fact that many active histone marks, such as H3K4me3 and H3K27ac, are highly enriched at gene promoters. A high TSS enrichment score indicates successful immunoprecipitation, low background noise, and high-quality, interpretable data [81]. This metric is superior to basic read counts as it reflects expected biological patterns.
Materials and Reagents
- Computing Environment: A Unix-based environment (e.g., Linux, macOS terminal) with sufficient memory and storage for NGS data analysis.
- Software:
- deepTools: A suite of tools for analyzing deep-sequencing data. Install via conda:
conda install -c bioconda deeptools[26]. - BEDTools: For genomic arithmetic. Install via conda:
conda install -c bioconda bedtools.
- deepTools: A suite of tools for analyzing deep-sequencing data. Install via conda:
- Input Files:
- Alignment File: A sorted BAM file from your ChIP-seq experiment, with a corresponding BAM index file (
.bai). - TSS Annotation File: A BED file containing the genomic coordinates of Transcription Start Sites for the reference genome of interest (e.g., obtained from UCSC Table Browser or GENCODE).
- Alignment File: A sorted BAM file from your ChIP-seq experiment, with a corresponding BAM index file (
Step-by-Step Procedure
Prepare TSS Regions File: Using BEDTools, generate a BED file that defines the regions around TSSs. The standard is to create a 4 kb window centered on the TSS (±2 kb).
Calculate Read Coverage Matrix: Use
computeMatrixfrom deepTools to calculate the read coverage scores across all defined TSS regions.Plot Profile and Calculate Enrichment: The
plotProfiletool generates the enrichment plot and calculates the final score.The TSS enrichment score is the normalized read density at the center of the distribution (the TSS) divided by the average read density at the two flanking regions (the 100 bp at each end) [81].
Data Interpretation
- High-Quality Data: A sharp, prominent peak at the TSS (score typically >10, often much higher for strong marks like H3K4me3).
- Medium-Quality Data: A visible but lower and broader peak (score between 5 and 10).
- Low-Quality/Noisy Data: A flat profile with no distinct peak (score close to 1), indicating failed experiment or excessive background.
Quantitative Comparison of ChIP-seq Performance Metrics
The choice of library preparation kit and input DNA amount significantly impacts key quality metrics, including those related to TSS enrichment and peak calling.
Table 1: Performance of Low-Input ChIP-seq Library Prep Kits on H3K4me3 Data (1 ng input)
| Library Prep Method | Sensitivity (%) | Specificity (%) | Library Complexity (PBC) | Uniquely Mapping Reads (%) |
|---|---|---|---|---|
| Accel-NGS 2S | >95 | >95 | High | Highest |
| ThruPLEX | >95 | >95 | High | High |
| NEB Next Ultra II | >90 | >90 | High | High [38] |
| DNA SMART | ~90 | ~90 | Medium | Medium |
| SeqPlex | ~80 | Lower | Lower | Lower [18] |
Table 2: Impact of Histone Mark Type and Input DNA on Peak Calling and Quality
| Histone Mark | Peak Pattern | Recommended Library Prep Kit | Optimal Input (ng) | TSS Enrichment Expectation |
|---|---|---|---|---|
| H3K4me3 | Sharp peaks | NEB Next Ultra II | 0.1 - 10 | Very High [38] |
| H3K27ac | Sharp peaks | NEB Next Ultra II | 0.1 - 10 | Very High |
| CTCF | Punctate peaks | Diagenode MicroPlex | 1 - 10 | Moderate (site-specific) [38] |
| H3K27me3 | Broad domains | Bioo NEXTflex | 1 - 10 (not low input) | Low (broadly enriched) [38] |
| H3K36me3 | Broad domains | Bioo NEXTflex | 1 - 10 | Low (gene body enriched) [82] |
Protocol: Assessing Peak Calling Accuracy
Background and Principle
Peak calling is the computational process of identifying genomic regions with statistically significant enrichment of sequencing reads. No single peak caller performs optimally across all types of histone marks due to their distinct enrichment patterns [82]. This protocol outlines a strategy for evaluating peak calling accuracy using the Irreproducible Discovery Rate (IDR) framework, which is the gold standard for assessing reproducibility between replicates.
Materials and Reagents
- Software:
- MACS2: Widely used peak caller with settings for both narrow and broad marks.
- IDR: Package for Irreproducible Discovery Rate analysis. Install via conda:
conda install -c bioconda idr. - SICER2: An alternative peak caller specialized for broad histone marks.
- SEACR: A peak caller known for high specificity, often used for CUT&Tag but applicable to ChIP-seq [15].
- Input Files: Sorted BAM files for at least two biological replicates of your ChIP-seq experiment and the corresponding input control.
Step-by-Step Procedure
Call Peaks on Individual Replicates: Run MACS2 on each biological replicate. Specify
--broadfor broad marks like H3K27me3.Run IDR Analysis for Narrow Peaks: IDR helps identify a consistent set of peaks between replicates.
Assess Broad Peaks (Alternative to IDR): For broad marks, overlap between replicates is a common metric.
Data Interpretation
- IDR Output: The output file contains a list of peaks passing a specified IDR threshold (e.g., < 0.05). A high number of IDR-passing peaks indicates high reproducibility and accurate peak calling.
- Fraction of Reads in Peaks (FRiP): Calculate the FRiP score for the final peak set. A FRiP score > 1% is acceptable for histone marks, with >5% being good for many marks like H3K4me3 [81]. This metric directly links peak calling back to the enrichment quality of the data.
Visual Workflow for ChIP-seq Evaluation
The following diagram illustrates the logical workflow for evaluating ChIP-seq success, from raw data to validated peaks, integrating TSS enrichment and peak calling accuracy.
The Scientist's Toolkit: Research Reagent Solutions
Table 3: Essential Reagents and Tools for ChIP-seq Library Evaluation
| Item Name | Function/Description | Example Use Case |
|---|---|---|
| NEB Next Ultra II DNA Library Prep Kit | Prepares sequencing libraries from low-input ChIP DNA. | Optimal for sharp histone marks (H3K4me3, H3K27ac) across a wide input range (0.1-10 ng) [38]. |
| Diagenode MicroPlex Library Prep Kit | Designed for low-input and single-cell ChIP-seq applications. | Preferred for transcription factor (e.g., CTCF) ChIP-seq libraries [38]. |
| Bioo NEXTflex ChIP-seq Kit | A commercial kit for standard and low-input library prep. | Recommended for broad histone marks like H3K27me3 [38]. |
| MACS2 Software | Identifies enriched regions from ChIP-seq data. | Standard peak calling for both narrow and broad marks; requires parameter tuning [82] [26]. |
| SEACR Software | A peak caller designed for high specificity. | Useful for calling peaks from high signal-to-noise data (e.g., CUT&Tag, or high-quality ChIP-seq) [15]. |
| SICER2 Software | Detects diffuse enrichment domains. | Superior for calling broad histone marks where MACS2 may segment signal [82]. |
| deepTools Suite | Analyzes and visualizes deep-sequencing data. | Calculates and visualizes TSS enrichment scores and other quality control metrics [26]. |
| IDR R Package | Statistical method for assessing replicate consistency. | Quantifies reproducibility between biological replicates to generate a high-confidence peak set [81]. |
Conclusion
Successful ChIP-seq library preparation for histone marks hinges on a integrated strategy that combines a deep understanding of epigenetic biology, meticulous optimization of wet-lab protocols, and rigorous data validation. As evidenced by comparative studies, the choice of library preparation method significantly impacts data quality, especially for low-input samples, with methods like Accel-NGS 2S and ThruPLEX demonstrating consistently high performance. Adherence to established consortium guidelines and robust troubleshooting practices is non-negotiable for generating biologically meaningful and reproducible data. Future directions will see these refined protocols further empowering the exploration of chromatin dynamics in physiologically relevant tissue environments, such as solid tumors, accelerating the discovery of epigenetic biomarkers and therapeutic targets in human disease. The integration of molecular barcoding (UMIs) and cost-effective sequencing platforms will continue to enhance data accuracy and accessibility for large-cohort studies.
References
- 1. Efficient In-house Coupling of Sample and Library ... [https://pubmed.ncbi.nlm.nih.gov/40257563/]
- 2. ChIP-seq guidelines and practices of the ENCODE and ... [https://pmc.ncbi.nlm.nih.gov/articles/PMC3431496/]
- 3. ChIP-Seq Data Analysis - CRCD User Manual - Pitt CRC [https://crc-pages.pitt.edu/user-manual/advanced-genomics-support/ChipSeq-data-analysis/]
- 4. Transcription Factor ChIP-seq Data Standards and ... [https://www.encodeproject.org/chip-seq/transcription_factor/]
- 5. Using ChIP-Seq Technology to Generate High-Resolution ... [https://pmc.ncbi.nlm.nih.gov/articles/PMC4151291/]
- 6. Histone Chip-Seq [https://resources.qiagenbioinformatics.com/manuals/clcgenomicsworkbench/current/index.php?manual=Histone_Chip_Seq.html]
- 7. Histone ChIP-seq Data Standards and Processing Pipeline [https://www.encodeproject.org/chip-seq/histone/]
- 8. Protocol for double-crosslinking ChIP-seq to improve data ... [https://pmc.ncbi.nlm.nih.gov/articles/PMC12603744/]
- 9. Deciphering histone mark-specific fine-scale chromatin ... [https://www.nature.com/articles/s41467-025-64350-w]
- 10. ChIP-Seq Analysis: Histone Modifications [https://www.news-medical.net/life-sciences/ChIP-Seq-Analysis-Histone-Modifications.aspx]
- 11. Quality control for ChIP-Seq samples [https://help.partek.illumina.com/partek-genomics-suite/tutorials/chip-seq-analysis/quality-control-for-chip-seq-samples]
- 12. ChIP-seq and Beyond: new and improved methodologies ... [https://pmc.ncbi.nlm.nih.gov/articles/PMC3591838/]
- 13. Pipeline and Tools for ChIP-Seq Analysis [https://www.cd-genomics.com/pipeline-and-tools-comparison-for-chip-seq-analysis.html]
- 14. Detection of broad peaks from ChIP-seq data [https://nbis-workshop-epigenomics.readthedocs.io/en/latest/content/tutorials/chipseqBroadPeaks/lab-broadpeaks.html]
- 15. CUT&Tag recovers up to half of ENCODE ChIP-seq ... [https://www.nature.com/articles/s41467-025-58137-2]
- 16. ChIP-seq Data Processing and Relative and Quantitative ... [https://pmc.ncbi.nlm.nih.gov/articles/PMC12067309/]
- 17. Deciphering histone mark-specific fine-scale chromatin ... [https://pmc.ncbi.nlm.nih.gov/articles/PMC12546738/]
- 18. A comparative study of ChIP-seq sequencing library ... [https://bmcgenomics.biomedcentral.com/articles/10.1186/s12864-016-3135-y]
- 19. Methods for ChIP-seq analysis: A practical workflow and ... [https://www.sciencedirect.com/science/article/pii/S1046202320300591]
- 20. Conservation of regulatory elements with highly diverged ... [https://www.nature.com/articles/s41588-025-02202-5]
- 21. Antibody Validation Webinar Series [https://www.antibodysociety.org/learningcenter/antibody-validation-webinar-series/]
- 22. Refined ChIP‐Seq Protocol for High‐Quality Chromatin ... [https://pmc.ncbi.nlm.nih.gov/articles/PMC12628287/]
- 23. 5 Critical Insights You Need to Know About Antibody ... [https://precisionantibody.com/insights-about-antibody-characterization/]
- 24. Antibody validation strategies, interview with experts [https://www.agrisera.com/en/blogg/agrisera-blog/2025/05/08/antibody-validation-strategies-interview-with-experts.html]
- 25. Chromatin preparation from tissues for ChIP [https://www.abcam.com/en-us/technical-resources/protocols/chromatin-preparation-from-tissues]
- 26. ChIP-seq library preparation and processing [https://bio-protocol.org/exchange/minidetail?id=17041309&type=30]
- 27. Refined ChIP-Seq Protocol for High-Quality Chromatin ... [https://pubmed.ncbi.nlm.nih.gov/41257332/?utm_source=FeedFetcher&utm_medium=rss&utm_campaign=None&utm_content=1-SjSZJSoHBGsnEXcLDjZZ8F-vz5YagNLIUYugSQFZXvZle9Rx&fc=None&ff=20251119210750&v=2.18.0.post22+67771e2]
- 28. ChIP-Seq Sample Preparation Protocol [https://www.cd-genomics.com/chip-seq-sample-preparation-protocol.html]
- 29. Guidelines to Analyze ChIP-Seq Data: Journey Through ... [https://pubmed.ncbi.nlm.nih.gov/39745614/]
- 30. ChIP-seq data processing tutorial [https://nbis-workshop-epigenomics.readthedocs.io/en/latest/content/tutorials/chipseqProc/lab-chipseq-processing.html]
- 31. Chromatin Mapping Basics: ChIP-seq [https://www.epicypher.com/resources/blog/chromatin-mapping-basics-chip-seq/]
- 32. Fragmentation of chromatin for ChIP applications [https://www.sigmaaldrich.com/US/en/technical-documents/technical-article/protein-biology/protein-and-nucleic-acid-interactions/fragmentation-of-chromatin-in-chip?srsltid=AfmBOorjk9SaCnnKnWXdx-WGRcP2VvwZtdX2tQBKmxm9pm-psewM1kM0]
- 33. A Step-by-Step Guide to Successful Chromatin ... [https://www.thermofisher.com/us/en/home/life-science/antibodies/antibodies-learning-center/antibodies-resource-library/antibody-application-notes/step-by-step-guide-successful-chip-assays.html]
- 34. How to Choose Enzymatic Digestion or Sonication for ChIP [https://blog.cellsignal.com/how-to-choose-enzymatic-or-sonication-protocol-for-chip]
- 35. Chromatin immunoprecipitation: Techniques, advances, ... [https://www.abcam.com/en-us/knowledge-center/epigenetics/chromatin-immunoprecipitation-techniques-advances-and-insights]
- 36. BTEP Question Forum - Bioinformatics [https://bioinformatics.ccr.cancer.gov/btep/questions/library-chip-preparation-how-do-i-choose-between-sonication-and-enzymaticbased-chromatin-fragmentation-for-chipseq-how-might-this-affect-sequencing-depth]
- 37. ChIP-seq: using high-throughput sequencing to discover ... [https://pmc.ncbi.nlm.nih.gov/articles/PMC4052679/]
- 38. Commercial ChIP-Seq Library Preparation Kits Performed ... [https://pmc.ncbi.nlm.nih.gov/articles/PMC10001930/]
- 39. High-throughput ChIPmentation: freely scalable, single day ... [https://bmcgenomics.biomedcentral.com/articles/10.1186/s12864-018-5299-0]
- 40. Chip seq DNA Library Preparation [https://www.neb.com/en-us/products/next-generation-sequencing-library-preparation/library-preparation-for-illumina/dna-library-prep-for-illumina/dna-library-prep-for-illumina/chip-seq-dna-library-preparation?srsltid=AfmBOorEK-cBNmiHlYG_2Dtjr68IKyGH1dTMlm3E3gSjM3sN0LHQIbIe]
- 41. MAnorm: a robust model for quantitative comparison of ChIP ... [https://genomebiology.biomedcentral.com/articles/10.1186/gb-2012-13-3-r16]
- 42. NGS Library Construction | DNA Technologies Core - UC Davis [https://dnatech.ucdavis.edu/ngs-library-construction]
- 43. TELP, a sensitive and versatile library construction method for ... [https://pmc.ncbi.nlm.nih.gov/articles/PMC4381050/]
- 44. Chip seq DNA Library Preparation [https://www.neb.com/en-us/products/next-generation-sequencing-library-preparation/library-preparation-for-illumina/dna-library-prep-for-illumina/dna-library-prep-for-illumina/chip-seq-dna-library-preparation?srsltid=AfmBOoqgZ1blotyksbyxWXu_2aDx3iN2syfojfqkh7Ox-uENY95aPJHg]
- 45. Which NGS DNA Library Prep Kit should you choose? [https://frontlinegenomics.com/which-ngs-dna-library-prep-kit-should-you-choose/]
- 46. Performance comparison of four exome capture platforms on ... [https://bmcgenomics.biomedcentral.com/articles/10.1186/s12864-025-12104-9]
- 47. Adaptation of PCR-based library preparation for MGI ... [https://pubmed.ncbi.nlm.nih.gov/40465654/]
- 48. ChIP-qPCR, ChIP-seq, CUT&RUN, CUT&Tag, and More [https://www.bosterbio.com/blog/post/a-comprehensive-guide-to-epigenomic-profiling-chip-qpcr-chip-seq-cut-and-run-cut-and-tag-and-more?srsltid=AfmBOopA9WxuSAQzGY7x53UnPgXPxIkL47VPN4YH-WB2de4AlnUYu4Ik]
- 49. Cross-linking ChIP-seq protocol [https://www.abcam.com/en-us/technical-resources/protocols/cross-linking-chip-seq]
- 50. Effects of sheared chromatin length on ChIP-seq quality ... [https://pmc.ncbi.nlm.nih.gov/articles/PMC8495733/]
- 51. Protocol for double-crosslinking ChIP-seq to improve data ... [https://www.sciencedirect.com/science/article/pii/S2666166725005775]
- 52. How to Get Quality DNA for ChIP-Seq [https://www.zymoresearch.com/blogs/blog/how-to-get-quality-dna-for-chip-sequencing?srsltid=AfmBOookdbQsFIsceLI71kb3XLTB9b43MqTpn_-mTYl_vsWA1B20PxiN]
- 53. Ligation-free ChIP-seq library preparation [https://www.takarabio.com/learning-centers/next-generation-sequencing/technical-notes/epigenetic-sequencing/chip-seq-libraries-from-ssdna?srsltid=AfmBOorxR3tktMUL7wCc46xMsHW9XwVYiAwK-GzXNLLUHWaXOCMTqE6n]
- 54. ChIPmentation: fast, robust, low-input ChIP-seq for ... [https://pmc.ncbi.nlm.nih.gov/articles/PMC4589892/]
- 55. Histone modification ChIP-seq on Arabidopsis thaliana ... [https://en.bio-protocol.org/en/bpdetail?id=4211&type=0]
- 56. DNA Library Prep Kit for Illumina Protocol (ChIP-seq, ... [https://www.cellsignal.com/learn-and-support/protocols/protocol-dna-lib-prep-kit-for-illumina?srsltid=AfmBOooPFYn5NuT9BVqGCFak91und18bopn0p7Gs3MnhAgFF-zlhvCK0]
- 57. ChIP-seq Library preparation [https://www.protocols.io/view/chip-seq-library-preparation-bn35mgq6.html]
- 58. Overview of Chromatin Immunoprecipitation (ChIP) [https://www.cellsignal.com/applications/chip-and-chip-seq/regulation-expression-in-cell-and-tissue?srsltid=AfmBOoq4LPTzHb5B4ijGDv-IT0TIuZqlFSUeFfizZj942d7aF5YwOuDK]
- 59. ChIP-MNase sample preparation and sequencing [https://bio-protocol.org/exchange/minidetail?id=5979055&type=30]
- 60. An Optimized Chromatin Immunoprecipitation Protocol for ... [https://pmc.ncbi.nlm.nih.gov/articles/PMC7357673/]
- 61. Optimized CUT&RUN protocol for activated primary mouse ... [https://pmc.ncbi.nlm.nih.gov/articles/PMC12021426/]
- 62. How PCR duplicates arise in next-generation sequencing [https://www.cureffi.org/2012/12/11/how-pcr-duplicates-arise-in-next-generation-sequencing/]
- 63. Impact of Reducing DNA Input on Next-Generation ... [https://www.sciencedirect.com/science/article/pii/S1525157820300428]
- 64. Ligation-free ChIP-seq library preparation [https://www.takarabio.com/learning-centers/next-generation-sequencing/technical-notes/epigenetic-sequencing/chip-seq-libraries-from-ssdna]
- 65. xGen 2S DNA Library Prep Ideal For ChIP Seq & Hi-C | IDT [https://www.idtdna.com/pages/products/next-generation-sequencing/workflow/xgen-ngs-library-preparation/dna-library-preparation/xgen-2s-dna-library-prep]
- 66. NGSC - FAQS - ChIP-Seq [https://ngsc.med.upenn.edu/faqs-mini/ChIP-Seq.html]
- 67. Visualization of peaks | Introduction to ChIP-Seq using high ... [https://hbctraining.github.io/Intro-to-ChIPseq/lessons/10_data_visualization.html]
- 68. Chapter 18 ChIP-Seq | Choosing Genomics Tools [https://hutchdatascience.org/Choosing_Genomics_Tools/chip-seq-1.html]
- 69. Evaluating Reproducibility and Best Practices for Replicate ... [https://pmc.ncbi.nlm.nih.gov/articles/PMC12524710/]
- 70. Benchmark of chromatin–protein interaction methods in ... [https://www.frontiersin.org/journals/cell-and-developmental-biology/articles/10.3389/fcell.2025.1572405/full]
- 71. Notes on ChIP-seq and other-seq-related tools [https://github.com/mdozmorov/ChIP-seq_notes]
- 72. a fully automated, web-based platform for end-to-end ChIP- ... [https://pmc.ncbi.nlm.nih.gov/articles/PMC12512806/]
- 73. The ChIP-Seq tools and web server: a resource for analyzing ... [https://bmcgenomics.biomedcentral.com/articles/10.1186/s12864-016-3288-8]
- 74. Antibody characterization process [https://www.encodeproject.org/help/antibody_characterization_process/]
- 75. Current ENCODE Experiment Guidelines [https://www.encodeproject.org/about/experiment-guidelines/]
- 76. Quality Metrics [https://genome.ucsc.edu/encode/qualityMetrics.html]
- 77. Systematic evaluation of factors influencing ChIP-seq fidelity [https://pmc.ncbi.nlm.nih.gov/articles/PMC3477507/]
- 78. 9.3 Factors that affect ChIP-seq experiment and analysis quality [https://compgenomr.github.io/book/factors-that-affect-chip-seq-experiment-and-analysis-quality.html]
- 79. Recommended coverage depth for ChIP Seq (H3K9me3 ) [https://bioinformatics.stackexchange.com/questions/14516/recommended-coverage-depth-for-chip-seq-h3k9me3]
- 80. ChIP-Seq Analysis Tutorial [https://www.basepairtech.com/knowledge-center/chip-seq-analysis-tutorial/]
- 81. Terms and Definitions [https://www.encodeproject.org/data-standards/terms/]
- 82. Comparative analysis of commonly used peak calling ... [https://pmc.ncbi.nlm.nih.gov/articles/PMC7808876/]