Optimizing Cloud-Based STAR RNA-seq Workflows: A Comprehensive Guide for Scalable and Cost-Effective Transcriptomics
This article provides a comprehensive guide for researchers and drug development professionals on implementing and optimizing the STAR aligner for RNA-seq analysis in cloud environments.
Optimizing Cloud-Based STAR RNA-seq Workflows: A Comprehensive Guide for Scalable and Cost-Effective Transcriptomics
Abstract
This article provides a comprehensive guide for researchers and drug development professionals on implementing and optimizing the STAR aligner for RNA-seq analysis in cloud environments. Covering foundational concepts through advanced optimization strategies, it details how cloud-native architectures enable processing of terabyte-scale datasets efficiently. The content explores cost-performance trade-offs, practical troubleshooting for common pipeline challenges, and validation methodologies to ensure biological accuracy. By synthesizing recent performance analyses and optimization techniques, this guide serves as an essential resource for teams seeking to leverage cloud computing for high-throughput transcriptomics while maintaining analytical rigor and reproducibility.
Cloud Computing and STAR Aligner: Foundations for Modern Transcriptomics
The field of genomics is experiencing an unprecedented data explosion. The integration of cutting-edge sequencing technologies, artificial intelligence, and multi-omics approaches has fundamentally reshaped biological research, enabling unprecedented insights into human biology and disease [1]. Next-Generation Sequencing (NGS) technologies, particularly for RNA sequencing (RNA-seq), have democratized genomic research by making large-scale sequencing faster, cheaper, and more accessible than ever before [1]. However, this progress has created a monumental computational challenge: a single human genome sequence generates approximately 150 gigabytes of data, while large-scale studies can require petabytes of storage capacity [2]. Traditional computing methods, which rely on local servers and personal computers, struggle immensely with such immense datasets, creating significant bottlenecks that slow down scientific discovery [2]. Cloud computing has emerged as an essential solution to this data deluge, providing researchers with on-demand access to scalable, high-performance computing resources without the need for massive infrastructure investments [3] [2]. This paradigm shift is particularly crucial for modern RNA-seq analysis, where tools like the STAR aligner require substantial computational resources to process the massive volumes of data generated by transcriptomic studies [4] [5]. By leveraging cloud infrastructure, researchers can now perform analyses in a fraction of the time it would take using traditional methods, enabling rapid insights into gene expression, alternative splicing, and transcriptional regulation that were previously impractical or impossible [4].
The Computational Challenge of RNA-seq Data
Scale of the Data Problem
The data generation capabilities of modern sequencing technologies have far outpaced traditional computational capacity. While the initial Human Genome Project took 13 years to complete, today's cloud-based platforms can process whole-genome sequencing in hours [2]. This acceleration comes with massive data storage and processing requirements that challenge institutional computing resources. RNA-seq experiments, especially those utilizing single-cell or spatial transcriptomics approaches, regularly generate terabytes of data that require specialized, scalable infrastructure for efficient processing [1] [6].
The fundamental challenge lies not only in the volume of data but also in its complexity. RNA-seq analysis involves multiple computationally intensive steps, including quality control, alignment, quantification, and differential expression analysis [4] [7]. Each step demands significant memory, processing power, and storage capacity, often requiring different computational optimizations. For example, the STAR aligner, one of the most widely used tools for RNA-seq alignment, requires substantial memory for genome indexing - often needing 48 GB or more for human genomes [4]. This memory requirement alone exceeds the capacity of most personal computers and many institutional servers, particularly when multiple analyses need to be run concurrently.
Limitations of Traditional Computing Infrastructure
Traditional computing infrastructure struggles with RNA-seq data on multiple fronts. Local servers and workstations typically have fixed capacity, creating bottlenecks during peak usage periods and remaining underutilized during slower periods [2]. The procurement process for additional hardware can take weeks or months, significantly delaying research progress [2]. Furthermore, maintaining and upgrading physical infrastructure requires substantial financial investment and specialized IT expertise, diverting resources from core research activities [3].
The pay-as-you-go model of cloud computing eliminates these constraints by providing instant access to virtually unlimited computational resources [3] [2]. Researchers can scale their computing power based on immediate project needs, accessing supercomputer-level resources when required without long-term commitment or infrastructure management [2]. This flexibility is particularly valuable for RNA-seq studies with variable data volumes or processing requirements across different stages of analysis.
Table 1: Comparative Analysis of Computing Approaches for RNA-seq Analysis
| Computing Aspect | Traditional Computing | Cloud Computing |
|---|---|---|
| Resource Scalability | Fixed capacity; requires hardware procurement for expansion | Dynamic, on-demand scaling based on workload requirements |
| Cost Structure | High upfront capital expenditure for hardware | Pay-as-you-go model with no upfront costs |
| Accessibility | Limited to physical location or institutional network | Global access via internet connection |
| Maintenance Responsibility | User/institution responsible for hardware and software maintenance | Cloud provider manages infrastructure maintenance and updates |
| Typical Setup Time | Weeks to months for new hardware | Minutes to hours for provisioning new resources |
| Suitability for Large RNA-seq Studies | Limited by local storage and processing constraints | Virtually unlimited capacity for large-scale studies |
Cloud-Native RNA-seq Workflow Architecture
Core Components of Cloud-Based RNA-seq Analysis
Implementing an effective cloud-based RNA-seq analysis pipeline requires several interconnected components that leverage the unique advantages of cloud infrastructure. The core architecture typically includes: (1) scalable object storage for raw sequencing data and processed files, (2) on-demand virtual machines with appropriate CPU and memory configurations, (3) containerization technologies for reproducible tool deployment, (4) workflow management systems for pipeline orchestration, and (5) data analysis platforms for visualization and interpretation [4] [7].
Cloud storage solutions such as Amazon S3 and Google Cloud Storage provide durable, scalable repositories for massive RNA-seq datasets, with automatic replication and robust access controls [3]. These storage systems seamlessly integrate with cloud computing resources, enabling efficient data transfer during processing. The computational heavy lifting occurs on virtual machines specifically configured for bioinformatics workloads, with instance types optimized for memory-intensive operations like genome alignment or CPU-intensive tasks like quality control [4] [5].
Containerization technologies, particularly Docker, play a crucial role in ensuring reproducibility and simplifying dependency management [4] [7]. By packaging analysis tools and their dependencies into standardized containers, researchers can create portable, version-controlled analysis environments that produce consistent results across different cloud platforms and computing environments. This approach eliminates the "it works on my machine" problem that frequently plagues bioinformatics analyses.
Workflow Management Systems
Workflow management systems like Nextflow provide the orchestration layer that coordinates the various steps of RNA-seq analysis across cloud resources [7]. These systems enable researchers to define complex, multi-step pipelines in a reproducible manner, with automatic handling of job scheduling, failure recovery, and resource management. Nextflow's integration with Google Batch, for example, allows seamless execution of RNA-seq pipelines on cloud infrastructure without manual intervention [7].
Platforms like Nextflow Tower further simplify workflow execution by providing a web-based interface for monitoring pipeline progress, managing computational environments, and tracking analysis metrics [7]. This abstraction layer makes sophisticated cloud-based RNA-seq analysis accessible to researchers without extensive computational expertise, democratizing access to high-performance bioinformatics capabilities.
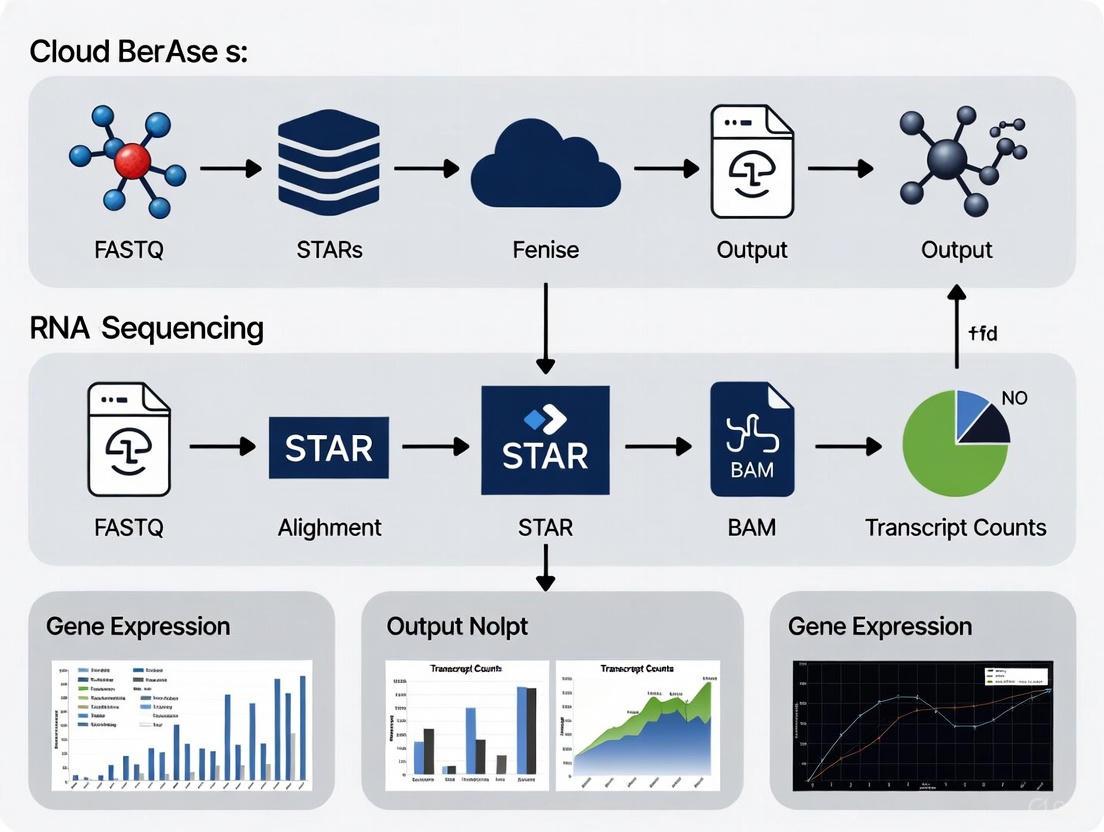
Cloud-Based RNA-seq Analysis Workflow: This diagram illustrates the core steps in a cloud-native RNA-seq analysis pipeline, from raw data processing in cloud storage through alignment, quantification, and differential expression analysis performed within scalable cloud computing resources.
STAR Aligner Implementation: Protocols and Optimization
Genome Index Generation
The first critical step in STAR-based RNA-seq analysis is generating a genome index, which significantly impacts alignment speed and accuracy. This process requires both the reference genome sequence in FASTA format and gene annotation in GTF or GFF format [4] [7]. For human studies, the GRCh38 reference genome and corresponding GENCODE annotations (version 36 or later) represent current best practices [4] [8].
The genome index generation should be performed on a cloud instance with sufficient memory - typically a machine with 48 GB RAM or more for human genomes [4]. The following protocol outlines the key steps:
Data Preparation: Download reference genome and annotation files from authoritative sources such as GENCODE and store them in cloud storage for reproducible access [4] [7].
Containerized Execution: Use Docker containers to ensure version control and reproducibility of the indexing process. A specialized container with STAR pre-installed can be deployed on cloud instances [4].
Index Command Execution: Run the STAR genome generation command with appropriate parameters. A typical implementation includes:
This command utilizes 8 CPU cores (--runThreadN 8) and specifies an overhang value (--sjdbOverhang 100) corresponding to the read length minus 1 [4].
- Storage of Index: Once generated, the genome index should be stored in cloud storage for reuse across multiple alignment jobs, avoiding redundant computation [4] [7].
RNA-seq Alignment and Quantification
After genome index generation, the actual alignment of RNA-seq data can proceed. This process maps the sequencing reads in FASTQ format to the reference genome and generates alignment files (BAM) along with gene-level counts [4] [7]. A cloud-optimized approach enables parallel processing of multiple samples, dramatically reducing overall processing time.
The alignment protocol involves:
Sample Processing Configuration: Create a tab-separated value (TSV) file specifying the input FASTQ files and output paths for each sample. This enables parallel processing of multiple samples through array jobs [4].
Alignment Execution: For each sample, execute the STAR alignment command:
This command uses 4 CPU cores (--runThreadN 4) and automatically decompresses gzipped FASTQ files (--readFilesCommand zcat) [4].
Quantification: Following alignment, tools like RSEM (RNA-Seq by Expectation Maximization) can be used to estimate gene and isoform abundances [7]. The integration of this step within the cloud pipeline enables seamless transition from alignment to quantification without data transfer bottlenecks.
Results Loading to BigQuery: For large-scale studies, results can be loaded directly into cloud-based data warehouses like Google BigQuery for efficient querying and downstream analysis [7]. This approach facilitates collaborative exploration of results across research teams.
Table 2: Computational Requirements for Key RNA-seq Analysis Steps
| Analysis Step | Recommended Cloud Instance Type | Memory Requirements | Approximate Execution Time* | Key Software Tools |
|---|---|---|---|---|
| Genome Indexing | Memory-optimized (e.g., n1-highmem-8) | 48+ GB | 60-90 minutes | STAR, HISAT2 |
| Read Alignment | Compute-optimized (e.g., n1-standard-8) | 32+ GB | 30-60 minutes per sample | STAR, HISAT2 |
| Gene Quantification | Standard instances (e.g., n1-standard-4) | 16+ GB | 15-30 minutes per sample | RSEM, featureCounts |
| Differential Expression | Memory-optimized (e.g., n1-highmem-4) | 32+ GB | Varies by sample size | DESeq2, edgeR, limma |
| Quality Control | Standard instances (e.g., n1-standard-2) | 8+ GB | 10-20 minutes per sample | FastQC, MultiQC |
Execution times are approximate and depend on sample size, read depth, and instance specifications.
Performance Analysis and Cost Optimization
Computational Efficiency Gains
Cloud-based implementation of STAR RNA-seq workflows delivers substantial performance improvements over traditional computing approaches. Recent research demonstrates that optimized cloud architectures can process tens to hundreds of terabytes of RNA-seq data with significant efficiency gains [5]. One key optimization - early stopping of alignment processes - can reduce total alignment time by approximately 23% without compromising results accuracy [5].
The scalability of cloud environments enables additional performance enhancements through parallel processing. Unlike traditional computing environments where samples are typically processed sequentially due to resource constraints, cloud platforms can align hundreds of samples simultaneously through array jobs [4]. This approach reduces the total analysis time from weeks to hours for large-scale studies, accelerating the research timeline dramatically.
Performance analysis of the STAR aligner in cloud environments has identified optimal instance types for different stages of RNA-seq processing [5]. Memory-optimized instances provide the best price-to-performance ratio for genome indexing and alignment steps, while compute-optimized instances are more efficient for quantification and quality control steps. This specialized allocation of resources further enhances overall workflow efficiency.
Cost Management Strategies
While cloud computing offers unparalleled scalability, cost management remains an important consideration. Several strategies can optimize cloud spending for RNA-seq analyses:
Spot/Preemptible Instances: Using spot instances (AWS) or preemptible instances (Google Cloud) can reduce compute costs by 60-90% for fault-tolerant workflows [4] [5]. These instances are available at discounted prices with the tradeoff that they may be terminated if capacity is needed elsewhere.
Rightsizing Resources: Selecting appropriately sized instances for each analysis step prevents overprovisioning. Monitoring tools provided by cloud platforms can identify underutilized resources and suggest more cost-effective instance types [3].
Storage Lifecycle Policies: Implementing automated storage lifecycle policies transitions data to cheaper storage classes (e.g., Amazon Glacier or Google Cloud Archive) when it is no longer frequently accessed, reducing storage costs by up to 70% [3].
Workflow Optimization: Recent research has demonstrated that algorithm-level optimizations, such as the early stopping technique for STAR alignment, not only improve performance but also directly reduce computational costs by minimizing resource utilization [5].
Table 3: Cost Optimization Strategies for Cloud-Based RNA-seq Analysis
| Strategy | Implementation Approach | Potential Cost Reduction | Considerations |
|---|---|---|---|
| Spot/Preemptible Instances | Use for fault-tolerant workflow steps | 60-90% for compute costs | Possible job interruption; requires checkpointing |
| Rightsizing Instances | Monitor CPU and memory utilization; select optimal instance types | 20-40% for compute costs | Requires performance testing and monitoring |
| Storage Tiering | Implement lifecycle policies to archive old data | 40-70% for storage costs | Retrieval latency for archived data |
| Container Optimization | Use lightweight base images; multi-stage builds | 10-20% for storage and data transfer | Requires Docker expertise |
| Workflow Optimization | Implement early stopping; efficient algorithm selection | 15-25% for compute costs | Requires validation of result quality |
Essential Research Reagents and Computational Tools
Successful implementation of cloud-based RNA-seq analysis requires both wet-lab reagents and computational resources. The following toolkit encompasses the essential components for end-to-end RNA-seq studies in cloud environments.
Table 4: Research Reagent Solutions for Cloud-Based RNA-seq Analysis
| Category | Specific Tools/Platforms | Function/Purpose |
|---|---|---|
| Cloud Platforms | Google Cloud Platform (GCP), Amazon Web Services (AWS) | Provides scalable infrastructure for storage and computation |
| Workflow Management | Nextflow, dsub, Cromwell | Orchestrates multi-step analysis pipelines across cloud resources |
| Containerization | Docker, Singularity | Packages tools and dependencies for reproducible execution |
| RNA-seq Alignment | STAR, HISAT2 | Aligns RNA sequencing reads to reference genome |
| Quality Control | FastQC, MultiQC, Trim Galore | Assesses data quality; performs adapter trimming and quality filtering |
| Quantification | RSEM, featureCounts, salmon | Estimates gene and transcript abundance from aligned reads |
| Differential Expression | DESeq2, edgeR, limma | Identifies statistically significant expression changes between conditions |
| Data Storage & Analysis | Google BigQuery, Amazon Athena | Enables scalable querying and analysis of results data |
| Reference Data Sources | GENCODE, NCBI RefSeq, Ensembl | Provides reference genomes and annotation files |
| Public Data Repositories | TCGA, GTEx, GEO | Sources of publicly available RNA-seq data for validation and meta-analysis |
The integration of cloud computing with RNA-seq analysis represents a paradigm shift in how researchers approach transcriptomic studies. The scalable nature of cloud infrastructure directly addresses the computational challenges posed by ever-increasing data volumes, while simultaneously reducing barriers to high-performance bioinformatics [3] [2]. The implementation of STAR-based workflows in cloud environments demonstrates tangible benefits in both performance and cost-efficiency, particularly through optimizations that can reduce alignment time by 23% or more [5].
As RNA-seq technologies continue to evolve toward single-cell and spatial transcriptomics approaches, generating even larger and more complex datasets, the importance of cloud computing will only intensify [1] [6]. The protocols and strategies outlined in this article provide researchers with a framework for leveraging cloud infrastructure to accelerate discovery while maintaining reproducibility and analytical rigor. By adopting these cloud-native approaches, the research community can fully harness the potential of RNA-seq technology to advance our understanding of biology and disease.
The accurate alignment of high-throughput RNA sequencing (RNA-seq) data is a foundational step in genomic analysis, enabling the interpretation of the transcriptome's complex structure. Unlike DNA sequencing, RNA-seq must account for spliced transcripts, where non-contiguous exons are joined together after intron removal. This presents a unique computational challenge: mapping short sequencing reads that may span these splice junctions back to a reference genome. The Spliced Transcripts Alignment to a Reference (STAR) software was developed specifically to address this challenge, outperforming earlier aligners by a factor of more than 50 in mapping speed while simultaneously improving sensitivity and precision [9]. Its ability to rapidly and accurately process vast datasets, such as the large ENCODE Transcriptome RNA-seq dataset comprising over 80 billion reads, has made it an indispensable tool in modern genomics [9]. For researchers implementing cloud-based RNA-seq workflows, STAR's performance characteristics directly influence computational resource requirements, execution time, and ultimately, the cost and feasibility of large-scale transcriptomic studies [10].
STAR's core functionality extends beyond basic alignment to include unbiased de novo detection of canonical and non-canonical splices, as well as chimeric (fusion) transcripts [9] [11]. Furthermore, it is capable of mapping full-length RNA sequences, making it suitable for the emerging long-read sequencing technologies [9]. In cloud-based implementations, where managing computational resources is critical, understanding STAR's underlying algorithm and its configuration is essential for optimizing workflow efficiency. The following sections detail the algorithmic foundations of STAR, its performance advantages, and practical protocols for its implementation in transcriptomic research.
Algorithmic Principles of STAR
The STAR algorithm employs a novel strategy fundamentally different from many earlier RNA-seq aligners, which were often extensions of contiguous DNA short-read mappers. Instead, STAR aligns non-contiguous sequences directly to the reference genome using a method based on sequential maximum mappable seed search followed by a clustering and stitching procedure [9]. This two-phase approach allows it to efficiently identify splice junctions in a single alignment pass without prior knowledge of their locations.
Core Two-Pass Alignment Strategy
STAR's operation can be divided into two main phases: seed searching and clustering/stitching/scoring.
Seed Search with Maximal Mappable Prefix (MMP): The central concept of STAR's first phase is the search for the Maximal Mappable Prefix (MMP). For a given read sequence and starting position, the MMP is defined as the longest substring that matches one or more substrings of the reference genome exactly [9]. This search is implemented through uncompressed suffix arrays (SAs), which provide a computationally efficient means for string matching with logarithmic scaling relative to the genome size [9]. The process is sequential; after finding the MMP for the beginning of a read, the algorithm repeats the search for the remaining unmapped portion. This natural progression allows STAR to pinpoint splice junction locations precisely without resorting to arbitrary read splitting. The use of uncompressed SAs confers a significant speed advantage, traded off against higher memory usage compared to aligners using compressed indexes [9].
Clustering, Stitching, and Scoring: In the second phase, STAR assembles complete read alignments by stitching together all seeds discovered in the first phase. Seeds are first clustered by proximity to selected "anchor" seeds. All seeds mapping within user-definable genomic windows around these anchors are then stitched together using a frugal dynamic programming algorithm. This algorithm allows for any number of mismatches but only one insertion or deletion per seed-pair alignment [9]. A key feature is the concurrent processing of paired-end read mates. STAR treats the mates as a single sequence, which increases alignment sensitivity, as only one correct anchor from one mate is sufficient to accurately align the entire read pair [9].
Handling Complex Alignments
The MMP strategy enables STAR to manage various sequencing artifacts and complex genomic events.
- Mismatches, Indels, and Poly-A Tails: If an MMP search is interrupted by mismatches, the resulting seeds act as anchors that can be extended to form gapped alignments. In cases where extension does not yield a good genomic match, STAR can identify poly-A tails, adapter sequences, or low-quality sequencing tails [9].
- Chimeric and Fusion Transcript Detection: STAR can detect chimeric alignments where different parts of a read map to distal genomic loci, different chromosomes, or different strands. This includes instances where the chimeric junction lies in the unsequenced portion between paired-end mates, allowing for sensitive fusion transcript discovery [9] [11].
Table 1: Key Algorithmic Components of STAR and Their Functions
| Algorithmic Component | Description | Function in Alignment |
|---|---|---|
| Maximal Mappable Prefix (MMP) | Longest exact match between a read substring and the reference genome [9]. | Acts as an anchor; identifies potential exonic segments and splice junctions. |
| Uncompressed Suffix Array (SA) | Data structure for efficient string matching of the reference genome [9]. | Enables fast MMP search with logarithmic scaling; increases mapping speed. |
| Seed Clustering & Stitching | Process of grouping nearby MMPs and connecting them with gapped alignments [9]. | Reconstructs the complete alignment of a spliced read across introns. |
| Concurrent Paired-End Processing | Treating mate pairs as a single sequence during alignment [9]. | Increases sensitivity by leveraging information from both reads simultaneously. |
The following diagram illustrates the core two-step workflow of the STAR aligner algorithm.
Performance and Advantages in Transcriptomics
STAR's design confers significant performance and functional benefits that make it particularly suited for both large-scale consortia projects and cloud-based analytical workflows.
Speed and Accuracy
STAR was developed to address the throughput bottlenecks presented by modern sequencing technologies. In its original publication, it demonstrated the capability to align 550 million 2x76 bp paired-end reads per hour on a standard 12-core server, a speed that was more than 50 times faster than other contemporary aligners [9]. This high mapping speed does not come at the cost of accuracy. Experimental validation of 1960 novel intergenic splice junctions discovered by STAR using Roche 454 sequencing confirmed a high precision rate of 80-90% [9]. This combination of speed and precision is crucial for processing the tens to hundreds of terabytes of data generated in large-scale projects like the Transcriptomics Atlas [10].
Superior Detection of Splicing Events
A key advantage of STAR over "lightweight" pseudoalignment methods is its detailed alignment-based approach. Studies have shown that the choice of alignment methodology can significantly influence subsequent transcript abundance estimates and differential expression analysis [12]. While lightweight methods are fast and memory-efficient, they can suffer from spurious mappings because they do not validate fragment mappings with a formal alignment score [12]. STAR, as a full aligner, provides more accurate mapping in complex regions, which translates to more reliable quantification, especially for applications requiring the discovery of novel splice junctions, fusion genes, or other complex transcriptional events [13] [12]. This makes STAR the "superior option" when the research aim extends beyond simple gene-level quantification to include splice variant analysis [13].
Cloud-Based Performance Optimizations
Recent research into optimizing STAR in cloud environments has identified specific strategies to enhance its performance and cost-effectiveness further.
- Early Stopping: One significant optimization is the implementation of an early stopping feature, which can reduce the total alignment time by 23% [10] [5]. This optimization leverages the fact that for many samples, a sufficient amount of reads can be aligned quickly, and prolonged runtime yields diminishing returns, a feature exploitable in quality-controlled, large-scale datasets.
- Instance Selection and Spot Usage: Cloud deployments benefit from selecting the most cost-efficient EC2 instance types, typically those with high memory and CPU resources that match STAR's demands. Furthermore, the use of spot instances (preemptible cloud VMs) has been verified as a viable and cost-saving strategy for running this resource-intensive aligner [10].
Table 2: Comparative Analysis of STAR vs. Pseudoaligners like Kallisto
| Feature | STAR (Alignment-Based) | Pseudoaligners (e.g., Kallisto) |
|---|---|---|
| Core Method | Full spliced alignment to the genome using MMP and seeding [9]. | Pseudoalignment to a transcriptome index using k-mer matching [13]. |
| Primary Output | Read counts per gene, splice junction counts, BAM alignment files [13]. | Transcript abundance estimates (TPM, counts) [13]. |
| Key Strength | High accuracy for novel splice/fusion detection; provides genomic coordinates [13] [12]. | Extremely fast and memory-efficient; ideal for high-sample-size quantification [13]. |
| Computational Load | High memory (tens of GiBs) and CPU; benefits from high-throughput disks [10]. | Low memory and CPU requirements [14]. |
| Ideal Use Case | Discovery of novel isoforms, splice junctions, and fusion genes [13]. | Rapid gene-level quantification on well-annotated transcriptomes [13]. |
Experimental Protocols and Cloud Implementation
Implementing STAR effectively requires careful attention to experimental design, data preparation, and computational configuration. The following protocols are adapted from benchmark studies and cloud optimization experiments.
Protocol: Standard RNA-seq Alignment with STAR
This protocol outlines the key steps for aligning bulk RNA-seq data using STAR, from data preparation to quantification.
Step 1: Preprocessing of Raw Sequencing Data
- Input: Raw sequencing reads in FASTQ format. For paired-end experiments, two FASTQ files are required.
- Quality Control: Use tools like FastQC to assess read quality.
- Adapter Trimming: Remove adapter sequences using tools such as Cutadapt or Trimmomatic. Adapter contamination reduces alignment quality and is a common issue in raw reads [14].
Step 2: Generating the Genome Index
- Input Requirements: A reference genome sequence (FASTA format) and corresponding annotation file (GTF format).
- STAR Command: Run STAR in genomeGenerate mode. The key parameter
--sjdbOverhangshould be set to the read length minus 1. This step is computationally intensive but needs to be performed only once for a given genome and annotation combination. - Computational Note: Indexing the human genome requires approximately 30 GB of RAM [10].
Step 3: Aligning Reads
- Input: Trimmed FASTQ files and the pre-built genome index.
- Key STAR Parameters:
--runThreadN: Number of threads for parallel execution.--readFilesCommand: For compressed input files (e.g.,--readFilesCommand zcat).--outSAMtype: Specify output format, typically BAM sorted by coordinate (--outSAMtype BAM SortedByCoordinate).--quantMode: Enables transcript quantification.--quantMode GeneCountsoutputs read counts per gene directly [10].
- Output: A sorted BAM file with alignments and a file with read counts per gene.
Step 4: Downstream Quantification and Analysis
- While STAR can produce gene counts directly, tools like Salmon (in alignment-based mode) can be used on the BAM file for potentially more accurate transcript-level quantification [12]. The BAM file can also be used for variant calling, visualization, and detecting novel events.
Protocol: Cloud-Native STAR Workflow Optimization
For implementing STAR at scale in a cloud environment, specific architectural and configuration optimizations are recommended based on recent research [10].
Step 1: Architectural Design
- Use a scalable, cloud-native architecture built on managed services. A microservices approach, containerizing the pipeline with Docker, allows for reproducibility and efficient resource management [14]. AWS Batch or Kubernetes with workflow managers (e.g., Argo Workflows) are suitable for orchestration.
Step 2: Data Distribution Strategy
- The precomputed STAR genome index must be efficiently distributed to all worker instances. Solutions include pre-loading index files onto a shared network file system or using fast cloud storage with caching mechanisms to avoid becoming a bottleneck.
Step 3: Resource Configuration and Optimization
- Instance Selection: Choose compute-optimized (e.g., C5) or memory-optimized (e.g., R5) EC2 instance families that provide a balance of CPU and memory. Test for the most cost-efficient type.
- Parallelism: Analyze the scalability of STAR on a single node to find the optimal core count, as performance may not scale linearly beyond a certain point [10].
- Cost Saving: Leverage spot instances for alignment tasks, as they have been shown to be suitable for running STAR, offering significant cost reductions [10].
- Early Stopping: Implement the early stopping optimization, which can halt alignment once a sufficient proportion of reads have been mapped, reducing runtime and cost by 23% [10] [5].
The following diagram visualizes this optimized cloud-based workflow.
Successful execution of a STAR-based RNA-seq pipeline relies on a suite of computational reagents and resources. The table below details these essential components.
Table 3: Key Research Reagent Solutions for STAR RNA-seq Workflows
| Resource/Reagent | Function and Role in the Workflow |
|---|---|
| Reference Genome | A high-quality reference genome (e.g., GRCh38 for human) in FASTA format. Serves as the foundational scaffold for read alignment [10]. |
| Genome Annotation | A comprehensive annotation file (GTF/GFF format) specifying known gene and transcript models. Crucial for generating the splice junction database during STAR indexing and for accurate quantification [10]. |
| STAR Genome Index | A precomputed index of the reference genome and annotations, generated by STAR. This data structure is loaded into memory during alignment to enable ultra-fast searching [10] [9]. |
| SRA Toolkit | A collection of tools for accessing and manipulating sequencing data from the NCBI Sequence Read Archive (SRA). It is used to retrieve (prefetch) and convert (fasterq-dump) public data into the FASTQ format for alignment [10]. |
| High-Performance Computing (HPC) or Cloud Resources | STAR requires substantial computational resources. A server with multiple CPU cores and large RAM capacity (e.g., >30 GB for human genome) is essential. Cloud instances (e.g., AWS EC2) provide scalable, on-demand resources for large studies [10]. |
| Downstream Analysis Tools | Software like DESeq2 or the quantification tool Salmon (in alignment mode) that processes the output of STAR (BAM or count files) for differential expression analysis and biological interpretation [10] [12]. |
The selection of a cloud platform is a critical first step in implementing a cloud-based STAR RNA-seq workflow. The table below provides a high-level comparison of the key platforms used in genomics research.
Table 1: Core Cloud Platform Comparison for Genomics Workflows
| Feature | AWS (Amazon Web Services) | Google Cloud Platform (GCP) | Terra |
|---|---|---|---|
| Market Share (2025) | ~30% [15] | ~13% [15] | N/A (Built on GCP/AWS) |
| Primary Genomics Focus | End-to-end managed workflows & storage [16] | Data analytics, AI/ML, and scalable compute [15] | Collaborative, user-friendly biomedical research [2] |
| Key Genomics Service | AWS HealthOmics [16] | Google Cloud Life Sciences, Vertex AI [17] | Pre-configured, community-driven analysis platform [2] |
| Cost Model for Compute | Per-second billing, Savings Plans, Spot Instances [15] | Per-second billing, Sustained-Use Discounts, Committed Use Discounts [15] [17] | Integrated billing; often managed via workspaces |
| Strengths | Broadest service catalog, strong ecosystem, automated scaling with HealthOmics [16] [18] [15] | Leading in data analytics and AI, superior Kubernetes management, automatic discounts [15] [17] | Lower technical barrier, pre-validated workflows, built-in data governance and collaboration [2] |
Experimental Protocols for STAR RNA-seq Across Platforms
The following protocols detail the implementation of a STAR RNA-seq alignment workflow on the major cloud platforms.
Protocol: Automated RNA-seq Analysis on AWS HealthOmics
This protocol leverages AWS HealthOmics to orchestrate a Nextflow-based RNA-seq pipeline, minimizing infrastructure management [16].
- Input Preparation: Create a CSV file containing the GEO Accession IDs (e.g., GSM123456) to be analyzed and upload it to a designated Amazon S3 bucket [16].
- Workflow Trigger: An S3 event notification automatically invokes an AWS Lambda function, which parses the CSV and launches a Step Functions state machine [16].
- Data Ingestion: The state machine uses AWS Batch for parallelized ingestion of FASTQ files from public repositories like the NCBI GEO. It checks an Amazon DynamoDB table to avoid re-downloading existing files and uses
fasterq-dumpfor efficient data transfer [16]. - Pipeline Execution: Upon ingestion completion, a sample sheet is generated and placed in an S3 bucket, triggering another Lambda function that submits the RNA-seq workflow (e.g., nf-core RNA-seq) to AWS HealthOmics [16].
- Output Handling: AWS HealthOmics executes the workflow, handling all compute provisioning and scaling. Upon completion, output files (e.g., BAM alignments, count tables) are automatically written to a specified S3 bucket [16].
Protocol: STAR Alignment on Google Cloud Platform
This protocol uses dsub for batch job management on GCP, offering fine-grained control over compute resources [4].
Preliminary Setup:
Reference Genome Indexing:
Sequence Alignment:
Protocol: Analysis Using the Terra Platform
Terra provides a centralized, collaborative environment for running pre-configured workflows, ideal for researchers seeking a lower-code solution [2].
- Workspace Setup: Navigate to the Terra platform and either create a new workspace or join an existing one dedicated to your project. Pre-configured workspaces for common analyses like bulk RNA-seq are often available.
- Data Configuration:
- Import or select your FASTQ files (hosted in a Google Bucket or other compatible cloud storage) into the Terra workspace's "Data" tab.
- Use Terra's interactive data table to link your samples (e.g., FASTQ files) to the analysis workflow.
- Workflow Selection & Configuration:
- In the "Workflows" tab, choose a pre-loaded STAR RNA-seq workflow, such as the "RNA with UMIs" pipeline from the Broad Institute's WARP repository [19].
- In the workflow configuration, specify your input data by matching the column names from your data table. Set the required reference genome (e.g., GRCh38) and any desired workflow parameters.
- Execution and Monitoring: Launch the workflow. Terra will submit the job to the cloud backend (GCP or AWS) and provide a real-time dashboard to monitor execution status and logs. Results, such as BAM files and quality metrics, will be automatically deposited back into your workspace's cloud storage.
Workflow Visualization and Data Flow
The end-to-end process of a cloud-based STAR RNA-seq analysis, from raw data to gene expression counts, follows a logical progression. The diagram below illustrates the major steps and their relationships.
Successful execution of a cloud-based RNA-seq experiment requires both biological and computational "reagents." The table below details the key materials and resources needed.
Table 2: Essential Research Reagents and Computational Resources
| Category | Item | Specifications / Example Source | Function in Workflow |
|---|---|---|---|
| Raw Sequencing Data | FASTQ Files | From NCBI GEO, SRA, or in-house sequencing [16] | The primary input data containing sequenced reads. |
| Reference Genome | FASTA File | GRCh38 primary assembly from GENCODE or GCP Broad references [4] [19] | The reference sequence for aligning reads. |
| Gene Annotations | GTF/GFF3 File | GENCODE v36 (or latest) comprehensive gene annotation [4] [20] | Provides gene model coordinates for alignment and counting. |
| STAR Aligner | STAR Software | Available via Bioconda or pre-installed in Docker images (e.g., registry.gitlab.com/hylkedonker/rna-seq) [4] |
Performs fast and accurate splicing-aware alignment of RNA-seq reads [4]. |
| Post-Alignment Tools | Samtools | Available via Bioconda [20] | Converts, sorts, and indexes SAM/BAM files for downstream analysis [20]. |
| Quantification Tool | HTSeq-count / RNA-SeQC | Available via Bioconda or pre-packaged in pipelines [19] [20] | Generates gene-level count data from aligned reads. |
| Workflow Manager | Nextflow / WDL | Used by nf-core and WARP pipelines on AWS HealthOmics and Terra [16] [19] | Defines and executes the portable, scalable computational workflow. |
| Containerization | Docker Image | e.g., registry.gitlab.com/hylkedonker/rna-seq [4] |
Ensures consistency and reproducibility of the software environment. |
Understanding Cloud-Native Architecture for Scalable Bioinformatics
The analysis of RNA sequencing (RNA-seq) data is a fundamental task in modern molecular biology and medicine, providing crucial insights into gene expression and its role in health and disease [10]. The STAR (Spliced Transcripts Alignment to a Reference) aligner has emerged as a widely used tool for this purpose, valued for its accuracy and ability to handle large-scale transcriptomic datasets [10] [4]. However, processing the hundreds of terabytes of data generated by high-throughput sequencing technologies presents significant computational challenges, requiring substantial memory, processing power, and high-throughput disk systems [10].
Cloud-native architecture addresses these challenges by leveraging the scalability, flexibility, and cost-efficiency of cloud computing platforms. This approach allows researchers to design systems that can dynamically scale to meet computational demands, avoiding the limitations and upfront costs of traditional on-premises high-performance computing (HPC) infrastructure. For bioinformatics pipelines like those based on STAR, a cloud-native approach enables the processing of large datasets in a fraction of the time required by traditional computing environments [4]. This document provides detailed application notes and protocols for implementing a cloud-native STAR RNA-seq workflow, developed within the context of broader research on cloud-based genomic analysis implementation.
Cloud-Native Architecture for Bioinformatics
A cloud-native architecture is designed from the ground up to leverage cloud services and infrastructure, focusing on scalability, resilience, and manageability. For data- and compute-intensive bioinformatics applications like the Transcriptomics Atlas pipeline, this involves a thoughtful integration of various cloud services and components [10].
The core architectural pattern for a cloud-native bioinformatics pipeline typically involves a coordinated sequence of steps: input data retrieval, format conversion, genomic alignment, and downstream analysis [10]. The alignment phase, often the most resource-intensive, benefits significantly from parallelization strategies that distribute workloads across multiple cloud instances. Cloud batch processing systems such as AWS Batch or Kubernetes-native solutions like Argo Workflows are commonly employed to manage these distributed computations, abstracting away the underlying infrastructure complexity [10].
Key considerations in this architecture include the efficient distribution of large reference datasets (such as the STAR index) to worker instances, selection of appropriate instance types based on the application's memory and CPU requirements, and implementation of robust data management strategies to handle intermediate files and final results [10]. The adoption of containerization technologies like Docker ensures consistency and reproducibility across computing environments, facilitating the packaging of complex bioinformatics tools and their dependencies [4].
Table 1: Core Components of a Cloud-Native Bioinformatics Architecture
| Component | Function | Example Technologies |
|---|---|---|
| Compute Management | Orchestrates and scales workload execution | AWS Batch, Kubernetes, Google Cloud dsub [10] [4] |
| Object Storage | Provides scalable and durable storage for large genomic datasets | AWS S3, Google Cloud Storage [10] [4] |
| Container Registry | Stores and manages containerized application images | Docker Hub, Google Container Registry [4] |
| Reference Data Management | Handles distribution of genomic references and indices | Dedicated data services, optimized data distribution techniques [10] |
| Security & Access Control | Manages authentication and data protection | Cloud IAM, encryption protocols, attestation frameworks [21] [22] |
Performance Analysis and Optimization
Rigorous performance analysis is essential for designing a cost-effective and efficient cloud-native bioinformatics pipeline. Research into running the Transcriptomics Atlas pipeline in AWS cloud has yielded quantitative insights into optimization strategies for the STAR aligner [10].
Application-Specific Optimizations
- Early Stopping: Implementation of an early stopping feature based on intermediate results can significantly reduce processing time. Experiments demonstrate that this optimization can reduce total alignment time by approximately 23%, thereby increasing overall pipeline throughput [10].
- Parallelism Configuration: Identifying the optimal level of parallelism within a single compute node is crucial. Beyond a certain core count, STAR exhibits performance degradation due to increased I/O wait times and resource contention. Benchmarking is necessary to determine the most cost-effective core allocation for specific instance types [10].
- Genomic Index Distribution: Efficiently distributing the large STAR genomic index (often tens of gigabytes) to worker instances is a critical bottleneck. Solutions that pre-cache indexes on fast local storage or use high-throughput network file systems can dramatically reduce startup latency [10].
Cloud Infrastructure Optimizations
- Instance Type Selection: The choice of virtual machine instance type directly impacts performance and cost. Memory-optimized instances (e.g., AWS R5 or Google Cloud n2-highmem series) are often suitable for STAR, which requires substantial RAM. Research indicates that careful selection can identify the most cost-efficient instance type for alignment tasks [10] [4].
- Spot Instance Usage: Leveraging preemptible or spot instances can reduce compute costs by 60-80% compared to on-demand pricing. Studies confirm that spot instances are generally suitable for running resource-intensive aligners like STAR, though checkpointing strategies are recommended for fault tolerance in large-scale simulations [10] [4].
- Storage Optimization: Pairing compute instances with appropriate high-throughput block storage (e.g., local SSDs or provisioned IOPS volumes) is necessary to prevent disk I/O from becoming a bottleneck during alignment [10].
Table 2: Quantitative Impact of Optimizations on STAR Workflow [10]
| Optimization Technique | Measured Impact | Key Consideration |
|---|---|---|
| Early Stopping | 23% reduction in total alignment time | Requires analysis of intermediate results |
| Optimal Core Allocation | Prevents performance degradation | Specific to instance type and data size |
| Spot Instance Utilization | Significant cost reduction (60-80%) | Requires handling of potential preemption |
| Efficient Index Distribution | Reduces job startup latency | Critical for maintaining high throughput |
Experimental Protocols
Protocol 1: Baseline STAR Alignment in Cloud Environment
This protocol establishes the foundational setup and execution of the STAR aligner in a cloud environment, forming the baseline against which optimizations can be measured.
Research Reagent Solutions:
- Genomic Reference and Annotation: A reference genome (e.g., GRCh38) in FASTA format and a corresponding annotation file in GFF3 or GTF format (e.g., from GENCODE). These provide the coordinate system and gene models for aligning reads [4].
- RNA-seq Read Files: Sequencing data in FASTQ format, containing the short reads to be aligned. These can be sourced from public repositories like the NCBI Sequence Read Archive (SRA) [10] [4].
- STAR Genomic Index: A precomputed index from the reference and annotation files. This is a critical data structure that dramatically accelerates the alignment process and must be distributed efficiently to compute nodes [10] [4].
Methodology:
Infrastructure Provisioning:
- Select a memory-optimized cloud instance type (e.g., n2-highmem-32 on Google Cloud or r5.8xlarge on AWS) with sufficient RAM for the target genome and adequate vCPUs [10] [4].
- Attach high-throughput local SSD storage to handle the I/O demands of alignment.
- Provision cloud object storage (e.g., Google Cloud Storage, AWS S3) for initial input data and final output storage [4].
Data Preparation:
- Upload reference genome FASTA file and annotation GTF file to a designated bucket in cloud object storage [4].
- Upload or transfer RNA-seq FASTQ files to the cloud storage input directory. If using SRA files, retrieve them using
prefetchand convert to FASTQ usingfasterq-dumpfrom the SRA Toolkit [10].
Genome Index Generation:
Alignment Execution:
Protocol 2: Optimized Large-Scale Deployment
This protocol builds upon the baseline, incorporating optimizations for processing tens to hundreds of terabytes of RNA-seq data in a cost-efficient and high-throughput manner.
Methodology:
Orchestrated Batch Processing:
- Deploy the pipeline using a managed batch processing service (e.g., AWS Batch) or a Kubernetes-based workflow manager (e.g., Argo Workflows) to automate cluster creation, job submission, and resource scaling [10].
- Configure the compute environment to use a mix of on-demand and spot instances to optimize for both availability and cost, implementing job retry logic for failed spot instances [10].
Implementation of Early Stopping:
- Modify the alignment workflow to check for and utilize existing intermediate results from previous, potentially failed, runs. This prevents recomputation of already completed alignment stages [10].
- In the workflow logic, add a preprocessing step that verifies the state of alignment for each sample before allocating full compute resources.
Optimized Data Distribution:
- Pre-cache the STAR genomic index on a fast, shared file system accessible by all worker nodes or replicate it to the local SSD of each worker instance at startup to minimize data transfer times [10].
- For input FASTQ files, ensure they are located in cloud object storage in the same region as the compute cluster to reduce data transfer latency and costs.
Performance Monitoring and Validation:
- Instrument the pipeline to collect detailed metrics on execution time, cost per sample, and resource utilization.
- Validate the biological accuracy of the optimized outputs by comparing key quality metrics (e.g., alignment rate, read distribution across features) with those generated by the non-optimized baseline protocol.
Workflow and Data Flow Visualization
The following diagrams illustrate the logical organization of the cloud-native STAR RNA-seq workflow and the flow of data between its core components, providing a visual summary of the protocols described above.
The Scientist's Toolkit
This section details the essential software, data, and cloud resources required to implement the cloud-native STAR RNA-seq workflow.
Table 3: Essential Research Reagents and Resources for Cloud-Native STAR Workflow
| Category | Resource | Description and Function |
|---|---|---|
| Bioinformatics Tools | STAR Aligner | Performs the core alignment of RNA-seq reads to the reference genome, handling spliced alignments [10] [4]. |
| SRA Toolkit | Provides utilities (prefetch, fasterq-dump) for retrieving and converting sequencing data from the NCBI SRA database [10]. |
|
| DESeq2 / R | Used for downstream normalization and differential expression analysis of the count data generated by STAR [10]. | |
| Reference Data | Reference Genome | A species-specific reference sequence (e.g., GRCh38 for human) in FASTA format, serving as the alignment scaffold [10] [4]. |
| Gene Annotation | A GTF/GFF3 file defining genomic coordinates of genes and transcripts, used for generating the STAR index and assigning reads to features [4]. | |
| STAR Genomic Index | A precomputed index from the reference genome and annotation, crucial for accelerating the alignment process [10] [4]. | |
| Cloud Services & Tools | Workflow Orchestrator | Manages and scales job execution (e.g., dsub, AWS Batch, Argo Workflows) across the cloud compute fleet [10] [4]. |
| Object Storage | Provides durable and scalable storage for input, output, and reference files (e.g., AWS S3, Google Cloud Storage) [10] [4]. | |
| Container Image | A Docker image containing the required bioinformatics software (STAR, SRA Toolkit) and their dependencies, ensuring runtime consistency [4]. |
The implementation of cloud-based STAR RNA-seq workflows presents researchers with a critical economic decision: selecting the appropriate computational infrastructure. The choice between the pay-as-you-go cloud model and traditional High-Performance Computing (HPC) infrastructure significantly impacts research budgets, scalability, and operational flexibility [23]. Next-generation sequencing technologies have democratized genomic research while simultaneously increasing the costs associated with data storage, analysis, and interpretation [24]. This application note provides a structured economic comparison and detailed protocols to guide researchers in optimizing their computational expenditures for transcriptomic studies.
The STAR (Spatio-Temporal Acidic Region) aligner represents a particularly resource-intensive component in RNA-seq workflows, requiring substantial memory allocation (approximately 30GB for human genome indices) and significant processing capabilities [25]. Understanding the economic tradeoffs between computational approaches is essential for maximizing research output within constrained budgets, particularly as the NGS-based RNA-sequencing market continues expanding at a CAGR of 20.1% [26].
Economic Comparison: Architectural and Financial Considerations
Fundamental Architectural Differences
The economic implications of infrastructure selection stem from fundamental architectural differences between cloud computing and traditional HPC systems.
Table 1: Architectural Comparison Between HPC and Cloud Computing
| Feature | High-Performance Computing (HPC) | Cloud Computing |
|---|---|---|
| Core Architecture | Tightly-Coupled Clusters/Supercomputers | Loosely-Coupled, Distributed Systems |
| Interconnect | Ultra-Low Latency (InfiniBand HDR/NDR, ~100ns-1µs) | Standard High-Bandwidth Ethernet (RoCEv2, ~µs) |
| Compute Focus | Raw Flops, Parallel Scaling (CPU/GPU Density) | Service Breadth, Elasticity, Managed Services |
| Storage | Parallel File Systems (Lustre, GPFS - High IOPS/BW) | Object Storage (S3), Block Storage, File (NFS) |
| Management | Complex, Specialized (Job Schedulers - Slurm, PBS) | Simplified, API-Driven, Self-Service |
| Deployment Model | Often On-Prem, Dedicated Colo, Cloud HPC "Pods" | Public Cloud, Private Cloud, Hybrid Cloud |
| Cost Model | High Capex (Hardware) / Lower Opex (Power, Staff) | Low/No Capex / Pay-as-you-Go Opex |
| Scalability | Scale-Up/Scale-Out (Pre-planned, less elastic) | Highly Elastic (Instant Up/Down) |
| Tenancy | Typically Dedicated | Multi-Tenant (Shared Resources) |
| Best For | Tightly-Coupled, Latency-Sensitive Simulations | Variable Workloads, Bursty Patterns, Managed AI/ML [23] |
These architectural differences directly influence economic efficiency for various workload types. HPC systems excel for tightly-coupled parallel applications where tasks constantly communicate, while cloud computing provides superior economic value for variable, bursty, or embarrassingly parallel workloads where tasks can be executed independently [23].
Diagram 1: Architectural and economic decision framework for computational infrastructure.
Comprehensive Cost Analysis
The economic analysis reveals distinct cost structures that favor different usage patterns and project timelines.
Table 2: Economic Comparison of Computational Infrastructure Options
| Cost Factor | Traditional HPC Infrastructure | Pay-As-You-Go Cloud | Reserved Cloud Instances |
|---|---|---|---|
| Initial Investment | High upfront capital expenditure ($50,000+) | Minimal to no upfront costs | Moderate commitment fees |
| Ongoing Operational Costs | Lower operational costs (power, cooling, maintenance) | Pay-per-use billing | Discounted rates (up to 50-70% off on-demand) |
| Staffing Requirements | Specialized IT staff for management and maintenance | Reduced operational complexity | Reduced operational complexity |
| Utilization Efficiency | Cost-effective at high utilization rates (>70%) | Cost-effective for variable workloads | Cost-effective for steady-state workloads |
| Scalability Cost | Significant additional capital investment | Instant, granular scaling | Planned scaling with commitments |
| Hardware Refresh | Additional capital investment every 3-5 years | Automatically included in service | Automatically included in service |
| Experimental Cost Example | N/A | $127 (ECS Fargate for 17.3TB data) | ~$50 (with Spot instances) [25] |
The economic advantage shifts based on utilization patterns. For steady-state workloads exceeding 30-50% utilization, traditional HPC or reserved cloud instances become more economical than pay-as-you-go models [27]. Research indicates that running steady-state workloads in pay-as-you-go mode can be more expensive than reserving capacity even when resources sit idle more than 50% of the time [27].
STAR RNA-Seq Workflow Cost Considerations
Specific cost patterns emerge when implementing STAR RNA-seq workflows in cloud environments:
- STAR alignment constitutes approximately 70-75% of total pipeline execution time, making it the primary cost driver [25]
- Memory requirements for human genome alignment (~30GB) necessitate appropriate instance selection to balance cost and performance [25]
- Storage costs for intermediate files (FASTQ formats up to 220GB) represent significant recurring expenses [25]
- Potential optimizations including spot instances (up to 70% savings) and early termination of low-quality sequences (23% reduction in alignment time) can substantially reduce costs [25]
Experimental Protocols for Economic Analysis
Protocol 1: Cloud Cost Estimation for STAR RNA-Seq
Objective: Systematically estimate computational costs for implementing STAR RNA-seq workflow in cloud environments.
Materials:
- Cloud cost estimator tools (AWS Pricing Calculator, Google Cloud Pricing Calculator)
- Sample RNA-seq dataset (FASTQ format)
- Reference genome index
Methodology:
- Workload Characterization:
- Quantify input dataset size (FASTQ files)
- Determine appropriate instance type based on memory requirements (minimum 32GB for non-human genomes, 48GB+ for human genomes)
- Estimate processing time using benchmarking data (5-10 minutes for index loading plus alignment time)
Storage Cost Calculation:
- Calculate input data storage requirements
- Project output data volume (typically 1.5-2x input size)
- Determine appropriate storage class (standard, infrequent access, archive) based on access patterns
Compute Cost Estimation:
- Apply formula: Total Cost = (Instance Cost per Hour × Estimated Runtime) + (Storage Cost per GB × Storage Volume) + Data Transfer Costs
- Incorporate 30% buffer for unexpected failures or optimization cycles [28]
Optimization Assessment:
- Evaluate spot instance compatibility for fault-tolerant workloads
- Assess reserved instance discounts for long-term projects
- Consider multi-cloud strategies to leverage competitive pricing [28]
Economic Analysis: Document cost projections and compare against traditional HPC alternatives using total cost of ownership calculations.
Protocol 2: Performance Benchmarking Across Platforms
Objective: Quantitatively compare STAR RNA-seq workflow performance and cost across computational infrastructures.
Materials:
- Standardized RNA-seq dataset (100-1000 samples)
- STAR workflow implementation
- Cloud computing account (AWS, GCP, or Azure)
- Access to HPC infrastructure
Methodology:
- Experimental Setup:
- Configure identical STAR workflow parameters across all platforms
- Select comparable hardware specifications (vCPUs, memory, storage I/O)
- Implement consistent monitoring for resource utilization and timing
Execution Protocol:
- Process standardized dataset on each platform
- Record precise execution times for each workflow step
- Monitor actual resource consumption (CPU hours, memory allocation, storage I/O)
Cost Calculation:
- Cloud environments: Use actual consumption-based billing data
- HPC environments: Calculate amortized hardware costs, power, cooling, and support staff
Data Collection:
- Record total execution time
- Calculate total cost per sample
- Document any operational complexities or failures
Analysis: Compare cost-effectiveness across platforms while considering operational overhead and scalability limitations.
The Scientist's Toolkit: Essential Research Reagents and Computational Solutions
Table 3: Essential Research Reagents and Computational Solutions for Cloud-Based RNA-Seq
| Item | Function/Application | Specification Notes |
|---|---|---|
| STAR Aligner | RNA-seq read alignment to reference genome | Requires 30GB RAM for human genome; most resource-intensive workflow step [25] |
| Reference Genome Index | Pre-computed genome index for alignment acceleration | Human genome index ~30GB; requires pre-loading into memory [25] |
| Elastic Block Storage (EBS) | Scalable storage for intermediate FASTQ files | GP3 volume with 500MiB/s throughput recommended for I/O intensive tasks [25] |
| Elastic File System (EFS) | Shared storage for reference indices across multiple instances | Enables efficient index sharing without redundant loading [25] |
| SRA Toolkit | Access and conversion of sequence read archive data | Converts SRA to FASTQ format; requires substantial temporary storage [25] |
| Containerization | Consistent execution environment across platforms | Docker containers encapsulate complex dependencies and ensure reproducibility [24] |
| Workflow Management | Orchestration of multi-step analysis pipelines | Tools like Nextflow or Cromwell enable scalable, reproducible analyses [29] |
| Monitoring Tools | Resource utilization tracking and cost attribution | Cloud-specific monitoring (AWS CloudWatch) essential for cost control [28] |
Economic Decision Framework
The economic decision between pay-as-you-go cloud models and traditional HPC infrastructure depends primarily on workload characteristics and utilization patterns.
Diagram 2: Economic decision framework for computational infrastructure selection.
Decision Guidelines:
Choose Traditional HPC when:
Choose Pay-As-You-Go Cloud when:
Choose Reserved Cloud Instances when:
- Steady-state workload patterns are predictable
- Long-term projects justify commitment-based discounts (up to 70% savings) [27]
- Cloud infrastructure is preferred but pay-as-you-go costs would be prohibitive
Implement Hybrid Approach when:
- Base workload runs on-premises with cloud bursting for peak demands
- Specific workloads are cloud-optimized while others require specialized HPC
- Organizational strategy involves gradual cloud migration [23]
The economic analysis demonstrates that both pay-as-you-go cloud models and traditional HPC infrastructure offer distinct economic advantages for different research scenarios. For STAR RNA-seq workflows, cloud implementations provide compelling economic benefits for small-to-medium scale projects, bursty workloads, and research environments with limited capital funding. Traditional HPC infrastructure remains economically superior for large-scale, consistent utilization scenarios where the high upfront investment can be amortized across multiple projects and years.
Researchers should carefully characterize their workload patterns, project timelines, and technical requirements before selecting computational infrastructure. The protocols and decision framework provided in this application note enable systematic economic evaluation to optimize research expenditures while maintaining computational efficiency for transcriptomic studies.
Implementing End-to-End STAR RNA-seq Pipelines in the Cloud
Within the broader context of implementing cloud-based STAR RNA-seq workflows, this application note details a standardized, scalable pipeline architecture for processing data from its raw form in sequence read archives (SRA) to ready-for-analysis differential expression results. The complexity of RNA-Seq data, addressing various aspects of gene expression, necessitates robust and reproducible analysis strategies [31]. The protocol outlined herein is designed to meet this need, integrating state-of-the-art bioinformatics tools within a structured framework that leverages cloud computing environments to provide researchers and drug development professionals with a comprehensive solution from data acquisition to biological insight.
Pipeline Architecture and Workflow
The overarching pipeline architecture is modular, ensuring flexibility and scalability. The workflow can be conceptually divided into three major phases: Data Acquisition and Preprocessing, Read Alignment and Quantification, and Downstream Analysis. This structure allows researchers to execute the entire pipeline seamlessly or to run specific modules independently based on their requirements [32].
The following diagram illustrates the complete workflow and the logical relationships between its core components:
Quantitative Pipeline Comparison
Multiple RNA-seq pipeline solutions are available, each with distinct features, computational environments, and capabilities. The table below provides a structured comparison of several prominent options to guide researchers in selecting the most appropriate platform for their cloud-based STAR RNA-seq workflow implementation.
Table 1: Comparative Analysis of RNA-Seq Analysis Pipelines
| Pipeline Name | Core Features | Computational Environment | Quantification Tools | Differential Expression | Key References |
|---|---|---|---|---|---|
| mainakm7/RNAseq_pipeline [32] | SRA download, alignment, QC, alternative splicing (RMATS) | HPC (SLURM), Singularity/Docker | featureCounts, Kallisto | Yes (via downstream analysis) | Integrated tool documentation |
| nf-core/rnaseq [33] | Extensive QC, trimming, multiple alignment routes, pseudoalignment | Nextflow, Cloud/Cluster | featureCounts, Salmon, Kallisto | No (output for statistical environments) | Ewels et al., 2020 |
| RumBall [34] | Read mapping, normalization, statistical modeling, GO enrichment | Docker | Internally integrated popular tools | Yes | Protocol publication |
| RAP [31] | Quality checks, expression quantification, alternative splicing, chimeric transcripts | Cloud computing web application | Cufflinks, HTSeq | Yes (Cuffdiff2, DESeq) | D'Antonio et al., 2015 |
| LncExpDB Pipeline [35] | Standardized processing for lncRNA expression database | Modular command-line tools | featureCounts, Kallisto | Implied by database purpose | Database methodology |
Detailed Experimental Protocol
Phase 1: Data Acquisition and Preprocessing
Downloading SRA Files
The pipeline begins with acquiring raw sequencing data from public repositories like the Sequence Read Archive (SRA). This can be accomplished using command-line tools.
Using
wget:The
-cparameter enables resume capability, crucial for large file transfers, while-t 0sets retry attempts to infinite, ensuring robust download completion [35].Using
sratoolkit: The SRA toolkit provides specialized utilities for efficient data access and extraction.
Converting SRA to FASTQ
The downloaded SRA files are converted into standard FASTQ format using fasterq-dump, which is faster and more efficient than the older fastq-dump.
- Command:
Here,
-pshows progress,-e 32specifies the use of 32 threads to speed up the process, and--split-3separates paired-end reads into two files while handling unpaired reads appropriately [35].
Quality Control and Trimming
Raw sequencing reads often contain adapter sequences and low-quality bases that can adversely affect alignment. Trimmomatic is used for this purpose.
- For Paired-End Data: This command removes Illumina adapters, cuts the first 3 bases, trims low-quality bases from the start and end, and discards reads shorter than 15 bases after trimming [35].
Phase 2: Read Alignment and Quantification
Alignment to Reference Genome with STAR
The STAR aligner is optimized for RNA-seq data as it accurately handles splice junctions.
- Command:
Key parameters include
--outSAMtype BAM SortedByCoordinateto generate a sorted BAM file, and--outFilterMultimapNmax 20to control the number of multiple alignments allowed per read [35]. This parameter combination is recommended for quantifying abundance in deep-sequencing samples [35].
Gene-Level Quantification with featureCounts
Following alignment, reads are assigned to genomic features. This step requires knowing the library's strandedness, which can be inferred automatically using tools like infer_experiment.py from the RSeQC package [35].
- Command for Paired-End Data:
The
-s 2parameter indicates reverse strandedness, which is common for many library prep kits; this should be adjusted based on empirical inference [35].
Phase 3: Downstream Analysis
While the core processing pipeline ends with a count matrix, the subsequent differential expression analysis is critical for extracting biological meaning. The generated count matrix can be directly imported into statistical environments like R for analysis with packages such as DESeq2 or Limma [33]. Furthermore, platforms like RumBall encapsulate this process within a Docker container, guiding users through statistical modeling and gene ontology enrichment to interpret the results in the context of biological pathways [34].
The Scientist's Toolkit
Successful implementation of a cloud-based STAR RNA-seq workflow requires a suite of specialized research reagents and software solutions. The following table details the essential materials and their critical functions within the pipeline.
Table 2: Key Research Reagent Solutions for RNA-Seq Pipeline Implementation
| Tool/Resource | Category | Primary Function | Protocol-Specific Role |
|---|---|---|---|
| SRAtoolkit [35] | Data Access | Download and extract data from SRA | Converts SRA accession IDs into analysis-ready FASTQ files |
| Trimmomatic [35] | Quality Control | Remove adapter sequences and low-quality bases | Ensures read quality and removes contaminants for accurate alignment |
| STAR Aligner [32] [35] | Alignment | Maps RNA-seq reads to a reference genome | Precisely aligns spliced transcripts and identifies junction reads |
| featureCounts [35] | Quantification | Assign aligned reads to genomic features | Generates the gene-count matrix for differential expression testing |
| RSeQC [35] | QC & Utility | Evaluate data quality and infer experiment type | Determines library strandedness automatically from aligned data |
| Docker/Singularity [32] [34] | Containerization | Package software into portable, reproducible units | Ensures pipeline consistency and portability across cloud environments |
| Nextflow [33] | Workflow Management | Orchestrate pipeline execution across platforms | Enables scalable, reproducible workflows on cloud and HPC systems |
| Reference Genome & GTF [35] | Reference Data | Provide species-specific genomic sequence and annotation | Serves as the template for read alignment and gene quantification |
Within the framework of a comprehensive thesis on implementing cloud-based STAR RNA-seq workflows, efficient data preparation is a critical foundational step. The NCBI SRA Toolkit provides the essential utilities for accessing and converting publicly available sequencing data from the Sequence Read Archive (SRA) into analysis-ready FASTQ files. This protocol focuses specifically on optimizing the SRA to FASTQ conversion process, a prerequisite for subsequent alignment and differential expression analysis in transcriptomic studies. The massive scale of modern RNA-seq experiments, often involving hundreds of samples, demands efficient and reliable conversion methodologies that leverage cloud computing capabilities for scalable processing [36]. As genomic datasets continue to grow exponentially, with SRA currently housing over 30 petabytes of sequencing data, optimized data retrieval and conversion protocols become increasingly vital for productive research [10].
SRA Toolkit Tools and Configuration
Essential Toolkit Components
The SRA Toolkit encompasses several command-line utilities designed for specific aspects of data retrieval and processing [37]:
- prefetch: Downloads SRA files from NCBI repositories to local storage
- fasterq-dump: The preferred tool for rapid conversion of SRA files to FASTQ format (multithreaded)
- fastq-dump: The legacy tool for SRA to FASTQ conversion (single-threaded, being deprecated)
- vdb-config: Interactive configuration tool for setting SRA Toolkit parameters
- srapath: Verifies accessibility and location of SRA accession files
Critical Configuration Steps
Proper configuration of the SRA Toolkit is essential for optimal performance, particularly in cloud environments:
For researchers working with controlled-access data (such as dbGaP), additional configuration with AWS or GCP credentials is required [38]. The toolkit must also be configured to accept cloud egress charges when accessing original submission files stored in commercial clouds [37].
Table 1: SRA Toolkit Configuration Settings for Cloud Environments
| Setting | Recommended Value | Purpose |
|---|---|---|
| Remote Access | Enabled | Allows fetching data from NCBI, AWS, and GCP |
| Temporary Directory | Local scratch space | Improves I/O performance during conversion |
| Cloud Identity Reporting | Enabled | Enables free access to public data in cloud repositories |
| File Caching | Enabled with sufficient RAM | Reduces redundant download operations |
Performance Comparison: fasterq-dump vs fastq-dump
Tool Selection Guidelines
The SRA Toolkit provides two primary utilities for FASTQ conversion, with significant performance implications:
fasterq-dump is now the recommended tool for all new workflows, as explicitly stated in NIH documentation: "fastq-dump is being deprecated. Use fasterq-dump instead - it is much faster and more efficient" [37]. This utility employs multi-threading (default: 6 threads) and optimized caching mechanisms to accelerate the conversion process.
fastq-dump remains available but operates as a single-threaded process with significantly lower performance. It retains utility only for specific use cases such as extracting small subsets of data or when direct compression during conversion is required [39].
Quantitative Performance Metrics
Performance testing reveals substantial differences between the two tools:
Table 2: Performance Comparison: fasterq-dump vs fastq-dump
| Tool | Threads | Default Splitting | Compression During Conversion | Subset Extraction | Relative Speed |
|---|---|---|---|---|---|
| fasterq-dump | 6 (default) | --split-3 | No (requires post-processing) | No | ~3-5x faster |
| fastq-dump | 1 | Manual (--split-3 required) | Yes (--gzip) | Yes (-X) | 1x (baseline) |
Empirical testing demonstrates that combining prefetch with fasterq-dump provides the fastest overall workflow, as prefetch downloads the SRA file in its native compressed format, which fasterq-dump then processes in parallel [39]. This approach can reduce processing time by 23-40% compared to standalone fasterq-dump execution [10].
Experimental Protocols
Protocol 1: Standard SRA to FASTQ Conversion
This protocol describes the optimal method for converting SRA accessions to FASTQ format using the fasterq-dump utility [37] [38]:
Environment Setup: Load the SRA Toolkit module and configure temporary storage:
Download SRA File: Use prefetch to download the SRA file:
Convert to FASTQ: Execute fasterq-dump with appropriate parameters:
The
-pflag shows progress,-tspecifies temporary directory, and-Osets output directory.Compress Output (optional): Compress resulting FASTQ files to save space:
Protocol 2: Automated Batch Processing
For studies involving multiple SRA accessions, implement automated batch processing:
Protocol 3: Integration with STAR RNA-seq Workflow
This protocol demonstrates seamless integration with the STAR aligner in a cloud environment:
Resource Estimation: Determine space requirements before processing:
Calculate 7x the reported size for temporary files and 6x for output files [37].
Execute Conversion with Optimal Parameters:
Direct Pipeline Integration:
Workflow Integration and Data Management
Space Requirements and Management
Effective storage management is crucial for large-scale SRA processing:
Table 3: Storage Space Estimation Guidelines
| Data Type | Multiplier | Purpose | Example (650MB SRA) |
|---|---|---|---|
| Temporary Files | 7x SRA size | fasterq-dump processing | 4.5 GB |
| FASTQ Output | 6x SRA size | Final FASTQ files | 3.9 GB |
| Total Required | 13x SRA size | Complete conversion | 8.4 GB |
These multipliers highlight the substantial storage requirements for SRA processing. For example, a 650MB SRA file requires approximately 8.4GB of total space during processing [37]. Cloud environments should be configured with sufficient temporary storage (preferably local SSD) and persistent storage for final outputs.
Integration with STAR Alignment Workflow
The SRA to FASTQ conversion represents the initial phase in a comprehensive transcriptomics analysis pipeline [10] [40]:
Diagram 1: SRA Conversion in RNA-seq Workflow
The Scientist's Toolkit: Essential Research Reagents
Table 4: Essential Research Reagents and Computational Tools
| Item | Function | Usage Notes |
|---|---|---|
| SRA Toolkit | Access and convert SRA data | Required version 2.10+ for cloud data access |
| STAR Aligner | RNA-seq read alignment | Requires substantial RAM (≈32GB for human genome) |
| DESeq2 R Package | Differential expression analysis | Uses raw count data from alignment |
| Precomputed Genome Index | Reference for alignment | Species-specific (e.g., Ensembl) |
| Cloud Credentials | Access to commercial cloud data | Required for original submission files |
| Local Scratch Storage | High-speed temporary files | Critical for fasterq-dump performance |
Troubleshooting and Optimization
Common Issues and Solutions
"Bucket is requester pays" Error: Configure cloud credentials using vdb-config for AWS or GCP access [37] [38]
Insufficient Space Errors: Allocate sufficient temporary space (7x SRA size) and output space (6x SRA size) [37]
Download Failures: Implement retry logic with exponential backoff for NCBI server timeouts [37]
Performance Issues: Ensure fasterq-dump uses local scratch space rather than network storage [38]
Cloud-Specific Optimizations
- Instance Selection: Choose compute-optimized instances (e.g., AWS c5, GCP n2) with sufficient RAM
- Storage Configuration: Use local SSDs for temporary files and object storage for long-term archiving
- Cost Management: Leverage spot instances for batch processing and monitor egress charges [10]
Efficient conversion of SRA files to FASTQ format represents the critical first step in cloud-based STAR RNA-seq workflows. By implementing the protocols outlined in this document - specifically utilizing fasterq-dump with proper temporary storage configuration - researchers can significantly accelerate data preparation phases. The integration of these optimized conversion methods with subsequent alignment and analysis steps creates a seamless, scalable transcriptomics pipeline suitable for processing large-scale RNA-seq datasets in cloud environments. As sequencing technologies continue to advance and dataset sizes grow, these optimized protocols will become increasingly essential for productive bioinformatics research.
Spliced Transcripts Alignment to a Reference (STAR) is a widely used RNA-seq aligner renowned for its high speed and accuracy in mapping sequencing reads, including the detection of spliced and chimeric transcripts [9]. In the context of cloud-based RNA-seq workflow implementation, the ability to configure STAR precisely is paramount for achieving high-quality, reproducible results that can scale efficiently with computational resources. A one-size-fits-all approach is suboptimal; as recent research indicates, carefully selected analysis software and parameters, tuned for specific data, provide more accurate biological insights than default configurations [41]. This application note details the critical parameters for optimizing STAR alignment to support robust differential expression, splicing, and fusion analysis within a cloud bioinformatics framework.
Critical STAR Parameters for Accurate Mapping
Optimizing STAR involves adjusting parameters that control alignment sensitivity, precision, and the handling of specific RNA-seq nuances. The following parameters are crucial for balancing mapping yield with accuracy.
Key Adjustable Parameters
Table 1: Critical STAR Alignment Parameters for Optimization
| Parameter | Default Value | Recommended Setting | Impact on Alignment |
|---|---|---|---|
--outFilterMismatchNmax |
10 | Adjust based on read length/quality (e.g., 0.04 * read length) [42] | Controls maximum mismatches per read pair; tighter values increase precision but may lower sensitivity. |
--outFilterMismatchNoverLmax |
0.3 | 0.04 - 0.1 [42] | Filters reads based on the ratio of mismatches to read length; more robust than a fixed number for variable lengths. |
--alignIntronMin |
21 | 20-25 [42] | Sets the minimum intron size. Should be set just below the smallest known intron for the organism. |
--alignIntronMax |
0 (unlimited) | Species-specific (e.g., 500000 for mammals) [42] | Sets the maximum intron size. Critical for preventing false alignments across large genomic regions. |
--outFilterMultimapNmax |
10 | 5-20 [42] | Limits the number of genomic loci a read can map to. Lower values increase stringency for unique mappings. |
--alignSJDBoverhangMin |
3 | 2-5 [43] | Minimum overhang for annotated spliced junctions; a value of 2 is often sufficient for most data. |
--seedSearchStartLmax |
50 | 12-20 [43] | Controls the seed search length; reducing can improve speed with minimal sensitivity loss for long reads. |
--twopassMode |
None | Basic [43] |
Enables two-pass mapping to discover novel junctions, improving sensitivity in the second alignment pass. |
Parameters for Advanced Analysis
For experiments focused on detecting gene fusions or chromosomal rearrangements, specific parameters enhance chimeric alignment discovery:
--chimSegmentMin: Defines the minimum length of the chimeric segment. A value of 12-20 is recommended for typical Illumina reads [43].--chimJunctionOverhangMin: Should be set to the same value as--chimSegmentMin[43].--chimOutType: Setting this toJunctionsorWithinBAMoutputs the chimeric reads in a separate file or within the main BAM file, respectively [43].
Experimental Protocols for Cloud-Based STAR Alignment
This protocol outlines a best-practice workflow for running STAR alignment, integrating quality control and quantification, suitable for execution on cloud platforms like AWS Batch or Google Cloud Life Sciences.
Protocol 1: Comprehensive RNA-Seq Alignment and Quantification
This protocol uses a hybrid approach combining STAR alignment with Salmon quantification to leverage the strengths of both tools [44].
I. Input Data and Preprocessing
- Input: Paired-end RNA-seq reads in FASTQ format (gzipped). Using paired-end data is strongly recommended for more robust expression estimates [44].
- Reference Files: Genome sequence in FASTA format and annotation in GTF format for the target organism.
- Preprocessing: Perform quality control and adapter trimming using tools like fastp or Trim Galore.
- fastp is advantageous due to its rapid analysis and simplicity of operation, and it can significantly enhance processed data quality [41].
II. Genome Index Generation Generate the STAR genome index. This is a one-time, computationally intensive step that can be stored and reused for multiple projects in cloud object storage.
III. Alignment and Quantification Execution Execute the alignment. The following command illustrates key parameters for accurate mapping.
IV. Downstream Quantification For optimal expression estimation, use the STAR-generated BAM file as input to the quantification tool Salmon in its alignment-based mode [44]. This approach leverages Salmon's superior handling of assignment uncertainty.
Protocol 2: Quick Alignment for Large-Scale Analyses
For studies with thousands of samples where alignment-based QC is less critical, a pseudoalignment-based workflow using Salmon directly on the FASTQ files is a sensible and highly scalable choice for cloud environments [44]. This bypasses the resource-intensive STAR alignment step while still producing accurate count estimates.
The Scientist's Toolkit: Essential Research Reagents and Solutions
Table 2: Key Research Reagents and Computational Tools for a STAR RNA-Seq Workflow
| Item Name | Function/Application | Specification Notes |
|---|---|---|
| STAR Aligner | Spliced alignment of RNA-seq reads to a reference genome. | Use the latest version. Optimized for speed and detects canonical and non-canonical splices [9]. |
| Salmon | Fast and bias-aware quantification of transcript abundances. | Can be used in alignment-based mode with STAR BAM files or in fast mode via pseudoalignment [44]. |
| fastp | Quality control and adapter trimming of raw FASTQ files. | Provides rapid processing and generates a post-trimming QC report, improving downstream alignment rates [41]. |
| SAMtools | Manipulation and indexing of SAM/BAM alignment files. | Essential for sorting, indexing, and extracting metrics from STAR's output BAM files [40]. |
| Reference Genome (FASTA) | The canonical DNA sequences for the organism of study. | Required for building the STAR genome index. Source from Ensembl, NCBI, or UCSC. |
| Genome Annotation (GTF) | The coordinates of known genes, transcripts, and exons. | Crucial for genome index generation and for guiding the aligner to known splice junctions [44]. |
| High-Performance Computing (HPC) or Cloud Cluster | Execution of the computationally intensive alignment steps. | STAR requires significant memory (≥32GB RAM for mammalian genomes) and multiple CPU cores [9] [44]. |
Visual Workflows and Logical Diagrams
STAR Algorithm and Mapping Logic
STAR Mapping Logic: Diagram illustrating the core two-step STAR algorithm: sequential Maximal Mappable Prefix (MMP) search followed by seed clustering and stitching [9].
End-to-End Cloud RNA-Seq Analysis Workflow
RNA-Seq Analysis Pipeline: A recommended workflow for cloud-based RNA-seq analysis, from raw data to count matrix, incorporating STAR alignment and Salmon quantification [44].
Configuring STAR's parameters is not a mere technical formality but a critical determinant in the success of an RNA-seq study, especially when implemented within scalable cloud workflows. By moving beyond default settings and thoughtfully adjusting parameters related to mismatches, intron sizes, multimapping, and novel junction discovery—as outlined in this document—researchers can significantly enhance the accuracy of their mappings. Adopting the hybrid STAR-Salmon protocol ensures a balance between comprehensive quality control and statistically robust quantification, providing a solid foundation for downstream differential expression and transcriptomic discovery in drug development and basic research.
In modern transcriptomics, the integration of robust statistical tools with scalable cloud infrastructure has become essential for handling large-scale RNA sequencing data. Within the context of a cloud-based STAR RNA-seq workflow, DESeq2 serves as the critical downstream component that transforms aligned read counts into biologically meaningful differential expression results [4]. This analysis package employs a negative binomial generalized linear model specifically designed for count-based data, properly accounting for the inherent variability and discrete nature of sequencing reads [45] [46].
The positioning of DESeq2 in the analytical workflow occurs after sequence alignment and quantification. When implementing a cloud-based STAR aligner workflow, the output (typically BAM files or raw count matrices) serves as direct input for DESeq2 [4] [47]. This seamless integration is crucial for comprehensive transcriptomic analysis, as DESeq2 performs normalization, statistical testing, and differential expression calling without requiring preliminary normalization of raw count data, making it ideally suited for processing output from cloud-based alignment pipelines [45].
Table 1: Key Advantages of DESeq2 for Cloud-Based RNA-seq Analysis
| Feature | Advantage | Implementation Benefit |
|---|---|---|
| Count-Based Model | Uses negative binomial distribution to model sequence count data | Properly handles biological variability and sequencing depth differences [46] |
| Internal Normalization | Automatically calculates size factors for library size correction | Eliminates need for pre-normalization of count data [45] |
| Dispersion Estimation | Estimates gene-wise dispersion and shrinks estimates for reliability | Improves accuracy for experiments with limited replicates [48] |
| Cloud Compatibility | Can process output directly from STAR aligner | Enables seamless integration into cloud-based workflows [4] [47] |
Experimental Design and Data Preparation
Experimental Design Considerations
Proper experimental design is fundamental to successful differential expression analysis. The design formula is a critical component that informs DESeq2 of the experimental structure and the comparisons of interest. This formula should include all major sources of variation in the data, with the factor of interest specified last [48]. For example, if investigating treatment effects while controlling for sex and age variations, the design formula would be: design <- ~ sex + age + treatment [48]. For more complex experimental designs investigating interactions between variables, DESeq2 supports interaction terms such as ~ genotype + treatment + genotype:treatment [47].
Data Input Requirements
DESeq2 requires two primary inputs for analysis:
- A count matrix with genes as rows and samples as columns containing raw, unnormalized integer counts
- A metadata table describing the experimental conditions for each sample [49] [45]
The count data should originate from tools that generate raw counts per gene, such as HTseq or featureCounts, which process the BAM files generated by the STAR aligner [45] [47]. It is crucial that these values represent actual counts rather than normalized values, as DESeq2's statistical model relies on the properties of count data to properly assess measurement precision [46].
Data Preprocessing and Quality Control
Prior to differential expression analysis, proper data preprocessing ensures computational efficiency and analytical accuracy:
Data Filtering: Remove genes with low counts across samples to reduce memory usage and improve multiple testing correction. A common threshold is keeping genes with at least 10 reads in at least one sample [49] [47].
Factor Level Specification: Explicitly set reference levels for categorical variables to ensure proper interpretation of results, particularly for the control condition in treatment studies [49] [45].
Sample Verification: Confirm that column names in the count matrix exactly match row names in the metadata to prevent analysis errors [47].
The following diagram illustrates the complete data preparation workflow from raw sequencing data to DESeq2-ready object:
Differential Expression Analysis Protocol
Core DESeq2 Workflow
The differential expression analysis with DESeq2 follows a standardized workflow that incorporates multiple statistical processing steps:
Object Creation: Create a DESeqDataSet object containing the count data, metadata, and design formula.
Analysis Execution: Run the comprehensive DESeq2 workflow with a single command:
This function sequentially performs size factor estimation, dispersion estimation, model fitting, and statistical testing [48] [49].
Results Extraction: Extract results for specific comparisons using the
results()function.
Key Statistical Steps in DESeq2
DESeq2 implements several sophisticated statistical procedures that occur during the DESeq() function call:
Size Factor Estimation: Corrects for differences in sequencing depth across samples using the median of ratios method [48] [46]. This generates normalization factors that account for library size differences without transforming the raw count data.
Dispersion Estimation: Measures the biological variability of each gene relative to its expression level [48]. DESeq2 first calculates gene-wise dispersion estimates, then fits a curve to these estimates, and finally shrinks dispersion estimates toward the fitted curve to improve reliability, particularly for genes with low counts or few replicates [48].
Statistical Testing: Fits a negative binomial generalized linear model for each gene and performs Wald tests to assess the significance of differences between conditions [48] [45]. For complex designs with multiple factors, DESeq2 can employ likelihood ratio tests to evaluate significance [48].
The following workflow diagram illustrates the key computational and statistical steps in the DESeq2 analysis pipeline:
Results Interpretation and Extraction
The output of DESeq2 analysis includes several key metrics for each gene:
- baseMean: The average normalized count across all samples.
- log2FoldChange: The estimated log2 fold change between conditions.
- lfcSE: Standard error of the log2 fold change estimate.
- stat: Wald test statistic.
- pvalue: The nominal p-value for the differential expression test.
- padj: The p-value adjusted for multiple testing using the Benjamini-Hochberg method [45] [47].
For improved visualization and ranking of genes, log2 fold change shrinkage is recommended using the lfcShrink() function with the apeglm method, which provides more accurate effect size estimates for genes with low counts [47] [46].
Successful implementation of DESeq2 within a cloud-based RNA-seq workflow requires both experimental and computational resources. The following table details the essential components:
Table 2: Key Research Reagent Solutions for DESeq2 Differential Expression Analysis
| Resource Category | Specific Tool/Reagent | Function in Analysis |
|---|---|---|
| Alignment Software | STAR Aligner | Performs splice-aware alignment of RNA-seq reads to reference genome, generating BAM files [4] |
| Quantification Tool | HTseq-count or featureCounts | Generates raw count matrices from BAM files by assigning reads to genomic features [45] [47] |
| Statistical Environment | R Programming Language | Provides the computational environment for running DESeq2 and related bioinformatics packages [49] [45] |
| Differential Expression Package | DESeq2 (Bioconductor) | Performs statistical analysis of differential expression using negative binomial generalized linear models [48] [46] |
| Reference Transcriptome | GENCODE or Ensembl annotations | Provides comprehensive gene models for read quantification and annotation of results [46] |
| Cloud Computing Resources | Google Cloud Platform, AWS, or Azure | Offers scalable computing infrastructure for resource-intensive alignment and analysis steps [4] [50] |
Advanced Applications and Integration Approaches
Alternative Quantification Methods
While this protocol focuses on the STAR-to-DESeq2 workflow, researchers should be aware of alternative quantification approaches that can be integrated with DESeq2. Pseudoalignment tools such as Salmon and kallisto offer faster quantification without generating intermediate BAM files [46]. These tools estimate transcript abundances using a lightweight alignment approach, and their output can be imported into DESeq2 using the tximport package, which provides count matrices and normalization offsets that account for potential changes in gene length across samples [46].
The choice between alignment-based and pseudoalignment-based approaches depends on research objectives. Alignment-based methods (STAR + HTseq) are advantageous when analyzing genomic regions beyond annotated genes or when visualizing alignments, while pseudoalignment methods offer speed advantages for standard differential expression analysis [46].
Cloud-Native Implementation
For large-scale studies, implementing the entire RNA-seq workflow in cloud environments provides significant advantages in scalability and cost efficiency. Cloud-native implementation strategies include:
- Containerization: Using Docker containers to ensure reproducibility and simplify deployment of complex software dependencies [4].
- Workflow Management: Employing workflow managers like Nextflow or Snakemake to orchestrate multi-step analyses across distributed cloud resources [46] [50].
- Resource Optimization: Selecting appropriate cloud instance types based on computational requirements (e.g., memory-optimized instances for STAR alignment) and leveraging cost-effective spot instances for non-time-critical processing [4].
The integration of DESeq2 into cloud-optimized pipelines such as nf-core/rnaseq represents the current state-of-the-art, providing standardized, scalable, and reproducible analytical workflows for transcriptomic studies [50].
DESeq2 represents a robust, statistically sound solution for differential expression analysis within cloud-based STAR RNA-seq workflows. Its capacity to handle the discrete nature of count data, account for biological variability through dispersion estimation, and integrate seamlessly with upstream alignment tools makes it an indispensable component of modern transcriptomics. The protocols outlined in this document provide researchers with a comprehensive framework for implementing DESeq2 in cloud environments, from experimental design through results interpretation. As transcriptomic studies continue to increase in scale and complexity, the integration of sophisticated statistical tools like DESeq2 with scalable cloud infrastructure will remain essential for extracting biologically meaningful insights from RNA sequencing data.
The expansion of transcriptomics in biomedical research and drug development has necessitated a shift from manual, low-throughput methods to fully automated, reproducible workflows. Automation strategies encompass the entire RNA-seq pipeline, from initial library preparation to final data analysis, and are crucial for eliminating technical variability, enhancing reproducibility, and increasing throughput to meet the demands of modern large-scale studies [51] [52]. When implemented within cloud-based environments, these strategies provide the additional benefits of scalable computational resources, collaborative potential, and standardized execution, which are fundamental for rigorous scientific inquiry and robust biomarker discovery [1] [2].
The implementation of a cloud-based STAR RNA-seq workflow represents a paradigm shift in how researchers approach transcriptome analysis. This framework integrates robust bioinformatics tools with scalable infrastructure, enabling researchers to transition from hands-on protocol management to overseeing a streamlined, end-to-end process. The core advantage lies in creating a hands-off operational model that minimizes human error, reduces hands-on time from days to hours, and ensures that results are consistent and comparable across projects and research institutions [51]. This document provides detailed application notes and protocols for establishing such a workflow, with a specific focus on the STAR aligner within an automated, cloud-native context.
Quantitative Benefits of Automation
The transition to automated workflows offers measurable improvements in efficiency, reproducibility, and cost-effectiveness. The data, consolidated from market analyses and peer-reviewed studies, highlight the compelling value proposition of automation.
Table 1: Time Efficiency Gains in Automated RNA-seq Workflows
| Workflow Stage | Manual Process Duration | Automated Process Duration | Efficiency Gain | Source |
|---|---|---|---|---|
| Library Preparation | ~2 days | ~9 hours | ~78% reduction | [51] |
| Data Analysis (Post-Sequencing) | Days to weeks (local servers) | Hours (cloud scaling) | Significant reduction | [2] |
| Total Workflow Hands-On Time | High | Significantly reduced | Enables higher throughput | [51] |
Table 2: Market and Operational Impact of RNA-seq Automation
| Metric | Value | Implication | Source |
|---|---|---|---|
| Projected NGS-based RNA-seq Market CAGR (2025-2034) | 20.1% | Rapid market expansion and adoption of advanced technologies | [26] |
| Projected Global RNA-seq Market Size by 2025 | ~USD 5,000 million | Strong growth driven by demand for advanced diagnostics and personalized medicine | [52] |
| Correlation Coefficient (Manual vs. Auto Libraries) | R² = 0.985 | Automated methods maintain high data fidelity and reproducibility | [51] |
Automated Protocol: Cloud-Based STAR RNA-seq Analysis
This protocol details the implementation of a fully automated, reproducible RNA-seq analysis workflow utilizing the STAR aligner and cloud computing resources. It is designed for researchers aiming to process multiple samples consistently with minimal manual intervention.
Pre-Workflow Preparation: Sample and Resource Provisioning
Experimental Design and Sample Sheet Creation Begin by constructing a sample sheet in the format required by the nf-core/RNA-seq workflow. This CSV file is the primary metadata input that drives the entire automated process [44].
Table 3: nf-core Sample Sheet Specification
| Column Header | Description | Requirements and Examples |
|---|---|---|
sample |
Unique sample identifier | Used as the column header in the final count matrix (e.g., Patient_1_Rep1) |
fastq_1 |
File path for Read 1 | Absolute or relative path to the gzipped FASTQ file for the first read pair |
fastq_2 |
File path for Read 2 | Absolute or relative path to the gzipped FASTQ file for the second read pair |
strandedness |
Library strandedness | Must be auto, forward, reverse, or unstranded. The use of auto is recommended to leverage Salmon's auto-detection function [44] |
Genomic Reference Provisioning The workflow requires a genome fasta file and a corresponding GTF annotation file. For consistency, obtain both files from the same source and version (e.g., ENSEMBL, GENCODE). These files must be pre-downloaded to a persistent storage location in your cloud environment.
Computational Resource Configuration Configure the workflow to run on a cloud computing platform (e.g., AWS, Google Cloud). This involves selecting a pre-configured machine image with Nextflow and necessary dependencies installed, or using a containerized service. Ensure that the chosen instance type has sufficient memory (≥ 32 GB RAM) and CPU cores (≥ 8) for STAR's genome alignment step.
Execution of the Automated Nextflow Pipeline
Workflow Initialization The core analysis is executed using the nf-core/RNA-seq workflow, which automates the entire process from raw data to a count matrix. The following command exemplifies how to launch the pipeline, which operates in "STAR-salmon" mode by default [44].
Key Parameters:
--input: Path to the sample sheet CSV file.--genome: A shorthand name for a pre-built genome index (e.g.,GRCh38,GRCm39). Alternatively, provide a custom genome fasta and GTF with--fastaand--gtf.--outdir: The directory where final results will be saved.-profile: Specifies the computational environment configuration (e.g.,awsbatch,google-lifesciences).-work-dir: Points to a cloud storage bucket for temporary working files, which is crucial for cost-effectiveness and managing large temporary data volumes.
Automated Process Steps Once launched, the workflow automatically executes a series of steps without further user input, as visualized below.
- Quality Control and Trimming: Tools like
fastporTrim Galoreautomatically perform adapter trimming and quality filtering, producing a report on data quality [41] [44]. - Splice-Aware Alignment: STAR aligns the trimmed reads to the reference genome, accurately handling spliced alignments across introns [44].
- Alignment Projection: The workflow automatically converts the genomic alignments (BAM files) into a transcriptome-compatible format for quantification.
- Expression Quantification: Salmon, in alignment-based mode, estimates transcript abundances, effectively handling the uncertainty of multi-mapping reads [44].
- Report Generation: The pipeline aggregates results from all steps, including alignment statistics, QC metrics, and the final gene-level count matrix, into a comprehensive, downloadable report.
Post-Processing and Downstream Analysis in the Cloud
Upon successful pipeline completion, the results are available in the designated cloud output directory. The key output for differential expression analysis is the gene-level count matrix. This matrix can be seamlessly imported into R or Python environments running on cloud virtual machines for subsequent statistical analysis, such as with the limma package in R [44]. The entire output directory, including the count matrix, alignment files, and QC reports, should be archived in long-term, low-cost cloud storage to ensure reproducibility and data longevity.
The Scientist's Toolkit: Essential Research Reagent Solutions
A successful automated workflow relies on a foundation of robust, reliable reagents and platforms. The following table details key solutions utilized in the protocols cited herein.
Table 4: Essential Research Reagents and Platforms for Automated RNA-seq
| Item Name | Provider/Developer | Function in the Workflow |
|---|---|---|
| NEBNext Ultra II RNA Library Prep Kit | New England Biolabs | Used in the automated library preparation protocol on the Beckman Biomek i7 for constructing sequencing-ready libraries from total RNA [51]. |
| Biomek i7 Hybrid Workstation | Beckman Coulter | Liquid handling robot that automates the library preparation process, drastically reducing hands-on time and improving reproducibility [51]. |
| STAR (Spliced Transcripts Alignment to a Reference) | Alexander Dobin et al. | The core splice-aware aligner used in the nf-core pipeline to accurately map RNA-seq reads to a reference genome [44]. |
| Salmon | Rob Patro et al. | A fast and bias-aware tool for quantifying transcript abundances from the aligned reads, handling uncertainty in read assignment [44]. |
| Nextflow | Seqera Labs | The workflow language that orchestrates the entire automated process, from QC to quantification, ensuring portability and reproducibility across different computing environments [44]. |
| NovaMagic Cloud Platform | Novogene | An example of a commercial cloud-based analysis platform that provides user-friendly, post-sequencing data analysis services, democratizing access to bioinformatics [53]. |
The integration of automation strategies from bench to cloud represents the future of robust, scalable, and reproducible transcriptomic research. The protocols and application notes detailed herein demonstrate that it is feasible to construct end-to-end, hands-off workflows that not only save valuable researcher time but also generate publication-quality data. As the field moves towards larger datasets and the integration of multi-omics approaches, the adoption of these automated, cloud-native frameworks will become increasingly critical for driving discoveries in basic research and accelerating the pipeline of drug development.
Performance Tuning and Cost Optimization Strategies
The implementation of the STAR (Spliced Transcripts Alignment to a Reference) RNA-seq aligner in cloud environments presents significant computational challenges, primarily due to its high memory demands and processing requirements. Successful cloud-based deployment hinges on precise resource provisioning to balance cost, performance, and stability. This Application Note provides a structured framework for selecting optimal cloud instances and configuring memory management, drawing on empirical performance data and established protocols. By adhering to these guidelines, researchers can achieve robust, scalable, and cost-effective transcriptomic analyses, directly supporting accelerated biomedical and therapeutic discovery.
Resource Requirements Analysis and Instance Selection
The STAR aligner is computationally intensive, with distinct requirements for its two primary phases: genome index generation and read alignment. Proper instance selection is critical for both performance and cost management.
Phase-Specific Computational Demands
Table 1: Computational Resource Requirements for STAR Workflow Phases
| Workflow Phase | Recommended vCPUs | Recommended RAM (GB) | Disk I/O Profile | Estimated Duration (varies by data size) |
|---|---|---|---|---|
| Genome Index Generation | 8 - 16 [4] [54] | 32 - 48 [4] [10] | High-throughput disk recommended [10] | Several hours |
| Read Alignment | 4 - 8 [4] [54] | 32 [4] | High-throughput disk required for scaling [10] | Minutes to hours per sample |
Cloud Instance Selection Guide
Empirical analysis indicates that memory-optimized instance families are generally the most suitable for STAR alignment. The following diagram illustrates the decision pathway for selecting and validating a cloud instance.
Key Considerations for Instance Selection:
- Memory-Optimized Instances: Instances such as AWS's R or X families (e.g., r5, x2gd) or their equivalents on other cloud platforms are ideal due to their high memory-to-vCPU ratio, which meets STAR's substantial RAM requirements [10].
- Preemptible/Spot Instances: For the alignment phase, which consists of many parallel, independent tasks, using preemptible or spot instances can reduce costs significantly by 60-80% without impacting overall workflow completion, as failed individual jobs can be restarted [4] [10].
- Disk I/O: STAR's performance scales with the number of threads but can be limited by disk read/write speeds. Selecting instances with attached high-throughput SSD storage (e.g., AWS EBS gp3 or io2 volumes) is essential for maximizing throughput, especially when using multiple cores [10].
Experimental Protocols for Resource Optimization
Protocol: Empirical Determination of Optimal Core Count
Objective: To identify the most cost-efficient core count for the STAR alignment step on a given cloud instance type, minimizing alignment time without over-provisioning resources.
Materials:
- Cloud compute instance (e.g., memory-optimized type with 32+ GB RAM)
- STAR aligner (v2.7.1a or newer) [8]
- Reference genome index
- Sample FASTQ file (representative of full dataset)
Method:
- Preparation: Place the genome index and a representative sample FASTQ file on high-throughput storage attached to the instance.
- Baseline Test: Run the STAR alignment command, starting with 4 cores (
--runThreadN 4). Record the wall-clock time and CPU utilization. - Iterative Testing: Repeat the alignment, incrementally increasing the
--runThreadNparameter (e.g., to 6, 8, 12, 16). Ensure the instance type has a sufficient number of vCPUs for each test. - Data Collection: For each run, document:
- Alignment time (e.g., in minutes)
--runThreadNvalue- Instance type and cost per unit time.
- Analysis: Calculate the cost for each run (cost per unit time × alignment time). Plot alignment time and cost against the number of cores. The optimal core count is typically at the inflection point where adding more cores yields diminishing returns in speed, and the cost may begin to increase.
Protocol: Memory Footprint Profiling and Monitoring
Objective: To quantify the peak memory usage of the STAR alignment process under a specific workload to guide instance selection and prevent out-of-memory failures.
Materials:
- Cloud compute instance
- STAR aligner
- Reference genome index and sample FASTQ file
- System monitoring tools (e.g.,
htop,time -v, or cloud monitoring metrics)
Method:
- Setup: Launch the chosen instance type and install necessary monitoring tools.
- Execution: Initiate the STAR alignment command with the desired parameters.
- Monitoring: In a separate terminal session or via the cloud provider's console, actively monitor the system's memory consumption. The command
/usr/bin/time -v STAR ...can provide a detailed report including "Maximum resident set size" after the job completes. - Data Collection: Record the peak memory usage observed during the run. This is most critical during the initial loading of the genome index into memory.
- Validation: Compare the observed peak memory usage against the instance's available RAM. For a stable operation, ensure the instance has a 15-20% memory buffer above the observed peak usage.
The Scientist's Toolkit: Research Reagent Solutions
Table 2: Essential Tools and Resources for Cloud-Based STAR RNA-seq Analysis
| Item | Function | Specification / Note |
|---|---|---|
| STAR Aligner | Splice-aware alignment of RNA-seq reads to a reference genome. | Use version 2.7.1a or newer for bug fixes and optimizations [8]. |
| Reference Genome | Baseline DNA sequence for read alignment. | Use a consistent version (e.g., GRCh38noalt) [8]. Mismatches with the gene model patch version can affect results. |
| Gene Annotation (GTF/GFF3) | Provides genomic coordinates of genes, transcripts, and exons. | Use a comprehensive, non-filtered GENCODE annotation (e.g., v31+) for best results, as recommended by the STAR manual [4] [8]. |
| dsub | A command-line tool to submit and manage batch jobs on cloud providers like Google Cloud. | Simplifies running multi-sample workflows by handling resource provisioning and task arrays [4]. |
| SRA-Toolkit | Provides utilities for downloading and converting sequence data from the NCBI SRA database. | Tools like prefetch and fasterq-dump are used to acquire and prepare input FASTQ files [10]. |
| High-Throughput Storage | Provides the necessary I/O performance for reading/writing large sequencing files. | Essential for avoiding I/O bottlenecks. Use cloud SSD block storage (e.g., AWS EBS gp3) or equivalent [10]. |
Integrated Optimization Workflow
The following diagram synthesizes the key protocols and checks for a fully optimized STAR workflow, from initial setup to large-scale execution.
Workflow Logic:
- A. Initial Setup: The genome index is generated once as a high-resource, non-preemptible job to ensure reliability.
- B. Optimization Phase: A single representative sample is used to empirically determine the optimal core count and confirm memory requirements, informing the configuration for the full batch.
- C. Execution Phase: With parameters finalized, the full set of samples is aligned in a parallelized array job, leveraging cost-effective preemptible instances because individual sample failures can be safely retried [4] [10].
Early Stopping and Other Algorithmic Optimizations for Faster Alignment
The alignment of RNA sequencing (RNA-seq) reads to a reference genome is a foundational step in transcriptomic analysis, yet it is often the most computationally intensive part of the workflow. In cloud-based implementations, where computational resources are flexible but incur direct costs, optimizing this step is crucial for both time and cost efficiency. The STAR (Spliced Transcripts Alignment to a Reference) aligner, while known for its high accuracy and speed, presents significant opportunities for optimization through algorithmic improvements and parallelization strategies. This Application Note details specific, empirically-validated optimizations—including the impactful early stopping technique—that can dramatically accelerate alignment within a cloud-based STAR RNA-seq workflow, providing researchers with protocols and data to enhance their own implementations.
The following tables consolidate key performance metrics from recent optimization studies, providing a benchmark for expected improvements.
Table 1: Performance Impact of Core STAR Optimizations
| Optimization Method | Key Metric Improvement | Magnitude of Improvement | Experimental Context & Scale |
|---|---|---|---|
| Early Stopping [5] [10] | Total Alignment Time Reduction | 23% | Medium to large-scale cloud experiment |
| Parallel MEM Retrieval [55] | Runtime Speedup (vs. single-thread) | 1.77× to 10.78× | Largest human dataset (ALZ), varying parameters |
| Parallel MEM Retrieval [55] | Speedup in uLTRA pipeline | ~4.99× | 15 processes, each with 16 threads |
| Optimal EC2 Instance & Spot Instances [5] [10] | Cost Efficiency | Significant reduction (precise % not stated) | Large-scale STAR workflow on AWS |
Table 2: Comparative Alignment Program Effectiveness (Small RNA-seq Focus)
| Alignment Program | Paired Quantification Tool | Reported Effectiveness | Key Context |
|---|---|---|---|
| STAR | Salmon | Most reliable approach [56] | Small RNA case study within the MAF |
| STAR | Samtools | Reliable, but with limitations [56] | Small RNA case study within the MAF |
| Bowtie2 | Salmon / Samtools | Effective, but less than STAR [56] | Small RNA case study within the MAF |
| BBMap | Salmon / Samtools | Less effective than STAR or Bowtie2 [56] | Small RNA case study within the MAF |
Detailed Experimental Protocols for Key Optimizations
Protocol 1: Implementing Early Stopping in STAR Alignment
The early stopping optimization leverages the fact that a subset of a dataset's reads can provide a robust estimate of the final alignment outcome, allowing the process to be terminated early for a significant portion of samples without compromising downstream analysis [5] [10].
Methodology:
- Experimental Setup: The optimization was tested within a cloud-native Transcriptomics Atlas pipeline processing tens to hundreds of terabytes of human RNA-seq data from the NCBI SRA [10].
- Alignment Process: The standard STAR alignment workflow (Section 5.2) was executed. Alongside, a decision metric was computed in real-time. While the specific metric is not detailed in the provided results, such a metric typically involves assessing the stability of gene counts or mapping rates as alignment progresses.
- Stopping Criterion: A predetermined threshold for the decision metric was established. When the metric for a given sample indicated that further alignment would not significantly alter the results, the STAR process for that sample was terminated early [5] [10].
- Validation: The results from the early-stopped alignments were compared against full alignments to ensure accuracy in downstream analyses like gene counting was maintained.
Protocol 2: Accelerating Seeding via Parallel Maximal Exact Match (MEM) Retrieval
This protocol addresses a computational bottleneck in spliced alignment algorithms, which is also relevant to STAR's strategy of searching for Maximal Mappable Prefixes (MMPs) [55] [54].
Methodology:
- Performance Profiling: The target aligner (uLTRA) was first profiled using performance monitoring tools. This confirmed that the "seeding" step—retrieving MEMs between reads and the reference genome—became the dominant time consumer, exceeding 60% of total runtime when multiple processes were used [55].
- Index Serialization: The FM-Index and sampled LCP array for the reference genome were pre-computed and serialized into binary files. This allowed the index to be loaded once and reused across multiple alignment tasks, nearly eliminating repetitive indexing time [55].
- Multi-threaded MEM Search: The original single-threaded loop processing reads sequentially was replaced with a multi-threaded strategy. In this approach, a batch of reads is loaded, and multiple threads within a single CPU process concurrently retrieve MEMs for different reads in the batch [55].
- Integration and Evaluation: The parallel MEM retrieval algorithm was integrated into the uLTRA pipeline. Its performance was evaluated on datasets of varying sizes (e.g., human ALZ, fruit fly DROS), measuring runtime, speedup, and throughput against the original single-threaded implementation [55].
Workflow and Logical Diagrams
The following diagrams illustrate the standard STAR workflow and the integration point of the parallel MEM retrieval optimization.
Diagram 1: STAR Alignment Workflow. This outlines the two main stages of the STAR algorithm and its position in a standard RNA-seq analysis pipeline [54].
Diagram 2: Parallel vs Sequential MEM Retrieval. This contrasts the new multi-threaded MEM retrieval strategy with the original sequential loop, which was identified as a major bottleneck [55].
The Scientist's Toolkit: Research Reagent Solutions
Table 3: Essential Tools and Resources for Optimized STAR Workflows
| Item | Function / Role in the Workflow | Specification & Notes |
|---|---|---|
| STAR Aligner | Performs the core task of spliced alignment of RNA-seq reads to a reference genome [54]. | Version 2.7.10b used in cloud-optimization studies [10]. Requires significant RAM (tens of GiBs). |
| SRA Toolkit | Provides utilities to download and convert raw sequencing data from the NCBI SRA database into FASTQ format for alignment [10]. | Tools prefetch (download) and fasterq-dump (conversion) are critical for data ingestion. |
| Reference Genome & Annotations | The genomic sequence (FASTA) and gene annotation (GTF/GFF) files required for genome indexing and alignment [54]. | Sources like Ensembl provide high-quality references. Essential for accurate spliced alignment. |
| Suffix Array (SA) Index | The uncompressed suffix array data structure built from the reference genome during indexing, enabling STAR's fast seed searching for MMPs [54]. | Stored in the genome index directory. |
| Serialized FM-Index & LCP Array | Pre-computed and saved index files for the reference genome that accelerate the MEM retrieval step in parallelized strategies [55]. | Enables near-instant index loading and reuse, eliminating a key bottleneck. |
| Multi-Alignment Framework (MAF) | A modular Bash script-based framework for comparing multiple alignment programs and quantification tools on the same dataset [56]. | Useful for benchmarking STAR against other aligners like Bowtie2 and BBMap in specific contexts. |
The implementation of the Spliced Transcripts Alignment to a Reference (STAR) aligner in cloud environments presents significant opportunities for cost reduction in large-scale transcriptomics studies. STAR is an ultrafast universal RNA-seq aligner that uses a previously undescribed RNA-seq alignment algorithm based on sequential maximum mappable seed search in uncompressed suffix arrays [9]. While STAR outperforms other aligners by a factor of >50 in mapping speed, its resource-intensive nature demands careful optimization in cloud environments [9]. Recent research has demonstrated that strategic optimization techniques can achieve significant execution time and cost reduction for processing tens or hundreds of terabytes of RNA-sequencing data [5] [10]. This protocol outlines evidence-based methodologies for leveraging cloud spot instances and parallelism to optimize STAR aligner workflows while maintaining analytical accuracy and reliability.
Quantitative Performance Benchmarks
The following tables summarize key quantitative findings from empirical studies on STAR optimization in cloud environments, providing benchmarks for expected performance improvements.
Table 1: Impact of Optimization Techniques on STAR Performance
| Optimization Technique | Performance Improvement | Experimental Conditions |
|---|---|---|
| Early Stopping | 23% reduction in total alignment time | Medium-scale experiments with Transcriptomics Atlas pipeline [10] |
| Optimal Instance Selection | Significant cost reduction (specific percentages not provided) | AWS EC2 instance comparison [5] |
| Spot Instance Usage | Cost efficiency with applicability verification | Resource-intensive aligner on AWS spot instances [5] [10] |
Table 2: STAR Aligner Performance Characteristics
| Performance Metric | Result | Experimental Context |
|---|---|---|
| Mapping Speed | >50x faster than other aligners | Human genome, 550 million 2×76 bp paired-end reads per hour [9] |
| Hardware Requirements | Modest 12-core server | Benchmark testing [9] |
| Data Volume Capacity | >80 billion reads | ENCODE Transcriptome RNA-seq dataset [9] |
| Alignment Precision | 80-90% success rate | Experimental validation of 1960 novel intergenic splice junctions [9] |
Experimental Protocol: Cloud Implementation of STAR Aligner
Workflow Architecture and Optimization Points
The following diagram illustrates the optimized STAR workflow in a cloud environment, highlighting key points for cost reduction and efficiency improvements:
Step-by-Step Implementation Protocol
Preprocessing and Data Preparation
Input Data Acquisition: Download SRA files from the NCBI Sequence Read Archive using
prefetchfrom the SRA-Toolkit [10]. The NCBI SRA repository contains more than 30PB of sequencing data, with files hosted on AWS in the us-east-1 region for optimal transfer speeds [10].Format Conversion: Convert SRA files to FASTQ format using
fasterq-dumpfrom the SRA-Toolkit [10]. This prepares the data for alignment with STAR.Reference Genome Preparation:
- Download the appropriate reference genome from Ensembl database [10].
- Generate the STAR index using the
STAR --runMode genomeGeneratecommand with parameters optimized for your target organism and read length. - Distribute the precomputed genomic index data structure to all worker nodes using efficient distribution mechanisms to minimize startup latency [10].
Cloud Environment Configuration
Instance Selection: Based on empirical testing, select memory-optimized AWS EC2 instance types (e.g., R5 or R6i series) that provide sufficient RAM for the STAR index and high-throughput disk I/O for scaling with multiple threads [10]. STAR typically requires tens of GiBs of RAM, depending on the reference genome size [10].
Spot Instance Implementation:
Storage Configuration:
- Use appropriately sized Amazon EBS volumes or instance store volumes optimized for I/O performance.
- Implement a shared file system or object storage for intermediate results if needed for downstream processing.
Strategic Parallelism Implementation
Inter-Node Parallelism:
- Distribute individual samples or batches of samples across multiple worker nodes.
- Use a job scheduling system (e.g., AWS Batch, Apache Airflow) to manage sample distribution and resource allocation.
Intra-Node Parallelism:
- Configure STAR's
--runThreadNparameter to utilize all available vCPUs on the instance [10]. - Monitor memory bandwidth and I/O contention to identify optimal thread count, which may be slightly less than the total vCPU count for memory-intensive operations.
- Configure STAR's
Early Stopping Optimization:
Alignment Execution
STAR Command Configuration:
- Use
--quantMode GeneCountsto obtain gene expression counts directly [10]. - Adjust alignment parameters based on specific experimental needs and reference organism.
- Use
Performance Monitoring:
- Monitor CPU utilization, memory usage, and disk I/O during alignment.
- Adjust instance types and parallelism based on observed bottlenecks.
- Log performance metrics for continuous optimization.
Post-Alignment Processing
Output Processing: Convert SAM files to BAM format, sort, and index using samtools if needed for downstream analysis.
Expression Quantification: If not using STAR's built-in quantification, perform read counting with specialized tools.
Differential Expression Analysis: Use DESeq2 for normalization and identification of differentially expressed genes [10].
The Scientist's Toolkit: Research Reagent Solutions
Table 3: Essential Tools and Resources for Cloud-Based STAR Analysis
| Resource | Function | Implementation Notes |
|---|---|---|
| STAR Aligner | Spliced alignment of RNA-seq reads | Version 2.7.10b or newer; requires significant RAM [10] |
| SRA-Toolkit | Access and handling of NCBI SRA files | Use prefetch and fasterq-dump components [10] |
| AWS EC2 Spot Instances | Cost-effective compute resources | 60-90% cost savings compared to on-demand instances [5] |
| DESeq2 | Differential expression analysis | R package for normalization and statistical testing [10] |
| Transcriptomics Atlas Pipeline | Integrated analysis workflow | Publicly available on GitHub under MIT license [10] |
| Ensembl Database | Reference genomes and annotations | Foundational resource for alignment scaffold [10] |
Technical Validation and Quality Assessment
The optimization approaches described have been validated in both medium-scale and large-scale experiments [10]. Implementation of these techniques in the Transcriptomics Atlas pipeline, which processes data from the NCBI SRA repository, has demonstrated significant improvements in cost efficiency without compromising analytical accuracy [10]. The 23% reduction in alignment time through early stopping optimization represents a substantial efficiency gain for large-scale studies [5] [10]. Furthermore, STAR's alignment precision has been independently validated through experimental confirmation of novel splice junctions with 80-90% success rates, ensuring that optimization techniques do not compromise result quality [9].
The following diagram illustrates the experimental validation approach and performance relationships for these optimization techniques:
The Spliced Transcripts Alignment to a Reference (STAR) aligner is designed to address the unique challenges of RNA-seq data mapping, employing a sophisticated two-step process that enables both high accuracy and remarkable speed, outperforming other aligners by more than a factor of 50 in mapping speed [54] [57]. This efficiency comes with significant memory requirements, making strategic index management particularly crucial in cloud-based workflow implementations. STAR's algorithm operates through seed searching followed by clustering, stitching, and scoring, which relies on a specialized genome index that must be generated before read alignment can occur [54]. For researchers implementing cloud-based RNA-seq workflows, effective STAR index management presents substantial challenges related to storage optimization, access latency, and computational resource allocation, while ensuring reproducibility and analysis consistency across distributed computing environments.
STAR Algorithm and Index Fundamentals
Core Alignment Mechanism
STAR utilizes an innovative alignment strategy that fundamentally depends on its pre-built genome index. The algorithm begins with Maximal Mappable Prefix (MMP) identification, where for each read, STAR searches for the longest sequence that exactly matches one or more locations on the reference genome [54] [57]. These MMPs are termed "seeds," with the first mapped sequence called seed1. The algorithm then sequentially searches the unmapped portions of the read to identify subsequent MMPs (seed2, etc.). This approach differs significantly from other aligners that often search for entire read sequences before performing iterative mapping rounds. When exact matches are not found due to mismatches or indels, STAR extends the previous MMPs, and if extension fails, poor quality or adapter sequences are soft-clipped [54].
The second phase involves clustering and stitching, where separate seeds are assembled into complete reads by first clustering them based on proximity to reliable "anchor" seeds that are not multi-mapping [54]. The seeds are then stitched together based on comprehensive scoring that considers mismatches, indels, gaps, and other alignment quality metrics. This two-stage process, enabled by the specialized genome index structure, allows STAR to efficiently handle spliced alignments across intron boundaries—a critical capability for eukaryotic transcriptome analysis.
Index Composition and Requirements
The STAR genome index contains compressed representations of the reference genome optimized for its alignment algorithm. The index is created using the genomeGenerate mode and requires two primary inputs: a reference genome in FASTA format and gene annotations in GTF format [54] [58]. A critical parameter during index generation is --sjdbOverhang, which specifies the length of the genomic sequence around annotated junctions. The recommended value for this parameter is read length minus 1 [54]. For reads of varying length, the ideal value is max(ReadLength)-1, though in practice, the default value of 100 often works similarly to the ideal value.
Table: Essential Components for STAR Index Generation
| Component | Format | Purpose | Considerations |
|---|---|---|---|
| Reference Genome | FASTA | Provides genomic sequence for alignment | Must match organism/assembly; chromosome files |
| Gene Annotations | GTF/GFF | Defines exon-intron boundaries | Should correspond to genome version; crucial for splice awareness |
| Index Directory | Binary Files | Stores compressed genome representation | Requires significant storage space; 30+ GB for mammalian genomes |
The memory requirements for index generation are substantial, often requiring 32GB or more of RAM for mammalian genomes [58]. The resulting index size varies by genome but typically ranges from 20-40GB for common model organisms, creating significant storage and transfer considerations for cloud implementations.
Cloud-Based Index Management Strategies
Centralized Repository Approach
A highly effective strategy for managing STAR indices in cloud environments involves establishing centralized index repositories that can be shared across multiple analysis instances and research projects. This approach mirrors the shared database model implemented in high-performance computing centers, where designated directories contain pre-built indices for various organisms and genome assemblies that are accessible to all users [54] [57]. In cloud implementations, this can be achieved through network-attached storage volumes, object storage buckets, or specialized bioinformatics data portals.
The centralized repository model offers several advantages: it eliminates redundant storage of large index files across multiple projects, ensures version consistency when the same reference materials are used by different team members, and simplifies maintenance and updates when new genome assemblies or annotations become available. For example, the Harvard Bioinformatics Core curriculum describes their shared resource directory at /n/groups/shared_databases/igenome/ which provides pre-built indices that researchers can directly utilize without generating them independently [54].
Implementation Protocols
Protocol 3.2.1: Establishing a Centralized Index Repository
Select appropriate cloud storage: Choose between block storage (for frequent access), object storage (for cost-effective archiving), or network file systems (for shared access), considering access patterns and budget constraints.
Organize indices systematically: Create a logical directory structure that includes organism, genome assembly version, annotation source, and STAR version used for index generation. Example:
/star_indices/homo_sapiens/GRCh38/ensembl_104/star_2.7.10a/.Implement access controls: Configure permissions to allow read access for all authorized users while restricting write capabilities to bioinformatics administrators.
Create documentation metadata: For each index, document the exact FASTA and GTF source files, download dates, and key parameters used during generation, particularly
--sjdbOverhang.Set up versioning protocols: Establish procedures for adding new indices while maintaining previous versions to ensure reproducibility of existing analyses.
Protocol 3.2.2: Optimized Index Generation Parameters
The following protocol details the index generation process with cloud implementation considerations:
Table: Cloud-Specific Index Generation Parameters
| Parameter | Typical Setting | Cloud Optimization Purpose |
|---|---|---|
--runThreadN |
8-16 cores | Balance speed vs. cost based on cloud instance pricing |
--genomeSAsparseD |
2 | Reduce index size for storage efficiency |
--genomeChrBinNbits |
18 | Minimize memory requirements during generation |
--genomeSAindexNbases |
14 (for small genomes) | Adjust for non-standard genome sizes |
For cloud implementations, the sparse index options (--genomeSAsparseD) can significantly reduce storage requirements with minimal impact on alignment accuracy, providing cost-benefit advantages for large-scale operations.
Visualization of STAR Index Management Workflow
The following diagram illustrates the complete STAR index management workflow in a cloud environment, highlighting the relationship between different components and processes:
STAR Index Management in Cloud Environment
This workflow emphasizes the separation between the centralized repository (cost-effective bulk storage) and local instance caches (high-performance temporary storage), which is crucial for optimizing both performance and costs in cloud implementations.
Research Reagent Solutions for STAR Implementation
Table: Essential Materials and Computational Resources for STAR RNA-seq Analysis
| Resource Category | Specific Examples | Function in Workflow | Implementation Notes |
|---|---|---|---|
| Reference Genomes | ENSEMBL, NCBI Assembly FASTA files | Provides genomic coordinate system for alignment | Use consistent versions across research team; checksum verification recommended |
| Gene Annotations | ENSEMBL GTF, RefSeq GFF3 | Defines exon-intron structure for splice-aware alignment | Ensure compatibility with genome version; third-party annotations may require validation |
| Compute Instances | Cloud VMs with 16+ cores, 64GB+ RAM | Executes alignment process with STAR | Memory-optimized instances preferred; spot instances can reduce costs |
| Storage Systems | Object storage (e.g., S3), Network file systems | Hosts centralized index repositories | Implement lifecycle policies to migrate unused indices to cheaper storage tiers |
| Containerization | Docker/Singularity images with STAR | Ensures version consistency and reproducibility | Include dependent tools (samtools, bedtools) in container definition |
Performance Optimization and Troubleshooting
Species-Specific Parameter Adjustments
While STAR's default parameters are optimized for mammalian genomes, researchers working with non-mammalian organisms must adjust key parameters to maintain alignment accuracy [59] [41]. This is particularly important for plants, fungi, and other species with significantly different genomic architectures. The --alignIntronMax parameter, which controls the maximum intron size, should be reduced for organisms with smaller introns. Similarly, the --alignMatesGapMax parameter (maximum distance between paired-end mates) often requires adjustment based on the organism's typical intron sizes and the library preparation fragment length distribution [59].
For plant pathogenic fungi and other non-model organisms, comprehensive optimization of the entire RNA-seq workflow—including STAR parameters—has been shown to provide more accurate biological insights compared to default configurations [41]. This species-specific optimization requires careful benchmarking, potentially using simulated datasets or orthogonal validation methods to establish appropriate parameter sets.
Monitoring and Quality Control
Effective index management includes rigorous quality control procedures to identify potential issues before they impact production analyses. The following protocol outlines key validation steps:
Protocol 6.2.1: Index Validation and Performance Monitoring
Alignment rate benchmarking: Test each new index with a standardized control dataset to establish baseline alignment rates and compare against expected performance.
Junction saturation analysis: Verify that splice junction detection scales appropriately with sequencing depth using RSeQC or similar tools [60].
Resource utilization tracking: Monitor memory consumption, storage I/O, and computational time during alignment to identify potential bottlenecks.
Cross-validation with alternative methods: Periodically compare STAR alignment results with other splice-aware aligners (HISAT2, TopHat2) to detect systematic issues [41].
Implementation of these monitoring procedures enables early detection of index corruption, version mismatches, or suboptimal parameter configurations that could compromise analysis quality.
Effective STAR index management represents a critical foundation for robust, reproducible, and efficient RNA-seq analyses in cloud environments. By implementing centralized repository architectures with appropriate storage hierarchies, establishing species-specific parameter optimization protocols, and maintaining comprehensive version control and documentation, research teams can significantly enhance the reliability of their transcriptomic workflows while optimizing computational costs. The strategies outlined in this application note provide a framework for addressing the distinctive data distribution challenges presented by STAR's memory-intensive alignment algorithm, enabling research teams to leverage the tool's exceptional speed and accuracy advantages without introducing unnecessary operational complexity or reproducibility concerns. As cloud-based RNA-seq workflows continue to evolve, thoughtful index management approaches will remain essential for maximizing analytical quality and research productivity.
The implementation of the Spliced Transcripts Alignment to a Reference (STAR) aligner in cloud environments represents a paradigm shift in transcriptomics research, enabling the processing of tens to hundreds of terabytes of RNA-sequencing data with unprecedented scalability [5]. However, this shift introduces complex monitoring and debugging challenges that differ substantially from traditional high-performance computing environments. Cloud-based RNA-seq workflows involve dynamic resource allocation, distributed computing architectures, and cost-performance tradeoffs that require specialized approaches for bottleneck identification.
As research consortia and pharmaceutical companies increasingly process massive datasets like the ENCODE transcriptome (>80 billion reads), the ability to efficiently monitor and optimize these workflows has become crucial for maintaining research momentum and cost-effectiveness [9]. The Singapore Nanopore Expression (SG-NEx) project, one of the world's largest long-read RNA sequencing datasets comprising over 750 million long RNA reads across 14 human cell lines, exemplifies the scale at which modern transcriptomics operates [61]. This Application Note provides detailed methodologies for identifying and resolving performance bottlenecks specifically within cloud-based STAR RNA-seq implementations, with protocols designed for researchers, scientists, and drug development professionals.
Workflow Architecture and Performance Benchmarks
Core Components of STAR Cloud Implementation
The STAR algorithm employs a two-phase mapping approach consisting of seed searching using sequential maximum mappable prefix (MMP) identification and clustering/stitching/scoring to generate complete alignments [9]. In cloud environments, this process is distributed across multiple virtualized compute instances with significant implications for performance monitoring. The algorithm's design, which uses uncompressed suffix arrays for seed finding, creates specific memory and computational patterns that must be understood when identifying bottlenecks [9].
Key architectural components requiring monitoring include:
- Compute-optimized instances for the alignment core
- High-throughput storage volumes for intermediate files
- Network bandwidth between compute and storage resources
- Memory allocation for reference genome indices
Performance analysis indicates that STAR's memory requirements scale with reference genome size, typically requiring ~30GB for the human genome, while computational requirements depend on read length, sequencing depth, and error profiles [62].
Quantitative Performance Baselines
Table 1: Performance Metrics for STAR Alignment in Cloud Environments
| Metric | Baseline Performance | Optimized Performance | Measurement Method |
|---|---|---|---|
| Alignment Speed | 299.7-356.2 million reads/hour [62] | 23% improvement with early stopping [5] | Log.progress.out monitoring |
| Memory Usage | ~10× genome size (30GB for human) [62] | Instance-specific optimization [5] | Cloud monitoring tools |
| CPU Utilization | Varies by instance type | Optimal with spot instances [5] | CPU load averages |
| I/O Patterns | High-throughput sequential reads | Parallel file system optimization [5] | Storage performance metrics |
| Cost Efficiency | Standard on-demand instances | 30-50% reduction with spot instances [5] | Cloud cost management tools |
Data extracted from performance analysis studies demonstrates that proper optimization can reduce total alignment time by approximately 23% through early stopping techniques and appropriate instance selection [5]. Medium-scale experiments followed by large-scale validation have confirmed that these optimizations maintain alignment accuracy while significantly improving throughput for large RNA-seq datasets.
Monitoring Framework and Bottleneck Identification
Comprehensive Monitoring Architecture
Implementing an effective monitoring framework requires instrumentation at multiple levels of the cloud infrastructure and application stack. The architecture should capture metrics from virtual machines, storage systems, network interfaces, and the STAR application itself to provide a comprehensive view of system behavior during alignment jobs.
Table 2: Key Monitoring Points and Metrics for Bottleneck Detection
| Monitoring Layer | Critical Metrics | Tools & Methods | Bottleneck Indicators |
|---|---|---|---|
| Compute Instance | CPU utilization, memory usage, load average | Cloud provider metrics, vmstat, top | Sustained >80% CPU, swap usage |
| Storage System | I/O throughput, IOPS, latency | Cloud storage metrics, iostat | I/O wait >10%, slow read times |
| Network | Bandwidth, packet loss, latency | Cloud network metrics, ping, traceroute | Network saturation, timeouts |
| STAR Application | Reads processed/hour, mapping rates, progress | Log.progress.out, custom parsing | Dropping throughput, rising unmapped reads |
| Cost Management | Instance costs, storage costs, data transfer | Cloud cost explorer, tagging | Unanticipated cost spikes |
The STAR software provides built-in progress monitoring through its Log.progress.out file, which updates every minute with critical statistics including processed read counts, mapping rates, and unique/multi-mapping distributions [62]. This file serves as the primary application-level monitoring resource and should be integrated with cloud monitoring systems for real-time bottleneck detection.
Diagnostic Protocol for Bottleneck Identification
Protocol 1: Comprehensive Bottleneck Analysis in Cloud STAR Workflows
Principle: Systematic identification of performance constraints through layered monitoring and targeted diagnostics.
Materials:
- Cloud-based STAR implementation
- Instance with monitoring agent installed
- Access to cloud provider's monitoring console
- STAR reference genome indices
- RNA-seq dataset (FASTQ format)
Procedure:
- Baseline Establishment
- Deploy STAR on appropriate cloud instance (e.g., memory-optimized for human genomes)
- Initiate alignment job with representative dataset subset (1-5 million reads)
- Record baseline metrics from cloud monitoring console for CPU, memory, storage I/O, and network
- Monitor STAR progress via
Log.progress.outfor expected throughput
Compute Bottleneck Detection
- Monitor CPU utilization via cloud metrics console
- If CPU utilization exceeds 80% sustained, note instance type and core count
- Check for CPU steal time indicating resource contention
- Compare observed reads/hour with expected rates from benchmarks
Memory Constraint Identification
- Monitor memory usage and swapping behavior
- Check for memory pressure using
free -hand cloud memory metrics - Verify sufficient RAM for genome indices (approximately 10× genome size)
I/O Bottleneck Assessment
- Monitor storage I/O metrics for read throughput
- Check I/O wait statistics using
iostat -x 1 - Identify storage latency impacting genome loading and read processing
Application-Level Performance Check
- Parse
Log.progress.outfor mapping rate anomalies - Check for increasing multimapping rates indicating potential alignment issues
- Monitor for decreasing throughput over time suggesting resource exhaustion
- Parse
Cost-Performance Correlation
- Correlate performance metrics with cost accumulation
- Identify inefficient resource utilization increasing costs
- Evaluate spot instance interruptions impacting job completion
Interpretation: True bottlenecks are identified when a specific resource is fully utilized while other resources have significant remaining capacity, and when addressing this constraint yields measurable improvements in throughput or cost efficiency.
Optimization Strategies for Common Bottlenecks
Computational and Memory Optimizations
Protocol 2: Compute and Memory Bottleneck Resolution
Principle: Strategic resource allocation and configuration tuning to alleviate computational constraints.
Materials:
- Cloud environment with scalable instance options
- STAR version 2.4.1a or later
- Reference genome indices
- RNA-seq FASTQ files
Procedure:
- Instance Selection Optimization
- Test multiple instance types (compute-optimized, memory-optimized)
- Balance vCPU count with memory bandwidth requirements
- Evaluate spot instances for cost-sensitive non-production work [5]
STAR Parameter Tuning
- Adjust
--runThreadNto match physical cores (not hyper-threads) - Optimize
--genomeLoadbased on available memory - Implement
--limitOutSJcollapsedto manage junction output
- Adjust
Early Stopping Implementation
- Configure STAR to terminate when primary alignment metrics stabilize
- Monitor for consistent mapping rates across read subsets
- Implement checkpointing for very large jobs [5]
Memory Management
- Preload genome indices when running multiple alignment jobs
- Monitor memory fragmentation with repeated jobs
- Implement job sequencing to maintain hot caches
Troubleshooting:
- If alignment speed decreases with increasing threads, reduce
--runThreadNto minimize threading overhead - If memory errors occur, verify genome index compatibility and increase instance memory
- For inconsistent performance across replicates, implement standardized instance configurations
Storage and I/O Optimizations
Protocol 3: Storage Bottleneck Mitigation
Principle: Optimization of data access patterns and storage configuration to maximize I/O throughput.
Materials:
- High-throughput cloud storage (block or object storage)
- Appropriate storage interfaces (NVMe for block storage)
- Data compression utilities
- Network configuration access
Procedure:
- Storage Tier Selection
- Select provisioned IOPS storage for consistent performance
- Implement storage tiering for input, working, and output data
- Utilize local ephemeral storage for temporary files when available
Data Access Pattern Optimization
- Stage input data in optimal storage locations before job initiation
- Implement parallel read strategies for multi-sample processing
- Compress input FASTQ files and use
--readFilesCommand zcatfor direct reading [62]
File System Tuning
- Select appropriate file system (ext4, xfs) based on access patterns
- Tune mount options for sequential read performance
- Implement read-ahead caching for sequential access patterns
Network Optimization
- Co-locate compute and storage resources in same availability zone
- Utilize enhanced networking capabilities when available
- Monitor network throughput and latency during data transfer
Troubleshooting:
- If I/O wait times exceed 10%, upgrade storage performance tier
- For slow genome loading, implement genome caching strategies
- If data transfer bottlenecks occur, implement compression or increase network capacity
Visualization of Monitoring Workflow
Bottleneck Identification Decision Framework
Cloud STAR Monitoring Architecture
Essential Research Reagent Solutions
Table 3: Key Research Reagents and Computational Resources for Cloud STAR Implementation
| Resource Category | Specific Solutions | Function in Workflow | Implementation Notes |
|---|---|---|---|
| STAR Algorithm | STAR software (v2.4.1a+) | Core alignment engine | Compile from source for target architecture [62] |
| Reference Data | Genome indices (GRCh38) | Alignment reference | Pre-built or custom-generated with sjdbOverhang adjustment [62] |
| Cloud Instances | Memory-optimized (r5ad), Compute-optimized (c5d) | Execution environment | Instance selection critical for performance [5] |
| Storage Solutions | High-IOPS block storage, Object storage | Data repository | Tiered storage for cost-performance optimization [5] |
| Monitoring Tools | Cloud provider metrics, Custom scripts | Performance tracking | Multi-layer monitoring essential [63] |
| Cost Management | Spot instances, Auto-scaling | Budget control | 30-50% cost reduction possible [5] |
| Data Sources | ENCODE, SG-NEx datasets | Validation and testing | Real-world performance validation [9] [61] |
Effective monitoring and debugging of cloud-based STAR RNA-seq workflows requires a systematic approach to bottleneck identification across computational, storage, network, and application layers. By implementing the protocols and frameworks outlined in this Application Note, researchers can achieve the significant performance improvements demonstrated in optimization studies, including up to 23% reduction in alignment time through targeted interventions [5].
The integration of comprehensive monitoring with strategic optimization enables both performance enhancement and cost control, critical factors for large-scale transcriptomics projects in academic and pharmaceutical research environments. As cloud technologies evolve toward increased AI integration and intelligent scheduling [63] [64], these foundational monitoring principles will remain essential for maintaining efficient and cost-effective RNA-seq analysis pipelines.
Future directions in cloud-based STAR optimization will likely include increased automation of bottleneck resolution through AI-driven resource allocation and more sophisticated cost-performance tradeoff analysis, further enhancing the scalability of transcriptomics research for drug development and clinical applications.
Ensuring Biological Accuracy: Validation and Benchmarking Approaches
In cloud-based RNA sequencing (RNA-Seq) analysis, the alignment of sequence reads to a reference genome is a foundational step whose accuracy profoundly impacts all downstream results and biological interpretations. For researchers and drug development professionals, evaluating this accuracy is not a single measurement but a multi-faceted process, requiring the assessment of both sensitivity (the ability to correctly identify true alignments) and precision (the ability to avoid false alignments). In the context of a cloud-based STAR (Spliced Transcripts Alignment to a Reference) workflow, understanding these metrics is crucial for optimizing computational resources, ensuring reproducibility, and validating biomarkers or therapeutic targets. This document outlines the essential metrics, detailed protocols, and key reagents for a comprehensive evaluation of alignment accuracy, providing a critical quality control framework for modern, distributed bioinformatics research.
Core Accuracy Metrics and Quantitative Benchmarks
A robust assessment of RNA-Seq alignment involves multiple quantitative metrics that together provide a picture of data quality and alignment performance.
Foundational Data Quality Metrics
The following metrics are fundamental for initial data quality assessment and are often calculated as part of initial pipeline processing [65]:
- Mapping Rate: The percentage of total sequenced reads that successfully align to the reference genome. An unusually low mapping rate can indicate sample contamination or poor library quality [65].
- Exon Mapping Rate: The percentage of reads that map to exonic regions. This is a key indicator of library preparation success; high exon mapping rates are expected for polyA-enriched libraries, while ribodepleted libraries will yield a higher proportion of intronic reads [65].
- Residual rRNA Reads: The percentage of reads aligning to ribosomal RNA. As rRNA constitutes 80-98% of cellular RNA, a high percentage (e.g., >10%) suggests inefficient ribodepletion, meaning sequencing depth for informative transcripts is compromised [65].
- Number of Genes Detected: The count of unique genes with detectable expression. This indicates library complexity, with low numbers suggesting technical degradation or issues with the sequencing reaction itself [65].
- Duplicate Read Rate: The percentage of reads that are exact duplicates based on their start and end positions. While some duplication is expected in RNA-Seq due to highly expressed genes, a high rate can indicate low input material or PCR over-amplification artifacts [65].
Comparative Performance of Aligners
The choice of alignment tool significantly impacts the results. A systematic comparison of the popular aligner STAR and the pseudoaligner Kallisto reveals a classic trade-off between comprehensiveness and computational efficiency [66] [13]. This is particularly relevant for cloud implementations where cost is directly tied to compute and memory usage.
Table 1: Quantitative Comparison of STAR and Kallisto Performance
| Metric | STAR | Kallisto | Implication for Cloud Workflows |
|---|---|---|---|
| Genes/Transcripts Detected | Globally produces more genes and higher gene-expression values [66] | Fewer genes detected compared to STAR [66] | STAR may be preferred for discovery-focused projects where maximum sensitivity is critical. |
| Alignment Accuracy | Higher correlation with RNA-FISH validation data; better detection of known cell-type markers [66] | High accuracy for quantification of known transcripts [13] | STAR's sensitivity is beneficial for detecting novel splice variants or low-abundance transcripts. |
| Computational Speed | Baseline (slower) [66] | Up to 4x faster than STAR [66] | Kallisto offers significant cost and time savings for large-scale studies involving thousands of samples. |
| Memory Usage | Baseline (higher) [66] | Uses ~7.7x less memory than STAR [66] | Kallisto is more suitable for environments with limited memory resources, reducing cloud compute costs. |
| Best Application | Novel splice junction discovery, fusion gene detection, and maximizing sensitivity [13] | Rapid and precise gene expression quantification for differential expression analysis [13] | Choice depends on the primary research goal: discovery (STAR) vs. high-throughput quantification (Kallisto). |
Large-scale, real-world benchmarking studies, such as the multi-center Quartet project, underscore that bioinformatics choices in both experimental and computational processes are primary sources of variation in final results, especially when trying to detect subtle differential expression with clinical relevance [67].
Experimental Protocols for Metric Assessment
Protocol: Calculating Alignment Metrics with Picard Tools
A standard method for calculating fundamental alignment metrics involves using Picard Tools, which can be easily containerized and run within a cloud environment.
Purpose: To generate a standard set of alignment metrics from a BAM file, including mapping rate and read distribution across genomic features. Input: Coordinate-sorted BAM file from STAR alignment, reference genome annotation file in refFlat format. Software: Picard Tools (CollectRnaSeqMetrics module) [68].
Procedure:
- Environment Setup: Pull the latest Picard Tools Docker image in your cloud environment.
- Execute the Metric Collection: Run the
CollectRnaSeqMetricscommand, specifying the required inputs and output locations.I: Input BAM file.O: Output metrics file.REF_FLAT: Gene model annotations in refFlat format.STRAND: Library strandedness (adjust based on your library prep).RIBOSOMAL_INTERVALS: File specifying genomic coordinates of ribosomal RNA intervals [68].
Output Interpretation: The output file will contain metrics like PFBASES, PCTRIBOSOMALBASES, PCTCODINGBASES, PCTUTRBASES, and PCTINTRONIC_BASES. Review these to assess the efficiency of ribosomal RNA removal and the correctness of the alignment based on the expected distribution of reads for your library type.
Protocol: Assessing Sensitivity and Precision using Ground Truth Data
For the most rigorous accuracy assessment, comparison against a "ground truth" dataset is required. This protocol leverages spike-in controls and validated reference datasets.
Purpose: To quantitatively measure the sensitivity and precision of an alignment workflow using samples with known characteristics.
Input: RNA-seq data from reference samples (e.g., Quartet, MAQC, or GIAB/ENCODE samples like NA12878) with known variants or expression profiles [69] [67].
Software: The PanMutsRx pipeline [69] or a custom variant-calling workflow incorporating GATK and a comparator like vcfeval.
Procedure:
- Data Acquisition and Alignment: Download FASTQ files for a reference sample (e.g., NA12878 from ENCODE) and process them through your cloud-based STAR workflow to generate a BAM file [69].
- Variant Calling: Perform variant calling (SNVs and Indels) on the aligned BAM file using a sensitive caller like the GATK HaplotypeCaller, configured for RNA-seq data [69].
- Benchmarking: Compare the called variants against a high-confidence truth set (e.g., the GIAB benchmark for NA12878).
- Calculate Metrics:
- Sensitivity = TP / (TP + FN)
- Precision = TP / (TP + FP)
- (Where TP=True Positives, FN=False Negatives, FP=False Positives)
Using this method on NA12878 data, one pipeline achieved sensitivities of approximately 95% for SNVs and 80% for Indels [69], providing a concrete benchmark for performance.
The logical workflow for this comprehensive assessment, from data preparation to final metric calculation, is outlined below.
Diagram 1: A workflow for comprehensive alignment accuracy assessment, integrating standard QC and variant-based validation.
The Scientist's Toolkit: Essential Reagents and Materials
Successful execution of these accuracy assessments relies on key bioinformatics reagents and resources.
Table 2: Key Research Reagent Solutions for Accuracy Evaluation
| Item | Function / Description | Example Source / Use Case |
|---|---|---|
| Reference Materials | Provides "ground truth" for benchmarking. Cell line or synthetic RNA samples with well-characterized transcriptomes and variants. | Quartet Project [67]; MAQC samples [67]; GIAB sample NA12878 [69]. |
| Spike-in Control RNAs | Allows for absolute quantification and assessment of technical sensitivity across the dynamic range. Synthetic RNAs added at known concentrations. | ERCC (External RNA Controls Consortium) Spike-in Mix [67]. |
| Reference Genome | The sequence to which reads are aligned. Critical for accuracy; version must match annotation file. | FASTA file from GENCODE or Ensembl. |
| Gene Annotation File | Defines genomic coordinates of genes, transcripts, and exons. Used for read quantification and metrics. Must be version-matched to the reference genome. | GTF or GFF3 file from GENCODE or Ensembl. |
| Ribosomal Intervals File | A list of genomic coordinates for ribosomal RNA loci. Essential for calculating the percentage of ribosomal reads, a key QC metric. | Can be generated from the gene annotation file or obtained from public repositories [68]. |
A rigorous, multi-faceted approach to evaluating alignment sensitivity and precision is non-negotiable for robust, cloud-based RNA-seq analysis, particularly in translational drug development. By implementing the protocols outlined—leveraging both standard QC tools like Picard and ground-truth validation with reference samples—researchers can quantitatively benchmark their STAR workflows. This practice ensures that the computational infrastructure and algorithmic choices made in the cloud directly support the generation of biologically accurate and clinically actionable data.
The accurate processing of bulk RNA sequencing (RNA-seq) data is a cornerstone of modern genomics, impacting downstream analyses such as differential expression and pathway analysis [13]. The choice of computational method for alignment and quantification is pivotal, with traditional aligners like STAR (Spliced Transcripts Alignment to a Reference) and modern pseudoaligners such as Kallisto and Salmon representing fundamentally different approaches [13] [70]. This article provides a comparative analysis of these tools, framed within the context of implementing optimized, cloud-native RNA-seq workflows. STAR employs traditional alignment to map reads precisely to a reference genome, enabling the discovery of novel splicing events [13] [10]. In contrast, pseudoaligners bypass full base-by-base alignment, determining the likelihood that reads originated from specific transcripts to achieve orders-of-magnitude faster quantification [70] [71]. The selection between them involves balancing considerations of accuracy, computational resource consumption, and the specific biological questions being addressed, all of which are critical for efficient cloud-based implementation [13] [10].
Fundamental Differences in Algorithmic Approaches
The core distinction between these tools lies in their underlying algorithms and the primary data they use for quantification.
STAR: Alignment-Based Genome Mapping
STAR operates through a sequential, alignment-based workflow. It maps RNA-seq reads directly to a reference genome, a process that involves identifying splice junctions and producing sequence alignment map (SAM/BAM) files as a primary output [4] [10]. This method requires a precomputed genome index, generated from a reference genome sequence and its corresponding annotation file (GTF/GFF). The alignment process itself is resource-intensive, often requiring tens of gigabytes of RAM and high-throughput disk systems to scale efficiently with multiple threads [10]. A significant advantage of this approach is its ability to identify and characterize novel genomic features, such as previously unannotated splice junctions and fusion genes, providing a more complete view of the transcriptome [13].
Kallisto and Salmon: Pseudoalignment for Transcript Quantification
Kallisto and Salmon belong to the class of "pseudoaligners" or "lightweight" quantifiers. They fundamentally shift the strategy from "where does this read map?" to "which transcripts could have generated this read?" [70]. This is achieved without producing costly base-level alignments.
- Kallisto utilizes a pseudoalignment algorithm based on the transcriptome de Bruijn graph (T-DBG). It efficiently determines transcript-read compatibility using k-mers, grouping reads into equivalence classes that share the same set of compatible transcripts. This streamlined model allows for extremely fast processing [70].
- Salmon employs a similar philosophy but uses a technique called quasi-mapping and incorporates a dual-phase parallel inference algorithm. A key differentiator for Salmon is its rich, sample-specific bias models that can correct for sequence-specific bias, fragment GC content bias, and positional biases, which can improve the accuracy of abundance estimates [71].
The following diagram illustrates the core algorithmic divergence between these two approaches.
Performance Benchmarking and Quantitative Comparison
Independent, systematic evaluations provide critical insights into the performance of these tools. A comprehensive benchmark study comparing multiple RNA-seq procedures evaluated pipelines involving STAR and pseudoaligners for raw gene expression quantification (RGEQ) [72]. Furthermore, a 2017 study specifically focused on isoform quantification accuracy offers detailed performance metrics across several tools [73].
Table 1: Performance Comparison of STAR, Kallisto, and Salmon
| Metric | STAR | Kallisto | Salmon | Notes |
|---|---|---|---|---|
| Speed | Slower (hours) [10] | Very Fast (minutes) [70] | Very Fast (minutes) [71] | Speed measured for 20-30 million reads. |
| Memory Usage | High (≥32 GB for human) [4] [10] | Low (~8 GB) [70] | Low [71] | STAR's memory use is a key constraint. |
| Accuracy (vs. RSEM sim) | - | MARDS: ~0.28 [73] | MARDS: ~0.27 [73] | Lower MARDS (Mean Absolute Relative Difference) is better. |
| Correlation (vs. Cufflinks) | - | R: 0.941 [70] | R: 0.939 [70] | High correlation indicates agreement with other methods. |
| False Positive Rate | - | Medium [73] | Lowest [71] [73] | Salmon shows improved FPR in DE analysis. |
| Key Differentiator | Discovers novel junctions/genes [13] | Speed and simplicity [70] | GC-bias correction & high accuracy [71] |
The data reveals a classic trade-off. STAR's alignment-based approach is more computationally demanding. Kallisto and Salmon deliver remarkable speed, with Salmon often holding a slight edge in accuracy and reliability, particularly in differential expression studies, due to its sophisticated bias modeling [71] [73]. For standard quantification tasks in a well-annotated transcriptome, pseudoaligners are highly performant.
Application Notes and Cloud-Based Protocol Implementation
The choice between these tools is not merely technical but is guided by the experimental design, biological questions, and computational infrastructure, especially in a cloud environment optimized for cost and efficiency.
Decision Framework: When to Use Which Tool?
The optimal tool selection depends on the research objectives and data characteristics [13].
Use STAR when:
- The primary goal is novel splice junction discovery, fusion gene detection, or working with an incomplete transcriptome [13] [10].
- The experimental data utilizes longer read lengths, which can improve alignment accuracy for novel junctions [13].
- There are sufficient computational resources (memory, CPU, and budget in the cloud) available [10].
Use Kallisto or Salmon when:
- The research question requires fast and accurate transcript quantification for differential expression analysis in a well-annotated organism [13] [70].
- Computational resources are limited, or processing large-scale datasets (e.g., thousands of samples) where speed and cost are critical [13] [10].
- Working with data of lower sequencing depth, where pseudoaligners are less sensitive to depth than alignment-based methods [13].
Cloud-Optimized STAR Workflow Protocol
Implementing STAR in the cloud requires careful architecture to manage its resource intensity. The following protocol, based on optimized cloud implementations, outlines a cost-effective and scalable approach [10] [7].
Objective: Align paired-end RNA-seq reads from multiple samples to a reference genome using STAR on Google Cloud Platform (GCP) or AWS.
Table 2: Research Reagent Solutions for Cloud RNA-seq
| Resource Type | Specific Example / Instance | Function in Workflow |
|---|---|---|
| Reference Genome | GENCODE (e.g., v36 for human) [4] | Standardized, high-quality gene annotation for alignment/quantification. |
| Container Image | Custom Docker image (e.g., from GitLab) [4] | Ensures reproducibility by packaging all software dependencies (STAR, samtools). |
| Cloud Compute Instance | AWS: c5.4xlarge (16 vCPUs, 32GB RAM) [10] | Balanced compute and memory for efficient STAR alignment. |
| Cloud Batch Service | Google Batch [7] or AWS Batch [10] | Fully managed service to schedule, queue, and execute batch jobs. |
| Job Scheduler / Wrapper | dsub [4] or Nextflow [7] |
Simplifies distributing and managing workloads across cloud compute nodes. |
Step-by-Step Protocol:
Preliminary Setup & Data Storage:
Genome Index Generation (Pre-processing):
- STAR requires a genome index. This is a one-time, resource-intensive step.
- Use a job scheduler like
dsubto launch a high-memory instance (e.g.,--min-ram 48 --min-cores 8). - Execute the STAR genomeGenerate command, specifying the FASTA and GTF files and an output directory for the index [4].
- Once generated, store the index in the cloud bucket for reuse across all samples.
Parallel Sample Alignment:
- The alignment of each sample is an independent task and can be parallelized.
- Create a tab-separated file (TSV) listing the input and output paths for all samples [4].
- Use the job scheduler (e.g.,
dsubwith the--tasksflag) to launch an array of alignment jobs, each on a worker instance with sufficient resources (e.g.,--min-ram 32 --min-cores 4). - The STAR alignment command in each worker will read the FASTQ files, use the pre-generated genome index, and output a BAM file to the specified location [4].
Cost-Saving Measures:
- Spot/Preemptible Instances: Use preemptible VMs on GCP or spot instances on AWS for a significant cost reduction (60-80% cheaper). This is viable for the alignment step, as the workflow can restart failed jobs [4] [10].
- Early Stopping: Research indicates that implementing an "early stopping" optimization during alignment, which halts processing if a sample fails quality checks, can reduce total alignment time by up to 23% [10].
The workflow for this scalable, cloud-native architecture is depicted below.
Protocol for Kallisto/Salmon Quantification
The protocol for pseudoaligners is simpler and more cost-effective due to their lower resource profile.
Objective: Quantify transcript abundance from paired-end RNA-seq reads using Kallisto or Salmon on the cloud.
Step-by-Step Protocol:
Transcriptome Indexing:
- Build an index from a transcriptome FASTA file (derived from the reference genome and annotation). This is a fast process with low memory requirements.
- Example for Kallisto:
kallisto index -i [index_name] [transcriptome.fa][70].
Quantification:
- Run the quantification command for each sample. This can be trivially parallelized for hundreds of samples.
- Example for Salmon:
salmon quant -i [index] -l ISR -1 [sample_R1.fastq] -2 [sample_R2.fastq] -o [output_dir][70] [71]. - The
-l ISRflag specifies the library type (stranded, reverse for Illumina), which is crucial for accuracy.
Downstream Analysis:
- The primary output is a file containing estimated counts and TPM (Transcripts Per Million) for each transcript.
- For differential expression analysis, the output from Kallisto can be directly imported into the
sleuthR package for interactive analysis [70]. Output from Salmon can be prepared forsleuthusing thewasabiR library [70].
STAR and pseudoaligners like Salmon and Kallisto represent complementary tools in the transcriptomics toolkit. STAR remains indispensable for exploratory studies aiming to discover novel transcriptomic features, despite its higher computational cost. Salmon and Kallisto are superior for high-throughput quantification studies where speed, cost-efficiency, and accuracy in defined transcriptomes are paramount. For cloud-based implementations, the choice dictates the architecture: STAR requires optimized, parallel workflows with robust job management to contain costs, while pseudoaligners enable extremely scalable and cost-effective processing. The decision framework and detailed protocols provided here will empower researchers and drug development professionals to make informed choices, ensuring robust and efficient analysis of their RNA-seq data.
The implementation of cloud-based STAR RNA-seq workflows has significantly enhanced our capacity to perform high-throughput transcriptome profiling, generating vast datasets of differentially expressed genes (DEGs). However, the computational nature of RNA-seq analysis introduces potential technical artifacts and biases that necessitate experimental confirmation. Integrating quantitative reverse transcription PCR (qRT-PCR) provides an essential orthogonal method for validating RNA-seq findings, ensuring the biological reliability and reproducibility of conclusions drawn from sequencing data. This verification step is particularly crucial in drug development pipelines, where decisions based on transcriptional biomarkers require the highest level of confidence. This protocol outlines a comprehensive framework for designing and executing qRT-PCR validation studies that confirm RNA-seq results generated through cloud-based STAR alignment workflows, thereby bridging computational findings with experimental confirmation.
RNA-seq Data Analysis for Target Selection
Preprocessing and Differential Expression Analysis
The validation pipeline begins with rigorous RNA-seq data analysis to identify candidate genes for qRT-PCR confirmation. The initial quality control (QC) step is paramount for detecting technical artifacts such as adapter contamination, unusual base composition, or duplicated reads using tools like FastQC or multiQC [74]. Following QC, read trimming removes low-quality sequences and adapter remnants using tools such as Trimmomatic or Cutadapt [74]. For cloud-based implementations, the STAR aligner provides ultrafast, accurate mapping of reads to the reference genome, leveraging sequential maximum mappable seed search in uncompressed suffix arrays followed by seed clustering and stitching procedures [9] [74]. Post-alignment QC eliminates poorly aligned or multimapping reads using SAMtools or Picard, preventing artificially inflated read counts that could distort expression comparisons [74].
Differential expression analysis typically employs statistical models implemented in tools such as DESeq2 or edgeR, which use negative binomial distributions to account for biological variability and overdispersion in read counts [74]. The resulting list of DEGs, ranked by statistical significance and fold-change, serves as the primary source for selecting validation targets.
Selection of Candidate Genes for Validation
Strategic selection of candidate genes is critical for meaningful validation. The process should encompass:
- Differentially Expressed Genes: Prioritize genes with high statistical significance (adjusted p-value < 0.05) and substantial fold changes (typically > 2) [75].
- Genes of Biological Interest: Include targets relevant to the pathway or phenotype under investigation, even with moderate significance.
- Reference Gene Identification: Utilize computational tools such as Gene Selector for Validation (GSV) to identify stably expressed reference genes directly from the RNA-seq dataset itself [76]. GSV applies filters based on TPM values to select genes with low variability across samples and sufficient expression levels for reliable RT-qPCR detection, moving beyond traditional housekeeping genes which may vary under experimental conditions [76].
Table 1: Selection Criteria for qRT-PCR Validation Candidates
| Category | Selection Criteria | Rationale |
|---|---|---|
| Strong DEGs | Adjusted p-value < 0.05, log2FC > 1 | Confirm technical reproducibility of primary findings |
| Pathway Representatives | Key players in relevant biological pathways | Verify biological context and mechanism |
| Reference Genes | Low variability (CV < 0.2), moderate to high expression | Ensure accurate normalization across samples |
Experimental Design for qRT-PCR Validation
Sample Considerations and Replication
The reliability of qRT-PCR validation depends heavily on appropriate experimental design. Use the same RNA samples originally sequenced for RNA-seq to control for biological variability [75]. If unavailable, prepare new biological replicates under identical conditions to the original experiment. Include at least three biological replicates per condition to adequately capture biological variability and enable statistical analysis [74]. Each biological replicate should be assayed with three technical replicates to account for procedural variability in the qRT-PCR process [75].
Controls and Reference Genes
Incorporate both positive and negative controls to monitor assay performance. For reference genes, select at least two optimally stable candidates identified through RNA-seq data analysis [76]. Avoid relying solely on traditional housekeeping genes (e.g., ACTB, GAPDH) without verifying their stability, as these may vary under experimental conditions [76]. The stability of reference genes can be confirmed using algorithms such as GeNorm or NormFinder after data collection [76].
Materials and Reagents
Table 2: Essential Research Reagent Solutions for qRT-PCR Validation
| Reagent/Solution | Function | Example Product |
|---|---|---|
| RNA Isolation Kit | Extracts high-quality total RNA from biological samples | AllPrep DNA/RNA Mini Kit [77] |
| Reverse Transcription Kit | Synthesizes first-strand cDNA from RNA templates | RevertAid First Strand cDNA Synthesis Kit [75] |
| qPCR Master Mix | Provides reaction components for amplification and detection | ChamQ Universal SYBR qPCR Master Mix [75] |
| Sequence-Specific Primers | Amplifies target sequences with high specificity | Custom-designed primers [75] |
| Nuclease-Free Water | Serves as diluent without degrading RNA/DNA | Molecular biology grade water |
Detailed qRT-PCR Protocol
cDNA Synthesis
Initiate the validation protocol with cDNA synthesis using the original RNA samples from the RNA-seq experiment [75]. For each sample:
- Quantify and Quality-Check RNA: Measure RNA concentration and purity using spectrophotometry (NanoDrop) and assess integrity (RIN > 7) with a TapeStation system [77] [78].
- Reverse Transcription Reaction: Use 100-1000 ng of total RNA as template for first-strand cDNA synthesis according to the manufacturer's protocol for your selected reverse transcription kit [75].
- Dilute and Store cDNA: Dilute the synthesized cDNA with nuclease-free water to a standardized concentration and store at -20°C until use.
Primer Design and Validation
Careful primer design is essential for specific and efficient amplification:
- Design primers to span exon-exon junctions where possible to minimize genomic DNA amplification.
- Ensure amplicon lengths between 80-150 bp for optimal amplification efficiency.
- Verify primer specificity using BLAST or similar tools against the reference genome.
- Test primer pairs for efficiency using standard curves with serial dilutions of cDNA, accepting only primers with 90-110% efficiency.
Table 3: qRT-PCR Reaction Components
| Component | Volume | Final Concentration |
|---|---|---|
| SYBR Green Master Mix (2X) | 5.0 µL | 1X |
| Forward Primer (10 µM) | 0.3 µL | 0.3 µM |
| Reverse Primer (10 µM) | 0.3 µL | 0.3 µM |
| cDNA Template | 1.0 µL | Varies |
| Nuclease-Free Water | 3.4 µL | - |
| Total Volume | 10.0 µL | - |
qRT-PCR Run Conditions
Program the thermal cycler with the following parameters:
- Initial Denaturation: 95°C for 30 seconds
- Amplification (40 cycles):
- Denaturation: 95°C for 5-10 seconds
- Annealing/Extension: 60°C for 30 seconds (with fluorescence acquisition)
- Melt Curve Analysis: 65°C to 95°C, increment 0.5°C for 5 seconds each
Data Analysis and Interpretation
Expression Quantification and Normalization
Calculate the relative expression of target genes using the 2-ΔΔCT method [75]:
- Calculate ΔCT: For each sample, subtract the CT value of the reference gene from the CT value of the target gene (ΔCT = CTtarget - CTreference).
- Calculate ΔΔCT: Subtract the ΔCT of the control group from the ΔCT of the experimental group (ΔΔCT = ΔCTexperimental - ΔCTcontrol).
- Calculate Relative Expression: Compute the relative expression as 2-ΔΔCT.
Correlation with RNA-seq Data
Assess the concordance between qRT-PCR and RNA-seq results by:
- Calculating Pearson or Spearman correlation coefficients between qRT-PCR fold-changes and RNA-seq fold-changes.
- Expect strong positive correlation (typically R > 0.80) for validated genes.
- Investigating discrepancies that may reveal technical artifacts or biological insights.
Workflow Visualization
qRT-PCR Validation Workflow
Troubleshooting and Quality Control
Implement comprehensive quality control measures throughout the validation process:
- Melt Curve Analysis: Confirm single amplification products for each primer pair through distinct, single peaks in melt curves.
- Efficiency Validation: Accept only primer sets with 90-110% amplification efficiency.
- Negative Controls: Include no-template controls (NTC) to detect contamination and no-reverse transcription controls to assess genomic DNA contamination.
- Interplate Calibration: Use interplate calibrators when running large experiments across multiple plates.
Integrating qRT-PCR validation into cloud-based STAR RNA-seq workflows provides an essential bridge between computational findings and biological confirmation. This protocol outlines a comprehensive approach from computational target selection through experimental verification and data correlation. The strategic selection of validation candidates, careful experimental design, and rigorous analytical methods detailed herein will enable researchers and drug development professionals to confidently confirm their transcriptomic findings, ensuring that conclusions drawn from RNA-seq data are both statistically sound and biologically relevant.
The implementation of cloud-based RNA-sequencing (RNA-seq) workflows, particularly those utilizing the STAR (Spliced Transcripts Alignment to a Reference) aligner, has standardized transcriptome analysis for human data. However, a critical challenge emerges when applying these workflows to other species. Research indicates that analysis tools and parameters optimized for human data do not always translate effectively to other organisms, potentially compromising the accuracy and biological relevance of results [41]. The foundational principles of RNA-seq remain consistent across species, but key biological differences—such as genome size, intron-exon structure, GC content, and the presence of species-specific sequences—demand a tailored approach to parameter configuration. This article details the essential species-specific considerations and experimental protocols for optimizing a cloud-based STAR RNA-seq workflow, ensuring precise and biologically meaningful results across diverse organisms.
The Critical Need for Species-Specific Optimization
Default parameters in most RNA-seq software, including STAR, are often calibrated for mammalian genomes [41] [54]. Applying these defaults indiscriminately to data from other species can introduce significant inaccuracies.
A comprehensive 2024 study systematically evaluated 288 distinct RNA-seq analysis pipelines applied to data from plants, animals, and fungi [41]. The findings demonstrated "that different analytical tools demonstrate some variations in performance when applied to different species." Furthermore, the research concluded that "in comparison to the default software parameter configurations, the analysis combination results after tuning can provide more accurate biological insights" [41]. This underscores that careful, species-informed tool and parameter selection is not merely a minor adjustment but is fundamental to achieving high-quality results.
In mixed-species experiments, such as xenograft models or co-culture systems, the risk of misalignment is pronounced. One study reported that even with a mixed human-mouse genome reference, a small but non-negligible fraction of reads (0.15-0.78%) were misassigned to the incorrect species' genome [79]. For individual genes with high sequence similarity, the proportion of misaligned reads can be dramatically higher, in some cases exceeding 65% [79]. This highlights the necessity of optimized separation strategies.
Optimizing Key Workflow Parameters for Non-Human Species
Read Alignment with STAR
The STAR aligner is highly sensitive to the genomic context. The following parameters are particularly crucial to adjust for non-human data.
--alignIntronMinand--alignIntronMax: These parameters define the minimum and maximum intron sizes. The authors of STAR explicitly note that "STAR's default parameters are optimized for mammalian genomes. Other species may require significant modifications of some alignment parameters; in particular, the maximum and minimum intron sizes have to be reduced for organisms with smaller introns" [54]. For example, fungal or insect genomes typically have much smaller introns than mammals.--sjdbOverhang: This parameter should be set to the length of the sequencing read minus 1. This is critical for constructing accurate splice junction databases [54] [62]. For reads of varying length, the ideal value ismax(ReadLength)-1[54].--outFilterScoreMinOverLreadand--outFilterMatchNminOverLread: These alignment score filters are normalized by read length, making them adaptable to different sequencing designs. Adjusting these can improve mapping accuracy for species with more divergent genomes or higher polymorphism rates.- Two-Pass Mapping: For species with less comprehensive genome annotations, the 2-pass mapping method is recommended. This involves a first mapping pass to discover novel splice junctions, which are then fed into the genome index for a second, more accurate mapping round [62]. This is especially valuable for discovering species-specific splicing events.
Table 1: Key STAR Parameters for Species-Specific Optimization
| Parameter | Typical Default (Mammalian) | Consideration for Other Species | Recommended Action |
|---|---|---|---|
--alignIntronMin |
21 | Fungi, plants, and insects have shorter introns. | Research species-specific intron sizes and reduce accordingly. |
--alignIntronMax |
0 (unlimited) | Can lead to spurious long-range alignments in compact genomes. | Set to a value slightly above the known maximum intron size. |
--sjdbOverhang |
100 | Directly tied to read length. | Set to max(ReadLength)-1 for your dataset [54]. |
--outFilterMismatchNmax |
10 | Higher polymorphism in some plant or wild species. | Consider increasing slightly to improve mappability. |
Two-Pass Mode (--twopassMode) |
Not activated | Crucial for novel junction discovery in poorly annotated genomes. | Enable Basic for non-model organisms. |
Read Trimming and Quality Control
The trimming step, while foundational, can also be fine-tuned. A 2024 study compared tools like fastp and Trim_Galore and found that fastp significantly enhanced the quality of processed data. The study also highlighted that the specific trimming parameters (e.g., the number of bases to trim) should be determined based on the quality control report of the original data rather than using a fixed numerical value across all species and datasets [41].
Experimental Design and Validation
For mixed-species RNA-seq data, alignment-dependent methods that use a pooled reference genome followed by optimal separation of reads have been shown to be highly effective, achieving over 97% accuracy in classifying reads by species [79]. This method involves aligning reads to a combined human-mouse (or other species) reference genome and then using the "primary alignment" flag in the resulting SAM/BAM files to correctly assign each read to its species of origin before final quantification.
A Protocol for Species-Specific Workflow Implementation
The following protocol provides a step-by-step guide for optimizing a cloud-based STAR RNA-seq workflow for a non-human or mixed-species study.
Pre-Analysis: Genome Preparation and Indexing
- Acquire Reference Files: Download the latest reference genome (FASTA) and annotation (GTF) for your target species from a trusted source (e.g., Ensembl, NCBI).
- Determine Genomic Characteristics: Research key genomic features of your species, particularly the minimum, maximum, and average intron sizes. This information is often available in genome database publications or can be computed from the GTF file.
- Generate the STAR Genome Index: Create the genome index using the
genomeGeneratemode, incorporating the species-specific parameters you have identified [54] [62]. Note: The--genomeSAindexNbasesparameter should be reduced for very small genomes (e.g., bacteria, some fungi) according to the formulamin(14, log2(GenomeLength)/2 - 1).
Mapping and Quantification
- Initial Mapping Run: Perform an initial alignment using the custom index and key parameters.
- Inspect Alignment Metrics: Carefully review the
Log.final.outfile. Pay close attention to the mapping rate, the percentage of reads mapped to multiple loci, and the number of novel splice junctions discovered. Unusually high multi-mapping rates or low unique mapping rates may indicate the need for further parameter adjustment. - Quantification: Use a tool like
featureCountsorHTSeqto generate read counts per gene, using the same, high-quality annotation file used for indexing.
Validation and Iteration
- Benchmark with Positive Controls: If available, use a set of known, constitutively expressed genes for the species as a benchmark to assess the technical performance of the pipeline [72].
- Biological Validation: Where possible, validate key findings using an orthogonal method, such as qRT-PCR for differential expression. A 2020 study emphasized the importance of using a carefully selected set of stable reference genes for qRT-PCR normalization, as commonly used genes like GAPDH and ACTB can show expression bias under certain conditions [72].
- Iterate: Use the insights from the alignment metrics and biological validation to fine-tune parameters and re-run the analysis if necessary.
The Scientist's Toolkit: Research Reagent Solutions
Table 2: Essential Reagents and Tools for Optimized RNA-seq Analysis
| Item | Function/Description | Example Tools / Sources |
|---|---|---|
| Reference Genome & Annotation | Essential for alignment and quantification. Quality and completeness are critical. | Ensembl, NCBI Genome, species-specific databases. |
| Quality Control Tools | Assesses raw read quality and confirms the effectiveness of trimming. | FastQC, fastp, Trim Galore [41] [40]. |
| Trimming Tools | Removes adapter sequences and low-quality bases. | fastp, Cutadapt, Trimmomatic [41] [72]. |
| Splice-Aware Aligner | Maps RNA-seq reads to the reference genome, accounting for introns. | STAR, HISAT2 [54] [62]. |
| Quantification Software | Counts the number of reads assigned to each genomic feature. | featureCounts, HTSeq, Kallisto [72] [40]. |
| Differential Expression Tools | Identifies statistically significant changes in gene expression. | DESeq2, edgeR, Cuffdiff2 [72] [31]. |
Workflow Visualization
The following diagram illustrates the logical workflow for implementing a species-optimized RNA-seq analysis.
Figure 1: A workflow for species-specific RNA-seq optimization, highlighting the iterative feedback loop for parameter tuning.
The move towards cloud-based, standardized RNA-seq workflows offers tremendous benefits in reproducibility and scalability. However, to fully realize these benefits in diverse biological research contexts, a one-size-fits-all approach is insufficient. By understanding and implementing the species-specific considerations outlined here—particularly the adjustment of key STAR parameters like intron size limits and the use of two-pass mapping for novel transcript discovery—researchers can significantly enhance the accuracy and biological insight gained from their transcriptomic studies. The presented protocol and toolkit provide a concrete roadmap for optimizing a cloud-based STAR RNA-seq workflow, ensuring that research on non-human species, from plant pathogens to animal models, is built upon a robust and reliable computational foundation.
The implementation of FAIR Data Principles—Findability, Accessibility, Interoperability, and Reusability—has become a critical foundation for advancing scientific reproducibility in transcriptomics research. Next-generation RNA sequencing (RNA-seq) workflows generate complex, multi-dimensional datasets that present significant challenges for reproducible analysis. Within the context of cloud-based STAR RNA-seq workflow implementation, FAIR principles provide a structured framework for ensuring that computational analyses can be independently verified, validated, and extended by other researchers. The spliced transcripts alignment to a reference (STAR) tool has emerged as a cornerstone of RNA-seq analysis pipelines due to its unique alignment algorithm that uses sequential maximum mappable seed search in uncompressed suffix arrays followed by seed clustering and stitching procedures [9]. This technical approach enables ultra-rapid alignment of RNA-seq reads while maintaining high sensitivity and precision, making it particularly valuable for large-scale consortia efforts such as ENCODE that generate billions of sequencing reads [9].
The migration of RNA-seq analysis workflows to cloud computing environments has created unprecedented opportunities for implementing robust reproducibility frameworks. Cloud platforms provide the computational scalability necessary for processing large RNA-seq datasets while offering specialized tools for version control, containerization, and workflow management that directly support FAIR principles. For researchers working with STAR aligner specifically, cloud implementation enables the management of memory-intensive alignment operations through scalable resources, addressing STAR's requirement for significant memory usage that traditionally limited its accessibility [9]. Furthermore, cloud-based solutions facilitate the standardization of analysis parameters across research teams, ensuring that STAR's two-step process of genome index generation and read alignment [54] is performed consistently regardless of local computational resources or expertise.
Implementing FAIR Principles in STAR RNA-Seq Workflows
Findability and Accessibility Framework
Findability represents the foundational layer of the FAIR principles, ensuring that research data and analytical workflows are properly identified through persistent metadata descriptors. For cloud-based STAR RNA-seq implementations, this requires systematic annotation of all workflow components using domain-specific metadata standards. The Genomics Standards Consortium specifications and MINSEQE (Minimum Information about a High-Throughput Nucleotide SeQuencing Experiment) guidelines provide the essential framework for describing experimental conditions, library preparation protocols, and sequencing parameters. Each dataset processed through the STAR aligner should be annotated with critical parameters including read length, sequencing depth, strandedness information, and reference genome build to enable precise replication of analytical conditions [44].
Accessibility in cloud environments is achieved through implementation of standardized data retrieval protocols and persistent identifier systems. Cloud-based RNA-seq platforms such as BestopCloud exemplify this principle by providing unrestricted web browser access to analytical capabilities while maintaining detailed metadata records [80]. These platforms typically implement RESTful APIs that enable both human and machine-readable access to processed data, with authentication and authorization protocols that balance open science principles with appropriate data protection. For STAR-specific workflows, accessibility also encompasses providing pre-computed genome indices for commonly used reference genomes, which substantially reduces the computational burden for researchers and ensures consistency across analyses [54]. The implementation of persistent data repositories with guaranteed retention policies ensures that RNA-seq data aligned with STAR remains accessible beyond the typical research project lifecycle.
Table 1: Essential Metadata for FAIR-Compliant STAR RNA-Seq Experiments
| Metadata Category | Specific Elements | FAIR Principle | Implementation Example |
|---|---|---|---|
| Experimental Design | Sample source, experimental conditions, replicates | Findability | MINSEQE guidelines |
| Sequencing Protocol | Platform, read type (single/paired-end), read length | Findability, Reusability | SRA submission metadata |
| Reference Materials | Genome assembly version, annotation source | Interoperability | ENSEMBL, Gencode identifiers |
| Alignment Parameters | STAR version, --sjdbOverhang, --genomeSAsparseD | Reusability | Snakemake/Nextflow workflow parameters |
| Data Access | Repository URL, access restrictions, license | Accessibility | GEO/SRA accession numbers |
Interoperability and Reusability Implementation
Interoperability requires that STAR RNA-seq workflows utilize formal, accessible, and shared languages and standards to enable data exchange and integration across diverse analytical platforms. The adoption of community-standard file formats at each processing stage is fundamental to achieving this principle. For STAR aligner outputs, the generation of BAM files sorted by coordinate with comprehensive read groups ensures compatibility with downstream analytical tools [54]. Additionally, the use of Common Workflow Language (CWL) or Workflow Description Language (WDL) for defining STAR alignment parameters enables seamless execution across different cloud environments and computing platforms. Interoperability is further enhanced through implementation of ontologies such as the Sequence Ontology and Gene Ontology for consistent functional annotation of aligned features, which facilitates cross-study integration and meta-analysis.
Reusability represents the most complex dimension of FAIR implementation, requiring that RNA-seq datasets and analytical workflows are sufficiently well-described to enable replication and recombination by independent researchers. For cloud-based STAR implementations, this is achieved through containerization technologies such as Docker or Singularity that capture the complete software environment, including specific STAR versions and dependencies. Version-controlled workflow management systems like Nextflow or Snakemake provide the mechanism for documenting and executing multi-step STAR RNA-seq analyses, with platforms such as the nf-core RNA-seq pipeline offering community-vetted implementations that integrate STAR with downstream quantification tools [44]. Critically, reusability requires comprehensive documentation of all STAR parameters that influence alignment outcomes, including --sjdbOverhang (set to read length minus 1), --outFilterType, and --outSAMtype, as these directly impact splice junction detection and read mapping accuracy [54] [9].
Table 2: STAR Alignment Parameters Critical for Reproducibility
| Parameter | Recommended Setting | Impact on Reproducibility | Cloud Implementation |
|---|---|---|---|
| --sjdbOverhang | Read length - 1 | Ensures accurate junction annotation | Automated detection from FASTQ metadata |
| --outSAMtype | BAM SortedByCoordinate | Enables downstream compatibility | Standardized output format |
| --outFilterMultimapNmax | 10 (default) | Controls multi-mapping reads | Consistent across experiments |
| --genomeSAsparseD | 2 (default) | Balances memory and accuracy | Cloud resource optimization |
| --quantMode | GeneCounts | Direct generation of count matrices | Integration with quantification tools |
Experimental Protocol: Cloud-Based STAR RNA-Seq Analysis
Computational Environment Configuration
The implementation of a reproducible, cloud-based STAR RNA-seq workflow begins with precise configuration of the computational environment. This foundation ensures that all subsequent analytical steps produce verifiable and consistent results. The following protocol outlines the containerized environment specification using Docker, which encapsulates the complete software dependencies required for STAR alignment and downstream analysis:
This container specification ensures that the complete analytical environment, including STAR version 2.7.10b and essential R packages for differential expression analysis (limma, edgeR, DESeq2), is consistently deployed across cloud computing platforms. The version-pinning of STAR is particularly critical as alignment algorithms and parameters may evolve between releases, potentially impacting mapping results and compromising reproducibility [9].
Genome Index Generation and Read Alignment
The core analytical process begins with generation of genome indices optimized for the specific experimental parameters, followed by the read alignment procedure. The protocol below details these critical steps implemented in a cloud environment:
Genome Index Generation:
This genome indexing step employs critical parameters that directly influence alignment sensitivity and accuracy. The --sjdbOverhang parameter, set to read length minus 1, specifies the length of the genomic sequence around annotated junctions that is used for constructing the splice junction database [54]. The --genomeSAsparseD parameter controls the sparsity of the suffix array, balancing memory usage against sensitivity for detecting multimapping reads [9]. Documentation of these parameters is essential for reproducibility, as variations can significantly impact junction detection and alignment rates.
Read Alignment Protocol:
The alignment phase incorporates several parameters critical for reproducibility. The --outSAMtype BAM SortedByCoordinate generates position-sorted BAM files that are compatible with downstream visualization tools and quantitative analysis pipelines. The --quantMode GeneCounts option directs STAR to output read counts per gene directly, leveraging the annotation provided during genome indexing to assign reads to genomic features [54]. This integrated approach to alignment and quantification reduces potential variability introduced by separate quantification steps while improving analytical efficiency.
Visualization of the FAIR-Compliant STAR RNA-Seq Workflow
The following diagram illustrates the complete analytical pathway for a FAIR-compliant cloud-based STAR RNA-seq workflow, highlighting critical reproducibility checkpoints and data management components:
This workflow visualization emphasizes the integration of FAIR principles at each analytical stage, from raw data processing through to publication of results. The color-coded nodes distinguish between input data (yellow), processing steps (green), output products (blue), and FAIR implementation components (red), creating a clear semantic mapping of the analytical pipeline.
Research Reagent Solutions for Reproducible RNA-Seq Experiments
The implementation of FAIR principles extends beyond computational workflows to encompass the physical reagents and reference materials that form the foundation of reproducible RNA-seq experiments. The following table details essential research reagents and their functions within the context of STAR RNA-seq workflows:
Table 3: Essential Research Reagents for Reproducible RNA-Seq Experiments
| Reagent Category | Specific Examples | Function in RNA-Seq Workflow | Quality Control Metrics |
|---|---|---|---|
| Reference RNA Standards | ERCC RNA Spike-In Mix, Universal Human Reference RNA | Normalization control, technical variance assessment | Concentration, integrity (RIN > 9.0) |
| Library Preparation Kits | Illumina Stranded mRNA Prep, NEBNext Ultra II RNA | cDNA synthesis, adapter ligation, library amplification | Library size distribution, molar concentration |
| Quality Control Reagents | Agilent RNA 6000 Nano Kit, Qubit RNA HS Assay | RNA integrity assessment, quantification | RNA Integrity Number (RIN), 260/280 ratio |
| Alignment Reference Materials | GENCODE annotations, ENSEMBL reference genomes | Genome indexing, read alignment, gene quantification | Release version, coordinate system consistency |
| Cell Line Standards | GM12878, IMR-90, H9 human embryonic stem cells | Experimental control, protocol validation | Genetic stability, passage number < 8 [81] |
The consistent application of these standardized reagents across experiments is fundamental to achieving analytical reproducibility. Specifically, well-characterized cell lines such as GM12878 (cultured B-cells) and IMR-90 (lung fibroblasts) provide biologically stable reference materials that enable meaningful cross-study comparisons when maintained under standardized culture conditions and low passage numbers [81]. RNA extraction methods utilizing guanidinium thiocyanate-based protocols ensure high purity and integrity, with minimum RNA Integrity Number (RIN) thresholds of 9.0 recommended for cell line samples to ensure optimal sequencing library quality [81].
For cloud-based STAR alignment workflows, the consistent application of reference genome builds and annotation files is particularly critical. The use of version-controlled references from authoritative sources such as GENCODE, ENSEMBL, or RefSeq ensures that alignment coordinates and gene identifiers remain consistent across analyses. Documentation of the specific genome assembly (e.g., GRCh38.p13), annotation release (e.g., GENCODE v42), and associated checksums should be embedded within the workflow metadata to guarantee complete reproducibility of alignment results.
Validation and Performance Metrics for Reproducible STAR Alignment
Quality Assessment and Benchmarking
The validation of STAR RNA-seq workflow performance requires implementation of comprehensive quality metrics that assess both technical reproducibility and biological fidelity. The following protocol outlines the key validation steps and acceptance criteria for a FAIR-compliant alignment pipeline:
Alignment Quality Metrics:
This quality assessment script extracts critical performance indicators from STAR's alignment summary, providing quantitative metrics for evaluating the success of the alignment process. Reproducible workflows should establish baseline thresholds for these metrics based on organism-specific expectations and experimental conditions, with typical values for human RNA-seq datasets ranging from 70-90% for uniquely mapped reads [9].
Computational Performance Optimization
Cloud-based implementation of STAR aligner enables scalability across datasets of varying sizes, but requires careful monitoring of computational resource utilization to maintain cost-effectiveness and reproducibility. The following table documents typical computational requirements for STAR alignment across different dataset scales:
Table 4: Computational Performance Metrics for STAR Alignment
| Dataset Scale | CPU Cores | Memory (GB) | Typical Runtime | Cloud Instance Type |
|---|---|---|---|---|
| Small (3k cells) | 6 | 32 | 26 seconds [80] | AWS c6i.2xlarge |
| Medium (10k cells) | 8 | 64 | 1-2 minutes [80] | AWS c6i.4xlarge |
| Large (20k cells) | 16 | 128 | 3.5 minutes [80] | AWS c6i.8xlarge |
| Very Large (>50k cells) | 32 | 256 | 10+ minutes | AWS c6i.16xlarge |
These performance benchmarks provide essential guidance for researchers configuring cloud resources for reproducible STAR analyses. The memory requirements in particular reflect STAR's use of uncompressed suffix arrays for rapid seed searching, which trades memory usage for significant speed advantages compared with compressed indexing approaches [9]. Documentation of these computational parameters ensures that analyses can be replicated with equivalent resources, eliminating performance-related variability in alignment outcomes.
Data Sharing and Publication Following FAIR Principles
The final phase of a reproducible STAR RNA-seq workflow involves the systematic publication and sharing of data, code, and analytical protocols to enable verification and reuse by the scientific community. The implementation of comprehensive data sharing strategies ensures maximal research impact while fulfilling the core tenets of the FAIR principles.
Data Repository Selection and Deposition: Public repositories provide specialized infrastructure for preserving and disseminating RNA-seq data in accordance with FAIR principles. The selection of appropriate repositories should be guided by domain-specific standards and funder requirements:
Gene Expression Omnibus (GEO) and Sequence Read Archive (SRA) represent the primary NIH-supported repositories for RNA-seq data, providing robust infrastructure for both raw sequencing data (FASTQ) and processed expression matrices [82]. These repositories assign persistent accession numbers that facilitate unambiguous citation and tracking of datasets.
EMBL-EBI Expression Atlas offers enhanced curation of RNA-seq datasets, categorizing experiments as "baseline" or "differential" to facilitate discovery and interpretation [82]. This resource provides additional value through cross-study integration and standardized analytical processing.
Genre-Specific Repositories including the Single Cell Portal (Broad Institute) and CZ Cell x Gene Discover (Chan Zuckerberg Initiative) provide specialized infrastructure for single-cell RNA-seq data, with built-in visualization tools and standardized data models [82].
Workflow Publication and Versioning: The publication of analytical workflows complements data sharing by providing explicit instructions for reproducing computational results. Containerized workflow management systems such as Nextflow and Snakemake enable version-controlled execution of STAR RNA-seq analyses, with platforms such as nf-core providing community-curated implementations [44]. The following code block illustrates a Nextflow configuration for a reproducible STAR workflow:
This workflow configuration exemplifies the principles of reusability and interoperability by specifying exact software versions through container images and defining computational resource requirements that ensure consistent execution across cloud environments. The publication of such workflows to platforms such as WorkflowHub or nf-core with associated DOI assignment completes the FAIR lifecycle, enabling independent verification and extension of the analytical methods.
The implementation of FAIR data principles within cloud-based STAR RNA-seq workflows represents a paradigm shift in biological computational research, transforming individual analyses into reusable, verifiable knowledge components. Through the systematic application of findability metrics, accessibility protocols, interoperability standards, and reusability frameworks, researchers can overcome the reproducibility challenges that have historically complicated transcriptomics studies. The integration of STAR's high-performance alignment algorithm with cloud computational resources creates a powerful foundation for scalable, reproducible RNA-seq analysis that maintains analytical precision while enabling transparency and verification.
As RNA-seq technologies continue to evolve, with emerging applications in single-cell sequencing, spatial transcriptomics, and direct RNA sequencing [81], the implementation of robust reproducibility frameworks will become increasingly critical. The workflow specifications, validation metrics, and sharing protocols outlined in this document provide a concrete roadmap for researchers implementing FAIR-compliant STAR RNA-seq analyses, with particular utility for drug development professionals requiring rigorous analytical standards for regulatory compliance. Through continued development of community standards and cloud-native analytical tools, the life sciences research community can fully realize the potential of FAIR principles to accelerate discovery and innovation.
Conclusion
Implementing STAR RNA-seq workflows in the cloud represents a transformative approach for modern transcriptomics, offering unprecedented scalability and cost-efficiency for large-scale studies. By combining STAR's alignment accuracy with cloud-native architectures, researchers can process terabytes of data while optimizing both performance and expenditure. The key takeaways include the critical importance of species-specific parameter tuning, the effectiveness of early stopping optimizations for reducing alignment time by over 20%, and the viability of spot instances for significant cost savings. As personalized medicine and multi-omics integration advance, these optimized cloud workflows will become increasingly essential for drug discovery and clinical applications. Future directions will likely involve deeper AI integration, improved cross-species optimization frameworks, and more sophisticated serverless implementations that further democratize large-scale transcriptomic analysis.
References
- 1. 2025 and Beyond: The Future of Genomic Data Analysis ... [https://blog.crownbio.com/2025-and-beyond-the-future-of-genomic-data-analysis-and-innovations-in-genomics-services]
- 2. Cloud Computing for Biology Research: The Essential Guide [https://bitesizebio.com/84263/cloud-computing-for-biology/]
- 3. Cloud computing in Bioinformatics: A game-changer for big ... [https://dromicslabs.com/cloud-computing-in-bioinformatics-a-game-changer-for-big-data-analysis/]
- 4. Bioinformatics on the cloud. Aligning RNAseq with STAR ... [https://medium.com/data-science/bioinformatics-on-the-cloud-144c4e7b60d1]
- 5. [2506.12611] Accelerating Cloud-Based Transcriptomics [https://arxiv.org/abs/2506.12611]
- 6. How RNA-Seq Projects Can Boost Your Biotech Career in ... [https://btgenz.in/blog/how-rna-seq-projects-can-boost-career-in-2025]
- 7. RNA-Seq and protein structure prediction on Google Cloud [https://cloud.google.com/blog/topics/healthcare-life-sciences/rna-seq-and-protein-structure-prediction-on-google-cloud/]
- 8. 0001-rnaseq-workflow-v2.0.0 - St. Jude Cloud RFCs [https://stjudecloud.github.io/rfcs/0001-rnaseq-workflow-v2.0.0.html]
- 9. STAR: ultrafast universal RNA-seq aligner - PubMed Central [https://pmc.ncbi.nlm.nih.gov/articles/PMC3530905/]
- 10. Performance Analysis and Optimization of the STAR ... [https://arxiv.org/html/2506.12611v1]
- 11. STAR [https://support.illumina.com/help/BS_App_RNASeq_Alignment_OLH_1000000006112/Content/Source/Informatics/STAR_RNAseq.htm]
- 12. Alignment and mapping methodology influence transcript ... [https://genomebiology.biomedcentral.com/articles/10.1186/s13059-020-02151-8]
- 13. Kallisto vs. STAR: Alignment and Quantification of Bulk ... [https://www.elucidata.io/blog/kallisto-vs-star-alignment-and-quantification-of-bulk-rna-seq-data]
- 14. Interoperable RNA-Seq analysis in the cloud [https://www.sciencedirect.com/science/article/abs/pii/S1874939919300501]
- 15. AWS vs Azure vs Google Cloud: The Ultimate 2025 ... [https://pilotcore.io/blog/aws-vs-azure-vs-google-cloud-comparison]
- 16. analyze public RNA sequencing data using ... [https://aws.amazon.com/blogs/architecture/genomics-workflows-part-7-analyze-public-rna-sequencing-data-using-aws-healthomics/]
- 17. AWS vs Azure vs Google Cloud [https://northflank.com/blog/aws-vs-azure-vs-google-cloud]
- 18. Sonrai reduced research timelines by 70% with ... [https://aws.amazon.com/blogs/industries/sonrai-reduced-research-timelines-by-70-with-aws-healthomics/]
- 19. RNA with UMIs Overview | WARP - Broad Institute [https://broadinstitute.github.io/warp/docs/Pipelines/RNA_with_UMIs_Pipeline/README]
- 20. Bioinformatics on the cloud part II [https://towardsdatascience.com/bioinformatics-on-the-cloud-part-ii-a99ccfea913a/]
- 21. The 2025 Bioinformatics Toolkit: From Sample Prep to AI- ... [https://blog.omni-inc.com/blog/the-2025-bioinformatics-toolkit-from-sample-prep-to-ai-driven-analysis]
- 22. Advancing Confidential Computing and cross-border ... [https://nebius.com/blog/posts/elixir-biohackathon]
- 23. Cloud Computing vs High Performance Computing (HPC) [https://resources.l-p.com/knowledge-center/cloud-computing-vs-high-performance-computing-comparison]
- 24. RSEQREP: RNA-Seq Reports, an open-source cloud- ... [https://pmc.ncbi.nlm.nih.gov/articles/PMC6039931/]
- 25. Serverless Approach to Running Resource-Intensive STAR ... [https://arxiv.org/html/2504.05078v1]
- 26. NGS-Based RNA-Sequencing Market Size 2024 - 2034 [https://www.towardshealthcare.com/insights/ngs-based-rna-sequencing-market-sizing]
- 27. When Pay Per Use Cloud Is The Most Expensive Option [https://www.totalcae.com/resources/when-pay-per-use-cloud-is-the-most-expensive-option/]
- 28. Estimate and manage your cloud costs [https://docs.cancergenomicscloud.org/docs/estimate-and-manage-your-cloud-costs]
- 29. What is the cost of bioinformatics? A look at ... [https://medium.com/truwl/what-is-the-cost-of-bioinformatics-a-look-at-bioinformatics-pricing-and-costs-1e4c1c3bcb4f]
- 30. Cloud Computing Costs in 2024 [https://www.oracle.com/cloud/cloud-computing-cost/]
- 31. RNA-Seq Analysis Pipeline, a new cloud-based NGS web ... [https://www.rna-seqblog.com/rap-rna-seq-analysis-pipeline-a-new-cloud-based-ngs-web-application/]
- 32. GitHub - mainakm7/RNAseq_ pipeline [https://github.com/mainakm7/RNAseq_pipeline]
- 33. rnaseq: Introduction [https://nf-co.re/rnaseq/3.14.0/]
- 34. Protocol for identifying differentially expressed genes using ... [https://www.sciencedirect.com/science/article/pii/S2666166724000911]
- 35. LncExpDB: Help [https://ngdc.cncb.ac.cn/lncexpdb/pipeline]
- 36. Reusable tutorials for using cloud-based computing ... [https://pmc.ncbi.nlm.nih.gov/articles/PMC11245317/]
- 37. SRA-Toolkit [https://hpc.nih.gov/apps/sratoolkit.html]
- 38. SRA Toolkit [https://www.osc.edu/resources/available_software/software_list/sra_toolkit]
- 39. Lesson 6: Downloading data from the SRA - Bioinformatics [https://bioinformatics.ccr.cancer.gov/docs/b4b/Module1_Unix_Biowulf/Lesson6/]
- 40. Transcriptomics / RNA-seq Alignment with STAR / Hands-on [https://training.galaxyproject.org/training-material/topics/transcriptomics/tutorials/rna-seq-bash-star-align/tutorial.html]
- 41. A comprehensive workflow for optimizing RNA-seq data analysis [https://bmcgenomics.biomedcentral.com/articles/10.1186/s12864-024-10414-y]
- 42. How to improve STAR alignment parameters? [https://www.lifescienceshub.ai/guides/how-to-improve-star-alignment-parameters-step-by-step-guide]
- 43. What are the best set of options to use while aligning ... [https://www.biostars.org/p/384844/]
- 44. [Tutorial] Bulk RNA-seq DE analysis [https://informatics.fas.harvard.edu/resources/tutorials/differential-expression-analysis/]
- 45. Differential expression with DEseq2 | Griffith Lab [https://genviz.org/module-04-expression/0004/02/01/DifferentialExpression/]
- 46. 7 201: RNA-seq data analysis with DESeq2 - GitHub Pages [https://bioconductor.github.io/BiocWorkshops/rna-seq-data-analysis-with-deseq2.html]
- 47. Differential Expression with DESeq2 [https://rnabio.org/module-03-expression/0003/03/03/Differential_Expression-DESeq2/]
- 48. Gene-level differential expression analysis with DESeq2 [https://hbctraining.github.io/DGE_workshop/lessons/04_DGE_DESeq2_analysis.html]
- 49. From Gene Counts to Differential Expression - DESeq2 ... [https://ashleyschwartz.com/posts/2023/05/deseq2-tutorial]
- 50. Introduction to Workflows in the Cloud 2025 [https://mdibl.org/course/workflows-in-the-cloud-2025/]
- 51. Automation of high-throughput mRNA-seq library preparation [https://www.sciencedirect.com/science/article/pii/S2472555222000077]
- 52. RNA-Seq Planning for the Future: Key Trends 2025-2033 [https://www.datainsightsmarket.com/reports/rna-seq-1981162]
- 53. RNA Day 2025: Premium RNA-seq Solutions from Your ... [https://web.novogene.com/Blog_2025_Aug_RNADay_Promotion]
- 54. Alignment with STAR | Introduction to RNA-Seq using high ... [https://hbctraining.github.io/Intro-to-rnaseq-hpc-O2/lessons/03_alignment.html]
- 55. Accelerating spliced alignment of long RNA sequencing ... [https://www.sciencedirect.com/science/article/abs/pii/S0010482524006267]
- 56. Evaluating the Effectiveness of Various Small RNA Alignment ... [https://pmc.ncbi.nlm.nih.gov/articles/PMC12195907/]
- 57. RNA-Seq workflow | Introduction to RNA-seq using high performance computing (Orchestra) - ARCHIVED [https://hbctraining.github.io/Intro-to-rnaseq-hpc-orchestra/lessons/07_rnaseq_workflow.html]
- 58. Alignment of RNA Seq data with STAR [https://research.stowers.org/cws/CompGenomics/Projects/star.html]
- 59. STAR parameters in OmicsBox [https://www.biostars.org/p/457565/]
- 60. VIPER: Visualization Pipeline for RNA-seq, a Snakemake ... [https://bmcbioinformatics.biomedcentral.com/articles/10.1186/s12859-018-2139-9]
- 61. Singapore scientists unveil one of world's largest long-read ... [https://www.rna-seqblog.com/singapore-scientists-unveil-one-of-worlds-largest-long-read-rna-sequencing-datasets-to-advance-disease-research/]
- 62. Mapping RNA-seq Reads with STAR - PMC [https://pmc.ncbi.nlm.nih.gov/articles/PMC4631051/]
- 63. Workflow Scheduling Must-Know! The Four Core Trends ... [https://medium.com/@ApacheDolphinScheduler/workflow-scheduling-must-know-the-four-core-trends-you-cant-ignore-in-2025-bf3db8df0ac6]
- 64. 2025 Cloud in Review: 6 Trends to Watch - CDInsights [https://www.clouddatainsights.com/2025-cloud-in-review-6-trends-to-watch/]
- 65. Essential RNA-seq Metrics: Part 1 [https://www.rna-seqblog.com/essential-rna-seq-metrics-part-1/]
- 66. of Evaluation and Kallisto on Single Cell STAR - RNA Data... Seq [https://pubmed.ncbi.nlm.nih.gov/32220951/]
- 67. A real-world multi-center RNA-seq benchmarking study ... [https://www.nature.com/articles/s41467-024-50420-y]
- 68. Calculation of Sequencing Alignment Metrics [https://bio-protocol.org/exchange/minidetail?id=168703&type=30]
- 69. Indel sensitive and comprehensive variant/mutation detection from... [https://bmcmedgenomics.biomedcentral.com/articles/10.1186/s12920-018-0391-5]
- 70. Salmon & kallisto: Rapid Transcript Quantification for RNA ... [https://learn.gencore.bio.nyu.edu/rna-seq-analysis/salmon-kallisto-rapid-transcript-quantification-for-rna-seq-data/]
- 71. Salmon: fast and bias-aware quantification of transcript ... [https://pmc.ncbi.nlm.nih.gov/articles/PMC5600148/]
- 72. Systematic comparison and assessment of RNA-seq ... [https://www.nature.com/articles/s41598-020-76881-x]
- 73. Evaluation and comparison of computational tools for RNA ... [https://bmcgenomics.biomedcentral.com/articles/10.1186/s12864-017-4002-1]
- 74. a practical guide to RNA sequencing data analysis [https://pmc.ncbi.nlm.nih.gov/articles/PMC12599993/]
- 75. 4.7. qRT-PCR Validation of RNA-seq Data [https://bio-protocol.org/exchange/minidetail?id=10031786&type=30]
- 76. RNA-seq validation: software for selection of reference and ... [https://bmcgenomics.biomedcentral.com/articles/10.1186/s12864-024-10511-y]
- 77. Clinical and analytical validation of a combined RNA ... [https://www.nature.com/articles/s43856-025-00934-3]
- 78. Identification and experimental validation of circular RNA ... [https://www.frontiersin.org/journals/genetics/articles/10.3389/fgene.2025.1619698/full]
- 79. OPTIMIZED SPLITTING OF MIXED-SPECIES RNA ... [https://pmc.ncbi.nlm.nih.gov/articles/PMC9081140/]
- 80. BestopCloud: an integrated one-stop solution for single- ... [https://pmc.ncbi.nlm.nih.gov/articles/PMC12512469/]
- 81. Unlocking the regulatory code of RNA - PubMed Central - NIH [https://pmc.ncbi.nlm.nih.gov/articles/PMC12551254/]
- 82. Public RNA-Seq and scRNA-Seq Databases [https://bigomics.ch/blog/ultimate-guide-to-public-rnaseq-and-sc-rna-seq-databases/]