Optimizing Histone ChIP-seq: Advanced Strategies to Boost Signal-to-Noise Ratio for Robust Epigenetic Profiling
This article provides a comprehensive guide for researchers and drug development professionals seeking to overcome the critical challenge of low signal-to-noise ratio in histone chromatin immunoprecipitation followed by sequencing (ChIP-seq).
Optimizing Histone ChIP-seq: Advanced Strategies to Boost Signal-to-Noise Ratio for Robust Epigenetic Profiling
Abstract
This article provides a comprehensive guide for researchers and drug development professionals seeking to overcome the critical challenge of low signal-to-noise ratio in histone chromatin immunoprecipitation followed by sequencing (ChIP-seq). We explore the fundamental principles behind noise generation and survey cutting-edge wet-lab and computational solutions, including spike-in normalization, automated pipelines, and emerging enzyme-based methods. A detailed troubleshooting framework and rigorous benchmarking standards are presented to enable reliable detection of histone modifications, which is essential for accurate epigenetic research and the development of targeted epigenetic therapies.
Understanding the Noise: Core Principles and Challenges in Histone ChIP-seq
Defining Signal-to-Noise Ratio and Its Impact on Epigenetic Data Quality
Frequently Asked Questions (FAQs)
1. What is signal-to-noise ratio in the context of histone ChIP-seq? Signal-to-noise ratio refers to the strength of the specific enrichment at genuine biological targets (signal) compared to non-specific or background binding (noise). In histone ChIP-seq, a high signal-to-noise ratio means your data shows clear enrichment at true histone modification sites with minimal background, leading to more reliable and interpretable results [1] [2].
2. Why is my histone ChIP-seq data so noisy? High background noise can stem from several sources, with antibody specificity being a primary culprit. Antibodies with cross-reactivity or low affinity can pull down non-target regions. Other common causes include suboptimal chromatin fragmentation (over- or under-sonication), insufficient sequencing depth for the histone mark being studied, and using an inadequate number of starting cells for the mark's abundance [1] [3] [4].
3. How can I improve the signal-to-noise ratio in my experiment? Key strategies include:
- Antibody Validation: Use antibodies that show ≥5-fold enrichment in ChIP-PCR at positive-control regions versus negative controls [1].
- Optimized Cell Number: Use sufficient starting material (typically 1 million cells for abundant marks like H3K4me3) to improve the signal [1].
- Proper Controls: Use input DNA as a control instead of non-specific IgG to account for biases in chromatin fragmentation and sequencing [1].
- Adequate Sequencing Depth: Ensure sufficient sequencing; while 20 million reads may suffice for Drosophila, 40–50 million is a practical minimum for human histone marks, with broader marks like H3K27me3 requiring more depth [3].
4. My replicates have different IP efficiencies. Can I fix this computationally?
You cannot truly "fix" fundamental differences in IP efficiency after sequencing, as a low-efficiency experiment will inherently have a higher noise floor. The best practice is to optimize your wet-lab protocol for consistency. For analysis, you can try to account for these differences during normalization against input DNA using tools like bamCompare from deepTools, but this does not replace the need for robust experimental technique [5].
5. What is the recommended control for a histone ChIP-seq experiment? Input DNA (sonicated and cross-linked chromatin that has not been immunoprecipitated) is generally recommended over non-specific IgG. Input DNA controls for biases introduced during chromatin fragmentation, base composition, and sequencing efficiency, providing a more accurate background model for peak identification [1].
Troubleshooting Guides
Guide 1: Diagnosing and Resolving Low Signal-to-Noise Ratio
A low signal-to-noise ratio manifests as high background, few clear peaks, or poor replicate concordance. Follow this diagnostic workflow to identify and correct the issue.
Guide 2: Addressing Specific Failure Modes
Problem: High Background or Too Many Peaks
This often indicates antibody cross-reactivity or non-specific binding.
Solutions:
- Verify Antibody Specificity: Perform a western blot on a knockout or knockdown cell line to check for non-specific bands [1].
- Use a Different Antibody: If available, test an antibody that recognizes a different epitope or is from a different clonality (try polyclonal if a monoclonal failed, or vice versa) [1].
- Increase Wash Stringency: Add more washes or use buffers with slightly higher salt concentrations to reduce non-specific binding [4].
- Employ Biotin-Streptavidin ChIP: For epitope-tagged proteins, using a biotin-streptavidin system can withstand very stringent washes, drastically reducing background [1].
Problem: Weak or No Peaks
This suggests poor immunoprecipitation efficiency or low enrichment.
Solutions:
- Check Antibody Quality: Ensure the antibody is ChIP-grade and has been validated for the specific species and application. Test it with a positive control target [4].
- Optimize Cross-linking: Over- or under-cross-linking can mask epitopes or reduce efficiency. Test different formaldehyde concentrations (e.g., 1%) and durations (e.g., 10-20 minutes) [4].
- Titrate Antibody Amount: Too little antibody will not pull down enough material. Use the manufacturer's recommendation as a starting point and optimize [1].
- Check Chromatin Fragmentation: Overshearing can destroy epitopes. Run sheared chromatin on a gel to confirm the fragment size is between 150-300 bp [1] [4].
Problem: Poor Reproducibility Between Replicates
Technical variability in the ChIP procedure is a common cause.
Solutions:
- Perform Biological Replicates: At least two biological replicates are necessary to ensure reliability [1].
- Standardize Protocols: Use master mixes for reagents, calibrate pipettes, and ensure all technicians follow the same SOP to minimize human error [6].
- Control for Input DNA Variation: Use high-quality, deeply sequenced input DNA libraries for normalization, as variation in input can significantly impact peak calling [2].
Key Experimental Parameters for Histone ChIP-seq
Table 1: Optimization Guidelines for Key Experimental Steps
| Parameter | Impact on S/N | Recommendation for Histone Marks | Troubleshooting Tip |
|---|---|---|---|
| Antibody Quality [1] | Critical | Use ChIP-validated antibodies with ≥5-fold enrichment in ChIP-PCR. | Validate with knockout control; test multiple antibodies if possible. |
| Cell Number [1] | High | 1 million for abundant marks (H3K4me3); up to 10 million for diffuse marks (H3K27me3). | If signal is low, scale up cell input. For rare cells, use low-cell-number protocols. |
| Cross-linking [4] | High | 1% formaldehyde for 10-20 min at room temp. | Over-cross-linking can mask epitomes; under-cross-linking reduces yield. |
| Chromatin Shearing [1] | High | Sonicate to 150-300 bp (mono-/di-nucleosome size). | Analyze fragment size on gel; over-sonication can damage histone epitopes. |
| Sequencing Depth [3] | Medium | 40-50 million reads for human; more for broad marks. | Insufficient depth causes false negatives; use pilot studies to determine depth. |
| Control [1] | High | Use input DNA, not IgG, for peak calling. | Input DNA accounts for open chromatin & sequencing bias. |
The Scientist's Toolkit: Essential Research Reagents and Materials
Table 2: Key Reagents for High-Quality Histone ChIP-seq
| Item | Function | Critical Consideration |
|---|---|---|
| ChIP-Grade Antibody [1] | Specifically enriches for the histone modification of interest. | Must be validated for ChIP-seq, not just ChIP-PCR. Check for cross-reactivity. |
| Protein A/G Magnetic Beads [4] | Captures the antibody-chromatin complex for purification. | Choose based on antibody species/isotype for optimal binding affinity. |
| Formaldehyde [4] | Crosslinks proteins to DNA, preserving in vivo interactions. | Use high-quality, fresh solutions. Quench with glycine. |
| Micrococcal Nuclease (MNase) [1] | Digests chromatin for native ChIP; provides nucleosome-resolution. | Preferred for histone modifications as it leaves nucleosomes intact. |
| Protease Inhibitors [4] | Prevents degradation of histones and proteins during the procedure. | Use a broad-spectrum cocktail; keep samples cold. |
| Biotin-Streptavidin System [1] | Alternative for epitope-tagged histones; enables ultra-stringent washes. | Greatly reduces background noise. Ensure tag does not disrupt function. |
| Sonication Device [1] | Shears cross-linked chromatin into small fragments. | Conditions must be optimized for each cell type and cross-linking condition. |
| Input DNA [1] [2] | The most appropriate control for normalization and peak calling. | Should be processed and sequenced alongside IP samples. |
Advanced Applications: Micro-C-ChIP
For researchers investigating 3D chromatin architecture specific to histone modifications, Micro-C-ChIP is a cutting-edge method. It combines Micro-C (for high-resolution chromatin conformation capture) with chromatin immunoprecipitation. This approach allows you to map histone mark-specific chromatin interactions (e.g., H3K4me3-mediated promoter contacts) at nucleosome resolution with significantly lower sequencing costs than full genome-wide methods like Hi-C [7].
Key Advantage: It focuses sequencing power on functionally relevant, histone-marked regions, providing a high signal-to-noise ratio for 3D interactions by eliminating sequencing burden from unrelated genomic regions [7].
FAQs: Addressing Common Experimental Issues
What are the primary sources of background noise in a histone ChIP-seq experiment? The three major sources of background noise are cross-linking artifacts, sonication bias, and non-specific antibody binding. Cross-linking artifacts occur when prolonged formaldehyde fixation traps non-specific proteins near DNA. Sonication bias arises from uneven chromatin fragmentation where open chromatin regions shear more easily. Non-specific antibody binding involves off-target recognition of epitopes other than the intended histone mark [8] [1] [9].
How can I minimize non-specific signal caused by my antibody? Antibody validation is crucial. For histone modifications, perform primary characterization using immunoblot analysis and secondary characterization through peptide binding tests, mass spectrometry, or immunoreactivity analysis in cell lines with knockdowns of relevant histone modification enzymes [8]. For ChIP-seq, your antibody should show ≥5-fold enrichment in ChIP-PCR assays at positive-control regions compared to negative controls [1]. Titrating antibody concentration can also help distinguish strong (on-target) from weak (off-target) interactions [10].
What is the optimal cross-linking time to minimize artifacts? Shorter cross-linking times significantly reduce non-specific recovery. Studies comparing 4-minute versus 60-minute formaldehyde fixation found prolonged fixation dramatically increased non-specific recovery of proteins that don't normally bind DNA [9]. For histone ChIP-seq specifically, consider alternative fragmentation using micrococcal nuclease (MNase) digestion of native chromatin, which eliminates cross-linking artifacts entirely [1] [10].
How does chromatin fragmentation method affect my results? Sonication bias favors open chromatin regions, which shear more easily than closed chromatin, creating higher background signals in these areas [1]. MNase digestion generates mononucleosome-sized fragments (~150-300 bp) with higher resolution for nucleosome modifications and eliminates cross-linking artifacts [1] [10]. MNase is generally superior for histone ChIP-seq as it provides reproducible fragment sizes and more accurate quantification [10].
What controls should I include to identify technical artifacts? Chromatin inputs serve as better controls than non-specific IgGs for addressing bias in chromatin fragmentation and variations in sequencing efficiency [1]. Input DNA provides greater and more evenly distributed genome coverage as a background model for peak identification. For antibody specificity controls, use true pre-immune serum, different antibodies recognizing the same factor, or cells with knockdown/knockout of your target [1].
Troubleshooting Guides
Cross-linking Artifacts
Problem: Non-specific recovery of proteins at active genomic loci, especially after extended fixation.
Solutions:
- Optimize fixation time: Reduce formaldehyde cross-linking to the minimum required (typically 2-10 minutes instead of 20-60 minutes) [9].
- Control fixation temperature: Keep temperature consistent during fixation (37°C recommended) [9].
- Use effective quenching: Replace glycine with 750 mM Tris, which more effectively terminates cross-linking reactions [10].
- Consider native ChIP: For histone modifications, use MNase digestion without cross-linking to completely avoid cross-linking artifacts [1] [11].
Sonication Bias
Problem: Uneven coverage with over-representation of open chromatin regions.
Solutions:
- Switch to MNase digestion: Produces mononucleosome-sized fragments (∼150-300 bp) with less bias [1] [10].
- Standardize sonication conditions: Prepare nuclei prior to fixation and optimize sonicator settings for your cell type [1].
- Verify fragment size: Analyze fragmented DNA to ensure optimal size range of 150-300 bp [1].
- Use appropriate buffers: SDS-containing buffers may improve efficiency for tightly-bound proteins but can disrupt some protein complexes [1].
Non-specific Antibody Binding
Problem: Off-target peaks and high background from antibody cross-reactivity.
Solutions:
- Validate antibodies rigorously: Test multiple genomic loci for ≥5-fold enrichment in ChIP-PCR before sequencing [1].
- Perform antibody titration: Sequence points along a binding isotherm to identify optimal concentration that maximizes on-target binding [10].
- Use knockout controls: When available, test antibodies in cells lacking the target protein to identify non-specific interactions [1].
- Consider monoclonal vs. polyclonal: Test both antibody types - monoclonals may reduce background but polyclonals can boost signal when epitopes are masked [1].
Table 1: Optimization Parameters for Reducing Background Noise
| Parameter | Suboptimal Condition | Optimal Condition | Effect on Signal-to-Noise |
|---|---|---|---|
| Cross-linking Time | 60 minutes [9] | 4-10 minutes [9] | Dramatically reduces non-specific protein recovery |
| Cell Number | 10^4-10^5 cells [1] | 1-10 million cells [1] | Higher cell numbers improve signal-to-noise ratio |
| Sequencing Depth | <10 million reads [8] | 20-40 million reads (human) [8] | Allows detection of more sites with reduced enrichment |
| FRiP Score | <1% [8] | >1% [8] | Indicates successful enrichment of target regions |
| Antibody Enrichment | <5-fold [1] | ≥5-fold [1] | Ensures sufficient specificity for ChIP-seq |
Table 2: Comparison of Chromatin Fragmentation Methods
| Characteristic | Sonication | MNase Digestion |
|---|---|---|
| Fragment Size Range | 100-800 bp [10] | ∼150-300 bp (mononucleosome) [10] |
| Cross-linking Required | Yes [1] | No (native ChIP) [1] |
| Resolution | Lower [10] | Higher [10] |
| Bias Toward Open Chromatin | Yes [1] | Reduced [10] |
| Best Applications | Transcription factors [1] | Histone modifications [1] |
Experimental Protocols
Day 1: Cell Preparation and MNase Digestion
- Culture and Harvest: Grow cells to 80% confluence in 10 cm dish.
- MNase Digestion: Digest chromatin with 75 U MNase for 5 minutes per dish.
- Verify Digestion: Purify DNA and run agarose gel to confirm mononucleosome-sized fragments (∼150 bp).
- Chromatin Preparation: Isulate chromatin and determine concentration.
Day 1-2: Immunoprecipitation
- Antibody Titration: Set up binding reactions with varying antibody concentrations (e.g., 0.5-5 μg) to generate binding isotherm.
- Incubate: Add antibody to chromatin and incubate overnight at 4°C.
- Add Beads: Add protein A/G beads and incubate 2-6 hours.
- Wash: Perform stringent washes; bead-only capture should be <1.5% of input.
Day 2: DNA Recovery and Analysis
- Elute and Reverse Cross-links: Incubate at 65°C with proteinase K.
- Purify DNA: Use PCR purification kit.
- Quality Control: Measure DNA concentration; typical yields should follow a binding isotherm with more antibody yielding more DNA until saturation.
For studying histone mark-specific chromatin interactions:
- Dual Cross-linking: Use dual fixation instead of formaldehyde-only for better signal-to-noise ratio.
- MNase Digestion: Fragment with MNase to nucleosome resolution.
- Proximity Ligation: Perform in situ ligation before immunoprecipitation to preserve true 3D interactions.
- Sonication and IP: Sonicate to solubilize cross-linked chromatin, then perform immunoprecipitation.
- Library Preparation: Use standard methods with biotin-labeled fragments.
Workflow Diagrams
Research Reagent Solutions
Table 3: Essential Materials for Optimized Histone ChIP-seq
| Reagent/Category | Specific Examples | Function & Optimization Notes |
|---|---|---|
| Cross-linking Reagents | Formaldehyde (1%), Tris quenching buffer (750 mM) [10] | Tris more effectively quenches formaldehyde than glycine, improving reproducibility [10] |
| Chromatin Fragmentation | Micrococcal Nuclease (75 U/5 min per 10 cm dish) [10] | Produces mononucleosome-sized fragments; more reproducible than sonication [10] |
| Validated Histone Antibodies | H3K4me3, H3K27me3 antibodies with peptide validation [8] [12] | Must show ≥5-fold enrichment in ChIP-PCR; titrate to find optimal concentration [1] [10] |
| Quality Control Tools | FRiP calculation, Cross-correlation analysis [8] | FRiP >1% indicates successful enrichment; essential for data quality assessment [8] |
| Alternative Methods | CUT&Tag, CUT&RUN [12] | Enzyme-based approaches with lower background; useful when ChIP-seq background is persistently high [12] |
The Critical Role of Antibody Specificity and Characterization
Core Concepts: Why Antibody Specificity is Non-Negotiable
What is antibody specificity in the context of histone ChIP-seq, and why does it directly impact my signal-to-noise ratio?
Antibody specificity refers to an antibody's ability to uniquely recognize its intended histone post-translational modification (PTM) and distinguish it from similar epigenetic marks. In histone ChIP-seq, this is critically important because non-specific antibodies generate increased background noise and obscure genuine biological signals, leading to inaccurate mapping of histone distributions across the genome.
The fundamental challenge arises from the similarity between different histone modifications. Antibodies must distinguish between highly similar modifications such as mono-, di-, or trimethylation of a single histone residue (e.g., H3K4me1, H3K4me2, H3K4me3). When antibodies lack sufficient specificity, they pull down nucleosomes containing off-target modifications in addition to the intended target, resulting in additional peaks that do not represent the true biological distribution of your target PTM. Research has demonstrated that antibodies with similarly high specificity (>85%) produce concordant ChIP-seq profiles, whereas antibodies with only 60% specificity generate different and potentially misleading peak patterns [13].
The relationship between antibody concentration and specificity further complicates experimental design. The immunoprecipitation step in ChIP-seq represents a competitive binding reaction that follows a classical binding isotherm. Titrating antibody concentration can reveal differential binding specificities associated with on- and off-target epitope interactions. At optimal concentrations, antibodies primarily engage in high-affinity (on-target) interactions, while excessive antibody concentrations can promote lower-affinity (off-target) binding, thereby increasing background noise and reducing your signal-to-noise ratio [10] [14].
How can I conceptually understand the workflow for characterizing antibody specificity?
The following diagram illustrates the core logical process for analyzing and troubleshooting antibody specificity:
Antibody Validation Methods: From Basic to Advanced
What methods are available for characterizing antibody specificity, and how do they compare?
Different validation methods provide complementary information about antibody performance. The table below summarizes the key techniques, their applications, and limitations:
| Method | Application Context | Key Output | Advantages | Limitations |
|---|---|---|---|---|
| Peptide Array/Dot Blot [13] | Western Blot, Initial Screening | Epitope recognition under denaturing conditions | High-throughput, comprehensive PTM screening | Does not reflect native chromatin context |
| SNAP-ChIP (ICeChIP) [13] | ChIP-seq, Native Conditions | Quantitative specificity and efficiency in nucleosomal context | Uses barcoded nucleosomes as internal controls; application-relevant | Limited to available modified nucleosomes in panel |
| siQ-ChIP [10] | ChIP-seq, Quantitative Profiling | Binding isotherms distinguishing on/off-target interactions | No spike-ins required; reveals antibody concentration effects | Requires multiple titration points; more complex analysis |
| Knockout/Knockdown Validation [1] | Specificity Confirmation | Loss of signal in absence of target | Biological validation of specificity | Not always feasible; time-consuming |
| Western Blot [15] | Initial Specificity Check | Recognition of target protein size | Confirms recognition of correct protein | Denaturing conditions not reflective of ChIP |
How do I implement the SNAP-ChIP method for rigorous antibody validation?
The SNAP-ChIP methodology (commercialized from the Internal Standard Calibrated ChIP or ICeChIP assay) uses barcoded synthetic nucleosomes as internal controls to quantitatively measure antibody specificity directly in the ChIP context [13].
Experimental Protocol:
- Spike-in Control Preparation: Obtain the K-MetStat panel or similar barcoded nucleosome standards. This panel typically includes unmethylated and mono-, di-, and trimethylated forms of H3K4, H3K9, H3K27, H3K36, and H4K20, each wrapped with a unique DNA barcode.
- Sample Preparation: Spike the barcoded nucleosome panel into your cell lysate at the beginning of the standard ChIP workflow.
- Standard ChIP Procedure: Proceed with your normal chromatin immunoprecipitation protocol using the antibody being tested.
- DNA Quantification: Isulate immunoprecipitated DNA and quantify the amount of each barcoded nucleosome using qPCR with barcode-specific primers.
- Data Analysis: Calculate antibody specificity as the percentage of immunoprecipitated nucleosomes that contain the intended target modification. Determine efficiency as the percentage of target nucleosomes immunoprecipitated relative to input.
Interpretation: High-quality antibodies typically show >85% specificity for their intended target with minimal cross-reactivity (<15%) across the modification panel. Antibody efficiency (percentage of target immunoprecipitated) can vary but provides information about signal strength [13].
What is the siQ-ChIP method and how does it characterize antibody behavior?
The sans spike-in Quantitative Chromatin Immunoprecipitation (siQ-ChIP) method introduces an absolute quantitative scale to ChIP-seq data without reliance on spike-in normalization. This approach is particularly valuable for characterizing the spectrum of an antibody's binding constants [10].
Experimental Protocol:
- Chromatin Standardization: Optimize MNase digestion to generate mononucleosome fragments and create a chromatin concentration standard.
- Antibody Titration: Perform multiple ChIP reactions titrating antibody concentration while keeping chromatin amount constant.
- DNA Quantification: Measure the mass of immunoprecipitated DNA at each antibody concentration.
- Sequencing: Sequence points along the binding isotherm at low depth (≥12 million reads per IP).
- Isotherm Analysis: Plot DNA capture against antibody concentration to generate a binding isotherm.
Interpretation: The resulting binding isotherm reveals the antibody's binding characteristics. "Narrow spectrum" antibodies display one observable binding constant, while "broad spectrum" antibodies show a range of binding constants, indicating differential affinity for on-target versus off-target epitopes. Sequencing multiple points along this isotherm enables distinction between strong (high-affinity, likely on-target) and weak (low-affinity, potentially off-target) interactions through their differential peak responses [10].
Troubleshooting FAQs: Solving Common Antibody Specificity Problems
Why does my ChIP-seq data show unexpected peaks or high background?
Unexpected peaks in your ChIP-seq data often indicate antibody cross-reactivity with off-target epitopes. This problem manifests as peaks in genomic regions not expected to contain your target modification, or when your profile differs significantly from published datasets despite similar biological conditions.
Solutions:
- Validate Specificity: Perform SNAP-ChIP or siQ-ChIP validation as described above to quantify cross-reactivity [13] [10].
- Titrate Antibody: Optimize antibody concentration relative to chromatin amount. High antibody concentrations can saturate the assay and promote off-target binding [14].
- Include Controls: Use knockout/knockdown controls where possible to confirm specificity [1].
- Verify Chromatin Quality: Ensure proper fragmentation (150-300 bp for sonication, mononucleosomal for MNase) as over-fragmentation can disrupt chromatin integrity and increase background [16] [1].
How can I optimize antibody concentration to improve signal-to-noise ratio?
Antibody concentration directly impacts your signal-to-noise ratio through its effect on binding specificity. The relationship follows a binding isotherm where both insufficient and excessive antibody diminish performance.
Optimization Protocol:
- Set Up Titration: Perform a pilot experiment with at least 4-5 different antibody concentrations (e.g., 0.5×, 1×, 2×, 4× the manufacturer's recommendation) while keeping chromatin amount constant.
- Measure DNA Yield: Quantify immunoprecipitated DNA mass at each concentration.
- Assess Enrichment: For selected concentrations, perform qPCR at positive and negative control genomic regions.
- Identify Optimal Range: Select the concentration that provides strong enrichment at positive control regions (≥10-fold over background) without increasing signal at negative control regions [14].
- Validate by Sequencing: Confirm optimal concentration with a limited sequencing run before scaling up.
What are the critical experimental parameters that most affect antibody specificity in practice?
The following troubleshooting guide addresses the most common experimental factors affecting antibody performance:
| Problem | Possible Causes | Recommended Solutions |
|---|---|---|
| High background in negative controls | Antibody cross-reactivity, excessive antibody concentration, insufficient washing | Validate specificity with SNAP-ChIP; titrate antibody; increase wash stringency [15] [14] |
| Poor enrichment at positive control regions | Insufficient antibody, epitope masking, over-fixation | Increase antibody concentration within optimal range; shorten crosslinking time; try SDS in sonication buffer [1] [15] |
| Inconsistent results between replicates | Variable chromatin fragmentation, antibody instability, bead handling inconsistencies | Standardize MNase digestion/sonication; aliquot antibodies to avoid freeze-thaw; ensure complete bead resuspension [16] [15] |
| Discrepancies with published profiles | Different antibody specificity, variation in experimental conditions | Compare specificity data; ensure consistent cell culture conditions; use recommended controls [17] [13] |
How can I visualize the complete troubleshooting workflow for antibody-related issues?
When facing antibody specificity problems, follow this systematic decision pathway to identify and resolve issues:
The Scientist's Toolkit: Essential Research Reagent Solutions
Implementing robust antibody validation requires specific reagents and tools. The table below summarizes essential resources mentioned in the research literature:
| Tool/Reagent | Function | Application Context | Key Features |
|---|---|---|---|
| K-MetStat Panel (SNAP-ChIP) [13] | Antibody specificity profiling | ChIP-seq optimization | Barcoded nucleosomes with specific PTMs; enables quantitative specificity assessment |
| siQ-ChIP Analysis Pipeline [10] | Quantitative ChIP without spike-ins | Antibody characterization | Generates binding isotherms; distinguishes narrow vs broad spectrum antibodies |
| ChIP-Grade Antibodies with SNAP-ChIP Validation [13] | Specific immunoprecipitation | Histone ChIP-seq | Pre-validated for >85% specificity in native chromatin context |
| MNase (Micrococcal Nuclease) [10] [16] | Chromatin fragmentation | Sample preparation | Generates mononucleosomal fragments; improves quantification accuracy |
| HDAC Inhibitors (TSA, NaB) [17] | Stabilization of acetyl marks | CUT&Tag for acetylation marks | Preserves histone acetylation during native protocols |
| MACS2 & SEACR [17] | Peak calling | Data analysis | Optimized parameters available for different antibody types |
How should I apply these tools in a coordinated experimental strategy?
For comprehensive antibody characterization, implement a tiered approach:
- Start with peptide arrays for initial screening of commercial antibodies.
- Progress to SNAP-ChIP validation for antibodies intended for ChIP applications, prioritizing those with >85% specificity.
- Implement siQ-ChIP titration for finetuning experimental conditions and understanding concentration effects.
- Incorporate biological controls (knockout lines, enzyme inhibitors) where possible for orthogonal validation.
- Use standardized analysis pipelines with appropriate peak callers and parameters for your specific antibody type [17] [13].
This multi-layered validation strategy ensures that your antibodies perform optimally in the specific context of histone ChIP-seq, ultimately delivering the high signal-to-noise ratio essential for reliable epigenetic profiling.
How Global Epigenetic Changes, Such as Those in Cancer, Exacerbate Normalization Challenges
FAQs: Navigating Histone ChIP-Seq in Complex Epigenetic Environments
FAQ 1: How do global epigenetic changes in cancer affect my histone ChIP-seq results? Cancer cells are characterized by widespread epigenetic alterations, including redistributed histone modifications and DNA methylation changes. These global shifts create an abnormal chromatin landscape that directly challenges ChIP-seq normalization. The underlying assumption of an even background signal across the genome is violated, leading to inaccurate peak calling and quantification. This is because the "noise floor" is no longer consistent, making it difficult to distinguish true biological signal from experiment-specific artifacts and the altered baseline [18] [19].
FAQ 2: What is the specific impact on signal-to-noise ratio? The primary impact is on your assay's signal-to-noise ratio (SNR). In cancer models, the "noise" can be substantially elevated due to:
- Epigenetic Heterogeneity: The presence of multiple cell subpopulations with distinct histone mark patterns increases variability in your data [18] [20].
- Altered Chromatin Accessibility: Global changes in DNA methylation and histone acetylation can make chromatin more or less accessible in a non-uniform way, skewing background signal [18].
- Generalized Dysregulation: The failure of normal "writer," "reader," and "eraser" functions in cancer cells means histone marks may be deposited or removed less faithfully, creating a more stochastic background [18].
A lower SNR makes it harder to detect genuine protein-DNA interactions and can lead to both false positives and false negatives. Advanced methods like HiChIP have shown that protocol optimizations, such as dual chromatin fixation, can substantially improve the SNR even in these challenging contexts [21].
FAQ 3: Why can't I use standard normalization methods like ICE for enrichment-based techniques in cancer samples? Standard normalization methods, such as ICE (Iterative Correction and Evaluation), assume relatively uniform coverage across the genome. This assumption is fundamentally broken in two ways when working with cancer epigenomes:
- Biological Bias: The cancer genome itself has massive regions of aberrant heterochromatin and euchromatin, leading to inherent, biologically meaningful coverage biases [18] [20].
- Methodological Bias: ChIP-based protocols (like ChIP-seq, HiChIP) intentionally create an enrichment bias towards regions bound by the protein or mark of interest [7]. Applying ICE to such data can normalize out genuine biological signals. For techniques like Micro-C-ChIP, input-based normalization using a deeply sequenced bulk Micro-C dataset from the same cell type as a control is recommended to account for general chromatin accessibility biases [7].
Troubleshooting Guides
Table: Expected Chromatin Yield from Different Tissues
Yields can vary significantly by tissue type, impacting the amount of input material required for a successful ChIP-seq. Below are typical yields from 25 mg of tissue or 4 x 10^6 HeLa cells [22].
| Tissue / Cell Type | Total Chromatin Yield (µg) | Expected DNA Concentration (µg/ml) |
|---|---|---|
| Spleen | 20 – 30 | 200 – 300 |
| Liver | 10 – 15 | 100 – 150 |
| Kidney | 8 – 10 | 80 – 100 |
| HeLa Cells | 10 – 15 | 100 – 150 |
| Brain | 2 – 5 | 20 – 50 |
| Heart | 2 – 5 | 20 – 50 |
Table: Common ChIP-seq Problems and Solutions in Challenging Samples
This guide addresses issues frequently encountered when working with samples exhibiting global epigenetic dysregulation [22] [23].
| Problem | Possible Causes | Recommendations |
|---|---|---|
| High Background/ Low Signal-to-Noise | • Epigenetic heterogeneity in sample.• Over-fragmented chromatin.• Antibody non-specificity or insufficient cross-linking. | • Increase number of cells/tissue per IP to ensure sufficient target material.• Verify antibody specificity for the intended target in your model system.• For transcription factors, consider increasing cross-linking time from 10 to 30 minutes. |
| Chromatin Under-fragmentation | • Cells are over-crosslinked.• Too much input material per reaction.• Insufficient nuclease or sonication. | • Shorten cross-linking time to the 10-30 minute range.Enzymatic: Increase amount of Micrococcal nuclease; perform an enzymatic digestion time course.Sonication: Conduct a sonication time course. |
| Chromatin Over-fragmentation | • Excessive nuclease or sonication.• Over-digestion to mono-nucleosome length. | Enzymatic: Reduce the amount of nuclease or increase the amount of tissue/cells in the digest.Sonication: Use the minimum number of sonication cycles needed to achieve 200-1000 bp fragments. Over-sonication can disrupt chromatin integrity. |
| Low Chromatin Concentration | • Incomplete cell or tissue lysis.• Not enough starting cells or tissue. | • If concentration is slightly low, add more chromatin to each IP to reach at least 5 µg.• Microscopically confirm complete lysis of nuclei after sonication.• Accurately count cells before cross-linking. |
Detailed Experimental Protocols
Protocol 1: Optimization of Chromatin Fragmentation for Enzymatic Digestion
This protocol is critical for achieving the ideal 150-900 bp fragment size, which is essential for high-resolution data and a good SNR [22].
- Prepare Cross-linked Nuclei: From 125 mg of tissue or 2 x 10^7 cells. Stop after nuclear preparation.
- Set Up Digestion Series: Transfer 100 µl of nuclei preparation into five individual 1.5 ml tubes.
- Dilute Enzyme: Add 3 µl of micrococcal nuclease (MNase) stock to 27 µl of 1X Buffer B + DTT.
- Digest: Add 0 µl, 2.5 µl, 5 µl, 7.5 µl, or 10 µl of the diluted MNase to the five tubes. Mix and incubate for 20 minutes at 37°C with frequent mixing.
- Stop Reaction: Add 10 µl of 0.5 M EDTA to each tube and place on ice.
- Pellet and Lyse Nuclei: Pellet nuclei by centrifugation, resuspend in 200 µl of 1X ChIP Buffer + Protease Inhibitor Cocktail (PIC), and incubate on ice for 10 minutes.
- Release Chromatin: Sonicate lysate with several brief pulses to break the nuclear membrane. Monitor lysis under a microscope.
- Analyze Fragmentation: Clarify lysates by centrifugation. Treat supernatant with RNase A and Proteinase K, then run 20 µl of each sample on a 1% agarose gel.
- Determine Optimal Condition: Identify the volume of diluted MNase that produces a DNA smear in the 150-900 bp range. The optimal volume for one IP (25 mg tissue or 4x10^6 cells) is this volume divided by 10.
Protocol 2: Determining Optimal Sonication Conditions
For techniques requiring sonication-based fragmentation, this time-course ensures optimal fragment size without damaging chromatin integrity [22] [23].
- Prepare Nuclei: From 100–150 mg of tissue or 1x10^7–2x10^7 cells.
- Sonication Time-Course: Fragment chromatin by sonication. Remove 50 µl samples after increasing durations of sonication (e.g., after each 1-2 minutes).
- Clarify and Decrosslink: Clarify chromatin samples by centrifugation. Treat the supernatant with RNase A and Proteinase K.
- Analyze Fragment Size: Run 20 µl of each sample on a 1% agarose gel.
- Select Conditions: Choose the minimal sonication time that generates a DNA smear with the desired size distribution.
- For cells fixed 10 min: ~90% of fragments < 1 kb.
- For tissues fixed 10 min: ~60% of fragments < 1 kb.
- Avoid over-sonication, where >80% of fragments are <500 bp, as this damages chromatin and lowers IP efficiency.
Signaling Pathways and Workflows
Histone Mark Deposition and Transcriptional Outcome
This diagram illustrates the pathway from epigenetic enzyme activity to gene expression changes, highlighting points where noise is introduced in cancer cells.
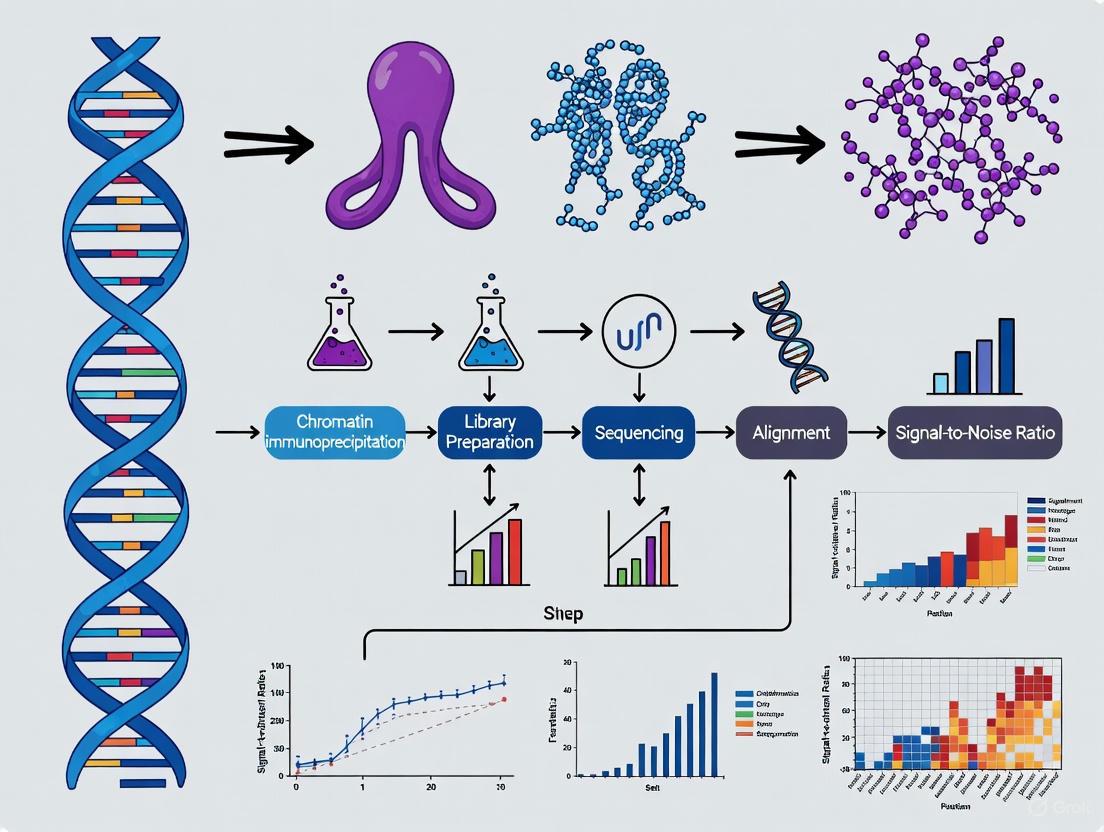
Optimized ChIP-seq Wet-Lab Workflow
This workflow diagram outlines a robust ChIP-seq protocol, incorporating key steps to mitigate normalization challenges.
The Scientist's Toolkit: Research Reagent Solutions
Table: Essential Materials for Robust Histone ChIP-seq
This table lists key reagents and their functions for conducting ChIP-seq experiments, particularly in challenging biological contexts.
| Item | Function & Application Notes |
|---|---|
| ChIP-Validated Antibodies | Essential for specific immunoprecipitation. Always use antibodies validated for ChIP application to ensure recognition of the epitope in cross-linked chromatin [23]. |
| Micrococcal Nuclease (MNase) | Enzyme for gentle chromatin digestion. Ideal for histone ChIP-seq as it cleaves linker DNA, preserving nucleosome integrity. Requires optimization for each cell/tissue type [22] [23]. |
| Formaldehyde | Reagent for cross-linking proteins to DNA. Standard cross-linking time is 10 minutes; can be extended to 30 minutes for better preservation of transcription factor interactions, though this may require longer sonication [22] [23]. |
| Protein G Magnetic Beads | Solid support for antibody capture. Preferred over agarose for easier washing, reduced bead loss, and compatibility with ChIP-seq (as they are not blocked with DNA that could contaminate libraries) [23]. |
| Protease Inhibitor Cocktail (PIC) | Prevents protein degradation during chromatin preparation. Critical for maintaining the integrity of histone modifications and chromatin-associated proteins throughout the protocol [22]. |
| Dual Crosslinkers (e.g., DSG + Formaldehyde) | For improved fixation of chromatin complexes. Used in advanced protocols like HiChIP to significantly enhance the signal-to-noise ratio and detection of specific chromatin interactions [21]. |
| 4-thiouridine (4sU) | Nucleotide analog for nascent RNA labeling. Used in new RNA profiling methods to decipher direct transcriptional effects of epigenetic compounds, separating them from indirect effects [24]. |
ENCODE and Community Standards for High-Quality Histone ChIP-seq
This technical support center is designed within the context of a broader thesis on improving the signal-to-noise ratio in histone ChIP-seq research. A high signal-to-noise ratio is paramount for generating reliable, interpretable, and biologically relevant data. The following guides and FAQs, structured around community standards from the ENCODE consortium and other expert sources, are crafted to help researchers and drug development professionals troubleshoot specific experimental issues, optimize their protocols, and achieve high-quality results.
FAQs: ENCODE Data Standards
What are the ENCODE standards for read depth and library complexity in histone ChIP-seq?
The ENCODE consortium has established specific quality control metrics and requirements for histone ChIP-seq experiments to ensure data quality and reproducibility [25].
Table 1: ENCODE Standards for Histone ChIP-seq Experiments
| Category | Specific Requirement | Metric or Value |
|---|---|---|
| Biological Replicates | Minimum number | Two or more biological replicates [25] |
| Control Experiments | Requirement | Input control with matching replicate structure, run type, and read length [25] |
| Library Complexity | Non-Redundant Fraction (NRF) | NRF > 0.9 (Preferred) [25] |
| PCR Bottlenecking Coefficient 1 (PBC1) | PBC1 > 0.9 (Preferred) [25] | |
| PCR Bottlenecking Coefficient 2 (PBC2) | PBC2 > 10 (Preferred) [25] | |
| Read Depth (per replicate) | Narrow histone marks (e.g., H3K27ac, H3K4me3) | 20 million usable fragments [25] |
| Broad histone marks (e.g., H3K27me3, H3K36me3) | 45 million usable fragments [25] | |
| Exception: H3K9me3 in tissues/primary cells | 45 million total mapped reads [25] |
How does the ENCODE pipeline process histone ChIP-seq data?
The ENCODE uniform processing pipeline for histone ChIP-seq is distinct from the transcription factor pipeline, as it is designed to resolve both punctate binding and longer chromatin domains [25]. The workflow involves mapping followed by peak calling, with specific steps for replicated and unreplicated experiments. The following diagram illustrates the core workflow:
What are the key quality metrics for assessing a successful ChIP-seq experiment?
Beyond the ENCODE standards, several quality metrics should be assessed. Strand cross-correlation is a ChIP-seq specific metric that helps determine the quality of an enrichment [26]. It produces a plot with two key peaks: a peak of enrichment corresponding to the predominant fragment length and a peak corresponding to the read length ("phantom" peak). From this, two critical coefficients are derived [26]:
- Normalized Strand Cross-correlation (NSC): Higher values (>1.05) indicate more enrichment.
- Relative Strand Cross-correlation (RSC): Values above 1 are indicative of successful ChIP, with higher values indicating stronger enrichment.
The FRiP (Fraction of Reads in Peaks) is another crucial metric used by ENCODE, representing the proportion of all mapped reads that fall into peak regions. A higher FRiP score indicates a better signal-to-noise ratio [25].
Troubleshooting Guides
Problem: Low Chromatin Yield or Concentration
Low chromatin concentration after extraction and fragmentation can severely limit immunoprecipitation efficiency.
Table 2: Troubleshooting Low Chromatin Yield
| Possible Cause | Recommended Solution | Supporting Context |
|---|---|---|
| Insufficient starting material | Use more cells or tissue per chromatin preparation. For tissues, expected yields vary (e.g., 20–30 µg from 25 mg spleen vs. 2–5 µg from 25 mg brain) [27]. | Tissue-specific yield data [27] |
| Incomplete tissue disaggregation or cell lysis | For tissues, use a dedicated homogenizer (e.g., gentleMACS Dissociator) or a Dounce homogenizer. For cells, visualize nuclei under a microscope before and after sonication to confirm complete lysis [27]. | Homogenization protocols [27] [28] |
| Protein degradation during lysis | Perform all steps at 4°C and use ice-cold buffers supplemented with fresh protease inhibitors [29]. | Cell lysis standards [29] |
Problem: Suboptimal Chromatin Fragmentation
The size distribution of fragmented chromatin is critical. Under-fragmentation leads to high background and poor resolution, while over-fragmentation can disrupt chromatin integrity and epitopes [27] [29].
Table 3: Troubleshooting Chromatin Fragmentation
| Problem & Cause | Optimization Strategy | Method Details |
|---|---|---|
| Under-fragmentation (Large fragments) | Enzymatic (MNase) Digestion: Increase the amount of Micrococcal nuclease or perform a digestion time course [27]. | Test a range of diluted MNase (e.g., 0, 2.5, 5, 7.5, 10 µl) on a small aliquot of nuclei. Analyze DNA on a gel to find the condition yielding 150–900 bp fragments [27]. |
| Sonication: Conduct a sonication time course. Increase power setting or duration within limits [27]. | Sonicate samples for varying durations (e.g., 1-2 min intervals). Analyze DNA fragment size on a gel after each interval [27]. | |
| Over-crosslinking: Shorten crosslinking time to the 10–30 minute range [27] [29]. | Avoid crosslinking for longer than 30 minutes, as it can make chromatin difficult to shear [29]. | |
| Over-fragmentation (Most fragments <500 bp) | Enzymatic (MNase) Digestion: Decrease the amount of MNase enzyme or reduce digestion time [27]. | Follow the same optimization protocol but aim for lower enzyme concentrations [27]. |
| Sonication: Use the minimal number of sonication cycles required. Reduce sonicator power setting [27]. | "Over-sonication... can result in excessive damage to the chromatin and lower immunoprecipitation efficiency." [27] |
Problem: High Background and Poor Signal-to-Noise Ratio
This is a central challenge in the thesis of improving ChIP-seq data. A poor signal-to-noise ratio results in low FRiP scores and difficulty distinguishing true binding events from background.
Table 4: Troubleshooting High Background
| Root Cause | Corrective Action | Thesis Application |
|---|---|---|
| Inefficient immunoprecipitation | Use ChIP-validated antibodies. Pre-clear chromatin with beads alone. Optimize antibody amount and incubation time (15 min to 16 hours) [29]. | Antibody specificity is a major factor in signal-to-noise. Always use a negative control IgG [29]. |
| Inefficient washing | Ensure wash buffers are ice-cold and the correct composition is used. Increase wash number or volume if necessary [28]. | Proper washing removes non-specifically bound DNA, directly reducing background noise. |
| Suboptimal crosslinking | Titrate formaldehyde concentration (typically 1%) and crosslinking time (e.g., 10, 20, 30 min). Excessive crosslinking can mask epitopes and increase background [29]. | "Very short or very long cross-linking time can lead to DNA loss and/or elevated background." [29] |
Advanced Protocol: ChIP-seq on Solid Tissues
Performing ChIP-seq on solid tissues presents unique challenges due to tissue heterogeneity and complex cell matrices [28]. The following optimized protocol is adapted from a recent refined method for colorectal cancer and other solid tissues [28].
Key Steps:
- Frozen Tissue Preparation: Mince the frozen tissue finely on ice using scalpel blades in a Petri dish [28].
- Homogenization: Transfer minced tissue to a Dounce grinder or gentleMACS C-tube.
- Cross-linking and Chromatin Preparation: Proceed with cross-linking the single-cell suspension. Subsequent chromatin shearing (sonication or enzymatic) must be re-optimized for the tissue type, as fixation times and tissue density significantly impact fragmentation efficiency [27] [28].
The Scientist's Toolkit: Essential Research Reagents
Table 5: Key Reagent Solutions for Histone ChIP-seq
| Reagent / Material | Critical Function | Considerations for Selection |
|---|---|---|
| ChIP-validated Antibody | Specifically binds the target histone modification for immunoprecipitation. | Must be characterized for specificity. Check ENCODE-approved antibodies. Polyclonals may offer higher signal but require controls for specificity [25] [29]. |
| Protein A/G Magnetic Beads | Solid-phase support for capturing antibody-chromatin complexes. | Choose A or G based on antibody species and isotype for optimal binding affinity [29]. |
| Micrococcal Nuclease (MNase) | Enzymatically digests chromatin to yield mononucleosomal fragments. | Requires optimization of enzyme-to-cell ratio for each cell/tissue type [27]. |
| Formaldehyde | Cross-links proteins to DNA, preserving in vivo interactions. | Use high-quality, fresh solutions. Concentration (typically 1%) and time (5-30 min) require optimization to balance shearing efficiency and epitope preservation [29]. |
| Protease Inhibitors | Prevent proteolytic degradation of histones and associated proteins during processing. | Use a broad-spectrum cocktail. Add to all buffers immediately before use and keep samples ice-cold [29]. |
| Histone Deacetylase (HDAC) Inhibitors | (e.g., Sodium Butyrate, Trichostatin A). Stabilizes acetylated histone marks during the procedure. | Particularly important for preserving labile marks like H3K27ac, especially in native protocols [17] [29]. |
Emerging Methods: CUT&Tag as an Alternative
Cleavage Under Targets & Tagmentation (CUT&Tag) is an emerging enzyme-tethering method presented as an alternative to ChIP-seq, offering a potentially higher signal-to-noise ratio and lower input requirements [17]. A recent 2025 benchmarking study in Nature Communications found that CUT&Tag recovers, on average, 54% of known ENCODE ChIP-seq peaks for H3K27ac and H3K27me3 in K562 cells [17]. The peaks identified by CUT&Tag largely represent the strongest ENCODE peaks and show the same functional and biological enrichments [17]. This suggests that for well-characterized targets, CUT&Tag can effectively capture the most biologically relevant signals with a streamlined workflow, offering a powerful tool for improving signal-to-noise, particularly in low-input or single-cell applications.
Practical Solutions: From Spike-in Normalization to Automated Analysis
Within histone ChIP-seq research, a significant challenge is the quantitative comparison of epigenetic feature abundance across different experimental conditions or samples. Standard ChIP-seq protocols, while foundational for mapping histone modifications, struggle to accurately measure differences in signal magnitude at a given locus, especially when global histone states are altered by drug treatments or cellular perturbations. The PerCell ChIP-seq method addresses this fundamental limitation by introducing a normalized approach using orthologous cellular spike-ins, thereby significantly improving the signal-to-noise ratio and enabling rigorous cross-condition and cross-species comparative epigenomics [30] [31]. This technical support center provides a detailed guide for researchers aiming to implement this advanced methodology.
Troubleshooting Guides and FAQs
Frequently Asked Questions (FAQs)
Q1: What is the core innovation of the PerCell method compared to standard ChIP-seq? PerCell incorporates cells from a closely related orthologous species (e.g., mouse cells into human samples) as an internal spike-in control at the very beginning of the workflow, prior to sonication. This is combined with a dedicated bioinformatic pipeline to normalize sequencing data, allowing for highly quantitative comparisons of histone modification abundance across samples, even those with vastly different genetic backgrounds or global epigenetic alterations [30].
Q2: Why use whole cells for spike-in instead of purified chromatin or DNA? Using well-defined ratios of whole cells, rather than calculated amounts of purified chromatin, accounts for variations throughout the entire experimental process, including sonication efficiency and immunoprecipitation. This leads to more sensitive and accurate quantification of local and global differences in histone modification abundance [30].
Q3: My spike-in read percentage is very low. What should I do?
The PerCell pipeline is designed to automatically exclude samples with spike-in reads below 0.5% of the total aligned reads, as normalization accuracy is compromised below this threshold. You can override this by setting the --override_spikeinfail true parameter, but it is better practice to optimize your cell mixing ratios. Ensure that cells are mixed at fixed, precise ratios before sonication [32].
Q4: What orthologous spike-in species are supported?
The PerCell workflow and pipeline are optimized for common pairings such as mouse-to-human and human-to-zebrafish. The pipeline also supports configurations for fly (dm6) and other combinations, provided the appropriate reference genomes are supplied [30] [32].
Troubleshooting Common Experimental Issues
The table below outlines common problems, their causes, and recommended solutions specific to the PerCell method and histone ChIP-seq.
Table 1: PerCell ChIP-seq Troubleshooting Guide
| Problem | Possible Causes | Recommendations |
|---|---|---|
| Low Signal | Excessive sonication [33], insufficient starting material [33], over-crosslinking masking epitopes [33], low antibody efficiency. | Optimize sonication to yield fragments of 200–1000 bp [33]. Use ≥5 µg chromatin per IP [34]. Reduce formaldehyde fixation time [33]. Validate antibody specificity and use 1–10 µg per IP [33]. |
| High Background | Incomplete cell lysis [34], under-fragmented chromatin [34], non-specific antibody binding, contaminated buffers. | Pre-clear lysate with protein A/G beads [33]. Prepare fresh lysis and wash buffers [33]. Optimize MNase digestion or sonication to achieve desired fragment size [34]. |
| High Variation in Spike-in Read Percentage | Inconsistent cell counting or mixing ratios, improper lysis of spike-in vs. experimental cells, sonication bias. | Standardize cell counting and mixing protocols meticulously. Mix experimental and spike-in cells at fixed ratios prior to sonication to ensure equal processing [30]. |
| Low Library Complexity | Insufficient DNA recovery from IP, leading to over-amplification by PCR [8]. | Ensure adequate starting material. Follow the ENCODE guideline that at least 80% of 10 million or more reads should map to distinct genomic locations [8]. |
Experimental Protocols and Workflows
PerCell Wet-Lab Workflow
The following diagram illustrates the key steps in the PerCell ChIP-seq experimental procedure.
Key Protocol Steps:
- Cell Mixing: The foundational step. Mix your experimental cells (e.g., human) with spike-in cells from an orthologous species (e.g., mouse) at a defined ratio (e.g., 3:1) before any further processing. This ensures both chromatin populations experience identical downstream conditions [30].
- Cross-linking and Sonication: Proceed with standard cross-linking using formaldehyde. The fixed chromatin from the mixed cell population is then fragmented by sonication. Note that the efficiency of lysis and sonication should be consistent across samples; using a Dounce homogenizer can help ensure complete lysis, especially for tissue samples [34].
- Immunoprecipitation: Use a single, validated antibody targeting your histone modification of interest. The antibody should have high specificity, as confirmed by immunoblot or other validation tests recommended by ENCODE standards [8].
- Sequencing: Prepare sequencing libraries from the immunoprecipitated DNA. The resulting sequenced reads will be a mixture derived from both the experimental and spike-in genomes.
PerCell Bioinformatic Analysis Pipeline
The accompanying computational pipeline is essential for normalization. The following diagram outlines its structure.
Pipeline Execution Summary:
To execute the pipeline, you will need a Linux/Unix environment with Nextflow and Singularity installed [32].
- Setup: Download the reference genomes for both your experimental and spike-in species (e.g., hg38 for human, mm10 for mouse) [32].
- Input: Create a sample sheet CSV file listing sample names, paths to FASTQ files, antibody information, and associated controls [32].
- Execution: Run the main pipeline script with a command like: The pipeline will then automatically perform quality control, alignment, deduplication, and calculate scaling factors based on the spike-in read count [32].
- Normalization: Using the calculated scaling factors, the pipeline randomly downsamples the experimental reads to normalize coverage across samples, which is the core of the PerCell quantitative correction [32].
- Peak Calling and Analysis: The normalized data is used for peak calling (with MACS2), reproducibility analysis (IDR for two replicates), and motif discovery, yielding quantitative comparisons of histone mark enrichment [32].
Quantitative Data and Performance
The PerCell method is benchmarked to provide consistent and efficient spike-in read incorporation, which is critical for reliable normalization.
Table 2: Performance Benchmarking of PerCell vs. Other Spike-in Methods
| Method | Spike-in Type | Typical Spike-in Read Percentage | Key Characteristics |
|---|---|---|---|
| PerCell [30] | Whole cells (orthologous) | 16%–25% (IP samples) | High consistency; uses a single antibody; enables cross-genetic background comparisons. |
| ChIP-Rx [30] | Chromatin/DNA | 4%–65% | Wide variation can necessitate heavy downsampling, effectively reducing usable read depth. |
| SAP [30] | Fixed amount of chromatin | 1%–21% | Lower and variable spike-in efficiency. |
| Active Motif [30] | Chromatin/DNA | <1%–25% | Can result in very low spike-in content, challenging normalization. |
The Scientist's Toolkit
This table lists the essential reagents and computational tools required to implement the PerCell method.
Table 3: Essential Research Reagent and Computational Solutions
| Item | Function / Explanation | Implementation in PerCell |
|---|---|---|
| Orthologous Cells | Provides the internal control chromatin for quantitative normalization. | Use closely related species (e.g., mouse for human experiments) to ensure antibody cross-reactivity [30]. |
| Validated Antibody | Binds specifically to the target histone modification (e.g., H3K27ac, H3K4me3). | A single, high-quality antibody is sufficient. Must be validated per ENCODE guidelines (e.g., immunoblot, peptide binding tests) [8]. |
| Micrococcal Nuclease (MNase) / Sonicator | Fragments chromatin to the optimal size for IP and sequencing. | Optimize digestion/sonication to yield fragments between 150–900 bp. Over-sonication can damage chromatin and reduce signal [34] [33]. |
| Protein A/G Beads | Captures the antibody-bound chromatin complex during immunoprecipitation. | Use high-quality beads to reduce non-specific binding and high background [33]. |
| PerCell Nextflow Pipeline | The dedicated bioinformatic tool for normalized analysis. | Automates alignment, spike-in calculation, normalization, and peak calling. Available on GitHub [32]. |
| Reference Genomes | Required for aligning sequenced reads to the correct species. | Provide FASTA files for both experimental (e.g., hg38.fa) and spike-in (e.g., mm10.fa) genomes [32]. |
A technical resource for researchers aiming to accurately capture global changes in histone modifications
Spike-in normalization is a powerful method for quantifying protein-DNA interactions in experiments where the overall concentration or modification level of the target protein changes significantly between samples. This approach involves adding exogenous chromatin from another species to each sample prior to immunoprecipitation, serving as an internal control that enables accurate normalization beyond standard read-depth methods [35].
This guide provides detailed protocols for implementing spike-in controlled ChIP-seq, specifically focusing on cell mixing ratios and the bioinformatic pipeline, with particular emphasis on troubleshooting common pitfalls.
Experimental Design & Wet-Lab Protocol
Determining the Necessity of Spike-in Controls
Spike-in normalization is particularly crucial when you expect massive global changes in histone modification levels. Before embarking on a full spike-in ChIP-seq experiment, confirm the necessity through these steps:
- Profile global changes of your histone modification of interest quantitatively using western blotting on acid-extracted histones [36]
- Treat cells with your experimental condition (e.g., HDAC inhibitor SAHA) versus control (e.g., DMSO) [36]
- Proceed with spike-in ChIP-seq only if you observe robust, global changes in histone modification levels that would render standard normalization insufficient [36]
Critical Reagent Solutions
Table 1: Essential Research Reagents for Spike-in ChIP-seq
| Reagent/Resource | Function/Purpose | Implementation Notes |
|---|---|---|
| Exogenous Chromatin Source | Internal control for normalization | Drosophila S2 cells commonly used for human studies [36] |
| Species-Matched Antibody | Immunoprecipitation of target epitope | Verify cross-reactivity with spike-in chromatin [35] |
| Chromatin Shearing Equipment | Fragment chromatin to appropriate size | Optimize sonication conditions for each cell type [36] |
| SPIKER Online Tool | Bioinformatics analysis | Available for spike-in ChIP-seq data normalization [36] |
Cell Mixing Ratios and Chromatin Preparation
The accuracy of spike-in normalization hinges on maintaining consistent ratios between spike-in and sample chromatin across all conditions.
Prepare spike-in chromatin from Drosophila S2 cells:
Prepare sample chromatin from your target cells:
Critical mixing ratio: For each ChIP reaction, use 5×10⁷ target cells mixed with a consistent, predetermined amount of Drosophila chromatin [36]. The absolute amount can vary by experimental setup, but consistency between samples is paramount.
Chromatin shearing and immunoprecipitation:
- Resuspend cell pellets in lysis buffers (LB1, LB2, LB3) [36]
- Sonicate with optimized conditions (e.g., 7 cycles of 30s ON/60s OFF at power setting 7 using a Misonix 3000 sonicator) [36]
- Save aliquots to measure DNA concentration and verify shearing efficiency [36]
- Perform immunoprecipitation with antibody verified for cross-reactivity [36]
Figure 1: Experimental workflow for spike-in chromatin preparation and processing
Bioinformatic Pipeline & Data Analysis
Computational Implementation of Spike-in Normalization
The bioinformatic pipeline for spike-in normalization requires careful attention to alignment strategy and normalization factor calculation to avoid common errors.
Quality Control and Read Mapping:
Calculate Normalization Factors: Different spike-in methods employ distinct normalization models, each with specific assumptions and limitations [35]:
Table 2: Comparison of Spike-in Normalization Methods
Normalization Tool/Method Normalization Model Key Limitations Examples of Misuse ChIP-Rx α = 1/NdNd = Spike-in reads Assumes linear behavior of signal to epitope abundance Inappropriate separate alignment to spike-in and target genomes [35] Bonhoure et al. Zi,k = αkγi,k + βkxi,k + εi,k Significant overlap between genomesAssumes linear behavior Spike-in reads too low for accurate quantification [35] Egan et al. Correction factors based on spike-in read counts No requirement for including inputs Missing input samples; improper alignment [35] Active Motif Kit Normalize to sample with lowest spike-in reads No use of inputs to account for variable chromatin ratio No input samples available [35] Peak Calling and Differential Analysis:
Figure 2: Bioinformatic workflow for spike-in ChIP-seq data analysis
Troubleshooting Common Issues
Q1: My spike-in read counts vary dramatically (e.g., ~10 fold) between replicates. What could be causing this?
This typically indicates inconsistent experimental techniques during chromatin mixing or preparation. To resolve:
- Standardize the chromatin mixing ratio precisely between all samples [35]
- Verify cell counting accuracy and chromatin quantification methods [36]
- Ensure consistent sonication efficiency across all samples [36]
- Confirm antibody efficiency and specificity for both target and spike-in chromatin [35] [36]
Q2: After spike-in normalization, my results don't match biological expectations. Where should I look?
This could stem from incorrect computational implementation:
- Verify you're using the appropriate normalization model for your experimental design (refer to Table 2) [35]
- Check that you've performed proper separate alignment to target and spike-in genomes, rather than a combined alignment [35]
- Ensure you're not applying spike-in normalization when global changes aren't present - this technique is specifically for conditions with massive global changes in histone modifications [35] [36]
- Visually inspect signal tracks in IGV to confirm normalized patterns match expected biology [39] [40]
Q3: How do I handle situations where my spike-in chromatin has low ChIP enrichment?
Low spike-in enrichment undermines the entire normalization approach. To address:
- Verify antibody cross-reactivity with spike-in chromatin before the main experiment [36]
- Include positive controls known to work with your spike-in chromatin
- Ensure chromatin quality from spike-in cells through proper preparation and shearing verification [36]
- Consider using a spike-in specific antibody if available for your system, though this introduces other assumptions [35]
Q4: What quality control metrics are essential for spike-in ChIP-seq?
Beyond standard ChIP-seq QC, include these spike-in specific metrics:
- Spike-in mapping rates: Should be consistent across samples [35]
- Spike-in read counts: Minimum threshold for accurate quantification (varies by genome size) [35]
- Ratio stability: Spike-in to sample read ratios should be comparable between replicates [35]
- Cross-correlation scores: Evaluate enrichment quality for both target and spike-in [39]
Key Considerations for Success
- Validate antibody efficiency for both target and spike-in chromatin before main experiment [36]
- Maintain consistent spike-in to sample chromatin ratios across all conditions and replicates [35]
- Choose appropriate normalization model based on your experimental design and antibody strategy [35]
- Always include proper controls and biological replicates to identify unexpected variation [35] [39]
- Verify that massive global changes in histone modification are present before using spike-in normalization [36]
When properly implemented, spike-in normalization enables accurate quantification of histone modifications across conditions with global changes, providing biological insights that would be obscured by standard normalization approaches.
Leveraging Fully Automated Web Platforms (H3NGST) for Streamlined, Reproducible Analysis
In histone ChIP-seq research, a poor signal-to-noise ratio manifests as high background signal, obscuring genuine histone modification enrichment and leading to irreproducible results. The H3NGST (Hybrid, High-throughput, and High-resolution NGS Toolkit) platform directly addresses this by providing a fully automated, web-based solution that standardizes the entire analytical workflow [41]. By minimizing technical variability and implementing proven best practices, H3NGST helps researchers achieve the high-quality, reproducible data essential for robust epigenetic analysis in drug development and basic research.
H3NGST Platform FAQ
What is H3NGST and how does it improve reproducibility? H3NGST is a fully automated web platform for end-to-end ChIP-seq analysis. It enhances reproducibility by eliminating manual file processing and varying software configurations, which are major sources of technical variability. The system automatically retrieves public data using BioProject IDs, performs comprehensive quality control, and executes a standardized pipeline with dynamically adjusted parameters based on your specific dataset characteristics (e.g., single-end vs. paired-end reads) [41].
What input does H3NGST require from me? The platform requires minimal input: a public BioProject, SRA, or GEO accession number; a chosen nickname for your analysis; and a few key parameters including reference genome selection, peak type (narrow for transcription factors or broad for histone modifications), and false discovery rate threshold [41].
How does H3NGST handle histone mark-specific analysis? H3NGST automatically adjusts its peak-calling algorithms based on your selection of peak type. For broad histone marks like H3K27me3, it uses appropriate algorithms capable of detecting these diffuse enrichment regions, which is crucial for accurate signal detection and reducing false negatives [41].
What output files can I expect? The platform provides comprehensive outputs including quality control reports, aligned reads in BAM format, peak calls in BED format, BigWig files for visualization, genomic annotations, and motif discovery results. All files are available for direct download in standardized formats [41].
Troubleshooting Common H3NGST Issues
Poor Signal-to-Noise Ratio in Results
- Potential Cause: Low antibody specificity or efficiency in the original experiment.
- Solution: H3NGST provides Fraction of Reads in Peaks (FRiP) scores in its quality metrics. A FRiP score below 1% indicates potential experimental issues [8]. Cross-reference your results with the ENCODE guidelines for recommended antibodies and validation methods [8].
Analysis Fails to Start or Stalls
- Potential Cause: Incorrect accession number format or server load.
- Solution: Verify your BioProject, SRA, or GEO accession number is correctly formatted. The platform stores previous nicknames locally in your browser for easy reuse. If the issue persists, check the platform's status page for updates [41].
Unexpectedly Low Number of Peaks
- Potential Cause: Inappropriate parameter selection or low sequencing depth.
- Solution: Ensure you've selected "broad peaks" for histone modifications rather than "narrow peaks." Verify that the original experiment achieved sufficient sequencing depth—typically 40-60 million reads for histone marks according to ENCODE standards [8]. Check the H3NGST trimming summary table to ensure sufficient reads survived quality control [41].
Difficulty Interpreting Genomic Annotations
- Potential Cause: Complex annotation output with multiple genomic categories.
- Solution: H3NGST categorizes peaks by genomic region and provides putative target genes. Use the platform's integrated visualization options, including direct links to the UCSC Genome Browser for exploring specific loci [41].
Essential Quality Metrics and Standards
Table 1: Key ChIP-seq Quality Metrics for Reproducible Research
| Metric | Target Value | Importance for Signal-to-Noise |
|---|---|---|
| FRiP (Fraction of Reads in Peaks) | >1% [8] | Measures enrichment; higher values indicate better signal-to-noise ratio |
| Sequencing Depth (Histone Marks) | 40-60 million reads [8] | Ensures sufficient coverage for detecting broad enrichment domains |
| Cross-correlation | Defined by ENCODE standards [8] | Assesses read distribution quality and sequencing artifacts |
| Peak Number Consistency | 75-80% overlap between replicates [8] | Indicates technical reproducibility between experimental replicates |
Table 2: Recommended Sequencing Strategies for Histone ChIP-seq
| Application | Recommended Sequencing Depth | Read Type |
|---|---|---|
| Transcription Factors | 20-30 million reads [42] | Single-end often sufficient |
| Histone Modifications | 40-60 million reads [42] | Paired-end recommended for complex genomes |
| Low Enrichment Factors | Higher depths required [42] | Paired-end beneficial |
Experimental Protocol Integration with H3NGST
Critical Wet-Lab Steps That Impact H3NGST Analysis Quality
Cell Cross-linking Optimization
- Use appropriate formaldehyde concentrations (typically 1-2%) to preserve protein-DNA interactions without excessive cross-linking that reduces DNA fragmentation efficiency [43].
- Over-cross-linking can create artifacts that persist through computational analysis.
Chromatin Shearing Standardization
- Optimize sonication conditions to achieve 200-500 bp fragments, with 250 bp being ideal for most histone marks [43].
- H3NGST's alignment and peak calling assume proper fragment sizes; deviations can reduce resolution.
Antibody Validation
Control Experiments
- Always include input DNA controls in your experimental design.
- While H3NGST can process these, proper experimental controls are essential for distinguishing true enrichment from background.
Research Reagent Solutions
Table 3: Essential Reagents for Quality Histone ChIP-seq
| Reagent Type | Specific Examples | Function & Importance |
|---|---|---|
| Validated Antibodies | H3K4me3, H3K27me3, H3K27ac [8] | Target-specific enrichment; antibody quality is the primary determinant of success |
| Cross-linking Agents | Formaldehyde [43] | Presves protein-DNA interactions; concentration must be optimized |
| Chromatin Shearing Reagents | Sonication buffers [43] | Fragment DNA to appropriate sizes; affects resolution of final data |
| DNA Size Selection Kits | SPRI beads, gel extraction kits | Isolate properly sized fragments; reduces background in sequencing |
H3NGST Workflow Integration Diagram
Data Reproducibility Framework
Metadata Reporting Standards For full reproducibility, ensure your original experiments capture and report these critical metadata elements, which complement H3NGST's computational reproducibility:
- Occurrence Data Provenance: Source, version, and download date of any publicly used data [44]
- Experimental Parameters: Antibody lots, cross-linking conditions, and fragmentation methods [43]
- Processing Information: Reference genome version and software parameters, which H3NGST automatically documents [41]
- Data Access Information: Public repository accession numbers and any reuse restrictions [45]
Leveraging H3NGST for FAIR Data Principles H3NGST supports Findable, Accessible, Interoperable, and Reusable (FAIR) data principles through:
- Standardized output formats that enable data exchange
- Comprehensive documentation of analytical parameters
- Integration with public data repositories
- Encryption of all data transmissions using SSL/TLS protocols [41]
Advanced Applications for Drug Development
For pharmaceutical researchers, H3NGST enables:
- Epigenetic Drug Screening: Rapid analysis of histone modification changes in response to HDAC inhibitors or EZH2 inhibitors [41]
- Biomarker Discovery: Identification of consistent histone modification patterns across sample cohorts
- Toxicology Studies: Assessment of epigenetic changes in response to compound treatment
By implementing these troubleshooting guidelines, quality standards, and experimental best practices through the H3NGST platform, researchers can significantly enhance the signal-to-noise ratio in histone ChIP-seq studies, leading to more reproducible and biologically meaningful results.
FAQs and Troubleshooting Guide
This technical support guide addresses common challenges researchers face when implementing double-crosslinking Chromatin Immunoprecipitation followed by sequencing (dxChIP-seq), with a focus on improving the signal-to-noise ratio in histone and transcription factor research.
Frequently Asked Questions (FAQs)
Q1: What is the primary advantage of double-crosslinking over standard formaldehyde crosslinking for ChIP-seq?
Double-crosslinking employs two different crosslinking agents to sequentially stabilize protein-protein and protein-DNA interactions. This is crucial for capturing chromatin factors, including many transcription factors and co-regulators, that do not bind DNA directly but are part of larger complexes. The protocol enhances the detection of these challenging targets and significantly improves the signal-to-noise ratio of your sequencing data [46] [47].
Q2: My chromatin fragmentation is inefficient, leading to large DNA fragments. What should I check?
Inefficient fragmentation can often be traced to over-crosslinking or using too much input material [48]. First, ensure your crosslinking time is within the 10-30 minute range [48]. Second, optimize your fragmentation method:
- For Sonication: Perform a sonication time-course experiment. With a 10-minute fixation, aim for a DNA smear where ~90% of fragments are less than 1 kb for cells, or ~60% for tissues [48].
- For Enzymatic Digestion: Titrate the amount of micrococcal nuclease. Follow an optimization protocol where you test different enzyme concentrations and analyze the resulting DNA fragment size on a gel, targeting a range of 150–900 bp [48].
Q3: I am getting a high background in my results. How can I reduce it?
High background can be mitigated by addressing several potential causes [49]:
- Pre-clear the lysate: Incubate your chromatin sample with protein A/G beads before immunoprecipitation to remove proteins that bind nonspecifically.
- Prepare fresh buffers: Contaminated lysis or wash buffers can increase background. Always use fresh, high-quality buffers.
- Reduce fragment size: Overly large chromatin fragments are a major source of background. Optimize your sonication or enzymatic digestion to achieve a fragment size of 200-1000 bp [48] [49].
Q4: My ChIP signal is low. What optimization steps can I take?
Low signal intensity can be improved through several key adjustments [49]:
- Reduce crosslinking intensity: Excessive formaldehyde crosslinking can mask antibody epitopes. Shorten the fixation time and quench the reaction effectively with glycine.
- Optimize fragmentation: Excessive sonication can destroy chromatin integrity. Use the minimal number of sonication cycles needed to achieve your desired fragment size [48].
- Increase antibody amount: Use 1–10 µg of a high-quality, validated antibody per immunoprecipitation reaction.
- Ensure complete cell lysis: Incomplete lysis will result in low chromatin yield. Verify lysis under a microscope if possible [48].
Troubleshooting Table
The table below summarizes common problems, their causes, and recommended solutions.
| Problem | Possible Causes | Recommended Solutions |
|---|---|---|
| Low Chromatin Concentration [48] | Insufficient starting material; Incomplete cell/lysis. | Accurate cell counting; Microscope to confirm nuclei lysis [48]; Increase tissue amount if yield is low (e.g., Brain: 2–5 µg/25 mg) [48]. |
| High Background [48] [49] | Large chromatin fragments; Non-specific binding; Contaminated buffers. | Optimize sonication/MNase for 200-1000 bp fragments [48] [49]; Pre-clear lysate [49]; Use fresh wash buffers [49]. |
| Low Signal [48] [49] | Epitope masking from over-crosslinking; Excessive sonication; Insufficient antibody. | Reduce formaldehyde crosslinking time [49]; Avoid over-sonication [48]; Titrate antibody (1-10 µg) [49]. |
| Over-fragmented Chromatin [48] | Excessive sonication or enzymatic digestion. | Conduct a time-course; Use minimal cycles for desired size; >80% fragments <500 bp indicates over-sonication [48]. |
The Scientist's Toolkit: Research Reagent Solutions
The following reagents are essential for the successful execution of the dxChIP-seq protocol.
| Reagent | Function in the Protocol |
|---|---|
| Double-Crosslinkers | Primary (e.g., Formaldehyde) and secondary crosslinking agents stabilize protein-DNA and protein-protein interactions, crucial for indirect binders [46]. |
| Focused Ultrasonicator | Instrument used to shear crosslinked chromatin into fragments of 200-1000 bp, optimal for immunoprecipitation and sequencing [46] [48]. |
| Protein A/G Beads | High-quality beads for immunoprecipitation, which bind the antibody-target complex to pull down the protein of interest along with its bound DNA [49]. |
| Micrococcal Nuclease (MNase) | An enzyme used as an alternative to sonication for digesting chromatin into nucleosomal fragments, requires careful titration [48]. |
| High-Specificity Antibodies | Validated antibodies against your target histone mark or transcription factor; critical for specific immunoprecipitation and low background [43] [49]. |
Experimental Workflow and Decision Pathway
dxChIP-seq Experimental Workflow
The following diagram outlines the core procedural steps for the double-crosslinking ChIP-seq protocol.
Troubleshooting Decision Pathway
When encountering suboptimal results, follow this logical pathway to identify and correct the issue.
Frequently Asked Questions (FAQs)
Q1: Why can't I use the same peak caller for both H3K27ac and H3K27me3 data? A1: The underlying chromatin biology is fundamentally different. H3K27ac marks active enhancers and promoters, producing sharp, focused peaks from a precise genomic location. H3K27me3 is a repressive mark spread over large, poorly defined genomic regions (e.g., Polycomb target genes). Using a narrow peak caller on a broad mark will fragment the signal into many small, false-positive peaks, while using a broad peak caller on a narrow mark will miss the precise localization and merge distinct regulatory elements.
Q2: My H3K27me3 peak calls have a low signal-to-noise ratio and appear fragmented. What is the most common cause?
A2: The most common cause is using an algorithm or parameters designed for narrow peaks. MACS2, for example, when run in its default mode, will incorrectly split broad domains. The primary solution is to use a peak caller with a specific broad mark mode (e.g., MACS2 with --broad flag) or a dedicated broad peak caller like SICER2 or BroadPeak.
Q3: What is the best way to assess the quality of my peak calls for these different marks? A3: For both marks, standard ChIP-seq QC metrics (NSC, RSC, FRiP) are essential. For narrow peaks (H3K27ac), the Fraction of Reads in Peaks (FRiP) should typically be >1-2%. For broad peaks (H3K27me3), a lower FRiP (e.g., 5-20%) is acceptable due to the diffuse signal. Visual inspection in a genome browser remains the gold standard to confirm the expected peak morphology.
Q4: How does sequencing depth impact peak calling for these marks? A4: Broad marks require significantly higher sequencing depth than narrow marks to achieve sufficient coverage across their extensive domains. While 20-40 million reads might suffice for H3K27ac, H3K27me3 experiments often require 40-70 million reads or more to accurately define the broad enrichment landscape.
Troubleshooting Guide
| Symptom | Possible Cause | Solution |
|---|---|---|
| Fragmented, "spiky" H3K27me3 peaks | Using a narrow peak-calling algorithm. | Switch to a broad peak caller (e.g., MACS2 --broad, SICER2). |
| Low FRiP score for H3K27me3 | Inadequate sequencing depth; poor antibody efficiency. | Sequence deeper (50M+ reads); validate antibody with a positive control. |
| Merging of distinct H3K27ac peaks | Using a broad peak caller or excessive smoothing. | Use a stringent narrow peak caller (e.g., MACS2 default) and adjust the -q/-p value cutoff. |
| High background in Input/Control | Insufficient input DNA or amplification artifacts. | Use an Input sample with >1x coverage of the ChIP sample; use a library prep kit that minimizes duplicates. |
Algorithm Comparison and Performance
Table 1: Recommended Peak-Calling Algorithms for Histone Marks
| Algorithm | Mark Type | Key Parameter(s) | Strengths | Weaknesses |
|---|---|---|---|---|
| MACS2 (default) | Narrow | -q 0.05 (FDR) |
Excellent precision for sharp peaks; widely used. | Poor performance on broad domains. |
MACS2 (--broad) |
Broad | --broad, --broad-cutoff 0.1 |
Good balance of sensitivity/specificity for broad marks. | Can be less sensitive than dedicated broad peak callers. |
| SICER2 | Broad | -w 200 (window size), -g 3 (gap size) |
Robust to noise; effectively identifies large domains. | More complex parameter tuning required. |
| HMMRATAC | Narrow/Open Chromatin | --min-length 1000 |
Uses ATAC-seq signal; good for nucleosome positioning. | Specific to ATAC-seq data, not direct ChIP-seq. |
Table 2: Typical Experimental and QC Metrics
| Metric | H3K27ac (Narrow) | H3K27me3 (Broad) |
|---|---|---|
| Recommended Sequencing Depth | 20-40 million reads | 40-70 million reads |
| Expected FRiP Score | 1-5% | 5-30% |
| Peak Width (typical) | 500 - 2,000 bp | 5,000 - 100,000 bp |
| Key QC Metric | Sharp, high-intensity peaks in browser. | Large, contiguous enriched regions in browser. |
Experimental Protocol: Cross-linked ChIP-seq for H3K27ac and H3K27me3
- Cell Fixation: Cross-link cells with 1% formaldehyde for 10 minutes at room temperature. Quench with 125mM glycine.
- Cell Lysis and Sonication: Lyse cells and sonicate chromatin to shear DNA to an average fragment size of 200-500 bp. Verify fragment size by agarose gel electrophoresis.
- Immunoprecipitation: Incubate clarified lysate with:
- H3K27ac: 2-5 µg of anti-H3K27ac antibody (e.g., Diagenode C15410196).
- H3K27me3: 2-5 µg of anti-H3K27me3 antibody (e.g., Cell Signaling Technology 9733).
- Use Protein A/G magnetic beads for antibody capture.
- Washes & Elution: Wash beads stringently with high-salt and LiCl buffers. Elute chromatin complexes and reverse cross-links by incubating at 65°C with high salt.
- DNA Purification: Purify DNA using a PCR purification kit (e.g., Qiagen MinElute).
- Library Preparation & Sequencing: Construct sequencing libraries from the purified DNA using a kit (e.g., NEBNext Ultra II DNA Library Prep) and sequence on an Illumina platform to the recommended depth.
Workflow Diagram
Title: ChIP-seq Peak Calling Workflow
The Scientist's Toolkit
Table 3: Essential Research Reagents and Materials
| Item | Function | Example |
|---|---|---|
| Anti-H3K27ac Antibody | Immunoprecipitates the active histone mark. | Diagenode C15410196 |
| Anti-H3K27me3 Antibody | Immunoprecipitates the repressive histone mark. | Cell Signaling Technology 9733 |
| Protein A/G Magnetic Beads | Efficient capture of antibody-chromatin complexes. | Thermo Fisher Scientific 10002D / 10004D |
| Formaldehyde | Crosslinks proteins to DNA to preserve in vivo interactions. | Thermo Fisher Scientific 28906 |
| Sonication Device | Shears cross-linked chromatin into small fragments. | Covaris S220 |
| DNA Library Prep Kit | Prepares immunoprecipitated DNA for sequencing. | NEBNext Ultra II DNA Library Prep (NEB #E7645) |
| DNA Purification Kit | Purifies DNA after elution and reverse cross-linking. | Qiagen MinElute PCR Purification Kit (28004) |
Troubleshooting Guide: Optimizing Your ChIP-seq Protocol from Bench to Bioinformatics
Optimizing Cross-linking Conditions and Chromatin Fragmentation for Maximum Efficiency
A technical guide to enhancing signal-to-noise ratio in histone ChIP-seq research
This technical support center provides targeted troubleshooting guides and FAQs to help researchers overcome common challenges in chromatin immunoprecipitation followed by sequencing (ChIP-seq), specifically framed within the context of improving the signal-to-noise ratio for histone modification studies. The following sections address specific experimental hurdles and provide optimized protocols to ensure high-quality, reproducible data.
Troubleshooting Common ChIP-seq Challenges
Chromatin Fragmentation and Quality Control
Problem: Chromatin is under-fragmented (fragments too large)
- Possible Causes: Over-crosslinking, insufficient sonication power or time, too much input material per sonication, or insufficient micrococcal nuclease [50] [51].
- Recommendations:
- For sonication: Perform a sonication time course, increase sonication power, or reduce the amount of cells/tissue per sonication volume [50].
- For enzymatic fragmentation: Increase the amount of micrococcal nuclease or extend digestion time [50].
- Reduce crosslinking time within the 10-30 minute range [50] [52].
Problem: Chromatin is over-fragmented
- Possible Causes: Excessive sonication cycles or power, over-digestion with micrococcal nuclease, or insufficient crosslinking [50] [51].
- Recommendations:
- For sonication: Use the minimum number of sonication cycles that produce the desired 200-1000 bp fragment size [50] [52].
- For enzymatic digestion: Reduce the amount of micrococcal nuclease or decrease digestion time. If only a single band around 150 bp (mono-nucleosome) appears, add less nuclease or increase cell/tissue amount [52].
- Over-sonication can denature chromatin and disrupt antibody epitopes, diminishing signal, especially for amplicons >150 bp [50].
Problem: Low chromatin concentration
- Possible Causes: Insufficient cells or tissue, incomplete cell/tissue lysis, or chromatin degradation [50] [51].
- Recommendations:
- Accurately count cells before cross-linking [50].
- Visually confirm complete nuclear lysis under a microscope (for enzymatic protocols) [50].
- Keep samples on ice between sonication steps to prevent degradation [51].
- If concentration is slightly low (close to 50 µg/ml), add more chromatin to reach at least 5 µg per IP [50].
Problem: Foaming during sonication
- Possible Causes: High sonication power, excessive detergent (SDS), or sample volume too large [53] [51].
- Recommendations:
Cross-linking Optimization
Problem: Too much or too little cross-linking
- Effects of Under-cross-linking: Prevents proper disassociation of protein-DNA complexes, resulting in poor yield [51].
- Effects of Over-cross-linking: Masks epitope sites, prevents proper chromatin shearing, and inhibits successful un-cross-linking [51].
- Optimization Strategy:
- For transcription factor ChIP in tissues, increasing crosslinking time from 10 to 30 minutes can improve enrichment, though it may increase fragment size [52].
- Determine optimal conditions by testing DNA recovery after de-cross-linking: over-crosslinked chromatin yields little DNA after de-cross-linking, while under-crosslinked chromatin yields abundant DNA without de-cross-linking [53].
Immunoprecipitation and PCR Issues
Problem: High background in no antibody control
- Possible Causes: Insufficient wash stringency, improper chromatin shearing, too much antibody, or excess template DNA [51].
- Recommendations: Keep IP buffers cold, increase wash stringency, optimize antibody amount, and ensure proper chromatin fragmentation [51].
Problem: No PCR amplification
- Possible Causes: Insufficient antibody, poorly designed primers, incompatible thermal cycler protocol, or insufficient template DNA [51].
- Recommendations: Use ChIP-validated antibodies, verify primer design, optimize thermal cycler protocol, and increase template DNA [51].
Expected Chromatin Yields and Fragmentation Standards
Tissue-Specific Chromatin Yield Expectations
The table below provides expected total chromatin yield and DNA concentration from 25 mg of various tissue types or 4 x 10⁶ HeLa cells, based on SimpleChIP kit performance data [50].
| Tissue / Cell Type | Total Chromatin Yield (per 25 mg tissue) | Expected DNA Concentration |
|---|---|---|
| Spleen | 20–30 µg | 200–300 µg/ml |
| Liver | 10–15 µg | 100–150 µg/ml |
| Kidney | 8–10 µg | 80–100 µg/ml |
| Brain | 2–5 µg | 20–50 µg/ml |
| Heart | 2–5 µg | 20–50 µg/ml |
| HeLa Cells | 10–15 µg (per 4 x 10⁶ cells) | 100–150 µg/ml |
Ideal Chromatin Fragment Profiles
The diagram below illustrates the optimal chromatin fragmentation patterns for ChIP-seq experiments.
Optimization Protocols for Maximum Efficiency
Protocol 1: Determining Optimal Micrococcal Nuclease Digestion
This protocol systematically determines the optimal MNase digestion conditions for specific tissue or cell types [50].
- Prepare cross-linked nuclei from 125 mg of tissue or 2 x 10⁷ cells (equivalent to 5 IP preps)
- Transfer 100 µl of the nuclei preparation into 5 individual 1.5 ml microcentrifuge tubes on ice
- Prepare diluted MNase: Add 3 µl micrococcal nuclease stock to 27 µl of 1X Buffer B + DTT (1:10 dilution)
- Add varying MNase volumes to the 5 tubes: 0 µl, 2.5 µl, 5 µl, 7.5 µl, or 10 µl of the diluted enzyme
- Incubate for 20 minutes at 37°C with frequent mixing
- Stop digestion by adding 10 µl of 0.5 M EDTA and placing tubes on ice
- Pellet nuclei by centrifugation at 13,000 rpm for 1 minute at 4°C, remove supernatant
- Resuspend nuclear pellet in 200 µl of 1X ChIP buffer + protease inhibitor cocktail (PIC)
- Lyse nuclei with several sonication pulses (observe lysis under microscope)
- Clarify lysates by centrifugation at 10,000 rpm for 10 minutes at 4°C
- Process samples for DNA extraction and analyze fragment size on 1% agarose gel
- Select optimal conditions that produce DNA fragments of 150-900 bp
Calculation: The volume of diluted MNase producing ideal fragmentation in this protocol is equivalent to 10 times the volume of stock MNase needed for one IP preparation. Example: If 5 µl of diluted MNase works best, use 0.5 µl of stock MNase per IP [50].
Protocol 2: Determining Optimal Sonication Conditions
This protocol establishes optimal sonication parameters for specific tissue or cell types [50].
- Prepare cross-linked nuclei from 100-150 mg of tissue or 1-2 x 10⁷ cells
- Resuspend nuclear pellet in 1 ml ChIP Sonication Nuclear Lysis Buffer per 100-150 mg tissue
- Perform sonication time-course: Fragment chromatin and remove 50 µl samples after varying durations (e.g., after each 1-2 minutes of sonication)
- Clarify chromatin samples by centrifugation at 21,000 x g for 10 minutes at 4°C
- Transfer supernatants to new tubes and add:
- 100 µl nuclease-free water
- 6 µl 5 M NaCl
- 2 µl RNase A
- Incubate at 37°C for 30 minutes
- Add 2 µl Proteinase K to each sample and incubate at 65°C for 2 hours
- Analyze DNA fragment size by electrophoresis on 1% agarose gel
- Select sonication conditions that generate optimal DNA fragment size
Note: Use minimal sonication cycles needed. Over-sonication (>80% fragments <500 bp) damages chromatin and reduces IP efficiency [50].
Protocol 3: Double-Crosslinking for Challenging Chromatin Targets
The dxChIP-seq protocol uses dual crosslinking to improve mapping of chromatin factors, including those not directly bound to DNA, while enhancing signal-to-noise ratio [47].
Key Steps:
- Double-crosslinking to capture both directly and indirectly DNA-bound proteins
- Chromatin extraction and focused ultrasonication
- Immunoprecipitation and DNA purification
- Library preparation, sequencing, and data processing with appropriate normalization strategies
This approach is particularly valuable for transcription factors and cofactors that interact with DNA indirectly or transiently.
Chromatin Immunoprecipitation FAQs
Q: What is the key difference between sonication- and enzymatic-based chromatin fragmentation? A: Sonication uses acoustic energy to shear chromatin and works well for histones and histone modifications, but over-sonication can damage chromatin and displace bound transcription factors. Enzymatic digestion uses micrococcal nuclease to cut linker DNA between nucleosomes, gently fragmenting chromatin while preserving protein-DNA interactions, making it more suitable for transcription factors and cofactors [52].
Q: How much chromatin is needed per immunoprecipitation (IP)? A: For all protein targets, start with 4x10⁶ cells or 25 mg of tissue sample per IP, typically translating to 10-20 µg of chromatin. For histone IPs specifically, as little as 1x10⁶ cell equivalents (2.5-5 µg chromatin) may suffice [52].
Q: Why is brief sonication still needed when using micrococcal nuclease for chromatin digestion? A: Incubation with buffers only permeabilizes formaldehyde cross-linked cells, allowing MNase to enter and digest chromatin. Brief sonication is required to release the fragmented chromatin into solution but does not further fragment the chromatin [52].
Q: How does crosslinking time affect sonication-based fragmentation? A: Increasing crosslinking time from 10 to 30 minutes can increase enrichment of chromatin-bound transcription factors and cofactors in tissues, though it may increase chromatin fragment size. With 10-minute fixation, approximately 60% of fragments are <1 kb for tissues; with 30-minute fixation, only about 30% are <1 kb [50] [52].
Q: What are the advantages of magnetic beads versus agarose beads for ChIP? A: Magnetic beads are easier to use, allow more complete washing, and are essential for ChIP-seq as they aren't DNA-blocked (carryover blocking DNA would contaminate sequencing). Agarose beads are traditional but blocked with salmon sperm DNA, which can interfere with sequencing [52].
The Scientist's Toolkit: Essential Research Reagents
| Reagent / Material | Function in ChIP-seq | Application Notes |
|---|---|---|
| Formaldehyde | Crosslinks proteins to DNA, preserving in vivo protein-DNA interactions | Freshly prepared paraformaldehyde recommended; concentration and incubation time require optimization [53] [51] |
| Micrococcal Nuclease (MNase) | Enzymatically digests chromatin at linker regions, preserving nucleosomes | Ideal for generating mono- to penta-nucleosome fragments (150-1000 bp); requires titration for different tissues [50] [52] |
| Protein G Magnetic Beads | Capture antibody-chromatin complexes during immunoprecipitation | Preferred for ChIP-seq; no DNA blocking agent reduces sequencing contamination [52] |
| Protease Inhibitor Cocktail (PIC) | Prevents protein degradation during chromatin preparation | Essential for preserving chromatin integrity, especially in tissues with high proteolytic activity [28] [53] |
| Dounce Homogenizer | Tissue disruption and homogenization while preserving nuclear integrity | Recommended for all tissue types in sonication protocols; essential for brain tissue [28] [50] |
| gentleMACS Dissociator | Semi-automated tissue homogenization system | Provides consistent disruption for many tissues; pre-configured programs available [28] |
| ChIP-Validated Antibodies | Target-specific immunoprecipitation of histone modifications | Critical for success; verify ChIP validation status as Western blot performance doesn't guarantee ChIP efficacy [53] [52] |
| Double-Crosslinking Reagents | Enhance preservation of indirect protein-DNA interactions | Improve mapping of chromatin factors that don't bind DNA directly [47] |
The experimental workflow for optimizing ChIP-seq conditions involves systematic testing of key parameters to achieve high-quality results, as shown below.
Key Optimization Principles for Enhanced Signal-to-Noise Ratio
Tissue-Specific Optimization is Critical: Chromatin yield varies significantly between tissue types (e.g., spleen yields 20-30 µg/25 mg vs. brain yielding 2-5 µg/25 mg) [50]. Adjust starting material accordingly.
Crosslinking-Fragmentation Balance: Achieve the delicate balance where sufficient crosslinking preserves protein-DNA interactions without impeding fragmentation [53] [51]. Test crosslinking times between 10-30 minutes for your specific tissue.
Antibody Quality and Specificity: Use ChIP-validated antibodies whenever possible [53] [52]. For non-validated antibodies, test 0.5-5 µg per IP reaction and verify specificity through Western blot when possible.
Method Selection Based on Target: For histone modifications, both sonication and enzymatic fragmentation work well. For transcription factors and cofactors, enzymatic fragmentation typically provides better results by preserving protein-DNA interactions [52].
Consider Advanced Approaches: For challenging targets, particularly factors that don't bind DNA directly, double-crosslinking methods (dxChIP-seq) can significantly improve detection and signal-to-noise ratio [47].
Addressing Low Library Complexity and High PCR Duplication Rates
FAQs on Library Complexity and Duplicates
What are "good" vs. "bad" duplicates in ChIP-seq?
In ChIP-seq data, duplicates fall into two main categories:
- Natural Duplicates ("Good"): These represent independent DNA fragments originating from the same genomic location and are considered true biological signals. They are highly enriched in peak regions. [54]
- PCR Duplicates ("Bad"): These are artifacts generated during the Polymerase Chain Reaction (PCR) amplification step of library preparation. They are identical copies of the same original DNA fragment. [54]
The key challenge is that standard sequencing methods cannot distinguish between these two types after alignment, as both map to the same genomic position. [54]
My sequencing depth is high. If I remove all duplicates, am I wasting data?
Not necessarily. The primary goal of deeper sequencing is to detect more true binding events, including less abundant peaks. While removing all duplicates does discard some true signals, it is crucial for minimizing false positives caused by PCR artifacts. [55] The balance between sensitivity and specificity depends on your experimental goals. Allowing some duplicates or using advanced methods like UMIs can help retain more true signal. [54] [55]
Why do my duplicate rates vary between samples, even with the same protocol?
Duplicate rate is a direct reflection of library complexity, which is influenced by many factors, including: [55]
- Antibody quality and specificity: A highly specific antibody leads to a more concentrated set of fragments, increasing the chance of duplicates.
- Starting material amount: Low input amounts require more PCR amplification, leading to higher duplicate rates. [54]
- Immunoprecipitation (IP) efficiency: Low IP efficiency yields less DNA, also necessitating more PCR cycles. [54]
- Cell viability and crosslinking efficiency. [55]
Therefore, some variation between samples is expected. A sample with a lower duplicate rate does not automatically indicate better quality, as it could also be a sign of high background noise. [55]
How should I handle duplicates for paired-end vs. single-end data?
- Paired-End Data: Provides more information, as both ends of the DNA fragment are sequenced. Duplicates are only declared if both pairs map to the identical locations and strands. This offers higher confidence in identifying true duplicates. [54] [55] The fragment size is directly determined from the aligned read pairs, so no additional parameters are typically needed for peak callers like MACS2. [55]
- Single-End Data: Has a higher rate of overestimating duplicates because reads from different-sized fragments can map to the same start position and strand, falsely appearing identical. [54]
Troubleshooting Guide: Causes and Solutions
Problem: High Duplication Rate and Low Library Complexity
| Symptom | Potential Causes | Recommended Solutions |
|---|---|---|
| High duplicate rates (>50-60%) in FastQC or Picard [55] | 1. Excessive PCR Amplification: Due to low IP efficiency or insufficient starting material. [54]2. Low Library Complexity: From over-amplification of a limited set of fragments. | Wet-Lab: Optimize ChIP protocol for better yield; use unique molecular identifiers (UMIs) to accurately identify PCR duplicates. [54] [55]Bioinformatics: Analyze a saturation curve to determine optimal sequencing depth; use peak callers that can model and handle duplicates (e.g., --keep-dup auto in MACS2). [55] |
| Variable duplicate rates between replicates | 1. Technical Variability: Differences in IP efficiency, cell viability, or crosslinking between samples. [55]2. Antibody Lot Variability. | Wet-Lab: Standardize protocols meticulously; use high-quality, validated antibodies.Bioinformatics: Do not normalize by subsampling reads; use specialized differential analysis tools (e.g., edgeR, DESeq2) that account for library size differences. [56] |
| Low Fraction of Reads in Peaks (FRiP) score | 1. High Background Noise: Non-specific immunoprecipitation.2. Poor Antibody Specificity.3. Over-removal of true signal reads. | Wet-Lab: Include HDAC inhibitors (e.g., Trichostatin A) for unstable marks like H3K27ac (note: one study found this did not consistently improve CUT&Tag data [17]).Bioinformatics: Filter out reads in low-complexity/blacklisted regions to improve signal-to-noise. [57] Use genome browser visualization to confirm peak quality. [55] [56] |
Problem: Optimizing Peak Calling with Duplicates
| Scenario | Challenge | Recommended Strategy & MACS2 Parameters |
|---|---|---|
| Transcription Factor (Narrow Marks) | High enrichment at specific sites leads to many true "natural duplicates." Aggressive removal can underestimate signal and miss weak peaks. [54] | Test different --keep-dup values. Start with --keep-dup 1 (default, removes all), then try --keep-dup all or --keep-dup auto (lets MACS2 model duplicates). Compare peak sets and quality metrics. [55] [58] |
| Histone Marks (Broad Marks) | Peaks are wider, so duplicate rate is naturally lower and removal has less impact. [54] | The default --keep-dup 1 is often sufficient. The primary focus should be on achieving sufficient sequencing depth for broad regions. |
| Very High Sequencing Depth | A large proportion of reads are duplicates. The cost of sequencing may not yield many new peaks. | Perform a saturation analysis: call peaks on subsets of your data (e.g., 10M, 20M, 30M reads) to see when new peak discovery plateaus. [55] |
The Scientist's Toolkit: Essential Reagents and Tools
| Item | Function | Application Note |
|---|---|---|
| Picard Tools | A set of command-line tools for handling sequencing data. Its MarkDuplicates command is the standard for identifying duplicate reads in BAM files. [56] [57] |
Used after read alignment. It marks duplicate reads, which can then be handled by downstream peak callers. |
| MACS2 (Peak Caller) | A widely used software for identifying enriched regions in ChIP-seq data. It has built-in options for handling duplicates. [58] | The --keep-dup parameter is critical for controlling how marked duplicates are treated during peak calling. [55] |
| Unique Molecular Identifiers (UMIs) | Short random nucleotide barcodes added to each DNA fragment during library preparation before PCR. [54] | Allows for precise discrimination between PCR duplicates (same UMI) and natural duplicates (different UMIs), enabling accurate deduplication. [54] [55] |
| HDAC Inhibitors (e.g., TSA) | Chemicals that inhibit histone deacetylase activity, helping to preserve unstable histone acetylation marks like H3K27ac during native protocols. [17] | Note: A 2025 benchmarking study found that adding TSA to H3K27ac CUT&Tag protocols did not consistently improve peak detection or signal-to-noise ratio. [17] |
| RepeatMasker / RepeatSoaker | Tools for identifying and filtering out reads that map to low-complexity or repetitive regions of the genome. [57] | Removing these reads reduces alignment artifacts and false positives, strengthening the downstream biological signal. [57] |
Experimental Workflow for Diagnosis and Resolution
The following diagram outlines a logical pathway for diagnosing and addressing high duplication rates in your ChIP-seq analysis.
ChIP-seq Duplicate Analysis Workflow
Advanced Methodologies: Cross-Technology Comparison
Emerging techniques like CUT&Tag are presented as alternatives with potentially superior performance characteristics. A 2025 benchmarking study compared CUT&Tag to traditional ChIP-seq for profiling histone modifications like H3K27ac and H3K27me3. [17]
- Recall: CUT&Tag recovered an average of 54% of known ENCODE ChIP-seq peaks for H3K27ac and H3K27me3, with these peaks representing the strongest ENCODE signals. [17]
- Precision: The identified peaks showed the same functional and biological enrichments as ChIP-seq peaks. [17]
- Sensitivity and Noise: Another 2025 study confirmed that CUT&Tag stands out for its comparatively higher signal-to-noise ratio than ChIP-seq. [59]
However, the same study notes that CUT&Tag can exhibit bias toward accessible chromatin. Therefore, the choice between ChIP-seq and CUT&Tag should be tailored to the specific biological question and protein target. [59]
In histone ChIP-seq research, achieving a high signal-to-noise ratio is paramount for accurately identifying biologically significant enrichment patterns. Key quality control (QC) metrics serve as crucial indicators of experimental success, reflecting everything from library preparation efficiency to the specificity of the immunoprecipitation. This guide details the interpretation and troubleshooting of four essential metrics—FRiP Score, NRF, PBC1, and PBC2—providing a framework to diagnose and rectify common issues in your experiments, thereby improving the reliability of your data.
Frequently Asked Questions (FAQs)
Q1: What do FRiP, NRF, PBC1, and PBC2 measure in a ChIP-seq experiment? These metrics evaluate different aspects of your ChIP-seq library and data quality [60] [61]:
- FRiP (Fraction of Reads in Peaks): Measures the enrichment and signal-to-noise ratio. It is the fraction of all mapped reads that fall within the called peak regions.
- NRF (Non-Redundant Fraction): An initial measure of library complexity, calculated as the number of distinct, uniquely mapped reads divided by the total number of reads.
- PBC (PCR Bottlenecking Coefficients): Evaluate library complexity based on the distribution of reads across genomic locations. PBC1 is the ratio of genomic locations with exactly one unique read to those with at least one. PBC2 is the ratio of genomic locations with exactly one unique read to those with two or more.
Q2: What are the recommended thresholds for these QC metrics? The ENCODE Consortium provides the following standards for ChIP-seq data [60] [61]:
Table: ENCODE Standards for ChIP-seq QC Metrics
| Metric | Preferred | Acceptable | Cause for Concern |
|---|---|---|---|
| NRF | > 0.9 | - | < 0.9 [60] |
| PBC1 | > 0.9 | - | < 0.9 [60] |
| PBC2 | > 10 | - | < 10 [60] |
| FRiP | Varies by target | - | Low score audit [61] |
Q3: My FRiP score is low. What are the most likely causes and solutions? A low FRiP score indicates poor enrichment or a high background. Key causes and fixes include [62]:
- Inefficient Immunoprecipitation: This is the most common cause.
- Suboptimal Peak Calling:
- Troubleshoot: Be aware that FRiP is highly dependent on the set of peaks used for calculation [62]. If using a pre-defined peak set, ensure it is appropriate for your cell type or condition. For project-specific peaks, ensure sufficient sequencing depth to call peaks robustly.
- Over-fixation: Excessive crosslinking can mask epitopes and reduce accessibility.
Q4: My PBC1 and PBC2 scores indicate low complexity. What does this mean and how can I fix it? Low PBC scores (PBC1 < 0.9, PBC2 < 10) indicate "bottlenecking," where your library is dominated by a small number of original DNA fragments due to over-amplification by PCR [60] [61].
- Diagnose: This problem originates early in the workflow, during library construction.
- Troubleshoot:
- Use More Starting Material: Increase the number of cells or amount of chromatin used for the immunoprecipitation to capture a more diverse set of fragments.
- Reduce PCR Cycles: Monitor the amplification reaction with qPCR and use the minimum number of cycles necessary for library generation to prevent over-amplification.
- Optimize Purification Steps: Avoid excessive loss of material during DNA clean-up steps after immunoprecipitation and adapter ligation.
Q5: How are these QC metrics calculated in standard processing pipelines?
- NRF, PBC1, PBC2: These are typically calculated from the aligned BAM file by analyzing the distribution of reads across genomic locations [60].
- FRiP Score: The calculation requires an aligned BAM file and a BED file of called peaks. The number of reads intersecting the peaks is divided by the total mapped reads. This can be done with tools like
bedtools intersectorfeatureCounts[64] [65]. Note that for paired-end data,featureCountscounts fragments, whilebedtoolscounts reads, leading to slightly different absolute values but similar conclusions [65].
Troubleshooting Guide: From Problem to Solution
Table: Diagnostic and Corrective Actions for Common QC Problems
| Problem Symptom | Likely Interpretation | Corrective Actions |
|---|---|---|
| Low FRiP Score | Poor enrichment; high background noise. | 1. Titrate antibody and validate for your biosample [61].2. Optimize crosslinking time/temperature [63].3. Verify input control matches experiment in read length and type [60]. |
| Low NRF, PBC1, PBC2 | Low library complexity due to PCR over-amplification or insufficient starting material. | 1. Increase input chromatin for IP.2. Reduce the number of PCR cycles during library amplification.3. Check for sample degradation before library prep. |
| All metrics failing | A fundamental issue with the sample or core protocol. | 1. Audit sample quality (e.g., viability, fragmentation).2. Systematically review protocol including reagent freshness and equipment calibration. |
Best Practices for Reliable QC
- Benchmark Against Standards: Always compare your metrics to established standards, like those from the ENCODE Consortium, to contextualize your experiment's quality [60].
- Use Controls Rigorously: Include a matching input control and, if possible, a positive control (e.g., a known antibody with a robust ChIP-seq profile) to validate your entire workflow [60] [61].
- Monitor Metrics in Tandem: Do not rely on a single metric. For example, a good FRiP score with poor PBC scores suggests the analysis may be biased by amplification artifacts.
The Scientist's Toolkit
Table: Key Research Reagents and Resources
| Item | Function / Description | Example / Source |
|---|---|---|
| Validated Antibodies | Primary antibody for specific histone modification immunoprecipitation | Cell Signaling Technology, Abcam [63] |
| Methanol-free Formaldehyde | Standard reagent for protein-DNA crosslinking. | Thermo Scientific (16% w/v) [63] |
| DSG (Disuccinimidyl Glutarate) | Homobifunctional crosslinker for stabilizing protein complexes in dxChIP-seq. | Thermo Scientific [63] |
| Protein G Dynabeads | Magnetic beads for antibody-bound chromatin complex retrieval. | Fisher Scientific [63] |
| Protease/Phosphatase Inhibitors | Cocktails to preserve protein integrity and modifications during extraction. | Roche, Sigma-Aldrich [63] |
| Spike-in Antibody & Chromatin | External control for normalization, accounting for technical variation. | Active Motif [63] |
| ChIP-seq Data Standards | Definitive reference for experimental guidelines and QC thresholds. | ENCODE Consortium [60] |
Experimental Workflow and Metric Relationships
The following diagram illustrates a generalized histone ChIP-seq workflow, highlighting the stages where key QC metrics are most relevant and how they interrelate in assessing data quality.
What are the ENCODE standards for sequencing depth in histone ChIP-seq?
The ENCODE Consortium has established distinct sequencing depth standards for histone ChIP-seq experiments based on whether the target is a broad histone mark or a narrow histone mark. Adhering to these guidelines is critical for achieving sufficient signal-to-noise ratio and ensuring data reproducibility [25] [66].
The table below summarizes the current ENCODE standards for sequencing depth.
| Histone Mark Type | Minimum Usable Fragments per Replicate | Recommended Usable Fragments per Replicate |
|---|---|---|
| Broad Marks (e.g., H3K27me3, H3K36me3) | 20 million [25] | 45 million [25] [66] |
| Narrow Marks (e.g., H3K27ac, H3K4me3) | 10 million [25] | 20 million [25] [66] |
Classification of Common Histone Marks
| Broad Marks | Narrow Marks | Exceptions |
|---|---|---|
| H3F3A, H3K27me3, H3K36me3, H3K4me1, H3K79me2, H3K79me3, H3K9me1, H3K9me2, H4K20me1 [25] [66] | H2AFZ, H3ac, H3K27ac, H3K4me2, H3K4me3, H3K9ac [25] [66] | H3K9me3 is a special case. As it is enriched in repetitive regions, tissues and primary cells require 45 million total mapped reads per replicate [25] [66]. |
These requirements are based on the fundamental differences in how these proteins associate with DNA. Broad marks, like H3K27me3, often cover large chromatin domains, necessitating deeper sequencing to capture their full extent reliably. In contrast, narrow marks, such as H3K4me3, produce punctate signals that are typically easier to capture with fewer reads [25].
Why do sequencing depth requirements differ for broad and narrow marks?
The differential requirements are due to the distinct genomic binding patterns of these protein classes, which directly impact the statistical power needed for confident peak detection.
- Broad Marks Cover Large Domains: Marks like H3K27me3 are associated with extensive genomic regions, sometimes spanning entire gene bodies. Deeper sequencing is required to distinguish the consistent, yet often low-level, enrichment of these broad domains from background noise across their entire length [67].
- Narrow Marks Have Focal Signals: Marks like H3K27ac and H3K4me3 are typically found at specific, short genomic locations such as active enhancers and promoters. Their sharp, high-intensity signals are more easily discerned from background, requiring comparatively less sequencing depth for confident identification [25] [67].
The following diagram illustrates the decision-making workflow for determining the appropriate sequencing depth based on your experimental target.
How can I troubleshoot a low signal-to-noise ratio in my data?
A low signal-to-noise ratio can stem from various issues in the experimental workflow. Below is a troubleshooting guide for common problems.
| Problem | Possible Causes | Recommendations |
|---|---|---|
| High Background | Non-specific antibody binding or contaminated buffers [68]. | Pre-clear lysate with protein A/G beads. Use fresh, high-quality lysis and wash buffers [68]. |
| Low Signal | Excessive sonication, insufficient starting material, or over-crosslinking [69] [68]. | Optimize sonication to yield fragments of 200-1000 bp. Ensure use of 5-10 µg chromatin per IP [69]. Reduce formaldehyde fixation time [68]. |
| Poor Resolution | Under-fragmented chromatin, resulting in large DNA fragments [69]. | Perform a sonication or enzymatic digestion time-course to achieve optimal DNA fragment size (150-900 bp) [69]. |
| Low Sequencing Depth | Inadequate number of sequenced fragments per replicate. | Verify that the total number of usable fragments meets or exceeds the ENCODE minimum standards for your target mark (see Table 1) [25] [66]. |
What is the detailed protocol for optimizing chromatin fragmentation?
Proper chromatin fragmentation is crucial for resolution and immunoprecipitation efficiency. Here are two standardized optimization protocols.
- Prepare Cross-linked Nuclei: From 125 mg of tissue or 2 x 10⁷ cells.
- Set Up Digestion Series: Aliquot 100 µl of nuclei preparation into 5 tubes.
- Titrate Enzyme: Add a dilution series of Micrococcal Nuclease (e.g., 0, 2.5, 5, 7.5, 10 µl) to each tube.
- Digest and Incubate: Incubate for 20 minutes at 37°C with frequent mixing.
- Stop Reaction: Add EDTA to a final concentration of 20 mM and place on ice.
- Analyze Fragment Size: Purify DNA and run on a 1% agarose gel. The optimal condition produces a DNA smear between 150–900 base pairs (1–6 nucleosomes).
- Prepare Cross-linked Nuclei: From 100–150 mg of tissue or 1x10⁷–2x10⁷ cells per 1 ml lysis buffer.
- Perform Sonication Time-Course: Subject chromatin to sonication, removing 50 µl samples after different durations (e.g., every 1-2 minutes).
- Clarify and Analyze: Centrifuge samples and purify DNA. Determine fragment size by gel electrophoresis.
- Determine Optimal Setting: Choose the minimal sonication required to achieve the desired fragmentation. Over-sonication (>80% fragments <500 bp) can damage chromatin and reduce IP efficiency [69].
What other quality control metrics does ENCODE require?
Beyond sequencing depth, the ENCODE Consortium mandates several other quality controls to ensure data integrity [25] [66] [67].
- Biological Replicates: Experiments should have two or more biological replicates [25] [66].
- Input Controls: Each ChIP-seq experiment requires a corresponding input control with matching replicate structure and sequencing parameters [25] [66].
- Library Complexity: This is measured to assess PCR bottlenecks and is indicated by:
- Antibody Validation: Antibodies must be rigorously characterized for specificity using immunoblot analysis or immunofluorescence, as per ENCODE guidelines [67].
- Replicate Concordance: Reproducibility is often measured by the Irreproducible Discovery Rate (IDR). Processed IDR-thresholded peaks should ideally have both rescue and self-consistency ratios below 2 [66].
The Scientist's Toolkit: Essential Reagents and Materials
| Item | Function | Considerations & Examples |
|---|---|---|
| Validated Antibodies | Specifically immunoprecipitate the target histone mark or protein. | Must be characterized per ENCODE guidelines (e.g., by immunoblot showing a single major band) [67]. |
| Micrococcal Nuclease (MNase) | Enzymatically fragments chromatin for the "enzymatic" ChIP protocol. | The optimal amount must be determined empirically for each cell/tissue type via a digestion series [69]. |
| Sonicator | Physically shears cross-linked chromatin for the "sonication" ChIP protocol. | Both bath and probe sonicators are used. Optimal settings (power, duration) are cell/tissue-specific and must be optimized [69]. |
| Protein A/G Beads | Capture the antibody-target complex during immunoprecipitation. | Use high-quality beads to minimize non-specific binding and reduce background [68]. |
| Cross-linking Agent (Formaldehyde) | Covalently links proteins to DNA in living cells to preserve in vivo interactions. | Fixation time is critical; over-crosslinking can mask epitopes and reduce signal [68] [67]. |
| Glycine | Quenches the cross-linking reaction by reacting with excess formaldehyde. | Essential for stopping fixation and preventing over-crosslinking [68]. |
Frequently Asked Questions
Q1: Why are consistent spike-in read percentages critical for my histone ChIP-seq experiment? Spike-in normalization uses exogenous chromatin from another species as an internal control to account for technical variation between samples. Consistent spike-in read percentages are vital because the method typically relies on a single scalar value to normalize genome-wide data. If the initial ratio of spike-in to sample chromatin varies significantly between samples, this scaling factor will be incorrect, potentially leading to erroneous biological conclusions about global changes in histone mark abundance [35].
Q2: What is the typical cause of high variability in spike-in read counts between my replicates? The most common cause is an inconsistent starting ratio of spike-in chromatin to your sample chromatin across different tubes. This can occur due to:
- Inaccurate pipetting when adding the spike-in chromatin to each sample.
- Improper mixing of the spike-in chromatin stock before use.
- Significant differences in cell counting or chromatin quantification between samples prior to spike-in addition [35].
Q3: I have followed the protocol, but my overall spike-in read count is very low. What does this mean? Low spike-in read counts are often a sign of inefficient immunoprecipitation (IP) of the spike-in chromatin itself. This can happen if:
- The antibody has poor affinity for the epitope on the spike-in chromatin.
- The experimental procedures affect the IP of the spike-in chromatin differently than the target IP (a key assumption when using a spike-in-specific antibody) [35].
- The draft genome assembly for the spike-in species is incomplete, leading to a high proportion of reads being lost during alignment [35].
Troubleshooting Guide: Diagnosing and Correcting Common Spike-in Issues
Use the following table to diagnose the specific failure mode you are encountering and to implement the recommended corrective actions.
| Failure Mode | Primary Symptoms | Root Cause | Corrective Actions |
|---|---|---|---|
| Variable Spike-in Ratios [35] | Large, unpredictable variability in spike-in read percentages between biological replicates. | Inconsistent pipetting or inaccurate quantification when mixing sample and spike-in chromatin. | - Use calibrated pipettes and master mixes for spike-in addition.- Vortex the spike-in chromatin stock thoroughly before use.- Implement precise cell counting (e.g., automated counters) and confirm chromatin concentration. |
| Inefficient Spike-in IP [35] | Consistently low number of spike-in reads across all samples. | Antibody with low affinity for the spike-in epitope or protocol steps that disproportionately affect spike-in chromatin. | - Validate antibody cross-reactivity with the spike-in species.- Titrate the antibody to ensure optimal binding.- Review protocol for steps that might differentially impact sample vs. spike-in (e.g., wash stringency). |
| Incorrect Data Processing [70] [35] | Unexpected normalization results even with good spike-in read counts; errors during computational analysis. | Deviating from the original method's computational guidelines, such as aligning reads to spike-in and target genomes separately. | - Use a pre-built, merged reference genome for alignment [70].- Adhere strictly to the bioinformatic pipeline (e.g., SpikeFlow) recommended for the method [70].- Ensure all required input controls are available and processed correctly [35]. |
| Suboptimal Crosslinking | High background noise, low signal-to-noise ratio, poor ChIP efficiency. | Standard formaldehyde fixation may not adequately capture chromatin factors that do not bind DNA directly. | - Adopt a double-crosslinking protocol (dxChIP-seq) using DSG followed by formaldehyde to better stabilize protein complexes [63]. |
The following diagram illustrates the relationship between these common failure modes and the critical steps in a spike-in ChIP-seq workflow.
Advanced Protocol: Double-Crosslinking to Improve Capture
For challenging targets, especially non-DNA-binding chromatin factors, consider an enhanced crosslinking method. dxChIP-seq (double-crosslinking ChIP-seq) uses disuccinimidyl glutarate (DSG) followed by standard formaldehyde (FA) fixation [63].
- DSG's Role: DSG is a homobifunctional NHS-ester crosslinker with a ~7.7 Å spacer. It efficiently stabilizes protein-protein interactions and complexes, which are common among chromatin regulators [63].
- FA's Role: Formaldehyde then secures the protein-DNA interactions with its short (~2 Å) crossbridges [63].
- Synergy: This sequential use "locks" protein complexes in place before securing them to DNA, leading to a more complete capture of the chromatin landscape and an improved signal-to-noise ratio [63].
The Scientist's Toolkit: Essential Research Reagents
The following table lists key materials and resources for implementing and troubleshooting spike-in normalized ChIP-seq.
| Item / Resource | Function / Description | Example / Source |
|---|---|---|
| Spike-in Chromatin | Exogenous chromatin added as an internal control for normalization. | Active Motif (Cat #53083) [63] [35] |
| Spike-in Antibody | Antibody specific to the epitope on the spike-in chromatin. | Active Motif (Cat #61686) [63] |
| Dual-Crosslinkers | DSG and Formaldehyde used sequentially to stabilize protein complexes and protein-DNA interactions. | Thermo Scientific (#20593, #28908) [63] |
| Merged Genome Index | A single bowtie2 index file combining the target (e.g., hg38) and spike-in (e.g., dm6) genomes for proper alignment. | Must be built or obtained; critical for accurate read mapping [70]. |
| Analysis Pipeline | Automated computational workflow for processing spike-in ChIP-seq data. | SpikeFlow (Available on GitHub) [70] |
Validation and Benchmarking: Ensuring Data Fidelity with Emerging Technologies
Frequently Asked Questions (FAQs)
Q1: What are the ENCODE Consortium's key experimental guidelines for a successful histone ChIP-seq experiment?
The ENCODE Consortium emphasizes several critical guidelines to ensure data quality and reproducibility in histone ChIP-seq. First, the use of high-quality, validated antibodies is paramount. Antibodies must be characterized for specificity using primary and secondary tests, such as immunoblot analysis or immunostaining [67]. Second, the inclusion of biological replicates is mandatory; experiments should have a minimum of two biological replicates (isogenic or anisogenic) to assess reproducibility [60]. Third, every ChIP-seq experiment must be accompanied by a matching input control experiment, which undergoes the same processing steps but without immunoprecipitation. This control helps account for background noise and technical biases [60] [71]. Furthermore, the consortium provides detailed protocols for chromatin preparation, including cross-linking and fragmentation, to ensure consistency across labs [72].
Q2: What are the target-specific sequencing depth requirements for histone ChIP-seq as per ENCODE standards?
Histone modifications often cover broad genomic domains, which necessitates greater sequencing depth compared to transcription factor binding sites. The ENCODE standards specify different requirements for "point-source" factors (like some transcription factors) and "broad-source" factors (like many histone marks). For broad-source marks in human cells, the consortium recommends 40 million uniquely mapped reads per replicate [8]. The table below summarizes the key sequencing requirements.
Table 1: ENCODE ChIP-seq Sequencing Depth Standards
| Target Type | Organism | Minimum Usable Fragments per Replicate | Uniquely Mapped Reads per Replicate (Historical Guideline) |
|---|---|---|---|
| Transcription Factor (Point Source) | Human | 20 million [60] | 20 million [8] |
| Histone Mark (Broad Source) | Human | Not explicitly stated for histones; transcription factor standards are used as a base. | 40 million [8] |
| Transcription Factor (Point Source) | Fly/Worm | Information not specified in sources | 8 million [8] |
| Histone Mark (Broad Source) | Fly/Worm | Information not specified in sources | 10 million [8] |
Q3: How does ENCODE quantitatively assess the quality of a ChIP-seq dataset, and what are the key metrics?
The ENCODE Consortium uses a suite of quality metrics to evaluate ChIP-seq data, as no single measurement can identify all high-quality samples [72]. The key metrics are outlined in the table below.
Table 2: Key ENCODE ChIP-seq Quality Control Metrics
| Metric | Description | Preferred/Passing Threshold |
|---|---|---|
| FRiP (Fraction of Reads in Peaks) | The fraction of all mapped reads that fall within peak regions. Indicates enrichment efficiency. | >1% for transcription factors; often higher for strong histone marks [67] [60]. |
| IDR (Irreproducible Discovery Rate) | Measures consistency between biological replicates by comparing rank-ordered peak lists. | Rescue and self-consistency ratios must be <2 for replicated experiments [60]. |
| Library Complexity (NRF, PBC1, PBC2) | Assesses the complexity and uniqueness of the DNA library, indicating potential PCR over-amplification. | NRF > 0.9; PBC1 > 0.9; PBC2 > 10 [60]. |
| Cross-Correlation | Calculates the correlation between reads on the Watson and Crick strands, helping to distinguish true signal from noise. | Used for assessment; no single threshold for all experiments [67] [8]. |
Q4: My histone ChIP-seq data has a low FRiP score. What are the potential causes and solutions?
A low FRiP score indicates poor enrichment and a high background signal. This is a common issue with several potential causes:
- Antibody Specificity: This is the most frequent culprit. The antibody may have low affinity or cross-react with other epitopes [67] [73]. Solution: Re-validate your antibody using immunoblot or other specificity tests. Consider using antibodies certified for ChIP (e.g., SNAP-ChIP Certified Antibodies) [73].
- Insufficient Sequencing Depth: While a low FRiP can be caused by shallow sequencing, the solution is not simply to sequence deeper. If the enrichment is poor, deeper sequencing will only provide more background reads. Solution: First optimize your wet-lab protocol (immunoprecipitation, washing stringency) before re-sequencing [8] [60].
- Suboptimal Chromatin Fragmentation: Over- or under-fragmentation can impact antibody accessibility and resolution. Solution: Perform a chromatin shearing time course and use electrophoresis to ensure fragments are in the ideal 150-300 bp range [74] [73].
- Inefficient Immunoprecipitation: The IP conditions may not be optimal. Solution: Titrate your antibody amount, ensure fresh cross-linking if used, and include rigorous wash steps to reduce background [73].
Q5: How can I directly benchmark my own ChIP-seq or CUT&Tag data against ENCODE gold standards?
To benchmark your data, you can perform a comparative analysis against relevant ENCODE datasets.
- Recall and Precision: A 2025 benchmarking study for H3K27ac and H3K27me3 in K562 cells provides a framework. They calculated recall (the proportion of ENCODE peaks captured by the new method) and precision (the proportion of peaks in the new data that fall into ENCODE peaks). In this study, CUT&Tag recovered an average of 54% (recall) of known ENCODE peaks [17].
- Peak Caller and Parameters: The choice of peak caller and parameters significantly affects benchmarking outcomes. The same study found that MACS2 and SEACR were suitable peak callers for CUT&Tag data, but parameters needed optimization [17].
- Functional Enrichment: Beyond peak overlap, confirm that your identified peaks show the same functional and biological enrichments as ENCODE peaks, such as association with correct gene ontology terms and transcription factor binding motifs [17].
The following diagram illustrates the core workflow for benchmarking a new dataset against ENCODE standards.
The Scientist's Toolkit: Research Reagent Solutions
Table 3: Essential Materials for Histone ChIP-seq Experiments
| Item | Function/Description | Considerations & Examples |
|---|---|---|
| Validated Antibodies | Binds specifically to the histone modification of interest for immunoprecipitation. | Critical for success. Use ChIP-grade antibodies. Validate via immunoblot/immunostaining. SNAP-ChIP Certified Antibodies are an option for histone PTMs [73]. |
| Cross-linking Agent | Stabilizes protein-DNA interactions in living cells. | Formaldehyde is most common. Concentration and time require optimization to avoid epitope masking [73]. |
| Chromatin Shearing Method | Fragments chromatin to mononucleosome size for high-resolution mapping. | Sonication or MNase digestion. Must be optimized for each cell/tissue type. Ideal size: 150-300 bp [74] [73]. |
| Magnetic Beads | Coupled to Protein A/G to isolate antibody-bound chromatin complexes. | More efficient and consistent than agarose beads [73]. |
| Input Control | Chromatin sample taken prior to immunoprecipitation. | Serves as a critical control for sequencing background and normalization. Must be processed alongside IP samples [60] [73]. |
| Library Prep Kit | Prepares immunoprecipitated DNA for next-generation sequencing. | Select kits compatible with low DNA input. Monitor PCR duplication rates [17]. |
The relationships between key quality metrics and their interpretation for troubleshooting are summarized below.
Troubleshooting Guides and FAQs
Q1: My ChIP-seq experiment for H3K27me3 has a high background. What could be the cause and how can I fix it? A: High background in H3K27me3 ChIP-seq is often due to incomplete chromatin fragmentation or antibody non-specificity.
- Solution: Optimize sonication conditions using a Covaris sonicator to achieve fragments of 200-500 bp. Perform a titration of the H3K27me3 antibody and include a pre-clearing step with protein A/G beads and IgG. Using a high-stringency wash buffer (e.g., RIPA buffer with 500 mM LiCl) can also reduce background.
Q2: I am getting low signal in my CUT&Tag experiment for H3K27ac. What are the critical steps to check? A: Low signal in CUT&Tag is frequently linked to poor cell membrane permeabilization or inactive pA-Tn5 transposase.
- Solution: Titrate the concentration of Digitonin (e.g., 0.01%-0.05%) in the permeabilization buffer to ensure optimal nuclear access. Always aliquot and store the pA-Tn5 enzyme at -80°C to prevent freeze-thaw cycles. Include a positive control antibody (e.g., H3K4me3) to verify the entire workflow.
Q3: My CUT&Tag library size distribution is abnormal, showing a strong sub-nucleosomal peak. Is this expected? A: For active marks like H3K27ac, a sub-nucleosomal peak (~100-200 bp) is normal and indicates high-resolution mapping. For repressive marks like H3K27me3, you may see a broader nucleosomal-sized distribution. A single sharp peak at ~60 bp may indicate over-digestion or insufficient chromatin.
Q4: How does antibody quality specifically impact the signal-to-noise ratio in both techniques? A: Antibody quality is the single most critical factor. A poor antibody with low affinity or specificity will capture off-target regions, drastically increasing noise.
- ChIP-seq: Requires antibodies that work in denaturing conditions (sonication). Validate with knockout cell lines if possible.
- CUT&Tag: Requires antibodies that recognize native chromatin. Use antibodies validated for CUT&Tag or immunofluorescence.
Comparative Performance Data
Table 1: Quantitative Comparison of ChIP-seq and CUT&Tag
| Feature | ChIP-seq | CUT&Tag |
|---|---|---|
| Typical Signal-to-Noise Ratio | Moderate | High |
| Input Material Required | 0.5 - 10 million cells | 50,000 - 100,000 cells |
| Hands-on Time | 3-4 days | 1-2 days |
| Sequencing Depth Recommendation | 20-50 million reads | 5-15 million reads |
| Resolution | 200-500 bp (sonication-dependent) | Single-nucleosome (<100 bp) |
| Key Advantage | Established, robust protocol | Low background, low input |
| Key Limitation | High background, cross-linking artifacts | Optimization of permeabilization critical |
Table 2: Performance by Histone Mark
| Histone Mark | Recommended Method | Key Consideration |
|---|---|---|
| H3K27ac | CUT&Tag | Excellent for mapping active enhancers with high resolution and low input. |
| H3K27me3 | ChIP-seq | More reliable for broad, diffuse domains due to deeper sequencing and established analysis pipelines. |
Experimental Protocols
Detailed ChIP-seq Protocol for H3K27ac/H3K27me3
- Cross-linking: Fix cells with 1% formaldehyde for 10 min at room temperature. Quench with 125 mM Glycine.
- Cell Lysis: Lyse cells in LB1 (50 mM HEPES-KOH pH 7.5, 140 mM NaCl, 1 mM EDTA, 10% Glycerol, 0.5% NP-40, 0.25% Triton X-100).
- Chromatin Shearing: Resuspend nuclei in LB2 (10 mM Tris-HCl pH 8.0, 200 mM NaCl, 1 mM EDTA, 0.5 mM EGTA) and sonicate using a Covaris S220 to fragment DNA to 200-500 bp.
- Immunoprecipitation: Incubate sheared chromatin with 2-5 µg of target-specific antibody (e.g., Anti-H3K27ac, Abcam ab4729) overnight at 4°C with rotation.
- Bead Capture & Washes: Capture immune complexes with Protein A/G magnetic beads. Wash sequentially with Low Salt, High Salt, LiCl, and TE buffers.
- Elution & Decrosslinking: Elute chromatin in Elution Buffer (1% SDS, 100 mM NaHCO3) and reverse crosslinks at 65°C overnight.
- Library Prep: Purify DNA and prepare sequencing library using the NEBNext Ultra II DNA Library Prep Kit.
Detailed CUT&Tag Protocol for H3K27ac/H3K27me3
- Cell Permeabilization: Bind Concanavalin A-coated magnetic beads to cells. Permeabilize nuclei with Digitonin-containing Wash Buffer (20 mM HEPES pH 7.5, 150 mM NaCl, 0.5 mM Spermidine, 0.05% Digitonin, protease inhibitors).
- Antibody Binding: Incubate with primary antibody (1:50-1:100 dilution in Antibody Buffer) overnight at 4°C.
- pA-Tn5 Binding: Wash and incubate with pA-Tn5 adapter complex (prepared in-house or commercial) for 1 hour at room temperature.
- Tagmentation: Induce tagmentation by adding MgCl₂ to a final concentration of 10 mM and incubating for 1 hour at 37°C.
- DNA Extraction: Stop tagmentation with SDS/Proteinase K and extract DNA using SPRI beads.
- Library Amplification: Amplify the library by PCR (e.g., 12-15 cycles) using dual-indexed primers and purify with SPRI beads.
Visualizations
Diagram 1: ChIP-seq Experimental Workflow
Diagram 2: CUT&Tag Experimental Workflow
Diagram 3: Signal-to-Noise Logic
The Scientist's Toolkit
Table 3: Research Reagent Solutions
| Item | Function | Example |
|---|---|---|
| H3K27ac Antibody | Binds specifically to H3K27ac epitope for chromatin capture. | Abcam, ab4729 |
| H3K27me3 Antibody | Binds specifically to H3K27me3 epitope for chromatin capture. | Cell Signaling Technology, C36B11 |
| pA-Tn5 Transposase | Protein A-Tn5 fusion enzyme for targeted tagmentation in CUT&Tag. | Commercial kit or lab-assembled |
| Magnetic Beads (ConA) | Binds cells for easy buffer exchanges during CUT&Tag. | Polysciences, Inc. |
| Digitonin | Detergent for permeabilizing cell and nuclear membranes in CUT&Tag. | MilliporeSigma |
| Covaris Sonicator | Instrument for consistent, controlled chromatin shearing in ChIP-seq. | Covaris S220 |
| NEBNext Ultra II Kit | Library preparation kit for Illumina sequencing. | New England Biolabs |
| SPRI Beads | Magnetic beads for size selection and clean-up of DNA libraries. | Beckman Coulter |
Frequently Asked Questions (FAQs)
Q1: What do "recall" and "precision" mean in the context of histone ChIP-seq data?
In histone ChIP-seq analysis, recall (or completeness) measures the proportion of true biological binding sites your experiment successfully identifies from a known set of peaks. Precision (or correctness) measures how many of your called peaks are true binding sites versus technical noise [75]. A high-quality dataset achieves a balance of both, maximizing true signal detection while minimizing false positives.
Q2: My histone ChIP-seq data has a low FRiP score. What does this indicate and how can I improve it?
A low FRiP (Fraction of Reads in Peaks) score indicates a high background noise level, meaning a significant portion of your sequenced reads do not originate from genuine enrichment sites. To address this:
- Verify antibody specificity: Use antibodies validated according to consortium standards (e.g., ENCODE) [66].
- Increase sequencing depth: Ensure you meet the minimum recommended depth for your target histone mark (e.g., ≥ 45 million usable fragments for broad marks like H3K27me3) [66].
- Optimize cross-linking: Avoid over-cross-linking, which can increase non-specific background signal.
- Check library complexity: Confirm your NRF (Non-Redundant Fraction) is >0.9 and PBC1 (PCR Bottlenecking Coefficient 1) is >0.9 [66].
Q3: How can I benchmark the performance of my histone ChIP-seq pipeline?
Benchmark your pipeline by calculating recall and precision against a "gold standard" dataset of known binding sites. This can be derived from:
- Orthogonal validation methods (e.g., comparative analysis with a high-quality ChIP-seq dataset from a trusted source like ENCODE).
- Integrated cis-regulatory element (CRE) maps that combine multiple profiling methods [75].
- Quantitative metrics are calculated using base-pair intersection between your called peaks and the gold standard regions [75].
Troubleshooting Guides
Low Recall: Missing Known Peaks
| Symptom | Potential Cause | Solution |
|---|---|---|
| Known regulatory regions not called as peaks | Insufficient sequencing depth | Sequence to recommended depth: 20-60 million reads depending on the mark [42] [66]. |
| Overly stringent peak-calling parameters | Adjust statistical thresholds (e.g., p-value, FDR) to be less conservative. | |
| Weak or diffuse histone marks not detected | Incorrect analysis for mark type | Use a broad peak-calling algorithm (e.g., from the ENCODE histone pipeline) for marks like H3K27me3 [66]. |
Low Precision: Excessive False Positives
| Symptom | Potential Cause | Solution |
|---|---|---|
| Many peaks in genomic backgrounds or repetitive regions | Inadequate input control | Always use a matched input or IgG control for peak calling to account for technical artifacts and open chromatin [66]. |
| High number of irreproducible peaks | Low replicate concordance | Perform biological replicates and use Irreproducible Discovery Rate (IDR) analysis. A self-consistency ratio < 2 is acceptable [66]. |
| Peaks with low signal-to-noise | Library complexity issues | Check PBC2 scores; a value >3 is acceptable, but >10 is preferred [66]. |
Quantitative Benchmarks for Performance Evaluation
The table below summarizes performance metrics for different cis-regulatory element identification methods when benchmarked against a ChIP-seq gold standard, illustrating the trade-off between recall and precision [75].
Table 1: Performance of CRE Identification Methods Against a ChIP-seq Gold Standard [75]
| Method Category | Example Methods | Key Strength | Consideration for Histone Marks |
|---|---|---|---|
| Chromatin Accessibility | ATAC-seq, DNase-seq | Identifies open chromatin regions, good for active marks (e.g., H3K27ac). | Context-specific; may miss repressed domains marked by H3K27me3. |
| DNA Methylation | Unmethylated Regions (UMRs) | Stable across tissues/conditions; good for creating universal maps. | Less dynamic, may not capture condition-specific regulation. |
| Sequence Conservation | BLSSpeller, msa_pipeline, FunTFBS | Identifies evolutionarily conserved functional elements. | Useful for core regulatory regions but may miss species-specific elements. |
| Integrated CREs (iCREs) | Combination of multiple above methods | Improved completeness (recall) and precision [75]. | Requires data integration but provides the most robust set of putative regulatory regions. |
ENCODE Sequencing Depth Standards
Adhering to established sequencing standards is fundamental for ensuring data quality. The table below outlines the ENCODE consortium's requirements.
Table 2: ENCODE4 Recommended Sequencing Depth for Histone ChIP-seq [66]
| Histone Mark Type | Example Marks | Minimum Usable Fragments per Replicate | Recommended Usable Fragments per Replicate |
|---|---|---|---|
| Narrow Marks | H3K4me3, H3K27ac, H3K9ac | 20 million | > 20 million |
| Broad Marks | H3K27me3, H3K36me3 | 45 million | > 45 million |
| Exception (H3K9me3) | H3K9me3 | 45 million (total mapped reads) | N/A |
Experimental Protocols for Quality Control
Protocol: Reproducibility Assessment with IDR
This protocol assesses the consistency between biological replicates, a key indicator of data precision.
- Peak Calling: Call peaks on each biological replicate individually and on a pooled set of reads from all replicates.
- Run IDR Analysis: Use the Irreproducible Discovery Rate (IDR) pipeline to compare the replicate-specific peak lists.
- Interpret Results: The output provides a set of high-confidence, reproducible peaks. A rescue ratio and self-consistency ratio both below 2 indicate good reproducibility [66].
- Use Reproducible Peaks: For downstream analysis, use the IDR-thresholded peaks file, which represents the most reliable set of binding events.
Protocol: In-silico Benchmarking of Recall and Precision
This protocol allows you to quantitatively evaluate your peak-calling results.
- Obtain a Gold Standard: Acquire a validated set of peaks for your histone mark in a similar cellular context (e.g., from a public repository like ENCODE [66] or a published study using an orthogonal method).
- Calculate Overlap: Identify the base-pair overlap between your set of called peaks and the gold standard regions.
- Compute Metrics:
- Recall = (Number of base pairs in gold standard recovered by your peaks) / (Total base pairs in gold standard).
- Precision = (Number of base pairs in your peaks that overlap the gold standard) / (Total base pairs in your peaks).
- F1 Score = 2 * (Precision * Recall) / (Precision + Recall). This harmonic mean provides a single metric to balance both [75].
The Scientist's Toolkit: Essential Research Reagents & Materials
Table 3: Key Reagents and Tools for Histone ChIP-seq QC and Analysis
| Item | Function / Description | Example / Note |
|---|---|---|
| Validated Antibody | Immunoprecipitation of specific histone marks. | Critical for success. Use antibodies characterized by ENCODE or other reputable sources [66]. |
| Input DNA Control | Control for technical biases from chromatin fragmentation, sequencing, and open chromatin. | A must-have for accurate peak calling and precision estimation [66]. |
| Spike-in Chromatin | For quantitative normalization across samples, improving precision in differential analysis. | e.g., Drosophila chromatin spiked into human samples [76]. |
| IDR Pipeline | Statistical method to evaluate reproducibility between replicates. | Standard tool in ENCODE pipeline to generate high-confidence peak sets [66]. |
| HOMER Suite | Integrated tool for peak calling, annotation, and motif discovery. | Beginner-friendly with comprehensive documentation for full analysis workflow [42]. |
| ENCODE Histone Pipeline | Standardized workflow for processing histone ChIP-seq data. | Provides best-practice scripts for mapping, signal generation, and broad peak calling [66]. |
Workflow Diagrams
ChIP-seq Quality Benchmarking
Precision & Recall Relationship
Integrating Multi-omics Data (Proteomics, Transcriptomics) for Biological Validation
Multi-omics data integration harmonizes multiple layers of biological data, such as transcriptomics, proteomics, and metabolomics, to achieve a comprehensive understanding of biological systems that cannot be captured by single-omics analyses alone [77] [78]. This holistic view is crucial for uncovering disease mechanisms, identifying biomarkers, and developing targeted therapies [78].
Within the context of a thesis focused on improving the signal-to-noise ratio in histone ChIP-seq research, multi-omics integration provides a powerful validation framework. Histone ChIP-seq identifies genome-wide locations of histone modifications, which are epigenetic marks influencing gene expression [71]. However, ChIP-seq data can be affected by noise and technical artifacts [79]. Integrating these findings with downstream molecular layers—such as transcriptomics (measuring RNA transcripts) and proteomics (identifying and quantifying proteins)—allows researchers to distinguish true biological signal from experimental noise. For instance, a histone mark indicating active transcription (e.g., H3K4me3) should show correlation with increased expression of associated genes at the RNA and/or protein level [43] [80]. This concordance across omics layers provides robust biological validation for ChIP-seq findings.
Troubleshooting Guides
Guide 1: Addressing Low Signal-to-Noise in Histone ChIP-seq Data
A low signal-to-noise ratio in ChIP-seq data makes it difficult to distinguish true binding events from background, leading to an insufficient number of confidently identified peaks.
Problem: The resulting data appears noisy, with a low fraction of reads in peaks (FRiP score), and peak callers identify fewer peaks than expected, even though motif analysis on the called peaks may confirm the presence of the expected biological signal [71] [79].
Solutions:
| Troubleshooting Step | Action and Rationale |
|---|---|
| Assess Data Quality | Run FastQC on raw sequencing data to check for adapter contamination and other quality metrics. Check the alignment rate of sequenced reads to the reference genome [79]. |
| Verify Enrichment | Use deepTools' plotFingerprint to check the enrichment of your ChIP signal over a control (input DNA). A good experiment shows a clear separation between the ChIP and control tracks [79]. |
| Evaluate Replicate Concordance | Use deepTools' multiBamSummary and plotCorrelation to assess the correlation between biological replicates. High correlation between replicates increases confidence in the identified peaks [79]. |
| Optimize Peak Calling | Try different peak callers (e.g., MACS2, RSEG, Pepr) and adjust significance parameters (e.g., p-value, FDR thresholds). Lowering these thresholds can help recover more true-positive peaks [81] [79]. |
| Ensure Proper Control | Always use a matched input DNA or IgG control for peak calling. This control is essential for distinguishing real peaks from background noise generated during sonication and sequencing [79]. |
| Check Antibody Specificity | Re-evaluate the antibody used for immunoprecipitation. A poorly validated antibody is a common source of failure. It should be validated for specificity via immunoblot or other methods [8] [71]. |
ChIP-seq Noise Troubleshooting
Guide 2: Resolving Discordant Signals in Multi-omics Integration
Discordance occurs when the expected biological relationship between different omics layers is not observed. For example, a histone modification suggesting active transcription (H3K4me3 from ChIP-seq) is not associated with increased transcript or protein levels for the corresponding gene [77] [80].
Problem: The data shows poor correlation between transcriptomics and proteomics, or between epigenomic marks and downstream molecular phenotypes, making biological interpretation challenging.
Solutions:
| Troubleshooting Step | Action and Rationale |
|---|---|
| Confirm Sample Alignment | Ensure all omics data (ChIP-seq, RNA-seq, proteomics) are generated from the same biological sample or from isogenic, similarly treated samples. Matched samples are crucial for direct integration [78]. |
| Apply Directional Integration | Use methods like Directional P-value Merging (DPM) that incorporate user-defined directional constraints (e.g., H3K4me3 should positively correlate with transcript levels). This prioritizes genes with consistent changes and penalizes those with inconsistent signals [80]. |
| Account for Biological Complexity | Investigate post-transcriptional and post-translational regulation. Discordance between transcript and protein levels can be biologically real, caused by miRNA regulation, protein degradation, or other mechanisms [77] [82]. |
| Check Data Preprocessing | Ensure each omics dataset has undergone appropriate, type-specific normalization and batch effect correction. Heterogeneous data structures and noise profiles can create artificial discordance [78]. |
| Leverage Pathway-Level Analysis | Move beyond single-gene comparisons. Use pathway enrichment analysis on integrated gene lists to see if combined signals from multiple genes in a pathway show consistent directional changes, even if individual genes are noisy [77] [80]. |
Multi-omics Discordance Resolution
Frequently Asked Questions (FAQs)
Q1: What are the main computational methods for integrating transcriptomic and proteomic data? Several strategies exist, falling into three main categories [77]:
- Correlation-based: Identifies genes/proteins with co-expression patterns across omics layers. This includes constructing gene-metabolite networks or using Similarity Network Fusion (SNF) to build joint sample-similarity networks [77] [78].
- Machine Learning (ML)/Factorisation-based: Methods like Multi-Omics Factor Analysis (MOFA) infer a set of latent factors that capture the major sources of variation across all datasets. This is useful for identifying coordinated molecular programs [78].
- Directional Significance Merging: Methods like DPM (Directional P-value Merging) integrate statistical significance estimates (p-values) from each omics dataset while incorporating expected directional relationships (e.g., positive correlation between transcript and protein) [80].
Q2: My ChIP-seq experiment yielded very little DNA. Are there protocols for low-input samples? Yes, specialized protocols have been developed to address this. Nano-ChIP-seq and LinDA (Linear DNA Amplification) have been successfully used for histone modification profiling with as few as 10,000 cells. These methods involve post-ChIP DNA amplification with optimized library preparation steps to minimize biases [8].
Q3: Why is there often a weak correlation between mRNA expression and protein abundance? This is a common finding due to the multi-layered regulation of gene expression. Key reasons include [77] [82]:
- Different Turnover Rates: mRNAs and proteins have distinct half-lives.
- Post-Transcriptional Regulation: miRNAs and RNA-binding proteins regulate mRNA translation and stability.
- Post-Translational Modifications (PTMs): Proteins are regulated by modifications (e.g., phosphorylation) that do not affect transcript levels.
- Technical Limitations: The "dark matter" of proteomics—many proteins are difficult to detect due to low abundance, poor ionization, or a vast dynamic range, leading to incomplete coverage [82].
Q4: How can I biologically interpret the results of a multi-omics integration? Pathway enrichment analysis is the most common technique. After integration yields a prioritized gene list, tools like GSEA or g:Profiler are used to identify biological processes, molecular pathways, or Gene Ontology terms that are overrepresented. Visualization as enrichment maps can reveal overarching functional themes [77] [80].
Experimental Protocols
Protocol 1: Optimized Histone ChIP-seq for Improved Signal-to-Noise
This protocol outlines critical steps for obtaining high-quality histone mark data, based on an optimized framework [43].
1. Cell Cross-linking and Lysis:
- Cross-link cells using a freshly prepared formaldehyde solution (concentration may require optimization for specific cell types; 1% is a common starting point) [43].
- Quench the cross-linking reaction with glycine.
- Lyse cells in ChIP lysis buffer (e.g., 1% SDS, 10mM EDTA, 50mM Tris-Cl, pH 8.0) supplemented with protease inhibitors.
2. Chromatin Shearing:
- Shear chromatin using sonication. The optimal conditions (time, intensity) must be determined empirically for each cell type and sonicator.
- Critical Optimization: Aim for an average DNA fragment size of 200-500 bp. Analyze fragment size distribution on an agarose gel after reversing cross-links and purifying DNA. Under-shearing reduces resolution, while over-shearing can destroy epitopes [43] [71].
3. Immunoprecipitation (IP):
- Pre-clear the sheared chromatin with Protein A/G beads.
- Incubate the supernatant with a validated, high-specificity antibody against the target histone modification (e.g., anti-H3K4me3).
- Antibody Validation is Critical: The antibody should be tested via immunoblot to confirm specificity and lack of cross-reactivity [8] [43].
- Recover the antibody-bound complexes using Protein A/G beads.
4. Washing, Elution, and DNA Purification:
- Wash beads stringently with low-salt, high-salt, and LiCl buffers, followed by TE buffer, to remove non-specifically bound DNA.
- Elute the ChIP'ed DNA from the beads and reverse cross-links.
- Purify DNA using phenol-chloroform extraction or spin columns.
5. Library Preparation and Sequencing:
- Prepare a sequencing library from the purified ChIP DNA. For low-input samples, use library kits designed for amplified material.
- Sequence on an appropriate NGS platform. The ENCODE consortium recommends a minimum of 20 million uniquely mapped reads for point-source factors and 40 million for broad histone marks in human samples [8].
Protocol 2: Directional Integration of ChIP-seq and Transcriptomics/Proteomics
This methodology uses directional constraints to validate ChIP-seq findings against transcriptomic or proteomic data [80].
1. Upstream Data Processing:
- Process each omics dataset independently through its standard bioinformatics pipeline to generate, for each gene, a measure of statistical significance (p-value) and a directional effect size.
- ChIP-seq: For a histone mark, the direction could be the log-fold-change of signal in a treatment vs. control, or a binary indicator of presence/absence.
- Transcriptomics/Proteomics: The direction is typically the log-fold-change in expression or abundance.
2. Define the Constraints Vector (CV):
- Formulate a hypothesis about the expected directional relationship between the datasets.
- Example: To validate an activating histone mark like H3K4me3, the CV with transcriptomics would be [+1, +1], meaning you expect the histone mark and gene expression to change in the same direction (both up in the treatment condition).
3. Execute Directional P-value Merging (DPM):
- Use the DPM algorithm (available in the ActivePathways R package) to integrate the p-values from all omics datasets.
- The algorithm will upweight genes where the observed directional changes align with the CV and penalize genes with inconsistent changes.
4. Pathway Enrichment Analysis:
- Use the merged, directionally-informed p-value list from DPM as input for a pathway enrichment tool like ActivePathways.
- This identifies biological pathways that are significantly regulated in a consistent direction across your multi-omics data, providing high-confidence validation of the ChIP-seq results.
Visualization and Data Interpretation Tools
Multi-omics Integration Workflow
This diagram illustrates the complete workflow for directionally integrating histone ChIP-seq data with transcriptomics and proteomics for biological validation.
Multi-omics Validation Workflow
The Scientist's Toolkit: Research Reagent Solutions
| Item | Function in Experiment |
|---|---|
| High-Specificity Antibody | The core of a successful ChIP-seq. Must be validated for specificity to the target histone modification (e.g., H3K4me3) via immunoblot or other assays to avoid off-target binding and high background [8] [43]. |
| Protein A/G Magnetic Beads | Used for immunoprecipitation. Magnetic beads offer easier handling and better recovery during washing steps compared to sepharose beads. |
| Formaldehyde (Crosslinker) | Cross-links proteins (including histones) to DNA in living cells, preserving in vivo interactions before cell lysis and shearing. Concentration and time may require optimization [43]. |
| Protease Inhibitor Cocktail | Added to all buffers during cell lysis and chromatin preparation to prevent degradation of histones and other proteins by cellular proteases. |
| Magnetic Rack | Essential for efficiently separating magnetic beads from solution during washing and elution steps of the ChIP protocol. |
| Sonication Device | Used to fragment chromatin into sizes suitable for sequencing (200-500 bp). Sonicator type and settings (power, duration, pulse) must be optimized for each cell type [43] [71]. |
| Pathway Analysis Software (e.g., ActivePathways, GSEA) | Computational tools required for the biological interpretation of integrated data. They identify pathways and processes significantly enriched in the validated gene lists [80]. |
| Multi-omics Integration Tools (e.g., MOFA+, DPM) | Software packages that implement algorithms for combining multiple omics datasets. The choice of tool (unsupervised, supervised, directional) depends on the biological question [78] [80]. |
Technical Support Center
Troubleshooting Guides
FAQ: Addressing Common Histone ChIP-seq Challenges in TNBC Research
This guide addresses frequent issues encountered during histone modification profiling in triple-negative breast cancer (TNBC) models, with a focus on improving the signal-to-noise ratio for more reliable data.
1. Problem: High background noise or low signal-to-noise ratio in ChIP-seq data.
- Potential Causes & Solutions:
- Cause: Incomplete chromatin fragmentation. Under-fragmented chromatin leads to large DNA fragments that increase background signal and reduce resolution [83].
- Cause: Antibody specificity issues. Non-specific antibodies are a primary source of false-positive peaks [67].
- Solution: Use ChIP-validated antibodies. Adhere to ENCODE guidelines for antibody characterization, which include immunoblot analysis to ensure the primary reactive band constitutes at least 50% of the signal, or immunofluorescence to confirm expected nuclear staining [67].
- Cause: Suboptimal cross-linking. Standard formaldehyde cross-linking may be insufficient for proteins not directly bound to DNA [47].
- Solution: Consider a double-crosslinking protocol (dxChIP-seq) using a combination of formaldehyde and a second crosslinker like DSG. This stabilizes larger protein complexes, improving the mapping of challenging chromatin targets and enhancing the signal-to-noise ratio [47].
2. Problem: Low yield of immunoprecipitated DNA.
- Potential Causes & Solutions:
- Cause: Insufficient starting material. The amount of chromatin varies by cell type [83].
- Solution: Scale up the input material. The recommended 5–10 µg of chromatin per IP is a guideline; TNBC cell lines or tissues may require more. Refer to expected yield tables to guide starting amounts [83].
- Cause: Over-fragmentation or over-sonication. This can damage chromatin integrity and epitopes, reducing IP efficiency [83] [84].
- Solution: Avoid over-sonication. If over 80% of DNA fragments are shorter than 500 bp, reduce sonication time or power [83].
- Cause: Insufficient starting material. The amount of chromatin varies by cell type [83].
3. Problem: Poor agreement between biological replicates.
- Potential Causes & Solutions:
- Cause: Variable chromatin preparation. Inconsistencies in cell culture, cross-linking, or shearing introduce technical noise [67].
- Solution: Standardize protocols meticulously. Process replicates in parallel using the same reagent batches and equipment settings [67].
- Cause: Low library complexity. This can stem from over-amplification during PCR or insufficient sequencing depth [85].
- Solution: Perform rigorous quality control. Use metrics like the Non-Redundant Fraction (NRF > 0.5), PCR bottlenecking coefficients (PBC1 > 0.5, PBC2 > 1), and Fraction of Reads in Peaks (FRiP) to assess data quality before comparing replicates [85].
- Cause: Variable chromatin preparation. Inconsistencies in cell culture, cross-linking, or shearing introduce technical noise [67].
Table: Expected Chromatin Yield from Different Sample Types
This table helps researchers estimate the required starting material to obtain the recommended 5–10 µg of chromatin for a single IP reaction [83].
| Sample Type | Total Chromatin Yield (per 25 mg tissue or ~4 million cells) | Expected DNA Concentration |
|---|---|---|
| HeLa Cells | 10–15 µg | 100–150 µg/ml |
| Spleen | 20–30 µg | 200–300 µg/ml |
| Liver | 10–15 µg | 100–150 µg/ml |
| Brain | 2–5 µg | 20–50 µg/ml |
| Heart | 2–5 µg | 20–50 µg/ml |
Table: Key Quality Control Metrics for Histone ChIP-seq Data
Adhering to these quality metrics, as used in rigorous TNBC studies, ensures high-quality data suitable for publication and downstream analysis [85] [67].
| Metric | Definition | Recommended Threshold |
|---|---|---|
| FRiP (Fraction of Reads in Peaks) | Proportion of all sequenced reads that fall into peak regions. | > 1% (histone marks), >5% (TFs) [67] |
| PBC (PCR Bottlenecking Coefficient) | Measure of library complexity. PBC1 is the fraction of distinct genomic locations with exactly one read; PBC2 is the ratio of locations with one read to those with two. | PBC1 ≥ 0.5, PBC2 ≥ 1 [85] |
| NRF (Non-Redundant Fraction) | Fraction of non-redundant, mapped reads. | ≥ 0.5 [85] |
| NSC (Normalized Strand Cross-correlation) | Ratio of the cross-correlation value at the peak to the background. | ≥ 1.05 [85] |
| RSC (Relative Strand Cross-correlation) | Ratio of the fragment-length cross-correlation to the read-length cross-correlation. | ≥ 0.8 [85] |
Experimental Protocols
Detailed Methodology: H3K27ac ChIP-seq for Super-Enhancer Profiling in TNBC
This protocol is essential for identifying active enhancers and super-enhancers, which are critical regulators of tumorigenesis in TNBC [85].
1. Cell Culture and Cross-linking:
- Grow TNBC cells (e.g., HCC1806) to 70–80% confluency [86].
- Cross-link proteins to DNA by adding 1% formaldehyde (final concentration) directly to the culture medium and incubating for 10 minutes at room temperature [84] [67].
- Quench the cross-linking reaction by adding glycine to a final concentration of 125 mM and incubating for 5 minutes [84].
2. Chromatin Preparation and Shearing:
- Lyse cells and isolate nuclei using ice-cold buffers supplemented with protease inhibitors [84].
- Resuspend the nuclear pellet in shearing buffer. Shear chromatin to an average size of 200–600 bp using a focused ultrasonicator. Optimization is critical: perform a sonication time-course to establish ideal conditions for your cell line [83] [85].
- Centrifuge to pellet debris and collect the supernatant containing sheared chromatin.
3. Immunoprecipitation:
- Incubate the chromatin sample with a validated anti-H3K27ac antibody [85] overnight at 4°C with rotation.
- Add pre-washed Protein A/G magnetic beads and incubate for 2 hours to capture the antibody-chromatin complexes [84].
- Wash beads sequentially with low-salt, high-salt, and LiCl wash buffers, followed by a final TE buffer wash to remove non-specifically bound material [67].
4. DNA Purification and Library Preparation:
- Reverse cross-links by incubating the sample with Proteinase K at 65°C for several hours [83].
- Purify the immunoprecipitated DNA using a commercial PCR purification kit.
- Prepare sequencing libraries using a commercial kit compatible with your sequencing platform. The resulting data can be analyzed with algorithms like ROSE to identify TNBC-specific super-enhancers [85].
Signaling Pathways and Workflows
ChIP-seq Workflow Diagram
Double-Crosslinking Chemistry Diagram
The Scientist's Toolkit
Table: Essential Research Reagents for Histone ChIP-seq in TNBC
| Reagent / Material | Function | Example/Target in TNBC Research |
|---|---|---|
| Validated Antibodies | Specifically immunoprecipitate the histone mark of interest. | H3K27ac (for active enhancers) [85], H3K4me3 (active promoters) [86], H3K27me3 (Polycomb repression) [86] [87]. |
| Protein A/G Magnetic Beads | Efficiently capture antibody-chromatin complexes for easy washing and elution. | Used in magnetic ChIP protocols to improve reproducibility and reduce background [84]. |
| Micrococcal Nuclease (MNase) | Enzymatically digests chromatin for high-resolution mapping of nucleosome positions. | Preferred over sonication for mapping nucleosome-level features like histone modifications [71]. |
| Next-Generation Sequencer | Generates millions of short reads to map protein-DNA interactions genome-wide. | Illumina platforms are widely used for ChIP-seq [71]. |
| Cell Line Models | Provide a consistent and renewable source of TNBC chromatin for profiling. | HCC1806 (Basal-like 2 subtype) is a frequently used preclinical model [86]. |
Conclusion
Enhancing the signal-to-noise ratio in histone ChIP-seq is not a single fix but a holistic process encompassing rigorous experimental design, the adoption of quantitative normalization methods like cellular spike-ins, and stringent bioinformatic quality control. The integration of automated pipelines and emerging technologies such as CUT&Tag offers promising avenues for higher sensitivity, especially in low-input scenarios. As the field moves forward, the adoption of universal standards and benchmarking practices will be crucial for generating reproducible, quantitative epigenomic data. This progress is foundational for unlocking the clinical potential of epigenetics, from discovering new disease biomarkers to developing the next generation of epigenetic therapeutics for conditions like cancer.
References
- 1. ChIP-Seq: Technical Considerations for Obtaining High ... [https://pmc.ncbi.nlm.nih.gov/articles/PMC3541830/]
- 2. ChIP-chip versus ChIP-seq: Lessons for experimental design ... [https://pmc.ncbi.nlm.nih.gov/articles/PMC3053263/]
- 3. Chapter 18 ChIP-Seq | Choosing Genomics Tools [https://hutchdatascience.org/Choosing_Genomics_Tools/chip-seq-1.html]
- 4. ChIP-Seq Kit Troubleshooting Guide | Boster Bio [https://www.bosterbio.com/protocol-and-troubleshooting/chromatin-immunoprecipitation-chip-troubleshooting-guide?srsltid=AfmBOoqBYfyPRsE7vE0MJ4v6EJZ9iUciZ8jBZfCxYRLBhB4loB8XRUBJ]
- 5. IP efficiency in Chip-Seq data [https://www.biostars.org/p/250437/]
- 6. How to Troubleshoot Sequencing Preparation Errors (NGS ... [https://www.cd-genomics.com/resource-sequencing-preparation-troubleshooting.html]
- 7. Deciphering histone mark-specific fine-scale chromatin ... [https://www.nature.com/articles/s41467-025-64350-w]
- 8. ChIP-seq and Beyond: new and improved methodologies ... [https://pmc.ncbi.nlm.nih.gov/articles/PMC3591838/]
- 9. ChIP bias as a function of cross-linking time - PMC [https://pmc.ncbi.nlm.nih.gov/articles/PMC4860130/]
- 10. Analysis of histone antibody specificity directly in ... [https://pmc.ncbi.nlm.nih.gov/articles/PMC10028865/]
- 11. Chromatin immunoprecipitation: Techniques, advances, ... [https://www.abcam.com/en-us/knowledge-center/epigenetics/chromatin-immunoprecipitation-techniques-advances-and-insights]
- 12. Benchmark of chromatin–protein interaction methods in ... [https://www.frontiersin.org/journals/cell-and-developmental-biology/articles/10.3389/fcell.2025.1572405/full]
- 13. SNAP-ChIP: A Robust Method for Determining Histone ... [https://www.thermofisher.com/us/en/home/references/newsletters-and-journals/bioprobes-journal-of-cell-biology-applications/bioprobes-79/snap-chip-histone-PTM-antibody-specificity.html]
- 14. Antibody Selection for Better ChIP Results - CST Blog [https://blog.cellsignal.com/4-steps-to-better-chip-results-step-3-chromatin-antibody]
- 15. Chromatin Immunoprecipitation Troubleshooting: ChIP Help [https://www.novusbio.com/support/support-by-application/chromatin-immunoprecipitation/troubleshooting.html?srsltid=AfmBOoqp6wHxZm6X8oJLjF5gooQ1XmadVXEkZe1B6AumLsptXew_08DJ]
- 16. Chromatin Immunoprecipitation Troubleshooting Guide [https://www.cellsignal.com/learn-and-support/troubleshooting/chip-troubleshooting-guide?srsltid=AfmBOopfia7Vp_3LU05-y1vAtJN4L4XOjDTCcbNmvt7c1wwiX9sStpJW]
- 17. CUT&Tag recovers up to half of ENCODE ChIP-seq ... [https://www.nature.com/articles/s41467-025-58137-2]
- 18. Epigenetic regulators in cancer therapy and progression [https://pmc.ncbi.nlm.nih.gov/articles/PMC12206235/]
- 19. Key players in cancer heterogeneity and drug resistance [https://www.sciencedirect.com/science/article/pii/S1936523323002073]
- 20. Epigenomic Echoes—Decoding Genomic and Epigenetic ... [https://pmc.ncbi.nlm.nih.gov/articles/PMC11843950/]
- 21. Improved cohesin HiChIP protocol and bioinformatic ... [https://pubmed.ncbi.nlm.nih.gov/40082674/]
- 22. Chromatin Immunoprecipitation Troubleshooting Guide [https://www.cellsignal.com/learn-and-support/troubleshooting/chip-troubleshooting-guide?srsltid=AfmBOoo2w6ZhLiyRWNs1qnDzUMTq3F7gC1QBhUoPe1ah94H63gqslFak]
- 23. Chromatin IP Frequently Asked Questions [https://www.cellsignal.com/learn-and-support/frequently-asked-questions/chip-faqs?srsltid=AfmBOopVYRYFrmyW-8J8sz0x4McYD0AxiXWnrOF1xWFYoWkocgRXn6G8]
- 24. Deciphering direct transcriptional effects of epigenetic ... [https://www.nature.com/articles/s41467-025-61769-z]
- 25. Histone ChIP-seq Data Standards and Processing Pipeline [https://www.encodeproject.org/chip-seq/histone/]
- 26. ChIP-seq data processing tutorial [https://nbis-workshop-epigenomics.readthedocs.io/en/latest/content/tutorials/chipseqProc/lab-chipseq-processing.html]
- 27. Chromatin Immunoprecipitation Troubleshooting Guide [https://www.cellsignal.com/learn-and-support/troubleshooting/chip-troubleshooting-guide?srsltid=AfmBOop787j_QDIxzR5hDvQqGHKj8J4tNKbq5wUxVam_JzwFnK8zMQ2R]
- 28. Refined ChIP‐Seq Protocol for High‐Quality Chromatin ... [https://pmc.ncbi.nlm.nih.gov/articles/PMC12628287/]
- 29. ChIP-Seq Kit Troubleshooting Guide | Boster Bio [https://www.bosterbio.com/protocol-and-troubleshooting/chromatin-immunoprecipitation-chip-troubleshooting-guide?srsltid=AfmBOop41FWJC_vqPFsAPza94ujqbOKDrMPhmwMyBEqBL0XgZUhpKZIL]
- 30. Highly quantitative measurement of differential protein ... [https://pmc.ncbi.nlm.nih.gov/articles/PMC12272247/]
- 31. Highly quantitative measurement of differential protein ... [https://pubmed.ncbi.nlm.nih.gov/40393455/]
- 32. PerCell ChIP-seq analysis pipeline for highly quantitative ... [https://github.com/lextallan/PerCell]
- 33. ChIP Troubleshooting Guide [https://www.bosterbio.com/frequently-asked-questions/chip-troubleshooting-guide?srsltid=AfmBOoobV6vyOjuis5RY86nhl9APyuMUDg8A7i5rZV8rPLUQj7f2Lm9v]
- 34. Chromatin Immunoprecipitation Troubleshooting Guide [https://www.cellsignal.com/learn-and-support/troubleshooting/chip-troubleshooting-guide?srsltid=AfmBOorFjOvryJ-hCRukXH-bDERUPJ9TrdJGiJo1FJq0s6-Y3UtKR9Wp]
- 35. The Wild West of Spike-in Normalization - PMC [https://pmc.ncbi.nlm.nih.gov/articles/PMC12266361/]
- 36. Protocol to apply spike-in ChIP-seq to capture massive ... [https://pmc.ncbi.nlm.nih.gov/articles/PMC8313745/]
- 37. Pipeline and Tools for ChIP-Seq Analysis [https://www.cd-genomics.com/pipeline-and-tools-comparison-for-chip-seq-analysis.html]
- 38. ChIP-Seq Data Analysis - CRCD User Manual - Pitt CRC [https://crc-pages.pitt.edu/user-manual/advanced-genomics-support/ChipSeq-data-analysis/]
- 39. Ten Common Mistakes in ChIP-seq Data Analysis [https://www.accurascience.com/blogs_35_0.html]
- 40. Troubleshooting ATAC-seq, CUT&Tag, ChIP-seq & More [https://www.accurascience.com/blogs_16_0.html]
- 41. H3NGST: a fully automated, web-based platform for end-to ... [https://bmcbioinformatics.biomedcentral.com/articles/10.1186/s12859-025-06247-5]
- 42. How To Analyze ChIP-seq Data For Absolute Beginners Part 1 [https://ngs101.com/how-to-analyze-chip-seq-data-for-absolute-beginners-part-1-from-fastq-to-peaks-with-homer/]
- 43. An optimized ChIP‐Seq framework for profiling histone ... [https://pmc.ncbi.nlm.nih.gov/articles/PMC8961045/]
- 44. A checklist for maximizing reproducibility of ecological ... [https://www.nature.com/articles/s41559-019-0972-5]
- 45. A standards perspective on genomic data reusability and ... [https://pmc.ncbi.nlm.nih.gov/articles/PMC11931119/]
- 46. Protocol for double-crosslinking ChIP-seq to improve data ... [https://pubmed.ncbi.nlm.nih.gov/41166303/]
- 47. Protocol for double-crosslinking ChIP-seq to improve data ... [https://www.sciencedirect.com/science/article/pii/S2666166725005775]
- 48. Chromatin Immunoprecipitation Troubleshooting Guide [https://www.cellsignal.com/learn-and-support/troubleshooting/chip-troubleshooting-guide?srsltid=AfmBOopakTpIQX3W_rCRdeaI-Kni1FdkNcnUSHmQLD742ieg8rEyb34m]
- 49. ChIP Troubleshooting Guide [https://www.bosterbio.com/frequently-asked-questions/chip-troubleshooting-guide?srsltid=AfmBOoq-g053PBKivF7oIWwQxHinszBIvwnWJeTWsqbV1xTpsNmdC5Zr]
- 50. Chromatin Immunoprecipitation Troubleshooting Guide [https://www.cellsignal.com/learn-and-support/troubleshooting/chip-troubleshooting-guide?srsltid=AfmBOooJpNdvEMxu-29sAoqu6dQF6dDd86PnA3YdxBYQTpgp1evvqEc-]
- 51. Chromatin Immunoprecipitation Troubleshooting: ChIP Help [https://www.novusbio.com/support/support-by-application/chromatin-immunoprecipitation/troubleshooting.html?srsltid=AfmBOorQGlIOQu6dDti3W3w1nSm0pe2sh5Ss7YA0u7xXoIwLM8cNE9KY]
- 52. Chromatin IP Frequently Asked Questions [https://www.cellsignal.com/learn-and-support/frequently-asked-questions/chip-faqs?srsltid=AfmBOoq7PNR9SR5F7_LcTiNB0EBaeJMJUerZl091FkPlBSsg9C4Q-A3u]
- 53. Chromatin immunoprecipitation: optimization, quantitative ... [https://pmc.ncbi.nlm.nih.gov/articles/PMC2077865/]
- 54. Identification of factors associated with duplicate rate in ... [https://pmc.ncbi.nlm.nih.gov/articles/PMC6447195/]
- 55. The Duplicates Dilemma of ChIP-Seq [https://www.biostars.org/p/9543379/]
- 56. ChIP-Seq reads mapping and data normalization of ... [https://www.biostars.org/p/433604/]
- 57. Detrimental effects of duplicate reads and low complexity ... [https://bmcbioinformatics.biomedcentral.com/articles/10.1186/1471-2105-16-S13-S10]
- 58. 9.4 Pre-processing ChIP data | Computational Genomics with R [https://compgenomr.github.io/book/pre-processing-chip-data.html]
- 59. Benchmark of chromatin–protein interaction methods in ... [https://pmc.ncbi.nlm.nih.gov/articles/PMC12106302/]
- 60. Transcription Factor ChIP-seq Data Standards and ... [https://www.encodeproject.org/chip-seq/transcription_factor/]
- 61. Audits [https://www.encodeproject.org/data-standards/audits/]
- 62. Extensive evaluation of ATAC-seq protocols for native or ... [https://pmc.ncbi.nlm.nih.gov/articles/PMC8928671/]
- 63. Protocol for double-crosslinking ChIP-seq to improve data ... [https://pmc.ncbi.nlm.nih.gov/articles/PMC12603744/]
- 64. FRIP score ATAC-seq [https://www.biostars.org/p/337872/]
- 65. Calculate FRiP score | Yiwei Niu's Note [https://yiweiniu.github.io/blog/2019/03/Calculate-FRiP-score/]
- 66. Histone ChIP-seq Data Standards and Processing Pipeline ... [https://www.encodeproject.org/chip-seq/histone-encode4/]
- 67. ChIP-seq guidelines and practices of the ENCODE and ... [https://pmc.ncbi.nlm.nih.gov/articles/PMC3431496/]
- 68. ChIP Troubleshooting Guide [https://www.bosterbio.com/frequently-asked-questions/chip-troubleshooting-guide?srsltid=AfmBOopiyZxjlzcObnN9FxcQcgADOsNPLdE8AkdzGems4UgTUynyifDE]
- 69. Chromatin Immunoprecipitation Troubleshooting Guide [https://www.cellsignal.com/learn-and-support/troubleshooting/chip-troubleshooting-guide?srsltid=AfmBOoq2VURcnB4XLHxyOHG8pWgX6uyJEJIEIofkVk8wlMnjOj_rjbsr]
- 70. DavideBrex/SpikeFlow: Pipeline to analyse ChIP-Rx data ... [https://github.com/DavideBrex/SpikeFlow]
- 71. ChIP-Seq: advantages and challenges of a maturing ... [https://pmc.ncbi.nlm.nih.gov/articles/PMC3191340/]
- 72. Data standards [https://www.encodeproject.org/data-standards/]
- 73. Chromatin Mapping Basics: ChIP-seq [https://www.epicypher.com/resources/blog/chromatin-mapping-basics-chip-seq/]
- 74. Iterative Fragmentation Improves the Detection of ChIP-seq ... [https://pmc.ncbi.nlm.nih.gov/articles/PMC5081244/]
- 75. A map of integrated cis-regulatory elements enhances ... [https://pmc.ncbi.nlm.nih.gov/articles/PMC12281299/]
- 76. Highly quantitative measurement of differential protein ... [https://www.sciencedirect.com/science/article/pii/S2667237525000888]
- 77. Strategies for Comprehensive Multi-Omics Integrative Data ... [https://pmc.ncbi.nlm.nih.gov/articles/PMC11592251/]
- 78. Multi-Omics: Challenges and Solutions [https://bigomics.ch/blog/key-challenges-in-multi-omics-data-integration/]
- 79. Noisy ChIPSeq data [https://www.biostars.org/p/188192/]
- 80. Directional integration and pathway enrichment analysis ... [https://www.nature.com/articles/s41467-024-49986-4]
- 81. Methods for ChIP-seq analysis: A practical workflow and ... [https://www.sciencedirect.com/science/article/pii/S1046202320300591]
- 82. Multiomic Big Data Analysis Challenges - PubMed Central - NIH [https://pmc.ncbi.nlm.nih.gov/articles/PMC8465926/]
- 83. Chromatin Immunoprecipitation Troubleshooting Guide [https://www.cellsignal.com/learn-and-support/troubleshooting/chip-troubleshooting-guide?srsltid=AfmBOopDtPbHJIbxLkXzLyIgnSVz5Ddlsu4XhgI-amsrNiJPH9wE_-LJ]
- 84. ChIP-Seq Kit Troubleshooting Guide | Boster Bio [https://www.bosterbio.com/protocol-and-troubleshooting/chromatin-immunoprecipitation-chip-troubleshooting-guide?srsltid=AfmBOoq7_mBW8NU0uoJmA3-REpRkofKLEd0KCTXbw9AaWEpx8C7nFJqd]
- 85. Profiling triple-negative breast cancer-specific super ... [https://pmc.ncbi.nlm.nih.gov/articles/PMC12070678/]
- 86. Epigenetic and transcriptional profiling of triple negative ... [https://www.nature.com/articles/sdata201933]
- 87. Deciphering histone mark-specific fine-scale chromatin ... [https://pmc.ncbi.nlm.nih.gov/articles/PMC12546738/]