PCA on Microarray vs RNA-seq Data: A Practical Guide for Performance and Application in Biomedical Research
This article provides a comprehensive comparison of Principal Component Analysis (PCA) performance on microarray and RNA-seq transcriptomic data.
PCA on Microarray vs RNA-seq Data: A Practical Guide for Performance and Application in Biomedical Research
Abstract
This article provides a comprehensive comparison of Principal Component Analysis (PCA) performance on microarray and RNA-seq transcriptomic data. Tailored for researchers and drug development professionals, it explores the foundational principles of each technology's data structure and its implications for PCA. The content covers practical methodological approaches for applying PCA, addresses common troubleshooting and optimization challenges, and validates performance through comparative analysis of real-world case studies. By synthesizing findings from recent benchmarking studies, this guide offers actionable insights for selecting the appropriate platform and analytical strategy to maximize the biological insights gained from transcriptomic dimensionality reduction.
Microarray vs RNA-seq: Understanding Core Data Structures and Their Impact on PCA
Gene expression analysis is a cornerstone of modern molecular biology, enabling researchers to understand cellular processes, disease mechanisms, and drug responses. Over recent decades, two principal technological approaches have emerged for transcriptome profiling: hybridization-based methods (primarily microarrays) and sequencing-based methods (including RNA sequencing, RNA-Seq). These technologies operate on fundamentally different principles for detecting and quantifying nucleic acids. Hybridization-based techniques rely on the binding of fluorescently labeled nucleic acids to complementary probes immobilized on a solid surface, with signal intensity corresponding to expression levels. In contrast, sequencing-based methods utilize next-generation sequencing platforms to directly determine the nucleotide sequence of cDNA molecules, providing digital counts of transcript abundance through computational alignment and enumeration.
The evolution of these platforms has created important considerations for researchers designing transcriptomic studies, particularly as both technologies remain in active use. While RNA-seq has gained substantial market share, microarray data still comprises a significant portion of existing gene expression repositories and continues to be used in new studies due to specific advantages in certain applications. Understanding the fundamental operational differences, performance characteristics, and appropriate use cases for each technology is essential for robust experimental design and data interpretation in genomics research, especially in pharmaceutical development and biomarker discovery.
Core Technological Principles and Workflows
Hybridization-Based Technologies
Hybridization-based technologies, predominantly represented by DNA microarrays, function through the principle of complementary base pairing between target sequences and immobilized probes. The experimental workflow begins with RNA extraction from biological samples, followed by reverse transcription to create complementary DNA (cDNA). This cDNA is then fluorescently labeled and hybridized to a microarray chip containing hundreds of thousands of predefined oligonucleotide probes spotted at specific locations. After extensive washing to remove non-specifically bound molecules, the chip is scanned to measure fluorescence intensity at each probe location, which corresponds to the abundance of the corresponding transcript in the original sample.
The fundamental characteristics of hybridization-based approaches include their dependence on predefined probes, which limits detection to known sequences included in the array design, and a signal output that is analog in nature, representing continuous fluorescence intensity values. This analog nature creates limitations at both low and high expression levels, where background noise and signal saturation respectively affect accurate quantification. Microarray technology matured rapidly throughout the 1990s and 2000s, becoming the workhorse method for large-scale gene expression studies and generating the bulk of data in repositories such as the Gene Expression Omnibus (GEO) during that period [1].
Sequencing-Based Technologies
Sequencing-based technologies for transcriptome quantification, primarily RNA sequencing (RNA-Seq), employ a fundamentally different approach based on direct nucleotide determination. The typical workflow begins with RNA extraction, followed by enrichment for specific RNA types (e.g., poly-A selection for mRNA). The RNA is then converted to a sequencing library through fragmentation, reverse transcription to cDNA, adapter ligation, and possible amplification. These prepared libraries are loaded onto next-generation sequencing platforms that perform massive parallel sequencing, generating millions of short DNA reads. These reads are then computationally mapped to a reference genome or transcriptome, with expression levels quantified by counting the number of reads aligned to each gene.
Key advantages of sequencing-based methods include their hypothesis-free nature, as they do not require prior knowledge of transcript sequences, enabling discovery of novel genes, splice variants, and mutations. Unlike the analog signals from microarrays, RNA-Seq provides digital read counts as its primary output, offering a wider dynamic range for quantification. Since its emergence in the mid-2000s, RNA-Seq has gradually become the predominant transcriptomic profiling method, comprising approximately 85% of all submissions to GEO as of 2023 [1].
Table 1: Core Fundamental Differences Between Hybridization and Sequencing Technologies
| Feature | Hybridization-Based (Microarrays) | Sequencing-Based (RNA-Seq) |
|---|---|---|
| Basic Principle | Complementary base pairing to immobilized probes | Direct nucleotide sequencing of cDNA |
| Detection Dependency | Requires predefined probe sequences | Does not require prior sequence knowledge |
| Output Signal | Analog fluorescence intensity | Digital read counts |
| Dynamic Range | Limited (~10³) due to background and saturation | Wide (>10⁵) with digital counting |
| Target Limitations | Limited to probes on the array | Virtually unlimited potential targets |
| Primary Applications | Profiling known transcripts, focused studies | Discovery work, novel transcript identification |
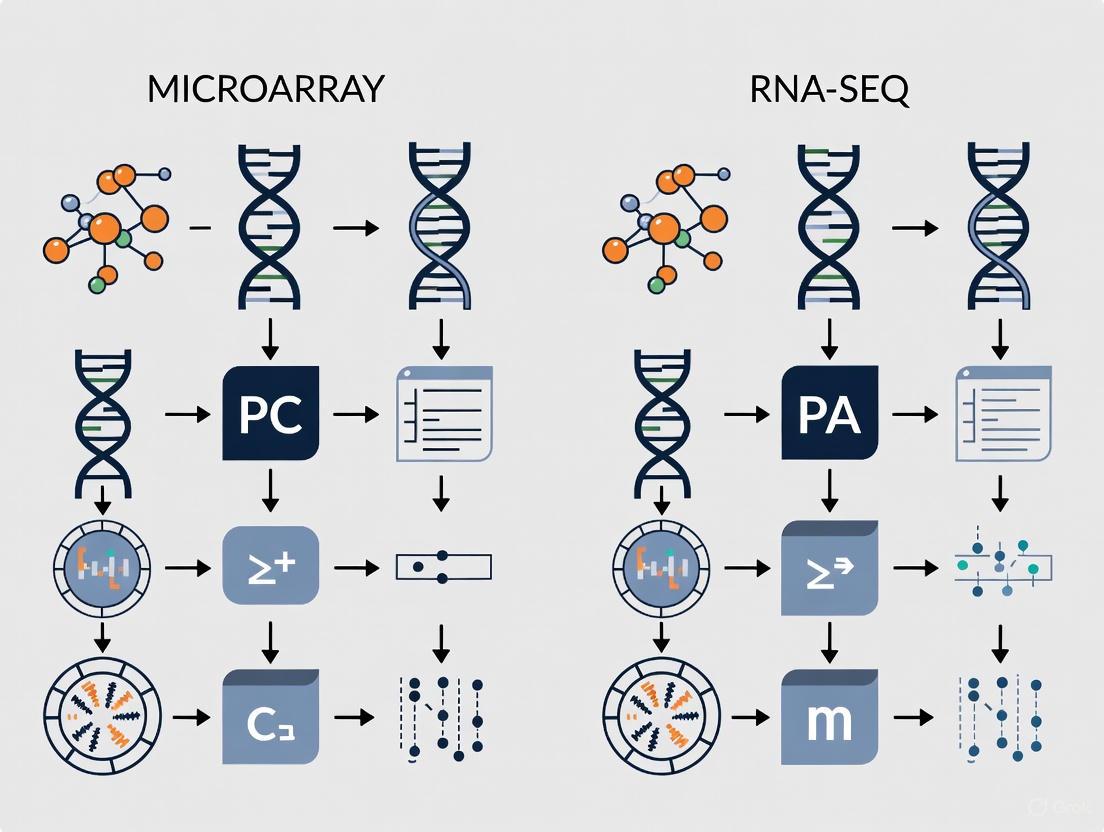
Visualizing Fundamental Workflow Differences
The diagram below illustrates the core procedural differences between hybridization-based and sequencing-based quantification workflows, highlighting key stages where methodological divergences occur.
Performance Comparison and Experimental Data
Technical Performance Metrics
Direct comparisons between hybridization and sequencing technologies reveal distinct performance characteristics that influence their suitability for different research applications. Microarray technology demonstrates good sensitivity for moderate to highly expressed transcripts but suffers from limited dynamic range (approximately 10³) due to background fluorescence at low expression levels and signal saturation at high abundances. In contrast, RNA-Seq provides a significantly wider dynamic range (>10⁵) due to its digital counting nature, enabling more accurate quantification of both lowly and highly expressed genes. This technical advantage translates to practical benefits, with RNA-Seq demonstrating higher specificity and sensitivity, particularly for detecting differentially expressed genes with low abundance [2].
The capability for novel discovery represents another fundamental differentiator between the platforms. Microarrays can only detect transcripts with complementary probes on the array, making them inherently biased toward known sequences. RNA-Seq, as an unbiased method, can identify novel transcripts, gene fusions, splice variants, and sequence polymorphisms without prior knowledge of their existence. This discovery potential makes RNA-Seq particularly valuable for exploratory research in less-characterized biological systems or for comprehensive transcriptome characterization [2].
Concordance in Gene Expression Profiling
Despite their technical differences, multiple studies have demonstrated reasonable concordance between hybridization and sequencing platforms when analyzing the same biological samples. A 2025 study comparing microarray and RNA-Seq technologies using identical blood samples from 35 participants found a median Pearson correlation coefficient of 0.76 for gene expression profiles, indicating strong overall agreement. In differential expression analysis, RNA-Seq identified 2,395 differentially expressed genes (DEGs), while microarray identified 427 DEGs, with 223 DEGs shared between the platforms. Pathway analysis revealed 205 perturbed pathways identified by RNA-Seq and 47 by microarray, with 30 pathways overlapping between the technologies [1].
An earlier comparison study published in 2007 examining microarray and Massively Parallel Signature Sequencing (MPSS) on biological replicates found that DNA microarray platforms generally provided highly correlated data, while moderate correlations between microarrays and MPSS were obtained. The study attributed disagreements between the technologies to limitations inherent to both approaches, including challenges with low-abundance transcripts, tag-to-gene mapping ambiguity, and absence of restriction sites for enzyme-based methods [3]. These findings underscore that while both methods can generate biologically meaningful data, they should be considered complementary rather than directly interchangeable.
Table 2: Experimental Performance Comparison Between Microarray and RNA-Seq
| Performance Metric | Microarray | RNA-Seq | Experimental Context |
|---|---|---|---|
| Gene Detection | 15,828 genes detected [1] | 22,323 genes detected [1] | Analysis of human whole blood samples |
| Differentially Expressed Genes | 427 DEGs identified [1] | 2,395 DEGs identified [1] | Youth with HIV vs. controls |
| Shared DEGs | 223 DEGs shared between platforms [1] | 223 DEGs shared between platforms [1] | Same samples, same statistical analysis |
| Pathway Detection | 47 perturbed pathways [1] | 205 perturbed pathways [1] | IPA pathway analysis |
| Dynamic Range | ~10³ [2] | >10⁵ [2] | Technical comparison studies |
| Correlation Between Platforms | Pearson r = 0.76 [1] | Pearson r = 0.76 [1] | Same blood samples analyzed |
Impact on Transcriptomic Benchmark Concentration Modeling
The performance differences between technologies take on particular importance in regulatory toxicology applications, where transcriptomic benchmark concentration (BMC) modeling provides quantitative information for chemical risk assessment. A 2025 toxicogenomic study comparing microarray and RNA-Seq for concentration-response modeling of cannabinoids found that despite RNA-Seq identifying larger numbers of differentially expressed genes with wider dynamic ranges, both platforms displayed equivalent performance in identifying functions and pathways impacted by compound exposure through gene set enrichment analysis. Most importantly, transcriptomic point of departure values derived through BMC modeling were at similar levels for both platforms, supporting the continued utility of microarray data for chemical risk assessment [4].
This finding has significant practical implications for toxicogenomics and drug development, suggesting that while RNA-Seq offers superior technical capabilities, microarray data remains sufficient and appropriate for many applications, particularly those focused on pathway identification and benchmark concentration modeling. The study authors noted that considering the relatively low cost, smaller data size, and better availability of software and public databases for data analysis and interpretation, "microarray is still a viable method of choice for traditional transcriptomic applications such as mechanistic pathway identification and concentration response modeling" [4].
Experimental Design and Methodological Considerations
Sample Preparation and Protocol Details
Proper experimental design begins with appropriate sample handling and preparation, which varies significantly between hybridization and sequencing approaches. For microarray analysis using the Affymetrix platform, a standard protocol involves using 100 ng of total RNA that undergoes reverse transcription with a T7-linked oligo(dT) primer, followed by second-strand cDNA synthesis. Subsequently, complementary RNA (cRNA) is synthesized through in vitro transcription with biotinylated nucleotides, followed by fragmentation and hybridization to microarray chips. After 16 hours of hybridization at 45°C, chips are washed, stained, and scanned to generate raw image files for analysis [4].
For RNA-Seq library preparation, the Illumina Stranded mRNA Prep protocol typically begins with 100 ng of total RNA followed by poly-A selection to enrich for mRNA. The RNA is then fragmented and reverse-transcribed into cDNA, with subsequent adapter ligation for sequencing. Libraries are quantified and quality-controlled before being loaded onto sequencing platforms. A key distinction is that RNA-Seq requires substantially more sophisticated bioinformatic processing of raw sequencing reads, including quality control, adapter trimming, alignment to reference genomes, and read counting for each gene [4] [2].
Data Processing and Analytical Approaches
Data processing methodologies differ substantially between the technologies due to their fundamentally different data types. Microarray data processing typically includes background correction, quantile normalization, and summarization of probe-level intensities, often using algorithms such as Robust Multi-Array Averaging (RMA). The output is continuous expression values on a logarithmic scale that can be analyzed using conventional statistical methods [1].
RNA-Seq data analysis involves quality control of raw reads, adapter trimming, alignment to a reference genome or transcriptome, and generation of count data for each gene. The count-based nature of RNA-Seq data requires specialized statistical methods that account for its discrete distribution, often using negative binomial models implemented in packages like DESeq2. Normalization approaches must account for factors like sequencing depth and gene length, with methods such as TPM (transcripts per million) or FPKM (fragments per kilobase million) used for cross-sample comparisons [1].
A critical consideration in cross-platform comparisons is the application of consistent statistical approaches. The 2025 study by found that applying the same non-parametric statistical methods (Mann-Whitney U tests) to both microarray and RNA-Seq data from the same samples reduced discrepancies and improved concordance in differential expression results, suggesting that analytical approach selection significantly impacts cross-platform comparisons [1].
PCA Performance on Microarray vs. RNA-Seq Data
The Role of Principal Component Analysis in Transcriptomics
Principal Component Analysis (PCA) serves as an essential computational method for analyzing high-dimensional transcriptomic datasets, enabling dimensionality reduction, visualization of sample relationships, and identification of batch effects. PCA is widely applied to both microarray and RNA-Seq data for quality control, exploratory data analysis, and as a preprocessing step for downstream machine learning applications. In single-cell RNA-sequencing (scRNA-seq) especially, PCA has become an indispensable tool for handling the extreme dimensionality of datasets containing millions of cells, where it is used for feature selection, denoising, and as input for clustering and trajectory inference algorithms [5].
The computational demands of PCA become particularly important with large-scale transcriptomic datasets. Benchmarking studies have revealed that for massive scRNA-seq datasets (e.g., >1 million cells), traditional PCA implementations that load entire data matrices into memory become computationally prohibitive. This has driven the development of memory-efficient PCA algorithms based on Krylov subspace methods and randomized singular value decomposition that maintain accuracy while reducing computational requirements [5].
Comparative Performance in Data Structure Resolution
When applied to microarray versus RNA-Seq data, PCA demonstrates different characteristics in resolving biological and technical variance structures. RNA-Seq data, with its wider dynamic range and greater sensitivity to low-abundance transcripts, typically captures more biological variation in initial principal components. However, the higher dimensionality and sparsity of RNA-Seq data can also introduce computational challenges not encountered with microarray data. The digital nature of RNA-Seq data means that proper normalization and transformation (e.g., variance-stabilizing transformation) are particularly critical before PCA application to avoid technical artifacts dominating the variance structure [1].
Microarray data, being continuous and approximately normally distributed after log-transformation, often exhibits more stable covariance estimation in PCA, potentially providing more robust separation of major biological effects. Studies comparing PCA results between the two platforms have found that while RNA-Seq typically captures more total transcriptional variance, the major axes of biological variation are generally consistent between platforms when analyzing the same samples. This consistency supports the continued utility of legacy microarray data in meta-analyses and database construction, even as RNA-Seq becomes the dominant transcriptomic profiling technology [1].
Essential Research Reagent Solutions
The following table details key reagents and materials essential for implementing both hybridization-based and sequencing-based gene expression quantification workflows, based on methodologies cited in the literature.
Table 3: Essential Research Reagents for Gene Expression Quantification
| Reagent/Material | Function | Technology Application |
|---|---|---|
| PAXgene Blood RNA Kit | Stabilizes RNA in blood samples during collection and storage | Both platforms [1] |
| GLOBINclear Kit | Depletes globin mRNA to improve signal in blood samples | Both platforms [1] |
| GeneChip 3' IVT Express Kit | Amplifies and labels RNA for microarray hybridization | Microarray [1] |
| GeneChip Human Genome U133 Plus 2.0 Array | Contains probes for 54,675 transcripts across 20,174 genes | Microarray [1] |
| Poly(A) mRNA Magnetic Isolation Module | Enriches for mRNA through poly-A tail selection | RNA-Seq [1] |
| NEBNext Ultra II RNA Library Prep Kit | Prepares sequencing libraries from RNA samples | RNA-Seq [1] |
| Stranded mRNA Prep Kit | Prepares directional RNA-Seq libraries | RNA-Seq [2] |
| Biotinylated Nucleotides | Incorporates label for microarray detection | Microarray [4] |
| Platform-Specific Sequencing Adapters | Enables binding to flow cell and cluster generation | RNA-Seq [6] |
| Quality Control Reagents | Assesses RNA integrity and library quality | Both platforms [4] |
Hybridization-based and sequencing-based technologies for gene expression quantification represent complementary rather than mutually exclusive approaches for transcriptome profiling. While RNA-Seq offers clear technical advantages in dynamic range, sensitivity, and discovery potential, microarray technology maintains relevance due to lower costs, simpler data analysis, and extensive legacy data resources. The choice between platforms should be guided by specific research objectives, with RNA-Seq preferred for exploratory studies requiring novel transcript discovery, and microarrays remaining viable for focused hypothesis testing, especially in contexts like toxicogenomic screening where pathway identification and benchmark concentration modeling are primary goals.
The research community's growing experience with both technologies suggests that appropriate statistical analysis and experimental design can yield highly concordant biological insights regardless of platform. As computational methods continue to evolve, particularly for integrating and reanalyzing legacy datasets, both hybridization and sequencing data will remain valuable resources for understanding gene expression in health, disease, and chemical response.
In the field of transcriptomics, two primary technologies have dominated the landscape for genome-wide gene expression analysis: microarrays and RNA sequencing (RNA-seq). These technologies fundamentally differ in how they capture and represent molecular data, utilizing distinct data structures that significantly influence downstream analytical outcomes. Microarrays generate data based on continuous fluorescence intensity measurements, relying on the hybridization affinity of predefined labeled probes to target cDNA sequences. In contrast, RNA-seq produces discrete digital read counts through direct sequencing of cDNA strands via next-generation sequencing technologies [7]. This fundamental distinction in data acquisition creates ripple effects throughout the analytical pipeline, particularly affecting methods like Principal Component Analysis (PCA) which is sensitive to the underlying data structure and variance composition.
The choice between these technologies extends beyond mere technical preference, influencing the dynamic range, sensitivity, reproducibility, and analytical capabilities of transcriptomic studies. As research increasingly focuses on detecting subtle differential expression patterns in complex biological systems—such as distinguishing between disease subtypes or stages—understanding how these data structures perform in multivariate analyses like PCA becomes critical for drawing accurate biological conclusions [8]. This guide provides an objective comparison of these technologies, with particular emphasis on their performance characteristics in PCA applications.
Technology Comparison: Fundamental Principles and Performance Characteristics
Operational Principles and Data Generation
Microarray Technology: Microarrays employ a hybridization-based approach where fluorescently labeled cDNA molecules bind to complementary DNA probes attached to a solid surface. The resulting signal is a continuous fluorescence intensity value that represents the relative abundance of specific RNA transcripts. This technology requires prior knowledge of the sequence for probe design and detects only predefined transcripts [7]. The data structure is inherently analog in nature, with intensity measurements suffering from limitations including background fluorescence, signal saturation at high abundance levels, and nonspecific binding [4].
RNA-Seq Technology: RNA-seq utilizes direct sequencing of cDNA molecules through next-generation sequencing platforms. This produces discrete, digital read counts that represent the number of times a particular transcript fragment has been sequenced. Unlike microarrays, RNA-seq does not require pre-specified probes and can detect novel transcripts, including previously unannotated genes, splice variants, gene fusions, and non-coding RNAs [2]. The digital nature of counting individual molecules provides a fundamentally different data structure with different statistical properties for downstream analysis.
Performance Comparison and Quantitative Metrics
Table 1: Comprehensive Comparison of Microarray and RNA-Seq Performance Characteristics
| Performance Parameter | Microarray Technology | RNA-Seq Technology |
|---|---|---|
| Basic Principle | Hybridization-based detection | Sequencing-based counting |
| Data Structure | Continuous fluorescence intensity | Discrete digital read counts |
| Dynamic Range | ~10³ [2] | >10⁵ [2] |
| Background Noise | High due to nonspecific binding [4] | Low, especially with unique mapping |
| Dependence on Prior Knowledge | Required for probe design [7] | Not required; can detect novel features |
| Reproducibility | High between technical replicates [9] | Higher stochastic variability [9] |
| Sensitivity for Low-Abundance Transcripts | Limited by background fluorescence [2] | Can be enhanced by increasing sequencing depth [2] |
| Cost Considerations | Lower per sample [4] | Higher per sample, but decreasing |
| Sample Throughput | High for standardized designs | Variable depending on sequencing depth |
Experimental Protocols for Technology Comparison
Microarray Experimental Workflow
The standard protocol for gene expression microarrays follows these key steps:
RNA Extraction and Quality Control: Total RNA is extracted from biological samples using kits such as miRNeasy Mini Kit (Qiagen). RNA quality is assessed using spectrophotometry (NanoDrop) and bioanalyzer systems (Agilent 2100 Bioanalyzer) to ensure RNA Integrity Number (RIN) >7 [9].
cDNA Synthesis and Labeling: RNA (typically 50-100 ng) is reverse-transcribed into complementary DNA (cDNA) while incorporating fluorescent labels (e.g., Cy3 or Cy5 dyes) using kits such as the GeneChip WT Plus Reagent Kit [9].
Hybridization: Labeled cDNA is hybridized to a microarray chip containing immobilized DNA probes. This process typically occurs over 16-20 hours at controlled temperatures to ensure specific binding [9].
Washing and Scanning: After hybridization, the array is washed to remove non-specifically bound cDNA and then scanned using a laser scanner to detect fluorescence signals at each probe location [9].
Image Processing and Data Extraction: The scanned image is processed to convert fluorescence signals into quantitative intensity values. Background correction and normalization are applied to generate final expression values [9].
RNA-Seq Experimental Workflow
The standard protocol for RNA sequencing involves these critical steps:
RNA Extraction and Quality Control: Similar to microarray protocols, total RNA is extracted and quality is verified using RIN scores to ensure sample integrity [9].
Library Preparation: This critical step involves several sub-steps:
- rRNA Depletion or poly-A Selection: Either ribosomal RNA is removed using probes, or mRNA is enriched using oligo(dT) beads to capture polyadenylated transcripts [4].
- Fragmentation: RNA is fragmented into appropriate sizes for sequencing (typically 200-500 bp).
- cDNA Synthesis: Fragmented RNA is reverse-transcribed into double-stranded cDNA.
- Adapter Ligation: Sequencing adapters are ligated to cDNA fragments to facilitate amplification and sequencing. Common kits include Illumina Stranded mRNA Prep kit or TruSeq Total RNA Sample Preparation Kit [4] [9].
Sequencing: The prepared libraries are sequenced using platforms such as Illumina HiSeq, NovaSeq, or similar systems, generating millions to billions of short sequence reads [9].
Bioinformatic Processing:
- Quality Control: Raw sequence data is assessed using tools like FastQC to evaluate base quality scores, GC content, and potential contaminants.
- Alignment: Reads are mapped to a reference genome using aligners such as STAR or HISAT2 [10].
- Quantification: Expression levels are estimated by counting reads that align to specific genomic features using tools like featureCounts or HTSeq.
Figure 1: Comparative Experimental Workflows for Microarray and RNA-Seq Technologies
PCA Performance in Analytical Context
Data Structure Implications for Multivariate Analysis
The performance of Principal Component Analysis on transcriptomic data is significantly influenced by the underlying data structure of each technology. PCA operates by identifying directions of maximum variance in high-dimensional datasets, and the fundamental differences between continuous fluorescence intensities and digital read counts create distinct variance patterns:
Variance Structure: Microarray data, with its continuous intensity measurements, demonstrates variance that is often more homoscedastic across expression levels. RNA-seq digital count data follows Poisson or negative binomial distributions where variance increases with mean expression level, requiring specialized normalization approaches before PCA [10].
Signal-to-Noise Characteristics: A multi-center study comparing both technologies found that PCA-based signal-to-noise ratio (SNR) values varied significantly between platforms, with microarrays sometimes demonstrating better reproducibility in detecting subtle differential expression when biological differences between sample groups are small [8]. RNA-seq may show higher stochastic variability, particularly for low-abundance transcripts, which can affect the separation of samples in principal component space [9].
Batch Effect Sensitivity: Both technologies are susceptible to batch effects, but RNA-seq demonstrates particularly pronounced technical variations arising from differences in library preparation protocols, sequencing depth, and bioinformatic processing choices. These technical artifacts can dominate the principal components if not properly addressed, potentially obscuring biological signals [8] [10].
Impact on Detection of Biologically Relevant Patterns
Table 2: PCA Performance Comparison for Microarray and RNA-Seq Data
| Analytical Consideration | Microarray Performance | RNA-Seq Performance |
|---|---|---|
| Separation of Distinct Sample Types | Effective for large biological differences [8] | Excellent for large biological differences; wider dynamic range helps [2] |
| Detection of Subtle Expression Patterns | More stable for small biological differences [8] | Higher variability can mask subtle differences [8] |
| Reproducibility Across replicates | Higher consistency in technical replicates [9] | Higher stochastic variability, especially for low-expression genes [9] |
| Handling of Low-Abundance Transcripts | Limited by background fluorescence and saturation [4] [2] | Can detect rare transcripts but with higher technical noise [2] |
| Data Normalization Requirements | Background correction, quantile normalization [9] | Requires specialized methods (e.g., DESeq2, edgeR) for count data [10] |
| Sensitivity to Technical Artifacts | Probe-specific effects, hybridization efficiency | Batch effects from library prep, sequencing depth [8] |
Figure 2: Relationship Between Data Structures and PCA Performance Outcomes
Research Reagent Solutions for Transcriptomics Studies
Table 3: Essential Research Reagents and Platforms for Transcriptomic Technologies
| Reagent/Platform | Function | Technology Application |
|---|---|---|
| Affymetrix GeneChip PrimeView Arrays | Pre-designed microarray chips for gene expression profiling | Microarray analysis [4] |
| Affymetrix HTA 2.0 Arrays | Human Transcriptome Arrays with probes covering exons and junctions | Comprehensive transcriptome analysis [9] |
| Illumina Stranded mRNA Prep Kit | Library preparation for RNA-seq with strand specificity | RNA-seq library construction [4] |
| TruSeq Total RNA Sample Preparation Kit | Library preparation with ribosomal RNA depletion | RNA-seq of total RNA including non-polyadenylated transcripts [9] |
| GeneChip WT Plus Reagent Kit | Target labeling and amplification for microarray analysis | Microarray sample processing [9] |
| miRNeasy Mini Kit (Qiagen) | Total RNA extraction including small RNAs | Sample preparation for both technologies [9] |
| Agilent 2100 Bioanalyzer | RNA quality assessment using microfluidics | Quality control for both technologies [9] |
| EZ1 RNA Cell Mini Kit | Automated RNA purification system | RNA extraction for transcriptomic studies [4] |
The choice between microarray and RNA-seq technologies for transcriptomic studies involves careful consideration of research goals, analytical priorities, and practical constraints. Each technology produces fundamentally different data structures—continuous fluorescence intensities versus digital read counts—that significantly impact PCA performance and biological interpretation.
Microarray technology, with its continuous intensity data structure, demonstrates advantages in reproducibility and cost-efficiency, particularly for studies focused on detecting subtle differential expression between similar sample types. The technology's maturity, standardized analytical pipelines, and lower per-sample cost make it suitable for large-scale studies where the target transcripts are well-annotated and biological differences may be subtle [4] [8] [9].
RNA-seq technology offers unparalleled discovery power through its digital read count data structure, providing a wider dynamic range and ability to detect novel transcripts and isoforms. While demonstrating excellent performance for distinguishing samples with large biological differences, its higher stochastic variability requires careful experimental design and more complex bioinformatic processing. The technology is particularly valuable for exploratory studies, applications requiring detection of novel features, or when analyzing transcriptomes without complete annotation [2] [8].
For PCA applications specifically, researchers should consider that microarray data often provides more stable results for detecting subtle patterns in similar samples, while RNA-seq excels at global profiling of diverse sample types. The decision matrix should incorporate study objectives, sample types, bioinformatic capabilities, and budget constraints to select the most appropriate technology for the specific research context.
The choice between microarray and RNA sequencing (RNA-seq) technologies represents a fundamental decision in transcriptomic research, with significant implications for data interpretation and biological conclusions. Within the specific context of performing Principal Component Analysis (PCA)—a core method for visualizing sample relationships and reducing data dimensionality—understanding the inherent technical biases of each platform is crucial. These biases, rooted in the underlying measurement principles of each technology, can directly influence the variance structure of the dataset and consequently, the outcome of PCA. This guide provides an objective, data-driven comparison of microarray and RNA-seq performance, focusing on the key parameters of dynamic range, background noise, and detection limits, and their impact on transcriptomic analysis.
Fundamental Technological Differences and Their Biases
The distinct operational principles of microarrays and RNA-seq are the direct cause of their differing technical biases. The following workflow illustrates the key steps where these biases are introduced.
Experimental Workflow and Source of Bias
Figure 1: Experimental workflows for Microarray and RNA-seq technologies. The points where key technical biases are introduced are highlighted, which subsequently influence the variance structure critical for PCA.
Microarray Technology relies on hybridization-based detection, where fluorescently labeled cDNA molecules bind to complementary DNA probes attached to a solid surface [4] [2]. The signal is measured as fluorescence intensity, an analog measurement. This process is susceptible to cross-hybridization, where non-specific binding occurs, and signal saturation for highly expressed transcripts [11] [2]. The technology is limited to detecting only the transcripts for which probes were pre-designed.
RNA-seq Technology is based on sequencing-by-synthesis, which involves fragmenting RNA, converting it to a cDNA library, and digitally counting the number of sequences (reads) that align to a reference genome or transcriptome [4] [2]. This digital counting method avoids many of the hybridization-related issues inherent to microarrays and is not constrained by pre-defined probes, allowing for the discovery of novel transcripts [12] [2].
Quantitative Comparison of Technical Parameters
The fundamental differences in technology translate into quantifiable disparities in performance. The following table summarizes the direct comparison of key technical parameters that influence data quality and analytical outcomes.
Table 1: Direct comparison of technical performance parameters between Microarray and RNA-seq.
| Technical Parameter | Microarray | RNA-seq | Supporting Experimental Evidence |
|---|---|---|---|
| Dynamic Range | ~10³ [2] | >10⁵ [2] | RNA-seq's digital counting does not suffer from signal saturation at the high end or background limitation at the low end, unlike analog fluorescence detection in microarrays [12] [2]. |
| Background Noise | High, due to cross-hybridization and non-specific binding [11] [12]. | Low, due to specific alignment of sequences to the genome [12] [13]. | Microarray data shows a consistent background fluorescence level requiring background subtraction algorithms, while RNA-seq noise is more random and can be modeled and filtered computationally [11] [13]. |
| Detection Limit & Sensitivity | Lower sensitivity, especially for low-abundance transcripts [11] [2]. | Higher sensitivity, can detect rare transcripts and weakly expressed genes [11] [2]. | In a T cell activation study, RNA-seq was superior in detecting low-abundance transcripts and identified a larger number of differentially expressed genes (DEGs), particularly those with low expression [11]. |
| Transcript Discovery | Limited to pre-designed probes for known transcripts. | Capable of de novo detection of novel transcripts, splice variants, and gene fusions [2]. | RNA-seq does not rely on existing genome annotation for probe selection, thus avoiding related biases and enabling the discovery of novel features [11] [2]. |
| Data Reproducibility | High intra-platform reproducibility but can suffer from inter-laboratory variability. | Highly reproducible with low technical variation [11]. | A study by Marioni et al. found that RNA-seq data on the Illumina platform was highly reproducible, with relatively little technical variation [11]. |
Impact on PCA and Transcriptomic Analysis
The technical parameters detailed above have a direct and measurable impact on the data structure that serves as input for PCA. The following diagram conceptualizes how platform-specific biases propagate to influence the principal components.
How Biases Influence PCA Results
Figure 2: The propagation of technical biases from raw data to PCA results. The inherent limitations of each platform shape the data's variance structure, which directly determines the principal components.
Variance Structure: PCA operates by identifying the directions of greatest variance in a dataset. RNA-seq's wider dynamic range means that true biological differences in gene expression, from very low to very high, can contribute significantly to these principal components. In contrast, microarray's compressed dynamic range may cause the variance to be dominated by technical factors or a smaller subset of highly expressed genes, potentially obscuring biologically relevant patterns [14].
Impact of Noise: The background noise and cross-hybridization in microarrays introduce a technical variance that is not biologically meaningful. This noise can become a component of the variance captured by the principal components, potentially distorting the sample separation in the PCA plot. RNA-seq's lower background noise helps ensure that the variance analyzed by PCA is more likely to reflect true biological signal [11] [13].
Impact of Detection Limits: The inability of microarrays to detect low-abundance and novel transcripts means that the expression matrix provided to PCA is incomplete. RNA-seq, with its superior sensitivity, provides a more complete picture of the transcriptome. The presence or absence of these additional transcripts can significantly alter the covariance structure of the data, leading to different principal components and sample clustering [11] [2]. For instance, in a study on colorectal cancer, systematic technical biases between platforms led to differences in transcriptomic subtyping, a process often reliant on dimensionality reduction techniques like PCA [14].
Case Study: Experimental Data and Protocols
Experimental Protocol from a Comparative Study
A 2025 study provided a direct, updated comparison using the same biological samples (iPSC-derived hepatocytes exposed to cannabinoids) analyzed on both platforms [4].
- Cell Culture and Exposure: iPSC-derived hepatocytes (iCell Hepatocytes 2.0) were cultured and exposed to a concentration range of cannabichromene (CBC) and cannabinol (CBN) for 24 hours [4].
- RNA Extraction: Total RNA was purified using an automated RNA purification instrument (Qiagen EZ1 Advanced XL) with an on-column DNase digestion step. RNA quality was assessed for integrity (RIN) using an Agilent 2100 Bioanalyzer [4].
- Microarray Processing: Total RNA (100 ng) was processed using the GeneChip 3' IVT PLUS Reagent Kit (Affymetrix) and hybridized to GeneChip PrimeView Human Gene Expression Arrays. Scanned images were processed using the Robust Multi-chip Average (RMA) algorithm for background adjustment, quantile normalization, and summarization [4].
- RNA-seq Processing: Sequencing libraries were prepared from 100 ng of total RNA using the Illumina Stranded mRNA Prep, Ligation Kit, which includes poly-A selection of mRNA. Libraries were sequenced on an Illumina platform to generate a typical output of 50 million paired-end reads per sample [4] [1].
Key Findings and Quantitative Data
Despite the profound technical differences, this study found that the two platforms could yield similar functional conclusions, though with important distinctions in the raw data [4].
Table 2: Key experimental findings from the comparative study of CBC and CBN [4].
| Analysis Metric | Microarray Results | RNA-seq Results | Interpretation |
|---|---|---|---|
| Overall Gene Expression Patterns | Similar concentration-dependent patterns for both CBC and CBN. | Similar concentration-dependent patterns for both CBC and CBN. | Both platforms captured the overall global response to chemical exposure consistently. |
| Number of Differentially Expressed Genes (DEGs) | Fewer DEGs identified. | Larger numbers of DEGs identified, with a wider dynamic range. | RNA-seq's higher sensitivity and dynamic range allowed detection of more subtle and extreme expression changes. |
| Functional Enrichment (GSEA) | Equivalent performance in identifying impacted functions and pathways. | Equivalent performance in identifying impacted functions and pathways. | Downstream functional analysis converged despite differences in the initial DEG list. |
| Transcriptomic Point of Departure (tPoD) | tPoD values were on the same level for both compounds. | tPoD values were on the same level for both compounds. | For quantitative concentration-response modeling, both platforms performed equivalently in this context. |
Another study on human peripheral blood cells further illustrates the scale of the difference in detection power. RNA-seq identified 2,395 differentially expressed genes (DEGs) between study groups, while microarray identified only 427 DEGs, with an overlap of 223 genes between the platforms [1]. This demonstrates that while there is concordance for a core set of genes, RNA-seq provides access to a much broader spectrum of the transcriptome's dynamics.
The Scientist's Toolkit: Essential Reagent Solutions
Table 3: Key research reagents and kits used in the featured experimental protocols.
| Reagent / Kit | Function | Example Use Case |
|---|---|---|
| Qiagen EZ1 RNA Cell Mini Kit | Purification of total intracellular RNA, including an on-column DNase digestion step to remove genomic DNA contamination. | RNA extraction from iPSC-derived hepatocytes for both microarray and RNA-seq [4]. |
| Agilent RNA 6000 Nano Kit | Assessment of RNA integrity (RIN) using the Agilent 2100 Bioanalyzer, a critical quality control step prior to library preparation. | QC of total RNA samples to ensure only high-quality (RIN > 7) RNA is used for downstream analysis [4] [1]. |
| GeneChip 3' IVT PLUS Reagent Kit (Affymetrix) | For amplification, biotin-labeling, and fragmentation of complementary RNA (cRNA) for microarray hybridization. | Target preparation for hybridization to Affymetrix GeneChip arrays [4] [1]. |
| Illumina Stranded mRNA Prep, Ligation Kit | Poly-A selection of mRNA and construction of strand-specific sequencing libraries for Illumina platforms. | RNA-seq library preparation from total RNA [4] [1]. |
| PAXgene Blood RNA Kit | Stabilization of RNA and extraction from whole blood samples, preserving the in vivo transcriptome profile. | RNA isolation for transcriptomic studies using human whole blood [1]. |
| GLOBINclear Kit | Depletion of globin mRNA from whole blood RNA samples to increase sequencing depth on non-globin transcripts. | Globin reduction to improve detection of non-erythrocyte transcripts in human blood studies [1]. |
Both microarray and RNA-seq technologies are capable of generating robust transcriptomic data for PCA and other analyses, as evidenced by their concordance in high-level pathway identification and concentration-response modeling [4]. However, they are not interchangeable. The choice of platform has a profound effect on the underlying data structure.
- RNA-seq offers clear technical advantages in dynamic range, sensitivity, and specificity, which generally provide a more complete and accurate representation of the transcriptome's variance. This leads to PCA results that are more likely to be driven by true biological differences across the full spectrum of gene expression.
- Microarray technology, while lower in cost and benefiting from well-established analysis pipelines and public databases, is constrained by its hybridization-based chemistry. The resulting biases can compress variance and introduce technical noise, which may influence the principal components.
Researchers must align their choice of technology with their experimental goals. For discovery-phase research, detection of low-abundance transcripts, or when analyzing organisms without a well-defined genome, RNA-seq is the superior choice. For focused studies where the transcripts of interest are well-characterized and highly expressed, or where budget and data storage are primary constraints, microarrays remain a viable and effective tool. Critically, when integrating public datasets for meta-analysis or building predictive models, investigators must account for platform-specific technical biases to ensure accurate and reproducible biological insights.
Principal Component Analysis (PCA) remains an essential exploratory tool for transcriptomic studies, serving critical roles in quality assessment, outlier detection, and visualization of sample relationships in high-dimensional gene expression data [15] [5]. The fundamental objective of PCA is dimensionality reduction—transforming thousands of gene expression measurements into a simplified set of uncorrelated principal components that capture the greatest variance within the dataset [16] [17]. The first principal component (PC1) aligns with the largest source of variance, followed by PC2 capturing the next largest remaining variance, and so on [18].
The application of PCA, however, is profoundly influenced by the underlying properties of the input data. This guide provides a systematic comparison of how these data properties—specifically linearity assumptions and variance structure—manifest differently in microarray and RNA-seq technologies, ultimately affecting PCA performance and interpretation. Understanding these technical distinctions is crucial for researchers, scientists, and drug development professionals working with transcriptomic data across platforms.
Fundamental Technological Differences Between Microarray and RNA-Seq
Microarray technology, the established platform for over a decade, employs a hybridization-based approach to profile transcriptome-wide gene expression by measuring fluorescence intensity of predefined transcripts [4]. In contrast, RNA-seq, which emerged in the mid-2000s, is based on counting reads that can be reliably aligned to a reference sequence, providing a wider dynamic range and ability to detect novel transcripts including splice variants and non-coding RNAs [4] [11].
Table 1: Core Technological Differences Between Platforms
| Feature | Microarray | RNA-Seq |
|---|---|---|
| Measurement Basis | Fluorescence intensity from hybridization [4] | Read counting via sequencing [4] |
| Dynamic Range | Limited [4] [11] | Broader [4] [11] |
| Background Noise | Higher due to nonspecific binding [4] | Lower [4] |
| Transcript Coverage | Predefined transcripts only [4] [19] | Whole transcriptome, including novel transcripts [4] [19] |
| Data Structure | Continuous intensity values [4] | Count-based data [11] |
These fundamental technological differences directly impact the data properties relevant to PCA—particularly the variance structure and dynamic range—which we explore in the following sections.
Impact of Variance Structure and Dynamic Range on PCA
Variance Characteristics by Platform
The variance structure embedded in gene expression data directly dictates how PCA prioritizes components. RNA-seq demonstrates a broader dynamic range than microarray, allowing for detection of more differentially expressed genes with higher fold-change [11]. This expanded dynamic range means RNA-seq captures more extreme expression values, which can disproportionately influence principal component directions if not properly addressed.
Microarray data typically exhibits more constrained variance structure due to technological limitations including background noise and nonspecific binding [4]. The predefined transcript detection also means unexpected sources of biological variation may remain undetected, potentially limiting the biological insights obtainable through PCA.
Evidence from Comparative Studies
Comparative studies consistently demonstrate that RNA-seq identifies more differentially expressed protein-coding genes and provides a wider quantitative range of expression level changes compared to microarrays [19]. One toxicogenomic study found approximately 78% of DEGs identified with microarrays overlapped with RNA-seq data, with Spearman's correlation ranging from 0.7 to 0.83 [19]. Despite this discordance, both platforms often identify similar enriched biological pathways, though RNA-seq may provide additional mechanistic insights through detection of more comprehensive gene sets [19].
Normalization Methods and Their Impact on PCA
The Critical Role of Normalization
Normalization of gene expression data represents an essential preprocessing step that significantly impacts subsequent PCA results [20]. As PCA is fundamentally based on covariance patterns [16], normalization methods that alter variance structure will directly influence component derivation. One comprehensive evaluation of twelve normalization methods applied to RNA-seq data found that while PCA score plots often appear similar across normalization techniques, the biological interpretation of the models can depend heavily on the normalization method applied [20].
Platform-Specific Normalization Considerations
For microarray data, the Robust Multi-chip Average (RMA) algorithm is commonly employed, consisting of background adjustment, quantile normalization, and summarization steps [4]. RNA-seq data requires distinct normalization approaches accounting for its count-based nature, with methods like DESeq2's median-of-ratios providing effective normalization [15].
Table 2: Normalization Methods for Cross-Platform Analysis
| Normalization Method | Mechanism | Effect on PCA Variance Structure |
|---|---|---|
| Quantile Normalization (QN) | Forces all samples to have identical empirical distribution [21] | Standardizes variance across platforms, enabling combined analysis [21] |
| Training Distribution Matching (TDM) | Transforms RNA-seq to match microarray distribution [21] | Makes variance structures comparable for machine learning applications [21] |
| Nonparanormal Normalization (NPN) | Semiparametric approach using truncated empirical distribution [21] | Preserves more platform-specific variance characteristics [21] |
| Z-score Standardization | Centers to mean and scales by standard deviation [21] | Can introduce variability if platforms have different mean-variance relationships [21] |
Cross-Platform Normalization Strategies
When integrating datasets from both platforms, cross-platform normalization becomes essential. Recent research indicates that quantile normalization and Training Distribution Matching allow for supervised and unsupervised model training on microarray and RNA-seq data simultaneously [21]. Nonparanormal normalization and z-scores are also appropriate for some applications, including pathway analysis [21].
Experimental Protocols for Platform Comparison
Sample Preparation and Processing
For meaningful comparison between platforms, the same RNA samples should be used for both microarray and RNA-seq analysis [19]. In practice, total RNA is extracted from biological samples (e.g., liver tissue from rat toxicity studies), with aliquots of the same total RNA samples used as input for each platform [19].
Microarray Protocol:
- Process samples using platform-specific kits (e.g., GeneChip 3' IVT PLUS Reagent Kit for Affymetrix)
- Hybridize to appropriate arrays (e.g., GeneChip PrimeView Human Gene Expression Arrays)
- Scan chips and process image files using manufacturer's software [4]
- Normalize data using RMA algorithm with background adjustment, quantile normalization, and summarization [4]
RNA-seq Protocol:
- Prepare sequencing libraries using kit-based approaches (e.g., Illumina Stranded mRNA Prep)
- Sequence on appropriate platform (e.g., NextSeq500)
- Generate FastQ files and align to reference genome using specialized tools (e.g., OSA4)
- Quantify expression as counts or RPKM/FPKM values [19]
PCA Implementation and Analysis
The following workflow diagram illustrates the key steps in performing PCA for transcriptomic data:
For RNA-seq data specifically, the computational implementation typically involves:
Critical considerations during implementation include whether to scale variables (divide by standard deviation) before PCA. By default, the prcomp() function centers but does not scale the data, which may be appropriate for log-transformed RNA-seq data but should be carefully considered based on the specific research context [18] [16].
The Scientist's Toolkit: Essential Research Reagents and Computational Tools
Table 3: Essential Research Reagents and Computational Tools
| Item | Function/Purpose | Example Products/Implementations |
|---|---|---|
| RNA Isolation Kits | Extract high-quality total RNA from biological samples | Qiazol extraction with on-column DNase I treatment [19] |
| Microarray Platforms | Hybridization-based transcriptome profiling | Affymetrix GeneChip PrimeView Arrays [4] |
| RNA-seq Library Prep Kits | Prepare sequencing libraries from RNA | Illumina Stranded mRNA Prep Kit [19] |
| Quality Control Instruments | Assess RNA integrity | Agilent 2100 Bioanalyzer with RNA Nano Kit [19] |
| PCA Implementations | Compute principal components | R's prcomp(), PCA() from FactoMineR [18] [5] |
| Interactive Visualization Tools | Explore PCA results interactively | pcaExplorer R/Bioconductor package [15] |
| Cross-Platform Normalization Methods | Enable integrated analysis of microarray and RNA-seq | Quantile Normalization, Training Distribution Matching [21] |
The pcaExplorer package deserves special mention as it provides a user-friendly Shiny interface for interactive exploration of PCA results, specifically designed for RNA-seq data [15]. This tool enhances standard analysis workflows by providing state saving and automated creation of reproducible reports, facilitating more efficient exploratory data analysis [15].
The properties of input data—particularly variance structure and dynamic range—significantly impact PCA performance and interpretation for transcriptomic studies. RNA-seq technology offers advantages in detecting more differentially expressed genes with wider dynamic range, while microarray benefits from established analysis pipelines and lower computational requirements. The selection between platforms should be guided by research objectives, with RNA-seq preferred for novel discovery and microarray remaining viable for focused hypothesis testing.
Successful application of PCA requires careful consideration of normalization strategies, especially when integrating data across platforms. Quantile normalization and Training Distribution Matching emerge as effective approaches for cross-platform analysis, enabling researchers to leverage the growing volumes of publicly available transcriptomic data. As sequencing costs continue to decrease and analysis methods improve, RNA-seq will likely become the predominant platform, though understanding the variance structure differences between technologies remains essential for proper experimental design and data interpretation.
Principal Component Analysis (PCA) is a fundamental statistical technique for dimensionality reduction, widely used to explore high-dimensional transcriptomic data. It transforms potentially correlated variables into a smaller set of uncorrelated principal components that retain most of the original information [22]. The performance and interpretability of PCA are heavily influenced by data preprocessing decisions, particularly normalization and transformation methods. This guide provides an objective comparison of how these preprocessing choices affect PCA outcomes when applied to the two dominant transcriptomic technologies: microarrays and RNA sequencing (RNA-seq). Understanding these relationships is crucial for researchers, scientists, and drug development professionals seeking to extract meaningful biological insights from their data.
Fundamental Technology Differences
Microarrays and RNA-seq employ fundamentally different principles for transcriptome profiling. Microarrays utilize a hybridization-based approach where fluorescently-labeled cDNA samples bind to predefined probes on a chip, with signal intensity indicating expression levels [7]. This technology requires prior knowledge of the sequences being detected. In contrast, RNA-seq is a sequencing-based method that involves converting RNA to complementary DNA (cDNA) followed by high-throughput sequencing to generate reads that are counted and mapped to a reference genome or transcriptome [7] [23].
Comparative Strengths and Limitations
Table 1: Key Technical Differences Between Microarray and RNA-seq Technologies
| Feature | Microarray | RNA-seq |
|---|---|---|
| Detection Principle | Hybridization to predefined probes | Direct sequencing of cDNA fragments |
| Prior Sequence Knowledge Required | Yes | No |
| Dynamic Range | ~10³ [7] | >10⁵ [7] |
| Ability to Detect Novel Transcripts | Limited | Extensive (splice variants, non-coding RNAs) [4] [7] |
| Background Noise | Higher | Lower |
| Data Type | Fluorescence intensity | Digital read counts |
| Typical Data Size | Smaller | Larger |
RNA-seq offers several technical advantages including a wider dynamic range, higher sensitivity for detecting low-abundance transcripts, and the ability to identify novel genes, splice variants, and non-coding RNAs [7]. However, microarrays maintain benefits including lower cost, simpler data analysis pipelines, and more established analytical software and reference databases [4].
Preprocessing Fundamentals for Transcriptomic Data
The Critical Role of Normalization
Normalization adjusts for technical variations to ensure that expression differences reflect true biological signals rather than artifacts of measurement. For both microarray and RNA-seq data, normalization addresses issues such as varying sample concentrations, hybridization efficiencies, and sequencing depths [10] [23]. The necessity and implementation of normalization, however, differ between platforms.
In RNA-seq analysis, raw counts cannot be directly compared between samples because the number of reads mapped to a gene depends not only on its true expression level but also on the total sequencing depth for that sample [23]. Normalization mathematically adjusts these counts to remove such biases. For microarray data, normalization addresses issues with background fluorescence, uneven hybridization, and probe-specific effects.
PCA and its Dependence on Data Structure
PCA is a linear dimensionality reduction technique that identifies the directions (principal components) of maximum variance in a dataset [22] [24]. The first principal component (PC1) captures the greatest variance, with subsequent components accounting for remaining variation in decreasing order while being orthogonal to previous components [22]. How variance is distributed across genes and samples directly impacts PCA results, making appropriate preprocessing critical for meaningful analysis.
As [20] demonstrates, normalization methods directly influence correlation patterns in the data, which in turn affects the PCA model complexity, sample clustering in the low-dimensional space, and biological interpretation of the components.
Platform-Specific Preprocessing Workflows
Microarray Preprocessing Pipeline
Microarray preprocessing typically involves background correction, normalization, and summarization. The robust multi-chip average (RMA) algorithm is commonly employed, consisting of three steps: background adjustment, quantile normalization, and summarization of probe-level data to generate expression values [4].
Figure 1: Standard microarray preprocessing workflow prior to PCA
RNA-seq Preprocessing Pipeline
RNA-seq preprocessing involves more complex steps including quality control, adapter trimming, read alignment, and quantification. The normalization approach must be carefully selected based on the experimental design and research questions.
Figure 2: Comprehensive RNA-seq preprocessing workflow prior to PCA
Normalization Methods and Their Impact on PCA
RNA-seq Normalization Techniques
Multiple normalization approaches exist for RNA-seq data, each with different implications for PCA outcomes:
- Shifted Logarithm: A simple approach using log(count + pseudo-count), where the pseudo-count choice significantly affects results [25]. The relationship between pseudo-count (y₀) and overdispersion (α) is y₀ = 1/(4α) [25].
- Variance-Stabilizing Transformation (VST): Based on the delta method, with the acosh transformation (1/√α × acosh(2αy + 1)) being theoretically optimal for gamma-Poisson distributed data [25].
- Pearson Residuals: Calculated as (ygc - μ̂gc)/√(μ̂gc + α̂gμ̂gc²), where μ̂gc and α̂_g come from fitting a gamma-Poisson generalized linear model [25]. This approach better handles size factor variations compared to delta method-based transformations.
Comparative Performance of Normalization Methods
Table 2: Impact of Normalization Methods on PCA Performance
| Normalization Method | PCA Cluster Separation | Technical Noise Removal | Biological Signal Preservation | Recommendation Context |
|---|---|---|---|---|
| Shifted Logarithm | Variable (depends on pseudo-count) | Moderate | Moderate | Good default choice [25] |
| VST (acosh) | Theoretical optimal, practical limitations | Good | Good | When size factors are similar |
| Pearson Residuals | Good, especially with varying size factors | Excellent | Good | Recommended for datasets with varying sequencing depths [25] |
| Quantile Normalization | Good for cross-platform comparisons | Good | Moderate | Microarray focus, cross-study RNA-seq [10] |
| CPM (Counts Per Million) | Poor (overdispersions underestimated) | Poor | Poor | Not recommended for PCA [25] |
Research indicates that while PCA score plots may appear similar across different normalization methods, the biological interpretation of the models can differ significantly [20]. A comprehensive evaluation of 12 normalization methods found that correlation patterns in normalized data varied substantially depending on the method used, directly impacting PCA interpretation [20].
Experimental Evidence: Platform Comparisons with PCA
Case Study: Toxicogenomic Applications
A comparative study of rat liver samples exposed to hepatotoxicants found that both RNA-seq and microarray platforms revealed similar overall gene expression patterns in PCA [19]. However, RNA-seq identified more differentially expressed protein-coding genes and provided a wider quantitative range of expression level changes [19]. Despite these technical differences, both platforms displayed equivalent performance in identifying functions and pathways impacted by compound exposure through gene set enrichment analysis.
In a study comparing cannabinoids (CBC and CBN), both platforms revealed similar overall gene expression patterns with regard to concentration, and transcriptomic point of departure values derived through benchmark concentration modeling were equivalent between platforms [4]. This suggests that for traditional transcriptomic applications like mechanistic pathway identification, microarrays remain a viable choice.
Performance in Classification Contexts
When PCA is used as a preprocessing step for classification, the choice of normalization significantly impacts outcomes. Research on RNA-seq data preprocessing pipelines for transcriptomic predictions across independent studies found that batch effect correction improved performance when classifying tissue of origin against an independent GTEx test dataset [10]. However, the same preprocessing operations worsened classification performance when the independent test dataset was aggregated from separate studies in ICGC and GEO [10].
Practical Guidelines for Researchers
Platform Selection Guidelines
Table 3: Platform Recommendation Based on Research Objectives
| Research Goal | Recommended Platform | Rationale | Optimal Preprocessing for PCA |
|---|---|---|---|
| Novel Transcript Discovery | RNA-seq | Ability to detect unknown transcripts [7] | Pearson residuals or VST |
| Traditional Pathway Analysis | Either (platforms equivalent) [4] | Similar functional enrichment results | Platform-specific standard methods |
| Large-Scale Studies with Budget Constraints | Microarray | Lower cost, smaller data size [4] | RMA with quantile normalization |
| Detection of Low-Abundance Transcripts | RNA-seq | Superior sensitivity [7] | Pearson residuals with careful quality control |
| Concentration-Response Modeling | Either (platforms equivalent) [4] | Similar point of departure values | Platform-specific standard methods |
Essential Research Reagents and Tools
Table 4: Key Research Reagent Solutions for Transcriptomic Studies
| Item | Function | Platform Application |
|---|---|---|
| TruSeq Stranded mRNA Library Prep Kit | RNA-seq library preparation | RNA-seq [19] |
| GeneChip PrimeView Human Gene Expression Arrays | Microarray hybridization | Microarray [4] |
| Qiazol | RNA extraction and purification | Both platforms [19] |
| DNase I | Genomic DNA removal | Both platforms [19] |
| BioAnalyzer with RNA 6000 Nano Reagent Kit | RNA quality assessment (RIN) | Both platforms [4] |
| STAR Aligner | RNA-seq read alignment | RNA-seq [10] |
| HTSeq-count/featureCounts | Read quantification | RNA-seq [23] |
Decision Framework for Preprocessing Choices
Figure 3: Preprocessing decision framework for optimal PCA performance
The optimal performance of Principal Component Analysis on transcriptomic data is inextricably linked to appropriate preprocessing decisions. While RNA-seq offers technical advantages in detection range and novelty, microarray platforms remain competitive for traditional applications, particularly when considering cost and analytical maturity. The choice of normalization method significantly influences PCA outcomes, with methods like Pearson residuals generally outperforming simpler approaches for RNA-seq data, especially with varying size factors. Researchers must align their preprocessing pipeline with their biological questions, technical resources, and analytical expertise to ensure that PCA reveals meaningful biological patterns rather than technical artifacts. As both technologies continue to evolve, so too will the preprocessing methodologies that maximize their analytical potential.
Implementing PCA: Best Practices and Workflows for Each Platform
In the field of transcriptomics, researchers must make critical decisions regarding experimental design to ensure robust, interpretable, and biologically relevant results. The choice between microarray and RNA-seq technologies, the determination of appropriate sample size, and the proper implementation of replicates are foundational considerations that directly impact data quality and subsequent conclusions. This guide provides an objective comparison of microarray and RNA-seq performance, with a specific focus on their characteristics in Principal Component Analysis (PCA), supported by experimental data and detailed methodologies.
Platform Technologies: Microarray vs. RNA-Seq
Fundamental Technology Principles
Microarray technology is based on a hybridization-based approach where fluorescently labeled cDNA is detected through hybridization to complementary sequences on a solid surface. The output is a continuous fluorescence intensity measurement, which serves as a proxy for gene expression levels [1]. The technology relies on predefined probes, making it suitable for profiling known sequences [26].
RNA sequencing (RNA-seq) utilizes next-generation sequencing (NGS) of cDNA molecules, providing a digital readout of transcript abundance through direct counting of sequence reads. This platform can identify transcripts not typically detectable by microarrays, including splice variants and non-coding RNAs (e.g., miRNA, lncRNA) [4] [27].
Experimental Workflows
The experimental workflows for both platforms share initial steps but diverge in their core detection methodologies. The following diagram illustrates the key stages for each platform:
Research Reagent Solutions
The following table details essential materials and reagents used in transcriptomics studies:
Table 1: Key Research Reagents and Platforms for Transcriptomic Analysis
| Item Category | Specific Examples | Function in Experiment |
|---|---|---|
| Microarray Platforms | Affymetrix GeneChip PrimeView Human Gene Expression Arrays, Gene Chip Human Genome U133 Plus 2.0 Array [4] [1] | Solid surface with immobilized probes for hybridization-based gene expression detection |
| RNA-seq Library Prep Kits | Illumina Stranded mRNA Prep Kit, NEBNext Ultra II RNA Library Prep Kit for Illumina [4] [1] | Convert RNA to sequencing-ready libraries with appropriate adapters |
| RNA Isolation Kits | PAXgene Blood RNA Kit, EZ1 RNA Cell Mini Kit [4] [1] | Purify high-quality total RNA from biological samples |
| RNA Quality Assessment | Agilent 2100 Bioanalyzer with RNA 6000 Nano Reagent Kit [4] | Assess RNA Integrity Number (RIN) to ensure sample quality |
| Amplification & Labeling | GeneChip 3' IVT PLUS Reagent Kit [4] | Amplify and fluorescently label cDNA for microarray detection |
| Globin Reduction | GLOBINclear Kit [1] | Deplete abundant globin mRNA from blood samples to improve detection of other transcripts |
Experimental Design Fundamentals
Replicates: Technical vs. Biological
Proper experimental replication is crucial for drawing statistically valid conclusions. The distinction between technical replicates and biological replicates is particularly important:
Technical Replicates: Multiple measurements of the same biological sample to account for measurement error and technical variability. These help assess the precision of the experimental protocol but do not provide evidence of biological reproducibility [28] [29].
Biological Replicates: Measurements from different biological sources (e.g., different animals, primary cell cultures from different donors) that account for biological variability. These are essential for making inferences about the population from which the samples were drawn [28].
As noted in one analysis, "if we have multiple measures on a single suspension from one individual mouse, we can only draw a conclusion about that particular suspension from that particular mouse" [28]. This highlights that without proper biological replication, the generalizability of findings is severely limited.
Sample Size Considerations
Determining appropriate sample size is critical for achieving sufficient statistical power. For small sample sizes, optimization-based approaches can be more effective than random assignment for creating statistically equivalent groups [30]. One proposed method matches experimental groups "to minimize the en-masse discrepancies in means and variances," which makes "statistics much more precise, concentrating them tightly around their nominal values while still being unbiased estimates" [30].
In genetic toxicology studies, it has been shown that "for optimal power in statistical testing, it is preferable to use equal total numbers of flies in the control and treated series" [31]. This principle of balanced group sizes applies broadly to transcriptomics experiments.
Performance Comparison: Microarray vs. RNA-Seq
Analytical Capabilities and Data Output
Table 2: Platform Capabilities and Performance Metrics
| Feature | Microarray | RNA-Seq |
|---|---|---|
| Dynamic Range | Limited [4] | Wide [4] |
| Probe/Read Type | Predefined probes [26] | All transcripts, including novel ones [4] |
| Typical DEGs Identified | 427 DEGs (example study) [1] | 2395 DEGs (example study) [1] |
| Pathways Identified | 47 perturbed pathways (example study) [1] | 205 perturbed pathways (example study) [1] |
| Correlation Between Platforms | Median Pearson r = 0.76 [1] | Median Pearson r = 0.76 [1] |
| Cost Considerations | Lower per sample cost [4] | Higher sequencing costs [4] |
| Data Analysis Maturity | Well-established methods [4] | Rapidly evolving algorithms [27] |
Concordance in Differential Expression Analysis
Despite technological differences, studies show significant concordance between platforms when appropriate statistical methods are applied. One comparative analysis using the same blood samples found that "the two platforms displayed equivalent performance in identifying functions and pathways impacted by compound exposure through gene set enrichment analysis (GSEA)" [4]. Furthermore, "transcriptomic point of departure (tPoD) values derived by the two platforms through BMC modeling were on the same levels" [4].
Another study reported that "RNA-seq identified 2395 differentially expressed genes (DEGs), while microarray identified 427 DEGs, with 223 DEGs shared between the two platforms" [1]. The overlap in functional interpretation was greater than the gene-level overlap, with "30 pathways shared" out of 47 identified by microarray and 205 by RNA-seq [1].
PCA Performance and Data Quality Assessment
Data Characteristics Affecting PCA
Principal Component Analysis (PCA) is commonly used to assess data quality and identify sample relationships and batch effects. The different data structures generated by microarray and RNA-seq influence PCA results:
Microarray Data: Continuous, normally distributed fluorescence intensity values (after log transformation) are generally suitable for PCA using conventional Euclidean distance metrics [1].
RNA-seq Data: Count-based data typically follows a negative binomial distribution, requiring variance-stabilizing transformation (VST) or regularized log transformation before PCA to avoid dominance by highly expressed genes [1].
The following diagram illustrates the data processing and PCA evaluation workflow for both platforms:
Metrics for Evaluating PCA Quality
Several metrics can assess PCA quality when comparing platforms:
Percentage of Variance Explained: The cumulative percent variance (CPV) retained by the first k principal components indicates how well the reduced dimensions capture the dataset's structure [32].
Variance of Reconstruction Error (VRE): This method evaluates how well the PCA model reconstructs the original data and can be used to determine the optimal number of components [32].
Information-Theoretic Criteria: Measures such as Rissanen's Minimum Description Length (MDL) provide alternative approaches for component selection [32].
Studies suggest that "CPV is convenient and easy, and does a decent job, but VRE and cross-validation methods are usually better" for evaluating PCA quality [32].
Experimental Protocols for Platform Comparison
Sample Preparation Methodology
For rigorous comparison studies, the same RNA samples should be used for both platforms:
Cell Culture & Treatment: Human iPSC-derived hepatocytes are cultured and exposed to compounds of interest in triplicate, maintaining consistent DMSO concentrations across treatments [4].
RNA Extraction: Total RNA is purified using automated systems (e.g., EZ1 Advanced XL), with DNase digestion to remove genomic DNA contamination [4].
Quality Control: RNA concentration and purity are measured via spectrophotometry (NanoDrop), with RNA integrity determined using microfluidics-based systems (Agilent Bioanalyzer) [4]. Samples should have RIN values above 7 for reliable results [1].
Platform-Specific Processing
Microarray Processing:
- Utilize platform-specific kits (e.g., GeneChip 3' IVT PLUS Reagent Kit) for amplification and labeling [4].
- Hybridize to appropriate arrays (e.g., Affymetrix PrimeView Human Gene Expression Arrays) [4].
- Process raw data (CEL files) with Robust Multi-Array Averaging (RMA) for background correction, quantile normalization, and summarization [4] [1].
RNA-seq Processing:
- Prepare libraries using validated kits (e.g., Illumina Stranded mRNA Prep) with polyA selection [4] [1].
- Sequence on appropriate platforms (e.g., Illumina HiSeq 3000) to achieve sufficient depth (e.g., 50 million paired-end reads per sample) [1].
- Process raw reads with quality control (FastQC), adapter trimming (Trimmomatic), and alignment to reference transcriptomes [1].
Statistical Analysis for Comparison
- Apply consistent non-parametric statistical tests (e.g., Mann-Whitney U test) to both datasets to minimize platform-specific biases [1].
- Use false discovery rate (FDR) correction for multiple comparisons (e.g., Benjamini-Hochberg method) [1].
- Perform functional enrichment analysis using standardized tools (e.g., Ingenuity Pathway Analysis) on both datasets [1].
Both microarray and RNA-seq technologies provide valuable approaches for transcriptomic analysis, with recent studies demonstrating "high correlation in gene expression profiles between microarray and RNA-seq, with a median Pearson correlation coefficient of 0.76" [1]. While RNA-seq offers broader dynamic range and detection of novel transcripts, microarray remains "a viable method of choice for traditional transcriptomic applications such as mechanistic pathway identification and concentration response modeling" [4], particularly considering its lower cost and well-established analytical pipelines.
The choice between platforms should be guided by research objectives, budget constraints, and analytical requirements. For PCA and dimensionality reduction, both platforms can generate high-quality data when appropriate preprocessing and normalization methods are applied. Proper experimental design—including adequate biological replication, appropriate sample sizes, and standardized processing protocols—remains essential for generating reliable and reproducible transcriptomic data regardless of the platform selected.
In the field of transcriptomics, the choice of data preprocessing pipeline is a critical determinant of the quality and reliability of downstream analytical results, including Principal Component Analysis (PCA). Two technologies have dominated this landscape: microarrays, a well-established method, and RNA sequencing (RNA-seq), a more recent digital approach. Each requires specific, optimized normalization methods to handle their distinct data characteristics. Robust Multi-array Average (RMA) is a cornerstone method for preprocessing microarray data, designed to address its specific noise and background characteristics. For RNA-seq data, which is fundamentally count-based and exhibits mean-variance dependency, Variance Stabilizing Transformation (VST) has emerged as a key normalization technique. This guide objectively compares the performance of pipelines centered on these two methods, providing experimental data and protocols to inform researchers and drug development professionals in their analytical choices. The evaluation is framed within a broader research context comparing the performance of PCA on data derived from microarray versus RNA-seq technologies.
RMA for Microarray Data
- Core Purpose: RMA is a comprehensive preprocessing method for Affymetrix microarray data. It is specifically designed to process the raw intensity files (.CEL files) generated by these platforms into normalized gene expression values.
- Workflow Steps: The algorithm proceeds through three key stages: (1) Background Correction, which adjusts for non-specific binding and optical noise, (2) Quantile Normalization, which forces the distribution of probe intensities to be identical across all arrays, and (3) Summarization, where the corrected and normalized probe-level signals are combined into a single robust expression measure (e.g., using the median polish algorithm) for each probe set (gene) on each array [33]. The final output is a log₂-transformed expression value for each gene.
VST for RNA-seq Data
- Core Purpose: VST addresses the fundamental property of RNA-seq data where the variance of counts is dependent on the mean (heteroscedasticity). This method stabilizes the variance across the dynamic range of expression levels, making the data more suitable for downstream statistical analyses that assume homoscedasticity, such as PCA.
- Workflow Context: VST is typically applied to raw count data that has already been normalized for sequencing depth and library composition. For instance, it is a core function within the DESeq2 package, where it uses a generalized linear model to model the mean-variance relationship and then transforms the counts to a scale where the variance is approximately independent of the mean [34] [35]. The transformed data can then be used for procedures like PCA or clustering.
Experimental Comparison and Performance Data
Direct comparisons of microarray and RNA-seq applied to the same biological samples provide the most insightful performance data. A study involving 35 participants analyzed RNA isolated from whole blood using both microarray (Affymetrix GeneChip) and RNA-seq (Illumina) technologies offers a robust empirical comparison.
Gene Expression Correlation and Detection Power
The table below summarizes key findings from the comparative study, which used consistent non-parametric statistical methods to analyze both platforms [36].
Table 1: Comparative Performance of Microarray (RMA) and RNA-seq (VST) Pipelines
| Performance Metric | Microarray (RMA) | RNA-seq (VST) |
|---|---|---|
| Median Gene Expression Correlation | Pearson r = 0.76 (between platforms) | |
| Genes After Filtering | 15,828 genes | 22,323 genes |
| Differentially Expressed Genes (DEGs) Identified | 427 DEGs | 2,395 DEGs |
| Shared DEGs (Overlap) | 223 DEGs (52.2% of array DEGs) | 223 DEGs (9.3% of RNA-seq DEGs) |
| Perturbed Pathways Identified | 47 pathways | 205 pathways |
| Shared Pathways (Overlap) | 30 pathways | 30 pathways |
Implications for PCA and Downstream Analysis
The data in Table 1 highlights critical differences that impact PCA performance:
- Concordance: The high median correlation (r=0.76) indicates that overall gene expression profiles are largely concordant. Therefore, PCA plots from both platforms are expected to reveal similar major sources of biological variation (e.g., separation between treatment and control groups).
- Resolution and Sensitivity: RNA-seq detected over 5 times more DEGs and 4 times more perturbed pathways. This suggests that PCA on RNA-seq data might capture more subtle biological patterns and variances that are undetectable by microarray, potentially leading to a more refined separation of sample groups or the identification of secondary factors influencing transcriptome variation.
- Data Dimensionality: RNA-seq data has a higher inherent dimensionality, quantifying more genes. This can be a double-edged sword for PCA. While it potentially captures more information, it also requires careful filtering to prevent noise from overwhelming the signal in the principal components.
Detailed Experimental Protocols
To ensure reproducibility, the following summarizes the key experimental and computational protocols from the cited study [36].
Sample Preparation and Processing
- Biological Samples: Whole blood samples were collected from 35 participants (22 youth without HIV and 13 youth with HIV) in PAXgene Blood RNA tubes.
- RNA Isolation: Total intracellular RNA was isolated using the PAXgene Blood RNA Kit. Globin mRNA was depleted to increase the detection sensitivity of other transcripts.
- Quality Control: RNA integrity was confirmed with an Agilent Bioanalyzer, ensuring an RNA Integrity Number (RIN) above 7.
- Microarray Processing: 100 ng of globin-reduced RNA was processed using the GeneChip 3′ IVT Express Kit and hybridized to GeneChip Human Genome U133 Plus 2.0 Arrays.
- RNA-seq Processing: 100 ng of globin-reduced RNA was used for library preparation with poly(A) selection and the NEBNext Ultra II RNA Library Prep Kit. Libraries were sequenced on an Illumina HiSeq 3000 platform to generate 50 million paired-end reads per sample.
Computational Preprocessing Pipelines
The workflows for the two platforms, from raw data to normalized expression values, are illustrated below.
The Scientist's Toolkit
The following table details key reagents and computational tools essential for implementing the RMA and VST preprocessing pipelines as described in the experimental protocols.
Table 2: Essential Research Reagents and Tools for Preprocessing Pipelines
| Item Name | Function / Description | Application |
|---|---|---|
| PAXgene Blood RNA Kit | Reagent kit for the isolation and purification of total RNA from whole blood. | Sample Preparation |
| GLOBINclear Kit | Depletes globin mRNA from human whole blood RNA samples to improve detection of other transcripts. | Sample Preparation |
| GeneChip 3′ IVT Express Kit | For amplifying and labeling purified RNA for hybridization to Affymetrix GeneChip arrays. | Microarray Processing |
| NEBNext Ultra II RNA Library Prep Kit | For preparing sequencing libraries from purified RNA for Illumina platforms. | RNA-seq Processing |
| Affymetrix GeneChip Scanner | Hardware system for scanning hybridized microarrays to generate raw .CEL data files. | Microarray Data Generation |
| Illumina HiSeq 3000 | High-throughput sequencing platform for generating RNA-seq read data. | RNA-seq Data Generation |
R/Bioconductor affy package |
Provides functions for reading .CEL files and performing RMA normalization. | Microarray Analysis |
R/Bioconductor DESeq2 package |
Provides functions for normalizing count data and applying the Variance Stabilizing Transformation. | RNA-seq Analysis |
| FastQC | A quality control tool for high-throughput sequence data. | RNA-seq QC |
| Trimmomatic | A flexible tool for trimming and removing adapters from sequencing reads. | RNA-seq Processing |
The choice between an RMA-based microarray pipeline and a VST-based RNA-seq pipeline has significant implications for transcriptomic analysis, including PCA. The experimental data demonstrates that while both platforms can produce broadly concordant results, they are not equivalent.
- For Microarray (RMA): This pipeline is a robust, well-established method for generating reliable gene expression data. It is sufficient for detecting large-scale transcriptional changes and is supported by vast amounts of legacy data and optimized protocols.
- For RNA-seq (VST): This pipeline offers superior detection power, sensitivity, and dynamic range. It is capable of identifying more differentially expressed genes and perturbed pathways, which can translate into a more detailed and informative PCA. The VST step is crucial for stabilizing variance, making the data suitable for many downstream statistical and multivariate analyses.
In the context of a thesis comparing PCA performance, researchers should expect PCA on RNA-seq data to potentially reveal more subtle biological structures due to its greater sensitivity and coverage. However, the high correlation between platforms suggests that for defining major sample groupings, both methods can be effective. The decision ultimately hinges on the specific research goals, required resolution, and available resources.
Principal Component Analysis (PCA) is an essential method for dimensionality reduction in genomics, particularly for analyzing large-scale datasets from technologies like single-cell RNA-sequencing (scRNA-seq) and microarrays. As datasets grow to millions of cells or hundreds of thousands of genetic features, standard PCA implementations based on full singular value decomposition (SVD) become computationally prohibitive due to excessive memory requirements and long processing times. This guide compares standard SVD with modern, memory-efficient PCA algorithms, providing a structured framework for researchers to select the optimal approach based on dataset size, computational resources, and analytical goals.
Taxonomy of PCA Algorithms
PCA algorithms can be categorized based on their underlying computational strategies. Understanding these categories is crucial for selecting the appropriate method.
| Algorithm Category | Key Principle | Typical Use-Case |
|---|---|---|
| Similarity Transformation (SimT) | Direct computation of covariance matrix eigenvalues [5] | Smaller datasets where full decomposition is feasible |
| Krylov Subspace-Based (Krylov) | Iteratively finds dominant eigenvectors; used in IRAM [5] [37] | Accurate computation of top PCs for very large datasets [5] |
| Randomized SVD (Rand) | Uses random sampling to approximate the range of the input matrix [5] [37] | Fast, approximate PCA for massive datasets [5] [37] |
| Singular Value Decomposition (SVD) Update-Based (SU) | Incrementally updates the SVD with new data [38] | Streaming data or online learning environments |
| Gradient Descent-Based (GD) | Uses optimization techniques to find principal components [5] | Scenarios compatible with iterative optimization frameworks |
| Downsampling-Based (DS) | Performs PCA on a random subset of the data [5] | Exploratory analysis of massive datasets; can sacrifice accuracy for speed [5] |
Comparative Analysis of PCA Implementations
Multiple software packages implement the aforementioned algorithms, each with unique strengths in speed, memory efficiency, and accuracy.
| Implementation | Core Algorithm | Key Features | Best-Suited Data Scale |
|---|---|---|---|
| Standard SVD (prcomp) | Full SVD (SimT) | High accuracy; gold standard for smaller datasets [5] | 10s to 1000s of samples |
| FlashPCA2 / bigsnpr | Implicitly Restarted Arnoldi Method (IRAM) [37] | High accuracy; memory-efficient [37] | Large-scale (e.g., 500k samples) [37] |
| PCAone (various algos) | IRAM & Novel Randomized SVD [37] | Out-of-core processing; multithreading; fast, accurate [37] | Very large-scale (e.g., 1.3M cells) [37] |
| OnlinePCA.jl | Randomized SVD, Gradient Descent [5] | Multiple algorithms; memory-efficient [5] | Large-scale scRNA-seq [5] |
| PLINK2 / FastPCA | Randomized SVD [37] | Fast | Large-scale genetic data [37] |
| MPOWIT | Subspace/Power Iteration [39] [38] | Minimal memory footprint; ideal for limited RAM [39] [38] | Extremely large datasets on desktop hardware [38] |
Performance Benchmarking and Experimental Data
Empirical evaluations provide critical insights into the real-world performance of different PCA algorithms in genomic studies.
Benchmarking on Real-World Genomic Datasets
A systematic benchmark of PCA algorithms used real-world scRNA-seq datasets, including human peripheral blood mononuclear cells (PBMCs) and pancreatic cells [5]. The study evaluated accuracy by comparing results to a gold-standard SVD and assessed downstream effects on clustering clarity and differential expression analysis [5].
Key Findings:
- Accuracy: Krylov subspace-based (IRAM) and some randomized SVD methods were fast, memory-efficient, and achieved accuracy comparable to the gold standard [5].
- Downsampling Pitfalls: PCA based on downsampled data produced unclear cluster structures and incorrectly merged distinct cell types, potentially missing biologically relevant subgroups [5].
- Convergence Issues: Some gradient descent-based algorithms (e.g.,
sgdin OnlinePCA.jl) showed worse clustering accuracy (measured by Adjusted Rand Index) [5].
Benchmarking on Human Genetic Data
Another study compared PCA methods using data from the 1000 Genomes Project [37]. Accuracy was measured by the Mean Explained Variance (MEV) of estimated PCs compared to a full SVD.
Key Findings:
- High-Accuracy Methods:
PCAone(novel RSVD) and IRAM-based methods (PCAoneArnoldi,FlashPCA2) consistently achieved the highest accuracy across different numbers of top PCs (K) [37]. - Variable Performance: Other randomized SVD methods (
PLINK2/FastPCA,ProPCA) showed lower accuracy for smaller K values, which improved with higher K but required more computational epochs [37]. - Speed:
PCAonecompleted its analysis in a fixed, low number of epochs (passes over the data), making it particularly efficient for out-of-core computation where disk reading is a bottleneck [37].
| Method (Algorithm Class) | Relative Speed | Memory Efficiency | Accuracy (vs. Full SVD) | Key Trade-off / Use Case |
|---|---|---|---|---|
| Standard SVD (SimT) | Slow | Low | Gold Standard [5] | Baseline for small datasets; infeasible for large-scale data |
| IRAM (Krylov) | Moderate | High | Very High [37] | Best choice when high accuracy is critical and resources allow |
| Randomized SVD (Rand) | Fast | High | Good to High (with power iterations) [37] | Best balance of speed and accuracy for most large-scale applications |
| Gradient Descent (GD) | Variable | High | Variable (can be lower) [5] | Can be useful but requires careful benchmarking |
| Downsampling (DS) | Fastest | Highest | Low (can miss subtle structures) [5] | Only for initial, exploratory analysis |
Experimental Protocols for PCA Evaluation
To ensure robust and reproducible PCA results, follow these established experimental protocols.
Data Preprocessing and Quality Control (QC)
- Single-Cell RNA-seq: Perform standard QC: remove cells with high mitochondrial gene counts or low unique gene counts. Normalize library sizes and log-transform expression values [5].
- Genotyping Data: Apply standard quality filters: remove SNPs with high missingness, low minor allele frequency, and deviate from Hardy-Weinberg equilibrium.
Algorithm Selection and Execution
- Pilot Analysis: Run a standard SVD (e.g.,
prcomp) on a small subset of data to establish a "ground truth" for comparison [5]. - Large-Scale Analysis: Use an efficient algorithm (e.g.,
PCAone,FlashPCA2). Specify the number of principal components (PCs) to compute based on the study's needs. For randomized methods, use power iterations (if available) to improve accuracy [37]. - Out-of-Core Processing: For datasets larger than available RAM, use implementations with out-of-core support (e.g.,
PCAone,PCAoneArnoldi) that read data directly from the disk without loading it entirely into memory [37].
Validation and Downstream Analysis
- Accuracy Assessment: If a ground truth is available, calculate metrics like Mean Explained Variance (MEV) [37] or the absolute cross-product of PCs [5].
- Biological Validation: Use the computed PCs in downstream analyses:
The Scientist's Toolkit: Essential Research Reagents & Software
This table details key computational tools and their functions for performing PCA on large genomic datasets.
| Tool / Resource | Function / Description |
|---|---|
| PCAone | A C++ framework for efficient out-of-core PCA using both IRAM and a novel, fast randomized SVD algorithm [37]. |
| FlashPCA2 / bigsnpr | Implements the IRAM algorithm for accurate, memory-efficient PCA of large genetic data [37]. |
| OnlinePCA.jl | A Julia package offering multiple memory-efficient PCA algorithms, including randomized SVD and gradient descent [5]. |
| PLINK2 | A toolkit for genome association analysis that includes a fast randomized PCA implementation [37]. |
| MPOWIT | A power iteration-based algorithm designed to solve very large PCA problems with minimal RAM [39] [38]. |
| Out-of-Core Computation | A computational mode that processes data directly from disk, bypassing RAM limitations for massive datasets [37]. |
| Adjusted Rand Index (ARI) | A metric for evaluating clustering results, used to validate the biological utility of PCs [5]. |
| Mean Explained Variance (MEV) | A metric for quantifying the accuracy of approximated PCs against a gold-standard SVD [37]. |
Selecting the right PCA algorithm is critical for the success of large-scale genomic studies. The choice involves a clear trade-off between computational resources, speed, and analytical precision.
- For Maximum Accuracy with Ample Resources: IRAM-based algorithms like
PCAoneArnoldiorFlashPCA2are the preferred choice, providing results closest to the gold-standard SVD [37]. - For Best Balance of Speed and Accuracy: Modern Randomized SVD algorithms, particularly
PCAone, offer a significant speed advantage (up to 10x faster than state-of-the-art tools) while maintaining high accuracy, making them ideal for most large-scale applications [37]. - For Memory-Constrained Environments: Out-of-core implementations of the above algorithms (e.g.,
PCAone) or specialized methods like MPOWIT enable the analysis of datasets far larger than the available RAM, making powerful desktop computers viable for massive computations [37] [38]. - To Avoid: Simple downsampling of data before PCA should be avoided for definitive analysis, as it can obscure subtle biological signals and lead to incorrect conclusions [5].
Researchers should integrate the recommended validation protocols to ensure that computational efficiency does not come at the cost of biological discovery.
Principal Component Analysis (PCA) is a foundational dimensionality reduction technique in transcriptomics, enabling researchers to visualize high-dimensional gene expression data and identify major patterns of variation. The core purpose of PCA is to transform complex datasets with many variables into a simpler set of uncorrelated principal components that capture the maximum variance in the data [22] [40]. This process involves identifying new axes in the data—principal components—where the first component (PC1) captures the highest variance, the second (PC2) captures the next highest while being orthogonal to the first, and so on [22]. In practical terms, for a gene expression dataset with thousands of genes, PCA projects this data into a 2D or 3D space (typically PC1 vs. PC2) where the spatial arrangement of samples can reveal biological relationships, technical artifacts, or potential batch effects [41] [42].
The mathematical foundation of PCA relies on linear algebra operations. After standardizing the data to ensure equal feature contribution, PCA computes a covariance matrix to understand how variables correlate [40]. It then performs eigen decomposition on this matrix to identify eigenvectors (principal components) and eigenvalues (variance explained by each component) [40]. The components are ranked by their eigenvalues, allowing researchers to select the most informative ones for visualization and analysis [40]. This process effectively creates a new coordinate system where the axes are oriented in directions of maximal variance, providing the optimal perspective for visualizing high-dimensional data relationships [40] [43].
Comparative Analysis: PCA Performance on Microarray vs. RNA-seq Data
Experimental Design and Data Generation
A 2025 study provides a direct comparative framework for evaluating PCA performance across microarray and RNA-seq platforms using identical biological samples [36]. The investigation utilized whole blood samples from 35 participants (22 youth without HIV and 13 youth with HIV) obtained through the Adolescent Medicine Trials Network for HIV/AIDS Interventions [36]. This carefully selected cohort enabled analysis of technical platform performance while controlling for biological variability.
Critical methodological details included: RNA isolation from PAXgene Blood RNA tubes using the PAXgene Blood RNA Kit, globin mRNA reduction to improve signal detection, and quality assessment requiring RNA Integrity Numbers (RIN) above 7 [36]. The platform-specific processing then diverged:
- Microarray analysis employed the GeneChip Human Genome U133 Plus 2.0 Array (54,675 probes representing 20,174 genes) using the GeneChip 3' IVT Express Kit for amplification and labeling [36].
- RNA-seq analysis utilized poly(A) selection and the NEBNext Ultra II RNA Library Prep Kit for Illumina, with sequencing on the Illumina Hiseq 3000 platform generating 50 million paired-end reads per sample [36].
This rigorous experimental design ensured that observed differences in PCA performance could be attributed to platform characteristics rather than pre-analytical variables.
Data Processing and Analytical Workflow
The data processing pipelines for both platforms incorporated quality control but employed platform-specific normalization approaches essential for interpreting subsequent PCA results [36]:
- Microarray data underwent background correction, quantile normalization, and summarization using Robust Multi-Array Averaging (RMA), with expression values converted to log2 scale [36].
- RNA-seq data underwent quality checking with FASTQC, adapter trimming with Trimmomatic, alignment to the UCSC reference transcriptome, and generation of read counts with TPM calculation [36].
For PCA specifically, the study applied consistent transformation approaches: log-transformed microarray data and variance-stabilizing transformation (VST) for RNA-seq data, with PCA performed using the prcomp function in R [36]. This methodological consistency is crucial for meaningful cross-platform comparison of variance structure.
Table 1: Key Differences in Data Generation and Processing
| Parameter | Microarray | RNA-seq |
|---|---|---|
| Technology Principle | Hybridization-based detection | Sequencing-based digital counting |
| Output Format | Fluorescence intensity (continuous) | Read counts (digital) |
| Typical Dynamic Range | Limited by fluorescence detection | Wider dynamic range |
| Data Preprocessing | Background correction, quantile normalization | Quality trimming, alignment, count generation |
| Standard Transformation | Log2 transformation | Variance-stabilizing transformation (VST) |
Quantitative Comparison of PCA Outputs
The 2025 study yielded direct quantitative comparisons of PCA performance between platforms, with key metrics summarized below [36]:
Table 2: Platform Performance Metrics from Comparative Study
| Performance Metric | Microarray | RNA-seq |
|---|---|---|
| Genes Detected (Post-Filtering) | 15,828 genes | 22,323 genes |
| Differentially Expressed Genes (DEGs) | 427 DEGs | 2,395 DEGs |
| Shared DEGs Between Platforms | 223 DEGs (52.2% of microarray DEGs) | 223 DEGs (9.3% of RNA-seq DEGs) |
| Median Pearson Correlation | 0.76 (between platforms) | 0.76 (between platforms) |
| Pathways Identified | 47 perturbed pathways | 205 perturbed pathways |
| Shared Pathways | 30 pathways | 30 pathways |
The high correlation (median Pearson r = 0.76) between platform expression profiles indicates substantial concordance in captured biological signals [36]. However, the nearly 6-fold difference in DEG detection highlights RNA-seq's enhanced sensitivity to expression changes, which directly impacts PCA variance structure. The greater gene detection in RNA-seq (22,323 vs. 15,828 genes) provides a broader foundation for principal component calculation, potentially capturing more subtle biological patterns [36].
Experimental Workflow for Platform Comparison
Interpreting PCA Plots: Technical vs. Biological Variation
Visualizing PCA Results
Effective interpretation of PCA plots requires understanding both the visualization techniques and the statistical foundations of principal components. The most fundamental visualization is the 2D scatter plot of the first two principal components (PC1 vs. PC2), which captures the maximal variance in the dataset [41]. For the Wine Quality Dataset, for instance, the first two components captured approximately 45% of total variance—a typical scenario where reducing dimensionality still preserves nearly half the information [41]. When more variance needs to be visualized, a 3D scatter plot incorporating PC3 can be employed, typically increasing explained variance to around 60% in transcriptomic datasets [41].
Beyond basic scatter plots, several specialized visualizations enhance PCA interpretation:
- Explained Variance Plots: Bar charts showing the percentage of total variance explained by each component, highlighting the relative importance of each dimension [41].
- Cumulative Variance Plots: Line charts displaying the progressive variance capture as components are added, crucial for determining the optimal number of components to retain [41].
- Biplots: Combined point and vector displays that show both sample projections and original variable contributions, enabling interpretation of which features drive component separation [41].
In transcriptomics, the spatial arrangement of samples in PCA plots reveals biological and technical relationships. Samples with similar expression profiles cluster together, while divergent samples separate along the component axes. The distance between points approximates their expression profile similarity, with tight clusters indicating homogeneity and dispersed points suggesting heterogeneity [42].
Identifying Biological Signals vs. Batch Effects
PCA plots serve as a powerful diagnostic tool for detecting both biological signals and technical artifacts in transcriptomic data. Biological signals typically manifest as distinct clustering of sample groups along component axes based on experimental conditions, phenotypes, or treatment responses [42]. For example, in the HIV study framework, effective PCA would show separation between YWH and YWOH samples along PC1 or PC2, indicating that biological status drives major expression variation [36].
In contrast, batch effects—systematic technical variations introduced by processing conditions, reagent lots, personnel, or instrumentation—appear as clustering based on processing batches rather than biological groups [44]. The profound impact of batch effects was demonstrated in a clinical trial where an RNA-extraction solution change caused incorrect classification for 162 patients, with 28 receiving inappropriate chemotherapy [44]. In PCA space, batch effects typically manifest as:
- Distinct clustering by processing date, sequencing lane, or extraction batch
- Separation along principal components that correlates with technical rather than biological variables
- Variance patterns that obscure biological signal when batch correlates with outcome
Table 3: Distinguishing Biological Signals from Batch Effects in PCA
| Characteristic | Biological Signal | Batch Effect |
|---|---|---|
| PCA Pattern | Clustering by biological group (e.g., disease status) | Clustering by technical factors (e.g., processing date) |
| Variance Explanation | Aligns with experimental design | Correlates with processing variables |
| Reproducibility | Consistent across technical replicates | Variable across batches |
| Biological Plausibility | Consistent with known biology | Unexplained by biological factors |
| Impact on Analysis | Enhances biological discovery | Obscures true signals, causes false positives |
Batch Effect Challenges and Mitigation Strategies
Batch effects represent a formidable challenge in transcriptomic studies, particularly when integrating data across platforms or large datasets. These technical variations arise from multiple sources throughout the experimental workflow [44]:
- Study Design Phase: Non-randomized sample collection, confounded designs where technical variables correlate with biological groups
- Sample Preparation: Variations in RNA extraction methods, reagent lots, operator techniques, storage conditions
- Data Generation: Platform-specific biases, instrument calibration differences, processing batch variations
- Data Analysis: Normalization artifacts, pipeline version differences
The consequences of unaddressed batch effects can be severe. Beyond the obvious problem of decreased statistical power through increased variability, batch effects can actively mislead analysis when technical variables correlate with outcomes of interest [44]. In cross-species comparisons, for instance, what appeared to be profound human-mouse differences were actually driven by 3-year separation in data generation timelines—after batch correction, the data clustered by tissue type rather than species [44]. This demonstrates how batch effects can generate biologically plausible but technically artifactual conclusions.
The challenges are particularly acute in multi-omics studies where different data types have distinct distributions and scales, and in single-cell RNA-seq where higher technical variation, lower RNA input, and increased dropout rates exacerbate batch effects compared to bulk sequencing [44]. In the context of PCA, these effects can dominate variance structure, potentially making technical variables more influential than biological variables in component formation.
Batch Effect Correction Methods
Effective batch effect management requires both experimental design strategies and computational correction approaches. The experimental front includes sample randomization, balanced processing across groups, and incorporation of control samples [44]. For computational correction, several methods have been developed:
- ComBat-ref: A refinement of ComBat-seq specifically designed for RNA-seq count data that uses a negative binomial model and selects a reference batch with minimal dispersion for adjustment, demonstrating superior performance in both simulated and real datasets [45].
- Platform-specific Approaches: Methods tailored to particular technologies that address platform-specific artifacts and distribution characteristics [44].
The correction process must balance effect removal with signal preservation, as over-correction can eliminate biological along with technical variation [44]. This is particularly crucial when batch variables correlate with biological variables—a situation that requires careful analytical strategy rather than automated correction.
Batch Effect Identification and Correction Workflow
Essential Research Reagents and Computational Tools
Research Reagent Solutions
Successful PCA-based analysis in transcriptomics requires high-quality reagents throughout the experimental workflow. Key solutions include:
Table 4: Essential Research Reagents for Transcriptomic Analysis
| Reagent/Tool | Function | Platform Application |
|---|---|---|
| PAXgene Blood RNA System | Stabilizes RNA in whole blood samples during collection and storage | Microarray & RNA-seq |
| Globin mRNA Reduction Kits | Depletes abundant globin transcripts to improve signal detection in blood | Microarray & RNA-seq |
| GeneChip 3' IVT Express Kit | Amplifies and labels RNA for microarray hybridization | Microarray specific |
| NEBNext Ultra II RNA Library Prep | Prepares sequencing libraries from RNA templates | RNA-seq specific |
| Poly(A) Magnetic Isolation Module | Enriches for mRNA by selecting polyadenylated transcripts | RNA-seq specific |
| Agilent Bioanalyzer System | Assesses RNA quality (RIN) to ensure input material integrity | Microarray & RNA-seq |
Computational Tools for PCA and Batch Effect Management
The analytical phase requires specialized computational tools for effective PCA implementation and batch effect management:
- R/Bioconductor Packages: The
affypackage for microarray preprocessing with RMA normalization;DESeq2for RNA-seq analysis and VST transformation;genefilterfor data filtering [36]. - Quality Control Tools: FASTQC for RNA-seq quality assessment; Trimmomatic for adapter trimming; BatchQC for batch effect evaluation [36].
- PCA Implementation: The
prcompfunction in R for core PCA computation;ggfortifyandclusterpackages for visualization [36]. - Specialized Batch Correction: ComBat-ref implementation for RNA-seq count data with reference batch selection [45].
These tools collectively enable the transformation of raw expression data into interpretable PCA visualizations while managing technical variability that could otherwise compromise biological interpretation.
The comparative analysis of PCA performance across microarray and RNA-seq platforms reveals both significant concordance and important technical distinctions. The high correlation (r=0.76) between platform expression profiles confirms that PCA captures conserved biological signals regardless of technological approach [36]. However, the substantially higher sensitivity of RNA-seq—evidenced by nearly 6-fold more detected DEGs—translates to potentially enhanced resolution in PCA variance structure [36].
For researchers employing PCA visualization strategies, several principles emerge as critical. First, platform-aware preprocessing is essential, with RMA normalization optimal for microarray and VST transformation preferred for RNA-seq data [36]. Second, batch effect vigilance must be maintained throughout, with PCA serving as a primary diagnostic tool before and after correction [44]. Finally, interpretation humility is warranted, recognizing that while PCA powerfully reduces dimensionality, the resulting components represent complex linear combinations of thousands of variables rather than single biological entities [40] [42].
The integration of these principles—coupled with appropriate reagent selection and computational tool implementation—enables researchers to leverage PCA's full potential for visualizing complex transcriptomic relationships while avoiding technical artifacts that could compromise biological discovery.
This guide objectively compares the performance of microarray and RNA-Seq technologies across key applications in biomedical research, with a specific focus on insights derived from Principal Component Analysis (PCA) and other analytical outputs.
Experimental Platforms and Analytical Performance
The fundamental differences between microarray and RNA-Seq technologies lead to variations in data output and analytical performance, which are often reflected in PCA results.
Technology Comparison and Data Generation
Table 1: Fundamental Platform Characteristics
| Feature | Microarray | RNA-Seq |
|---|---|---|
| Core Technology | Hybridization-based fluorescence detection [4] [36] | Sequencing-by-synthesis with digital read counting [4] [36] |
| Dynamic Range | Limited by background noise and probe saturation [4] [19] | Wider, capable of detecting low-abundant transcripts [4] [19] |
| Predefined Targets | Required; detects only annotated transcripts on the array [19] | Not required; can identify novel transcripts and splice variants [4] [19] |
| Typical Input RNA | 100 ng (as used in cannabinoid and HIV studies) [4] [36] | 75-100 ng (as used in cannabinoid, hepatotoxicant, and HIV studies) [4] [36] [19] |
Data Output and Concordance
Direct comparison of data output reveals significant differences in the number of detectable features and identified differentially expressed genes (DEGs).
Table 2: Empirical Data Output Comparison from Comparative Studies
| Metric | Microarray | RNA-Seq | Concordance |
|---|---|---|---|
| Total Genes Detected | 15,828 genes (HIV study) [36] | 22,323 genes (HIV study) [36] | 13,577 shared genes (86% of microarray) [36] |
| Differentially Expressed Genes (DEGs) | 427 DEGs (HIV study) [36] | 2,395 DEGs (HIV study) [36] | 223 overlapping DEGs (52% of microarray DEGs) [36] |
| DEG Correlation | ~78% of microarray DEGs overlapped with RNA-Seq in rat liver study [19] | Spearman’s correlation of 0.7–0.83 with microarray [19] | High correlation in overall expression patterns [4] [19] |
| Non-Coding RNA | Limited or no detection [19] | Detects miRNA, lncRNA, pseudogenes [4] [19] | Not applicable |
The following diagram illustrates the foundational workflows for both platforms, from sample preparation to data generation, highlighting key steps that contribute to technical variations.
Case Study 1: Toxicogenomics and Compound Potency Assessment
Toxicogenomics utilizes transcriptomic data to understand mechanisms of toxicity (MOA) and determine quantitative points of departure (POD) for chemical risk assessment [46] [47].
Experimental Protocol: Transcriptomic Point of Departure (tPOD)
Application: Quantitative risk assessment using transcriptomic benchmark concentration (BMC) modeling [4] [47].
- In Vitro System: Human-relevant cell models. Example: iPSC-derived hepatocytes (iCell Hepatocytes 2.0) cultured in maintenance medium [4].
- Compound Exposure: Cells are exposed to the test compound (e.g., cannabinoids, hepatotoxicants) in a concentration-response manner (e.g., 5-8 concentrations) for a set duration (e.g., 24 hours) [4] [19].
- RNA Isolation & Platform Analysis: Total RNA is isolated (e.g., using Qiazol extraction with DNase treatment) with quality control (RIN ≥ 9). The same RNA samples are processed for both microarray and RNA-Seq [4] [19].
- Differential Expression Analysis: For microarray, normalized log2 intensity data is analyzed. For RNA-Seq, aligned read counts are analyzed. Non-parametric tests (e.g., Mann-Whitney U) can be applied to both [36].
- BMC Modeling & tPOD Derivation: BMC modeling is applied to DEGs or gene sets to calculate a transcriptomic point of departure (tPOD), the concentration at which a significant transcriptional response occurs [4] [47].
Platform Performance Comparison
Table 3: Performance in Toxicogenomic Case Studies
| Compound / Study | Microarray Findings | RNA-Seq Findings | Comparative Outcome |
|---|---|---|---|
| Cannabinoids (CBC, CBN) [4] | Derived tPOD values for both compounds. | Derived tPOD values on the same level as microarray. | Equivalent performance for final tPOD output, despite RNA-Seq identifying more DEGs. |
| Rat Hepatotoxicants (ANIT, CCl₄, etc.) [19] | Identified key MOA pathways (Nrf2, hepatic cholestasis). | Identified the same core pathways plus additional ones; detected non-coding RNAs. | Enhanced mechanistic insight with RNA-Seq, but microarray captured primary toxicity pathways. |
| Acetaminophen [46] | Used for hazard identification in systems toxicology. | Applied for cross-species and in vitro-to-in vivo extrapolation. | Complementary role in quantitative dose-response analysis. |
The process of deriving a tPOD, common to both platforms, involves modeling transcriptional changes against compound concentration.
Case Study 2: Disease Subtyping and Biomarker Discovery
Disease heterogeneity poses a challenge for diagnosis and treatment. Transcriptomics enables the discovery of molecular subtypes and associated biomarkers [48] [49].
Experimental Protocol: Molecular Subtyping with Multi-Omics Integration
Application: Identifying disease subtypes with distinct imaging, genetic, and clinical profiles [49].
- Cohort Selection: Participants are grouped into reference (e.g., healthy controls) and target (e.g., disease cohort) populations. Example: 28,858 individuals for Alzheimer's disease subtyping [49].
- Multi-Modal Data Acquisition:
- Phenotypic Data: Magnetic resonance imaging (MRI) is processed to extract quantitative brain features (e.g., regional volumes) [49].
- Genetic Data: Single nucleotide polymorphisms (SNPs) are genotyped [49].
- Transcriptomic Data: (Optional) RNA from blood or tissue is profiled via microarray or RNA-Seq.
- Integrative Clustering Analysis: Advanced machine learning models (e.g., Gene-SGAN: a multi-view weakly-supervised deep clustering method) are used. These models jointly analyze phenotypic and genetic data in a latent space to estimate disease subtypes [49].
- Subtype Validation & Biomarker Identification: Derived subtypes are validated for reproducibility and assessed for significant differences in clinical biomarkers and outcomes. Key genes and pathways defining each subtype are identified as biomarkers [49].
Platform Performance Comparison
Table 4: Performance in Disease Subtyping and Biomarker Discovery
| Application | Microarray Utility | RNA-Seq Utility | Key Consideration |
|---|---|---|---|
| Breast Cancer Subtyping [48] [49] | Used in early biomarker discovery studies. | Enables more comprehensive subtyping via models like Gene-SGAN. | Critical Note: Subtyping before biomarker discovery can inflate performance metrics; combined overall accuracy must be reported [48]. |
| Biomarker Discovery [19] [47] | Identifies predictive gene panels (e.g., 65-gene panel for genotoxicity) [47]. | Discovers a larger number of candidate biomarkers, including non-coding RNAs [19]. | Practicality: Smaller, targeted gene panels from both platforms are often used for cost-effective application [47]. |
| Data Integration [50] | Legacy data can be integrated with RNA-Seq using gene set enrichment scores. | Modern data can be combined with microarray for meta-analyses. | Solution: Transforming data into gene set enrichment scores (e.g., ssGSEA) increases comparability between platforms [50]. |
The following diagram illustrates a sophisticated, multi-view framework that integrates genetic and phenotypic data for robust disease subtyping.
The Scientist's Toolkit: Essential Research Reagents and Solutions
Table 5: Key Reagents and Materials for Transcriptomic Workflows
| Item | Function | Example Products / Kits |
|---|---|---|
| iPSC-Derived Hepatocytes | Human-relevant in vitro model for toxicology studies [4]. | iCell Hepatocytes 2.0 (FUJIFILM Cellular Dynamics) [4]. |
| RNA Isolation Kit | Purifies high-quality total RNA from cells or tissues, crucial for downstream analysis. | PAXgene Blood RNA Kit, Qiazol extraction with DNase I treatment [36] [19]. |
| Microarray Platform | For hybridization-based transcriptome profiling. | GeneChip Human Genome U133 Plus 2.0 Array, GeneChip PrimeView Human Gene Expression Array [4] [36]. |
| RNA-Seq Library Prep Kit | Prepares cDNA libraries for next-generation sequencing. | Illumina Stranded mRNA Prep, Ligation Kit; TruSeq Stranded mRNA Library Prep Kit [4] [19]. |
| Bioinformatics Tools | For data processing, normalization, differential expression, and pathway analysis. | Ingenuity Pathway Analysis (IPA), DESeq2, OmicSoft Array Studio, MoAViz, BMD Software [19] [47]. |
Solving Common PCA Challenges: Noise Reduction and Performance Optimization
Gene expression studies using high-throughput technologies like microarrays and RNA sequencing (RNA-seq) systematically measure the activity of thousands of genes simultaneously, creating a paradigm where the number of features (genes) vastly exceeds the number of observations (samples). This high-dimensional data scenario presents serious challenges for statistical analysis, including the curse of dimensionality, where data becomes sparse in the high-dimensional space, reducing the effectiveness of distance-based algorithms [51] [52]. Additionally, the risk of overfitting increases significantly, where models learn noise instead of true biological patterns, thereby reducing their generalizability [51]. The computational complexity of analysis also grows substantially with dimensionality, leading to longer processing times and increased resource demands [51]. These challenges necessitate sophisticated feature selection and dimensionality reduction strategies to extract meaningful biological insights from transcriptomic data.
Principal Component Analysis (PCA) serves as a fundamental technique for addressing high-dimensionality in transcriptomics by transforming the original variables into a smaller set of uncorrelated principal components that capture maximum variance in the data [40] [53]. This method simplifies complex data sets while preserving essential patterns and trends, making it particularly valuable for exploratory analysis, visualization, and as a preprocessing step before further statistical modeling [53]. When comparing performance across transcriptomic platforms, PCA provides a standardized approach to evaluate data structure and variance distribution, enabling direct comparisons between microarray and RNA-seq technologies.
Platform Comparison: Microarray vs. RNA-Seq
Microarray technology, a hybridization-based approach, was the primary platform for transcriptomic applications for over a decade [4]. It profiles transcriptome-wide gene expression by measuring fluorescence intensity of predefined transcripts through complementary binding [4] [1]. The technology offers relatively simple sample preparation, low per-sample cost, and well-established methodologies for data processing and analysis [4]. However, microarrays suffer from limitations including a restricted dynamic range, high background noise, and nonspecific binding [4]. Crucially, they can only detect predefined transcripts, missing novel genes, splice variants, and many non-coding RNA species.
RNA sequencing (RNA-seq) emerged in the mid-2000s as an alternative technology based on next-generation sequencing [4]. This approach involves counting reads that can be reliably aligned to a reference sequence, providing a digital measure of transcript abundance [4] [1]. RNA-seq offers several advantages including an essentially unlimited dynamic range, higher precision, and the ability to identify transcripts not detectable by microarrays, such as splice variants, microRNAs, long non-coding RNAs, and pseudogenes [4] [54]. As of 2023, RNA-seq comprises 85% of all submissions to the Gene Expression Omnibus repository, reflecting its dominance in contemporary transcriptomics [1].
Quantitative Performance Comparison
Table 1: Direct comparison of microarray and RNA-seq performance characteristics
| Performance Metric | Microarray | RNA-Seq | Experimental Context |
|---|---|---|---|
| Detected Genes | 15,828 genes | 22,323 genes | Analysis of 35 participant samples [1] |
| Differentially Expressed Genes (DEGs) | 427 DEGs | 2,395 DEGs | HIV status comparison [1] |
| Shared DEGs Between Platforms | 223 DEGs (52% of microarray DEGs) | 223 DEGs (9% of RNA-seq DEGs) | Same samples and statistical approach [1] |
| Correlation of Expression Profiles | Median Pearson r = 0.76 | Median Pearson r = 0.76 | Same samples analyzed [1] |
| Pathways Identified | 47 perturbed pathways | 205 perturbed pathways | Pathway analysis of DEGs [1] |
| Shared Pathways | 30 pathways (64% of microarray pathways) | 30 pathways (15% of RNA-seq pathways) | Overlap in functional analysis [1] |
| Transcriptomic Point of Departure (tPoD) | Equivalent levels | Equivalent levels | Concentration-response modeling of cannabinoids [4] |
| Signal-to-Noise Ratio (SNR) | 19.8 (0.3-37.6) | Varies by laboratory | Multi-center study using Quartet reference materials [8] |
Table 2: Data structure and variance characteristics relevant to PCA
| Characteristic | Microarray | RNA-Seq | Impact on PCA |
|---|---|---|---|
| Dynamic Range | Limited by fluorescence detection | Essentially unlimited | RNA-seq may capture more variance in highly expressed genes |
| Background Noise | Higher due to nonspecific binding | Lower with proper preprocessing | Microarray may require more aggressive noise filtering |
| Data Distribution | Continuous intensity values | Discrete count data | RNA-seq often requires variance-stabilizing transformation |
| Missing Values | Low expression near detection limit | Genes with zero counts | Different imputation strategies may be needed |
| Technical Variability | Primarily from hybridization | Primarily from library preparation | Affects variance structure captured by PCA |
Despite their technological differences, both platforms demonstrate strong concordance in gene expression profiles when analyzed with consistent statistical methods [1]. A comparative study using the same patient samples found a median Pearson correlation coefficient of 0.76 between platforms, indicating substantial agreement in measured expression values [1]. However, RNA-seq identified approximately 5.6 times more differentially expressed genes (2,395 vs. 427) between the same comparison groups, reflecting its enhanced sensitivity [1]. Importantly, when these DEGs were subjected to functional pathway analysis, both platforms identified overlapping biological pathways, with 30 pathways shared between them [1].
For concentration-response modeling in toxicogenomics, both platforms displayed equivalent performance in identifying transcriptomic points of departure (tPoD), despite RNA-seq detecting larger numbers of DEGs with wider dynamic ranges [4]. This suggests that for traditional transcriptomic applications like mechanistic pathway identification and concentration-response modeling, microarray remains a viable method, particularly considering its relatively lower cost, smaller data size, and better availability of software and public databases for analysis and interpretation [4].
Experimental Protocols for Cross-Platform Comparison
Standardized RNA Sample Preparation
Robust comparison of microarray and RNA-seq platforms requires meticulous sample preparation to ensure meaningful results. The following protocol outlines the key steps for parallel analysis using both technologies:
Cell Culture and Treatment: Human induced pluripotent stem cell (iPSC)-derived hepatocytes (iCell Hepatocytes 2.0) are cultured following manufacturer specifications. Cells are thawed and seeded onto collagen-coated plates at a density of 3 × 10^5 cells/cm^2 in plating medium supplemented with oncostatin M, dexamethasone, and gentamicin. The plating medium is replenished daily for four days before switching to maintenance medium without oncostatin M. Cells are ready for experimentation between days 5-8 post-seeding [4].
Compound Exposure: On day 6 of culture, cells are exposed to varying concentrations of test compounds in triplicate. Stock solutions are prepared in DMSO and diluted in maintenance medium to achieve final concentrations, maintaining a constant DMSO concentration of 0.5% across all treatments. Vehicle control groups receive maintenance medium with 0.5% DMSO only. Exposure is conducted at 37°C with 5% CO₂ for 24 hours [4].
RNA Isolation and Quality Control: After exposure, cells are lysed in RLT buffer supplemented with β-mercaptoethanol. Total RNA is purified using automated RNA purification systems with an on-column DNase digestion step to remove genomic DNA. RNA concentration and purity are measured using UV-vis spectrophotometry (260/280 ratio), and RNA integrity is assessed with microfluidics-based systems to obtain RNA Integrity Numbers (RIN >7.0) [4] [1]. For blood-derived samples, globin mRNA reduction is performed using GLOBINclear kits to improve detection of non-globin transcripts [1].
Platform-Specific Data Generation
Microarray Processing:
- Total RNA (100 ng) is processed using the GeneChip 3' IVT PLUS Reagent Kit
- Single-stranded cDNA is generated with T7-linked oligo(dT) primer, then converted to double-stranded DNA
- Biotin-labeled cRNA is synthesized through in vitro transcription
- Fragmented cRNA (12 µg) is hybridized onto microarray chips for 16 hours at 45°C
- Chips are stained, washed, and scanned to generate DAT files
- Image files are processed to produce CEL files using manufacturer's software [4]
RNA-seq Library Preparation and Sequencing:
- Total RNA (100 ng) undergoes poly(A) selection to enrich for mRNA
- Sequencing libraries are prepared using strand-specific library preparation kits
- Libraries are barcoded, pooled, and sequenced on Illumina platforms (e.g., HiSeq 3000)
- Target sequencing depth of 50 million paired-end reads per sample provides sufficient coverage for gene-level quantification [1]
Data Processing and Analysis Workflow
The following diagram illustrates the experimental workflow for cross-platform comparison:
Figure 1: Experimental workflow for cross-platform comparison of microarray and RNA-seq technologies. Samples are split after RNA extraction for parallel processing. Both platforms undergo platform-specific normalization before PCA analysis.
Microarray Data Processing:
- Raw CEL files are imported and quality checked using Transcriptome Analysis Console software
- Background adjustment, quantile normalization, and summarization are performed using the Robust Multi-Array Average (RMA) algorithm
- Normalized expression values are log2-transformed for downstream analysis [4] [1]
RNA-seq Data Processing:
- Raw reads are quality checked with FASTQC and trimmed for adapters/quality using Trimmomatic
- Processed reads are aligned to reference transcriptomes (e.g., UCSC hg38) using appropriate aligners
- Gene-level counts are quantified and normalized using transcripts per million (TPM) or variance-stabilizing transformation (VST) for downstream analysis [1]
PCA Implementation and Performance Assessment
Standardized PCA Methodology
Principal Component Analysis follows a systematic procedure to ensure reproducible dimension reduction across platforms:
Data Standardization: Expression data is standardized by subtracting the mean and dividing by the standard deviation for each variable (gene) to ensure all features contribute equally to the analysis, regardless of their original measurement scales [40] [53]. This step is critical as PCA is sensitive to the variances of initial variables [40].
Covariance Matrix Computation: The covariance matrix of standardized data is computed to understand how variables vary from the mean relative to each other and identify correlated variables that may contain redundant information [40].
Eigen Decomposition: Eigenvectors and eigenvalues of the covariance matrix are calculated, where eigenvectors represent the directions of maximum variance (principal components), and eigenvalues indicate the magnitude of variance captured by each component [40] [53].
Component Selection: Eigenvectors are ranked by their corresponding eigenvalues in descending order, and the top components capturing the majority of variance are selected based on scree plots or cumulative variance thresholds [40] [53].
Data Projection: The original data is projected onto the selected principal components to create a lower-dimensional representation for visualization and further analysis [40].
Performance Metrics for PCA Evaluation
The performance of PCA in addressing high-dimensionality challenges is assessed using multiple quantitative metrics:
Signal-to-Noise Ratio (SNR): Calculated based on PCA results to quantify the ability to distinguish biological signals from technical noise. Higher SNR values indicate better separation of sample groups relative to technical variation [8]. Multi-center studies report SNR values ranging from 0.3 to 37.6 for microarray and similar ranges for RNA-seq when analyzing samples with subtle biological differences [8].
Variance Explained: The percentage of total variance captured by successive principal components, typically visualized through scree plots. The number of components required to capture 80-90% of total variance provides insight into data complexity [40] [53].
Cluster Separation: The clear separation of biological replicates and distinct sample groups in PCA score plots indicates preserved biological signal after dimensionality reduction [8].
Research Reagent Solutions
Table 3: Essential research reagents and materials for cross-platform transcriptomic studies
| Reagent/Material | Function | Example Products |
|---|---|---|
| iPSC-derived Hepatocytes | In vitro model system for toxicogenomics and drug metabolism studies | iCell Hepatocytes 2.0 (FUJIFILM Cellular Dynamics) [4] |
| RNA Stabilization Tubes | Preserve RNA integrity in whole blood samples during collection and storage | PAXgene Blood RNA Tubes (Becton, Dickinson) [1] |
| RNA Isolation Kits | Purify high-quality total RNA with genomic DNA removal | PAXgene Blood RNA Kit (PreAnalytiX), EZ1 RNA Cell Mini Kit (Qiagen) [4] [1] |
| Globin Reduction Kits | Deplete globin mRNA from blood samples to improve detection of other transcripts | GLOBINclear Kit (Ambion) [1] |
| Microarray Kits | Process RNA for hybridization-based expression profiling | GeneChip 3' IVT PLUS Reagent Kit, GeneChip PrimeView Human Gene Expression Arrays (Affymetrix) [4] |
| RNA-seq Library Prep Kits | Prepare sequencing libraries from RNA for NGS-based expression profiling | Illumina Stranded mRNA Prep, NEBNext Ultra II RNA Library Prep Kit for Illumina [4] [1] |
| Reference Materials | Provide ground truth for method validation and quality control | Quartet reference materials, MAQC reference samples, ERCC RNA Spike-In Mixes [8] |
Analysis of PCA Performance Across Platforms
Data Structure and Variance Distribution
PCA performance differs between microarray and RNA-seq data due to fundamental differences in their data structures and variance characteristics. Microarray data consists of continuous fluorescence intensity values with a defined upper limit, creating a compressed dynamic range that affects variance distribution across principal components [4]. RNA-seq data, in contrast, comprises discrete count data with a theoretically unlimited dynamic range, potentially capturing more biological variation, particularly for highly expressed genes [4] [54].
The following diagram illustrates the PCA workflow and its application to transcriptomic data:
Figure 2: Standardized PCA workflow for high-dimensional transcriptomic data. The process transforms raw expression data into a low-dimensional representation suitable for various analytical applications.
RNA-seq data typically requires more extensive preprocessing before PCA application. While microarray data can often be directly analyzed after log2 transformation and normalization, RNA-seq count data commonly undergoes variance-stabilizing transformation (VST) to address mean-variance dependence inherent in count-based measurements [1]. The choice of transformation method significantly impacts PCA results, as the variance structure directly influences component calculation.
Technical and Biological Variance Capture
Both platforms demonstrate the ability to separate biological signals from technical noise when proper normalization and transformation methods are applied. A multi-center study evaluating PCA performance across 45 laboratories found that signal-to-noise ratios (SNR) based on PCA effectively discriminated data quality across platforms [8]. The study reported that samples with smaller intrinsic biological differences (Quartet reference materials) showed lower average SNR values (19.8, range 0.3-37.6) compared to samples with larger biological differences (MAQC reference materials, average SNR 33.0, range 11.2-45.2), reflecting the greater challenge in distinguishing subtle biological signals from technical variation [8].
When analyzing the same biological samples, both platforms tend to show similar patterns of sample clustering in PCA score plots, particularly when the same gene sets are analyzed [1]. However, RNA-seq often captures additional biological variance due to its ability to detect a wider range of transcript types, potentially leading to better separation of sample groups in cases where non-polyadenylated RNAs or splice variants contribute to biological differences [4] [54].
Impact of Feature Selection on PCA
Feature selection prior to PCA can significantly impact results on both platforms. Filtering methods that remove low-expression genes improve PCA performance by reducing noise [55] [56]. For microarray data, removing probes with low intensity across samples (e.g., bottom 25% by interquartile range) enhances biological signal capture [1]. For RNA-seq data, filtering genes with low counts across samples (e.g., requiring a minimum number of reads in a minimum number of samples) prevents technical artifacts from dominating principal components [1].
Studies comparing feature selection methods for high-dimensional data have found that simple approaches like variance filtering can outperform more complex methods [55] [56]. For PCA applications, selecting genes with the highest variance across samples often produces components that effectively capture biological signal, though this approach may prioritize technically variable genes over biologically relevant ones with consistent expression [55].
Microarray and RNA-seq technologies both generate high-dimensional data requiring sophisticated dimensionality reduction approaches like PCA for effective analysis. While RNA-seq offers technical advantages including wider dynamic range and ability to detect novel transcripts, both platforms demonstrate comparable performance in capturing biological variance when proper preprocessing, normalization, and analysis methods are applied. The choice between platforms should consider research objectives, with microarray remaining a cost-effective option for focused studies where established biomarkers are available, and RNA-seq providing advantages for discovery-phase research requiring comprehensive transcriptome coverage. For both technologies, appropriate feature selection strategies combined with PCA enable researchers to effectively address the challenges of high-dimensional data and extract meaningful biological insights.
In the field of transcriptomics, researchers rely heavily on two principal technologies for genome-wide expression profiling: microarrays and RNA sequencing (RNA-seq). Each platform exhibits distinct advantages and introduces specific technical artifacts that can confound biological interpretation if not properly managed. Microarray technology, based on hybridization of fluorescently labeled cDNA to pre-designed probes on a solid surface, is susceptible to probe hybridization artifacts including cross-hybridization, background fluorescence, and signal saturation [4] [57]. In contrast, RNA-seq, which quantifies expression through direct sequencing of cDNA fragments, faces challenges related to sequencing depth variability and library preparation biases that disproportionately affect detection of low-abundance transcripts [58] [59].
Principal Component Analysis (PCA) has emerged as an indispensable tool for quality control and exploratory analysis of high-dimensional transcriptomic data. When applied to data from different technological platforms, PCA performance is directly influenced by how effectively platform-specific noise is characterized and mitigated. Understanding these noise structures is essential for accurate biological interpretation, particularly as researchers increasingly seek to integrate legacy microarray datasets with newer RNA-seq data in meta-analyses [1] [60]. This guide provides a comprehensive comparison of noise characteristics across platforms, supported by experimental data and methodological recommendations for optimizing PCA performance in transcriptomic studies.
Technical Foundations and Noise Characteristics
Microarray Technology and Probe Hybridization Artifacts
Microarray technology operates on the principle of complementary hybridization, where fluorescently labeled cDNA fragments bind to DNA probes immobilized on a chip surface. The fluorescence intensity at each probe spot correlates with the expression level of the corresponding gene [4] [57]. This established technology provides a cost-effective solution for profiling known transcripts in well-annotated organisms, but its accuracy is limited by several probe-specific artifacts:
- Cross-hybridization: Non-specific binding of similar sequences leads to false positive signals, particularly in gene families with high sequence homology [57].
- Background fluorescence: Non-specific binding of labeled cDNA to the array surface creates elevated background noise that reduces the signal-to-noise ratio, especially for low-expression genes [4].
- Signal saturation: Fluorescence intensity reaches a maximum threshold, limiting the dynamic range for highly expressed genes and compressing expression fold-changes [4].
- Limited dynamic range: The effective quantification range of microarrays is constrained by background noise at the lower end and signal saturation at the upper end [4].
The predefined nature of microarray probes means they can only detect known, annotated transcripts, leaving novel genes, splice variants, and non-coding RNAs undetected [57].
RNA-Seq Technology and Sequencing Depth Considerations
RNA-seq utilizes next-generation sequencing platforms to directly sequence cDNA fragments, producing digital count data representing transcript abundance. The method involves converting RNA to a sequencing library, followed by massive parallel sequencing and alignment of the resulting reads to a reference genome or transcriptome [58]. While RNA-seq offers a broader dynamic range and the ability to discover novel transcripts, it introduces distinct technical variations:
- Sequencing depth variability: The number of reads obtained per sample directly impacts detection sensitivity, particularly for low-abundance transcripts [58] [59].
- Library composition biases: Differences in transcript length distribution and GC content between samples create technical variations that require specialized normalization [58].
- Mapping ambiguities: Reads deriving from homologous genes or multiple splice variants may map to multiple genomic locations, complicating accurate quantification [58].
- Batch effects: Technical variations introduced during library preparation, sequencing runs, or reagent lots can create systematic biases that obscure biological signals [8].
Sequencing depth requirements vary significantly based on research goals. Standard gene expression analysis typically requires 20-30 million reads per sample, while detection of rare transcripts and splicing events may necessitate hundreds of millions of reads [59].
Table 1: Fundamental Differences Between Microarray and RNA-Seq Technologies
| Characteristic | Microarray | RNA-Seq |
|---|---|---|
| Detection principle | Hybridization-based | Sequencing-based |
| Output data | Continuous fluorescence intensity | Digital read counts |
| Dynamic range | Limited (∼10²-10³) | Wide (∼10⁵) |
| Background noise | High background fluorescence | Low background |
| Transcript discovery | Limited to predefined probes | Capable of novel transcript discovery |
| Technical variations | Probe-specific efficiency, cross-hybridization | Sequencing depth, GC content bias, mapping errors |
Experimental Design for Cross-Platform Comparison
Case Study: Cannabinoid Response in Hepatocytes
A well-designed comparison study investigating the transcriptomic responses to cannabinoids (cannabichromene and cannabinol) in iPSC-derived hepatocytes provides exemplary methodology for cross-platform comparison [4]. The experimental design applied both microarray and RNA-seq to the same biological samples, enabling direct comparison of results while controlling for biological variation.
Experimental Protocol:
- Cell culture: Commercial iPSC-derived hepatocytes (iCell Hepatocytes 2.0) were cultured following manufacturer's protocol in 24-well plates coated with rat tail collagen type I [4].
- Compound exposure: Cells were exposed to varying concentrations of cannabinoids (CBC and CBN) in triplicate for 24 hours, with vehicle controls containing 0.5% DMSO only [4].
- RNA isolation: Total RNA was purified using EZ1 Advanced XL automated instrument with DNase digestion step. RNA quality was verified using Nanodrop and Bioanalyzer (RIN >7) [4].
- Platform-specific processing:
This carefully controlled design enabled direct comparison of both technologies while minimizing sources of variation unrelated to the platforms themselves.
Analytical Workflow for Cross-Platform Data Integration
A separate study comparing microarray and RNA-seq data from peripheral blood cells of 35 participants established a robust analytical framework for cross-platform comparison [1]. The methodology emphasized consistent statistical approaches to minimize discrepancies:
Data Processing Workflow:
- Microarray processing: Raw CEL files were background-corrected, quantile-normalized, and summarized using Robust Multi-Array Averaging (RMA) with log2 transformation [1].
- RNA-seq processing: Quality control with FASTQC, adapter trimming with Trimmomatic, alignment to reference transcriptome, and generation of count data [1].
- Cross-platform normalization: Application of quantile normalization and Training Distribution Matching enabled combined analysis of microarray and RNA-seq data [60].
- Differential expression: Non-parametric Mann-Whitney U tests with multiple comparison adjustment (BH method, padj < 0.05) applied consistently to both platforms [1].
This consistent statistical approach revealed a high correlation (median Pearson correlation coefficient = 0.76) between platforms despite differences in raw data structure [1].
Figure 1: Experimental workflow for cross-platform comparison of microarray and RNA-seq technologies, highlighting sources of platform-specific noise.
Quantitative Comparison of Platform Performance
Detection Sensitivity and Dynamic Range
Multiple studies have systematically compared the detection capabilities of microarray and RNA-seq platforms. A study using peripheral blood cells from 35 participants revealed significant differences in gene detection: microarray detected 15,828 genes after filtering (∼29% less than RNA-seq), while RNA-seq identified 22,323 genes. The platforms shared 13,577 genes, representing approximately 86% of microarray's detection capacity but only 61% of RNA-seq's broader detection range [1].
In differential expression analysis, RNA-seq consistently identifies larger numbers of differentially expressed genes (DEGs). In the blood cell study, RNA-seq detected 2,395 DEGs compared to only 427 by microarray, with 223 DEGs shared between platforms [1]. Similarly, in the cannabinoid study, RNA-seq identified "larger numbers of differentially expressed genes (DEGs) with wider dynamic ranges" [4]. This enhanced sensitivity comes primarily from RNA-seq's ability to detect low-abundance transcripts that fall below the detection threshold of microarrays.
Table 2: Performance Comparison in Differential Expression Analysis
| Performance Metric | Microarray | RNA-Seq | Experimental Context |
|---|---|---|---|
| Typical DEGs detected | 427 | 2,395 | Blood cell study [1] |
| Shared DEGs | 223 (52% of array DEGs) | 223 (9% of RNA-seq DEGs) | Blood cell study [1] |
| Dynamic range | Limited | Wider | Cannabinoid study [4] |
| Pathways identified | 47 | 205 | Blood cell study [1] |
| Shared pathways | 30 (64% of array pathways) | 30 (15% of RNA-seq pathways) | Blood cell study [1] |
| Transcriptomic PoD values | Equivalent levels | Equivalent levels | Cannabinoid study [4] |
Impact on Pathway Analysis and Biological Interpretation
Despite substantial differences in raw gene detection and DEG numbers, both platforms can yield similar biological interpretations when analyzed appropriately. In the cannabinoid study, both platforms "displayed equivalent performance in identifying functions and pathways impacted by compound exposure through gene set enrichment analysis (GSEA)" [4]. Furthermore, transcriptomic point of departure (tPoD) values derived through benchmark concentration (BMC) modeling "were on the same levels for both CBC and CBN" using either platform [4].
The blood cell study revealed similar concordance in functional analysis: pathway analysis identified 47 perturbed pathways by microarray and 205 by RNA-seq, with 30 pathways shared between platforms [1]. This suggests that while RNA-seq detects more subtle changes, both platforms capture the major biological themes when proper analytical approaches are applied.
PCA Performance Across Platforms
Noise Structure and Its Impact on PCA
The performance of Principal Component Analysis (PCA) in capturing biological signal is strongly influenced by platform-specific noise characteristics. A multi-center study evaluating RNA-seq performance across 45 laboratories utilized PCA-based signal-to-noise ratio (SNR) as a key metric for data quality assessment [8]. This study found that "PCA-based SNR values using both the Quartet and MAQC samples discriminated the quality of all gene expression data into a wide range, reflecting the varying ability to distinguish biological signals in different sample groups from technical noises in replicates" [8].
The study further demonstrated that smaller intrinsic biological differences were more challenging to distinguish from technical noise, as indicated by lower average SNR values for samples with subtle differences (19.8) compared to those with large biological differences (33.0) [8]. This sensitivity to effect size has important implications for PCA performance in different experimental contexts.
Strategies for Optimizing PCA Performance
To maximize PCA performance for biological discovery, researchers should implement platform-specific preprocessing strategies:
For Microarray Data:
- Apply robust multi-array average (RMA) normalization to address background noise and probe-specific artifacts [1].
- Implement variance-stabilizing transformations to handle heteroscedasticity of intensity measurements.
- Filter low-expression probes that predominantly contribute technical noise rather than biological signal.
For RNA-Seq Data:
- Utilize variance-stabilizing transformations (e.g., DESeq2's VST) or regularized logarithm transformation to address mean-variance dependence in count data [1].
- Consider sequencing depth normalization (e.g., TMM in edgeR or median-of-ratios in DESeq2) to correct for library size differences [58].
- Filter low-count genes while preserving potentially important low-expression transcripts through careful thresholding.
For integrated analysis of both data types, cross-platform normalization methods such as quantile normalization and Training Distribution Matching have proven effective [60]. These approaches enable simultaneous machine learning model training on combined microarray and RNA-seq datasets.
Table 3: Key Research Reagents and Computational Tools for Platform Comparison Studies
| Item | Function | Example Products/Tools |
|---|---|---|
| Reference RNA samples | Quality control and cross-platform normalization | Quartet reference materials, MAQC reference samples [8] |
| RNA isolation kits | High-quality RNA extraction with genomic DNA removal | PAXgene Blood RNA Kit, EZ1 RNA Cell Mini Kit [4] [1] |
| Globin reduction kits | Improve detection sensitivity in blood samples | GLOBINclear Kit [1] |
| Microarray platforms | Gene expression profiling via hybridization | GeneChip PrimeView Human Gene Expression Array [4] |
| Library prep kits | RNA-seq library construction | Illumina Stranded mRNA Prep, NEBNext Ultra II RNA Library Prep [4] [1] |
| Alignment tools | Map sequencing reads to reference genome | STAR, HISAT2, TopHat2 [58] |
| Quantification tools | Generate expression values from aligned reads | featureCounts, HTSeq-count, Salmon, Kallisto [58] |
| Normalization methods | Cross-platform data integration | Quantile normalization, Training Distribution Matching [60] |
| Differential expression tools | Identify statistically significant expression changes | DESeq2, edgeR, limma [58] [57] |
Figure 2: Factors influencing PCA performance in transcriptomic data analysis and recommended optimization strategies.
Based on comprehensive evidence from multiple comparative studies, both microarray and RNA-seq technologies provide valuable approaches for transcriptomic analysis when their specific noise characteristics are properly managed. Microarray remains a viable choice for targeted studies of known transcripts with budget constraints, while RNA-seq offers superior sensitivity and discovery potential for novel transcripts and splice variants [4] [57].
For optimal PCA performance and biological interpretation, we recommend:
Platform selection aligned with research goals: Choose microarrays for well-annotated organisms with focused research questions, and RNA-seq for discovery-oriented studies or non-model organisms [57].
Sequencing depth optimization: Target 20-30 million reads per sample for standard differential expression analysis, and increase to hundreds of millions for detecting rare transcripts and splicing events [58] [59].
Platform-specific preprocessing: Apply RMA for microarrays and appropriate count-based normalization methods (e.g., DESeq2, edgeR) for RNA-seq to address platform-specific noise structures [58] [1].
Cross-platform integration: Utilize quantile normalization or Training Distribution Matching when combining datasets from both platforms [60].
Rigorous quality assessment: Implement PCA-based signal-to-noise ratio monitoring to evaluate data quality, particularly for studies expecting subtle expression differences [8].
By understanding and managing platform-specific noise characteristics, researchers can maximize the utility of both microarray and RNA-seq technologies, ensuring robust biological insights from transcriptomic studies across diverse research contexts.
In the field of transcriptomics, Principal Component Analysis (PCA) serves as a fundamental dimension reduction technique, projecting samples with tens of thousands of genes into a lower-dimensional space for visualization and analysis [61]. The computational approach to PCA, however, must be tailored to the specific data generation technology. The emergence of RNA sequencing (RNA-seq) as a predominant platform has introduced new challenges and considerations for efficient PCA algorithms compared to traditional microarray data.
RNA-seq and microarrays differ fundamentally in their operational principles; while microarrays rely on hybridization-based detection using predefined fluorescent probes, RNA-seq employs direct sequencing of cDNA through next-generation sequencing technologies [7]. This fundamental distinction results in critical differences in data structure that directly impact PCA performance and methodology. RNA-seq data is characterized by its wide dynamic range, capacity to detect novel transcripts, and digital counting nature, which presents both opportunities and challenges for dimensionality reduction compared to the more constrained fluorescence intensity measurements of microarrays [62] [7].
Understanding these platform-specific characteristics is essential for developing and applying computationally optimized PCA approaches that can handle the scale and complexity of modern RNA-seq datasets while maintaining biological relevance. This guide provides a comprehensive comparison of PCA performance and methodologies across these transcriptomic platforms.
Technical Comparison: Data Structures and Their Computational Implications
Table 1: Fundamental differences between microarray and RNA-seq data affecting PCA performance
| Characteristic | Microarray Data | RNA-Seq Data | Impact on PCA |
|---|---|---|---|
| Data Generation | Hybridization-based fluorescence intensity | Digital read counting via NGS | RNA-seq's counting nature violates normality assumptions in standard PCA |
| Dynamic Range | Limited (~10³), susceptible to background noise and saturation [7] | Wide (>10⁵) with discrete quantification [7] | PCA on RNA-seq captures more biological variance but requires specialized transformations |
| Prior Sequence Knowledge | Required for probe design [7] | Not required; can detect novel transcripts | RNA-seq PCA can incorporate novel features increasing dimensionality |
| Data Distribution | Continuous, approximately normal after preprocessing | Discrete count data with mean-variance relationship | Standard PCA inappropriate for raw counts; requires model-based alternatives |
| Typical Data Size | Smaller, manageable file sizes [4] | Larger files with more complex structure [62] | RNA-seq demands more computational resources and memory for PCA |
The application of PCA to RNA-seq data requires special consideration of its fundamental statistical properties. As noted in recent research, "the extreme sparsity and discreteness of scRNA-seq count data make traditional statistical models based on normal distributions inappropriate" [63]. This limitation extends to bulk RNA-seq data as well, necessitating specialized approaches to dimensionality reduction that account for the unique characteristics of sequencing count data.
RNA-seq data typically exhibits a wider dynamic range and higher sensitivity compared to microarrays, capable of detecting "rare and low abundance transcripts with ease" [7]. While biologically advantageous, this characteristic complicates standard PCA applications, as the transformation and normalization requirements become more critical. The default approach in analysis pipelines like Scanpy (Log+PCA) transforms raw counts using ( \log(1+x) ) before applying PCA, while Seurat employs a similar transformation followed by standardization to zero mean and unit variance [63].
Experimental Benchmarking: Methodologies for Performance Evaluation
Standard PCA Protocols for Transcriptomic Data
Table 2: Experimental protocols for PCA performance benchmarking
| Method Category | Specific Implementation | Key Parameters | Typical Application |
|---|---|---|---|
| Standard PCA | Log+PCA (Scanpy default) | Transformation: log(1+x), PCA on transformed matrix |
Baseline method for RNA-seq |
| Standardized PCA | Log+Scale+PCA (Seurat default) | Transformation: log(1+x), standardization, then PCA |
Microarray and RNA-seq |
| Residual-based PCA | scTransform+PCA | Negative binomial regression, Pearson residuals, then PCA | Large-scale RNA-seq data |
| Model-based DR | scGBM (Poisson bilinear model) | Fast iteratively reweighted SVD, uncertainty quantification | Single-cell and bulk RNA-seq |
| Analytical Residuals | APR+PCA | Analytic Pearson residuals with fixed dispersion | Rapid processing of RNA-seq |
The experimental evaluation of PCA performance requires careful protocol standardization. For microarray data, the standard preprocessing pipeline includes "background adjustment, quantile normalization, and summarization using Robust Multi-Array Averaging (RMA)" before PCA application [4]. The normalized expression values are typically converted to log2 scale for downstream analysis, which stabilizes variance and makes the data more amenable to traditional PCA.
For RNA-seq data, the process involves additional considerations. As demonstrated in recent studies, total RNA is typically isolated with quality assessment (RIN ≥ 9), followed by library preparation using kits such as the "TruSeq Stranded mRNA Prep" or "Illumina Stranded mRNA Prep" [4] [62]. The sequenced reads are then quality-controlled, aligned to a reference genome, and counted per gene before normalization. The PCA is then applied to transformed count data, with the choice of transformation significantly impacting results.
Benchmarking studies typically evaluate PCA performance based on several criteria: the ability to capture biological signal (e.g., separation of known cell types or treatments), computational efficiency (run time and memory usage), and stability of results. As demonstrated in a 2025 study, "scGBM produces low-dimensional embeddings that better capture relevant biological information while removing unwanted variation" compared to standard methods [63].
Performance Evaluation Metrics
The evaluation of PCA algorithm performance on large-scale RNA-seq data encompasses multiple dimensions. Biologically, researchers assess the "ability to separate the cell types via the first two PCs" and the preservation of known biological groupings in the reduced dimension space [63]. Computationally, key metrics include runtime, memory consumption, and scalability to datasets with millions of cells. Statistically, uncertainty quantification and sensitivity to technical artifacts provide additional evaluation criteria.
Recent research has highlighted that "commonly used transformations such as can still lead to substantial bias in the subsequent PCA results" [63], emphasizing the need for careful method selection. Studies have shown that in simple simulations with rare cell types, methods like Log+Scale+PCA and SCT+PCA may "fail to separate any of the cell types," while model-based approaches like scGBM successfully capture the biological signal [63].
RNA-seq PCA Analysis Workflow: This diagram illustrates the standard processing pipeline for RNA-seq data prior to PCA, highlighting three methodological alternatives at the transformation stage that significantly impact computational performance and biological results.
The Scientist's Toolkit: Essential Research Reagents and Computational Solutions
Table 3: Key research reagents and computational tools for transcriptomic PCA
| Category | Item | Specific Example | Function in Analysis |
|---|---|---|---|
| Wet Lab Reagents | RNA Isolation Kit | PAXgene Blood RNA Kit, Qiazol extraction [62] [1] | High-quality RNA extraction essential for both platforms |
| Library Prep Kit | TruSeq Stranded mRNA Prep [62], NEBNext Ultra II [1] | cDNA library construction for RNA-seq | |
| Microarray Platform | GeneChip Human Genome U133 Plus 2.0 [1] | Standardized microarray analysis | |
| Computational Tools | PCA Software | Scanpy, Seurat, scGBM [64] [63] | Dimension reduction implementation |
| Normalization Methods | RMA (microarray), TPM/FPKM (RNA-seq) | Data preprocessing for PCA compatibility | |
| Quality Control | FASTQC, Bioanalyzer RIN [1] | Data quality assessment pre-PCA | |
| Specialized Algorithms | Model-based PCA | scGBM, GLM-PCA, ZINB-WAVE [63] | Count-aware dimension reduction |
The computational toolkit for handling PCA of large-scale RNA-seq data has evolved significantly to address the unique challenges of sequencing data. Model-based methods such as scGBM, which "fits a Poisson bilinear model to the count matrix" using "fast estimation algorithm to fit the model using iteratively reweighted singular value decompositions," enable scalable processing of datasets with millions of cells [63]. These approaches circumvent the limitations of transformation-based PCA methods that can "induce spurious heterogeneity and mask true biological variability" [63].
Specialized tools have emerged to address specific analytical challenges. The scGBM package, for instance, not only performs dimensionality reduction but also "quantifies the uncertainty in each cell's latent position and leverages these uncertainties to assess the confidence associated with a given cell clustering" [63]. This uncertainty quantification represents a significant advancement over traditional PCA methods, providing researchers with metrics to evaluate the robustness of their dimension reduction results.
For researchers working with both microarray and RNA-seq data, integration methods have been developed that increase "comparability between RNA-Seq and microarray data by utilization of gene sets" [50]. These approaches transform high-dimensional transcriptomics data into lower-dimensional, biologically relevant enrichment scores, enabling more consistent PCA applications across platforms.
Comparative Analysis: PCA Performance Across Platforms
The performance of PCA algorithms differs substantially between microarray and RNA-seq data due to their inherent technological differences. RNA-seq's wider dynamic range results in greater technical variance structure that must be accounted for in dimensionality reduction. As demonstrated in performance comparisons, "Log+Scale+PCA and SCT+PCA fail to separate any of the cell types" in simulations with rare cell populations, while model-based approaches successfully capture these biological signals [63].
Microarray data, being continuous and approximately normal after preprocessing, is more amenable to traditional PCA approaches. The data processing pipeline for microarrays includes "background adjustment, quantile normalization, and summarization using Robust Multi-Array Averaging (RMA)" which produces data that aligns well with the assumptions underlying standard PCA [4]. The resulting data structure is more computationally tractable but lacks the sensitivity and dynamic range of RNA-seq.
For RNA-seq data, the discrete count nature with characteristic mean-variance relationships requires specialized approaches. As noted in recent methodological research, "commonly used transformations such as can still lead to substantial bias in the subsequent PCA results" [63], motivating the development of model-based alternatives. Methods like scGBM that directly model the count distribution using "a Poisson bilinear model to the count matrix" have demonstrated superior performance in capturing biological signal while removing unwanted technical variation [63].
The computational resources required also differ significantly between platforms. RNA-seq data, with its larger file sizes and more complex structure, "entails an extensive and more complex bioinformatic analysis, which results in highly intensive and expensive computation infrastructure and analytics, as well as longer analysis times" compared to microarray data [62]. This has practical implications for researchers designing computational workflows and allocating resources for transcriptomic studies.
The computational optimization of PCA for large-scale RNA-seq data remains an active area of research and development. While microarray data continues to be analytically tractable with standard methods, the unique characteristics of RNA-seq data have driven innovation in dimension reduction techniques. Model-based approaches that directly account for the count-based nature of sequencing data represent the current state-of-the-art, offering improved biological signal capture and uncertainty quantification.
Future methodological developments will likely focus on enhancing scalability as single-cell datasets continue to grow in size, improving integration capabilities across different transcriptomic platforms, and refining uncertainty quantification for downstream analytical decisions. The integration of dimension reduction with other analytical steps in the transcriptomics workflow will also represent an important direction for computational optimization.
As the field continues to evolve, the selection of appropriate PCA methodologies will remain critical for extracting biologically meaningful insights from large-scale RNA-seq datasets while maintaining computational efficiency and statistical rigor.
In transcriptomic analysis, the signal-to-noise ratio (SNR) fundamentally determines the reliability and precision of biological insights. It quantifies the ability to distinguish true biological signals from technical variations inherent in experimental platforms and procedures. A higher SNR indicates a clearer separation between biological effects and technical noise, which becomes particularly crucial when investigating subtle expression differences between disease subtypes, treatment responses, or closely related cell types [8]. The choice between microarray and RNA-seq technologies, along with their respective experimental and bioinformatic workflows, directly impacts the achievable SNR and consequently influences the detection of differentially expressed genes (DEGs) and the accuracy of downstream analyses such as Principal Component Analysis (PCA).
This guide objectively compares the performance of microarray and RNA-seq platforms, focusing specifically on their inherent characteristics that affect SNR. We present supporting experimental data and detailed methodologies to help researchers, scientists, and drug development professionals make informed decisions for their transcriptomic studies.
Technology Comparison: Microarray vs. RNA-Seq
Fundamental Technological Differences
Microarray and RNA-seq technologies employ fundamentally different principles for transcriptome profiling, which directly impact their signal detection capabilities.
Microarray Technology relies on hybridization between fluorescently-labeled cDNA and predefined, immobilized DNA probes on a solid surface [7]. The signal is measured as continuous fluorescence intensity, which can be limited by background noise, nonspecific binding, and signal saturation at high expression levels [4]. This technology requires prior knowledge of the target sequences.
RNA-seq Technology is based on next-generation sequencing of cDNA molecules, producing digital read counts that represent transcript abundance [1] [7]. This approach provides a discrete, digital quantification method that fundamentally differs from microarray's analog approach, enabling a wider dynamic range and detection of novel transcripts without prior sequence knowledge.
The following diagram illustrates the fundamental workflow differences between these two technologies:
Performance Metrics and Quantitative Comparison
Multiple studies have systematically compared the performance of microarray and RNA-seq platforms, with SNR being a critical metric for evaluation. One large-scale multi-center study calculated PCA-based SNR values to assess data quality, finding that RNA-seq generally provides superior performance for detecting subtle differential expression [8].
Table 1: Performance Comparison of Microarray and RNA-Seq Platforms
| Performance Characteristic | Microarray | RNA-Seq | Experimental Support |
|---|---|---|---|
| Dynamic Range | ~10³ [7] | >10⁵ [7] | Wider linear range enables more accurate quantification of highly and lowly expressed genes |
| DEG Detection Sensitivity | Identified 427 DEGs in a HIV study [1] | Identified 2,395 DEGs in the same HIV study [1] | RNA-seq detects 5.6× more differentially expressed genes |
| Platform Concordance | 78% overlap in DEGs with RNA-seq in toxicogenomics study [19] | High correlation (0.76) with microarray expression profiles [1] | Strong but incomplete agreement between platforms |
| Signal-to-Noise Ratio | Lower PCA-based SNR for samples with small biological differences [8] | Higher PCA-based SNR enables better distinction of subtle expression differences [8] | Critical for detecting clinically relevant subtle differential expression |
| Novel Transcript Detection | Limited to predefined probes [4] | Comprehensive detection of novel transcripts, splice variants, and non-coding RNAs [4] [19] | RNA-seq identifies non-coding RNAs and novel sequences |
Experimental Protocols for SNR Optimization
Standardized RNA-seq Benchmarking Methodology
Large-scale consortium-led studies have established rigorous protocols for assessing RNA-seq performance and SNR characteristics:
Reference Material Selection: The Quartet project uses well-characterized reference materials from immortalized B-lymphoblastoid cell lines derived from a Chinese quartet family, which provide samples with small biological differences ideal for assessing subtle differential expression detection [8]. MAQC reference materials (MAQC A and B) with larger biological differences are used in parallel.
Spike-in Controls: ERCC (External RNA Control Consortium) synthetic RNA spikes are added to samples at known concentrations before library preparation to provide built-in truth for assessing quantification accuracy [8].
Multi-laboratory Design: The same RNA reference materials are distributed to multiple laboratories (45 in the Quartet study), each using their own in-house experimental protocols and analysis pipelines to assess real-world performance [8].
Data Quality Assessment: PCA-based SNR calculation involves performing principal component analysis and computing the ratio of between-sample variance to within-sample variance, providing a quantitative measure of technical noise relative to biological signal [8].
Microarray Experimental Protocol
For microarray analysis, standardized protocols ensure optimal SNR and reproducible results:
Sample Preparation: Total RNA is extracted using phenol-chloroform methods (e.g., Qiazol) with on-column DNase I treatment to remove genomic DNA contamination. RNA quality is verified using BioAnalyzer with RIN scores ≥9 [19].
Labeling and Hybridization: For Affymetrix platforms, 100ng total RNA is processed using the GeneChip 3' IVT PLUS Reagent Kit, which includes reverse transcription, cDNA purification, in vitro transcription for cRNA amplification, and fragmentation. Biotin-labeled cRNA is hybridized to microarray chips for 16 hours at 45°C [4].
Signal Detection: Arrays are washed, stained, and scanned using specialized fluidics stations and scanners. Raw image files (DAT) are processed to generate cell intensity files (CEL) using manufacturer's software [4].
Data Processing: The Robust Multi-Array Average (RMA) algorithm is applied for background adjustment, quantile normalization, and summarization to generate normalized expression values on a log2 scale [4] [1].
PCA Performance on Microarray vs. RNA-seq Data
Comparative Analysis of PCA Applications
Principal Component Analysis serves as a powerful tool for visualizing sample relationships and assessing data quality in transcriptomic studies. The performance of PCA differs notably between microarray and RNA-seq data due to their fundamental technological differences.
Table 2: PCA Performance Comparison Between Microarray and RNA-Seq Data
| PCA Characteristic | Microarray Data | RNA-Seq Data | Interpretation |
|---|---|---|---|
| Data Distribution | Continuous, normal-like distribution [1] | Count-based, follows negative binomial distribution [1] | Different statistical distributions require specific preprocessing |
| Variance Structure | Technical noise predominates in lower abundance genes [4] | Greater heterogeneity in variance across expression ranges [8] | RNA-seq reveals more complex variance patterns |
| Normalization Requirements | RMA normalization addresses background and probe effects [1] | Requires specialized normalization (e.g., VST) for count data [1] | Platform-specific normalization critical for PCA quality |
| Separation Capability | Lower SNR in samples with small biological differences [8] | Higher SNR enables better group separation [8] | RNA-seq superior for distinguishing subtle expression patterns |
| Technical Batch Effects | Significant batch effects requiring correction [8] | Pronounced inter-laboratory variations [8] | Both platforms susceptible to technical variability |
SNR Optimization for Enhanced PCA Performance
The following workflow outlines the key steps for optimizing SNR in transcriptomic data analysis, with particular emphasis on preparing data for PCA:
Research Reagent Solutions for SNR Enhancement
Selecting appropriate reagents and kits is essential for optimizing SNR in transcriptomic studies. The following table details essential research reagents and their functions:
Table 3: Essential Research Reagents for Transcriptomic Studies
| Reagent/Kits | Primary Function | SNR Impact |
|---|---|---|
| PAXgene Blood RNA Kit | Stabilizes RNA in whole blood samples at collection [1] | Preserves RNA integrity, reduces degradation noise |
| TruSeq Stranded mRNA Prep Kit | RNA-seq library preparation with strand specificity [19] | Maintains directional information, reduces misalignment |
| GlobinClear Kit | Depletes globin mRNA from blood samples [1] | Reduces high-abundance transcripts that mask signal |
| ERCC Spike-in Controls | Synthetic RNA additives with known concentrations [8] | Provides internal standards for normalization |
| GeneChip 3' IVT Plus Kit | Microarray sample processing for Affymetrix platforms [4] [1] | Standardized amplification and labeling |
| QIAshredder Homogenizers | Tissue homogenization and cell lysis [4] | Ensures representative RNA sampling |
| RNeasy Mini Kit | Silica-membrane based RNA purification [4] | Removes inhibitors, ensures high-quality RNA |
The choice between microarray and RNA-seq technologies should be guided by research objectives, budget constraints, and the specific biological questions under investigation. For studies requiring maximum sensitivity, detection of novel transcripts, and identification of subtle expression differences, RNA-seq provides superior SNR and broader dynamic range. However, microarray technology remains a viable and cost-effective option for focused research questions where the genes of interest are well-annotated, particularly when studying pronounced expression changes [4] [19].
Both platforms can generate highly concordant biological insights when analyzed with appropriate statistical methods [1]. As sequencing costs continue to decrease and analytical methods improve, RNA-seq is increasingly becoming the preferred platform for transcriptomic analysis, though microarrays maintain utility for large-scale studies where cost considerations remain paramount. Ultimately, researchers must balance the enhanced SNR and detection capabilities of RNA-seq against practical considerations of cost, data storage, and computational requirements when selecting the optimal platform for their specific application.
In the field of transcriptomics, researchers and drug development professionals increasingly leverage gene expression data to understand cellular processes, disease mechanisms, and compound toxicity. Principal Component Analysis (PCA) is a fundamental statistical technique employed to reduce the dimensionality of such high-dimensional data, revealing the most important patterns, identifying batch effects, and assessing sample outliers. The choice of transcriptomic platform—microarray or RNA sequencing (RNA-seq)—can significantly influence the results of PCA and subsequent biological interpretations. Microarray technology, a hybridization-based platform, has been the cornerstone of transcriptome profiling for decades, offering well-established protocols and lower per-sample cost. In contrast, RNA-seq, a sequencing-based technology, provides a broader dynamic range and can detect novel transcripts. This guide objectively compares the performance of PCA and other quality control metrics when applied to data from these two platforms, providing supporting experimental data to inform platform selection for research and regulatory applications [65] [36].
Platform Comparison: Experimental Data and Performance
Direct comparisons of microarray and RNA-seq, starting from the same biological samples, provide the most robust assessment of their performance characteristics. The quantitative data below summarizes key findings from such comparative studies.
Table 1: Summary of Comparative Performance Metrics from Recent Studies
| Performance Metric | Microarray | RNA-seq | Experimental Context |
|---|---|---|---|
| Gene Detection Capacity | 15,828 - 20,174 genes [36] | 22,323 - 26,475 genes [36] | Analysis of whole blood samples from youth with and without HIV [36] |
| Differentially Expressed Genes (DEGs) Identified | 427 DEGs [36] | 2395 DEGs [36] | Same as above; non-parametric Mann-Whitney U test (padj < 0.05) [36] |
| Overlap in DEGs Between Platforms | 52.2% of its DEGs were shared with RNA-seq [36] | 9.3% of its DEGs were shared with microarray [36] | Significant concordance in overlap (p = 2.2 × 10⁻¹⁶) [36] |
| Correlation of Gene Expression Profiles | Median Pearson r = 0.76 with RNA-seq [36] | Median Pearson r = 0.76 with microarray [36] | Based on shared genes from the same samples [36] |
| Pathway Analysis Output | 47 perturbed pathways identified [36] | 205 perturbed pathways identified [36] | 30 pathways were shared between platforms [36] |
| Transcriptomic Point of Departure (tPoD) | Similar tPoD values for cannabinoids [65] | Similar tPoD values for cannabinoids [65] | Concentration-response study with CBC and CBN; iPSC-derived hepatocytes [65] |
The data demonstrates that while RNA-seq detects a larger number of genes and DEGs, the functional outcomes—such as enriched pathways and quantitative tPoD values—can be highly concordant between the two platforms. This suggests that for applications like mechanistic pathway identification and concentration-response modeling, microarray remains a viable and cost-effective option [65] [36].
Methodologies for Cross-Platform Comparison
To ensure fair and meaningful comparisons, studies must follow rigorous experimental protocols from sample preparation through data analysis.
Sample Preparation and Data Generation
In a typical comparative workflow, RNA is isolated from the same set of biological samples (e.g., whole blood or cultured cells). For microarray analysis, globin-reduced RNA is often amplified, labeled, and hybridized to arrays such as the Affymetrix GeneChip Human Genome U133 Plus 2.0. The raw signal intensities (CEL files) are then background-corrected, quantile-normalized, and summarized using algorithms like Robust Multi-Array Averaging (RMA), with expression values converted to a log₂ scale [36]. For RNA-seq, libraries are prepared from the same RNA extracts using poly(A) selection and are sequenced on platforms like Illumina HiSeq. The raw reads are quality-controlled, trimmed, and aligned to a reference transcriptome. Gene expression is quantified as read counts or Transcripts Per Million (TPM) [36] [66].
Data Preprocessing and Normalization for PCA
The inherent differences in data structure between platforms—continuous fluorescence intensity for microarray and discrete read counts for RNA-seq—necessitate specific preprocessing before PCA.
- Microarray Data: Log₂-transformed expression values are often used directly for PCA [36].
- RNA-seq Data: Raw count data is not normally distributed and requires transformation. Common practices include:
To enable joint PCA across platforms for integrated analysis, several normalization methods have been evaluated.
- Quantile Normalization (QN): A widely used method that makes the distribution of probe or gene intensities the same across arrays and can be applied to RNA-seq data to match a microarray reference distribution [21].
- Training Distribution Matching (TDM): A method designed specifically to normalize RNA-seq data to a target distribution (like microarray) for machine learning applications [21].
- Nonparanormal Normalization (NPN): A robust method that also shows strong performance in making the two platforms comparable for downstream analyses [21].
Diagram 1: Experimental workflow for cross-platform comparison of microarray and RNA-seq data, from sample processing to PCA and analysis.
The Scientist's Toolkit: Key Reagents and Software
Successful execution of a cross-platform transcriptomic study requires a suite of reliable laboratory reagents and bioinformatics tools.
Table 2: Essential Research Reagents and Computational Tools
| Category | Item | Function / Description | Example Products / Packages |
|---|---|---|---|
| Sample Prep | RNA Isolation Kit | Purifies intact, high-quality total RNA from biological samples. | PAXgene Blood RNA Kit, Qiagen RNeasy Kits [36] |
| Globin Reduction Kit | Depletes globin mRNA from whole blood RNA to improve transcriptome coverage. | GLOBINclear Kit (Ambion) [36] | |
| Microarray | GeneChip Array | Solid-surface array with immobilized probes for specific transcript detection. | Affymetrix GeneChip Human Genome U133 Plus 2.0 [36] |
| 3' IVT Kit | Amplifies and biotin-labels cDNA for microarray hybridization. | GeneChip 3' IVT Express Kit [65] [36] | |
| RNA-seq | Library Prep Kit | Prepares a sequencing-ready cDNA fragment library from RNA. | NEBNext Ultra II RNA Library Prep Kit [36] |
| Poly-A Selection Module | Enriches for messenger RNA (mRNA) by selecting poly-adenylated transcripts. | Poly(A) mRNA Magnetic Isolation Module [36] | |
| Bioinformatics | Normalization & DEG | Software packages for data normalization and differential expression analysis. | affy & limma (microarray); DESeq2 & edgeR (RNA-seq) [34] [36] [66] |
| Pathway Analysis | Tool for functional interpretation of gene lists in the context of biological pathways. | Ingenuity Pathway Analysis (IPA) [36] | |
| Cross-Platform Normalization | Methods and packages to combine data from different platforms. | Quantile Normalization, TDM, NPN [21] |
The choice between microarray and RNA-seq for transcriptomic studies is not a simple matter of one platform being superior to the other. RNA-seq offers a broader dynamic range and detects more genes and differentially expressed transcripts. However, for many traditional applications—including pathway enrichment analysis and concentration-response modeling—both platforms can produce functionally concordant and biologically relevant results, with PCA performance being highly dependent on appropriate data preprocessing. Microarray remains a viable option, particularly when considering its lower cost, smaller data size, and the extensive availability of analytical tools and reference databases. Researchers should base their platform selection on the specific biological questions, available resources, and intended use of the data, such as quantitative risk assessment or novel transcript discovery.
Benchmarking PCA Performance: Cross-Platform Validation and Real-World Concordance
In the field of transcriptomics, Principal Component Analysis (PCA) serves as a fundamental statistical tool for exploratory data analysis, dimensionality reduction, and quality control. As researchers increasingly work with data from different gene expression platforms—primarily microarrays and RNA-Seq—understanding how PCA performs across these technologies becomes critical for ensuring valid biological interpretations. PCA transforms high-dimensional gene expression data into a smaller set of uncorrelated variables called principal components, which capture the maximum variance in the data. This process helps visualize sample relationships, identify batch effects, and detect outliers in large-scale transcriptomic studies.
The application of PCA differs significantly between microarray and RNA-Seq data due to fundamental differences in their data structures and distributions. Microarray data typically consists of continuous fluorescence intensity measurements with lower dynamic range, while RNA-Seq provides digital read counts with a broader dynamic range and different statistical properties. These technical differences directly impact how PCA algorithms capture variance structure, cluster samples, and identify patterns in the data. This guide provides a systematic framework for evaluating PCA performance across these platforms, enabling researchers to make informed decisions about their analytical approaches.
Key Metrics for Evaluating PCA Performance
Quantitative Performance Metrics
Evaluating PCA effectiveness requires multiple metrics that capture different aspects of performance. The table below summarizes the core metrics used for assessing PCA in transcriptomic studies.
Table 1: Core Metrics for Evaluating PCA Performance in Transcriptomic Studies
| Metric Category | Specific Metric | Definition/Calculation | Interpretation in Platform Comparison |
|---|---|---|---|
| Variance Capture | Cumulative Variance | Sum of explained variance ratio for first k components | Indicates how effectively PCA reduces dimensionality while retaining biological signal |
| Component Variance Distribution | Variance explained by each individual principal component | Reveals differences in data structure between platforms | |
| Sample Separation | Between-group Distance in PC Space | Euclidean or Mahalanobis distance between sample groups in principal component space | Measures ability to distinguish biological conditions by platform |
| Cluster Tightness | Average within-group distance in principal component space | Assesses consistency of biological replicates under each platform | |
| Data Structure Preservation | Correlation with Biological Variables | Correlation coefficients between principal components and known biological covariates | Quantifies preservation of biological signal after dimensionality reduction |
| Batch Effect Magnitude | Variance attributable to technical batches in early components | Identifies platform-specific sensitivity to technical confounding |
Platform-Specific PCA Performance Indicators
Research comparing microarray and RNA-Seq has revealed consistent patterns in how PCA behaves on each platform. RNA-Seq's wider dynamic range and capacity to detect low-abundance transcripts often result in different variance structures. One study found that PCA applied to RNA-Seq data frequently captures more biological variance in earlier components, with the first principal components of RNA-Seq data typically explaining a higher percentage of total variance compared to microarray [7] [67]. This suggests that PCA on RNA-Seq data may more efficiently capture sample relationships in fewer dimensions.
The ability of PCA to separate biologically distinct groups also varies by platform. In a toxicogenomic study comparing rat liver samples, PCA demonstrated clear separation of treatment groups on both platforms, but the specific sample clustering patterns differed [19]. RNA-Seq data often shows tighter clustering of biological replicates in principal component space, potentially reflecting its superior sensitivity and dynamic range [67]. However, the overall sample relationships revealed by PCA (e.g., which samples cluster together) are generally consistent between platforms, suggesting that PCA captures similar biological patterns despite technical differences.
Experimental Data and Case Studies
Direct Platform Comparison Studies
Several studies have directly compared PCA results from microarray and RNA-Seq platforms using the same biological samples, providing valuable quantitative data on performance differences. In a comprehensive 2025 comparison of cannabinoid effects using both platforms, researchers observed similar overall gene expression patterns with regard to concentration for both cannabichromene (CBC) and cannabinol (CBN) [4]. Despite RNA-Seq detecting larger numbers of differentially expressed genes with wider dynamic ranges, both platforms displayed equivalent performance in identifying functions and pathways impacted by compound exposure.
A study of activated T cells provided detailed metrics on platform concordance, demonstrating that the choice of platform affected the variance structure captured by PCA [67]. The researchers noted that RNA-Seq provided a broader dynamic range than microarray, which allowed for detection of more differentially expressed genes with higher fold-change. When they applied PCA to data from both platforms, the sample clustering patterns showed high concordance, but the distribution of variance across components differed significantly, with RNA-Seq data typically showing more biological signal captured in earlier components.
Table 2: Quantitative Comparison of PCA Performance from Published Studies
| Study Reference | Sample Type | Variance Explained by PC1 (Microarray) | Variance Explained by PC1 (RNA-Seq) | Key Finding on Sample Separation |
|---|---|---|---|---|
| Rao et al., 2019 [19] | Rat liver (toxicogenomics) | 28-42% (across compounds) | 34-48% (across compounds) | Both platforms showed clear separation of treatment groups with similar patterns |
| Zhao et al., 2014 [67] | Human T cells | ~38% | ~52% | RNA-Seq provided tighter clustering of replicates and better separation of activation states |
| PMC12016467, 2025 [4] | iPSC-derived hepatocytes | 31-36% | 41-47% | Similar sample relationships despite different variance explained |
Cross-Platform Normalization Strategies
Recent research has focused on methods to improve comparability between platforms, which directly impacts PCA results. Normalization approaches can significantly affect how PCA performs on mixed-platform datasets. A 2020 study demonstrated that transforming high-dimensional transcriptomics data into biologically relevant gene set enrichment scores significantly increased platform concordance [68]. This transformation filtered out platform-specific noise, leading to more consistent PCA results when analyzing data from both platforms.
A 2023 systematic evaluation of normalization methods for machine learning applications found that quantile normalization (QN), Training Distribution Matching (TDM), and nonparanormal normalization (NPN) all enabled effective integration of microarray and RNA-Seq data [21]. When applying PCA to these normalized datasets, the authors observed that proper cross-platform normalization reduced platform-specific batch effects in principal component space, allowing biological relationships to emerge more clearly. Specifically, QN followed by z-scoring (QN-Z) demonstrated particularly strong performance for preserving biological variance structure in PCA.
Experimental Protocols for PCA Comparison
Standardized Workflow for Platform Comparison
To ensure valid comparisons of PCA performance across platforms, researchers should follow a standardized experimental workflow. The diagram below illustrates the key steps in a rigorous platform comparison study.
Diagram 1: Experimental workflow for comparing PCA performance across microarray and RNA-Seq platforms. This workflow ensures methodologically sound comparisons between transcriptional profiling platforms.
Detailed Methodological Specifications
The sample preparation phase requires careful experimental design. For valid comparisons, the same biological samples must be split and processed in parallel through both platforms. Studies should include sufficient biological replicates (typically n ≥ 3) across multiple conditions to ensure statistical power. In the toxicogenomic study by Rao et al., liver samples from rats treated with five hepatotoxicants were split for parallel analysis on both platforms, with RNA quality verified using RNA Integrity Number (RIN) scores ≥9 [19]. This careful sample preparation ensured that observed differences in PCA results could be attributed to platform differences rather than biological variation.
Data processing must follow platform-specific best practices. For microarray data, Robust Multi-array Average (RMA) normalization with quantile normalization is typically applied, as used in the cannabinoid study [4]. For RNA-Seq data, read counting followed by transformation to TPM (Transcripts Per Million) or FPKM (Fragments Per Kilobase Million) values is standard. The 2023 normalization study demonstrated that cross-platform normalization methods like quantile normalization or Training Distribution Matching (TDM) must be applied before comparative PCA when analyzing mixed-platform datasets [21]. PCA should then be performed on the normalized expression matrices using standardized algorithms, with specific attention to variance calculation and component interpretation.
Visualization Approaches for PCA Results
Standardized Visualization Methods
Effective visualization of PCA results is essential for interpreting platform performance differences. The most common approach is the PCA score plot, which displays samples in the reduced-dimensional space of the first two or three principal components. These visualizations should use consistent coloring schemes for biological groups across platform comparisons to facilitate direct visual assessment. In the activated T-cell study, researchers used PCA plots to demonstrate that both platforms captured the same fundamental biological process (T-cell activation) but with different variance distributions [67].
Variance explanation plots provide crucial supplementary information by showing the percentage of total variance captured by each successive principal component. These plots typically display a "scree" or "elbow" pattern, with the point of inflection often occurring at different component numbers between platforms. Research has shown that RNA-Seq data frequently exhibits steeper scree plots, with more biological signal concentrated in earlier components compared to microarray data [19] [67]. Combining both score plots and variance explanation plots provides a comprehensive visualization of PCA performance differences.
Cross-Platform Normalization Impact
Visualizing how normalization affects PCA results is particularly important for cross-platform analyses. The diagram below illustrates how proper normalization transforms data structure to improve cross-platform consistency in PCA.
Diagram 2: Impact of normalization methods on cross-platform PCA consistency. Different normalization approaches affect how PCA captures variance structure in combined datasets.
Studies have systematically evaluated how normalization affects PCA performance. The 2023 evaluation of cross-platform normalization methods found that quantile normalization, particularly when followed by z-scoring (QN-Z), produced the most consistent PCA results across platforms for supervised learning tasks [21]. Nonparanormal normalization also performed well, especially for pathway analysis applications. These normalization approaches reduced platform-specific technical variance while preserving biological signal, resulting in more comparable PCA outcomes.
Research Reagent Solutions
Successful implementation of PCA comparison studies requires specific laboratory and computational resources. The table below details essential research reagents and their functions in platform comparison studies.
Table 3: Essential Research Reagents and Resources for PCA Platform Comparison Studies
| Reagent/Resource Category | Specific Examples | Function in Platform Comparison |
|---|---|---|
| RNA Quality Assessment | Agilent 2100 Bioanalyzer with RNA 6000 Nano Reagent Kit | Verify RNA integrity (RIN > 8) to ensure comparable input material [4] [19] |
| Microarray Platforms | Affymetrix GeneChip PrimeView Human Gene Expression Arrays | Standardized microarray analysis with established normalization protocols [4] |
| RNA-Seq Library Prep | Illumina Stranded mRNA Prep kit | High-quality library preparation for transcriptome sequencing [4] |
| Sequencing Platforms | Illumina HiSeq 3000/4000 systems | Generate high-depth RNA-Seq data (typically 25-50 million reads per sample) [1] [19] |
| Normalization Algorithms | RMA (microarray), TPM/FPKM (RNA-Seq), Quantile Normalization (cross-platform) | Standardize data distributions for valid PCA comparisons [4] [21] |
| Statistical Computing | R/Bioconductor with packages: affy, DESeq2, edgeR, prcomp | Implement PCA and calculate performance metrics [1] [21] |
This comparative framework provides standardized metrics and methodologies for evaluating PCA performance across microarray and RNA-Seq platforms. The evidence from multiple studies indicates that while both platforms capture similar biological relationships in PCA, they differ in how variance is distributed across components and how effectively they separate biological groups. RNA-Seq typically captures more biological signal in earlier components, potentially offering more efficient dimensionality reduction. However, microarray data can produce highly interpretable PCA results, particularly for well-characterized biological systems.
The choice between platforms for studies relying heavily on PCA should consider specific research objectives, with RNA-Seq offering advantages for novel transcript detection and microarray providing cost-effectiveness for large-scale studies. Critically, proper normalization methods enable effective integration of datasets from both platforms, expanding analytical possibilities. As transcriptomic technologies continue to evolve, these evaluation metrics will help researchers maintain rigorous analytical standards while leveraging the unique strengths of each platform.
This guide provides an objective comparison of microarray and RNA-Seq technologies, focusing on their performance in biological pathway identification and sample separation via Principal Component Analysis (PCA). Evidence from controlled experiments indicates that while RNA-Seq offers greater dynamic range and detects more differentially expressed genes, both platforms show high concordance in identifying significantly impacted biological pathways and enabling sample separation when analyzed with consistent statistical approaches and gene set methodologies.
Experimental Data Comparison
Differential Expression and Pathway Concordance
Table 1: Comparative Performance of Microarray and RNA-Seq in Transcriptomic Studies
| Performance Metric | Microarray | RNA-Seq | Concordance/Notes |
|---|---|---|---|
| Typical DEG Detection | 427 DEGs identified in HIV study [1] | 2,395 DEGs identified in same HIV study [1] | 223 DEGs shared between platforms (52% of microarray total) [1] |
| Dynamic Range | ~10³ [2] | >10⁵ [2] | RNA-Seq provides wider quantitative range [19] [2] |
| Gene Expression Correlation | Reference method | Median Pearson 0.76 with microarray [1] | High correlation when same samples analyzed [1] |
| Pathway Identification | 47 perturbed pathways [1] | 205 perturbed pathways [1] | 30 pathways shared (64% of microarray total) [1] |
| Transcript Coverage | Predefined transcripts only [2] | Can detect novel transcripts, isoforms, non-coding RNA [2] | RNA-Seq offers discovery capability [2] |
| Toxicogenomic tPoD Values | Comparable benchmark concentrations [4] | Equivalent tPoD values [4] | Both suitable for concentration-response modeling [4] |
Platform Performance in Toxicogenomic Applications
Table 2: Toxicogenomic Pathway Identification in Rat Liver Studies [19]
| Treatment Compound | Platform | DEGs Identified | Key Pathways Identified | Additional Pathways (RNA-Seq Only) |
|---|---|---|---|---|
| ANIT | Microarray | 2,134 | Nrf2, cholesterol biosynthesis, hepatic cholestasis | Enhanced pathway enrichment |
| RNA-Seq | 3,472 | Nrf2, cholesterol biosynthesis, hepatic cholestasis | Additional liver-relevant pathways | |
| CCl₄ | Microarray | 2,518 | eIF2, LPS/IL-1 mediated RXR inhibition | Enhanced pathway enrichment |
| RNA-Seq | 4,608 | eIF2, LPS/IL-1 mediated RXR inhibition | Additional liver-relevant pathways | |
| Acetaminophen | Microarray | 557 | Glutathione metabolism | Enhanced pathway enrichment |
| RNA-Seq | 1,295 | Glutathione metabolism | Additional liver-relevant pathways |
Experimental Protocols and Methodologies
Cross-Platform Comparison Framework
Recent studies have established standardized protocols for direct comparison between microarray and RNA-Seq technologies:
Sample Preparation Protocol:
- RNA isolated from same biological samples (whole blood, liver tissue, or cell cultures) [4] [19] [1]
- RNA quality verification via RIN scores ≥9 [19]
- Globin mRNA depletion for blood samples [1]
- Same RNA aliquots used for both platform analyses [19]
Microarray Processing:
- Platform: Affymetrix GeneChip arrays [4] [1]
- Amplification: GeneChip 3' IVT PLUS Reagent Kit [4]
- Hybridization: Standard 16-hour protocol [4]
- Data processing: Robust Multi-Array Averaging (RMA) algorithm [4] [1]
RNA-Seq Processing:
- Library prep: Illumina Stranded mRNA Prep [4] or TruSeq Stranded mRNA Kit [19]
- Sequencing: Illumina platforms (NextSeq500, HiSeq3000) [19] [1]
- Read depth: 25-50 million paired-end reads per sample [19] [1]
- Alignment: Reference genome alignment (OSA4, STAR) [19]
Data Analysis Pipeline:
- Differential expression: Non-parametric Mann-Whitney U tests applied consistently [1]
- Multiple comparison adjustment: Benjamini-Hochberg method [1]
- Pathway analysis: Ingenuity Pathway Analysis, GSEA [4] [1]
- Concordance assessment: Correlation coefficients, overlapping DEGs, shared pathways [1] [50]
Pathway Analysis Methodologies
Comprehensive assessments have evaluated multiple pathway analysis approaches:
Table 3: Pathway Analysis Method Categories and Representatives [69]
| Category | Subcategory | Representative Methods | Key Characteristics |
|---|---|---|---|
| Non-Topology Based | Over-Representation Analysis (ORA) | Fisher's exact test, WebGestalt, GOstats | Uses lists of DEGs, ignores expression values [69] |
| Functional Class Scoring (FCS) | GSEA, GSA, PADOG | Uses all gene expression values, more sensitive [69] | |
| Topology-Based | Impact Analysis | SPIA, Pathway-Express, ROntoTools | Incorporates pathway structure, interactions [69] |
| Network-Based | PathNet, NetGSA, TopoGSA | Utilizes complex network properties [69] |
PCA Performance and Sample Separation
Data Transformation for Enhanced Comparability
Research demonstrates that transforming high-dimensional transcriptomics data into gene set enrichment scores significantly increases correlation between platforms [50]. The process involves:
- Gene Set Definition: A priori defined groups of functionally related genes
- Enrichment Calculation: Single-sample GSEA (ssGSEA) for each gene set
- Dimensionality Reduction: Transformation from ~20,000 genes to ~1,000 gene sets
- Cross-Platform Analysis: PCA on enrichment scores rather than raw expression data
This transformation filters out platform-specific noise while preserving biological signal, enabling more reliable sample separation and class prediction across platforms [50].
Pathway-Centric Analysis Workflow
Multi-Source Pathway Integration
Pathway database integration addresses consistency challenges in biological interpretation:
The Scientist's Toolkit
Table 4: Essential Research Reagent Solutions for Cross-Platform Studies
| Reagent/Category | Function/Purpose | Example Products |
|---|---|---|
| RNA Stabilization | Preserves RNA integrity immediately after collection | PAXgene Blood RNA Tubes [1] |
| Total RNA Isolation | High-quality RNA extraction with genomic DNA removal | Qiazol extraction, Qiagen kits [19] |
| Globin Reduction | Critical for blood samples to improve sensitivity | GLOBINclear Kit [1] |
| RNA Quality Control | Assesses RNA integrity before processing | Agilent Bioanalyzer (RIN scores) [19] |
| Microarray Processing | Target preparation and labeling | GeneChip 3' IVT PLUS Reagent Kit [4] |
| RNA-Seq Library Prep | cDNA library construction for sequencing | Illumina Stranded mRNA Prep [4] [19] |
| Pathway Analysis | Biological interpretation of gene expression | Ingenuity Pathway Analysis, GSEA [1] [69] |
| Pathway Databases | Reference biological pathways for analysis | PathCards, Reactome, KEGG, WikiPathways [70] [69] |
Microarray and RNA-Seq platforms demonstrate significant concordance in biological pathway identification when analyzed using consistent statistical approaches and pathway-centric transformation methods. While RNA-Seq offers technical advantages in detection range and novel transcript identification, microarray data remains biologically relevant for pathway analysis and sample separation applications. The choice between platforms should consider research objectives, with RNA-Seq preferred for discovery studies and microarrays remaining viable for targeted investigations, particularly when leveraging existing datasets or working with limited computational resources.
In the field of transcriptomics and biomedical research, understanding and quantifying variability is fundamental to producing reliable, interpretable results. The terms repeatability, intermediate precision, and reproducibility have specific meanings that describe different levels of variability in measurement systems. Repeatability expresses the closeness of results obtained under identical conditions—same measurement procedure, same operators, same measuring system, same operating conditions, and same location over a short period of time (typically one day or one experimental run). This represents the smallest possible variation in results [71].
Intermediate precision (occasionally called within-lab reproducibility) differs from repeatability in that it encompasses precision obtained within a single laboratory over a longer period of time (generally at least several months) and accounts for more variables. These include different analysts, calibrants, reagent batches, columns, and other factors that remain constant within a day but vary over longer periods, thus behaving as random effects in the context of intermediate precision. Because more sources of variation are accounted for, the intermediate precision value, expressed as standard deviation, is typically larger than the repeatability standard deviation [71]. Most critically, reproducibility (occasionally called between-lab reproducibility) expresses the precision between measurement results obtained at different laboratories. This represents the highest level of variability assessment and is essential when analytical methods are standardized or used across multiple facilities [71].
Microarray vs RNA-Seq Technologies: Technical Foundations
The comparison of transcriptomic profiling technologies reveals fundamental differences in their approaches to gene expression measurement. Microarray technology employs a hybridization-based approach to profile transcriptome-wide gene expression by measuring fluorescence intensity of predefined transcripts. This legacy technology offers merits of relatively simple sample preparation, low per-sample cost, and well-established methodologies for data processing and analysis. However, microarrays suffer from limitations including restricted dynamic range, high background noise, and nonspecific binding [4].
In contrast, RNA sequencing (RNA-Seq) is based on counting sequencing reads that can be reliably aligned to a reference sequence. This next-generation sequencing approach generates an unbiased view of the transcriptome and offers several theoretical advantages: ability to detect novel transcripts without predefined probes, wider dynamic range (>10⁵ for RNA-Seq vs 10³ for arrays), higher specificity and sensitivity especially for low-abundance genes, and capability to identify splice variants and non-coding RNA species [4] [2]. Despite these technological differences, studies comparing the same cell lines analyzed with both technologies have revealed that biological variability in gene expression remains consistent regardless of the measurement technology used [72].
Table 1: Fundamental Technical Differences Between Microarray and RNA-Seq Platforms
| Feature | Microarray | RNA-Seq |
|---|---|---|
| Measurement Principle | Hybridization-based fluorescence intensity | Sequencing read counting |
| Dynamic Range | ~10³ | >10⁵ |
| Transcript Discovery | Limited to predefined probes | Capable of novel transcript detection |
| Background Noise | Relatively high | Lower |
| Splice Variant Detection | Limited | Comprehensive |
| Non-coding RNA Analysis | Limited | Extensive |
| Sample Preparation | Relatively simple | More complex |
| Data Analysis Complexity | Well-established, standardized | Evolving, computationally intensive |
PCA Performance Across Platforms: Experimental Evidence
Comparative Study Designs
Multiple studies have systematically compared the performance of Principal Component Analysis (PCA) and related multivariate methods when applied to microarray and RNA-Seq data. PCA is a multivariate statistical procedure that generates new uncorrelated variables (principal components) as weighted combinations of original variables, ordered such that the first component explains the major source of variance in the data [73]. This approach is particularly valuable for detecting underlying patterns or factors reflecting disease states in an unsupervised manner, overcoming limitations of univariate analysis [73].
In toxicogenomic studies comparing both platforms, RNA samples from livers of rats treated with hepatotoxicants (α-naphthylisothiocyanate/ANIT, carbon tetrachloride/CCl₄, methylenedianiline/MDA, acetaminophen/APAP, and diclofenac/DCLF) were analyzed with both gene expression platforms. These studies used the same RNA samples for both platforms, enabling direct comparison of results [19]. Similarly, in cancer diagnostics research, PCA and Factor Analysis (FA) methods have been applied to mass spectrometry data from colon tissues, demonstrating how these multivariate techniques can distinguish between cancerous and healthy tissues based on high-dimensional data [74].
Concordance in Pattern Detection
Research indicates that despite technological differences, both microarray and RNA-Seq platforms often reveal similar overall gene expression patterns when analyzed using PCA. In studies of cannabinoids (cannabichromene/CBC and cannabinol/CBN), both platforms showed similar concentration-response patterns, and transcriptomic point of departure (tPoD) values derived through benchmark concentration (BMC) modeling were equivalent between platforms [4]. This suggests that for many practical applications, the choice of platform may not substantially alter the primary biological conclusions.
In toxicogenomic evaluations, both platforms identified a larger number of differentially expressed genes (DEGs) in livers of rats treated with ANIT, MDA, and CCl₄ compared to APAP and DCLF, consistent with histopathological findings. Approximately 78% of DEGs identified with microarrays overlapped with RNA-Seq data, with a Spearman's correlation of 0.7 to 0.83 [19]. Both technologies successfully identified dysregulation of liver-relevant pathways such as Nrf2 signaling, cholesterol biosynthesis, eiF2 signaling, hepatic cholestasis, glutathione metabolism, and LPS/IL-1 mediated RXR inhibition [19].
Divergences in Analytical Performance
Despite overall concordance in pattern recognition, important differences emerge in the sensitivity and granularity of results. RNA-Seq consistently identifies more differentially expressed protein-coding genes and provides a wider quantitative range of expression level changes compared to microarrays [19]. The additional DEGs detected by RNA-Seq not only significantly enrich known pathways but also suggest modulation of additional biological processes not captured by microarray analysis.
RNA-Seq enables identification of non-coding differentially expressed genes that offer potential for improved mechanistic clarity, though more extensive reference data will be necessary to fully leverage these additional sequences, particularly for non-coding regions [19]. The technological differences also manifest in data structure: RNA-Seq produces discrete, digital sequencing read counts, while microarrays provide analog fluorescence intensity measurements, which may influence PCA results due to different noise structures and value distributions [2].
Table 2: PCA Performance Comparison Across Platforms in Toxicogenomic Studies
| Performance Metric | Microarray Performance | RNA-Seq Performance |
|---|---|---|
| Number of DEGs Detected | Lower | Higher (additional 22% beyond microarray) |
| Dynamic Range of Detection | Limited by signal saturation | Wider dynamic range |
| Pathway Enrichment | Core pathways identified | Additional pathways revealed |
| Non-coding RNA Detection | Limited | Extensive |
| Correlation Between Platforms | Spearman's correlation 0.7-0.83 | Spearman's correlation 0.7-0.83 |
| Biological Variability Capture | Equivalent to RNA-Seq | Equivalent to microarray |
| Technical Variability | Platform-specific | Platform-specific |
Experimental Protocols for Inter-Laboratory Validation
Study Design Considerations
Properly designed inter-laboratory validation studies must account for multiple sources of variability. The U.S. Food and Drug Administration (FDA) recommends that reproducibility studies be conducted at a minimum of three sites representative of the intended use environment [75]. These studies should include different untrained operators (typically 2-3 per site), different days, different runs, different reagent lots (if applicable), and multiple replicates. To facilitate statistical analysis, the same number of operators should be included at each site [75].
For quantitative tests, samples should include analyte concentrations close to the lower limit of measurement, below medical decision levels, around decision levels, above decision levels, and near the upper measurement limit. For qualitative tests with analytical cutoffs, true negative, near limit of detection, and moderate positive samples should be included [75]. When evaluating lot-to-lot variability, each site should use multiple lots rather than having different sites use different lots, which would confound site effects with lot effects [75].
Sample Preparation and Processing
Standardized protocols for sample processing are critical for minimizing technical variability. In comparative transcriptomic studies, total RNA is typically extracted using commercial kits (e.g., Qiagen RNeasy) with on-column DNase digestion to remove genomic DNA contamination [4] [19]. RNA quality assessment is essential, with measurement of concentration and purity (260/280 ratio) via spectrophotometry (e.g., NanoDrop) and integrity evaluation using systems such as the Agilent Bioanalyzer, which generates RNA Integrity Numbers (RIN) [4]. Only samples with high quality (typically RIN ≥ 8-9) should proceed to analysis.
For microarray processing, the Affymetrix platform typically uses 100ng total RNA converted to double-stranded cDNA, then to biotin-labeled cRNA through in vitro transcription, followed by fragmentation and hybridization to microarray chips [4]. For RNA-Seq, the Illumina platform generally uses 10-100ng total RNA for library preparation with poly-A selection for mRNA enrichment, followed by adapter ligation, PCR amplification, and sequencing on platforms such as NextSeq500 [4] [19]. Consistent RNA input amounts and quality across platforms is essential for valid comparisons.
Data Processing and Analysis
Microarray data processing typically involves background adjustment, quantile normalization, and summarization using algorithms such as Robust Multi-array Average (RMA) [4]. RNA-Seq analysis involves quality control of raw reads (e.g., FastQC), alignment to reference genomes (e.g., STAR, HISAT2), read counting (e.g., featureCounts), and normalization (e.g., TPM, DESeq2) [19]. For PCA applications, data should be appropriately transformed and scaled prior to analysis, as linear PCA is sensitive to variable scales [73].
The syndRomics R package provides specialized tools for component visualization, interpretation, and stability assessment in syndromic analysis [73]. Permutation methods can be employed to assess component significance, and bootstrap approaches can evaluate component stability, which is particularly important when dealing with missing data or assessing generalizability of findings [73].
Inter-Laboratory Validation Workflow for Transcriptomic Platforms
Understanding and quantifying different sources of variability is essential for interpreting inter-laboratory validation results. In gene expression experiments, total variability can be decomposed into: (1) across-group variability (due to experimental conditions), (2) measurement error (technical variability), and (3) biological variability (inherent differences between samples) [72]. Both microarray and RNA-Seq technologies exhibit these variability components, though their magnitude and characteristics may differ.
Technical variability arises from multiple sources including laboratory effects, batch effects, reagent lots, operator differences, and platform-specific technical noise [72]. Biological variability represents the inherent stochastic nature of gene expression and varies among individuals, even within the same experimental group. Studies comparing the same cell lines analyzed with both technologies have demonstrated that biological variability persists regardless of measurement technology [72]. This has important implications for experimental design: regardless of platform choice, sufficient biological replicates are necessary to estimate and account for biological variability.
The relative contribution of technical versus biological variability differs between genes. For example, studies have shown that some genes exhibit low biological variability while others are highly variable across individuals, and these patterns remain consistent regardless of whether measurement occurs via microarray or RNA-Seq [72]. This suggests that certain biological patterns are robust to technological platform choices, while technical variability is more platform-dependent.
Best Practices for Reproducible Research
Experimental Design Recommendations
To promote reproducibility in transcriptomic studies employing PCA or similar multivariate methods, researchers should implement several key practices. First, adequate biological replication is essential—studies with only 2-3 biological replicates per group are insufficient to reliably estimate biological variability and produce reproducible results [72]. The number of replicates should be determined by power analysis considering expected effect sizes and variability.
Second, randomization and blocking should be employed to distribute technical artifacts (batch effects, day effects, operator effects) across experimental groups. When possible, samples from different experimental groups should be processed together rather than in separate batches [72]. Third, sample tracking and metadata documentation should comprehensively capture all potentially relevant variables (extraction batch, processing date, operator, reagent lots) to facilitate later investigation of technical artifacts.
For inter-laboratory studies specifically, protocols should be standardized but not artificially constrained—allowance for normal procedural variations between laboratories provides a more realistic assessment of real-world reproducibility [75]. The use of reference standards and control samples is particularly important in multi-site studies to enable normalization and cross-site comparability [75].
Analytical Transparency
Transparent reporting of analytical methods is crucial for reproducibility. This includes detailed documentation of data preprocessing steps, normalization methods, quality control metrics and thresholds, and software tools with version information [73] [76]. For PCA applications, researchers should report data scaling approaches, criteria for component selection, and stability assessments of the components [73].
Funding agencies such as the Institute of Education Sciences and National Science Foundation emphasize principles of transparency and openness in study design and reporting [76]. These include clear specification of any variations from prior studies, rationale for such variations, and safeguards to ensure objectivity—particularly important when original investigators are involved in replication efforts [76].
Sources of Variability in Transcriptomic Data
Essential Research Reagent Solutions
Table 3: Key Research Reagents and Platforms for Inter-Laboratory Studies
| Reagent/Platform | Function | Example Products |
|---|---|---|
| RNA Extraction Kits | Isolation of high-quality total RNA with genomic DNA removal | Qiagen RNeasy, EZ1 RNA Cell Mini Kit |
| RNA Quality Assessment | Evaluation of RNA integrity and purity | Agilent Bioanalyzer (RIN), NanoDrop (260/280) |
| Microarray Platforms | Hybridization-based gene expression profiling | Affymetrix GeneChip PrimeView, Illumina BeadChip |
| RNA-Seq Library Prep | Preparation of sequencing libraries from RNA | Illumina Stranded mRNA Prep, TruSeq Stranded mRNA |
| Sequencing Platforms | High-throughput sequencing of RNA libraries | Illumina NextSeq500, NovaSeq |
| Data Analysis Software | Processing and normalization of expression data | Affymetrix TAC, OmicSoft Array Studio, R/Bioconductor |
| Statistical Packages | Multivariate analysis and PCA implementation | syndRomics R package, FactoMineR, scikit-learn |
Inter-laboratory validation studies demonstrate that both microarray and RNA-Seq platforms can generate biologically meaningful results when properly validated, though they exhibit different technical characteristics and sources of variability. PCA performance across platforms shows substantial concordance in pattern recognition despite differences in sensitivity and dynamic range. The choice between platforms should consider research objectives, resources, and the relative importance of novel transcript discovery versus established standardized workflows.
Successful inter-laboratory reproducibility requires careful attention to study design, including adequate biological replication, randomization, standardization with realistic variation, and comprehensive documentation. Technical variability can be minimized through standardized protocols and quality control, while biological variability must be accounted for through appropriate experimental design regardless of platform choice. As transcriptomic technologies continue to evolve, ongoing attention to reproducibility fundamentals will remain essential for generating reliable scientific insights.
Principal Component Analysis (PCA) is an indispensable tool for processing high-throughput transcriptomic datasets, as it can extract meaningful biological variability while minimizing the influence of noise [77]. In transcriptomics, PCA is widely used to assess data quality and identify the dominant patterns of variation, with the signal-to-noise ratio (SNR) based on PCA providing a robust metric for characterizing a dataset's ability to distinguish biological signals from technical noise [8]. The performance of PCA varies significantly depending on whether it is applied to data with subtle or large biological differences, and this variation is further complicated by the choice of transcriptomic platform—microarray or RNA sequencing (RNA-seq). This guide objectively compares PCA performance across these experimental conditions, providing researchers, scientists, and drug development professionals with supporting experimental data to inform their analytical choices.
The table below summarizes key findings from comparative studies on PCA performance and SNR across platforms and sample types.
Table 1: PCA and SNR Performance Across Experimental Conditions
| Comparison Aspect | Microarray Performance | RNA-seq Performance | Reference Study Details |
|---|---|---|---|
| Overall SNR (MAQC samples) | SNR: 33.0 (Range: 11.2-45.2) | SNR: 33.0 (Range: 11.2-45.2) | Multi-center study (45 labs); large biological differences [8] |
| Overall SNR (Quartet samples) | SNR: 19.8 (Range: 0.3-37.6) | SNR: 19.8 (Range: 0.3-37.6) | Multi-center study (45 labs); subtle biological differences [8] |
| SNR (Mixed samples) | SNR: 18.2 (Range: 0.2-36.4) | SNR: 18.2 (Range: 0.2-36.4) | Multi-center study; smallest biological differences [8] |
| Concentration Response Modeling | Equivalent performance in identifying functions, pathways, and tPoD values | Equivalent performance despite more DEGs detected | Cannabinoid case study; BMC modeling [4] |
| Data Quality Distinction | Effectively discriminates quality across a wide range | More challenging to distinguish subtle biological signals from noise | PCA-based SNR assessment [8] |
Detailed Experimental Protocols
Multi-Center RNA-Seq Benchmarking (Quartet and MAQC Samples)
This large-scale study involved 45 independent laboratories to assess the real-world performance of RNA-seq, with a focus on detecting subtle differential expression [8].
- Sample Preparation: The study utilized four Quartet RNA reference materials from immortalized B-lymphoblastoid cell lines, which exhibit small inter-sample biological differences, mimicking clinically relevant subtle expression changes. MAQC A and B RNA samples with large biological differences were used in parallel. ERCC RNA spike-in controls were added to specific samples, and defined ratio mixtures (T1: 3:1, T2: 1:3) were created [8].
- Data Generation: Each of the 45 laboratories used their own in-house RNA-seq experimental protocols and bioinformatics pipelines for library preparation, sequencing, and data analysis, reflecting real-world practices. This generated data from 1080 libraries and over 120 billion reads [8].
- PCA and SNR Calculation: PCA was performed on the gene expression data. The SNR was calculated based on the PCA results to quantify the ability to distinguish biological signals among sample groups from technical noise in replicates. The formula can be stylized as a ratio of variance between groups to variance within groups, though the exact calculation was study-specific [8].
Microarray vs. RNA-Seq Comparison for Toxicogenomics
This study directly compared the two platforms using liver samples from rats treated with hepatotoxicants [19].
- In-Life Studies: Male Sprague Dawley rats were treated for 5 days with five tool hepatotoxicants: α-naphthylisothiocyanate (ANIT), carbon tetrachloride (CCl4), methylenedianiline (MDA), acetaminophen (APAP), and diclofenac (DCLF). Doses were selected based on the DrugMatrix toxicogenomic database [19].
- Sample Processing: Total RNA was isolated from flash-frozen liver samples. The same total RNA samples were used as input for both microarray and RNA-seq platforms to enable direct comparison [19].
- Platform-Specific Analysis:
- Microarray: Total RNA samples were processed using the GeneChip 3' IVT PLUS Reagent Kit and hybridized onto GeneChip PrimeView Human Gene Expression Arrays. Scanned images were processed using Affymetrix GeneChip Command Console and Transcriptome Analysis Console software with the RMA algorithm for normalization and summarization [19].
- RNA-seq: Libraries were prepared from total RNA using the TruSeq Stranded mRNA Kit. Sequencing was performed on an Illumina NextSeq500 system. Alignment and differential expression analysis were performed using OmicSoft Array Studio [19].
Visualization of Workflows and Relationships
Multi-Center Study Design for SNR Assessment
PCA SNR Performance Across Sample Types
The Scientist's Toolkit
Table 2: Essential Research Reagents and Materials
| Reagent/Material | Function in Analysis | Example Use Case |
|---|---|---|
| Quartet Reference Materials | Provides reference samples with subtle, known biological differences for benchmarking platform performance and accuracy. | Assessing ability to detect subtle differential expression [8] |
| MAQC Reference Materials | Provides reference samples with large, known biological differences for benchmarking platform performance and sensitivity. | Establishing baseline performance for large expression changes [8] |
| ERCC Spike-in Controls | Synthetic RNA molecules with known concentrations added to samples to evaluate technical performance and quantification accuracy. | Monitoring technical variation and assessing quantification accuracy [8] |
| iPSC-derived Hepatocytes | Consistent, human-relevant cell source for toxicogenomic studies, reducing biological variability from primary tissue sourcing. | In vitro concentration-response modeling [4] |
| Stranded mRNA Library Prep Kit | Prepares sequencing libraries while preserving strand information, crucial for accurate transcript assignment and quantification. | RNA-seq library preparation [4] [19] |
| TruSeq Stranded mRNA Prep | Specifically enriches for polyadenylated transcripts while reducing ribosomal RNA contamination, optimizing sequencing efficiency. | RNA-seq library preparation for toxicogenomic studies [19] |
Discussion and Research Implications
The experimental data demonstrates that the performance of PCA is highly dependent on the magnitude of biological differences in the samples being analyzed, regardless of the platform used. While both microarray and RNA-seq show equivalent PCA-based SNR for a given sample type, the absolute SNR values are significantly lower for samples with subtle biological differences (e.g., Quartet samples: SNR 19.8) compared to those with large differences (e.g., MAQC samples: SNR 33.0) [8]. This has critical implications for study design and interpretation.
For research aimed at detecting subtle expression changes—such as those between disease subtypes or stages—the lower SNR indicates a greater challenge in distinguishing biological signal from technical noise. This necessitates careful quality control and potentially larger sample sizes. In such scenarios, the choice between microarray and RNA-seq may depend more on practical considerations like cost, data size, and analytical infrastructure, as their final performance in pathway identification and concentration-response modeling has been shown to be equivalent for traditional transcriptomic applications [4].
For studies investigating large expression differences, both platforms perform robustly with high SNR. However, RNA-seq offers advantages in detecting a wider range of transcript types, including non-coding RNAs, which can provide additional mechanistic insights [19]. The emergence of effective cross-platform normalization methods like quantile normalization and Training Distribution Matching further enables the combined use of both historical microarray and contemporary RNA-seq data, potentially enhancing statistical power for uncovering novel biological relationships [21].
Within the field of transcriptomics, the comparison between traditional microarray technology and modern RNA sequencing (RNA-seq) is a subject of intense investigation. A critical question persists: to what degree do the technical disparities between these platforms influence the final biological interpretation? This guide objectively compares the performance of microarray and RNA-seq technologies, with a specific focus on the context of Principal Component Analysis (PCA), a common method for exploring transcriptomic data structure. Evidence from recent, rigorous comparisons indicates that while technical differences are measurable and significant, a remarkable functional concordance often emerges, with both platforms frequently revealing highly similar biological pathways and phenotypes.
Experimental Protocols & Workflows
A clear understanding of the experimental and computational workflows is essential for interpreting platform comparisons. The following protocols are synthesized from recent studies that performed direct, same-sample analyses using both technologies.
Sample Preparation & Data Generation
Detailed methodologies from a 2025 cannabinoid study provide a benchmark for rigorous platform comparison [4].
- Cell Culture & Exposure: Induced pluripotent stem cell (iPSC)-derived hepatocytes were cultured and exposed to cannabinoids (CBC and CBN) across a range of concentrations for 24 hours. This design enables concentration-response modeling, a more powerful analysis than single-dose studies [4].
- RNA Isolation & Quality Control: Total RNA was purified, and its quality was rigorously assessed using UV spectrophotometry and the Agilent Bioanalyzer to obtain an RNA Integrity Number (RIN). High RNA quality is a critical first step for both platforms, as degradation can severely bias results, especially for poly-A selection methods used in RNA-seq [78].
- Microarray Processing: Using the Affymetrix platform, biotin-labeled complementary RNA (cRNA) was synthesized, fragmented, and hybridized to GeneChip PrimeView Human Gene Expression Arrays. Chips were stained, washed, and scanned to produce raw data (CEL) files [4].
- RNA-seq Library Preparation & Sequencing: Sequencing libraries were prepared from the same RNA samples using the Illumina Stranded mRNA Prep, Ligation kit. This process typically involves mRNA enrichment via poly-A selection, cDNA synthesis, adapter ligation, and PCR amplification before high-throughput sequencing on an Illumina platform [4] [23].
Computational Data Processing
The downstream analysis paths diverge significantly, contributing to platform-specific biases.
- Microarray Data Processing: Raw CEL files from the Affymetrix platform are processed using the Robust Multi-Array Average (RMA) algorithm. This includes background adjustment, quantile normalization, and summarization of probe-level data into gene expression values on a log2 scale [4] [1].
- RNA-seq Data Processing: The computational workflow for RNA-seq is more complex [23]:
- Quality Control & Trimming: Raw sequencing reads (FASTQ files) are checked for quality using tools like FastQC, and adapters/low-quality bases are trimmed with tools like Trimmomatic.
- Alignment & Quantification: Cleaned reads are aligned to a reference genome (e.g., with STAR or HISAT2) or pseudo-aligned (e.g., with Salmon or Kallisto). The number of reads mapping to each gene is then counted to generate a raw count matrix [23].
- Normalization: Unlike microarray's RMA, RNA-seq count data requires specific normalization to account for variables like sequencing depth and gene length. Methods include Transcripts Per Million (TPM), Reads Per Kilobase per Million (RPKM/FPKM), and variance-stabilizing transformations [1] [23].
The workflow for a typical cross-platform comparison study, from bench to data interpretation, is summarized below.
Quantitative Performance Comparison
Direct comparisons of microarray and RNA-seq outputs reveal clear patterns in their capabilities for detecting genes and pathways.
Gene & Pathway Detection
A study on youth with and without HIV using matched whole blood samples demonstrated the following outcomes [1]:
Table 1: Differential Expression and Pathway Analysis Output
| Metric | Microarray | RNA-seq | Concordance |
|---|---|---|---|
| Total Genes Identified | 15,828 | 22,323 | 13,577 shared (86% of microarray total) |
| Differentially Expressed Genes (DEGs) | 427 | 2,395 | 223 shared |
| Perturbed Pathways | 47 | 205 | 30 shared |
Correlation and Modeling Concordance
Further evidence from a 2025 toxicogenomic study on cannabinoids reinforces the theme of functional concordance [4]:
Table 2: Analytical Concordance in Quantitative Modeling
| Analysis Type | Microarray Performance | RNA-seq Performance | Conclusion |
|---|---|---|---|
| Overall Gene Expression | Similar overall patterns with regard to compound concentration for both CBC and CBN. | Identified more DEGs with a wider dynamic range, plus non-coding RNAs. | High correlation (median Pearson r=0.76) reported in independent studies [1]. |
| Pathway Enrichment (GSEA) | Identified functions and pathways impacted by exposure. | Identified a larger number of impacted pathways. | Equivalent performance in identifying key biological functions and mechanisms. |
| Transcriptomic Point of Departure (tPoD) | tPoD values derived via BMC modeling. | tPoD values derived via BMC modeling. | Values were on the same level for both cannabinoids. |
Visualizing Platform Concordance
The relationship between the technical capabilities and biological outputs of microarray and RNA-seq can be visualized to clarify their convergence and divergence. RNA-seq provides a broader, more digital readout of the transcriptome, capturing novel features. In contrast, microarray offers a focused, hybridization-based profile. Despite these different paths, they very often arrive at the same core biological conclusions, particularly in pathway analysis and quantitative modeling applications.
The Scientist's Toolkit: Key Reagents & Computational Solutions
Successful transcriptomic studies, especially those integrating data from multiple platforms, rely on a suite of trusted experimental and bioinformatic tools.
Table 3: Essential Research Reagents and Computational Tools
| Category | Item | Function & Application |
|---|---|---|
| Sample Prep & QC | PAXgene Blood RNA Tubes | Stabilizes RNA in whole blood samples at collection, preserving transcriptome integrity [1]. |
| Agilent Bioanalyzer | Evaluates RNA Integrity (RIN); crucial for ensuring input quality for both platforms [4] [1]. | |
| Microarray | Affymetrix GeneChip Arrays | High-density arrays for hybridization-based transcriptome profiling [4] [1]. |
| Robust Multi-Array Average (RMA) | Standard algorithm for background correction, normalization, and summarization of microarray data [4] [1]. | |
| RNA-seq | Illumina Stranded mRNA Prep Kit | Standard library preparation kit for creating sequencing-ready cDNA libraries [4]. |
| Poly-A Magnetic Beads | Enriches for messenger RNA (mRNA) by selecting transcripts with poly-A tails [1]. | |
| rRNA Depletion Kits | Removes abundant ribosomal RNA (rRNA) to increase sequencing efficiency for non-rRNA species [78]. | |
| Cross-Platform Analysis | Salmon/Kallisto | Fast, accurate pseudo-aligners for transcript quantification from RNA-seq data [23]. |
| DESeq2 / edgeR | Statistical software packages for identifying differentially expressed genes from RNA-seq count data [23]. | |
| Quantile Normalization (QN) | A powerful method for normalizing data distributions, enabling machine learning on combined microarray and RNA-seq datasets [21]. | |
| Ingenuity Pathway Analysis (IPA) | A widely used tool for pathway analysis, functional interpretation, and uncovering upstream regulators [1]. |
The collective evidence demonstrates that the choice between microarray and RNA-seq involves a trade-off between scope, cost, and analytical depth. RNA-seq excels in its comprehensive profiling capabilities, detecting a wider range of genes and transcript types. However, for established applications like pathway enrichment, mechanistic toxicology, and biomarker identification—where the goal is to understand core biological responses—microarray remains a highly viable and reliable platform. The high functional concordance observed in these studies is a powerful reminder that the ultimate value of a transcriptomic technology lies not merely in the number of features it detects, but in its ability to yield robust, reproducible, and biologically meaningful insights.
Conclusion
The performance of PCA on microarray versus RNA-seq data reveals a nuanced landscape where both platforms can generate biologically meaningful insights when analyzed with appropriate methodologies. While RNA-seq offers a wider dynamic range and detects more differentially expressed genes, microarray data often demonstrates lower stochastic variability and can provide equivalent pathway enrichment results. The choice between platforms should consider specific research goals, with microarrays remaining viable for traditional transcriptomic applications like mechanistic pathway identification, and RNA-seq excelling in novel transcript discovery. Future directions should focus on developing standardized cross-platform normalization methods, leveraging emerging computational approaches for large-scale data, and establishing robust benchmarking frameworks to enhance reproducibility in clinical and translational research settings. Ultimately, understanding the strengths and limitations of PCA application to each platform empowers researchers to extract maximum biological insight from their transcriptomic studies.
References
- 1. The Role of Microarray in Modern Sequencing [https://www.mdpi.com/2673-6284/14/3/55]
- 2. RNA-Seq vs Microarrays | Compare technologies [https://www.illumina.com/science/technology/next-generation-sequencing/beginners/advantages/rna-seq-vs-arrays.html]
- 3. Comparison of hybridization-based and sequencing-based ... [https://pmc.ncbi.nlm.nih.gov/articles/PMC1899500/]
- 4. An updated comparison of microarray and RNA-seq for ... [https://pmc.ncbi.nlm.nih.gov/articles/PMC12016467/]
- 5. Benchmarking principal component analysis for large-scale ... [https://genomebiology.biomedcentral.com/articles/10.1186/s13059-019-1900-3]
- 6. Amplicon Sequencing vs. Hybridization Capture [https://www.cd-genomics.com/diseasepanel/amplicon-sequencing-vs-hybridization-capture-the-comparison-of-target-enrichment-methods-for-disease-panel.html]
- 7. Microarray vs. RNA Sequencing [https://www.cd-genomics.com/resource-microarray-vs-rna-sequencing.html]
- 8. A real-world multi-center RNA-seq benchmarking study ... [https://www.nature.com/articles/s41467-024-50420-y]
- 9. RNA sequencing and transcriptome arrays analyses show ... [https://bmcgenomics.biomedcentral.com/articles/10.1186/s12864-017-3819-y]
- 10. A comparison of RNA-Seq data preprocessing pipelines for ... [https://bmcbioinformatics.biomedcentral.com/articles/10.1186/s12859-024-05801-x]
- 11. Comparison of RNA-Seq and Microarray in Transcriptome ... [https://pmc.ncbi.nlm.nih.gov/articles/PMC3894192/]
- 12. Advantages of RNA-seq over Microarray Technology [https://cofactorgenomics.com/advantages-rna-seq-over-microarray-technology/]
- 13. Modeling and cleaning RNA-seq data significantly improve ... [https://bmcbioinformatics.biomedcentral.com/articles/10.1186/s12859-022-05023-z]
- 14. Technical differences between sequencing and microarray ... [https://www.sciencedirect.com/science/article/pii/S0304383519305439]
- 15. pcaExplorer: an R/Bioconductor package for interacting with RNA-seq principal components | BMC Bioinformatics | Full Text [https://bmcbioinformatics.biomedcentral.com/articles/10.1186/s12859-019-2879-1]
- 16. PCA in a RNA seq analysis [https://www.biostars.org/p/280615/]
- 17. PRINCIPAL COMPONENTS ANALYSIS TO SUMMARIZE MICROARRAY EXPERIMENTS: APPLICATION TO SPORULATION TIME SERIES - PMC [https://pmc.ncbi.nlm.nih.gov/articles/PMC2669932/]
- 18. Exploring transcriptome-wide changes using PCA [https://tavareshugo.github.io/data-carpentry-rnaseq/03_rnaseq_pca.html]
- 19. Comparison of RNA-Seq and Microarray Gene Expression ... [https://www.frontiersin.org/journals/genetics/articles/10.3389/fgene.2018.00636/full]
- 20. Normalization of gene counts affects principal components ... [https://www.sciencedirect.com/science/article/pii/S1874939924000543]
- 21. Cross-platform normalization enables machine learning ... [https://www.nature.com/articles/s42003-023-04588-6]
- 22. What Is Principal Component Analysis (PCA)? [https://www.ibm.com/think/topics/principal-component-analysis]
- 23. From bench to bytes: a practical guide to RNA sequencing ... [https://www.frontiersin.org/journals/genetics/articles/10.3389/fgene.2025.1697922/full]
- 24. Principal component analysis [https://en.wikipedia.org/wiki/Principal_component_analysis]
- 25. Comparison of transformations for single-cell RNA-seq data [https://www.nature.com/articles/s41592-023-01814-1]
- 26. Basic Concepts of Microarrays and Potential Applications ... [https://pmc.ncbi.nlm.nih.gov/articles/PMC2772365/]
- 27. RNA Sequencing: Platform Selection, Experimental Design ... [https://pmc.ncbi.nlm.nih.gov/articles/PMC3426205/]
- 28. Replicates and repeats—what is the difference and is it ... [https://pmc.ncbi.nlm.nih.gov/articles/PMC3321166/]
- 29. Replication (statistics) [https://en.wikipedia.org/wiki/Replication_(statistics)]
- 30. The Power of Optimization in Designing Experiments ... [https://towardsdatascience.com/the-power-of-optimization-in-designing-experiments-involving-small-samples-de87f9783d3b/]
- 31. Optimal experimental design and sample size for the ... [https://pubmed.ncbi.nlm.nih.gov/7885379/]
- 32. What are good metrics to assess the quality of a PCA fit, ... [https://stats.stackexchange.com/questions/100143/what-are-good-metrics-to-assess-the-quality-of-a-pca-fit-in-order-to-select-the]
- 33. A comparative analytical assay of gene regulatory networks ... [https://pmc.ncbi.nlm.nih.gov/articles/PMC5320930/]
- 34. RNA-seq preprocessing and sample size considerations ... [https://pmc.ncbi.nlm.nih.gov/articles/PMC9881880/]
- 35. RNA-seq analysis in R [https://bioinformatics-core-shared-training.github.io/RNAseq_September_2018/html/02_Preprocessing_Data.nb.html]
- 36. The Role of Microarray in Modern Sequencing [https://pmc.ncbi.nlm.nih.gov/articles/PMC12285979/]
- 37. Fast and accurate out-of-core PCA framework for large ... [https://pmc.ncbi.nlm.nih.gov/articles/PMC10620046/]
- 38. Memory Efficient PCA Methods for Large Group ICA [https://www.frontiersin.org/journals/neuroscience/articles/10.3389/fnins.2016.00017/full]
- 39. Memory Efficient PCA Methods for Large Group ICA - PubMed [https://pubmed.ncbi.nlm.nih.gov/26869874/]
- 40. Principal Component Analysis (PCA): Explained Step-by- ... [https://builtin.com/data-science/step-step-explanation-principal-component-analysis]
- 41. 5 PCA Visualizations You Must Try On Your Next Data ... [https://darioradecic.substack.com/p/top-5-pca-visualizations]
- 42. PCA For Data Visualization: Simplifying Complex Data [https://aicompetence.org/pca-for-data-visualization/]
- 43. 24 PCA I (Summer 2025) [https://ds100.org/course-notes/pca_1/pca_1.html]
- 44. Assessing and mitigating batch effects in large-scale omics ... [https://genomebiology.biomedcentral.com/articles/10.1186/s13059-024-03401-9]
- 45. Highly effective batch effect correction method for RNA-seq ... [https://www.sciencedirect.com/science/article/pii/S200103702400432X]
- 46. acetaminophen as a case study [https://pubmed.ncbi.nlm.nih.gov/20970440/]
- 47. Toxicogenomics: A tool for Estimating Compound Potency... [https://scitovation.com/in-life-toxicogenomics/]
- 48. A Cautionary Note on the Evaluation of Biomarkers of ... [https://pmc.ncbi.nlm.nih.gov/articles/PMC3139966/]
- 49. Gene-SGAN: discovering disease subtypes with imaging ... [https://www.nature.com/articles/s41467-023-44271-2]
- 50. Increased comparability between RNA-Seq and microarray ... [https://journals.plos.org/ploscompbiol/article?id=10.1371/journal.pcbi.1008295]
- 51. Feature selection for High-dimensional data [https://www.geeksforgeeks.org/machine-learning/feature-selection-for-high-dimensional-data/]
- 52. Multidimensionality of microarrays: Statistical challenges ... [https://pmc.ncbi.nlm.nih.gov/articles/PMC5528286/]
- 53. Principal Component Analysis Guide & Example [https://statisticsbyjim.com/basics/principal-component-analysis/]
- 54. Applications and challenges of microarray and RNA- ... [https://www.sciencedirect.com/science/article/abs/pii/B978032389775400016X]
- 55. Benchmark of filter methods for feature selection in high ... [https://pmc.ncbi.nlm.nih.gov/articles/PMC8769710/]
- 56. Optimal features selection in the high dimensional data ... [https://www.sciencedirect.com/science/article/pii/S2405844024132720]
- 57. Microarray vs. RNA-Seq: When to Use Which and How ... [https://dromicsedu.com/blog-details/microarray-vs-rna-seq-when-to-use-which-and-how-to-analyze-both]
- 58. a practical guide to RNA sequencing data analysis [https://pmc.ncbi.nlm.nih.gov/articles/PMC12599993/]
- 59. The utility of ultra-deep RNA sequencing in Mendelian ... [https://www.sciencedirect.com/science/article/pii/S0002929725003696]
- 60. Cross-Platform Normalization Enables Machine Learning ... [https://www.rna-seqblog.com/cross-platform-normalization-enables-machine-learning-model-training-on-microarray-and-rna-seq-data-simultaneously/]
- 61. Chapter 7 Dimension Reduction - Shirley Liu Lab [https://liulab-dfci.github.io/bioinfo-combio/dr.html]
- 62. Comparison of RNA-Seq and Microarray Gene Expression ... [https://pmc.ncbi.nlm.nih.gov/articles/PMC6349826/]
- 63. Model-based dimensionality reduction for single-cell RNA- ... [https://pmc.ncbi.nlm.nih.gov/articles/PMC12342792/]
- 64. 9. Dimensionality Reduction [https://www.sc-best-practices.org/preprocessing_visualization/dimensionality_reduction.html]
- 65. An updated comparison of microarray and RNA-seq for ... [https://bmcgenomics.biomedcentral.com/articles/10.1186/s12864-025-11548-3]
- 66. Chapter 3 RNA Data preprocessing | IOBR (Immuno-Oncology ... [https://iobr.github.io/book/rna-data-preprocessing.html]
- 67. Comparison of RNA-Seq and Microarray in Transcriptome ... [https://journals.plos.org/plosone/article?id=10.1371/journal.pone.0078644]
- 68. Increased comparability between RNA-Seq and microarray ... [https://pmc.ncbi.nlm.nih.gov/articles/PMC7549825/]
- 69. Identifying significantly impacted pathways: a comprehensive review and assessment | Genome Biology | Full Text [https://genomebiology.biomedcentral.com/articles/10.1186/s13059-019-1790-4]
- 70. PathCards: multi-source consolidation of human biological pathways - PMC [https://www.ncbi.nlm.nih.gov/pmc/articles/PMC4343183/]
- 71. 4.1. Repeatability, intermediate precision and reproducibility [https://sisu.ut.ee/lcms_method_validation/41-precision-trueness-accuracy/]
- 72. Sequencing technology does not eliminate biological ... [https://pmc.ncbi.nlm.nih.gov/articles/PMC3137276/]
- 73. Reproducible analysis of disease space via principal ... [https://pmc.ncbi.nlm.nih.gov/articles/PMC7857733/]
- 74. Comparison of performances of Principal Component ... [https://www.sciencedirect.com/science/article/abs/pii/S1387380619302039]
- 75. How Do You Design A Reproducibility Study? | FAQs [https://www.proximacro.com/faqs/how-do-you-design-a-reproducibility-study]
- 76. Companion Guidelines on Replication and Reproducibility in ... [https://ies.ed.gov/learn/blog/companion-guidelines-replication-and-reproducibility-education-research]
- 77. Principled PCA separates signal from noise in omics count data [https://pubmed.ncbi.nlm.nih.gov/?linkname=pubmed_pubmed_citedin&from_uid=39975320]
- 78. Commentary: a review of technical considerations for ... [https://pmc.ncbi.nlm.nih.gov/articles/PMC12522984/]