qPCR vs RNA-Seq: A Researcher's Guide to Gene Expression Analysis
Choosing between quantitative PCR (qPCR) and RNA Sequencing (RNA-Seq) is a critical decision in gene expression studies, impacting cost, workflow, and data interpretation.
qPCR vs RNA-Seq: A Researcher's Guide to Gene Expression Analysis
Abstract
Choosing between quantitative PCR (qPCR) and RNA Sequencing (RNA-Seq) is a critical decision in gene expression studies, impacting cost, workflow, and data interpretation. This article provides a comprehensive comparison for researchers and drug development professionals, covering the foundational principles of both technologies. It delves into their specific methodological applications, from targeted validation to whole-transcriptome discovery, and offers practical troubleshooting and optimization strategies. Furthermore, it explores how these methods are synergistically used for validation, supported by studies demonstrating high concordance in differential expression analysis. This guide empowers scientists to select the optimal tool and implement robust, reliable gene expression analysis pipelines.
Core Principles: Understanding qPCR and RNA-Seq Fundamentals
Gene Expression Analysis
Gene expression analysis is the process of measuring the activity (expression levels) of genes in biological samples. It enables researchers to understand which genes are turned on or off in various cell types, under different conditions, or in response to specific treatments. This field is fundamental to advancing our knowledge in areas like disease mechanisms, drug development, and personalized medicine [1].
What is Gene Expression Analysis?
At its core, gene expression analysis quantifies the presence of messenger RNA (mRNA) transcripts, which are the intermediate templates between a gene's DNA code and the functional protein it produces. By measuring mRNA levels, scientists can infer how actively a gene is being transcribed. The table below outlines the key aspects of this process.
Table: Fundamental Concepts in Gene Expression Analysis
| Concept | Description |
|---|---|
| Objective | To quantify the abundance of RNA transcripts in a biological sample, providing a snapshot of cellular activity at the molecular level. |
| Molecular Target | Typically messenger RNA (mRNA), which carries the genetic code for protein synthesis. |
| Key Applications | Identifying biomarkers for disease, understanding drug mechanisms, uncovering disease pathways, and classifying tumors. |
| Common Techniques | Quantitative PCR (qPCR), Microarrays, and RNA Sequencing (RNA-Seq). |
qPCR vs. RNA-Seq: A Technical Comparison
Two of the most prominent technologies for gene expression analysis are quantitative PCR (qPCR) and RNA Sequencing (RNA-Seq). They serve complementary roles in the modern laboratory.
Table: Comparison of qPCR and RNA-Seq Technologies
| Feature | qPCR | RNA-Seq |
|---|---|---|
| Throughput | Low to medium; ideal for a focused set of genes (e.g., < 50) [2]. | High; can profile the entire transcriptome simultaneously [3]. |
| Discovery Power | Low; can only detect known, pre-defined sequences [3]. | High; can identify novel genes, splice variants, and fusion transcripts without prior knowledge [1] [3]. |
| Dynamic Range | Very wide [2]. | Very wide, capable of quantifying genes across a vast range of expression levels without background noise [3]. |
| Sensitivity | High; capable of detecting rare transcripts [4]. | High; can detect subtle expression changes (down to 10%) and low-abundance transcripts [3]. |
| Data Output | Cycle threshold (Ct) values, which are relative measurements. | Absolute read counts that can be normalized to TPM (Transcripts Per Million) or FPKM (Fragments Per Kilobase Million) [5]. |
| Workflow & Cost | Well-established, fast, and lower cost for a small number of targets [6] [2]. | Complex, requires specialized bioinformatics expertise, and is more expensive per sample [1] [2]. |
| Primary Use Case | Targeted validation, hypothesis testing, and clinical diagnostics [6] [4]. | Discovery-driven research, whole-transcriptome analysis, and novel biomarker identification [6] [3]. |
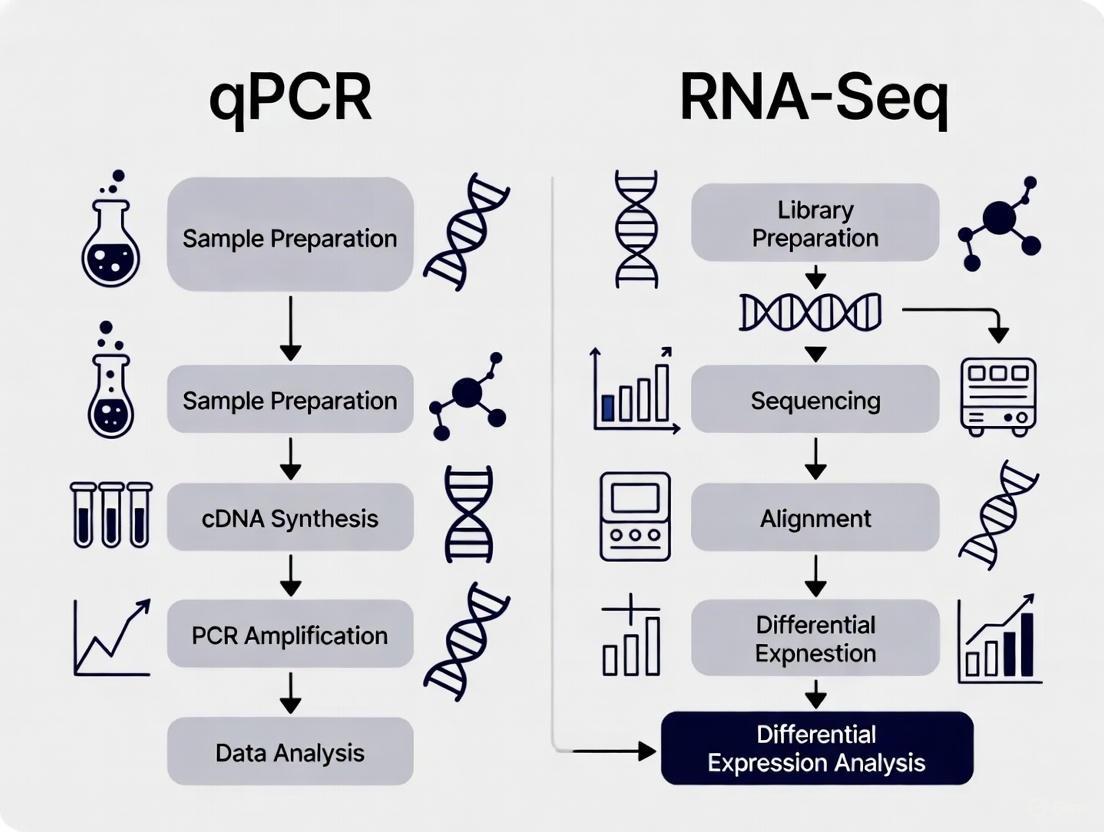
The following diagram illustrates the typical workflows for both qPCR and RNA-Seq, highlighting key steps where their processes differ.
Experimental Data and Concordance
Multiple independent studies have systematically compared the results from qPCR and RNA-Seq to assess their reliability and concordance.
A comprehensive benchmarking study using whole-transcriptome RT-qPCR data as a reference found that all major RNA-Seq analysis workflows showed high correlation with qPCR data for both gene expression levels and fold changes. When comparing fold changes between samples, approximately 85% of genes showed consistent results between RNA-Seq and qPCR [5].
Table: Concordance Between RNA-Seq and qPCR from Benchmarking Studies
| Metric | Findings | Experimental Context |
|---|---|---|
| Fold Change Correlation | High correlation observed (R² > 0.93) across multiple RNA-Seq workflows [5]. | Comparison of two reference RNA samples (MAQCA and MAQCB). |
| Non-Concordant Genes | ~15% of genes showed discrepancies in differential expression calls [5]. | Analysis of over 18,000 protein-coding genes. |
| Nature of Discrepancies | Of the non-concordant genes, ~93% had a fold change below 2, and ~80% below 1.5. The most severely discordant genes (∼1.8%) were typically lower expressed and shorter [7]. | Systematic comparison of five RNA-seq analysis pipelines to qPCR. |
| HLA Gene Expression | A moderate correlation (0.2 ≤ rho ≤ 0.53) was observed between qPCR and RNA-seq for polymorphic HLA class I genes [8]. | Analysis of HLA-A, -B, and -C expression in human PBMCs. |
Detailed Experimental Protocol: Benchmarking RNA-Seq
The following methodology is adapted from a large-scale benchmarking study [5]:
- Sample Preparation: The well-established MAQCA (Universal Human Reference RNA) and MAQCB (Human Brain Reference RNA) samples were used as benchmarks.
- RNA-Seq Analysis: RNA-seq reads were processed using five distinct computational workflows:
- Alignment-based: Tophat-HTSeq, Tophat-Cufflinks, STAR-HTSeq.
- Pseudoalignment-based: Kallisto, Salmon.
- qPCR Analysis: A whole-transcriptome qPCR dataset comprising 18,080 protein-coding genes was generated. This served as the validation benchmark.
- Data Alignment & Normalization: For a fair comparison, transcript-level data from RNA-seq were aggregated to gene-level TPM values, aligning with the transcripts detected by the qPCR assays.
- Comparison Metrics: The study evaluated both absolute gene expression correlation and, more importantly, the correlation of gene expression fold changes between the two samples.
The Scientist's Toolkit: Essential Research Reagents
Successful gene expression analysis relies on a suite of reliable reagents and tools. The following table details key solutions used in the featured experiments.
Table: Key Research Reagent Solutions for Gene Expression Analysis
| Reagent / Solution | Function | Example Use Case |
|---|---|---|
| TaqMan qPCR Assays | Sequence-specific probes and primers for highly sensitive and quantitative amplification of target cDNA. | Validating gene expression changes discovered via RNA-Seq; targeted expression profiling of a few genes [6] [4]. |
| RNA Extraction Kits (e.g., RNeasy, Direct-zol) | Purify high-quality, intact total RNA from complex biological samples (cells, tissues). | Initial sample preparation for both qPCR and RNA-Seq workflows. The method (e.g., phenol vs. column) can impact yields [8] [9] [10]. |
| Stranded mRNA Library Prep Kits | Prepare sequencing libraries from purified RNA by enriching for poly-adenylated mRNA and adding sequencing adapters. | Converting RNA into a format compatible with high-throughput sequencers for RNA-Seq [10] [3]. |
| Ion AmpliSeq or Illumina AmpliSeq Panels | Designed for targeted RNA sequencing, allowing focused analysis of a predefined set of genes. | Cost-effective profiling of a few hundred to a thousand genes when whole-transcriptome sequencing is not required [6] [3]. |
| Housekeeping Gene Assays (e.g., GAPDH, ACTB) | Provide stable reference signals for data normalization in qPCR, correcting for technical variations. | Essential for accurate relative quantification in qPCR experiments, though stability must be verified per experimental condition [10] [4]. |
Key Insights for Your Research
- For Discovery: Choose RNA-Seq. If your goal is to uncover novel transcripts, alternative splicing, or to profile the entire transcriptome without bias, RNA-Seq is the superior tool due to its high discovery power [3].
- For Validation and Targeting: Rely on qPCR. When you need to accurately measure the expression of a predefined set of genes across many samples, or when you must orthogonally confirm critical results from an RNA-Seq experiment, qPCR remains the "gold standard" for its sensitivity, simplicity, and cost-effectiveness [4] [7].
- They Are Complementary. The most robust research strategies often use both techniques in tandem: RNA-Seq for hypothesis generation and qPCR for hypothesis testing and validation [6] [4].
In the field of gene expression analysis, the choice between quantitative PCR (qPCR) and RNA sequencing (RNA-Seq) is fundamental. While RNA-Seq provides an unbiased, comprehensive view of the entire transcriptome, qPCR remains the undisputed gold standard for sensitive, accurate, and reproducible quantification of a predefined set of target genes. [11] [7] This guide objectively compares the performance of these two methodologies, providing the experimental data and protocols that underpin qPCR's premier role in targeted gene expression analysis.
Methodological Comparison: qPCR vs. RNA-Seq
The core distinction between these techniques lies in their approach: qPCR is a targeted method, while RNA-Seq is a discovery-oriented tool. The table below summarizes their key characteristics.
| Feature | qPCR / RT-qPCR | RNA-Seq |
|---|---|---|
| Scope | Targeted analysis of 1-10s of known genes. [11] | Genome-wide, unbiased profiling of all RNA transcripts. [11] |
| Throughput | Low to medium for target number, high for sample number. | High for target number, lower for sample number due to cost and analysis. |
| Sensitivity | Very high; can detect a single copy of a target sequence. [12] | High, but can miss very low-abundance transcripts. [7] |
| Dynamic Range | Up to 8-9 logs of dynamic range. [13] | Wide, typically around 5 logs of dynamic range. |
| Tolerance to RNA Quality | Requires high-quality RNA for optimal results. [12] | More adaptable; targeted panels and NanoString are better for degraded samples (e.g., FFPE). [11] |
| Best Application | Validation, high-throughput screening of known targets, clinical diagnostics. [11] [14] | Discovery, novel transcript/isoform identification, biomarker discovery. [11] |
| Hands-on Time & Speed | Rapid; results in 1-3 days. [11] | Longer; requires several days for library prep and sequencing. [11] |
| Bioinformatics Demand | Low; minimal computational requirements. | High; requires specialized expertise and infrastructure. [11] |
| Cost per Sample | Lower for targeted studies. [11] | Higher, especially for whole-transcriptome sequencing. [11] |
Performance Benchmarking: Sensitivity, Specificity, and Concordance
Independent studies consistently demonstrate qPCR's superior performance for quantifying specific targets, particularly those with low expression levels.
Sensitivity in Pathogen Detection
A study evaluating molecular methods for co-detecting waterborne pathogens demonstrated the exceptional sensitivity of qPCR, with detection limits as low as 1 cell/mL for all target genes. In comparison, multiplex PCR and traditional culture methods showed detection limits in the range of 10¹–10⁴ cells/mL. [15] This high sensitivity is a hallmark of the qPCR technique. [12]
Concordance with RNA-Seq Data
A comprehensive analysis of over 18,000 human genes compared five different RNA-seq analysis pipelines to wet-lab qPCR results. The key findings were: [7]
- 80-85% Concordance: The majority of genes showed consistent differential expression calls between RNA-seq and qPCR.
- Low-Fold-Change Disagreement: Among the non-concordant genes, approximately 93% had a fold change lower than 2, and 80% had a fold change lower than 1.5.
- Critical Role for Validation: A small but significant fraction (~1.8%) of genes were "severely non-concordant," and these were typically lower-expressed and shorter genes. This finding underscores the necessity of using qPCR to validate key results, especially when a study's conclusions hinge on the expression of a small number of genes or genes with low abundance. [7]
Critical Experimental Protocols for Robust qPCR
The reliability of qPCR data is contingent on rigorous experimental design and execution. Two of the most critical protocols are reference gene selection and detection chemistry.
Protocol 1: Selection and Validation of Reference Genes
Normalizing to stably expressed reference genes is essential for accurate qPCR data interpretation. [16] [13] The outdated practice of using a single housekeeping gene (e.g., GAPDH, Actin) is no longer acceptable, as their expression can vary significantly across experimental conditions. [16] [17]
Method 1: In Silico Selection from RNA-Seq Data (Recommended) Tools like GSV (Gene Selector for Validation) can identify optimal reference genes directly from RNA-seq datasets. [17] The criteria for a good reference gene include:
- Expression > 0 TPM in all samples. [17]
- Low variability: Standard deviation of log₂(TPM) < 1. [17]
- Stable expression: No single log₂(TPM) value is more than 2-fold from the mean. [17]
- High expression: Average log₂(TPM) > 5. [17]
- Low coefficient of variation: < 0.2. [17]
Method 2: The Stable Combination of Non-Stable Genes A groundbreaking study found that a carefully selected combination of genes, even if they are not individually stable, can outperform the best single reference genes. This method uses RNA-seq data to find a set of genes whose expression profiles balance each other out across all experimental conditions, leading to more accurate normalization. [16]
Validation Workflow: After selecting candidate genes, their stability must be confirmed experimentally using algorithms like geNorm, NormFinder, and BestKeeper. [16] [17]
Protocol 2: Choosing Detection Chemistry
The choice between SYBR Green and probe-based assays (like TaqMan) has significant implications for cost, specificity, and multiplexing capability. [13] [18]
| Feature | SYBR Green | TaqMan Probes |
|---|---|---|
| Principle | Intercalating dye that binds any double-stranded DNA. [13] | Sequence-specific probe with a fluorophore and quencher. [13] |
| Specificity | Lower; requires melt curve analysis to confirm amplicon specificity. [14] | Very high; due to dual specificity of primers and probe. [18] |
| Multiplexing | Not possible; can only detect one target per reaction. [18] | Possible; multiple targets can be detected with different colored dyes. [13] |
| Cost (Reagents) | Lower per reaction for single-plex. [18] | Higher per reaction for single-plex. [18] |
| Development | Faster, cheaper primer design. [14] | Requires more complex and costly probe design. [14] |
Cost-Effectiveness Analysis: While SYBR Green seems cheaper initially, a duplex TaqMan reaction (quantifying both target and reference gene in one well) becomes more cost-effective than two separate SYBR Green reactions when analyzing large numbers of samples. One cost-benefit analysis found unit costs of ₹52 for qPCR and ₹173 for multiplex PCR in a specific application, highlighting the cost savings of multiplexed, probe-based approaches. [15] [18]
Essential Research Reagent Solutions
A successful qPCR experiment relies on several key reagents, each with a critical function.
| Reagent / Tool | Function | Considerations |
|---|---|---|
| Reverse Transcriptase | Converts RNA into complementary DNA (cDNA). [13] | Choice between one-step (convenience) and two-step (flexibility, cDNA storage) protocols. [13] |
| DNA Polymerase & Master Mix | Amplifies the cDNA target during PCR. [13] | Available formulated for SYBR Green or probe-based detection. |
| Assays | Primers and/or probes that define the target to be amplified. [13] | SYBR Green: Primer pairs only. [14] TaqMan: Primer pair + specific probe. [13] Pre-designed assays are available. |
| Reference Gene Assays | Used to normalize for sample input variation. [13] | Must be validated for stability in the specific experimental system. [16] [17] |
| Software (e.g., GSV, NormFinder) | Identifies stable reference genes and analyzes Cq data for stability. [16] [17] | GSV uses RNA-seq data; NormFinder/geNorm use Cq values from validation experiments. |
In the context of differential expression research, qPCR and RNA-Seq are not competitors but powerful, complementary technologies. RNA-Seq is unparalleled for exploratory, hypothesis-generating research that demands a whole-transcriptome view. However, when the goal is precise, sensitive, and cost-effective quantification of a predetermined set of genes—whether for validating RNA-Seq hits, screening clinical samples, or conducting mechanistic studies—qPCR maintains its status as the gold standard. Its superior sensitivity, reproducibility, and robust quantitative output, grounded in well-established experimental protocols, make it an indispensable tool in the molecular biologist's toolkit.
In the field of gene expression analysis, the choice between quantitative PCR (qPCR) and RNA Sequencing (RNA-Seq) is fundamental. While qPCR remains a gold standard for targeted, small-scale expression analysis, RNA-Seq provides a powerful, unbiased approach for comprehensive transcriptome profiling, enabling discovery and system-level insights [11] [19]. This guide objectively compares their performance for differential expression research.
Core Technology Comparison
The following table outlines the fundamental characteristics of each method.
| Feature | RNA-Seq | qPCR |
|---|---|---|
| Throughput & Scope | Whole transcriptome; hypothesis-free [19] | Targeted (1-10 genes typically); requires prior knowledge [11] [19] |
| Dynamic Range | Very broad [5] | Broad [11] |
| Primary Application | Discovery, biomarker identification, isoform analysis [20] [11] | Validation, focused gene sets, clinical diagnostics [11] [19] |
| Key Limitation | High cost, complex data analysis, high RNA quality often needed [11] [21] | Low multiplexing capability, not suitable for discovery [11] [19] |
| Novel Transcript Detection | Yes [11] [19] | No [19] |
Performance Benchmarking and Experimental Data
Independent benchmarking studies using whole-transcriptome qPCR data have validated RNA-Seq's performance for differential expression analysis.
Table 1: Correlation with qPCR Expression Data
Data from a study comparing five RNA-seq workflows to transcriptome-wide qPCR for over 13,000 genes [5].
| RNA-Seq Analysis Workflow | Expression Correlation (Pearson R²) | Fold-Change Correlation (Pearson R²) |
|---|---|---|
| Salmon | 0.845 | 0.929 |
| Kallisto | 0.839 | 0.930 |
| Tophat-HTSeq | 0.827 | 0.934 |
| STAR-HTSeq | 0.821 | 0.933 |
| Tophat-Cufflinks | 0.798 | 0.927 |
These data demonstrate a high overall concordance between RNA-Seq and qPCR, with different computational workflows showing comparable performance [5]. The correlation for gene expression fold changes, which is critical for differential expression research, is exceptionally high (R² > 0.92) across all tested methods.
However, challenges remain in specific contexts. For example, a 2023 study focusing on the highly polymorphic HLA genes reported only moderate correlations (0.2 ≤ rho ≤ 0.53) between qPCR and RNA-seq expression estimates for HLA-A, -B, and -C, highlighting the difficulties in analyzing genes with extreme polymorphism and the need for specialized bioinformatic pipelines [8].
Detailed Experimental Protocols
To ensure reliable results, a carefully planned experimental workflow is crucial for both technologies.
RNA-Seq Workflow for Differential Expression
Diagram Title: RNA-Seq Experimental Workflow
- Sample Collection & RNA Extraction: Collect samples (e.g., cells, tissue) under appropriate conditions. Extract total RNA using commercial kits. For blood, use RNA-stabilizing reagents like PAXgene or process immediately [21].
- RNA Quality Control (QC): Assess RNA integrity using methods like Bioanalyzer. An RNA Integrity Number (RIN) >7 is generally recommended for high-quality sequencing. Check 260/280 and 260/230 ratios for purity [21].
- Library Preparation:
- Choose Library Type: Stranded libraries are preferred as they preserve transcript orientation, which is crucial for identifying overlapping genes and alternative splicing [21].
- rRNA Depletion: Since ribosomal RNA (rRNA) constitutes ~80% of cellular RNA, use probe-based rRNA depletion (e.g., RNaseH method) to enrich for mRNA and other RNA species. This significantly reduces sequencing costs [21].
- Sequencing: Use a next-generation sequencing platform (e.g., Illumina NovaSeq). Appropriate sequencing depth is critical; deeper sequencing allows for detection of low-abundance transcripts [22].
- Bioinformatic Analysis: Process raw data through a pipeline: quality control (FastQC), read alignment to a reference genome (STAR, HISAT2), quantification of gene counts (featureCounts, HTSeq), and finally, differential expression analysis (DESeq2, edgeR) [22] [5].
qPCR Workflow for Validation
Diagram Title: qPCR Experimental Workflow
- RNA Input: Use the same high-quality RNA as for RNA-Seq to ensure comparability.
- Reverse Transcription: Convert RNA into complementary DNA (cDNA) using reverse transcriptase.
- Assay Design: Use validated, target-specific primers and probes (e.g., TaqMan) for each gene of interest. Include reference genes (e.g., GAPDH, ACTB) for normalization.
- Amplification & Detection: Run the qPCR reaction. Fluorescent probes or DNA-binding dyes emit a signal proportional to the amount of amplified cDNA. The cycle at which the fluorescence crosses a threshold (Cq) is recorded.
- Data Analysis: Calculate relative gene expression using the ΔΔCq method, comparing Cq values of target genes between experimental groups after normalization to reference genes [11] [19].
The Scientist's Toolkit: Essential Research Reagents
| Item | Function in RNA-Seq/qPCR |
|---|---|
| RNA Stabilization Reagents (e.g., PAXgene) | Preserves RNA integrity at the point of sample collection, especially critical for blood and clinical samples [21]. |
| Stranded Library Prep Kit | Creates sequencing libraries that retain information about the original transcript strand, crucial for accurate annotation [21]. |
| rRNA Depletion Kit | Removes abundant ribosomal RNA, dramatically increasing the informative yield of sequencing reads and reducing cost [21]. |
| Reverse Transcriptase Enzyme | Synthesizes complementary DNA (cDNA) from an RNA template; the first step for both qPCR and most RNA-Seq protocols [11] [21]. |
| Target-Specific Primers & Probes | For qPCR, these are essential reagents that define the genes being measured. They must be highly specific and validated [19]. |
| Spike-in Control RNAs | Artificial RNA sequences added in known quantities to the sample. They serve as an internal standard to monitor technical performance and normalization accuracy in RNA-Seq [23]. |
For comprehensive transcriptome profiling, RNA-Seq is the unequivocal choice, offering an unbiased, genome-wide view of gene expression, splicing events, and novel transcript discovery [5] [19]. However, the decision is not binary. A synergistic approach is often the most powerful strategy: using RNA-Seq for broad-scale discovery and hypothesis generation, followed by targeted qPCR assays for validating key findings in larger sample cohorts with high precision and speed [11] [19]. The choice ultimately depends on the research question, scope, and available resources.
For researchers in drug development and basic science, selecting the appropriate method for differential gene expression analysis is a critical step in experimental design. The choice between quantitative PCR (qPCR) and RNA Sequencing (RNA-seq) often hinges on three fundamental parameters: throughput, dynamic range, and discovery potential. This guide provides an objective, data-driven comparison of these two technologies to inform your research strategy.
Comparative Analysis: qPCR vs. RNA-seq
The table below summarizes the core performance differences between qPCR and RNA-seq based on current technological capabilities.
| Feature | qPCR | RNA-seq |
|---|---|---|
| Throughput | Low to medium; optimal for ≤ 20-30 targets [2] [3]. Becomes cumbersome for many targets [3]. | Very high; can profile >20,000 transcripts simultaneously in a single assay [6] [19]. |
| Dynamic Range | Very wide dynamic range [2]. Lower limit of quantification [2]. | Wider dynamic range than microarrays; can quantify genes without background noise or signal saturation [3]. |
| Discovery Potential | Limited; can only detect known, predefined sequences. Requires prior knowledge for assay design [3] [19]. | High; hypothesis-free approach can detect novel transcripts, alternative splice isoforms, gene fusions, and non-coding RNAs [3] [19]. |
| Primary Application | Targeted validation, high-sensitivity quantification of a few genes [19] [11]. | Exploratory discovery, whole-transcriptome analysis, and detection of sequence variants [19] [11]. |
| Data Output | Cycle threshold (Cq) values for relative or absolute quantification. | Absolute read counts for each transcript, enabling complex differential expression analysis [3]. |
Experimental Validation and Protocol Considerations
Understanding the methodological underpinnings and validation data is crucial for interpreting results from these technologies.
Experimental Workflow Comparison
The core laboratory workflows for qPCR and RNA-seq differ significantly in complexity and objectives, as illustrated below.
Key Methodological Considerations
qPCR Protocol Specifics: For reliable and repeatable results, the MIQE (Minimum Information for Publication of Quantitative Real-Time PCR Experiments) guidelines should be followed. This includes the use of controls and validation of PCR amplification efficiency for each assay [2]. The process is highly targeted, relying on specific primers and fluorescent probes or dyes for each gene of interest [19].
RNA-seq Protocol Specifics: RNA-seq requires numerous decisions that impact data quality and cost. Researchers must choose the sequencing technology (e.g., Illumina, PacBio), library preparation type (e.g., strand-specific, with barcodes), and sequencing depth [2]. Unlike qPCR, RNA-seq does not require predesigned probes, leading to unbiased data sets [3]. However, data analysis involves complex bioinformatic pipelines for steps like adapter trimming, read alignment, and normalization, often requiring significant computing power and expertise [2].
Correlative Data Between Techniques
While both methods quantify RNA abundance, they can yield different results due to technical and biological factors. A 2023 study comparing qPCR and HLA-tailored RNA-seq for HLA class I genes (HLA-A, -B, and -C) observed only a moderate correlation (0.2 ≤ rho ≤ 0.53) between the expression estimates from the two techniques [8]. This highlights the challenges in comparing quantifications from different molecular phenotypes and techniques and underscores that one method cannot be considered a simple substitute for the other [8].
Research Applications and Limitations
When to Choose qPCR
qPCR is the most efficient tool for focused, hypothesis-driven research.
- Targeted Validation: It is the gold-standard for confirming results from high-throughput screens like RNA-seq [6] [19] [11].
- Low-Plex, High-Throughput Screening: Ideal for rapidly screening a small number of known genes across many samples [2] [11].
- Resource-Limited Settings: qPCR is accessible, with familiar workflows and equipment available in most labs [3] [11].
When to Choose RNA-seq
RNA-seq is unparalleled for discovery-based and comprehensive analysis.
- Novel Transcript Discovery: Its hypothesis-free nature allows for the identification of novel transcripts, splice variants, and gene fusions [3] [19].
- Whole Transcriptome Analysis: Provides an unbiased snapshot of the entire transcriptome, crucial for early-stage projects where the key players are unknown [19].
- Complex Transcriptome Characterization: Capable of detecting subtle changes in gene expression (down to 10%), identifying alternative spliced isoforms, and profiling non-coding RNA species [3].
A Complementary Workflow
In practice, the two technologies are often used together synergistically. A common and powerful strategy is to use RNA-seq for initial, unbiased discovery in a small set of samples, followed by qPCR to validate and expand upon the key findings in a larger cohort [6] [19] [24]. This approach leverages the strengths of each method while mitigating their individual limitations and costs.
Research Reagent Solutions
The table below details essential reagents and kits used in these experimental workflows.
| Item | Function | Example Technologies |
|---|---|---|
| RNA Extraction Kit | Isolves high-quality total RNA from cell or tissue samples. | RNeasy Kit (Qiagen) [8] |
| Reverse Transcriptase | Converts RNA templates into stable complementary DNA (cDNA). | Components of TaqMan Gene Expression Assays [6] |
| qPCR Master Mix | Contains enzymes, dNTPs, and buffer for efficient DNA amplification. | SYBR Green, TaqMan Assays [19] [24] |
| RNA-seq Library Prep Kit | Prepares cDNA fragments for sequencing by adding platform-specific adapters. | SEQuoia Stranded RNA Library Prep Kit (Bio-Rad), Illumina Stranded mRNA Prep [3] [24] |
| Targeted RNA-seq Panel | Enriches for a predefined set of genes to enable focused, deep sequencing. | Ion AmpliSeq Transcriptome Panel, Illumina RNA Prep with Enrichment [3] [6] |
Technical Limitations and Challenges
qPCR Limitations: The technique is inherently limited by its reliance on pre-existing sequence knowledge, offering no discovery power [3]. Throughput is physically constrained by plate wells, making it inefficient for profiling hundreds of genes [3].
RNA-seq Limitations: The main challenges are cost and complexity. It requires significant investment in sequencing and bioinformatic resources [2] [19]. The massive data files (gigabytes per sample) demand substantial storage and computing power [2]. For highly polymorphic gene families like HLA, standard short-read alignment can be problematic, though specialized bioinformatic pipelines have been developed to address this [8].
The selection of an appropriate methodology for gene expression analysis is a critical decision in molecular biology and drug development research. Reverse Transcription Quantitative Polymerase Chain Reaction (RT-qPCR) and RNA Sequencing (RNA-Seq) have emerged as foundational technologies for differential expression research, each with distinct advantages, limitations, and applications. RT-qPCR remains the gold standard for targeted, high-precision quantification of a limited number of genes, offering exceptional sensitivity, reproducibility, and cost-effectiveness for focused studies [11] [7]. In contrast, RNA-Seq provides a comprehensive, unbiased view of the entire transcriptome, enabling not only gene expression quantification but also discovery of novel transcripts, alternative splicing variants, and genetic alterations [25] [26]. This guide objectively compares the technical workflows, performance characteristics, and experimental considerations of these platforms to inform researchers and drug development professionals in selecting the optimal approach for their specific research context. Understanding the technical foundations of both methods—from library preparation to data analysis—is essential for designing robust experiments and accurately interpreting gene expression data in the context of differential expression studies.
Workflow Comparison: RT-qPCR vs. RNA-Seq
The experimental workflows for RT-qPCR and RNA-Seq involve distinct processes, reagents, and technical considerations that significantly impact their applications in research. Below is a comparative visualization of their fundamental workflows, highlighting key decision points and procedural differences.
RT-qPCR Workflow Specifications
The RT-qPCR workflow begins with RNA extraction and quality assessment, followed by a two-step process. First, reverse transcription converts RNA to complementary DNA (cDNA) using reverse transcriptase enzyme with primers (gene-specific, oligo(dT), or random hexamers), dNTPs, MgCl₂, and RNase inhibitors [27]. This step involves denaturing RNA secondary structures at 65-70°C for 5-10 minutes, primer annealing, cDNA synthesis at 37-50°C for 30-60 minutes, and enzyme inactivation at 70-85°C [27]. Second, quantitative PCR amplifies and detects specific targets using cDNA template, DNA polymerase, gene-specific primers, dNTPs, and fluorescent dyes (SYBR Green) or probes (TaqMan) [27]. Thermal cycling includes initial denaturation (95°C), followed by 30-40 cycles of denaturation (95°C), primer annealing (55-65°C), and extension (72°C) with fluorescence measurement at each cycle [27].
Researchers must choose between one-step and two-step RT-qPCR approaches. One-step RT-qPCR combines reverse transcription and qPCR in a single tube using gene-specific primers, offering minimal handling, reduced contamination risk, and streamlined processing—ideal for high-throughput applications [28]. Two-step RT-qPCR performs reverse transcription separately using random hexamers, oligo(dT), or gene-specific primers, then uses a portion of cDNA for qPCR, providing flexibility to analyze multiple targets from a single cDNA synthesis reaction and better reaction optimization control [28].
RNA-Seq Library Preparation Methods
RNA-Seq library preparation involves several methodological choices that significantly impact results. The fundamental distinction lies between whole transcriptome and 3' mRNA-Seq approaches. Whole transcriptome methods (e.g., Illumina TruSeq) use random priming to generate sequencing reads distributed across entire transcripts, enabling detection of alternative splicing, novel isoforms, and fusion genes, but require ribosomal RNA depletion (either by polyA selection or rRNA-specific removal) and higher sequencing depth [26]. In contrast, 3' mRNA-Seq methods (e.g., Lexogen QuantSeq) employ oligo(dT) priming to generate fragments primarily from the 3' end of polyadenylated RNAs, providing cost-effective gene expression quantification with lower sequencing depth (1-5 million reads/sample) and simpler data analysis, but limited transcript-level information [26].
Specific library preparation kits exhibit distinct performance characteristics. The TruSeq method (Illumina) fragments mRNA after capture with oligo dT beads, then performs reverse transcription and double-stranded cDNA generation, demonstrating strong gene detection and splicing event identification [25] [29]. SMARTer and TeloPrime methods generate full-length double-stranded cDNA without fragmentation—SMARTer uses template-switching activity of MMLV reverse transcriptase, while TeloPrime employs cap-specific linker ligation to target complete 5' capped mRNA molecules [25]. Performance comparisons show TruSeq detects more expressed genes and splicing events than SMARTer and TeloPrime, while TeloPrime provides superior transcription start site coverage but uneven gene body coverage [25] [29].
Performance Comparison for Differential Expression
Technology Performance Metrics
Table 1: Performance Characteristics of RNA-Seq and RT-qPCR for Differential Expression Analysis
| Parameter | RNA-Seq | RT-qPCR |
|---|---|---|
| Throughput | Genome-wide, 10,000+ genes simultaneously [5] | Typically 1-10 genes per reaction [11] |
| Sensitivity | Broad dynamic range, can detect low-abundance transcripts [26] | Excellent sensitivity, can detect rare transcripts with proper optimization [27] |
| Accuracy | High correlation with qPCR (R² = 0.82-0.93 for fold changes) [5] | Considered gold standard for validation [7] |
| Concordance Rate | 80-85% of genes show consistent DE results with qPCR [5] [7] | Reference method for comparison |
| Problematic Genes | ~1.8% severely non-concordant; typically shorter, lower expressed genes [5] [7] | More reliable for shorter, low-expression genes [5] |
| Multiplexing Capacity | Essentially unlimited [26] | Limited, typically 2-4 targets per reaction with probes [11] |
| Best Applications | Discovery work, novel transcript identification, splicing analysis [25] [26] | Targeted validation, high-precision quantification, clinical assays [11] [7] |
RNA-Seq Method Performance
Table 2: Performance Comparison of RNA-Seq Library Preparation Methods
| Method | Detected Genes | Splicing Events | Coverage Bias | Input Requirements | Strand Specificity |
|---|---|---|---|---|---|
| TruSeq Stranded | High (~90% of mappable reads) [25] | Highest detection rate [25] [29] | Uniform gene body coverage [25] | High (100-1000 ng) [30] | Yes [30] |
| SMARTer | Moderate (similar to TruSeq) [25] | Moderate (fewer than TruSeq) [25] | Uniform but with genomic DNA contamination [25] | Low input compatible [30] | Varies by kit [30] |
| TeloPrime | Low (~50% of TruSeq) [25] | Low (fewest detected) [25] | Strong 5' bias, poor 3' coverage [25] | Low input compatible [25] | Yes [25] |
| 3' mRNA-Seq (QuantSeq) | Moderate (fewer DE genes than WTS) [26] | Limited to 3' information [26] | Strong 3' bias by design [26] | Flexible, works with degraded samples [26] | Yes [26] |
Validation Requirements and Concordance
Comparative studies reveal high overall concordance between RNA-Seq and RT-qPCR, with approximately 85% of genes showing consistent differential expression results between the platforms [5]. The non-concordant fraction (15-20%) primarily consists of genes with small fold changes (<2), while severely discordant results affect only about 1.8% of genes, which are typically shorter, have fewer exons, and show lower expression levels [5] [7]. This suggests that orthogonal validation with RT-qPCR may be particularly valuable for these specific gene types, or when research conclusions hinge on precise quantification of a small number of genes with modest expression differences [7].
Experimental Protocols
RT-qPCR Experimental Methodology
Sample Preparation and RNA Extraction: Isolate high-quality RNA using appropriate extraction methods. For tissues, use mechanical homogenization followed by column-based or phenol-chloroform extraction. Include DNase treatment to remove genomic DNA contamination. Assess RNA quality using spectrophotometry (A260/A280 ratio ~1.8-2.0) and integrity via electrophoresis (RIN >7 for most applications) [27].
Reverse Transcription: Prepare reaction mixture containing 10ng-1μg total RNA, 50-250ng random hexamers or oligo(dT) primers, 0.5mM dNTPs, 1× reverse transcriptase buffer, 5mM MgCl₂, 2U/μL RNase inhibitor, and 10U/μL reverse transcriptase [27]. Incubate at 65°C for 5-10 minutes for RNA denaturation, cool to 4°C for primer annealing, then incubate at 37-50°C for 30-60 minutes for cDNA synthesis. Terminate reaction by heating at 70-85°C for 5-10 minutes [27].
Quantitative PCR: Prepare reaction mix containing 1× SYBR Green or TaqMan Master Mix, 0.1-0.5μM forward and reverse primers, and cDNA template (diluted 1:5 to 1:20) [27]. Perform amplification with initial denaturation at 95°C for 2-10 minutes, followed by 40 cycles of 95°C for 15 seconds (denaturation) and 60°C for 1 minute (annealing/extension) with fluorescence acquisition. Include no-template controls and standard curves for efficiency determination [27].
Primer Design Considerations: Design primers spanning exon-exon junctions to avoid genomic DNA amplification. Optimal amplicon length: 70-200bp. Primer length: 18-25 nucleotides with 40-60% GC content. Avoid secondary structures and dimer formation using tools like Primer3Plus. Validate primer specificity using BLAST and check for secondary structures with OligoAnalyzer [27].
RNA-Seq Library Preparation Protocol
Library Preparation Workflow: The process varies by kit but generally follows: (1) RNA quality assessment (RIN >8 recommended), (2) ribosomal RNA depletion via polyA selection or rRNA-specific removal, (3) RNA fragmentation (except for full-length methods), (4) cDNA synthesis with reverse transcriptase, (5) second-strand synthesis, (6) adapter ligation, (7) library amplification, and (8) quality control and quantification before sequencing [25] [30] [26].
Quality Control Metrics: Assess library quality using Bioanalyzer or TapeStation (confirm expected size distribution), qPCR for quantification, and validate absence of adapter dimers. For sequencing, aim for 20-30 million reads per sample for standard whole transcriptome studies, or 1-5 million reads for 3' mRNA-Seq [26].
Strand-Specific Protocol Considerations: When using strand-specific kits (e.g., TruSeq Stranded, Pico), incorporate dUTP during second-strand synthesis, which allows enzymatic degradation of this strand before sequencing to maintain strand information [30]. This enables accurate sense/antisense transcription assessment and is particularly valuable for identifying antisense transcripts and accurately quantifying overlapping genes [30].
Research Reagent Solutions
Essential Materials and Their Functions
Table 3: Key Research Reagents for RT-qPCR and RNA-Seq Workflows
| Reagent Category | Specific Examples | Function | Application Notes |
|---|---|---|---|
| Reverse Transcriptases | MMLV, LunaScript | RNA to cDNA conversion | Higher temperature variants reduce secondary structures [27] [28] |
| PCR Enzymes | Hot-start Taq polymerases | DNA amplification | Reduces non-specific amplification; essential for qPCR [27] |
| Fluorescent Detection | SYBR Green, TaqMan probes | Amplicon detection | SYBR for general use; TaqMan for higher specificity [27] |
| RNA-Seq Kits | TruSeq, SMARTer, QuantSEQ | Library preparation | Varying input needs, strand specificity, and coverage [25] [26] |
| Primer Types | Oligo(dT), random hexamers, gene-specific | cDNA synthesis initiation | Oligo(dT) for mRNA; random for total RNA including non-polyA [27] |
| Normalization Genes | HKGs (ACTB, GAPDH), LVGs | qPCR data normalization | Must be validated for specific experimental conditions [31] |
Selection Guidelines
For RT-qPCR, choose one-step formats when processing many samples for the same few targets, prioritizing workflow simplicity and reduced contamination risk [28]. Select two-step formats when analyzing multiple targets from limited RNA samples or needing reaction optimization flexibility [28]. For RNA-Seq, choose whole transcriptome methods (e.g., TruSeq) when studying splicing variants, novel transcripts, or needing comprehensive transcriptome characterization [25] [26]. Select 3' mRNA-Seq (e.g., QuantSeq) for large-scale gene expression studies, degraded samples (FFPE), or when cost-effectiveness and simplified data analysis are priorities [26].
The choice between RT-qPCR and RNA-Seq for differential expression research depends on multiple experimental factors. The following decision framework visualizes the key considerations for selecting the appropriate methodology.
RT-qPCR and RNA-Seq represent complementary rather than competing technologies for differential expression research. RT-qPCR excels in scenarios requiring precise quantification of a limited number of pre-defined targets, offering superior sensitivity, reproducibility, and cost-effectiveness for focused studies and validation work [11] [7]. RNA-Seq provides unparalleled capability for discovery-based research, enabling comprehensive transcriptome characterization, including differential expression analysis, alternative splicing assessment, and novel transcript identification [25] [26]. When designing gene expression studies, researchers should consider their specific objectives, sample characteristics, analytical requirements, and resource constraints to select the most appropriate methodology. For maximum rigor, particularly when research conclusions depend heavily on expression patterns of a small number of genes, orthogonal validation using both approaches may be warranted, especially for shorter, lower-expressed genes that show higher rates of inter-method discordance [5] [7]. By understanding the technical foundations, performance characteristics, and appropriate applications of each platform, researchers can optimize their experimental approaches to generate robust, reliable gene expression data for advancing scientific knowledge and drug development programs.
Strategic Application: Choosing the Right Tool for Your Research Goal
In the evolving landscape of gene expression analysis, the choice between quantitative PCR (qPCR) and RNA sequencing (RNA-seq) remains a critical consideration for researchers. While RNA-seq offers an unbiased, genome-wide discovery power, qPCR maintains its status as a gold standard for targeted expression analysis due to its superior sensitivity, cost-effectiveness, and well-established validation frameworks. This guide objectively compares these technologies, focusing specifically on the scenarios where qPCR delivers unparalleled performance for validation studies, low-throughput targets, and clinical assays, supported by experimental data and standardized protocols.
Key Advantages of qPCR in Gene Expression Analysis
Targeted Sensitivity and Cost-Efficiency
qPCR excels in studies involving a limited number of pre-defined targets, typically 30 genes or fewer [2]. Its exceptional dynamic range and low quantification limits enable reliable detection of even minimally expressed transcripts [2]. When research objectives are focused on validating specific genetic markers or pathways, qPCR provides a more efficient and economical solution than sequencing-based approaches.
For example, in research involving surrogate markers of immunity such as IFN-γ, RT-qPCR has demonstrated a diagnostic sensitivity equivalent to detecting 1:10,000 responding cells with over 90% accuracy, requiring as few as 50,000 PBMCs [32]. This level of sensitivity is crucial for detecting low-abundance transcripts in limited clinical samples.
Established Validation Frameworks
qPCR benefits from well-defined validation guidelines and metrics that ensure data reliability. The MIQE guidelines establish minimal standards for publication, ensuring proper controls, replication, and PCR efficiency calculations [2]. Validation techniques like Poisson analysis and PCR-Stop analysis provide rigorous assessment of an assay's quantitative and qualitative resolution, revealing its true performance boundaries [33] [34].
PCR-Stop analysis, for instance, investigates assay performance during initial qPCR cycles by subjecting sample batches to increasing numbers of pre-amplification cycles before the main qPCR run. This method verifies whether DNA duplication follows theoretical efficiency from the first cycle and identifies an assay's quantitative resolution [33]. Such thorough validation is particularly valuable for clinical applications where result accuracy directly impacts diagnostic or therapeutic decisions.
Experimental Comparison: qPCR vs. RNA-seq Performance
Correlation Studies in HLA Expression Research
Direct comparisons between qPCR and RNA-seq reveal important differences in their expression measurements. A 2023 study analyzing HLA class I gene expression found only moderate correlation between qPCR and RNA-seq estimates for HLA-A, -B, and -C (0.2 ≤ rho ≤ 0.53) [8]. This discrepancy highlights the technical challenges of RNA-seq for quantifying extremely polymorphic genes and underscores the value of qPCR for validating expression levels of specific targets.
Large-Scale Benchmarking Evidence
A comprehensive benchmarking study using the well-established MAQCA and MAQCB reference samples provided further insights into technology concordance. When comparing gene expression fold changes between samples, approximately 85% of genes showed consistent results between RNA-seq and qPCR data across five different processing workflows [5].
Table 1: Performance Comparison of qPCR and RNA-seq
| Parameter | qPCR | RNA-seq |
|---|---|---|
| Optimal Target Range | ≤ 30 genes [2] | Genome-wide [3] |
| Dynamic Range | Widest [2] | Broad, but platform-dependent [3] |
| Sensitivity | Single transcript detection [34] | Detection limit varies with sequencing depth [35] |
| Throughput | Low to medium [3] | High [3] |
| Discovery Power | Limited to known sequences [3] | Detects novel transcripts and variants [3] |
| Cost Per Sample | Lower for limited targets [2] | Higher, especially with sufficient coverage [2] |
The remaining 15% of non-concordant genes exhibited methodological discrepancies, with a small but specific gene set (7.1-8.0% of non-concordant genes) showing substantial fold change differences (ΔFC > 2) between technologies [5]. These genes tended to be shorter, contain fewer exons, and show lower expression levels, highlighting a category where careful validation is particularly warranted [5].
Essential qPCR Experimental Protocols
Sample Preparation and Validation
Proper sample preparation is fundamental to reliable qPCR results. For immune cell studies, peripheral blood mononuclear cells (PBMCs) are frequently used. Following isolation by density gradient centrifugation, PBMCs should be cryopreserved in 90% FBS/10% DMSO, then thawed rapidly at 37°C, treated with DNase I (100μg/mL), and rested for 18 hours at 2×10⁶ cells/mL in complete media before stimulation or analysis [32].
The PCR-Stop validation protocol provides a robust method for assessing qPCR assay performance [33]:
- Prepare six batches of eight identical samples containing target DNA (>10 initial target molecule number)
- Subject batches to ascending pre-run amplification cycles (0 to 5 cycles)
- Analyze all batches in a subsequent qPCR run
- Evaluate: (I) DNA duplication efficiency during pre-runs, (II) relative standard deviation between replicates, (III) steady value increase indicating quantitative resolution, and (IV) presence of negative controls [33]
This method validates that amplification begins immediately with constant efficiency and confirms the assay's quantitative resolution beyond what calibration curves alone can demonstrate [33].
Cost-Optimized High-Throughput qPCR
For studies requiring higher throughput, a miniaturized RT-qPCR protocol can reduce costs by nearly 90% while maintaining excellent performance metrics (Z' factor >0.5) [32]. This approach systematically optimizes reagent volumes and concentrations without compromising data quality:
- RNA Extraction: Use magnetic bead-based methods like MagMAX mirVana Total RNA Isolation Kit
- Reverse Transcription: Reduce reaction volumes to 25-50% of manufacturer recommendations
- qPCR Setup: Implement 5μL reaction volumes with appropriate cDNA dilution [32]
This optimized protocol achieves single-cell analytical sensitivity while enabling comprehensive screening experiments within practical resource constraints [32].
Research Reagent Solutions
Table 2: Essential Reagents for qPCR Experiments
| Reagent/Category | Specific Examples | Function & Application |
|---|---|---|
| RNA Isolation Kits | MagMAX mirVana Total RNA Isolation Kit [32] | High-quality RNA extraction from PBMCs and other samples |
| Reverse Transcription Systems | SuperScript IV First-Strand Synthesis System [32] | cDNA synthesis with high efficiency and stability |
| qPCR Master Mixes | ssoAdvanced Universal SYBR Green Master-Mix [32] | Fluorescence-based detection of amplified DNA |
| Sequence-Specific Assays | TaqMan Assays [36] | Gold-standard probe-based detection for superior specificity |
| Stimulatory Reagents | Phorbol 12-Myristate 13-Acetate (PMA), Ionomycin [32] | Positive control stimulation for immune cell activation studies |
| Reference Assays | PrimerBank primers [32] | Pre-validated primers for gene expression normalization |
qPCR Workflow and Applications
qPCR Workflow and Key Applications
qPCR remains an indispensable technology in the molecular biologist's toolkit, particularly for studies requiring precise quantification of limited gene targets, rigorous assay validation, and clinical applications demanding high sensitivity and reproducibility. While RNA-seq provides unprecedented discovery power for exploratory research, qPCR offers unmatched performance for focused investigations where accuracy, cost-efficiency, and established validation frameworks are paramount. By understanding the specific strengths and optimal applications of each technology, researchers can make informed decisions that maximize scientific rigor while efficiently allocating resources.
For researchers deciding between quantitative PCR (qPCR) and RNA sequencing (RNA-seq) for differential expression studies, the choice extends beyond simple gene-level counts. While qPCR remains a precise and cost-effective method for quantifying the expression of a limited number of pre-defined genes, RNA-seq is the unequivocal choice for discovery-driven research, particularly for uncovering splice variants and novel transcripts. This guide objectively compares their performance, with a focus on how long-read RNA-seq technologies are transforming transcriptomics.
Table of Contents
- Introduction: The qPCR vs. RNA-seq Paradigm
- Technical Performance: Accuracy and Reproducibility
- Uncovering Splice Variants: From Short-Read to Long-Read Resolution
- Discovering Novel Transcripts: Expanding the Annotated Genome
- Experimental Protocols and Reagent Solutions
- Conclusion and Decision Framework
The selection of a gene expression tool involves a fundamental trade-off between hypothesis-testing and hypothesis-generation. qPCR excels at the former, providing high-sensitivity, low-cost quantification of known targets. Its success, however, is heavily dependent on the use of stably expressed reference genes for normalization, a factor that can introduce significant bias if not meticulously validated [16] [37].
RNA-seq, in contrast, provides a comprehensive, unbiased view of the transcriptome. It enables the simultaneous discovery of novel transcripts and the quantification of known ones without prior knowledge of sequence information. The emergence of long-read RNA-seq (e.g., PacBio and Oxford Nanopore Technologies) has been particularly transformative, overcoming a critical limitation of short-read sequencing: the inability to reliably determine the full-length structure of RNA isoforms [38] [39]. This makes long-read RNA-seq uniquely powerful for applications in genetics and disease research where understanding the complete transcript isoform is critical [40].
Technical Performance: Accuracy and Reproducibility
Large-scale, multi-center benchmarking studies are essential for understanding the real-world performance of RNA-seq. A recent study involving 45 laboratories highlighted key factors affecting the accuracy and reproducibility of RNA-seq data, especially for detecting subtle differential expression—a common scenario in clinical diagnostics and drug development [41].
Table 1: Key Findings from Multi-Center RNA-Seq Benchmarking
| Assessment Metric | Performance with Large Biological Differences (e.g., MAQC samples) | Performance with Subtle Biological Differences (e.g., Quartet samples) | Primary Influencing Factors |
|---|---|---|---|
| Signal-to-Noise Ratio | High (Avg. 33.0) [41] | Significantly Lower (Avg. 19.8) [41] | mRNA enrichment, library strandedness [41] |
| Correlation with TaqMan (qPCR) | Lower (Avg. Pearson: 0.825) [41] | Higher (Avg. Pearson: 0.876) [41] | Gene type and expression level [41] |
| Inter-laboratory Variation | Moderate | High [41] | Experimental execution and bioinformatics pipeline [41] |
These findings underscore that while RNA-seq is a powerful tool, its application to detect subtle expression changes requires rigorous quality control and standardized protocols. The choice of bioinformatics pipeline, including the gene annotation used, systematically impacts downstream differential expression results [41] [42].
Uncovering Splice Variants: From Short-Read to Long-Read Resolution
Alternative splicing is a major source of transcriptomic diversity and is frequently disrupted in disease. Short-read RNA-seq can infer splicing events indirectly, but long-read RNA-seq directly sequences full-length transcripts, providing unambiguous evidence of splice variants and their haplotype origin.
A 2025 study demonstrated this power using a new method, isoLASER, which leverages long-read data to segregate splicing events into cis-directed (primarily regulated by genetic variants on the same allele) and trans-directed (regulated by cellular factors affecting both alleles equally) [43]. This distinction is crucial for understanding the genetic basis of disease.
Experimental Protocol: Identifying cis-Directed Splicing with isoLASER
- Library Preparation & Sequencing: Generate long-read RNA-seq data (e.g., using PacBio Sequel II) [43].
- Variant Calling:
isoLASERperforms de novo variant calling from RNA-seq reads using a local reassembly approach and an ML classifier to achieve high precision (>0.99 AUC in training) [43]. - Gene-level Phasing: Heterozygous variants are phased into haplotypes using a k-means clustering approach, assigning each read to its allele of origin (haplotagging). This step showed >99% consistency with HapCUT2 and a switch-error rate of only 0.15% in benchmark data [43].
- Allelic Linkage Testing: For each alternative exon, the tool tests for linkage between its inclusion and the phased haplotypes. A significant bias towards one haplotype classifies it as a cis-directed event [43].
This workflow revealed that the genetic linkage of splicing is largely individual-specific, in contrast to the tissue-specific pattern of overall splicing profiles [43]. The method has been successfully applied to identify novel cis-directed splicing events in Alzheimer’s disease-relevant genes like MAPT and BIN1, and in the challenging, highly polymorphic HLA gene family [43].
Discovering Novel Transcripts: Expanding the Annotated Genome
Standard genome annotations from databases like GENCODE and RefSeq are incomplete. Long-read RNA-seq is proving to be a transformative technology for revealing this "dark matter" of the transcriptome, particularly in complex tissues like the human brain.
A 2025 study of 31 neuropsychiatric risk genes used nanopore long-read amplicon sequencing and a novel bioinformatic pipeline called IsoLamp to deeply profile their RNA isoform repertoire [44]. The study identified 363 novel isoforms and 28 novel exons in these previously studied genes. In genes such as ATG13 and GATAD2A, the majority of expression was derived from these previously undiscovered isoforms. Furthermore, mass spectrometry confirmed the translation of a novel exon-skipping event in the schizophrenia risk gene ITIH4, suggesting a new regulatory mechanism for this gene in the brain [44].
Experimental Protocol: Novel Isoform Discovery with IsoLamp
- Targeted Amplification: Design amplicons to cover the full coding region of target genes from first to last exon. Multiple primer sets may be needed for genes with alternative start/end sites [44].
- Long-read Sequencing: Perform deep sequencing using Oxford Nanopore Technology (ONT) to generate full-length reads.
- Isoform Discovery & Quantification: Process reads with the
IsoLamppipeline, which was benchmarked and shown to outperform other tools (Bambu, FLAIR, FLAMES, StringTie2) in precision and recall on synthetic spike-in RNA controls [44]. - Functional Validation: Corroborate findings with mass spectrometry to confirm the translation of novel protein isoforms [44].
This work emphasizes that the transcript structure of most risk genes is more complex than current annotations suggest, with direct implications for understanding disease pathophysiology and interpreting the functional impact of genetic variants found in non-coding regions [44] [40].
Experimental Protocols and Reagent Solutions
The following table details key reagents and computational tools referenced in the featured studies.
Table 2: Research Reagent and Computational Solutions
| Category | Item | Function in Experiment |
|---|---|---|
| Reference Materials | Quartet Project & MAQC Reference RNAs [41] | Benchmarking material for assessing RNA-seq accuracy and cross-lab reproducibility. |
| ERCC RNA Spike-In Mixes [41] | Synthetic RNA controls spiked into samples to evaluate quantification accuracy. | |
| SIRVs (Spike-in RNA Variants) [44] | Synthetic isoform mixes with known structure and abundance for benchmarking isoform discovery tools. | |
| Critical Software | isoLASER [43] | A computational method for identifying cis- and trans-directed splicing from long-read RNA-seq data. |
| IsoLamp [44] | A bioinformatic pipeline optimized for isoform discovery and quantification from long-read amplicon data. | |
| Bambu [44] | A tool for transcript discovery and quantification from long-read RNA-seq data; used within IsoLamp. |
The choice between qPCR and RNA-seq is defined by the research objective. qPCR is the superior tool for targeted, high-throughput quantification of a small, predefined set of genes in a large number of samples.
RNA-seq is the mandatory technology for all discovery-based applications. As the supporting data shows, long-read RNA-seq is no longer a niche technology but a foundational one for research requiring a complete understanding of transcriptome complexity. It is particularly critical for:
- Genetic Disease Research: Linking cis-acting genetic variants to full-length isoform effects and clarifying the impact of non-coding risk variants [43] [40].
- Neurology and Psychiatry: Profiling the immense isoform diversity in the brain, which is replete with novel, unannotated transcripts [44].
- Cancer Biology: Identifying patient- or subtype-specific isoforms that may drive disease progression [40].
- Improving Genome Annotation: Generating ground-truth data to complete and correct reference databases like GENCODE and RefSeq [44] [42].
For researchers investigating differential expression, the decision is clear: use qPCR for focused, cost-sensitive hypothesis testing, but employ RNA-seq—and increasingly, long-read RNA-seq—whenever the goal is to explore the full complexity of the transcriptome.
In differential expression research, scientists are often faced with a critical choice between high-throughput discovery and highly accurate validation. RNA sequencing (RNA-seq) and quantitative polymerase chain reaction (qPCR) represent two complementary technologies that, when used in concert, provide a powerful hybrid workflow for comprehensive gene expression analysis. RNA-seq enables unbiased, genome-wide transcript discovery, while qPCR delivers sensitive, specific validation of key targets—making them ideal partners rather than competitors in rigorous scientific investigation.
This guide objectively compares the performance characteristics of both technologies and provides a structured framework for implementing them in an integrated discovery-to-validation pipeline, complete with experimental protocols and data standards required for reproducible research in drug development and basic science.
Technology Comparison: Capabilities and Limitations
Fundamental Technical Differences
RNA-seq is a high-throughput technique that utilizes next-generation sequencing to capture a comprehensive snapshot of the transcriptome. It sequences cDNA fragments converted from RNA, then aligns these sequences to a reference genome or transcriptome to identify and quantify transcripts. This technology provides an unbiased, discovery-oriented approach that can detect novel transcripts, alternative splicing events, and sequence variations alongside expression levels [8] [45].
qPCR (quantitative PCR), particularly in its reverse transcription form (RT-qPCR or qRT-PCR), is a targeted technique that amplifies specific cDNA sequences using primer pairs and fluorescent probes for precise quantification. It operates by monitoring the amplification of target genes in real-time during PCR cycles, providing extremely sensitive and specific measurement of predefined targets with a large dynamic range [46] [47].
Performance Characteristics and Capabilities
Table 1: Comparative Analysis of RNA-seq and qPCR Performance Characteristics
| Parameter | RNA-seq | qPCR |
|---|---|---|
| Throughput | Genome-wide, profiling all transcripts [48] | Targeted, typically 1-100 genes per run |
| Sensitivity | Moderate (requires more reads for low-abundance transcripts) [45] | High (can detect single copies with good assay design) [46] [47] |
| Dynamic Range | ~5 orders of magnitude [45] | ~7-8 orders of magnitude [47] |
| Accuracy (Absolute Quantification) | Lower, gene-specific biases observed [45] [41] | Higher when optimized with standard curves [47] |
| Reproducibility | High inter-laboratory variation (especially for subtle expression differences) [41] | Excellent when standardized (CV typically 0.0%-5.9%) [46] |
| Discovery Capability | Excellent (novel transcripts, splice variants, fusions) [45] | None (requires prior sequence knowledge) |
| Turnaround Time | Days to weeks (including library prep and bioinformatics) | Hours to 1-2 days |
| Cost Per Sample | Higher for full transcriptome | Lower for limited gene sets [48] |
| Technical Expertise | Advanced bioinformatics required | Accessible, though assay optimization needed |
Experimental Protocols for Hybrid Workflows
RNA-seq Discovery Phase Protocol
Sample Preparation and Library Construction
- RNA Extraction: Isolate high-quality total RNA using silica-membrane columns (e.g., RNeasy kits) or magnetic beads. Assess RNA integrity using an Agilent Bioanalyzer; accept only samples with RIN > 8.0 [10].
- RNA Quantification: Precisely quantify RNA using fluorescence-based methods (e.g., Qubit RNA HS Assay) to ensure accurate input amounts [8].
- Library Preparation: Utilize stranded mRNA-seq library prep kits. Poly-A selection is recommended for mRNA enrichment. Include unique dual indexing (UDI) to enable sample multiplexing and prevent cross-talk [41].
- Quality Control: Validate library size distribution using capillary electrophoresis and quantify by qPCR before sequencing.
Sequencing and Data Generation
- Platform Selection: Illumina platforms (HiSeq 2500/3000/4000, NovaSeq) are currently best established for RNA-seq [45] [10].
- Sequencing Depth: Target 30-50 million paired-end reads per sample for standard differential expression studies. Increase to 50-100 million for splice variant detection [45].
- Read Length: Use 2×100 bp or 2×150 bp paired-end reads to optimize both mapping accuracy and junction detection [10].
Bioinformatic Processing and Analysis
- Quality Control and Trimming: Assess raw read quality with FastQC. Perform adapter trimming and quality filtering using Trimmomatic, Cutadapt, or BBDuk, retaining only reads with Phred score >20 and length >50 bp [10].
- Alignment and Quantification: For human studies, the STAR aligner with GENCODE comprehensive gene annotation is recommended. For expression quantification, featureCounts or HTSeq-count provide robust gene-level counts [10].
- Normalization and Differential Expression: Apply TMM (trimmed mean of M-values) normalization for cross-sample comparison. For differential expression, DESeq2 or edgeR are well-validated methods that account for biological variability and sequence depth differences [10].
qPCR Validation Phase Protocol
Candidate Gene Selection
- Target Identification: Select top differentially expressed candidates from RNA-seq analysis, prioritizing based on statistical significance (adjusted p-value), fold-change magnitude, and biological relevance [17].
- Reference Gene Selection: Identify stable reference genes using specialized tools like GSV (Gene Selector for Validation), which applies multiple criteria: expression in all samples, standard deviation of log2(TPM) <1, absence of outlier expression (>2× average log2 expression), average log2 expression >5, and coefficient of variation <0.2 [17]. Avoid traditional housekeeping genes (e.g., GAPDH, ACTB) without stability verification [17].
Assay Design and Optimization
- Primer/Probe Design: Design amplicons spanning exon-exon junctions to avoid genomic DNA amplification. For SYBR Green, ensure primer specificity with melt curve analysis. For TaqMan, design probes with 5' reporter dye and 3' quencher [46].
- Validation and Efficiency Testing: Test all assays for amplification efficiency using serial dilutions of cDNA. Accept only assays with efficiency between 90-105% (R² > 0.990). Verify specificity via gel electrophoresis or melt curve analysis [46].
qPCR Execution and Data Analysis
- Reaction Setup: Perform technical duplicates or triplicates in 96- or 384-well plates. Include no-template controls for each assay and inter-run calibrators for plate-to-plate normalization.
- Thermocycling Conditions: Standard conditions: 50°C for 2 min, 95°C for 10 min, followed by 40 cycles of 95°C for 15 sec and 60°C for 1 min (adjust annealing temperature as needed) [46].
- Data Analysis: Calculate quantification cycles (Cq) using the algorithm provided by the instrument software. For relative quantification, use the ΔΔCq method with multiple reference genes or the global median normalization approach when many genes are assayed [10] [17].
Integrated Hybrid Workflow Implementation
The synergy between RNA-seq and qPCR creates a robust framework for gene expression analysis that leverages the strengths of both technologies. The following diagram illustrates this integrated approach:
Cross-Platform Correlation and Data Integration
Multiple studies have systematically evaluated the correlation between RNA-seq and qPCR measurements. A 2023 study focusing on HLA class I genes demonstrated moderate correlation between expression estimates from qPCR and RNA-seq (0.2 ≤ rho ≤ 0.53 for HLA-A, -B, and -C), highlighting both the agreement and technical disparities between platforms [8]. A more comprehensive 2020 benchmarking study evaluated 192 distinct RNA-seq analysis pipelines and validated findings with qPCR, establishing robust frameworks for cross-platform data integration [10].
For successful data integration:
- Normalize Across Platforms: Convert RNA-seq counts to TPM (transcripts per million) or FPKM (fragments per kilobase million) for better comparison with qPCR data.
- Account for Technical Variance: Recognize that each platform has distinct sensitivity profiles—qPCR generally excels for low-abundance transcripts, while RNA-seq provides better relative comparison across highly expressed genes.
- Statistical Reconciliation: Apply correlation analyses (Spearman correlation often performs better than Pearson due to different measurement scales) to validate the direction and magnitude of expression changes rather than absolute values.
Essential Research Reagent Solutions
Successful implementation of hybrid workflows requires carefully selected reagents and tools optimized for each technological platform.
Table 2: Essential Research Reagents for Hybrid Expression Workflows
| Reagent Category | Specific Examples | Function & Importance |
|---|---|---|
| RNA Isolation Kits | RNeasy Plus Mini Kit (Qiagen), TRIzol-based methods | High-quality RNA with genomic DNA removal; critical for both platforms [10] |
| RNA Quality Assessment | Agilent 2100 Bioanalyzer RNA kits, LabChip GX systems | RNA integrity number (RIN) assessment; essential for reproducible results [10] |
| RNA-seq Library Prep | TruSeq Stranded mRNA (Illumina), NEBNext Ultra II (NEB) | Directional RNA-seq libraries with minimal bias [10] |
| qPCR Master Mixes | TaqMan Fast Advanced, SYBR Green Master Mix | Consistent amplification with minimal background [46] |
| Reverse Transcriptase | SuperScript IV (Thermo Fisher), PrimeScript RT (Takara) | High-efficiency cDNA synthesis with full-length representation [10] |
| Reference Gene Panels | Endogenous control assays, commercially validated panels | Stable normalization standards; alternatively use tools like GSV for selection [17] |
| RNA Spike-in Controls | ERCC RNA Spike-In Mix (Thermo Fisher) | Process controls for normalization and quality assessment [45] [41] |
Critical Factors Influencing Platform Performance
Experimental and Technical Considerations
Multiple large-scale benchmarking studies have identified key factors that significantly impact data quality and cross-platform concordance:
RNA-seq Variability Sources:
- mRNA Enrichment Method: Poly-A selection versus ribosomal RNA depletion introduces substantial variation in transcript representation [41].
- Library Strandedness: Strand-specific protocols improve accuracy of transcript assignment and quantification [41].
- Sequencing Depth: Inadequate depth compromises detection of low-abundance transcripts and differential expression accuracy [45].
- Bioinformatic Pipeline: Choice of alignment tools, quantification methods, and normalization approaches significantly influences results [10] [41].
qPCR Variability Sources:
- RNA Quality: Degraded RNA disproportionately affects longer amplicons and certain transcript classes.
- Reverse Transcription Efficiency: Inconsistent cDNA synthesis introduces substantial technical variability [47].
- Amplification Efficiency: Primer sets with suboptimal efficiency (<90% or >110%) compromise accurate quantification [46].
- Reference Gene Stability: Unstable reference genes represent the most significant source of false results in qPCR studies [17].
Best Practice Recommendations
Based on multi-center benchmarking studies, the following practices optimize hybrid workflow outcomes:
For RNA-seq: Employ stranded mRNA-seq protocols with poly-A selection, target 40-50 million paired-end reads per sample, utilize STAR alignment with GENCODE annotations, and apply TPM normalization followed by DESeq2 for differential expression [10] [41].
For qPCR: Systematically identify and validate reference genes using tools like GSV software rather than relying on traditional housekeeping genes, design assays with 70-120 bp amplicons spanning exon junctions, validate amplification efficiencies (90-105%), and implement global median normalization when analyzing multiple targets [46] [17].
For Cross-Platform Integration: Focus on correlation of expression changes (fold-differences) rather than absolute expression values, prioritize candidates showing consistent direction and magnitude of change across platforms, and utilize spike-in controls where absolute quantification is required [8] [10].
The hybrid workflow combining RNA-seq for discovery and qPCR for validation represents the current gold-standard approach for robust gene expression analysis in both basic research and drug development. RNA-seq provides the unparalleled discovery power to identify novel targets and pathways across the entire transcriptome, while qPCR delivers the precision, sensitivity, and reproducibility required to validate these findings with statistical confidence.
By understanding the performance characteristics, optimal experimental conditions, and data integration strategies for both platforms, researchers can design more efficient and reliable studies. The continued development of reference materials, standardized protocols, and analysis tools—particularly those addressing the challenge of detecting subtle expression differences—will further enhance the synergy between these complementary technologies in advancing biomedical research.
In the field of molecular biology, two powerful techniques dominate gene expression analysis: quantitative polymerase chain reaction (qPCR) and RNA sequencing (RNA-seq). The choice between these methods represents a critical decision point for researchers studying differential expression, with implications for experimental design, cost, data complexity, and biological insight. While qPCR provides a highly sensitive and quantifiable method for profiling a limited number of predefined targets, RNA-seq offers an unbiased, genome-wide survey of the transcriptome [49] [50]. This guide provides an objective comparison of their performance across three key applications—gene expression profiling, biomarker discovery, and pathogen detection—framed within experimental contexts and supported by quantitative data.
The fundamental distinction lies in their approach: qPCR is a targeted technique ideal for validating and quantifying known genes, while RNA-seq is a discovery-oriented tool that captures both known and novel transcriptional events [49]. RNA-seq works by sequencing all RNA molecules in a sample, converted to complementary DNA (cDNA), using next-generation sequencing (NGS) platforms like Illumina, Element Biosciences, Nanopore, or PacBio [49]. This allows it to determine not just expression levels but also structural aspects of transcripts, such as alternative splicing, non-coding RNAs, and novel isoforms [49]. In contrast, qPCR relies on the amplification of specific cDNA targets using fluorescent probes or DNA-binding dyes, with quantification based on the cycle threshold (Ct) at which fluorescence crosses a detection threshold [51]. This core difference dictates their respective strengths and optimal applications in modern research and clinical development.
Performance Comparison in Core Applications
Gene Expression Profiling
For gene expression profiling, accuracy, reproducibility, and dynamic range are paramount. RNA-seq demonstrates superior performance in profiling degraded and low-quantity samples compared to standard microarray methods, with its effectiveness varying by library preparation protocol [50]. A comprehensive assessment of RNA-seq protocols using established human reference RNA samples found that ribosomal RNA depletion (Ribo-Zero) protocols maintain high accuracy and reproducibility even at very low input amounts (1-2 ng) for degraded RNA samples [50]. For highly degraded samples, such as those from FFPE tissues, exon capture methods (RNA Access) perform best, generating reliable data down to 5 ng input [50]. All three major protocols (poly(A) enrichment, ribosomal depletion, and exon capture) show high reproducibility (R² > 0.92) on intact RNA samples down to 10 ng input amounts [50].
However, studies directly comparing RNA-seq to qPCR for specific gene families reveal important nuances. In the challenging context of Human Leukocyte Antigen (HLA) class I gene expression, which is essential for immune function and disease outcome, a comparison of matched samples found only moderate correlation between qPCR and RNA-seq expression estimates for HLA-A, -B, and -C genes (0.2 ≤ rho ≤ 0.53) [8]. This discrepancy highlights how technical and biological factors, including the extreme polymorphism of HLA genes and the alignment challenges it creates for RNA-seq, can affect expression quantifications [8]. While RNA-seq provides a comprehensive view, its accuracy for specific, highly variable genes may not always match that of qPCR.
Table 1: Performance Comparison for Gene Expression Profiling
| Parameter | qPCR | RNA-seq |
|---|---|---|
| Throughput | Limited to pre-defined targets | Genome-wide, unbiased detection |
| Dynamic Range | >7 orders of magnitude | ~5 orders of magnitude |
| Sample Quality Requirements | High-quality RNA preferred | Adaptable to degraded samples with specialized protocols |
| Reproducibility | High (when optimized) | High (R² > 0.92) across protocols [50] |
| Accuracy for Polymorphic Genes | High for well-designed assays | Variable (e.g., HLA genes: rho = 0.2-0.53 vs qPCR) [8] |
| Cost per Sample | $2-50 [52] | >$1000 (depending on depth) [52] |
Biomarker Discovery and Validation
The biomarker development pipeline naturally leverages the complementary strengths of both technologies, with RNA-seq excelling in discovery and qPCR providing validation. RNA-seq has revolutionized cancer research by enabling the identification of differential gene expression, tumor heterogeneity, drug resistance mechanisms, and novel therapeutic targets [49]. Its ability to detect novel transcripts, including long non-coding RNAs (lncRNAs) and alternative splice variants, makes it particularly powerful for uncovering new biomarker candidates [49].
In practice, a sequential approach is often most effective. For example, in a study seeking transcriptomic biomarkers to discriminate bacterial from non-bacterial respiratory infections, researchers used RNA-seq to identify candidate genes and then validated them using qPCR [53]. They confirmed significant expression differences for 10 genes previously identified as discriminatory for bacterial lower respiratory tract infections (LRTI) [53]. Through a novel dimension reduction strategy, they selected three pathways (lymphocyte, α-linoleic acid metabolism, IGF regulation) including eleven genes as optimal markers, achieving a naïve AUC of 0.94 and cross-validated AUC of 0.86 for classifying bacterial infection [53].
A critical consideration in transitioning from RNA-seq discovery to qPCR validation is proper normalization. Unlike RNA-seq, which uses global normalization strategies (e.g., RPKM, TPM, or DESeq2), qPCR requires target-specific normalization using stable endogenous reference genes [52]. Commonly used "universal" controls like GAPDH for RNA or miR-16 for miRNA assays are often unsuitable in disease contexts due to expression variability [52]. Tools like HeraNorm help identify context-specific endogenous controls from NGS datasets to ensure reliable translation to qPCR assays [52].
For high-content screening in complex models like organoids, targeted RNA-seq methods like TORNADO-seq offer a middle ground, enabling the cost-effective ($5 per sample) monitoring of large gene signatures for detailed phenotypic evaluation in drug discovery applications [54].
Table 2: Biomarker Development Workflow: Technology Roles
| Development Stage | Primary Technology | Key Advantages | Typical Output |
|---|---|---|---|
| Discovery | RNA-seq | Unbiased transcriptome coverage; novel biomarker identification | Dozens to hundreds of candidate biomarkers |
| Verification | Targeted RNA-seq | Higher throughput; intermediate multiplexing capability | 10-50 confirmed candidates |
| Validation | qPCR/ddPCR | High sensitivity, precision, and throughput; low cost | 1-10 clinically actionable biomarkers |
| Clinical Implementation | qPCR/ddPCR | Rapid turnaround (<2 hours); regulatory approval; cost-effectiveness ($2-50 per reaction) [52] | FDA-approved in vitro diagnostics |
Pathogen Detection
In pathogen detection, sensitivity, specificity, and speed are critical performance metrics. While qPCR remains the gold standard for detecting known pathogens in clinical settings, emerging CRISPR-based technologies and advanced multiplexing approaches are pushing detection boundaries.
Traditional qPCR demonstrates sensitivity typically in the range of 0.1 × 10⁴ – 10⁵ copies/mL for pathogen detection [55]. However, this sensitivity may be insufficient for ultra-low pathogen levels in clinical samples like blood, which can contain as little as 1-2 CFU/mL [55]. This limitation contributes to the variable performance of PCR-based methods for bloodstream infections, with reported sensitivity of 43–99% and specificity of 60–100% [55].
Innovative approaches are addressing these limitations. The TCC (Target-amplification-free Collateral-cleavage-enhancing CRISPR-CasΦ) method achieves a record-low detection limit of 0.11 copies/μL, demonstrating superior sensitivity compared to qPCR [55]. This method can detect pathogenic bacteria as low as 1.2 CFU/mL in serum within 40 minutes, without requiring target pre-amplification [55].
For syndromic testing where multiple pathogens must be discriminated, new multiplexing strategies for qPCR show significant promise. Color Cycle Multiplex Amplification (CCMA) dramatically increases the number of detectable DNA targets in a single qPCR reaction using standard instrumentation [56]. Unlike traditional multiplexing limited by spectral overlap of fluorophores, CCMA uses fluorescence permutations across cycles, theoretically allowing detection of up to 136 distinct DNA targets with 4 fluorescence channels [56]. In a clinical demonstration, a single-tube qPCR assay screened 21 sepsis-related bacterial DNA targets with 89% clinical sensitivity and 100% clinical specificity [56].
RNA-seq also contributes to pathogen detection through host response profiling rather than direct pathogen identification. By analyzing the host's transcriptional response to infection, researchers can discriminate between bacterial and viral infections, even when direct pathogen detection is challenging [53].
Table 3: Pathogen Detection Technologies Comparison
| Technology | Detection Principle | Sensitivity | Turnaround Time | Multiplexing Capacity | |
|---|---|---|---|---|---|
| Standard qPCR | Target amplification with fluorescent detection | 0.1 × 10⁴ – 10⁵ copies/mL [55] | <2 hours | Limited (4-6 targets with standard instruments) | |
| Blood Culture | Microbial growth | 1-2 CFU/mL (but requires sufficient growth) | 3-7 days | Limited | N/A |
| CRISPR-CasΦ (TCC) | CRISPR-mediated collateral cleavage | 0.11 copies/μL [55] | 40 minutes | Limited (currently) | |
| CCMA qPCR | Fluorescence permutation across cycles | Comparable to standard qPCR | <2 hours | High (theoretically up to 136 targets with 4 colors) [56] | |
| RNA-seq Host Response | Host transcriptome profiling | Varies by pathogen | 1-2 days (including library prep) | Genome-wide |
Experimental Protocols and Methodologies
RNA-seq Workflow for Gene Expression Profiling
The standard RNA-seq workflow begins with RNA extraction from biological samples, followed by quality assessment. Library preparation then follows one of three main strategies: (1) Poly(A) + enrichment using oligo-dT coated beads to capture polyadenylated RNAs; (2) Ribosomal RNA depletion using capture probes to remove abundant rRNAs; or (3) Exon capture using probes targeting known exons [50]. The choice depends on sample quality and research goals. For intact RNA, poly(A) enrichment is standard; for degraded samples, ribosomal depletion performs better; for highly degraded material (e.g., FFPE), exon capture is most effective [50].
After library preparation, samples are sequenced on NGS platforms. For gene expression analysis, a depth of 20-50 million reads per sample is typically sufficient. The resulting reads are then aligned to a reference genome using tools like TopHat, and expression values are summarized using software like HTSeq [53]. Normalization methods such as Conditional Median normalization or DESeq2's median-of-ratios approach are applied to account for technical variability [53].
Diagram 1: RNA-seq Experimental Workflow
qPCR Experimental Protocol and Data Analysis
For qPCR analysis, the workflow begins with RNA extraction and reverse transcription to cDNA. Critical steps include careful primer design and validation, with efficiency typically required to be between 85-110% [51]. Efficiency is calculated using serial dilutions of a known template amount, with the formula: Efficiency (%) = (10^(-1/slope) - 1) × 100 [51].
Data analysis employs either absolute or relative quantification. Absolute quantification determines the exact copy number of a target using a standard curve, while relative quantification compares expression between samples using a reference gene [51]. The Livak method (2^(-ΔΔCt)) is commonly used for relative quantification when PCR efficiencies are between 90-100% [51]. This involves calculating ΔCt values (Cttarget - Ctreference) for both treatment and control samples, then comparing these ΔCt values to determine fold changes [51].
Proper normalization is critical, requiring the selection of stable endogenous controls validated for the specific experimental context [52]. Common reference genes like GAPDH or ACTB may show variability under certain conditions, potentially compromising results.
Diagram 2: qPCR Experimental Workflow
The Scientist's Toolkit: Essential Research Reagents and Solutions
Table 4: Essential Research Reagents and Solutions
| Reagent/Solution | Function | Application Notes |
|---|---|---|
| Tempus Blood RNA Tubes | RNA stabilization during blood collection | Preserves RNA integrity for transcriptomic studies [53] |
| Globin Reduction Kits | Removal of globin mRNA from blood samples | Reduces background in blood transcriptome studies [53] |
| TruSeq Stranded mRNA Kit | Poly(A) + RNA library preparation | Ideal for intact RNA samples; standard for mRNA sequencing [50] |
| TruSeq Ribo-Zero Kit | Ribosomal RNA depletion | Superior for degraded samples; maintains performance down to 1-2 ng input [50] |
| TruSeq RNA Access Kit | Exon capture-based library prep | Optimal for highly degraded samples (e.g., FFPE) [50] |
| TaqPath ProAmp Master Mix | qPCR amplification chemistry | Used in advanced multiplexing applications like CCMA [56] |
| CRISPR-CasΦ System | Nucleic acid detection without pre-amplification | Enables ultra-sensitive detection (0.11 copies/μL) [55] |
| HeraNorm Tool | Identification of stable endogenous controls | Selects optimal reference genes for qPCR from RNA-seq data [52] |
The choice between qPCR and RNA-seq for gene expression analysis is not a matter of superiority but of appropriate application. RNA-seq provides an unparalleled discovery platform for comprehensive transcriptome characterization, while qPCR offers precision, speed, and cost-efficiency for targeted quantification.
For discovery-phase research, biomarker identification, and studies requiring an unbiased view of transcriptome complexity, RNA-seq is indispensable. Its ability to detect novel transcripts, alternative splicing, and non-coding RNAs, combined with decreasing costs, has made it the foundation of modern transcriptomics. However, researchers must carefully consider library preparation methods based on sample quality and experimental goals.
For validation studies, clinical implementation, and applications requiring rapid, sensitive quantification of known targets, qPCR remains the gold standard. Recent advances in multiplexing capabilities and the emergence of CRISPR-based detection methods continue to expand its utility while maintaining the cost-effectiveness and accessibility essential for clinical translation.
The most successful research strategies often leverage both technologies in a complementary workflow: using RNA-seq for initial discovery and qPCR for validation and translation to clinical applications. This integrated approach maximizes the strengths of each technology while mitigating their respective limitations, providing a powerful framework for advancing gene expression research from basic science to clinical implementation.
In the field of differential expression research, the choice between quantitative polymerase chain reaction (qPCR) and RNA sequencing (RNA-Seq) is a fundamental decision that balances experimental goals, technical capabilities, and financial constraints. While qPCR has long been the gold standard for targeted gene expression analysis, RNA-Seq offers a comprehensive, genome-wide view of the transcriptome. The economics of these technologies have evolved significantly, with RNA-Seq costs decreasing dramatically in recent years, making it accessible for a broader range of applications [48]. This guide provides an objective comparison of qPCR and RNA-Seq performance and economics to help researchers, scientists, and drug development professionals select the most appropriate method for their differential expression studies.
Technology Fundamentals
qPCR is a highly sensitive, targeted technique that measures the expression of a predefined set of genes through fluorescent detection of amplified cDNA. It remains the gold standard for validation studies due to its precision, sensitivity, and reproducibility [8] [11]. In contrast, RNA-Seq is a high-throughput sequencing approach that enables comprehensive quantification of transcriptomes at a genome-wide scale without requiring prior knowledge of gene sequences [57]. It can detect novel transcripts, splice variants, gene fusions, and non-coding RNAs, providing an unbiased view of the transcriptome.
Current Market Landscape
The global RNA analysis market continues to expand rapidly, demonstrating the growing importance of transcriptomic technologies. The market was valued at approximately $5.02 billion in 2024 and is projected to reach $7.84 billion by 2030, rising at a compound annual growth rate (CAGR) of 7.71% [58]. Within this market, RT-qPCR currently dominates with approximately 30% revenue share in 2024, while single-cell RNA-Seq represents the fastest-growing segment [59]. This growth is driven by technological advancements that have made RNA analysis more precise, affordable, and accessible, alongside increasing demand for personalized diagnostics and targeted therapies.
Economic Breakdown: Cost Structures and Comparisons
RNA-Seq Cost Components
The cost structure for RNA-Seq has multiple components, with library preparation now often representing the most expensive step rather than sequencing itself [60]. The table below provides a detailed breakdown of current RNA-Seq costs using different library preparation methods on Illumina's NovaSeq platform.
Table 1: Detailed Cost Breakdown for mRNA-seq (per sample, using NovaSeq S4 flow cell at full capacity)
| Cost Component | Illumina TruSeq | NEBnext Ultra II | Lexogen QuantSeq-Pool | Alithea BRB-seq |
|---|---|---|---|---|
| RNA Extraction | $6.3 - $11.2 | $6.3 - $11.2 | $6.3 - $11.2 | $6.3 - $11.2 |
| Library Prep | $68.7 | $41.3 | $43.8 | $24.0 |
| Sequencing | $36.9 | $25.9 | $4.6 | $4.6 |
| Data Analysis | ~$2.0 | ~$2.0 | ~$2.0 | ~$2.0 |
| Total Cost | $113.9 | $75.5 | $56.7 | $36.9 |
Source: Adapted from Alithea Genomics [60]
Cost-saving strategies such as Bulk RNA Barcoding and sequencing (BRB-seq) significantly reduce expenses by implementing early barcoding and pooling of samples, requiring only one subsequent library preparation [60]. For standard mRNA-seq experiments, current costs range from approximately $36.9 to $173 per sample, depending on the library preparation method and sequencing depth [60].
qPCR and RNA-Seq Economic Comparison
The economic relationship between qPCR and RNA-Seq depends heavily on the scale of the study—specifically, the number of genes targeted and the number of samples analyzed.
Table 2: Economic Break-even Analysis Between qPCR and RNA-Seq
| Factor | qPCR | RNA-Seq |
|---|---|---|
| Optimal Use Case | Targeted analysis of known genes (<50) | Transcriptome-wide discovery, splice variants, novel transcripts |
| Key Economic Driver | Cost per gene assay | Library preparation and sequencing depth |
| Typical Sample Throughput | 1-3 days for small gene sets | 3-4 days hands-on time |
| Break-even Consideration | More economical for studies targeting few genes | Economical when interest extends to >50 genes or discovery |
| Additional Cost Factors | Primer/probe design and validation | Bioinformatics infrastructure and expertise |
Source: Compiled from multiple sources [48] [60] [11]
Recent analyses indicate that RNA-Seq has become so cost-effective that it must be considered even when researchers are interested in the expression levels of only a fraction of the transcriptome [48]. The break-even point where RNA-Seq becomes economically favorable depends on the number of genes and samples, with one study specifically calculating this threshold to guide methodology selection [48].
Performance Comparison and Experimental Considerations
Technical Performance Benchmarks
A systematic benchmarking study across 45 laboratories revealed significant variations in detecting subtle differential expression using RNA-Seq [41]. This large-scale assessment found that experimental factors including mRNA enrichment and strandedness, along with each bioinformatics step, emerge as primary sources of variation in gene expression measurements. When comparing expression estimates between qPCR and RNA-Seq for HLA class I genes, researchers observed only moderate correlation (0.2 ≤ rho ≤ 0.53), highlighting technical and biological factors that must be accounted for when comparing quantifications from different techniques [8].
Experimental Design Considerations
For RNA-Seq experiments, careful experimental design is crucial for obtaining reliable results. Key considerations include:
- Biological Replicates: While three replicates per condition is often considered the minimum standard, this may not be sufficient when biological variability within groups is high. Increasing replicates improves power to detect true differences in gene expression [57].
- Sequencing Depth: For standard differential gene expression analysis, approximately 20-30 million reads per sample is often sufficient, though this requirement can be reduced to 5 million reads when using 3' mRNA-seq multiplexing methods [60] [57].
- Sample Quality: RNA-Seq generally requires high-quality RNA, whereas alternative technologies like NanoString perform better with degraded or FFPE-preserved samples [11].
Methodologies and Workflows
RNA-Seq Experimental Workflow
The RNA-Seq workflow involves multiple standardized steps from sample preparation to data analysis, each requiring specific quality control checkpoints.
Figure 1: RNA-Seq Data Analysis Pipeline. This workflow illustrates the key steps in RNA-Seq data analysis, from raw sequencing files to functional interpretation, including quality control checkpoints at multiple stages.
qPCR Experimental Workflow
The qPCR workflow for gene expression validation requires careful attention to reference gene selection and reaction optimization.
Figure 2: qPCR Workflow for Gene Expression Analysis. This diagram outlines the key steps in qPCR-based gene expression analysis, highlighting the importance of proper reference gene selection and reaction optimization.
Reference Gene Selection Methodology
Proper reference gene selection is critical for accurate qPCR validation. The "Gene Selector for Validation" (GSV) software implements a systematic approach to identify optimal reference genes from RNA-seq data based on the following criteria [17]:
- Expression Filter: Expression greater than zero in all libraries analyzed
- Variability Filter: Standard variation of log2(TPM) smaller than one
- Expression Consistency: No exceptional expression in any library (at most twice the average of log2 expression)
- Expression Level: Average of log2 expression above five
- Coefficient of Variation: Less than 0.2
This methodology helps eliminate traditionally used housekeeping genes that may not be ideal for specific biological contexts, thereby reducing errors in RT-qPCR quantification [17].
Essential Research Reagents and Materials
Successful implementation of either qPCR or RNA-Seq workflows requires specific reagent solutions and laboratory materials. The following table outlines key components for both technologies.
Table 3: Essential Research Reagent Solutions for qPCR and RNA-Seq
| Category | Specific Product/Kit | Function/Application | Technology |
|---|---|---|---|
| RNA Extraction | TRIzol Reagent | Solvent-based RNA extraction from cells/tissues | Both |
| QIAgen RNeasy Kit | Silica-based column purification of RNA | Both | |
| RNA Quality Control | Bioanalyzer RNA-6000-Nano | Assessment of RNA Integrity Number (RIN) | Both |
| Library Preparation | Illumina TruSeq Stranded mRNA | mRNA selection and library prep for transcriptome-wide RNA-Seq | RNA-Seq |
| NEBnext Ultra II RNA | Library preparation with reduced cost | RNA-Seq | |
| Lexogen QuantSeq | 3' mRNA-seq with barcoding for pooling | RNA-Seq | |
| Alithea MERCURIUS BRB-seq | Ultra-affordable library prep via bulk RNA barcoding | RNA-Seq | |
| qPCR Reagents | SYBR Green Master Mix | Intercalating dye for qPCR detection | qPCR |
| TaqMan Probes & Master Mix | Sequence-specific fluorescent probes | qPCR | |
| Bioinformatics Tools | FastQC, MultiQC | Quality control of raw sequencing data | RNA-Seq |
| STAR, HISAT2 | Read alignment to reference genome | RNA-Seq | |
| DESeq2, edgeR | Differential expression analysis | RNA-Seq | |
| GSV Software | Reference gene selection from RNA-seq data | qPCR |
Source: Compiled from multiple sources [60] [57] [17]
The choice between qPCR and RNA-Seq for differential expression research involves careful consideration of multiple factors including research objectives, sample characteristics, analytical requirements, and budget constraints. While qPCR remains unmatched for precision in targeted studies and validation work, RNA-Seq offers unparalleled comprehensiveness for discovery-phase research. The economic landscape has shifted significantly, with RNA-Seq costs decreasing to the point where it can be cost-effective even for studying a modest number of genes. As sequencing technologies continue to evolve and costs decline further, RNA-Seq is positioned to become increasingly accessible for routine applications, though qPCR will maintain its vital role for focused, hypothesis-driven expression analysis. By aligning methodological choices with specific research questions and constraints, scientists can optimize both the economic and scientific returns on their investment in gene expression analysis.
Optimization & Troubleshooting: Ensuring Data Accuracy and Reproducibility
In the field of differential expression research, the choice between quantitative PCR (qPCR) and RNA sequencing (RNA-seq) is fundamental. While RNA-seq provides an unbiased, genome-wide snapshot of the transcriptome, qPCR remains the gold standard for sensitive, targeted validation of a limited number of genes [61]. However, the reliability of qPCR data is entirely dependent on the meticulous optimization of the experimental workflow. Researchers frequently encounter three major pitfalls: low yield, non-specific amplification, and high variation in Ct (threshold cycle) values. This guide objectively compares qPCR performance with RNA-seq, providing structured experimental data and protocols to help scientists identify, troubleshoot, and overcome these critical challenges, thereby ensuring the generation of robust and reproducible data.
Part 1: qPCR vs. RNA-Seq — A Technical and Performance Comparison
The fundamental differences between qPCR and RNA-seq begin at the level of workflow and underlying principle. The following diagram illustrates the key stages of each method.
Quantitative Performance Benchmarking
While RNA-seq is a powerful discovery tool, studies benchmarking it against qPCR reveal important nuances in quantitative accuracy. The following table summarizes key findings from a large-scale validation study.
Table 1: Correlation of Gene Expression Measurements Between qPCR and RNA-Seq
| Metric | qPCR vs. Tophat-HTSeq | qPCR vs. Kallisto | qPCR vs. Salmon | Notes |
|---|---|---|---|---|
| Expression Correlation (R²) | 0.827 | 0.839 | 0.845 | Pearson correlation of expression intensities from MAQCA/MAQCB samples [5]. |
| Fold Change Correlation (R²) | 0.934 | 0.930 | 0.929 | Pearson correlation of gene expression fold changes between MAQCA and MAQCB samples [5]. |
| Non-Concordant Genes | 15.1% | 17.3% | 19.4% | Percentage of genes with disagreeing differential expression status (DE vs. non-DE) between methods [5]. |
A specific study on HLA class I genes found a moderate correlation (0.2 ≤ rho ≤ 0.53) between expression estimates from qPCR and RNA-seq, highlighting the challenges of quantifying extremely polymorphic genes with short-read sequencing technologies [8].
Comparative Applications and Limitations
Choosing the right technology depends heavily on the research question.
Table 2: Strategic Choice Between qPCR and RNA-Seq
| Factor | qPCR | RNA-Seq |
|---|---|---|
| Number of Targets | Ideal for a low number of pre-defined genes [61]. | Ideal for whole-transcriptome, unbiased analysis [61]. |
| Throughput | High-throughput for many samples, limited targets. | High-throughput for many targets, limited samples. |
| Sequence Requirement | Requires prior sequence knowledge for primer/probe design [61]. | No prior sequence knowledge needed; enables gene discovery [61]. |
| Quantitative Dynamic Range | Very high, capable of detecting very low copy numbers. | Broad, but can be less sensitive for extremely low-abundance transcripts. |
| Multiplexing Capability | Limited (typically 2-6 targets per reaction with probe-based multiplexing). | Virtually unlimited. |
| Technical Complexity & Cost | Lower cost, simpler data analysis. | Higher cost per sample, requires advanced bioinformatics expertise [61]. |
| Common Use Cases | Validation of RNA-seq hits, time-series experiments, diagnostic assays [61]. | Discovery of novel transcripts, splice variants, and global expression profiling [61]. |
Part 2: Deep Dive into qPCR Pitfalls and Proven Solutions
Pitfall 1: Non-Specific Amplification
Non-specific amplification is the generation of non-target PCR products, which compete with the target amplicon and lead to inaccurate quantification [62].
- Recognition: On an agarose gel, this appears as multiple unexpected bands, a ladder-like pattern, or a smear, instead of a single discrete band at the expected size [62].
- Root Causes:
- Suboptimal Primer Design: Primers with low melting temperature (Tm), complementary sequences (leading to primer-dimers), or that bind to non-target sequences [63] [62].
- Low Annealing Temperature: Allows primers to bind to sequences with partial complementarity [62].
- Excessive Template or Primer Concentration: Increases the chance of mis-priming and primer-dimer formation [62].
- Solutions and Experimental Protocols:
- In Silico Design Checks: Design primers with a Tm of 58–60°C and ensure both primers are within 1°C of each other. The probe Tm should be ~10°C higher [63]. Use BLAST to check for specificity and avoid low-complexity regions [63].
- Optimize Thermal Cycling: Perform a temperature gradient PCR to determine the optimal annealing temperature that maximizes specific product yield.
- Use Hot-Start Polymerase: This prevents polymerase activity during reaction setup, reducing non-specific amplification and primer-dimer formation [62].
- Titrate Reagents: Lower primer concentrations (e.g., 50-900 nM) can reduce primer-dimer formation without significantly impacting specific yield [64].
Pitfall 2: Low Yield/No Amplification
A weak or absent signal compromises the entire experiment and is often a multi-factorial problem.
- Recognition: A high Ct value (e.g., >35) or no Ct value at all in a qPCR run [65].
- Root Causes:
- Degraded RNA: The most common cause. RNA is highly labile and susceptible to RNases [66].
- Inefficient Reverse Transcription: The initial cDNA synthesis step is a major source of failure. Using oligo-dT primers for long transcripts can lead to 5' bias and incomplete cDNA [66].
- PCR Inhibitors: Carryover of salts, alcohols, or proteins from the nucleic acid extraction process can inhibit the polymerase [62] [64].
- Solutions and Experimental Protocols:
- Ensure RNA Integrity:
- Optimize Reverse Transcription:
- Check for Inhibitors:
- Dilute the template DNA/cDNA 1:10 and re-run the qPCR. A significant drop in Ct suggests the presence of inhibitors.
- Use a SPUD assay to test for the presence of PCR inhibitors in the sample preparation.
Pitfall 3: High Ct Value Variation
High variation between technical replicates (high standard deviation of Ct) indicates poor precision and makes fold-change calculations unreliable.
- Recognition: Large standard deviation in Ct values among replicate reactions.
- Root Causes:
- Inconsistent Baseline/Threshold Setting: Improper data analysis is a major contributor. The baseline must be set in the early cycles where the signal is flat, and the threshold must be in the linear, exponential phase of amplification for all samples [67].
- Pipetting Inaccuracy: Small volumetric errors in pipetting master mix, primers, or template are magnified over 40 cycles.
- Inconsistent Template Quality or Quantity: Using RNA/cDNA of variable quality or inaccurate quantification between samples.
- Solutions and Experimental Protocols:
- Correct Data Analysis Workflow:
- Baseline Correction: Set the baseline from cycles where the fluorescence signal is flat, typically between cycles 3-15, avoiding the initial cycles with stabilization artifacts [67].
- Threshold Setting: Set the threshold within the exponential phase of all amplification plots. When viewed on a log-scale Y-axis, this phase appears as parallel lines. The ΔCq between samples is unaffected by the absolute threshold position as long as it is set in this parallel region [67].
- Master Mix Aliquoting: Prepare a single, large master mix for all replicates and controls to minimize pipetting error and ensure reaction consistency.
- Normalize to a Reference Gene: Use the 2^(-ΔΔCt) method to normalize the Ct of the gene of interest (GOI) to a stably expressed reference gene (Ref) and then to a control condition [68]. This corrects for well-to-well variations in RNA input and reverse transcription efficiency. The formula is: Relative Quantity (RQ) = 2^-((CtGOI,test - CtRef,test) - (CtGOI,control - CtRef,control)) [68].
- Correct Data Analysis Workflow:
Part 3: The Scientist's Toolkit — Essential Reagents and Protocols
Research Reagent Solutions
The following table details key materials required for a robust, probe-based qPCR assay.
Table 3: Essential Reagents for Probe-Based qPCR Assays
| Reagent / Material | Function / Role | Recommended Specification / Notes |
|---|---|---|
| Primers | Define the start and end of the target amplicon. | Tm 58-60°C, within 1°C of each other. Avoid self-complementarity. Working stock: 10-100 µM [63]. |
| TaqMan Probe | Sequence-specific detection via fluorescence. | Tm ~10°C higher than primers. Quencher and reporter dyes must be compatible with the instrument. Working stock: 2-10 µM [63]. |
| TaqMan Universal Master Mix II | Provides optimized buffer, dNTPs, and hot-start DNA polymerase. | Use a commercial master mix for robustness. Ensures consistent 90%-110% PCR efficiency [64]. |
| RNase Inhibitor | Protects RNA templates from degradation during reverse transcription. | Essential for high-quality cDNA synthesis. Included in most commercial RT kits [66]. |
| Nuclease-Free Water | Solvent for reactions. | Must be certified nuclease-free to prevent degradation of primers, probes, and template [66]. |
Standardized qPCR Experimental Protocol
A detailed methodology for a TaqMan-based qPCR assay as recommended for regulatory studies [64].
- Reaction Setup (50 µL final volume):
- Template DNA: Up to 1000 ng of sample DNA (or cDNA).
- Primers: Forward and Reverse, each at up to 900 nM.
- Probe: Up to 300 nM.
- Master Mix: 1X concentration of a commercial TaqMan master mix.
- Water: Nuclease-free water to volume.
- qPCR Cycling Conditions on a QuantStudio 7 Flex instrument:
- Enzyme Activation: 95°C for 10 minutes (1 cycle).
- Amplification: 95°C for 15 seconds (denaturation) followed by 60°C for 30-60 seconds (annealing/extension) for 40 cycles [64].
- Data Analysis:
qPCR remains an indispensable tool for targeted gene expression analysis, especially for validating findings from discovery-driven RNA-seq studies. Its superior sensitivity and affordability for a low number of targets are countered by its limited scope and susceptibility to technical pitfalls. Success in qPCR is not automatic; it demands rigorous attention to detail at every step—from RNA integrity and precise primer design to consistent data analysis. By understanding the common pitfalls of low yield, non-specific amplification, and Ct variation, and by implementing the detailed troubleshooting protocols and best practices outlined in this guide, researchers can ensure their qPCR data is both robust and reliable, thereby solidifying the conclusions of their differential expression research.
In the field of differential expression research, quantitative polymerase chain reaction (qPCR) and RNA sequencing (RNA-seq) serve as fundamental yet complementary technologies. RNA-seq provides an unbiased, genome-wide overview of the transcriptome, enabling the discovery of novel transcripts and complex splicing variants [69] [70]. However, its workflow involves complex computational steps, and performance varies significantly across laboratories, especially when detecting subtle differential expression [41] [8]. In contrast, qPCR offers unparalleled sensitivity, specificity, and cost-effectiveness for validating a limited number of targets, making it the gold standard for confirmatory studies [71] [72]. The reliability of qPCR data, however, is profoundly dependent on optimal primer design, a process complicated by the widespread occurrence of single nucleotide polymorphisms (SNPs). With the human genome containing a SNP approximately every 22 bases, ignoring these variations during assay design risks primer binding inefficiency, allele dropout, and ultimately, inaccurate biological conclusions [73]. This guide explores how strategically leveraging SNP information transforms primer design from a potential source of error into a powerful tool for enhancing assay specificity and efficiency.
The SNP Challenge in qPCR Assay Design
The Pervasiveness of SNPs
The exponential growth in cataloged sequence data, driven by next-generation sequencing (NGS), has revealed a remarkably high frequency of SNPs across model organisms. As detailed in Table 1, these genetic variations are a common feature in genomes, making it virtually impossible to completely avoid them when designing primers and probes [73].
Table 1: SNP Frequency in Common Model Organisms
| Species | refSNP (million) | Genome Size (bp) | SNPs per Base |
|---|---|---|---|
| Homo sapiens (human) | 154.2 | 3.40 x 10⁹ | 1 in 22 |
| Bos taurus (cow) | 100.2 | 3.62 x 10⁹ | 1 in 36 |
| Mus musculus (mouse) | 80.4 | 3.23 x 10⁹ | 1 in 40 |
| Sus scrofa (pig) | 60.4 | 3.13 x 10⁹ | 1 in 52 |
| Drosophila melanogaster (fruit fly) | 5.2 | 0.176 x 10⁹ | 1 in 34 |
Impact of SNPs on qPCR Performance
The presence of a SNP within a primer or probe binding site can destabilize hybridization through a reduction in melting temperature (Tm), which can fall by as much as 5–18°C [73]. The impact on qPCR results is highly dependent on the position and nature of the mismatch:
- Positional Effects: Mismatches closest to the 3' end of a primer have the most dramatic effect on amplification. A mismatch at the terminal 3' base can alter the quantification cycle (Cq) by as much as 5–7 cycles—equivalent to a 32- to 128-fold difference in calculated template quantity [73].
- Base Composition Effects: Purine/purine and pyrimidine/pyrimidine mismatches (e.g., A/G and C/C) at the 3' terminal position produce the largest Cq shifts compared to perfect matches [73].
- Cumulative Effects: The reduction in Tm and shift in Cq are exacerbated when SNPs are present in both forward and reverse primers or when more than one mismatch occurs within a single primer [73].
These effects can lead to inefficient amplification, allele dropout, and a significant underestimation of gene expression or copy number, ultimately compromising the integrity of differential expression data [73] [74].
Mastery in Practice: A Workflow for SNP-Aware Primer Design
Implementing a rigorous, SNP-aware design workflow is critical for developing robust qPCR assays. The following diagram and subsequent protocol outline this process.
Figure 1: A recommended workflow for designing SNP-aware qPCR assays to ensure specificity and efficiency.
Experimental Protocol: Designing a SNP-Resilient qPCR Assay
Step 1: Identify SNPs in Your Target Sequence
- Procedure: Perform a BLAST search of your target sequence. On the BLAST results page, navigate to the "Graphics" view under the "Alignments" section. Enable the "Variation" track to visualize known SNP positions along your sequence [73].
- Alternative: If the Reference SNP cluster ID (rs number) is known, query the NCBI dbSNP database directly for detailed information [73].
Step 2: Evaluate SNP Relevance
- Procedure: For each identified SNP, check its minor allele frequency (MAF) in the population relevant to your study. A SNP with a very low MAF may not warrant a design change, whereas a common SNP requires attention [73].
Step 3: Primer and Probe Design with SNP Positioning
- Procedure: Using primer design software (e.g., NCBI Primer-BLAST), design primers that flank your target amplicon.
- Key Consideration: If a SNP cannot be avoided in the primer sequence, strategically position it toward the 5' end of the primer. Mismatches located more than 5 nucleotides from the 3' end have a significantly reduced impact on polymerase extension efficiency [73].
- Probe Design: If a SNP underlies a probe sequence, use a tool like the IDT OligoAnalyzer to predict the Tm of the mismatched probe and ensure it remains within a viable range for your assay [73].
Step 4: In silico Validation
- Procedure: Use tools like OligoAnalyzer to check for potential hairpin formation and primer-dimer artifacts. Finally, use Primer-BLAST to perform a specificity check against the appropriate nucleotide database to ensure your primers will amplify only the intended target [75].
Step 5: Wet-Lab Validation and Normalization
- Procedure: Validate all primer sets experimentally using a standard qPCR dilution series to determine amplification efficiency.
- Normalization Strategy: For accurate differential expression analysis, normalize your qPCR data using stable reference genes. A recent study in canine tissues found that using the global mean (GM) of the expression of all tested genes was the best-performing normalization method when profiling large sets of genes (>55). For smaller gene sets, using multiple stable reference genes (e.g., RPS5, RPL8, HMBS) is recommended [71]. The traditional 2−ΔΔCT method is often outperformed by ANCOVA, which offers greater statistical power and robustness against variability in amplification efficiency [72].
qPCR vs. RNA-Seq: A Data-Driven Comparison for Differential Expression
The choice between qPCR and RNA-seq is dictated by the research question, scale, and required precision. Table 2 provides a comparative summary of the two technologies.
Table 2: Comparative Analysis: qPCR vs. RNA-Seq for Differential Expression Studies
| Feature | qPCR | RNA-Seq |
|---|---|---|
| Primary Role | Targeted validation of known genes; high-throughput screening of few targets [71] [8] | Discovery-driven, genome-wide profiling; novel transcript/isoform identification [69] [70] |
| Throughput | Low to medium (tens to hundreds of targets) | High (entire transcriptome) |
| Sensitivity & Dynamic Range | Very high; capable of detecting rare transcripts [74] | High, but depends on sequencing depth; can miss very low-abundance transcripts |
| Technical Variability | Low when optimized with robust normalization [71] [72] | Can be high; significant inter-laboratory variations reported, especially for subtle expression differences [41] [8] |
| SNP Handling | Requires proactive design to avoid or manage SNPs; risk of allele-specific amplification if ignored [73] | Bioinformatics pipelines can account for SNPs during alignment, but extreme polymorphism (e.g., in HLA genes) remains a challenge [8] |
| Cost & Accessibility | Lower cost per sample; widely accessible equipment | Higher cost per sample; requires specialized bioinformatics expertise [69] |
| Data Analysis | Relatively straightforward; requires validation of reference gene stability [71] [72] | Complex, multi-step pipeline; tool selection and parameters significantly impact results [41] [70] |
Key Insights from Comparative Studies:
- Correlation Between Platforms: A study on HLA class I gene expression found only a moderate correlation (0.2 ≤ rho ≤ 0.53) between expression estimates from qPCR and RNA-seq, highlighting the technical differences and challenges in cross-platform comparison [8].
- Detection of Subtle Changes: Large-scale benchmarking studies reveal that RNA-seq performance varies considerably across labs when trying to detect subtle differential expression, a scenario where a well-designed qPCR assay excels in precision [41].
- Normalization is Critical: For both technologies, normalization is a critical step. In RNA-seq, the choice of bioinformatics pipelines (alignment, quantification, and normalization tools) is a major source of variation [41] [70]. In qPCR, the use of unstable reference genes is a common pitfall that can lead to erroneous conclusions [71] [72].
Essential Research Reagent Solutions
The following reagents and tools are fundamental for implementing the protocols discussed in this guide.
Table 3: Key Research Reagents and Tools for SNP-Aware qPCR
| Reagent / Tool | Function / Description | Application Note |
|---|---|---|
| dbSNP Database | NCBI's primary repository for submitted SNPs [73]. | The first stop for identifying known variations in your target sequence before primer design. |
| Primer-BLAST | An NCBI tool that combines primer design with a BLAST search to check for specificity [75]. | Ensures primers are unique to the intended target, a cornerstone of reliable assay design. |
| OligoAnalyzer Tool | A free online tool for predicting Tm, hairpins, and dimer formation for oligonucleotides [73]. | Invaluable for predicting the impact of a SNP on a primer's or probe's melting temperature. |
| Stable Reference Genes | Endogenous genes with consistent expression across sample types (e.g., RPS5, RPL8) [71]. | Critical for accurate normalization; stability must be validated for each experimental condition. |
| High-Efficiency Polymerase | A non-proofreading DNA polymerase (e.g., Taq) for qPCR amplification [73]. | Essential for efficient amplification. Note that mismatches near the 3' end can severely impact the extension efficiency of these enzymes. |
Mastering primer design by proactively incorporating SNP information is no longer an advanced technique but a fundamental requirement for generating rigorous and reproducible qPCR data in differential expression research. While RNA-seq provides a powerful discovery platform, its results often require validation using a targeted, highly sensitive technology. qPCR fulfills this role impeccably, but only when its assays are designed to withstand the challenges posed by genomic diversity. By adopting the workflow and best practices outlined in this guide—meticulous in silico checks, strategic SNP positioning, and rigorous wet-lab validation—researchers can transform their qPCR assays into precise and reliable tools. This ensures that the conclusions drawn about gene expression are robust, thereby strengthening the foundation of drug development and biological research.
RNA sequencing (RNA-Seq) has revolutionized transcriptomics by enabling genome-wide quantification of RNA abundance with finer resolution and improved signal accuracy compared to earlier methods like microarrays [76]. However, the analysis of RNA-Seq data presents significant challenges for researchers, particularly in selecting appropriate tools and methods for trimming, alignment, and normalization. The complexity of RNA-Seq analysis demands proficiency with computational and statistical approaches to manage technical issues and large data sizes [76]. With numerous algorithms and pipelines available, researchers face daunting decisions at each step of the workflow that can significantly impact their results. This guide provides a comprehensive comparison of tools and methods based on experimental data to inform decision-making for differential expression research, positioning RNA-Seq within the broader context of alternative technologies like qPCR.
The RNA-Seq Workflow: Core Steps and Challenges
The RNA-Seq analysis pipeline typically follows a sequential workflow beginning with raw data quality control and proceeding through trimming, alignment, quantification, and normalization before culminating in differential expression analysis [76] [70]. Each stage introduces specific challenges and decision points that researchers must navigate to ensure accurate biological interpretations.
The following diagram illustrates the standard RNA-Seq analysis workflow with key decision points at each stage:
Trimming: Data Cleaning and Quality Control
The Role of Trimming in RNA-Seq Analysis
Trimming serves as a critical first step in RNA-Seq data preprocessing, aimed at removing adapter sequences and low-quality nucleotides to improve read mapping rates [10]. This process eliminates potential technical errors such as leftover adapter sequences, unusual base composition, or duplicated reads that can interfere with accurate mapping [76]. However, trimming must be applied non-aggressively with wisely chosen read length parameters to avoid unpredictable changes in gene expression and transcriptome assembly [10].
Comparative Performance of Trimming Tools
Several tools are commonly used for filtering and trimming, each with distinct advantages and limitations. A comprehensive study evaluating 192 pipelines using different tools found that the choice of trimming algorithm significantly impacts downstream results [10].
Table 1: Comparison of RNA-Seq Trimming Tools
| Tool | Strengths | Limitations | Use Case Recommendations |
|---|---|---|---|
| fastp | Rapid analysis; simple operation; significantly enhances data quality [70] | Limited customization options | Ideal for high-throughput processing where speed is essential [70] |
| Trim_Galore | Integrated workflow with Cutadapt and FastQC; generates quality control reports during trimming [70] | May cause unbalanced base distribution in tail regions [70] | Suitable for users seeking comprehensive QC during trimming [70] |
| Trimmomatic | Comprehensive parameter control; widely cited in literature [10] | Complex parameter setup; no speed advantage [70] | Recommended for experienced users requiring fine-grained control [70] |
| Cutadapt | Effective adapter removal; flexible parameters [10] | Requires separate QC analysis [70] | Best for targeted adapter removal when used as part of custom pipelines [10] |
Experimental data from fungal RNA-Seq analysis demonstrated that fastp significantly enhanced the quality of processed data, improving the proportion of Q20 and Q30 bases by 1-6% compared to original data [70]. Parameter selection for trimming should be guided by quality control reports of the original data, with particular attention to specific base positions rather than arbitrary numerical values [70].
Alignment: Mapping Reads to Reference
Alignment Fundamentals and Challenges
Alignment, or mapping, identifies which genes or transcripts are being expressed in samples by aligning cleaned reads to a reference transcriptome or genome [76]. This step is particularly challenging for eukaryotic RNA-Seq data due to the presence of splice junctions, which require "splice-aware" aligners that can recognize intron-exon boundaries. The choice of aligner affects not only mapping efficiency but also downstream variant identification, with studies showing surprisingly low concordance among aligners for features like RNA editing sites [77].
Performance Comparison of Spliced Aligners
Table 2: Comparison of RNA-Seq Alignment Tools
| Aligner | Indexing Method | Memory Requirements | Speed | Accuracy Considerations |
|---|---|---|---|---|
| STAR | Suffix array [78] | High (~30 GB for human genome) [79] | Very fast [79] | High sensitivity; excels at detecting splice junctions [79] [77] |
| HISAT2 | FM-Index with hierarchical indexing [78] | Low (~5 GB for human genome) [79] | Fast; ~3x faster than next fastest aligner [78] | Balanced speed and accuracy; competitive mapping rates [79] [78] |
| TopHat2 | FM-Index | Moderate | Slow | Largely superseded by HISAT2 [78] |
| BWA | FM-Index [78] | Low | Fast for DNA-seq | Not optimized for spliced RNA-seq alignment [79] |
Based on alignment rate and gene coverage metrics, most modern aligners perform well, with BWA showing strong performance for shorter transcripts and HISAT2 and STAR excelling for longer transcripts (>500 bp) [78]. When selecting an aligner, researchers should consider their computational resources, with HISAT2 offering the best balance for memory-constrained environments and STAR providing maximum sensitivity when sufficient RAM is available [79] [77].
Alternative approaches like pseudoalignment with Kallisto or Salmon estimate transcript abundances without full base-by-base alignment, offering dramatic speed improvements and reduced memory usage [76]. These methods are particularly well-suited for large datasets where rapid quantification is the primary goal [76] [77].
Normalization: Accounting for Technical Variability
The Critical Role of Normalization
Normalization adjusts raw counts to remove technical biases that can distort biological interpretations. Raw read counts cannot be directly compared between samples because the number of reads mapped to a gene depends not only on its expression level but also on the total number of sequencing reads obtained for that sample (sequencing depth) [76]. Samples with more total reads will naturally have higher counts, even if genes are expressed at the same level [76]. Additionally, factors like library composition and gene length must be considered in normalization approaches.
Comparative Analysis of Normalization Methods
Table 3: Comparison of RNA-Seq Normalization Methods
| Method | Sequencing Depth Correction | Gene Length Correction | Library Composition Correction | Suitable for DE Analysis |
|---|---|---|---|---|
| CPM | Yes | No | No | No [76] |
| RPKM/FPKM | Yes | Yes | No | No [76] |
| TPM | Yes | Yes | Partial | No [76] |
| TMM (edgeR) | Yes | No | Yes | Yes [76] [80] |
| RLE (DESeq2) | Yes | No | Yes | Yes [76] [80] |
| Median Ratio Normalization | Yes | No | Yes | Yes [80] |
For simple experimental designs with about two conditions and no replicates, any of the three main normalization methods (TMM, RLE, or MRN) can be used with minimal impact on results [80]. However, for more complex experimental designs, the Median Ratio Normalization (MRN) method has been shown to perform slightly better on some simulated datasets [80]. Research comparing TMM (edgeR) and RLE (DESeq2) normalization methods has shown they generally produce similar results with both real and simulated datasets [80].
Differential Expression Analysis: Tool Comparison
Statistical Foundations of Differential Expression
Differential expression (DE) analysis represents a fundamental step in understanding how genes respond to different biological conditions, enabling researchers to identify expression changes systematically across thousands of genes while accounting for biological variability and technical noise [81]. The three most widely-used tools—DESeq2, edgeR, and limma-voom—each employ distinct statistical approaches to address specific challenges in RNA-seq data [81].
Performance Comparison of DE Tools
Table 4: Comparison of Differential Expression Analysis Tools
| Aspect | DESeq2 | edgeR | limma-voom |
|---|---|---|---|
| Core Statistical Approach | Negative binomial modeling with empirical Bayes shrinkage [81] | Negative binomial modeling with flexible dispersion estimation [81] | Linear modeling with empirical Bayes moderation [81] |
| Normalization Method | Internal normalization based on geometric mean [81] | TMM normalization by default [81] | voom transformation converts counts to log-CPM values [81] |
| Ideal Sample Size | ≥3 replicates, performs well with more [81] | ≥2 replicates, efficient with small samples [81] | ≥3 replicates per condition [81] |
| Best Use Cases | Moderate to large sample sizes; high biological variability; subtle expression changes [81] | Very small sample sizes; large datasets; technical replicates [81] | Small sample sizes; multi-factor experiments; time-series data [81] |
| Computational Efficiency | Can be computationally intensive for large datasets [81] | Highly efficient, fast processing [81] | Very efficient, scales well [81] |
| Special Features | Automatic outlier detection; independent filtering; visualization tools [81] | Multiple testing strategies; quasi-likelihood options; fast exact tests [81] | Handles complex designs elegantly; works well with other high-throughput data [81] |
Extensive benchmark studies have revealed that despite their different statistical approaches, these tools show remarkable concordance in their results [81]. Limma demonstrates particular versatility and robustness across diverse experimental conditions, while DESeq2 and edgeR share many performance characteristics due to their common foundation in negative binomial modeling [81]. EdgeR tends to perform slightly better with low-expression genes where its flexible dispersion estimation better captures variability in sparse count data [81].
Experimental Design and Validation Considerations
The Importance of Experimental Design
The reliability of RNA-Seq analysis, particularly for differential expression, depends strongly on thoughtful experimental design, especially regarding biological replicates and sequencing depth [76]. While differential expression analysis is technically possible with only two replicates, the ability to estimate variability and control false discovery rates is greatly reduced [76]. Three replicates per condition is often considered the minimum standard, though this may not be universally sufficient, especially when biological variability within groups is high [76].
Sequencing depth represents another critical parameter, with approximately 20-30 million reads per sample often sufficient for standard differential expression analysis [76]. Deeper sequencing captures more reads per gene, increasing sensitivity to detect lowly expressed transcripts, but also increasing costs and computational demands [76].
Validation with qPCR
Within the context of qPCR versus RNA-Seq for differential expression research, qPCR remains the gold standard for validating RNA-Seq results due to its high sensitivity, precision, and dynamic range [11] [31]. While RNA-Seq excels in discovery and scalability, qPCR provides unmatched efficiency and precision for validating small numbers of genes [11].
A critical consideration for qPCR validation is proper normalization, as traditional housekeeping genes may not be stable across all experimental conditions [31]. Recent research demonstrates that finding a stable combination of genes, regardless of their individual stability, outperforms standard reference genes for qPCR data normalization [31]. Such optimal gene combinations can be identified using comprehensive RNA-Seq databases, enabling more accurate normalization of qPCR validation data [31].
Essential Research Reagent Solutions
Table 5: Key Research Reagents and Tools for RNA-Seq Analysis
| Category | Essential Tools/Reagents | Function/Purpose |
|---|---|---|
| Quality Control | FastQC, MultiQC [76] [77] | Assess read quality; generate aggregated QC reports |
| Trimming | fastp, Trimmomatic, Cutadapt [76] [70] | Remove adapter sequences; trim low-quality bases |
| Alignment | STAR, HISAT2 [79] [77] | Map reads to reference genome/transcriptome |
| Quantification | featureCounts, HTSeq-count, Salmon, Kallisto [76] [77] | Generate count data for genes/transcripts |
| Differential Expression | DESeq2, edgeR, limma [81] | Identify statistically significant expression changes |
| Visualization | IGV, ggplot2 [77] | Visualize aligned reads; create publication-quality plots |
Navigating the RNA-Seq pipeline requires careful consideration at each analytical step, from trimming through differential expression analysis. Tool selection should be guided by experimental goals, sample characteristics, and computational resources rather than default preferences. For trimming, fastp offers speed and quality improvements, while STAR and HISAT2 provide complementary approaches for alignment—the former for sensitivity and the latter for efficiency. Normalization should be matched to experimental complexity, with TMM, RLE, or MRN selected based on study design. Finally, DESeq2, edgeR, and limma each excel in different scenarios, with DESeq2 handling biological variability well, edgeR performing efficiently with small samples, and limma accommodating complex designs. By making informed choices at each step and validating key findings with qPCR using properly selected reference genes, researchers can maximize the reliability and biological insights gained from their RNA-Seq experiments.
The Critical Role of Endogenous Controls and Reference Genes
Accurate gene expression analysis is a cornerstone of modern biological research and drug development. Whether using the highly sensitive quantitative PCR (qPCR) or the comprehensive RNA sequencing (RNA-Seq), the selection of appropriate endogenous controls—commonly known as reference genes—is a critical methodological step that fundamentally impacts data reliability and interpretation. Reference genes serve as internal reaction controls to normalize variations arising from differences in sample quantity, RNA quality, and enzymatic efficiencies during reverse transcription and amplification processes [82]. The use of improperly validated reference genes remains a pervasive issue, with a systematic review revealing that the average number of reference genes used across studies is only 1.2, despite guidelines recommending a minimum of two validated genes [83]. This comprehensive guide examines the role, selection, and validation of endogenous controls within the broader context of choosing between qPCR and RNA-Seq for differential expression research, providing researchers with evidence-based frameworks for generating publication-quality data.
Fundamental Concepts: Endogenous Controls in Gene Expression Analysis
Definition and Purpose
Endogenous controls, or reference genes, are genes constitutively expressed at stable levels across various experimental conditions, cell types, and treatments [82]. These genes, typically involved in basic cellular functions essential for cell survival and maintenance, provide a stable baseline against which target gene expression can be normalized. In qPCR, endogenous controls correct for technical variations by accounting for differences in starting material amount, RNA integrity, and reaction efficiency [82]. The normalization process enables accurate quantification by ensuring that observed changes in target gene expression reflect biological reality rather than technical artifacts.
Consequences of Improper Normalization
The use of inappropriate reference genes can lead to significant data misinterpretation. When unstable reference genes are used for normalization, biologically relevant changes in gene expression can be obscured or exaggerated [83]. For example, normalizing against a reference gene that fluctuates under experimental conditions may cause overestimation or underestimation of true target gene expression levels [83]. This is particularly problematic in contexts where subtle expression changes have important biological implications, such as in biomarker discovery, therapeutic efficacy studies, and clinical diagnostics.
Table 1: Traditional Reference Genes and Their Potential Limitations
| Reference Gene | Full Name | Common Applications | Documented Limitations |
|---|---|---|---|
| GAPDH | Glyceraldehyde-3-phosphate dehydrogenase | Widely used in metabolic studies | Varies considerably between tissue types [82]; unstable in some viral infections and cancer studies [84] [85] |
| ACTB | Beta-actin | Cytoskeletal structure studies | Fluctuates in various tissues and disease states; different stability profiles for different gene loci [16] |
| 18S rRNA | 18S ribosomal RNA | High-abundance normalization | Often improperly used in species-specific contexts; may not reflect mRNA expression patterns [86] |
| HPRT1 | Hypoxanthine phosphoribosyl-transferase 1 | Purine metabolism studies | Showed high variability and low stability in leukemia studies [85] |
Methodological Comparison: qPCR versus RNA-Seq
qPCR and RNA-Seq represent complementary approaches with distinct strengths and limitations for gene expression analysis. qPCR remains the gold standard for targeted, high-sensitivity quantification of a small number of genes, offering rapid turnaround (1-3 days), low RNA input requirements, and exceptional sensitivity for low-abundance transcripts [11]. Its established protocols and lower cost per sample make it ideal for validation studies and focused expression profiling. However, qPCR requires prior knowledge of target sequences and lacks the discovery capability of sequencing-based methods [11].
RNA-Seq provides a comprehensive, unbiased view of the transcriptome, enabling discovery of novel transcripts, splice variants, and genetic alterations [11]. Transcriptome-wide RNA-Seq captures all RNA transcripts, while targeted panels focus on predefined gene sets associated with specific pathways or diseases. Although RNA-Seq offers broader dynamic range and discovery potential, it demands higher-quality RNA, substantial bioinformatics expertise, and greater computational and financial resources [11].
Normalization Approaches Across Platforms
While both technologies require normalization, their approaches differ significantly. qPCR relies heavily on internal reference genes for relative quantification, typically using the 2-ΔΔCT method or variations thereof [83]. In contrast, RNA-Seq employs computational normalization methods that use the entire dataset, such as TPM (transcripts per kilobase million) or similar count-based approaches [86]. Despite these methodological differences, the fundamental principle remains: accurate normalization is essential for biologically meaningful results.
Table 2: Comparison of Gene Expression Analysis Platforms
| Parameter | qPCR | RNA-Seq | NanoString |
|---|---|---|---|
| Throughput | Low to medium (1-10 genes) | High (entire transcriptome) | Medium (up to 800 genes) |
| Sensitivity | High | Variable; lower for low-abundance genes | Moderate |
| Dynamic Range | ~7-8 logs | ~5 logs [87] | Narrower than RNA-Seq [11] |
| Sample Quality Requirements | Moderate | High (RIN > 8 recommended) | Low (works well with degraded/FFPE RNA) |
| Normalization Method | Reference genes | Computational (e.g., TPM, FPKM) | Internal controls + positive spikes |
| Best Applications | Target validation, clinical assays, small studies | Discovery research, biomarker identification | Clinical research, validation studies |
| Time to Results | 1-3 days | Days to weeks (including analysis) | < 48 hours |
| Bioinformatics Demand | Low | High | Low to moderate |
Experimental Evidence: Reference Gene Performance Across Biological Contexts
Veterinary and Infectious Disease Applications
In studies of Peste des petits ruminants virus (PPRV) infection in goats and sheep, comprehensive evaluation of ten candidate reference genes across fourteen tissues revealed significant variation in expression stability [84]. HMBS and B2M emerged as the most stable reference genes in goats, while HMBS and HPRT1 were most stable in sheep, demonstrating that optimal reference genes differ even between closely related species under identical experimental conditions [84]. This study highlights the limitation of assuming universal reference gene stability and underscores the need for empirical validation in each specific context.
Oncology Research Applications
In acute leukemia research, a 2024 validation study examined six candidate reference genes in peripheral blood and bone marrow samples [85]. The analysis revealed that the combination of ACTB, ABL, TBP, and RPLP0 demonstrated stable expression across sample types, while traditional choices GAPDH and HPRT1 showed high variability and poor stability [85]. These findings have direct implications for minimal residual disease monitoring, where accurate quantification is critical for treatment decisions.
Environmental Stress Studies
Research on Japanese flounder under temperature stress demonstrated the advantage of transcriptome-derived reference genes over traditional candidates [86]. Eight candidate genes identified from RNA-Seq data (including rpl6, rpl9, and gatd1) exhibited more stable expression than conventionally used actb and 18S RNA [86]. This study illustrates how RNA-Seq can inform qPCR reference gene selection, particularly in non-model organisms where traditional references may be suboptimal.
Validation Strategies and Statistical Frameworks
Experimental Design for Validation
Proper validation of reference genes requires testing candidate genes under conditions representative of the planned study [82]. The recommended protocol includes: (1) selecting multiple candidate genes (typically 3-10) based on literature and preliminary data; (2) purifying RNA from all samples across experimental conditions using consistent methods; (3) quantifying RNA and using identical amounts for cDNA synthesis; (4) testing each candidate gene across conditions in at least triplicate qPCR reactions; and (5) assessing variability in Ct values by calculating standard deviation [82]. Candidates with the lowest standard deviation across conditions are considered most stable.
Statistical Algorithms for Stability Assessment
Several specialized algorithms have been developed to evaluate reference gene stability:
- geNorm determines the most stable genes by stepwise exclusion of the least stable gene and calculates a stability measure (M) where lower values indicate greater stability [84]. It also determines the optimal number of reference genes by pairwise variation analysis [16].
- NormFinder employs a model-based approach to estimate expression variation, identifying genes with minimal intra- and inter-group variation [84] [87].
- BestKeeper uses pairwise correlation analysis based on Ct values to identify stable genes [84] [85].
- RefFinder integrates geNorm, NormFinder, BestKeeper, and the comparative ΔCt method to provide a comprehensive ranking [84].
Recent evidence suggests that the statistical approach may be more important than the source of candidate genes. A 2022 study demonstrated that with proper statistical methodology, commonly used reference genes performed equivalently to genes pre-selected from RNA-Seq data [87].
Diagram 1: Reference Gene Validation Workflow. This diagram illustrates the stepwise process for validating reference genes, from initial candidate selection through final implementation in data normalization.
Advanced Approaches and Emerging Trends
Gene Combination Strategies
An innovative 2024 study demonstrated that a stable combination of non-stable genes can outperform individually stable reference genes for qPCR normalization [16]. This approach identifies a fixed number of genes whose individual expressions balance each other across experimental conditions. By leveraging comprehensive RNA-Seq databases, researchers can mathematically derive optimal gene combinations that exhibit superior normalization properties compared to traditional reference genes [16]. This paradigm shift emphasizes that what matters is not individual gene stability but the collective stability of the normalization factor.
RNA-Seq Informed Selection
For organisms with available RNA-Seq databases, in silico selection of reference genes provides a powerful alternative to traditional approaches. The process involves: (1) extracting expression data from a comprehensive RNA-Seq database; (2) calculating expression stability metrics (variance, coefficient of variation) for all genes; (3) applying selection criteria including detection across tissues, low variance, absence of outlier expression, and medium to high expression levels; and (4) experimental validation of top candidates [86]. This method is particularly valuable for non-model organisms where traditional reference genes may be suboptimal.
Table 3: Reference Gene Performance Across Experimental Conditions
| Biological Context | Most Stable Reference Genes | Least Stable Reference Genes | Validation Methods |
|---|---|---|---|
| PPRV Infection (Goats) | HMBS, B2M [84] | Tissue-dependent | RefFinder, RankAggreg, geNorm, NormFinder |
| PPRV Infection (Sheep) | HMBS, HPRT1 [84] | Tissue-dependent | RefFinder, RankAggreg, geNorm, NormFinder |
| Acute Leukemia (Human) | ACTB, ABL, TBP, RPLP0 [85] | GAPDH, HPRT1 [85] | NormFinder, geNorm, R software |
| Temperature Stress (Japanese Flounder) | gatd1, rpl6 [86] | actb, 18S RNA [86] | Delta-Ct, BestKeeper, geNorm, NormFinder |
| Tomato Development | Gene combinations from RNA-Seq [16] | Traditional single HKGs | geNorm, NormFinder, BestKeeper |
Laboratory Reagents and Kits
- TRIzol Reagent: For total RNA extraction from various sample types, including challenging tissues [87] [86] [85].
- DNase I Treatment: Essential for removing genomic DNA contamination prior to cDNA synthesis [86].
- Reverse Transcriptase Kits: High-capacity kits for efficient cDNA synthesis from RNA templates [85].
- SYBR Green Master Mix: For intercalating dye-based qPCR detection providing cost-effective analysis [86].
- TaqMan Gene Expression Assays: Probe-based chemistry offering superior specificity for reference gene quantification [82] [85].
- TaqMan Endogenous Control Plates: Pre-configured plates with triplicates of 32 stably expressed human genes for efficient screening [82].
Bioinformatics Tools
- RefFinder: Web-based tool that integrates four different algorithms to provide comprehensive reference gene ranking [84].
- geNorm: Module within qbase+ software that determines the optimal number of reference genes [84] [16].
- NormFinder: Excel-based tool that models variation within and between sample groups [84] [87].
- BestKeeper: Excel-based tool using pairwise correlations for stability assessment [84] [85].
- RNA-Seq Analysis Pipelines: Tools like DESeq2, edgeR, and NOISeq for differential expression analysis and reference gene identification [88].
Diagram 2: Experimental workflow for reference gene validation, depicting the process from sample preparation through final implementation in gene expression studies.
The selection and validation of appropriate endogenous controls remains a critical methodological consideration in both qPCR and RNA-Seq experiments. Rather than relying on traditionally used reference genes, researchers should adopt evidence-based approaches tailored to their specific experimental systems. Based on current evidence, the following best practices are recommended:
- Always validate reference genes for each specific experimental system and condition rather than relying on literature alone [84] [85] [83].
- Use multiple reference genes (minimum of two) and calculate normalization factors using the geometric mean of their expression values [16] [83].
- Select reference genes with expression levels similar to your target genes to avoid introducing technical artifacts [82] [16].
- Consider innovative approaches such as gene combinations that may provide superior normalization compared to individually stable genes [16].
- Leverage available RNA-Seq data when possible to identify potential candidate reference genes, particularly for non-model organisms [86] [16].
- Report validation data comprehensively, including stability values and statistical methods used, to enhance experimental reproducibility [89].
By adopting these rigorous approaches to reference gene selection and validation, researchers can significantly enhance the reliability, accuracy, and interpretability of their gene expression data, leading to more robust scientific conclusions in both basic research and applied drug development contexts.
In the landscape of gene expression analysis, quantitative polymerase chain reaction (qPCR) has maintained its status as a cornerstone technology despite the rising prominence of RNA-sequencing (RNA-seq). While RNA-seq provides an unbiased, genome-wide view of the transcriptome, qPCR offers unparalleled sensitivity, speed, and cost-efficiency for targeted expression analysis [8] [5]. The emergence of automated qPCR systems has further strengthened its position by addressing key limitations in throughput, reproducibility, and operational efficiency. For researchers and drug development professionals navigating the choice between comprehensive screening and precise, high-throughput validation, automated qPCR solutions present a compelling pathway to enhanced precision and productivity in molecular diagnostics and basic research.
This comparison guide examines currently available automation solutions for qPCR, objectively evaluating their performance against alternative methodologies and providing supporting experimental data. Framed within the broader thesis of qPCR versus RNA-seq for differential expression research, we explore how technological advancements in qPCR automation are reshaping the landscape of molecular analysis.
qPCR vs. RNA-seq: A Technical and Practical Comparison
Analytical Performance Benchmarking
Understanding the relative strengths of qPCR and RNA-seq is fundamental to selecting the appropriate tool for differential expression research. While RNA-seq has become the gold standard for whole-transcriptome analysis, benchmarking studies reveal important considerations for its application relative to qPCR.
Table 1: Performance Comparison Between qPCR and RNA-seq for Gene Expression Analysis
| Parameter | qPCR | RNA-seq | Experimental Evidence |
|---|---|---|---|
| Expression Correlation | Reference Standard | High (R²: 0.798-0.845) [5] | Comparison with whole-transcriptome qPCR for 18,080 genes [5] |
| Fold Change Correlation | Reference Standard | Very High (R²: 0.927-0.934) [5] | MAQCA/MAQCB sample comparison [5] |
| Sensitivity | Detects single copies | Lower sensitivity for low-abundance transcripts [5] | Systematic identification of inconsistent genes in RNA-seq [5] |
| Multiplexing Capacity | High (5-plex or more) [90] | Genome-wide | Simultaneous detection of EGFR, KRAS, BRAF, ALK in NSCLC [90] |
| Turnaround Time | Hours (2 min - 2 hrs) [91] [90] | Days [90] | Protocol timing from sample to results |
| Cost Per Sample | $50-$200 [90] | $300-$3,000 [90] | Cost analysis for targeted vs. comprehensive profiling |
Experimental Protocol: Cross-Platform Validation
The following methodology outlines a standard approach for validating RNA-seq findings using qPCR, a common practice in gene expression studies:
- Target Selection: Identify genes of interest from RNA-seq differential expression analysis, prioritizing those with clinical or biological significance.
- Assay Design: Design and validate sequence-specific primers and probes for each target. Multiplex assays can be developed to detect several clinically relevant mutations simultaneously, such as in non-small cell lung cancer where alterations in EGFR, KRAS, BRAF, and ALK are assessed in a single reaction [90].
- RNA Quality Control: Verify RNA integrity using appropriate methods (e.g., RIN >7).
- Reverse Transcription: Convert RNA to cDNA using reverse transcriptase with random hexamers and/or oligo-dT primers.
- qPCR Amplification: Perform amplification using a standardized protocol:
- Denaturation: 95°C for 2 minutes
- Amplification: 40 cycles of 95°C for 15 seconds and 60°C for 1 minute
- Use of inhibitor-resistant polymerases and ambient-stable master mixes is recommended for reliable results from clinical samples like plasma or FFPE tissues [90].
- Data Analysis: Calculate expression levels using the ΔΔCq method with normalization to validated reference genes.
For automated systems, the process integrates with liquid handling robots for cDNA setup and plate loading, with thermal cyclers capable of completing 30 cycles in as little as 2 minutes [91], and data analysis software that automatically processes and reports results.
Technological Advancements in qPCR Automation
Fully Automated PCR Systems
The market for fully automated PCR systems is experiencing significant growth, valued at USD 2.5 billion in 2024 and projected to reach USD 4.8 billion by 2033 [92]. These integrated systems combine liquid handling, thermal cycling, and detection capabilities to create seamless workflows with minimal manual intervention.
Table 2: Comparison of Automated qPCR System Characteristics
| Characteristic | High-Throughput Systems | Point-of-Care Systems | Ultra-Fast Systems |
|---|---|---|---|
| Sample Capacity | 96-well to 384-well plates [93] | Lower throughput, cartridge-based | 96-well and 384-well plates [91] |
| Speed | Standard to fast cycling | Medium speed | 30 cycles in 2 minutes [91] |
| Primary Applications | Large-scale screening, central labs [94] | Decentralized testing, mobile labs [93] | Rapid diagnostics, urgent testing [91] |
| Key Features | Integration with LIMS, robotic plate handling [95] | Portable, battery operation, user-friendly [93] | Minimal footprint, low energy use [91] |
| Representative Examples | Thermo Fisher, Roche, Bio-Rad systems [93] | Qiagen portable systems [93] | NextGenPCR, cyQlone [91] |
Workflow Integration and Data Management
Modern automated qPCR systems feature enhanced software integration, with touchscreen displays, automated sample loading, and connectivity with laboratory information management systems (LIMS) to streamline workflows and reduce manual errors [93]. The innovative features of systems like the Roche LightCycler PRO System utilize vapor chamber technology for enhanced temperature uniformity across the block, alongside improved software algorithms for quality, precision, and reliability [96]. These capabilities are critical for accurate patient diagnosis and effective clinical decisions.
Application Focus: qPCR Automation in Action
Clinical Diagnostics and Oncology
In cancer diagnostics, qPCR remains a foundational tool with particular strengths in early detection, molecular stratification, and personalized therapy guidance [90]. Its strong multiplexing capability allows multiple clinically relevant mutations to be detected in a single reaction, without compromising sensitivity or speed. This makes it particularly well-suited for oncology applications where actionable targets span several genes and sample material is scarce, such as in fine needle aspirates or cell-free DNA from liquid biopsies [90].
Automated qPCR systems deliver clinically actionable results within hours, compared to days for sequencing platforms [90]. This rapid turnaround is especially valuable in time-sensitive scenarios such as selecting targeted therapies or enrolling patients into mutation-driven clinical trials. The scalability and automation-friendly nature of qPCR supports high-throughput testing without the need for significant capital investment or complex infrastructure, making it suitable for a wide range of settings from centralized reference labs to hospital-based molecular laboratories [90].
Infectious Disease and Public Health
In infectious disease testing, automated qPCR systems have proven essential for rapid pathogen detection and microbial surveillance. The COVID-19 pandemic highlighted the critical need for automated, high-throughput testing systems that could deliver fast, accurate results under significant resource constraints [96]. Systems like the Roche LightCycler PRO are specifically designed to address these dynamics by offering the flexibility to switch seamlessly between research and clinical applications [96].
The rapid capabilities of ultra-fast qPCR systems are particularly valuable for public health applications. For instance, the cyQlone qPCR system can provide results in just 9 minutes, enabling rapid microbial characterization that is vital for mediating outbreak threats and guiding public health decisions [91].
The Scientist's Toolkit: Essential Reagent Solutions
Table 3: Key Research Reagent Solutions for Automated qPCR Workflows
| Reagent Type | Function | Key Characteristics | Application Notes |
|---|---|---|---|
| Inhibitor-Resistant Master Mixes | Enhances amplification efficiency in challenging samples | Engineered polymerases/buffers tolerate PCR inhibitors in plasma, blood, FFPE samples [90] | Critical for clinical matrices; enables reliable results from suboptimal samples |
| Ambient-Stable Kits | Supports reagent storage without cold chain | Lyophilized formulations stable at room temperature [90] | Ideal for decentralized testing, reduces logistics costs |
| Multiplex qPCR Assays | Simultaneous detection of multiple targets | Advanced master mixes and probe systems (FAM, ROX, Cy5, etc.) [91] [90] | Enables comprehensive profiling from minimal sample material |
| High-Sensitivity Chemistry | Detection of low-frequency variants | Consistently detects variants at <0.1% variant allele frequency [90] | Essential for liquid biopsy and early detection applications |
| Custom OEM Formulations | Tailored reagent solutions | Designed for specific automation platforms or regulatory needs [90] | Ensures optimal performance in integrated systems |
Comparative Workflow Analysis: Traditional vs. Automated qPCR
The following diagram illustrates the key differences between traditional and automated qPCR workflows, highlighting the steps where automation enhances efficiency and reduces manual intervention:
The integration of automation solutions in qPCR workflows represents a significant advancement in molecular diagnostics and research. While RNA-seq provides comprehensive transcriptome profiling, automated qPCR offers distinct advantages in speed, cost-efficiency, and practical implementation for targeted gene expression analysis. The data presented in this guide demonstrates that modern automated qPCR systems deliver exceptional precision and throughput while maintaining the sensitivity and specificity that have made qPCR a gold standard for validation.
For researchers and drug development professionals, the choice between these technologies should be guided by specific application requirements rather than perceived technological superiority. When focused, reproducible, high-throughput analysis of known targets is needed—particularly in clinical or time-sensitive contexts—today's automated qPCR solutions provide an optimally balanced approach that enhances both precision and productivity.
Validation & Concordance: Benchmarking Technologies for Reliable Results
qPCR as the Validation Gold Standard for RNA-Seq Findings
In the field of genomics research, both quantitative PCR (qPCR) and RNA sequencing (RNA-Seq) have become indispensable tools for gene expression analysis. While RNA-Seq has emerged as the premier discovery platform for whole-transcriptome profiling, qPCR maintains its critical role as the validation gold standard for confirming differential expression findings. This complementary relationship stems from their fundamental technical differences: RNA-Seq provides an unbiased, hypothesis-free approach capable of detecting novel transcripts and variants, whereas qPCR delivers highly precise, sensitive, and reproducible quantification of specific targets [3]. The continued necessity of qPCR validation is not a reflection of RNA-Seq's inadequacy, but rather an acknowledgment of its different error profiles and the critical importance of independent verification for key research findings.
The practice of validating RNA-Seq results with qPCR has roots in historical precedent from the microarray era, where concerns about reproducibility and bias created a culture of independent verification [7]. However, as RNA-Seq technology has matured, the field has developed a more nuanced understanding of when validation is truly necessary. Current evidence suggests that RNA-Seq methods and analysis approaches are now robust enough that validation is not always required, though specific circumstances demand orthogonal confirmation [7]. This guide examines the technical basis for qPCR's validation role, provides experimental frameworks for effective verification, and outlines the specific scenarios where this gold standard status remains justified.
Technical Comparison: Understanding Methodological Differences
The fundamental differences between qPCR and RNA-Seq technologies create a powerful synergy when used together. qPCR operates through targeted amplification and fluorescent detection of specific cDNA sequences, delivering exceptional sensitivity and dynamic range for known targets. Its limitations include predetermined target selection and lower throughput for large gene sets [3]. In contrast, RNA-Seq utilizes next-generation sequencing to capture comprehensive transcriptome data, enabling discovery of novel transcripts, alternative splicing variants, and non-coding RNAs without prior sequence knowledge [3].
Key Technical Distinctions
Table 1: Fundamental Technical Differences Between qPCR and RNA-Seq
| Parameter | qPCR | RNA-Seq |
|---|---|---|
| Discovery Power | Limited to known sequences | High; detects novel transcripts, isoforms, and variants |
| Throughput | Low to medium (typically <20 targets efficiently) | High (thousands of genes simultaneously) |
| Dynamic Range | ~7-8 logs | ~5 logs for standard protocols |
| Sensitivity | Can detect single copies | Limited for low-abundance transcripts |
| Sample Input | Low requirements | Higher RNA input typically needed |
| Cost per Sample | Low for few targets | Higher, especially for deep sequencing |
| Data Analysis Complexity | Relatively simple | Complex, requiring specialized bioinformatics |
| Absolute Quantification | Possible with standard curves | Typically provides relative quantification |
A critical consideration in comparing these technologies is their correlation performance. Benchmarking studies comparing multiple RNA-Seq analysis workflows (STAR-HTSeq, Tophat-Cufflinks, Kallisto, Salmon) against whole-transcriptome qPCR data have demonstrated overall high concordance, with approximately 85% of genes showing consistent differential expression results between platforms [5]. However, the remaining 15% of genes with discordant findings typically cluster in specific biological and technical categories that demand special attention.
Quantitative Evidence: Establishing qPCR's Validation Role
Comprehensive analyses have specifically addressed the correlation between results obtained with RNA-seq and qPCR. A landmark study by Everaert et al. (benchmarking five RNA-seq analysis pipelines against wet-lab qPCR results for >18,000 protein-coding genes) found that depending on the analysis workflow, 15–20% of genes are considered 'non-concordant' when comparing RNA-seq to qPCR results [7]. Importantly, the majority of these non-concordant genes (approximately 93%) show fold changes lower than 2, and about 80% show fold changes lower than 1.5 [7]. This indicates that most discrepancies occur in genes with minimal expression changes that hover near significance thresholds.
Concordance Analysis Across Expression Ranges
Table 2: Gene Characteristics Influencing qPCR and RNA-Seq Concordance
| Gene Characteristic | Impact on Concordance | Practical Implications |
|---|---|---|
| Expression Level | Lower expressed genes show higher discordance rates | High-confidence validation needed for low-abundance transcripts |
| Fold Change Magnitude | Discordance increases with smaller fold changes (<1.5) | Focus validation on biologically relevant effect sizes |
| Transcript Length | Shorter transcripts exhibit higher discordance | Consider transcript structure in validation strategy |
| Sequence Complexity | Regions with high polymorphism or paralogs problematic | Particularly relevant for HLA and gene family studies |
The small fraction of severely non-concordant genes (approximately 1.8%) are typically lower expressed and shorter, presenting particular challenges for accurate quantification by either method [7]. This pattern has been consistently observed across independent datasets, suggesting systematic technological biases rather than random error. In specialized applications such as HLA expression quantification, the challenges are amplified due to extreme polymorphism, resulting in only moderate correlations between qPCR and RNA-seq (0.2 ≤ rho ≤ 0.53) that highlight the need for careful method selection based on research goals [8].
Experimental Design: Methodologies for Effective Validation
Sample Preparation and RNA Quality Control
The foundation of any successful validation experiment begins with high-quality RNA and standardized processing. For comparative studies, the same RNA samples should ideally be used for both RNA-Seq and qPCR analyses to eliminate sample-to-sample variation. Essential steps include:
- RNA Extraction: Use standardized kits with DNase treatment to eliminate genomic DNA contamination [8].
- Quality Assessment: Verify RNA Integrity Number (RIN) >8.0 for both RNA-Seq and qPCR applications.
- Reverse Transcription: Use consistent priming methods (oligo-dT, random hexamers, or gene-specific primers) across all samples.
- Aliquot Preservation: Create single-use aliquots to avoid repeated freeze-thaw cycles that degrade RNA and compromise protein integrity in parallel studies [97].
qPCR Experimental Protocol
The MIQE (Minimum Information for Publication of Quantitative Real-Time PCR Experiments) guidelines provide a comprehensive framework for conducting robust qPCR validation experiments [7] [72]. The key steps include:
- Primer Design: Design primers spanning exon-exon junctions to minimize genomic DNA amplification. Verify primer efficiency (90-110%) using standard curves [97].
- Reference Gene Selection: Validate reference gene stability under specific experimental conditions. Statistical approaches like NormFinder can identify stable reference genes from candidate sets without requiring RNA-Seq data [98].
- Reaction Setup: Perform technical replicates (minimum triplicates) to assess technical variability.
- Data Analysis: Move beyond the traditional 2−ΔΔCT method. Implement ANCOVA (Analysis of Covariance) models that enhance statistical power and are not affected by variability in qPCR amplification efficiency [72].
- Data Sharing: Provide raw fluorescence data and analysis scripts to improve reproducibility and enable future reanalysis [72].
When is Validation Essential? Specific Research Scenarios
While RNA-Seq has demonstrated sufficient reliability for many applications, specific research scenarios warrant qPCR validation:
Critical Validation Scenarios
- Few-Gene Stories: When an entire biological conclusion rests on differential expression of only a few genes, especially if expression levels are low and/or differences are small [7].
- Therapeutic Target Identification: In drug development contexts where RNA biomarkers form the basis for diagnostic or therapeutic decisions [99] [100].
- Low-Fold Changes: Genes showing differential expression with fold changes below 1.5, where technical variability is highest [7].
- Complex Genomic Regions: Analysis of highly polymorphic regions (e.g., HLA genes) or gene families with extensive sequence homology [8].
- Extended Study Designs: When qPCR is used to confirm RNA-Seq findings in additional sample sets, strains, or conditions not included in the original sequencing experiment [7].
The feasibility of validation must also be considered. Randomly selecting genes for qPCR confirmation provides limited value, as concordant results for a subset offers no guarantee that all genes were correctly identified as differentially expressed by RNA-Seq [7]. Therefore, validation efforts should be strategically targeted rather than applied indiscriminately.
The Scientist's Toolkit: Essential Research Reagents and Solutions
Table 3: Key Research Reagent Solutions for qPCR Validation Studies
| Reagent/Solution | Function | Implementation Considerations |
|---|---|---|
| RNA Extraction Kits | High-purity RNA isolation | Select based on sample type (e.g., FFPE compatibility); include DNase treatment |
| Reverse Transcription Kits | cDNA synthesis from RNA templates | Consistent priming method critical for reproducibility |
| qPCR Master Mixes | Reaction components for amplification | SYBR Green or probe-based; verify compatibility with instrumentation |
| Validated Primer Sets | Target-specific amplification | Efficiency 90-110%; exon-spanning designs to avoid genomic DNA |
| Reference Gene Panels | Normalization controls | Multiple stable genes; validate under specific experimental conditions |
| Standard Curve Materials | Quantification standards | For absolute quantification; essential for primer efficiency validation |
| Data Analysis Software | Quantification and statistical analysis | Support for MIQE-compliant reporting and advanced statistical models |
Successful implementation requires not only quality reagents but also standardized protocols and appropriate statistical frameworks. The transition toward FAIR (Findable, Accessible, Interoperable, Reproducible) data principles and sharing of raw fluorescence data represents an important evolution in qPCR practice that enhances validation reliability [72].
qPCR maintains its status as the validation gold standard for RNA-Seq findings not because of RNA-Seq's deficiencies, but because of their complementary strengths. RNA-Seq provides unparalleled discovery power for hypothesis generation, while qPCR delivers precise, targeted quantification for hypothesis testing. The most robust gene expression studies strategically integrate both platforms, using each for its optimal purpose.
As sequencing technologies continue to evolve, the relationship between these methods may shift, but the fundamental principle of orthogonal validation will remain relevant. By understanding the specific scenarios that demand validation, implementing rigorous experimental designs, and applying appropriate statistical analyses, researchers can maximize the reliability of their gene expression findings and build a solid foundation for subsequent functional studies and translational applications.
The transition from quantitative PCR (qPCR) to RNA sequencing (RNA-Seq) as a primary tool for transcriptome analysis represents a significant evolution in molecular biology. While qPCR remains the gold standard for targeted gene expression validation due to its simplicity, accuracy, and low cost, RNA-Seq provides an unbiased, genome-wide view of the transcriptome [76] [37] [5]. However, this technological shift necessitates rigorous benchmarking to ensure that RNA-Seq data reliably captures both absolute expression levels and differential expression patterns. Determining the correlation between these platforms is therefore essential for validating RNA-Seq findings and establishing confidence in its application for basic research, biomarker discovery, and clinical diagnostics [41] [5].
Accurately identifying differentially expressed genes (DEGs) is a fundamental goal in transcriptomics, particularly for distinguishing subtle expression changes between similar biological conditions, such as different disease subtypes or stages [41]. The reliability of these findings depends heavily on the analytical workflow, from experimental design to computational analysis. This guide provides a comprehensive comparison of platform correlations, evaluates the performance of various RNA-Seq analysis workflows against qPCR data, and outlines best practices to ensure the accuracy and reproducibility of differential expression studies.
Quantitative Correlation Between RNA-Seq and qPCR
Multiple large-scale studies have systematically evaluated how well RNA-Seq measurements correlate with qPCR data, which is often treated as the reference standard. The correlation is typically assessed at two levels: absolute gene expression (the measured abundance of a transcript in a single sample) and relative gene expression (the fold-change in expression between different conditions).
Table 1: Summary of Key Benchmarking Studies on RNA-Seq and qPCR Correlation
| Study | Sample Types | Key Finding on Expression Correlation (R²) | Key Finding on Fold-Change Correlation (R²) |
|---|---|---|---|
| MAQC Consortium & Follow-ups [5] | MAQC-A (UHRR) and MAQC-B (Brain) | 0.798 - 0.845 (across 5 workflows) | 0.927 - 0.934 (across 5 workflows) |
| Multi-Center Quartet Project [41] | Quartet reference materials | 0.876 (vs. Quartet TaqMan data) | Greater inter-laboratory variation for subtle differential expression |
| Systematic Pipeline Comparison [10] | Myeloma cell lines | High correlation with qPCR (specific R² not provided) | 17 DE methods evaluated against qPCR validation |
The overall consensus is that RNA-Seq shows high concordance with qPCR, particularly for fold-change measurements, which are the most relevant for differential expression analysis. One of the most comprehensive benchmarks, which used whole-transcriptome qPCR data for over 18,000 genes, found that all five tested RNA-Seq workflows (Tophat-HTSeq, Tophat-Cufflinks, STAR-HTSeq, Kallisto, and Salmon) exhibited high fold-change correlations with qPCR data (R² values between 0.927 and 0.934) [5]. This indicates that for about 85% of genes, RNA-Seq and qPCR agreed on differential expression status.
However, a multi-center study using the Quartet project reference materials highlighted a critical challenge: inter-laboratory consistency drops significantly when trying to detect subtle differential expression, such as the small expression differences found between similar disease subtypes [41]. This underscores the need for robust quality control, especially in clinical applications.
Experimental Protocols for Benchmarking
To ensure valid and reproducible comparisons between RNA-Seq and qPCR, a rigorous experimental design is paramount. The following protocols are synthesized from established benchmarking studies.
Sample Selection and Preparation
- Reference Materials: Utilize well-characterized RNA reference samples. The MAQC samples (MAQC-A: Universal Human Reference RNA; MAQC-B: Human Brain Reference RNA) are widely used due to their large biological differences and established ground truth [5] [42]. For studies focused on subtle expression differences, the Quartet reference materials from a Chinese family quartet are more appropriate [41].
- Spike-in Controls: Spike known quantities of synthetic RNA controls (e.g., ERCC Spike-in Mix) into the samples prior to library preparation. This provides an internal "built-in truth" for evaluating quantification accuracy [41].
- Experimental Replicates: Include a minimum of three technical replicates for each sample to assess technical variability. Biological replicates are essential for evaluating biological variability and the robustness of differential expression calls [76] [101].
qPCR Validation Protocol
- Candidate Gene Selection: Select a set of genes that represent a wide dynamic range of expression levels and include known housekeeping genes for normalization.
- RNA Reverse Transcription: Convert total RNA to cDNA using a high-fidelity reverse transcriptase kit with oligo(dT) and/or random hexamer primers.
- qPCR Assay Performance: Perform qPCR reactions in duplicate or triplicate. Assays with amplification efficiencies outside the range of 90–110% should be re-optimized or excluded.
- Reference Gene Validation: Do not assume traditional housekeeping genes (e.g., GAPDH, ACTB) are stable. Use algorithms like geNorm, NormFinder, or BestKeeper to identify the most stably expressed genes from your dataset for reliable normalization [10] [37]. A global median normalization approach across all stable genes can also be used [10].
RNA-Seq Analysis Workflows
The RNA-Seq analysis involves multiple steps, and the choice of tools at each stage can impact the final correlation with qPCR.
Table 2: Common Tools for Each Step of RNA-Seq Analysis
| Analysis Step | Description | Commonly Used Tools |
|---|---|---|
| Quality Control | Assess raw read quality and potential contaminants. | FastQC, multiQC [76] |
| Read Trimming | Remove adapter sequences and low-quality bases. | Trimmomatic, Cutadapt, fastp [76] [10] |
| Alignment/Quantification | Map reads to a reference or directly quantify transcripts. | Alignment-based: STAR, HISAT2, TopHat2 [76] [5] Pseudoalignment: Kallisto, Salmon [76] [5] |
| Gene Annotation | Define gene models for read counting. | GENCODE, RefSeq [42] |
| Normalization | Adjust counts for technical biases (e.g., sequencing depth). | For DE: Median-of-ratios (DESeq2), TMM (edgeR) [76] For visualization: TPM, FPKM [76] |
| Differential Expression | Statistically identify genes with significant expression changes. | DESeq2, edgeR, limma-voom [76] [101] |
Visualization of Benchmarking Workflows
The following diagrams illustrate the key procedural and analytical pathways for conducting a robust correlation study between qPCR and RNA-Seq.
Diagram 1: Overall workflow for benchmarking RNA-Seq against qPCR, showing the parallel processing of shared RNA samples and the final correlation assessment.
Diagram 2: Key decision points in an RNA-Seq bioinformatics pipeline, showing the two main quantification paths (alignment-based and pseudoalignment) that can impact correlation with qPCR.
The Scientist's Toolkit: Essential Reagents and Materials
Successful execution of a correlation study requires careful selection of reagents and resources. The following table details key solutions and their critical functions.
Table 3: Essential Research Reagent Solutions for qPCR and RNA-Seq Correlation Studies
| Category | Specific Product/Resource | Function in Experiment |
|---|---|---|
| Reference RNA | MAQC Reference RNAs (A & B), Quartet Project RNAs | Provides a well-characterized, consistent RNA source with known expression profiles for cross-platform and cross-laboratory benchmarking [41] [5]. |
| Spike-in Controls | ERCC ExFold RNA Spike-In Mix | Adds a set of synthetic RNAs at known concentrations, creating an internal "built-in truth" for evaluating the accuracy and dynamic range of quantification [41]. |
| Library Prep Kit | TruSeq Stranded Total RNA Kit (Illumina) | Converts RNA into a sequenceable library, preserving strand information which is crucial for accurately quantifying overlapping transcripts [10] [42]. |
| Reverse Transcriptase | SuperScript IV First-Strand Synthesis System (Thermo Fisher) | Generates high-quality cDNA from RNA templates with high efficiency and fidelity, which is critical for both qPCR and RNA-Seq library prep [10]. |
| qPCR Assays | TaqMan Gene Expression Assays (Thermo Fisher) | Provides pre-validated, highly specific primers and probes for accurate and sensitive quantification of target genes by qPCR [10] [5]. |
| Gene Annotation | GENCODE Human Annotation | Supplies a comprehensive and regularly updated set of gene models, which is essential for accurate read alignment and quantification in RNA-Seq analysis [42]. |
Critical Factors Influencing Correlation and Best Practices
The correlation between RNA-Seq and qPCR is not universal and can be influenced by several technical and biological factors. Understanding these is key to interpreting results and improving experimental design.
Key Factors Affecting Agreement
- Gene Annotation Complexity ("Mappability"): Genes with low "mappability" – meaning their reads can be ambiguously mapped to multiple genomic locations due to sequence similarity (e.g., in paralogous gene families) – show poorer correlation between RNA-Seq and qPCR. Using a filtered annotation set that excludes problematic gene models can improve performance [42].
- Gene-Specific Characteristics: Discrepancies are more common for genes that are shorter, have fewer exons, and are lowly expressed [5]. These genes are inherently more difficult to quantify accurately with both technologies, but the technical noise has a larger relative impact.
- Sample Size and Statistical Power: Underpowered experiments with too few biological replicates (e.g., fewer than 5-6 per condition) produce DEG lists that are unstable and difficult to replicate. A review of real studies found that about 50% of human RNA-Seq experiments use six or fewer replicates, which is often insufficient [101]. Increasing replicates significantly improves the reliability of results more than simply increasing sequencing depth [76] [101].
- Normalization Method: Using simple normalization methods like CPM or RPKM/FPKM that do not account for library composition can lead to biases, especially if a few genes are very highly expressed in one condition. For differential expression, composition-robust methods like DESeq2's median-of-ratios or edgeR's TMM are recommended [76].
Recommendations for Best Practices
- For Detecting Subtle Expression Differences: Incorporate reference materials like the Quartet samples into your quality control pipeline to monitor your workflow's sensitivity to small changes [41].
- Validate Critical Findings: For key genes, especially those that are short, lowly expressed, or have low mappability, confirm RNA-Seq results using qPCR [5] [42].
- Prioritize Replicates Over Depth: When facing budget constraints, allocate resources to obtaining more biological replicates rather than ultra-deep sequencing. Studies suggest a minimum of 6-12 replicates per condition for robust DEG detection [101].
- Use a Power Analysis: Before starting a study, use pilot data or public datasets with tools like Scotty or methods from publications to estimate the required number of replicates to achieve sufficient statistical power (e.g., 80%) for your effect sizes of interest [102] [101].
- Standardize and Document Workflows: Given the significant impact of bioinformatics choices, clearly document every step of the RNA-Seq analysis, including software versions and parameters, to ensure reproducibility [41] [76].
Quantitative PCR (qPCR) and RNA sequencing (RNA-seq) represent two fundamental approaches for gene expression analysis in differential expression research. While both techniques aim to quantify transcript abundance, they often yield discrepant results due to distinct technical and biological factors. Understanding the sources of these variations is crucial for researchers and drug development professionals to select appropriate methodologies, interpret data accurately, and ensure reproducible findings. This guide objectively compares the performance of these technologies using supporting experimental data, addressing the key factors contributing to observed discrepancies and providing strategies for their resolution.
Performance Comparison: qPCR vs. RNA-seq
Table 1: Key Performance Metrics for qPCR and RNA-seq
| Performance Metric | qPCR | RNA-seq | Supporting Experimental Evidence |
|---|---|---|---|
| Technology Principle | Target-specific amplification and detection | High-throughput sequencing of entire transcriptome | [2] |
| Dynamic Range | Widest dynamic range, lowest quantification limits | Broader than microarrays, but can be affected by technical noise | [2] [103] |
| Throughput | Low-throughput (ideal for ≤ 30 genes) | High-throughput (whole transcriptome) | [2] |
| Expression Correlation | Considered gold standard for validation | High overall correlation (e.g., R² ~0.84 for Salmon), but with outliers | [5] [17] |
| Fold Change Correlation | Benchmark for differential expression | High concordance (e.g., R² ~0.93), with 15-19% non-concordant genes | [5] |
| Precision at Single-Cell Level | N/A | Generally low; requires ≥500 cells per cell type per individual for reliability | [103] |
| Impact of Low Input RNA | Requires less starting material | Inefficient amplification of low/moderate transcripts; increased noise and distortion | [104] |
Table 2: Technical Factors Contributing to Discrepancies
| Technical Factor | Impact on qPCR | Impact on RNA-seq | Recommended Resolution |
|---|---|---|---|
| Normalization | Highly dependent on stable reference genes; errors lead to misinterpretation | Uses global normalization (e.g., TPM); less reliant on single genes | Use tools like GSV or InterOpt to select optimal reference genes from RNA-seq data [105] [17] |
| Amplification Bias | Specific primer/probe efficiency | Global amplification biases; PCR duplicates distort quantification, especially with low input [106] | Use Unique Molecular Identifiers (UMIs) to identify PCR duplicates [106] |
| Transcript Complexity | Targets specific, known sequences | Challenges with polymorphic regions (e.g., HLA) and paralogous genes lead to misalignment and biased quantification [8] | Use HLA-tailored bioinformatics pipelines for accurate alignment and quantification [8] |
| Input Material | Robust with low input | High rates of PCR duplicates (34-96%) with inputs <125 ng; fewer genes detected and increased noise [106] | Use sufficient input RNA (>125 ng) and minimize PCR cycles during library prep [106] |
Experimental Protocols for Method Comparison
Protocol: Benchmarking RNA-seq Workflows Against qPCR
A robust method for validating RNA-seq data involves comparison with whole-transcriptome qPCR data.
- Sample Preparation: Use well-characterized reference RNA samples (e.g., MAQCA and MAQCB from the MAQC consortium) [5].
- qPCR Analysis: Perform whole-transcriptome qPCR assays for all protein-coding genes. Normalize data using validated reference genes.
- RNA-seq Library Preparation & Sequencing: Prepare RNA-seq libraries from the same RNA source. Utilize multiple library prep protocols and sequencing platforms if possible.
- Bioinformatic Processing: Process RNA-seq reads using multiple workflows (e.g., STAR-HTSeq, Kallisto, Salmon) to generate gene-level expression estimates [5].
- Data Alignment & Correlation Analysis: Align transcripts detected by qPCR with those quantified by RNA-seq. Calculate expression correlation (log TPM vs. normalized Cq values) and fold-change correlation between samples for both techniques. Identify and investigate outlier genes [5].
Protocol: Assessing HLA Expression with Tailored Pipelines
The extreme polymorphism of HLA genes requires specialized approaches for accurate expression quantification.
- Sample Collection: Obtain fresh peripheral blood mononuclear cells (PBMCs) from donors. Extract high-quality RNA, treating with DNAse to remove genomic DNA [8].
- Multi-Method Expression Quantification:
- qPCR: Perform qPCR for HLA Class I genes (HLA-A, -B, -C) using locus-specific primers.
- RNA-seq: Conduct standard RNA-seq. Additionally, use an HLA-tailored computational pipeline that accounts for known HLA diversity during alignment, rather than relying on a single reference genome [8].
- Cell Surface Expression (Validation): For a subset of samples, quantify HLA-C protein expression on the cell surface using antibody-based techniques like flow cytometry [8].
- Data Comparison: Correlate expression estimates from qPCR, standard RNA-seq, HLA-tailored RNA-seq, and cell surface expression to evaluate consistency and identify technical biases [8].
Visualization of Workflows and Decision Pathways
Comparison and Integration Workflow This diagram outlines the complementary roles of qPCR and RNA-seq in a gene expression study and the process of integrating data from both methods.
Troubleshooting Discrepancies This diagram provides a logical pathway for diagnosing and resolving the most common technical variations that lead to discrepancies between qPCR and RNA-seq data.
The Scientist's Toolkit: Essential Reagents and Solutions
Table 3: Key Research Reagent Solutions for Expression Studies
| Item Name | Function/Benefit | Application Context |
|---|---|---|
| Unique Molecular Identifiers (UMIs) | Short random nucleotide sequences added to RNA fragments prior to amplification; enable precise identification and removal of PCR duplicates during bioinformatic analysis [106]. | Critical for RNA-seq protocols, especially with low-input samples (<125 ng) to reduce amplification noise and improve quantification accuracy. |
| Spike-in RNA Controls | Synthetic RNA sequences (e.g., ERCC, Sequin, SIRVs) with known concentrations added to samples prior to library prep [107]. | Used for normalizing RNA-seq data, assessing technical performance, and evaluating the accuracy of transcript quantification across different protocols. |
| HLA-Tailored Bioinformatics Pipelines | Specialized computational tools designed to handle the extreme polymorphism of HLA genes during read alignment, minimizing mapping biases [8]. | Essential for accurate quantification of HLA gene expression from RNA-seq data, overcoming limitations of standard pipelines that use a single reference genome. |
| Stable Reference Gene Panels | Genes identified from RNA-seq data (e.g., using GSV software) as having high, stable expression across the specific biological conditions of a study [17]. | Provides a more reliable foundation for qPCR data normalization than traditionally used housekeeping genes, which can vary. |
| NEBNext Ultra II Directional RNA Library Prep Kit | A widely used kit for preparing RNA-seq libraries; study shows its performance with varying RNA inputs and PCR cycles [106]. | Enables robust library construction; optimal results obtained with >125 ng input and minimal PCR cycles to limit duplicates. |
qPCR and RNA-seq are complementary technologies in differential expression research, each with distinct strengths and limitations. Discrepancies between them arise from a complex interplay of technical factors, including normalization strategies, amplification biases, and challenges in quantifying complex genomic regions. Biological variations, such as alternative isoforms, add another layer of complexity. By understanding these sources of variation—leveraging optimized experimental protocols, employing specialized bioinformatic tools, and utilizing key reagent solutions—researchers can make informed methodological choices, critically interpret data, and implement effective strategies to resolve inconsistencies, thereby ensuring the robustness and reliability of their gene expression findings.
Benchmarking RNA-Seq Analysis Workflows Against qPCR Data
The accurate quantification of gene expression is fundamental to advancing research in molecular biology, drug development, and personalized medicine. For years, quantitative PCR (qPCR) has served as the gold standard for gene expression analysis due to its sensitivity, reproducibility, and wide dynamic range [2]. However, with the rise of next-generation sequencing, RNA-Seq has emerged as a powerful alternative, offering an unbiased, hypothesis-free approach to transcriptome analysis without requiring prior knowledge of sequence information [3].
The relationship between these two technologies has evolved from replacement to complementary coexistence, raising critical questions about their comparability. While RNA-Seq provides a comprehensive view of the transcriptome, including discovery of novel transcripts and splice variants, its accuracy in quantifying expression levels relative to the established qPCR standard requires rigorous validation [5] [7]. This comparison guide objectively evaluates the performance of various RNA-Seq analysis workflows against qPCR data, providing researchers with evidence-based insights for selecting appropriate methodologies based on their specific research goals and constraints.
Performance Comparison of RNA-Seq Workflows Against qPCR
Experimental Design and Benchmarking Approach
To objectively evaluate the performance of RNA-Seq workflows, we established a benchmarking framework using the well-characterized MAQCA (Universal Human Reference RNA) and MAQCB (Human Brain Reference RNA) reference samples [5] [108]. This approach utilized whole-transcriptome RT-qPCR data for 18,080 protein-coding genes as a validation standard, representing one of the most comprehensive comparisons to date.
Five representative RNA-Seq processing workflows were selected to encompass the two major methodological approaches: alignment-based methods (Tophat-HTSeq, Tophat-Cufflinks, STAR-HTSeq) and pseudoalignment methods (Kallisto, Salmon) [5]. The alignment-based methods involve mapping reads directly to a reference genome followed by quantification, while pseudoalignment methods break reads into k-mers before assigning them to transcripts, offering substantial gains in processing speed [5].
For meaningful comparison, transcript-based workflows (Cufflinks, Kallisto, Salmon) had their transcript-level TPM values aggregated to gene-level measurements corresponding to those detected by qPCR assays. Gene-level counts from HTSeq-based workflows were similarly converted to TPM values. To ensure robust analysis, genes were filtered based on a minimal expression of 0.1 TPM across all samples and replicates, resulting in 13,045-13,309 genes selected for final comparison depending on the dataset [5].
Quantitative Performance Metrics
The table below summarizes the performance of the five RNA-Seq workflows against qPCR benchmark data across two key metrics: expression correlation and fold change correlation.
Table 1: Performance Comparison of RNA-Seq Workflows Against qPCR Data
| Workflow | Methodology | Expression Correlation (R² with qPCR) | Fold Change Correlation (R² with qPCR) | Non-concordant Genes | Severely Non-concordant Genes |
|---|---|---|---|---|---|
| Tophat-HTSeq | Alignment-based | 0.827 | 0.934 | 15.1% | ~1.8% |
| STAR-HTSeq | Alignment-based | 0.821 | 0.933 | 15.3% | ~1.8% |
| Tophat-Cufflinks | Alignment-based | 0.798 | 0.927 | 16.2% | ~1.8% |
| Kallisto | Pseudoalignment | 0.839 | 0.930 | 16.8% | ~1.8% |
| Salmon | Pseudoalignment | 0.845 | 0.929 | 19.4% | ~1.8% |
All methods demonstrated high correlation with qPCR data for both expression intensity and fold change measurements [5]. The similarity between Tophat-HTSeq and STAR-HTSeq results (expression correlation R² = 0.994) suggests minimal impact of the mapping algorithm on quantification accuracy [5].
When examining differential expression between MAQCA and MAQCB samples, approximately 85% of genes showed consistent results between RNA-Seq and qPCR data across all workflows [5] [108]. The non-concordant genes (those with discrepant results between methods) were characterized by relatively small fold change differences, with over 66% having a ΔFC < 1 and 93% having a ΔFC < 2 [5]. The small subset of severely non-concordant genes (approximately 1.8%) were typically shorter in length, had fewer exons, and were lower expressed compared to genes with consistent expression measurements [5] [108].
Special Considerations for Complex Genomic Regions
The exceptional polymorphism of certain gene families presents unique challenges for RNA-Seq quantification. Studies focusing on Human Leukocyte Antigen (HLA) genes, which are essential elements of innate and acquired immunity, have revealed more moderate correlations between qPCR and RNA-Seq expression estimates (0.2 ≤ rho ≤ 0.53 for HLA-A, -B, and -C) [8].
These discrepancies stem from technical issues related to the extreme polymorphism at HLA genes, which complicates read alignment using standard reference genomes [8]. Recently developed HLA-tailored bioinformatic pipelines that account for known HLA diversity in the alignment step have shown improved performance, though careful consideration of technical and biological factors remains essential when comparing quantifications from different techniques [8].
Experimental Protocols and Methodologies
RNA-Seq Library Preparation and Sequencing
The reliability of RNA-Seq data begins with appropriate library preparation. Recent investigations have highlighted the impact of PCR duplication on data quality, particularly the relationship between RNA input amount and the number of PCR cycles used for amplification [35].
For input amounts lower than 125 ng, 34-96% of reads were discarded via deduplication, with this percentage increasing with lower input amounts and decreasing with increasing PCR cycles [35]. This reduced read diversity for low input amounts leads to fewer genes detected and increased noise in expression counts [35]. To mitigate these effects, the implementation of Unique Molecular Identifiers (UMIs) is recommended, as they enable accurate detection of individual molecules by tagging RNA fragments prior to amplification [35].
The quality of sequencing data across different platforms (Illumina NovaSeq 6000, Illumina NovaSeq X, Element Biosciences AVITI, and Singular Genomics G4) has been shown to be generally comparable, with all platforms producing high-quality reads suitable for accurate gene expression quantification [35].
RNA-Seq Data Processing Workflows
A standardized processing pipeline is essential for reproducible RNA-Seq analysis. The following diagram illustrates the key steps in a typical RNA-Seq workflow:
The initial quality control step identifies technical artifacts including adapter contamination, unusual base composition, and duplicated reads using tools like FastQC or multiQC [57]. Following QC, read trimming cleans the data by removing low-quality sequences and adapter remnants using tools such as Trimmomatic, Cutadapt, or fastp [57].
The core processing step involves either alignment-based methods (STAR, HISAT2, TopHat2) that map reads to a reference genome, or pseudoalignment methods (Kallisto, Salmon) that estimate transcript abundances without full base-by-base alignment [57]. Pseudoalignment methods offer significant speed advantages and reduced memory requirements, making them particularly suitable for large datasets [57].
Post-alignment QC removes poorly aligned or ambiguously mapped reads using tools like SAMtools, Qualimap, or Picard to prevent artificially inflated read counts [57]. The final read quantification step generates a count matrix summarizing reads per gene using tools like featureCounts or HTSeq-count [57].
qPCR Validation Methodology
When employing qPCR for validation studies, researchers should adhere to MIQE guidelines (Minimum Information for Publication of Quantitative Real-Time PCR Experiments) to ensure reliability and repeatability [2]. These guidelines specify proper controls, PCR efficiency calculations, and experimental documentation.
For differential expression analysis, qPCR assays should target both genes of interest and appropriately validated reference genes to control for technical variability. Recent approaches have leveraged RNA-Seq data itself to identify stable reference genes for specific experimental contexts [109].
Decision Framework and Applications
Technology Selection Guidelines
The choice between RNA-Seq and qPCR depends on multiple factors, including research goals, target number, budget, and organism characteristics. The following diagram outlines key decision factors:
qPCR is recommended when analyzing a small number of genes (≤ 20 targets) with known sequences, as it offers the widest dynamic range, lowest quantification limits, and minimal bias compared to other methods [2] [3]. It remains particularly valuable for high-precision quantification of specific targets and validation of key findings across additional sample sets [7].
RNA-Seq is preferable for discovery-oriented studies requiring comprehensive transcriptome characterization, detection of novel transcripts, identification of splice variants, or analysis of large gene sets [3]. It provides hypothesis-free exploration without requiring prior sequence knowledge and can detect both known and novel variants with single-base resolution [3].
When is qPCR Validation Necessary?
The need for qPCR validation of RNA-Seq results depends on several factors. For most well-designed RNA-Seq studies with sufficient biological replicates and proper analytical techniques, orthogonal validation by qPCR provides limited added value [7]. However, qPCR validation remains warranted when:
- The entire biological story depends on differential expression of only a few genes [7]
- Expression differences are small (fold change < 2) and/or expression levels are very low [5] [7]
- Genes of interest belong to problematic categories (shorter genes with fewer exons) [5]
- Confirmation of expression patterns is needed in additional samples, strains, or conditions beyond the original RNA-Seq experiment [7]
Essential Research Reagent Solutions
The table below details key reagents and computational tools essential for implementing robust RNA-Seq and qPCR workflows.
Table 2: Essential Research Reagents and Computational Tools
| Category | Product/Solution | Key Features | Applications |
|---|---|---|---|
| Library Prep | NEBNext Ultra II Directional RNA Library Prep | Maintains strand specificity; supports low input (≥10 ng) | RNA-Seq library construction |
| Library Prep | Illumina Stranded mRNA Prep | Single-day solution; cost-effective; rapid | Coding transcriptome analysis |
| Unique Molecular Identifiers | UMI Adapters | Random nucleotide sequences (5-11 bp); molecular tagging | PCR duplicate removal; accurate quantification |
| qPCR Master Mix | MIQE-compliant reagents | Includes controls for efficiency determination; optimized chemistry | Validated qPCR experiments |
| Alignment Software | STAR | Spliced aligner; fast processing; high accuracy | Alignment-based RNA-Seq analysis |
| Pseudoalignment | Kallisto | Ultra-fast processing; bootstrap confidence intervals | Transcript quantification without full alignment |
| Pseudoalignment | Salmon | Accurate quantification; sequence and fragment-level bias correction | Rapid transcript-level estimation |
| Quality Control | FastQC | Comprehensive QC reports; user-friendly visualization | RNA-Seq data quality assessment |
| Read Trimming | Trimmomatic | Flexible adapter removal; quality-based trimming | Pre-alignment read processing |
| Differential Expression | DESeq2 | Robust statistical modeling; handles low counts | Identification of differentially expressed genes |
Comprehensive benchmarking reveals that modern RNA-Seq workflows show strong concordance with qPCR data for the majority of protein-coding genes, with approximately 85% of genes showing consistent differential expression results between platforms [5]. The remaining discrepancies primarily affect lowly expressed, shorter genes with minimal fold changes [5].
This validation supports RNA-Seq as a reliable approach for transcriptome-wide differential expression analysis, reducing but not eliminating the need for qPCR confirmation in most cases [7]. The decision between these technologies should be guided by research objectives, with qPCR remaining the optimal choice for targeted analysis of known sequences, while RNA-Seq provides superior discovery power for comprehensive transcriptome characterization [2] [3].
Researchers can implement these findings with confidence by selecting appropriate methodologies based on their specific goals, following established best practices for experimental design and analysis, and employing validation strategies where warranted by the biological context or technical considerations.
Quantifying the relationship between mRNA transcription and the resulting cell surface protein levels is a fundamental goal in molecular biology, with significant implications for biomarker discovery, drug development, and understanding immune regulation. This relationship is not always straightforward due to complex post-transcriptional and post-translational regulation. Researchers primarily rely on two powerful technologies to measure mRNA—quantitative PCR (qPCR) and RNA sequencing (RNA-seq)—each with distinct strengths and limitations [2]. This guide provides an objective comparison of their performance when correlating mRNA data with protein measurements, such as those obtained from flow cytometry or single-cell proteomics. The choice between qPCR, with its proven precision for targeted genes, and RNA-seq, with its discovery power for the entire transcriptome, shapes the experimental design and interpretation of multimodal studies [110] [5]. We will evaluate their accuracy, throughput, and applicability through experimental data and benchmarking studies.
Technology Performance Comparison
Quantitative Correlation with Protein Levels
The correlation between mRNA expression quantified by different technologies and cell surface protein abundance varies significantly. Table 1 summarizes key performance metrics from benchmarking studies.
Table 1: Performance Comparison of qPCR and RNA-seq in Multimodal Studies
| Technology | Typical Correlation with Protein Levels (r/rho) | Key Strengths | Key Limitations | Best-Suited Applications |
|---|---|---|---|---|
| qPCR | Moderate to high for targeted genes (e.g., HLA: 0.2 ≤ rho ≤ 0.53) [8] | Wide dynamic range, low quantification limits, high sensitivity for low-abundance transcripts, gold standard for validation [110] [2] | Limited to known, pre-selected genes; lower throughput [2] | Validating RNA-seq findings; focused studies on a defined set of genes (<30) [110] [17] [2] |
| Bulk RNA-seq | Moderate correlation (e.g., HLA: 0.2 ≤ rho ≤ 0.53) [8] | Whole-transcriptome, discovery-driven, can identify novel genes/isoforms [5] [2] | Challenging for highly polymorphic genes (e.g., HLA); requires complex bioinformatics [8] [2] | Genome-wide exploratory studies; discovering novel biomarkers or splice variants [2] |
| Single-Cell Multi-Omics (CITE-seq) | High (when properly integrated) [111] | Direct, simultaneous measurement of mRNA and protein in the same single cell | Weak mRNA-protein relationships for some genes due to post-transcriptional regulation [111] | Deconvolving cellular heterogeneity; building atlas-level maps of cell states [111] [112] |
A direct comparison study of HLA class I gene expression revealed a moderate correlation between estimates from qPCR and RNA-seq (0.2 ≤ rho ≤ 0.53 for HLA-A, -B, and -C), with technical and biological factors affecting the agreement [8]. This highlights that even when measuring the same mRNA molecules, different platforms can yield varying results. For broader transcriptome-wide correlation with protein levels, one must consider that mRNA levels do not always correlate strongly with protein abundance due to regulatory mechanisms like post-transcriptional control, degradation, and protein modifications [111].
Accuracy and Reproducibility in Differential Expression
Accurately detecting changes in gene expression is crucial for linking transcriptional regulation to protein-level outcomes.
Table 2: Differential Expression Analysis Performance
| Metric | qPCR Performance | RNA-seq Performance | Notes |
|---|---|---|---|
| Fold-Change Correlation with qPCR | Gold Standard (Self) | High (R² ~ 0.93) [5] | RNA-seq shows high concordance with qPCR for relative quantification. |
| Fraction of Non-Concordant Genes | N/A | 15.1% - 19.4% [5] | Genes with disagreed differential expression status between RNA-seq and qPCR. |
| Impact on Subtle Differential Expression | High Accuracy | Greater inter-laboratory variation [41] | RNA-seq performance varies more across labs for small expression differences. |
A foundational benchmarking study demonstrated that while RNA-seq workflows show high fold-change correlation with qPCR (R² ~ 0.93), a fraction of genes (15.1%-19.4%) can show inconsistent differential expression results between the two technologies [5]. This is particularly critical for "subtle differential expression," where biological differences between samples are minor. A recent large-scale study involving 45 laboratories found that inter-lab reproducibility for detecting these subtle changes is more variable for RNA-seq, underscoring the need for rigorous quality control when using it for clinically relevant, fine distinctions [41].
Detailed Experimental Protocols
Protocol 1: qPCR Workflow for mRNA Validation
Objective: To accurately quantify the expression of a pre-defined set of target genes for correlation with protein measurements.
Step 1: Sample Preparation and RNA Extraction
- Isolate cells of interest (e.g., PBMCs) under consistent conditions.
- Extract total RNA using a silica-membrane column-based kit (e.g., RNeasy from Qiagen) to ensure purity and remove genomic DNA contamination with DNase treatment [8].
- Quantify RNA using a sensitive method like a lab chip kit (e.g., Caliper HT RNA Lab Chip) [8].
Step 2: Reverse Transcription and Assay Design
- Convert RNA to cDNA using a reverse transcription kit with random hexamers and/or oligo-dT primers.
- Design and validate qPCR assays for target genes. Probes (e.g., TaqMan) are preferred for higher specificity. Adhere to MIQE (Minimum Information for Publication of Quantitative Real-Time PCR Experiments) guidelines to ensure reliability [110] [2].
Step 3: qPCR Run and Data Analysis
- Perform reactions in technical replicates on a real-time PCR instrument.
- Include negative controls (no-template) and positive controls.
- Use stable reference genes for normalization. Software like "Gene Selector for Validation" (GSV) can identify optimal reference genes from RNA-seq data based on high and stable expression across samples [17].
- Calculate relative gene expression using the ΔΔCq method.
Protocol 2: RNA-seq Workflow for Multimodal Integration
Objective: To generate genome-wide transcriptome data for correlation with protein levels, enabling both targeted and discovery-based analysis.
Step 1: Library Preparation and Sequencing
- Assess RNA integrity (RIN > 8). Select an appropriate library prep protocol: poly-A enrichment for mRNA or ribosomal RNA depletion for broader RNA species. Stranded protocols are recommended to resolve overlapping transcripts [41].
- The choice of sequencing platform (Illumina, Nanopore, PacBio) and parameters (read length, depth, single vs. paired-end) depends on the goal. For transcript-level analysis, long-read sequencing (Nanopore, PacBio) more robustly identifies major isoforms [107].
Step 2: Bioinformatic Processing and Quantification
- Quality Control: Use FastQC to assess read quality. Trim adapters and low-quality bases with tools like Trimmomatic or Cutadapt.
- Alignment & Quantification: Two primary strategies exist:
- Alignment-based: Map reads to a reference genome using splice-aware aligners (STAR, HISAT2), then count reads per gene with HTSeq or featureCounts [5].
- Pseudoalignment: Use ultra-fast tools (Kallisto, Salmon) that map reads to a transcriptome without full alignment, providing transcript-level estimates [5].
- For complex gene families like HLA, employ specialized pipelines (e.g., HLA-specific quantification tools) to account for extreme polymorphism and avoid alignment biases [8].
Step 3: Data Normalization and Cross-Modality Integration
- Normalize gene counts to account for library size (e.g., TPM, or using DESeq2's median of ratios method) [5] [17].
- For single-cell multi-omics data (e.g., CITE-seq), use advanced computational frameworks like scMODAL or MaxFuse. These methods use neural networks and generative adversarial networks (GANs) to align cell embeddings from RNA and protein modalities, even when the number of known linked features is limited [111].
The Scientist's Toolkit: Essential Research Reagents and Materials
Table 3: Key Reagents and Tools for Multimodal Expression Studies
| Item | Function | Example Products/Tools |
|---|---|---|
| High-Quality RNA Extraction Kit | Isolate pure, intact RNA for downstream applications. | RNeasy Kit (Qiagen) [8] |
| qPCR Assays | Gene-specific primers and probes for targeted quantification. | TaqMan Assays |
| Stable Reference Genes | Normalize qPCR data; genes with high, stable expression. | Identified via GSV software [17] |
| RNA-seq Library Prep Kit | Prepare RNA samples for sequencing. | Illumina TruSeq, NEBNext |
| Spike-in RNA Controls | Monitor technical variation and quantify absolute expression. | ERCC RNA Spike-In Mix [41] |
| Antibody Panels | Detect specific cell surface proteins via flow cytometry. | CD antibody panels |
| CITE-seq Antibodies | Oligo-tagged antibodies for simultaneous protein and RNA measurement. | BioLegend TotalSeq Antibodies |
| Multi-Omic Integration Software | Computationally align RNA and protein data from single cells. | scMODAL [111], MaxFuse [111] |
The choice between qPCR and RNA-seq for linking mRNA to protein levels is not a matter of which technology is superior, but which is most fit-for-purpose.
- For targeted validation of a small gene set (<30 genes), qPCR remains the gold standard due to its sensitivity, wide dynamic range, and cost-effectiveness [2]. It is the definitive method for confirming findings from high-throughput screens.
- For exploratory, discovery-driven research, RNA-seq is indispensable. It allows for the unbiased identification of novel correlates and pathways without prior knowledge of the transcriptome. Best practices include using stranded library prep, spike-in controls, and specialized pipelines for complex genomic regions [8] [41].
- To directly address cellular heterogeneity and build comprehensive cell maps, single-cell multi-omics technologies like CITE-seq, coupled with advanced integration tools like scMODAL, are the state of the art. They mitigate the confounding effects of analyzing bulk cell populations [111] [112].
Ultimately, a combined approach is often the most powerful: using RNA-seq for discovery and qPCR for rigorous, targeted validation. Adhering to standardized guidelines (MIQE for qPCR, robust QC for RNA-seq) ensures that data generated for multimodal correlation is reliable, reproducible, and impactful for advancing drug development and basic research.
Conclusion
The choice between qPCR and RNA-Seq is not a matter of superiority but of strategic application. qPCR remains unmatched for its precision, sensitivity, and cost-effectiveness in validating a limited number of targets, making it indispensable for focused studies and clinical assays. In contrast, RNA-Seq provides an unparalleled, unbiased view of the transcriptome, enabling novel discovery and the analysis of complex expression patterns. The most robust research strategies often leverage the strengths of both: using RNA-Seq for hypothesis-free exploration and qPCR for rigorous, high-fidelity validation of key results. As both technologies continue to advance, their synergistic use will be crucial for driving accurate and impactful discoveries in biomedical and clinical research, from biomarker identification to understanding complex disease mechanisms.
References
- 1. Comprehensive molecular screening: from the RT-PCR to ... [https://pmc.ncbi.nlm.nih.gov/articles/PMC4369859/]
- 2. qPCR, Microarrays or RNA Sequencing - What to Choose? [https://biosistemika.com/blog/qpcr-microarrays-rna-sequencing-choose-one/]
- 3. NGS vs qPCR [https://www.illumina.com/science/technology/next-generation-sequencing/beginners/advantages/ngs-vs-qpcr.html]
- 4. Cancer Research to Microbes: Harnessing the Power of ... [https://www.thermofisher.com/blog/behindthebench/harnessing-the-power-of-qpcr/]
- 5. Benchmarking of RNA-sequencing analysis workflows ... [https://www.nature.com/articles/s41598-017-01617-3]
- 6. Real-Time PCR (qPCR) and Whole-Transcriptome NGS [https://www.thermofisher.com/us/en/home/life-science/pcr/real-time-pcr/ngs-comparison.html]
- 7. Do results obtained with RNA-sequencing require ... [https://pmc.ncbi.nlm.nih.gov/articles/PMC7823214/]
- 8. Comparison between qPCR and RNA-seq reveals challenges ... [https://pmc.ncbi.nlm.nih.gov/articles/PMC9883133/]
- 9. Comparison of RNA isolation methods on RNA-Seq [https://bmcgenomics.biomedcentral.com/articles/10.1186/s12864-020-6673-2]
- 10. Systematic comparison and assessment of RNA-seq ... [https://www.nature.com/articles/s41598-020-76881-x]
- 11. BLOG: Choosing the Right RNA Analysis Method [https://www.eurofins-viracorbiopharma.com/resource-library/posts/2025/june/blog-choosing-the-right-rna-analysis-method-rna-seq-nanostring-or-qpcr/]
- 12. Revolutionizing Gene Expression: The Power of qPCR [https://pluto.bio/resources/Learning%20Series/revolutionizing-gene-expression-the-power-of-qpcr]
- 13. Introduction to Quantitative PCR (qPCR) Gene Expression ... [https://www.thermofisher.com/us/en/home/life-science/pcr/real-time-pcr/real-time-pcr-learning-center/gene-expression-analysis-real-time-pcr-information/introduction-gene-expression.html]
- 14. Development and validation of cost-effective SYBR Green ... [https://www.nature.com/articles/s41598-024-52250-w]
- 15. Evaluation of Sensitivity and Cost-Effectiveness ... [https://pubmed.ncbi.nlm.nih.gov/34714447/]
- 16. A stable combination of non-stable genes outperforms ... [https://www.nature.com/articles/s41598-024-82651-w]
- 17. RNA-seq validation: software for selection of reference and ... [https://bmcgenomics.biomedcentral.com/articles/10.1186/s12864-024-10511-y]
- 18. How Much is Your qPCR Assay Really Costing You? - LGC [https://blog.biosearchtech.com/how-much-is-your-qpcr-assay-really-costing-you]
- 19. Gene Expression Analysis: RNA-Seq or Real-Time PCR [https://www.lubio.ch/blog/gene-expression-analysis-rna-seq-or-real-time-pcr]
- 20. Limitations of RNA-seq — BioClavis [https://www.bioclavis.co.uk/limitations-of-rna-seq]
- 21. Commentary: a review of technical considerations for ... [https://pmc.ncbi.nlm.nih.gov/articles/PMC12522984/]
- 22. Real-time transcriptomic profiling in distinct experimental ... [https://elifesciences.org/reviewed-preprints/98768]
- 23. RNA-Seq Experimental Design Guide for Drug Discovery [https://www.lexogen.com/blog/planning-for-success-a-strategic-design-guide-for-rna-seq-experiments-in-drug-discovery/]
- 24. Maximize Insights by Combining Molecular Profiling [https://www.bioradiations.com/maximize-insights-by-combining-molecular-profiling-624/]
- 25. A comparison of mRNA sequencing (RNA-Seq) library ... [https://bmcgenomics.biomedcentral.com/articles/10.1186/s12864-022-08543-3]
- 26. Whole Transcriptome vs 3' mRNA-Seq: How to Choose ... [https://www.lexogen.com/blog/choosing-between-whole-transcriptome-total-rna-seq-and-3-mrna-seq/]
- 27. Brief guide to RT-qPCR - PMC [https://pmc.ncbi.nlm.nih.gov/articles/PMC11612376/]
- 28. Choice Of One Step RT-qPCR Or Two Step RT-qPCR [https://www.neb.com/en-us/applications/dna-amplification-pcr-and-qpcr/choice-of-one-step-rt-qpcr-or-two-step-rt-qpcr?srsltid=AfmBOorrefEYr24dZlPaqU9XJg20LOlfH3Bnft9ASaPg1FSmwTjRFRe8]
- 29. A comparison of mRNA sequencing (RNA-Seq) library ... [https://pubmed.ncbi.nlm.nih.gov/35418012/]
- 30. Comparative evaluation of RNA-Seq library preparation ... [https://www.nature.com/articles/s41598-019-49889-1]
- 31. A stable combination of non-stable genes outperforms ... [https://pmc.ncbi.nlm.nih.gov/articles/PMC11682138/]
- 32. A high-throughput screening RT-qPCR assay for ... [https://pmc.ncbi.nlm.nih.gov/articles/PMC9469018/]
- 33. -Stop analysis as a new tool for PCR assay qPCR | Scientific... validation [https://www.nature.com/articles/s41598-018-26116-x?error=cookies_not_supported&code=d313a0df-89c0-4c07-b93f-5ca0d01fa24a]
- 34. on the Basis of the Listeria monocytogenes prfA Assay qPCR Validation [https://pubmed.ncbi.nlm.nih.gov/32975765/]
- 35. The impact of PCR duplication on RNAseq data generated ... [https://pmc.ncbi.nlm.nih.gov/articles/PMC12117910/]
- 36. Real-Time PCR Research Applications & Technologies [https://www.thermofisher.com/us/en/home/life-science/pcr/real-time-pcr/real-time-pcr-applications.html]
- 37. A Whole-Transcriptome Approach to Evaluating Reference ... [https://pmc.ncbi.nlm.nih.gov/articles/PMC5386857/]
- 38. Transcriptomics in the era of long-read sequencing [https://www.rna-seqblog.com/transcriptomics-in-the-era-of-long-read-sequencing/]
- 39. Long-read RNA sequencing: A transformative technology ... [https://www.sciencedirect.com/science/article/pii/S1525001624007524]
- 40. Novel Splice-Driven Mechanisms of Human Genetic ... [https://www.acmgeducation.net/URL/WebinarSeriesJune17]
- 41. A real-world multi-center RNA-seq benchmarking study ... [https://www.nature.com/articles/s41467-024-50420-y]
- 42. Impact of human gene annotations on RNA-seq differential ... [https://bmcgenomics.biomedcentral.com/articles/10.1186/s12864-021-08038-7]
- 43. Long-read RNA-seq demarcates cis- and trans-directed ... [https://www.nature.com/articles/s41467-025-64605-6]
- 44. Long-read sequencing reveals the RNA isoform repertoire of ... [https://genomebiology.biomedcentral.com/articles/10.1186/s13059-025-03724-1]
- 45. A comprehensive assessment of RNA-seq accuracy ... [https://pmc.ncbi.nlm.nih.gov/articles/PMC4321899/]
- 46. Efficiency, sensitivity and specificity of a quantitative real- ... [https://pubmed.ncbi.nlm.nih.gov/35709972/]
- 47. Is qPCR More Accurate Than PCR? | PHCbi [https://www.phchd.com/eu/biomedical/knowledge-base/is-qpcr-more-accurate-than-pcr]
- 48. Cost comparison for qRT-PCR and RNA-Seq [https://www.rna-seqblog.com/cost-comparison-for-qrt-pcr-and-rna-seq/]
- 49. RNA sequencing: better choice than qPCR? - OHMX.bio [https://ohmx.bio/blogs/rna-sequencing-better-choice-than-qpcr/]
- 50. A comprehensive assessment of RNA-seq protocols for ... [https://bmcgenomics.biomedcentral.com/articles/10.1186/s12864-017-3827-y]
- 51. How To Interpret RT-qPCR Results [https://www.goldbio.com/blogs/articles/how-to-interpret-rt-qpcr-results?srsltid=AfmBOoottnkDJcKNhnSUAIF3Ap4teNAzey32aRRQCtiCgLo64dGFMitd]
- 52. HeraNorm: an R shiny application for identifying optimal ... [https://pmc.ncbi.nlm.nih.gov/articles/PMC12596163/]
- 53. Transcriptomic Biomarkers to Discriminate Bacterial ... - PMC [https://pmc.ncbi.nlm.nih.gov/articles/PMC5529430/]
- 54. High-content, targeted RNA-seq screening in organoids for ... [https://www.sciencedirect.com/science/article/pii/S2211124721003405]
- 55. Ultrasensitive detection of clinical pathogens through a ... [https://www.nature.com/articles/s41467-025-59219-x]
- 56. Advancing quantitative PCR with color cycle multiplex ... [https://pmc.ncbi.nlm.nih.gov/articles/PMC11417387/]
- 57. From bench to bytes: a practical guide to RNA sequencing ... [https://www.frontiersin.org/journals/genetics/articles/10.3389/fgene.2025.1697922/full]
- 58. Gene Expression Analysis Market Outlook 2025-2030: [https://www.globenewswire.com/news-release/2025/05/21/3085487/0/en/Gene-Expression-Analysis-Market-Outlook-2025-2030-Overcoming-Challenges-such-as-Data-Complexities-and-Cost-Barriers.html]
- 59. RNA Analysis Market Driven by Single-Cell Sequencing [https://www.towardshealthcare.com/insights/rna-analysis-market-sizing]
- 60. Budgeting for an mRNA-seq project? How much does RNA ... [https://alitheagenomics.com/blog/budgeting-for-an-mrna-seq-project-here-are-the-main-cost-drivers-to-keep-an-eye-on]
- 61. Gene Expression Analysis: RNA-Seq or Real-Time PCR? [https://nordicbiosite.com/blog/gene-expression-analysis-rna-seq-or-real-time-pcr]
- 62. Troubleshooting Non-Specific Amplification [https://bento.bio/resources/bento-lab-advice/troubleshooting-non-specific-amplification-with-bento-lab/]
- 63. Top Ten Pitfalls in Quantitative Real-time PCR Primer ... [https://www.thermofisher.com/us/en/home/references/ambion-tech-support/rtpcr-analysis/general-articles/top-ten-pitfalls-in-quantitative-real-time-pcr-primer.html]
- 64. qPCR and qRT-PCR analysis: Regulatory points to ... [https://pmc.ncbi.nlm.nih.gov/articles/PMC7786041/]
- 65. Understanding Ct Values in Real-Time PCR [https://www.thermofisher.com/blog/behindthebench/understanding-ct-values/]
- 66. Reverse Transcription: The Most Common Pitfalls! [https://bitesizebio.com/32253/the-most-common-issues-with-reverse-transcription/]
- 67. PCR/qPCR Data Analysis [https://www.sigmaaldrich.com/US/en/technical-documents/technical-article/genomics/qpcr/data-analysis?srsltid=AfmBOooPIwMZzga3-AX3AB7HOoTU6w2ZS7qAWOgdfVjcICQNRzXZse_K]
- 68. qPCR Double Delta Ct Analysis in 4 Easy Steps [https://bitesizebio.com/24894/4-easy-steps-to-analyze-your-qpcr-data-using-double-delta-ct-analysis/]
- 69. A Beginner's Guide to Analysis of RNA Sequencing Data [https://pmc.ncbi.nlm.nih.gov/articles/PMC6096346/]
- 70. A comprehensive workflow for optimizing RNA-seq data analysis [https://bmcgenomics.biomedcentral.com/articles/10.1186/s12864-024-10414-y]
- 71. Evaluation of normalisation strategies for qPCR data ... [https://www.nature.com/articles/s41598-025-06657-8]
- 72. Analyzing qPCR data: Better practices to facilitate rigor and ... [https://www.sciencedirect.com/science/article/pii/S2405580825004431]
- 73. Consider SNPs when designing PCR and qPCR assays | IDT [https://www.idtdna.com/page/support-and-education/decoded-plus/considering-snps-when-designing-pcr-and-qpcr-assays/]
- 74. Using qPCR for single-nucleotide Polymorphisms (SNP) [https://swordbio.com/blog/using-qpcr-for-single-nucleotide-polymorphisms-snp/]
- 75. Primer designing tool - NCBI - NIH [https://www.ncbi.nlm.nih.gov/tools/primer-blast/]
- 76. a practical guide to RNA sequencing data analysis [https://pmc.ncbi.nlm.nih.gov/articles/PMC12599993/]
- 77. Top Bioinformatics Tools for RNA Sequencing Data Analysis [https://riveraxe.com/top-bioinformatics-tools-for-rna-sequencing-data-analysis-best-value-for-your-research/]
- 78. Comparison of Short-Read Sequence Aligners Indicates ... [https://www.frontiersin.org/journals/plant-science/articles/10.3389/fpls.2021.657240/full]
- 79. STAR, HISAT2, BWA for RNA or DNA Sequencing [https://www.linkedin.com/posts/bulut-hamali_bioinformatics-ngs-genomics-activity-7348357499135107073-0_ja]
- 80. Comparison of TMM (edgeR), RLE (DESeq2), and MRN ... [https://www.rna-seqblog.com/comparison-of-tmm-edger-rle-deseq2-and-mrn-normalization-methods/]
- 81. How to Analyze RNAseq Data for Absolute Beginners Part 20 [https://ngs101.com/how-to-analyze-rnaseq-data-for-absolute-beginners-part-20-comparing-limma-deseq2-and-edger-in-differential-expression-analysis/]
- 82. How to Select Endogenous Controls for Real-Time PCR [https://www.thermofisher.com/us/en/home/life-science/pcr/real-time-pcr/real-time-pcr-learning-center/gene-expression-analysis-real-time-pcr-information/choosing-endogenous-control-gene-expression-analysis-real-time-pcr.html]
- 83. A Systematic Review of Endogenous Controls in Gene ... [https://journals.plos.org/plosone/article?id=10.1371/journal.pone.0141853]
- 84. Selection and validation of suitable reference genes for ... [https://www.nature.com/articles/s41598-018-34236-7]
- 85. Validation of Endogenous Control Genes by Real-Time ... [https://pmc.ncbi.nlm.nih.gov/articles/PMC10887733/]
- 86. Evaluation of reference genes for gene expression analysis in ... [https://pmc.ncbi.nlm.nih.gov/articles/PMC11804088/]
- 87. RNA-Seq is not required to determine stable reference genes ... [https://pmc.ncbi.nlm.nih.gov/articles/PMC8912902/]
- 88. Robustness of differential gene expression analysis ... [https://www.sciencedirect.com/science/article/pii/S200103702100221X]
- 89. The Ultimate qPCR Experiment: Producing Publication ... [https://www.sciencedirect.com/science/article/pii/S0167779918303421]
- 90. Why qPCR Still Leads in Cancer Detection | Meridian Bioscience [https://www.meridianbioscience.com/lifescience-blog/why-qpcr-still-leads-in-oncology/]
- 91. Ultra fast PCR thermal cycler: NextGenPCR™ [https://www.nextgenpcr.com/]
- 92. Fully-Automated PCR System Market 2025 [https://www.linkedin.com/pulse/fully-automated-pcr-system-market-2025-bright-horizon-media-report-17qdf]
- 93. Best PCR Machines for Diagnostics: A Comprehensive ... [https://labequipmentdirect.com/blogs/lab-equipment-guides-applications/best-pcr-machines-clinical-diagnostic-labs?srsltid=AfmBOoqXgQCq4BKglwKKeYRAcfLYYzSWKX3eaJ0NaIDU0L2VXsvdJO6W]
- 94. Fully-Automated PCR System Strategic Insights: Analysis ... [https://www.datainsightsmarket.com/reports/fully-automated-pcr-system-1008930]
- 95. The Most Important Products for Biology Laboratories ... [https://www.mrclab.com/the-most-important-products-for-biology-laboratories-for-2025]
- 96. Roche launches next-generation qPCR system to advance ... [https://diagnostics.roche.com/global/en/news-listing/2023/roche-launches-next-generation-qpcr-system-to-advance-clinical-needs.html]
- 97. Why qPCR and WB results are not consistent 2025- ... [https://www.antibodysystem.com/archive/380.html]
- 98. RNA-Seq is not required to determine stable reference genes for qPCR normalization | PLOS Computational Biology [https://journals.plos.org/ploscompbiol/article?id=10.1371/journal.pcbi.1009868]
- 99. Quantitative real time polymerase chain reaction in drug ... [https://pmc.ncbi.nlm.nih.gov/articles/PMC7163540/]
- 100. Drug Response RNA Biomarker Discovery and Profiling [https://www.illumina.com/areas-of-interest/genomics-in-drug-development/ngs-for-drug-development/rna-biomarker-discovery-profiling.html]
- 101. Replicability of bulk RNA-Seq differential expression and ... [https://pmc.ncbi.nlm.nih.gov/articles/PMC12077797/]
- 102. Power analysis for RNA-Seq differential expression studies [https://www.rna-seqblog.com/power-analysis-for-rna-seq-differential-expression-studies/]
- 103. Precision and Accuracy in Quantitative Measurement of Gene ... [https://pmc.ncbi.nlm.nih.gov/articles/PMC11042208/]
- 104. Technical Variations in Low-Input RNA-seq Methodologies [https://www.nature.com/articles/srep03678]
- 105. InterOpt: Improved gene expression quantification in qPCR ... [https://www.sciencedirect.com/science/article/pii/S2589004223020229]
- 106. The impact of PCR duplication on RNAseq data generated ... [https://genomebiology.biomedcentral.com/articles/10.1186/s13059-025-03613-7]
- 107. A systematic benchmark of Nanopore long-read RNA ... [https://www.nature.com/articles/s41592-025-02623-4]
- 108. Benchmarking of RNA-sequencing analysis workflows ... [https://pubmed.ncbi.nlm.nih.gov/28484260/]
- 109. Selection and validation of reference genes for ... [https://www.sciencedirect.com/science/article/pii/S1642431X25000300]
- 110. Consensus guidelines for the validation of qRT-PCR ... [https://pmc.ncbi.nlm.nih.gov/articles/PMC8792405/]
- 111. scMODAL: a general deep learning framework for ... [https://www.nature.com/articles/s41467-025-60333-z]
- 112. Perturb-Multimodal: a platform for pooled genetic screens with ... [https://pmc.ncbi.nlm.nih.gov/articles/PMC12324982/]