RNA-seq Normalization Methods: A Practical Guide for Exploratory Analysis in Biomedical Research
This article provides a comprehensive guide to RNA-seq normalization, a critical step for ensuring the biological validity of exploratory transcriptomic analysis.
RNA-seq Normalization Methods: A Practical Guide for Exploratory Analysis in Biomedical Research
Abstract
This article provides a comprehensive guide to RNA-seq normalization, a critical step for ensuring the biological validity of exploratory transcriptomic analysis. Tailored for researchers and drug development professionals, we demystify the core principles, practical applications, and common pitfalls of normalization methods. Starting with foundational concepts, we progress through a detailed comparison of within-sample and between-sample techniques like TPM, FPKM, TMM, and RLE, highlighting their suitability for different analytical goals. The guide further covers troubleshooting for complex datasets, including those with global expression shifts or copy number variations, and outlines best practices for validation. By integrating methodological insights with benchmarks from recent studies, this resource empowers scientists to confidently select and apply normalization strategies that enhance the reliability and interpretability of their exploratory RNA-seq findings in disease research and therapeutic development.
Laying the Groundwork: Why RNA-seq Normalization is Essential for Exploratory Analysis
In RNA sequencing (RNA-seq) analysis, the journey from raw data to biological insight is fraught with technical challenges. Technical variability introduced during library preparation, sequencing, and data processing can obscure true biological signals, leading to inaccurate conclusions in exploratory research and drug development [1] [2]. Normalization serves as a critical statistical correction process that adjusts raw count data to account for these non-biological artifacts, enabling meaningful comparison of gene expression levels within and between samples [1]. Without appropriate normalization, even well-designed studies may generate false positives or miss genuine differential expression, compromising research validity and therapeutic discovery efforts.
The fundamental sources of technical variability in RNA-seq data include:
- Sequencing depth: Variation in the total number of sequenced reads across samples [1]
- Gene length bias: Longer transcripts generating more reads independent of actual expression levels [1]
- GC-content effects: Sequence-specific biases where guanine-cytosine content influences read count efficiency [2]
- Batch effects: Systematic technical variations introduced when samples are processed at different times, locations, or by different personnel [1]
- Library composition differences: Varying expression profiles between samples affecting relative abundance measurements [1]
This application note provides a comprehensive framework for addressing these challenges through appropriate normalization strategies, with specific protocols and analytical tools tailored for research scientists in pharmaceutical and academic settings.
Understanding Normalization Stages
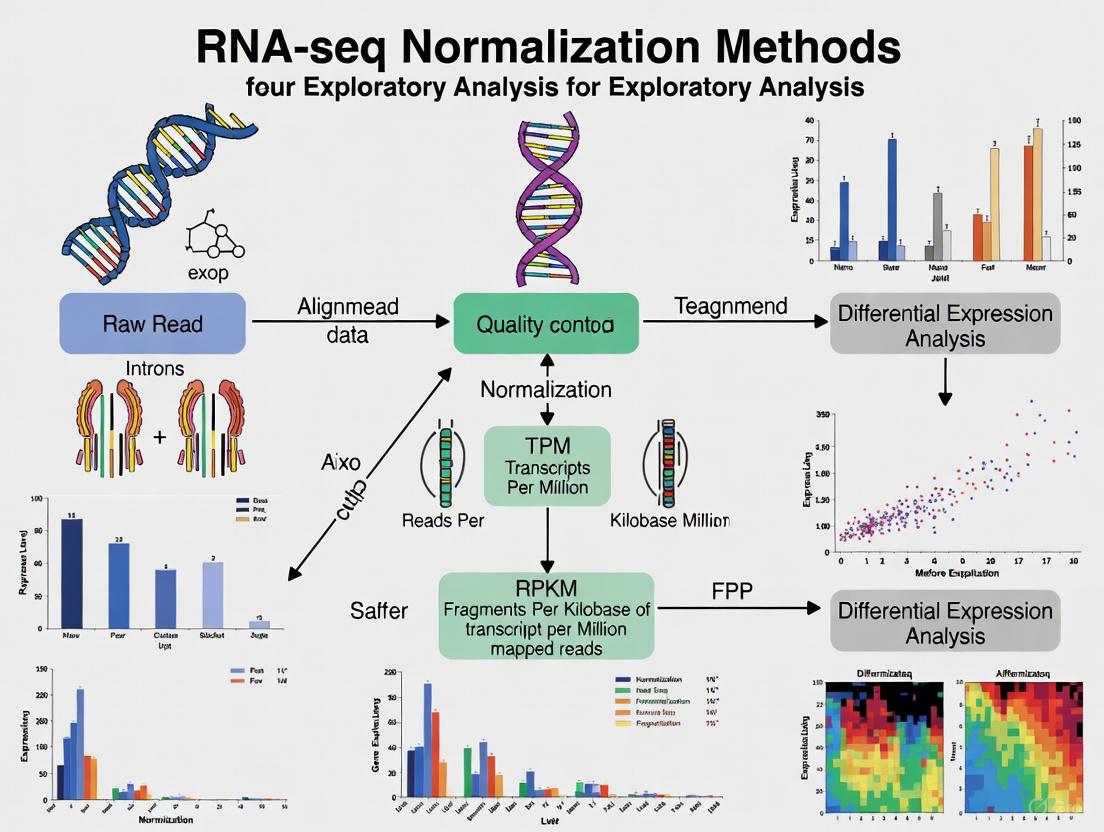
RNA-seq normalization methods can be categorized into three distinct stages, each addressing different aspects of technical variability. The appropriate application of these stages depends on the specific biological questions being addressed and the nature of the sample comparisons required.
Within-Sample Normalization
Within-sample normalization enables meaningful comparison of expression levels between different genes within the same sample. This stage addresses two primary technical variables: transcript length and sequencing depth [1]. Longer genes naturally produce more sequencing fragments than shorter genes at identical expression levels, creating a length bias that must be corrected for accurate intra-sample gene comparison [1]. Common methods for within-sample normalization include:
Table 1: Within-Sample Normalization Methods
| Method | Description | Formula | Applications | Limitations |
|---|---|---|---|---|
| CPM (Counts Per Million) | Normalizes for sequencing depth only | CPM = (Reads mapped to gene / Total mapped reads) × 10^6 |
Preliminary data screening; requires additional between-sample normalization for comparisons [1] | Does not account for gene length differences [1] |
| FPKM/RPKM (Fragments/Reads Per Kilobase per Million) | Normalizes for both sequencing depth and gene length | FPKM = (Reads mapped to gene / (Gene length in kb × Total mapped reads in millions)) |
Single-end (RPKM) or paired-end (FPKM) data; within-sample gene expression comparison [1] | Values depend on total transcript population; problematic for between-sample comparisons [1] |
| TPM (Transcripts Per Million) | Normalizes for sequencing depth and gene length with different calculation order | TPM = (Reads mapped to gene / Gene length in kb) / (Sum of length-normalized counts) × 10^6 |
Within-sample comparisons; preferred over FPKM/RPKM as sum of TPMs is consistent across samples [1] | Still requires between-sample normalization for cross-sample comparisons [1] |
Between-Sample Normalization
Between-sample normalization addresses technical variations when comparing the same gene across different samples. This stage is essential for differential expression analysis and assumes that most genes are not differentially expressed between samples [1]. These methods calculate sample-specific scaling factors to remove distributional differences while preserving biological signals.
Table 2: Between-Sample Normalization Methods
| Method | Description | Algorithm | Advantages | Implementation |
|---|---|---|---|---|
| TMM (Trimmed Mean of M-values) | Uses a reference sample and calculates scaling factors based on fold changes after trimming extreme values [1] | 1. Select reference sample; 2. Calculate log fold changes (M-values) and absolute expression levels (A-values); 3. Trim extreme values; 4. Compute weighted mean of M-values; 5. Calculate scaling factors [1] | Robust to differentially expressed genes; performs well with compositionally different samples [1] | Available in edgeR package [3] |
| RLE (Relative Log Expression) | Calculates median ratio of each gene to a pseudo-reference sample | 1. Create pseudo-reference sample from geometric means of all genes; 2. Calculate ratio of each gene to pseudo-reference; 3. Compute median ratio for each sample; 4. Use as scaling factor [3] | Effective for large datasets; stable performance across various conditions [3] | Available in DESeq2 package [3] |
| Quantile | Forces the distribution of gene expression to be identical across samples | 1. Rank genes by expression in each sample; 2. Calculate average expression for each rank across samples; 3. Replace original values with rank averages; 4. Restore original gene order [1] | Removes global distribution differences; standardizes expression profiles [1] | Available in various packages including limma |
Cross-Dataset Normalization
Cross-dataset normalization becomes necessary when integrating RNA-seq data from multiple independent studies, sequencing batches, or experimental platforms. Batch effects often represent the greatest source of variation in combined datasets and can completely obscure true biological differences if left uncorrected [1]. These methods adjust for both known (e.g., sequencing date, facility) and unknown technical variables.
Table 3: Cross-Dataset Normalization Methods
| Method | Description | Approach | Considerations |
|---|---|---|---|
| ComBat | Empirical Bayes batch effect correction | Uses parametric empirical Bayes framework to adjust for batch effects while preserving biological signals; works well with small sample sizes by "borrowing" information across genes [1] | Requires pre-specified batch variables; assumes batch effects are systematic and additive |
| Limma | Linear models with empirical Bayes moderation | Fits linear models to expression data and applies empirical Bayes moderation to variance estimates; includes functions for removing batch effects [1] | Flexible framework for complex experimental designs; can incorporate multiple batch variables |
| SVA (Surrogate Variable Analysis) | Correction for unknown sources of variation | Identifies and estimates surrogate variables that represent unmodeled technical variation; particularly useful when batch information is incomplete or unknown [1] | Does not require pre-specification of batch variables; may capture biological variation if not carefully implemented |
Figure 1: RNA-seq Normalization Workflow. This diagram illustrates the sequential approach to addressing technical variability through three normalization stages.
Comparative Analysis of Normalization Methods
Performance Benchmarking in Metabolic Modeling
Recent benchmarking studies provide empirical evidence for normalization method performance in specific applications. A 2024 study published in npj Systems Biology and Applications evaluated five normalization methods (TPM, FPKM, TMM, GeTMM, and RLE) for transcriptome mapping on human genome-scale metabolic models (GEMs) using iMAT and INIT algorithms [3].
The research demonstrated that between-sample normalization methods (RLE, TMM, GeTMM) enabled production of condition-specific metabolic models with significantly lower variability in the number of active reactions compared to within-sample methods (FPKM, TPM) [3]. Specifically:
- Models generated with TPM and FPKM normalized data showed high sample-to-sample variability in reaction counts
- RLE, TMM, and GeTMM approaches produced more consistent model sizes with lower variability
- Between-sample methods demonstrated superior accuracy in capturing disease-associated genes (~0.80 for Alzheimer's disease and ~0.67 for lung adenocarcinoma)
- All methods showed improved accuracy when covariate adjustment was applied for age, gender, and post-mortem interval [3]
Table 4: Benchmark Results of Normalization Methods in Metabolic Modeling
| Normalization Method | Model Variability | AD Gene Accuracy | LUAD Gene Accuracy | Reaction Detection | Covariate Adjustment Benefit |
|---|---|---|---|---|---|
| TPM | High | Moderate | Moderate | High false positives | Significant improvement |
| FPKM | High | Moderate | Moderate | High false positives | Significant improvement |
| TMM | Low | High (~0.80) | Moderate (~0.67) | Balanced | Moderate improvement |
| RLE | Low | High (~0.80) | Moderate (~0.67) | Balanced | Moderate improvement |
| GeTMM | Low | High (~0.80) | Moderate (~0.67) | Balanced | Moderate improvement |
Method Selection Guidelines
Choosing the appropriate normalization method depends on experimental design, sample characteristics, and analytical goals:
- For single-sample analyses (e.g., pathway enrichment within one condition): TPM provides appropriate within-sample comparability [1]
- For differential expression across conditions: TMM or RLE offer robust performance, particularly with compositionally different samples [1] [3]
- For multi-study integrations: Sequential application of within-sample, between-sample, and cross-dataset normalization is recommended [1]
- For metabolic modeling applications: RLE, TMM, or GeTMM are preferred to minimize false positive predictions [3]
- When covariates are influential: Apply covariate adjustment after normalization to remove age, gender, or technical effects [3]
Experimental Protocols
Protocol 1: Comprehensive RNA-seq Normalization Workflow
Objective: Implement a complete normalization pipeline for differential expression analysis from raw count data.
Materials:
- RNA-seq count matrix (genes × samples)
- Sample metadata (experimental conditions, batches, covariates)
- R statistical environment (version 4.0 or higher)
- Required R packages: edgeR, DESeq2, limma, sva
Figure 2: Experimental Normalization Protocol. This workflow guides method selection based on experimental design and data characteristics.
Procedure:
Data Preprocessing and Quality Control
- Load count matrix and metadata into R
- Filter low-expressed genes (recommended: require >1 count per million in at least X samples, where X is the size of the smallest group)
- Examine sample relationships with PCA to identify potential batch effects and outliers
Within-Sample Normalization (TPM)
Between-Sample Normalization (TMM)
Batch Effect Correction (ComBat)
Covariate Adjustment
Validation Steps:
- Post-normalization PCA should show clustering by biological condition rather than technical batches
- Distribution of expression values should be similar across samples after normalization
- Positive control genes with known expression patterns should maintain expected behavior
Protocol 2: Conditional Quantile Normalization for GC Content Bias
Objective: Address sequence-specific biases, particularly GC-content effects, that impact counting efficiency [2].
Background: GC-content has been shown to strongly influence gene expression measurements in RNA-seq data, creating sample-specific effects that can generate false positives if uncorrected [2]. This protocol combines robust generalized regression to remove GC-content bias with quantile normalization to correct global distortions.
Materials:
- RNA-seq count matrix
- Gene-level GC content values (can be calculated from reference sequences)
- R packages: preprocessCore, dplyr
Procedure:
Calculate GC Content for Each Gene
Perform Conditional Quantile Normalization
Validate GC Bias Reduction
- Plot expression values against GC content before and after correction
- Correlation between GC content and expression should be minimized after correction
- Check preservation of biological signals using positive control genes
Performance Notes: This approach has been shown to improve measurement precision by 42% without loss of accuracy in benchmark studies [2].
Research Reagent Solutions
Table 5: Essential Research Reagents and Computational Tools for RNA-seq Normalization
| Category | Item/Resource | Specification/Function | Application Context |
|---|---|---|---|
| Bioinformatics Packages | edgeR (R package) | Implementation of TMM normalization and related differential expression methods [1] [3] | Between-sample normalization; differential expression analysis |
| DESeq2 (R package) | Implementation of RLE normalization and negative binomial-based differential expression [3] | Between-sample normalization; large dataset analysis | |
| limma (R package) | Linear modeling framework with empirical Bayes moderation; batch correction tools [1] | Cross-dataset normalization; complex experimental designs | |
| sva (R package) | Surrogate variable analysis for unknown batch effects; ComBat for known batches [1] | Batch effect correction; multi-study integrations | |
| Reference Materials | ERCC RNA Spike-In Mixes | Synthetic exogenous RNA controls with known concentrations | Normalization quality assessment; technical variability monitoring |
| UCSC Genome Browser | Reference genome sequences and annotations | Gene length information; GC content calculation | |
| Quality Assessment Tools | FastQC | Quality control metrics for raw sequencing data | Pre-normalization data quality evaluation |
| MultiQC | Aggregate results from multiple bioinformatics tools across all samples | Comprehensive quality assessment pre- and post-normalization | |
| Data Resources | GENCODE | Comprehensive human and mouse gene annotations | Accurate gene model definitions for length normalization |
| Sequence Read Archive (SRA) | Public repository of raw sequencing data | Access to data for method validation and comparison |
Effective correction of technical variability through appropriate normalization remains a cornerstone of robust RNA-seq analysis in exploratory research and drug development. The hierarchical approach addressing within-sample, between-sample, and cross-dataset variability provides a systematic framework for generating reliable transcriptional profiles. Method selection should be guided by experimental design, with between-sample methods (TMM, RLE) generally preferred for differential expression analysis and cross-sample comparisons. As demonstrated in recent benchmarking studies, these methods reduce variability in downstream applications while maintaining sensitivity to true biological signals. Implementation of the protocols outlined herein will enhance data quality, improve reproducibility, and strengthen biological conclusions derived from RNA-seq experiments in pharmaceutical and basic research settings.
RNA sequencing (RNA-seq) has become the predominant method for transcriptome profiling, but the raw data generated contains technical biases that must be corrected through normalization to reveal true biological signals. These technical variations originate from multiple sources, including sequencing depth (number of reads per sample), gene length (longer genes accumulate more reads), and sample-to-sample variability introduced during library preparation and sequencing runs. Effective normalization is therefore essential for accurate biological interpretation [1].
The normalization process occurs across three distinct hierarchical stages: within-sample (enabling gene expression comparison within a single sample), between-sample (enabling comparison across multiple samples within a dataset), and across datasets (enabling integration of data from different studies or batches). Each stage addresses specific technical challenges and employs different mathematical approaches to ensure data reliability [1]. This protocol outlines comprehensive methodologies for each normalization stage, providing researchers with practical guidance for implementing these techniques in exploratory transcriptome analysis.
The Three Stages of Normalization
Within-Sample Normalization
Purpose and Applications: Within-sample normalization methods adjust for technical variations that affect gene expression measurements within individual samples. The primary goals are to correct for gene length bias (longer genes naturally have more mapped reads) and sequencing depth (total number of reads per sample) to enable meaningful comparisons of expression levels between different genes within the same sample [1]. These normalized values are particularly valuable for assessing the relative abundance of various transcripts within a single biological specimen.
Commonly Used Methods:
- FPKM/RPKM: Fragments per kilobase of transcript per million fragments mapped (FPKM) for paired-end data and reads per kilobase of transcript per million reads mapped (RPKM) for single-end data correct for both library size and gene length. These units are appropriate for comparing gene expression within a single sample but have limitations for between-sample comparisons because the expression of a gene in one sample can appear different from its expression in another sample even at identical true expression levels [1].
- TPM: Transcripts per million (TPM) is considered an improvement over FPKM/RPKM. It represents the relative number of transcripts you would detect for a gene if you had sequenced one million full-length transcripts. The calculation involves dividing the number of reads mapped to a transcript by the transcript length, then dividing this value by the sum of mapped reads to all transcripts after normalization for transcript length, and multiplying by one million. A key advantage is that the sum of all TPMs in each sample is the same, reducing variation between samples [1].
Table 1: Within-Sample Normalization Methods
| Method | Full Name | Correction Factors | Primary Application | Key Characteristics |
|---|---|---|---|---|
| CPM | Counts Per Million | Sequencing depth | Preliminary normalization | Does not correct for gene length; requires additional between-sample normalization [1] |
| FPKM | Fragments Per Kilobase Million | Gene length & sequencing depth | Within-sample comparisons | Paired-end data; sample-specific relative abundance affects comparisons [1] |
| RPKM | Reads Per Kilobase Million | Gene length & sequencing depth | Within-sample comparisons | Single-end data; similar limitations to FPKM [1] |
| TPM | Transcripts Per Million | Gene length & sequencing depth | Within-sample comparisons | Sum of TPMs consistent across samples; preferred over FPKM/RPKM [1] |
Within a Dataset (Between-Sample) Normalization
Purpose and Applications: Between-sample normalization addresses technical variations that occur between different samples within the same dataset. These methods enable valid comparisons of gene expression levels for the same gene across different samples or experimental conditions. Without this crucial step, differences in library size and composition could masquerade as biological effects [1]. These methods typically operate on count matrices after within-sample normalization has been applied.
Commonly Used Methods:
- TMM: The Trimmed Mean of M-values method, implemented in the edgeR package, operates on the assumption that most genes are not differentially expressed. TMM calculates scaling factors to adjust library sizes by first selecting a reference sample, then computing fold changes and absolute expression levels of other samples relative to this reference. The method strategically "trims" the data to remove genes with extreme fold changes or high expression, and the trimmed mean of the fold changes is used to scale read counts [1].
- RLE: The Relative Log Expression method, used by DESeq2, similarly assumes that most genes are non-differential. RLE calculates a correction factor as the median of the ratios of all genes in a sample compared to a geometric mean reference sample. This correction factor is then applied to the read counts of individual genes [3].
- GeTMM: Gene length corrected Trimmed Mean of M-values represents a newer approach that combines gene-length correction with between-sample normalization, effectively bridging within-sample and between-sample normalization paradigms [3].
- Quantile: This method aims to make the distribution of gene expression levels identical for each sample in a dataset. It assumes global distribution differences between samples are technical in origin. The method ranks genes by expression level for each sample, calculates average values across all samples for genes of the same rank, and replaces original values with these averages before returning genes to their original order [1].
Performance Considerations: Benchmark studies comparing these normalization methods have demonstrated that between-sample methods (RLE, TMM, GeTMM) produce condition-specific metabolic models with considerably lower variability compared to within-sample methods (FPKM, TPM) when mapping RNA-seq data to genome-scale metabolic models. Specifically, between-sample methods more accurately capture disease-associated genes, with average accuracy of approximately 0.80 for Alzheimer's disease and 0.67 for lung adenocarcinoma in one comprehensive benchmark [3].
Across Datasets Normalization
Purpose and Applications: Also known as batch correction, across-datasets normalization addresses technical variations introduced when integrating RNA-seq data from multiple independent studies, sequencing centers, or time points. These "batch effects" can become the dominant source of variation in combined datasets, potentially masking true biological differences and leading to incorrect conclusions if not properly addressed [1]. This stage is particularly crucial for meta-analyses that combine publicly available datasets or for large studies conducted across multiple sequencing facilities.
Commonly Used Methods:
- ComBat: Part of the sva package, ComBat employs empirical Bayes methods to adjust for batch effects while preserving biological signals. The method works well even with small sample sizes because it "borrows" information across genes in each batch to create more robust adjustments. ComBat requires that batch variables are known in advance [1].
- Limma: The removeBatchEffect function in the limma package uses a linear modeling framework to eliminate technical batch effects from the expression data. Like ComBat, it requires known batch variables and should be applied after within-dataset normalization to ensure gene expression values are on the same scale between samples [1].
- Surrogate Variable Analysis (SVA): For cases where batch effects or other unknown sources of technical variation are present, SVA can identify and estimate these hidden factors. The method does not require prior knowledge of all batch variables and can effectively adjust for both known and unknown technical variations [1].
Table 2: Across-Datasets Normalization Methods
| Method | Implementation | Batch Information Requirement | Key Features |
|---|---|---|---|
| ComBat | sva R package | Known batches | Empirical Bayes framework; robust for small sample sizes [1] |
| Limma | limma R package | Known batches | Linear modeling framework; includes removeBatchEffect() function [1] |
| SVA | sva R package | Known or unknown batches | Identifies surrogate variables; corrects for hidden factors [1] |
Experimental Protocols
Protocol 1: Implementing Within-Sample Normalization
Required Materials and Software:
- Raw count matrix from RNA-seq alignment (e.g., from STAR/Salmon pipeline)
- R or Python environment with appropriate packages
- Gene annotation file with transcript lengths
Step-by-Step Procedure:
- Data Preparation: Load the raw count matrix into your analytical environment, ensuring proper formatting with genes as rows and samples as columns.
- Calculate Normalization Factors:
- For TPM: Divide each gene count by its transcript length in kilobases to obtain reads per kilobase (RPK). Sum all RPK values in a sample and divide by 1,000,000 to obtain per-million scaling factor. Divide each RPK value by this scaling factor to generate TPM values [1].
- For FPKM: Similar to TPM but with different order of operations - first normalize for sequencing depth then gene length.
- Validation: Verify that the sum of all TPM values for each sample equals 1,000,000, confirming correct calculation.
- Downstream Application: Use normalized values for within-sample analyses such as identifying highly expressed genes or pathway activity within individual samples.
Protocol 2: Implementing Between-Sample Normalization with TMM
Required Materials and Software:
- Within-sample normalized count matrix
- R statistical environment with edgeR package installed
- Experimental design metadata
Step-by-Step Procedure:
- Data Input: Create a DGEList object in edgeR containing your count data and sample information.
- Calculate Normalization Factors: Apply the
calcNormFactors()function with method="TMM" to compute scaling factors for each sample. - Data Transformation: Convert normalized counts to log2-counts-per-million (logCPM) using the
cpm()function with normalized library sizes. - Quality Assessment: Examine the distribution of samples using PCA plots or multidimensional scaling (MDS) plots to verify reduction of technical variability between replicates.
- Differential Expression: Proceed with differential expression analysis using the normalized counts as input to statistical models.
Protocol 3: Batch Correction Using ComBat
Required Materials and Software:
- Between-sample normalized expression matrix
- R environment with sva package installed
- Batch information metadata (sequencing date, facility, etc.)
Step-by-Step Procedure:
- Data Preparation: Ensure expression data has been previously normalized using between-sample methods. Log2-transform the data if not already transformed.
- Model Specification: Define a model matrix representing the biological groups of interest, and a separate vector indicating batch membership.
- Batch Correction: Execute the
ComBat()function with the expression data, batch vector, and model matrix as inputs. - Validation: Visualize corrected data using PCA plots to confirm reduction of batch-associated clustering while maintaining biological separation.
- Downstream Analysis: Use batch-corrected data for integrated analyses combining multiple datasets.
The Scientist's Toolkit
Table 3: Essential Research Reagent Solutions for RNA-seq Normalization
| Tool/Software | Primary Function | Application Context |
|---|---|---|
| edgeR | Bioconductor package implementing TMM normalization | Between-sample normalization for differential expression [3] |
| DESeq2 | Bioconductor package implementing RLE normalization | Between-sample normalization for differential expression [3] |
| sva | Bioconductor package with ComBat and SVA functions | Across-datasets batch effect correction [1] |
| limma | Bioconductor package with removeBatchEffect() function | Across-datasets normalization for linear models [1] |
| FastQC | Quality control tool for raw sequencing data | Initial data quality assessment before normalization [4] |
| Salmon | Alignment-free quantification of transcript abundance | Generation of count matrices for normalization [5] |
| STAR | Spliced-aware alignment of RNA-seq reads | Generation of alignment files for count quantification [5] |
| nf-core/rnaseq | Comprehensive RNA-seq analysis pipeline | Automated workflow including normalization steps [5] |
Workflow Visualization
Three-Stage RNA-seq Normalization Workflow
Covariate Adjustment Considerations
In complex datasets, particularly those from human studies, biological covariates such as age, gender, and post-mortem interval can significantly influence transcriptomic measurements. Recent research demonstrates that adjusting for these covariates during normalization can improve the accuracy of downstream analyses. For example, in studies of Alzheimer's disease and lung adenocarcinoma, covariate adjustment increased the accuracy of capturing disease-associated genes across all normalization methods [3].
The covariate adjustment process typically involves including these variables as covariates in the statistical models used for normalization. For between-sample normalization, this can be implemented through the design matrix in linear models, while for across-datasets normalization, known biological covariates should be included in the model to prevent their removal during batch correction procedures.
The three-stage framework for RNA-seq normalization provides a systematic approach to addressing technical variations at different levels of experimental design. Within-sample normalization enables accurate gene comparison within individual samples, between-sample normalization facilitates valid comparisons across experimental conditions, and across-datasets normalization allows integration of diverse data sources. Benchmark studies indicate that between-sample methods such as RLE, TMM, and GeTMM generally produce more reliable results for differential expression analysis compared to within-sample methods alone [3].
Implementation of this hierarchical normalization approach, with appropriate consideration of biological covariates, ensures that RNA-seq data accurately reflects biological truth rather than technical artifacts. This protocol provides the necessary foundation for researchers to make informed decisions about normalization strategies based on their specific experimental designs and analytical goals.
In RNA sequencing (RNA-seq) analysis, raw read counts serve as the fundamental data for transcriptome quantification. However, these counts are influenced by multiple technical biases that can obscure true biological signals if not properly addressed. Sequencing depth refers to the total number of reads sequenced per sample, which directly affects count magnitudes, while library composition describes the transcriptional makeup of each sample, where highly abundant transcripts can skew count distributions for less prevalent species [1] [6]. These biases represent significant challenges for exploratory analysis and differential expression studies, as they introduce systematic variations that are unrelated to biological conditions [7] [8]. Understanding and correcting for these technical artifacts is a prerequisite for obtaining biologically meaningful results from RNA-seq experiments, particularly in drug development contexts where accurate transcript quantification is essential for biomarker identification and therapeutic target validation [9]. This protocol examines the nature of these biases and provides methodological frameworks for their identification and correction within the broader context of RNA-seq normalization for exploratory analysis research.
Understanding Sequencing Depth Bias
Characteristics and Impact
Sequencing depth bias arises from fundamental properties of RNA-seq technology, where the total number of sequenced reads varies substantially between samples. This variation introduces technical noise that must be distinguished from biologically relevant expression differences.
Definition and Mechanism: Sequencing depth refers to the total number of reads obtained per sample, which directly influences raw count magnitudes. Samples with greater sequencing depth naturally yield higher counts for equivalently expressed genes, creating artificial differences that do not reflect true biological variation [1] [9]. This occurs because RNA-seq provides relative, rather than absolute, measures of transcript abundance, where each count represents a proportion of the total sequenced molecules in a library [6].
Impact on Downstream Analysis: Without appropriate correction, sequencing depth variation can severely compromise differential expression analysis. Statistical models in widely used tools like DESeq2 and edgeR rely on raw count distributions that assume library size differences have been accounted for in their internal normalization procedures [10] [11]. When depth biases remain uncorrected, they inflate variance estimates, reduce statistical power for detecting truly differentially expressed genes, and increase false discovery rates [9] [12].
Visual Identification: Exploratory data analysis provides effective methods for detecting sequencing depth biases. Simple diagnostic plots, such as boxplots of log-transformed counts per sample or principal component analysis (PCA) plots colored by total read depth, can reveal systematic patterns correlated with sequencing depth rather than experimental conditions [13] [12]. These visualizations serve as crucial quality control checkpoints before proceeding with formal statistical testing.
Practical Demonstration
The following example illustrates how sequencing depth bias manifests in real datasets and demonstrates appropriate normalization strategies:
Data Inspection: Begin by examining column sums across samples, which reveal substantial differences in total read counts. For example, in the Hammer et al. dataset, column sums range from approximately 4.5 million to 23.5 million reads, indicating nearly a 5-fold difference in sequencing depth between samples [12].
Normalization Implementation: Apply size factor estimation using the median-of-ratios method in DESeq2, which calculates scaling factors centered around 1. These factors represent robust estimates of relative sequencing depth that are less influenced by extremely highly expressed genes than simple total counts [12]. The resulting size factors can vary significantly; in the Hammer dataset, they range from 0.45 to 2.41, confirming substantial depth differences [12].
Visual Validation: Create diagnostic plots comparing raw library sizes to size factors, which should approximately follow a linear relationship. After normalization, PCA plots and sample clustering diagrams should show reduced grouping by sequencing batch and improved clustering by biological conditions, indicating successful mitigation of depth-related artifacts [13] [12].
Table 1: Common Normalization Methods Addressing Sequencing Depth Bias
| Method | Mechanism | Advantages | Limitations | Implementation |
|---|---|---|---|---|
| Counts Per Million (CPM) | Scales counts by total library size multiplied by 1 million | Simple, intuitive calculation | Fails to correct for composition effects; unsuitable for between-sample comparison [1] | Basic arithmetic on count matrix |
| DESeq2 Median-of-Ratios | Uses geometric mean across samples to estimate size factors | Robust to highly expressed genes; integrated into DESeq2 workflow [12] | Assumes most genes not differentially expressed | DESeq2::estimateSizeFactors() |
| Trimmed Mean of M-values (TMM) | Trims extreme log fold-changes and library sizes | Robust for between-sample normalization; implemented in edgeR [1] | Sensitive to the proportion of differentially expressed genes | edgeR::calcNormFactors() |
| Transcripts Per Million (TPM) | Normalizes for both sequencing depth and gene length | Suitable for within-sample comparisons [1] | Sums to constant across samples; not recommended for differential expression | Length-normalized counts divided by total length-scaled counts |
Understanding Library Composition Bias
Theoretical Foundation
Library composition bias represents a more subtle challenge than sequencing depth effects, arising from the relative nature of RNA-seq measurements and the finite sampling capacity of sequencing platforms.
Fundamental Principle: RNA-seq measures transcript abundance in relative terms, where each count reflects the proportion of that transcript within the total RNA pool rather than its absolute cellular concentration [6]. This proportional relationship means that changes in the abundance of a few highly expressed genes can create apparent changes in all other genes, even when their absolute expression remains constant [6] [9].
Mathematical Basis: The finite nature of sequencing resources creates a competitive relationship between transcripts. When one transcript population dramatically increases in abundance, it necessarily reduces the sequencing "budget" available for all other transcripts, creating artificial suppression effects for genes that are not truly differentially expressed [6]. This composition effect violates the assumption that total RNA content is constant across samples, which underpins simpler normalization approaches.
Biological Consequences: In treatment experiments where fundamental cellular processes are altered, total RNA output may change substantially between conditions. For example, drug treatments that affect metabolic activity or proliferation rates can globally impact transcription, creating systematic composition differences that complicate direct sample comparisons [6] [9]. These scenarios require specialized normalization approaches that can distinguish technical artifacts from biological effects.
Concrete Example and Implications
A hypothetical scenario illustrates how composition bias distorts expression measurements:
Table 2: Library Composition Bias Example (Read Counts)
| Gene | Group A | Group B | True Expression Status |
|---|---|---|---|
| Gene1 | 500 | 0 | Differentially expressed |
| Gene2 | 500 | 0 | Differentially expressed |
| Gene3 | 500 | 1000 | Not differentially expressed |
| Gene4 | 500 | 1000 | Not differentially expressed |
| Total | 2000 | 2000 |
In this example, both groups have identical total reads (2000), but Genes 1 and 2 are exclusively expressed in Group A, while Genes 3 and 4 show identical expression in both groups. Without composition-aware normalization, all four genes would appear differentially expressed due to the redistribution of sequencing resources, leading to false conclusions [6]. Advanced normalization methods like TMM and median-of-ratios address this by identifying invariant genes across samples and using them to calculate scaling factors that adjust for composition effects [1] [6].
Integrated Experimental Protocol for Bias Identification and Correction
Sample Preparation and Library Construction
The initial experimental phases introduce biases that propagate through subsequent analysis stages. Implementing standardized protocols during these steps minimizes technical variability.
RNA Extraction and Quality Control: Begin with high-quality RNA extraction using silica-gel-based column procedures (e.g., mirVana miRNA isolation kit), which provide superior yield and quality compared to TRIzol-based methods, especially for non-coding RNAs [7]. Assess RNA integrity using appropriate methods (e.g., RIN scores), acknowledging that degraded samples require higher input amounts to compensate for fragment loss. For formalin-fixed paraffin-embedded (FFPE) samples, employ specialized protocols that minimize cross-linking and chemical modifications during nucleic acid extraction [7].
Library Preparation Considerations: During library construction, select fragmentation methods that minimize sequence-specific biases. Chemical fragmentation (e.g., zinc-based) demonstrates superior randomness compared to enzymatic approaches (e.g., RNase III) [7]. For mRNA enrichment, consider ribosomal RNA depletion rather than poly-A selection to avoid 3'-end capture bias, particularly when working with degraded samples or non-polyadenylated transcripts [7]. Employ adapter ligation strategies that incorporate random nucleotides at ligation junctions to reduce sequence-specific preferences of T4 RNA ligases [7].
Amplification Controls: Implement careful PCR amplification protocols using high-fidelity polymerases (e.g., Kapa HiFi) and minimize cycle numbers to reduce duplication biases and GC-content effects [7]. For extreme GC-rich or AT-rich genomes, incorporate PCR additives like TMAC or betaine, and optimize extension temperatures and denaturation times to ensure uniform amplification across different transcript types [7].
Bioinformatic Processing and Quality Assessment
Following sequencing, computational methods identify and quantify residual biases, enabling appropriate normalization strategy selection.
Read Alignment and Quantification: Process raw FASTQ files through quality control using FastQC or multiQC to identify adapter contamination, unusual base composition, or other technical artifacts [9]. Perform adapter trimming with tools like Trimmomatic or Cutadapt, avoiding over-trimming that unnecessarily reduces usable read depth [9]. Align reads to reference genomes using splice-aware aligners (STAR, HISAT2) or employ alignment-free quantification methods (Salmon, kallisto) that incorporate sequence-specific bias correction directly in abundance estimation [11] [9].
Bias Detection and Diagnostic Visualization: Generate diagnostic plots to identify systematic biases before normalization. Create density plots of log-counts per sample to detect distributional differences related to sequencing depth [13]. Plot GC content versus gene expression to identify sequence composition biases, where specific GC ranges show consistently elevated or depressed expression across samples [8]. Implement correlation heatmaps of samples to identify batch effects and outliers that may indicate technical artifacts rather than biological variation [13].
Normalization Strategy Selection: Based on diagnostic results, select appropriate normalization methods. For datasets with balanced library composition and minimal global expression shifts, standard depth-based methods (CPM, TPM) may suffice [1]. When composition biases are evident, employ advanced methods (TMM, median-of-ratios) that explicitly account for these effects [1] [6]. For experiments with extreme differential expression or expected global transcriptional changes, consider using spike-in controls or housekeeping gene-based normalization to establish absolute scaling factors [6] [9].
The following workflow diagram illustrates the comprehensive process for addressing both sequencing depth and library composition biases:
Diagram 1: Bias Correction Workflow. This diagram outlines the sequential process for identifying and correcting sequencing depth and library composition biases in RNA-seq data analysis.
The Scientist's Toolkit: Essential Research Reagents and Computational Tools
Successful management of RNA-seq biases requires both wet-lab reagents and computational resources. The following table catalogues essential materials for implementing the protocols described in this document.
Table 3: Research Reagent Solutions for RNA-seq Bias Mitigation
| Category | Item/Resource | Specific Example | Function/Purpose | Considerations |
|---|---|---|---|---|
| RNA Extraction | Column-based kits | mirVana miRNA isolation kit | High-yield RNA purification with preservation of small RNAs | Superior to TRIzol for non-coding RNA analysis [7] |
| RNA Quality Control | Bioanalyzer/TapeStation | Agilent Bioanalyzer RNA kits | RNA Integrity Number (RIN) assessment | Critical for evaluating input RNA quality [7] |
| Library Preparation | rRNA depletion kits | Illumina Ribo-Zero Plus | Removal of ribosomal RNA without 3' bias | Preferred over poly-A selection for degraded samples [7] |
| Fragmentation Reagents | Chemical fragmentation | Zinc-based fragmentation | Random fragmentation minimizing sequence bias | Alternative to enzymatic (RNase III) methods [7] |
| Amplification Enzymes | High-fidelity polymerases | Kapa HiFi Polymerase | Reduced amplification bias in GC-rich regions | Superior to Phusion for problematic genomic regions [7] |
| Computational Tools | Quality control | FastQC, MultiQC | Sequence quality assessment and report generation | Essential first step in processing pipeline [9] |
| Alignment Tools | Splice-aware aligners | STAR, HISAT2 | Accurate mapping across splice junctions | Critical for eukaryotic transcriptomes [10] [9] |
| Quantification Tools | Alignment-free methods | Salmon, kallisto | Rapid quantification with bias correction | Incorporates GC-bias and sequence-specific corrections [11] [9] |
| Normalization Software | Differential expression | DESeq2, edgeR | Statistical normalization accounting for multiple biases | Implements median-of-ratios (DESeq2) or TMM (edgeR) [10] [12] |
Sequencing depth and library composition biases represent fundamental challenges in RNA-seq analysis that systematically distort raw count data if left uncorrected. Through implementation of the standardized protocols and quality control measures outlined in this document, researchers can effectively distinguish technical artifacts from biological signals, substantially improving the reliability of downstream analyses. The integrated approach—combining careful experimental design with appropriate computational normalization strategies—ensures that conclusions regarding differential expression reflect true biological differences rather than methodological artifacts. As RNA-seq applications continue to expand in drug development and clinical research contexts, rigorous bias correction remains an essential prerequisite for generating biologically meaningful and reproducible transcriptomic insights.
RNA sequencing (RNA-seq) has become a fundamental tool for profiling transcriptomes, enabling researchers to explore gene expression across diverse biological conditions. A critical, yet often undervalued, step in this process is data normalization, which adjusts raw sequencing data to account for technical variations that can mask true biological signals. The choice of normalization method is not one-size-fits-all; it must be strategically aligned with the specific exploratory goals of the research. Incorrect normalization can introduce biases, leading to inaccurate biological interpretations and false discoveries. This Application Note provides a structured framework for selecting appropriate RNA-seq normalization methods based on distinct research objectives, complete with comparative data, experimental protocols, and decision-support tools for researchers and drug development professionals.
Understanding RNA-Seq Normalization Stages and Objectives
Normalization is essential because RNA-seq data contains technical biases from factors like sequencing depth (the total number of reads per sample), gene length (longer genes accumulate more reads), and RNA composition (differences in the transcript population between samples) [1]. Failure to correct for these variables can lead to misleading conclusions when comparing gene expression.
RNA-seq normalization methods can be categorized into three main stages, each serving a distinct purpose in the analytical pipeline [1]:
- Within-sample normalization enables the comparison of expression levels between different genes within the same sample. This is crucial for analyses such as identifying the most highly expressed genes in a single condition. Methods in this category correct for the fact that longer genes will naturally have more mapped reads than shorter genes expressed at the same actual level.
- Between-sample normalization enables the comparison of the expression of the same gene across different samples. This is the foundational step for differential expression analysis, where the goal is to find genes that are expressed at different levels between two or more conditions (e.g., diseased vs. healthy). These methods correct for differences in sequencing depth and composition across samples.
- Across-datasets normalization, or batch correction, is applied when integrating data from multiple independent studies sequenced at different times or facilities. This process removes technical "batch effects" that can be the largest source of variation, thereby masking true biological differences.
The following workflow outlines the logical decision process for selecting a normalization method based on the specific exploratory goal of your research.
A Comparative Guide to Normalization Methods
Different normalization methods employ distinct algorithms and assumptions, making them suitable for specific analytical scenarios. The table below summarizes the key methods, their formulas, primary applications, and important considerations for researchers.
Table 1: Comparative Analysis of Common RNA-seq Normalization Methods
| Normalization Method | Formula / Core Principle | Primary Use Case | Key Advantages | Key Limitations |
|---|---|---|---|---|
| TPM (Transcripts Per Million) [1] | ( \text{TPM}i = \frac{ \frac{\text{Reads}i}{\text{Transcript Length}i} }{ \sumj \frac{\text{Reads}j}{\text{Transcript Length}j} } \times 10^6 ) | Within-sample comparisons; active pathway identification. | Sum is constant across samples, allowing for better cross-sample comparison than FPKM. | Not sufficient for differential expression analysis without between-sample methods. |
| FPKM/RPKM [1] | ( \text{FPKM}i = \frac{\text{Reads}i}{(\text{Transcript Length}_i \times \text{Total Fragments})} \times 10^9 ) | Within-sample comparisons. | Corrects for both gene length and sequencing depth. | Values are not directly comparable between samples due to compositional bias. |
| TMM (Trimmed Mean of M-values) [3] [1] | Trims extreme log-fold changes (M-values) and absolute expression (A-values) to compute a scaling factor relative to a reference sample. | Between-sample comparisons; differential expression analysis. | Robust to a high proportion of differentially expressed genes. | Assumes most genes are not differentially expressed. |
| RLE (Relative Log Expression) [3] | Calculates a scaling factor as the median of the ratios of each gene's count to its geometric mean across all samples. | Between-sample comparisons; differential expression analysis. | Implemented in DESeq2; performs well even with many zeros. | Sensitive to outliers; assumes few genes are differentially expressed. |
| GeTMM (Gene length corrected TMM) [3] | Applies TMM normalization to counts that have first been adjusted for gene length (like in TPM). | Combines within- and between-sample comparisons. | Allows for comparison of expression levels both within and across samples. | A newer method with less established benchmarks across diverse datasets. |
The choice between these methods has a demonstrable impact on downstream biological conclusions. A 2024 benchmark study systematically evaluated normalization methods in the context of building condition-specific metabolic models using the iMAT algorithm [3]. The study revealed that:
- Between-sample methods (TMM, RLE, GeTMM) produced metabolic models with considerably lower variability in the number of active reactions compared to within-sample methods (TPM, FPKM) [3].
- Models derived from RLE, TMM, or GeTMM normalized data more accurately captured disease-associated genes, with an average accuracy of ~0.80 for Alzheimer's disease and ~0.67 for lung adenocarcinoma [3].
- Covariate adjustment (e.g., for age, gender) further increased the accuracy of models for all normalization methods, highlighting the importance of accounting for known biological confounders [3].
Experimental Protocols for Normalization and Evaluation
Protocol 1: Generating a Count Matrix for Downstream Normalization
Objective: To process raw RNA-seq FASTQ files into a gene-level count matrix, which serves as the input for all downstream normalization and differential expression analyses [14].
Materials:
- Computing Environment: Unix/Linux server or high-performance computing cluster.
- Software:
- FastQC: For initial quality control of raw FASTQ files.
- Trimmomatic or fastp: For adapter trimming and quality filtering.
- STAR aligner: For splicing-aware alignment of reads to a reference genome.
- featureCounts or HTSeq: For quantifying reads that map to genes.
Procedure:
- Quality Control: Run FastQC on all raw FASTQ files to assess per-base sequence quality, adapter contamination, and other potential issues.
- Trimming and Filtering: Use Trimmomatic or fastp to remove adapter sequences and low-quality bases. Example command for fastp:
fastp -i input_R1.fastq.gz -I input_R2.fastq.gz -o clean_R1.fastq.gz -O clean_R2.fastq.gz - Alignment: Align the cleaned reads to the appropriate reference genome (e.g., GRCh38 for human) using STAR.
STAR --genomeDir /path/to/GenomeDir --readFilesIn clean_R1.fastq.gz clean_R2.fastq.gz --runThreadN 12 --outSAMtype BAM SortedByCoordinate --outFileNamePrefix sample_aligned. - Quantification: Generate the gene-level count matrix by counting the number of reads overlapping each gene's exons using featureCounts.
featureCounts -T 8 -p -a annotation.gtf -o counts.txt *.bam
Output: A counts matrix file (counts.txt) where rows are genes, columns are samples, and values are raw integer counts. It is critical to use these raw counts, not pre-normalized values, as input for between-sample normalization methods in differential expression tools like DESeq2 or edgeR [14].
Protocol 2: Implementing and Evaluating Normalization Methods
Objective: To apply different normalization methods to the count matrix and evaluate their performance in a differential expression workflow.
Materials:
- Computing Environment: R statistical software environment.
- R/Bioconductor Packages:
DESeq2(for RLE),edgeR(for TMM),tximportorlimma.
Procedure:
- Data Input: Load the raw count matrix and sample metadata into R.
- Apply Normalization Methods:
- For RLE: Create a
DESeqDataSetobject and useestimateSizeFactors()to calculate RLE normalization factors. Thecounts()function withnormalized=TRUEreturns normalized counts. - For TMM: Create a
DGEListobject in edgeR and usecalcNormFactors()to calculate TMM scaling factors. - For TPM: Calculate using the formula in Table 1. Note that gene lengths must be estimated, often from the genomic annotations (GTF file) used in alignment.
- For RLE: Create a
- Exploratory Data Analysis (EDA): Evaluate the effect of normalization.
- Perform Principal Component Analysis (PCA) to visualize sample-to-sample distances. Well-normalized data should show clear separation by experimental condition, not by technical batch.
- Check for the presence of batch effects using PCA and sample distance heatmaps. If batches are present, proceed to batch correction.
- Batch Effect Correction: For data integration across studies, use the
removeBatchEffect()function in thelimmapackage or theComBat()function in thesvapackage on normalized (e.g., log-transformed TMM or RLE) data [1]. - Downstream Analysis: Proceed with differential expression testing using the appropriate statistical models in
DESeq2oredgeR, which incorporate their respective normalization factors internally.
Evaluation Checkpoint: A key indicator of successful normalization is reduced technical variability in EDA plots. Between-sample normalization methods like TMM and RLE are expected to produce more tightly clustered replicates in PCA plots compared to unnormalized data or within-sample methods when the goal is cross-sample comparison [3].
Table 2: Key Software and Resources for RNA-seq Normalization
| Tool / Resource Name | Category | Primary Function | Application Note |
|---|---|---|---|
| DESeq2 [14] | R Package / Differential Expression | Performs RLE normalization and differential expression analysis using a negative binomial model. | Industry standard; highly robust for experiments with a small number of replicates. |
| edgeR [14] | R Package / Differential Expression | Performs TMM normalization and differential expression analysis. | Powerful for complex experimental designs and highly expressed genes. |
| STAR Aligner [14] | Read Alignment | Aligns RNA-seq reads to a reference genome, accounting for splice junctions. | Fast and accurate; generates the BAM files required for read counting. |
| fastp [15] | Quality Control | Performs rapid and integrated adapter trimming and quality filtering. | Improves mapping rates and data quality; user-friendly with comprehensive reporting. |
| limma [1] | R Package / Batch Correction | Removes known batch effects from normalized expression data. | Essential for meta-analyses combining public and in-house datasets. |
| Omics Playground [1] | Web Platform / Integrated Analysis | Provides a user-friendly interface for normalization and exploratory analysis. | Ideal for bench scientists without a coding background. |
A Practical Toolkit: Comparing and Applying Key Normalization Methods
In RNA sequencing (RNA-seq) analysis, raw read counts mapped to genes are influenced by technical factors that can mask true biological expression levels. Within-sample normalization is the critical first step that adjusts raw count data to account for two primary technical variables: transcript length and sequencing depth [1]. Longer genes naturally accumulate more reads than shorter genes at identical expression levels, while varying sequencing depths across samples cause differences in total read counts [1]. Without proper normalization, these technical artifacts prevent accurate comparison of expression levels between different genes within the same sample.
This protocol focuses on three fundamental within-sample normalization methods: CPM (Counts Per Million), FPKM/RPKM (Fragments/Reads Per Kilobase of transcript per Million mapped reads), and TPM (Transcripts Per Million). These methods enable researchers to compare the relative abundance of different genes within a single sample, which is essential for exploratory analyses including expression profiling, clustering, and pathway analysis [1] [16]. Understanding the appropriate application of each method is crucial for generating biologically meaningful results from RNA-seq data.
Normalization Methods: Computational Foundations
CPM (Counts Per Million)
CPM (also known as RPM, Reads Per Million) represents the simplest normalization approach, adjusting solely for sequencing depth without accounting for gene length variations [17]. This method is suitable for sequencing protocols where read generation is independent of gene length, such as 3' tag sequencing [17].
Calculation Formula: CPM = (Reads mapped to gene / Total mapped reads) × 10^6 [17]
Key Characteristics:
- Normalizes only for sequencing depth
- Does not account for gene length bias
- Suitable for within-sample comparisons when gene length is not a concern
- Inappropriate for comparing expression across genes of different lengths [17]
Example Calculation: For a gene with 5,000 mapped reads in a library of 4 million total mapped reads: CPM = (5,000 / 4,000,000) × 10^6 = 1,250 [17]
RPKM and FPKM
RPKM (Reads Per Kilobase per Million mapped reads) and its paired-end equivalent FPKM (Fragments Per Kilobase per Million mapped fragments) normalize for both sequencing depth and gene length, enabling more accurate within-sample gene expression comparisons [18] [16].
Calculation Formula: RPKM (or FPKM) = Reads (or fragments) mapped to gene / (Gene length in kb × Total mapped reads in millions) [18]
Step-by-Step Calculation:
- Divide read counts by the total reads in the sample and multiply by 1,000,000 to get "per million" scaling factor
- Divide this result by the length of the gene in kilobases [18]
Key Characteristics:
- Normalizes for both sequencing depth and gene length
- RPKM designed for single-end RNA-seq, FPKM for paired-end RNA-seq [18] [16]
- Enables comparison of expression levels between genes of different lengths within the same sample
- Sum of RPKM/FPKM values can differ between samples, complicating cross-sample comparisons [18]
TPM (Transcripts Per Million)
TPM represents an evolution in normalization methodology that addresses a key limitation of RPKM/FPKM by maintaining consistent sums across samples [18]. The calculation involves the same factors as RPKM/FPKM but applies them in reverse order.
Calculation Formula: TPM = (Reads mapped to gene / Gene length in kb) / (Sum of all length-normalized reads) × 10^6 [18]
Step-by-Step Calculation:
- Divide read counts by the length of each gene in kilobases → yields RPK (Reads Per Kilobase)
- Sum all RPK values in a sample and divide by 1,000,000 → "per million" scaling factor
- Divide RPK values by this scaling factor → TPM [18]
Key Characteristics:
- Normalizes for gene length first, then sequencing depth
- Sum of all TPMs in each sample is identical (1,000,000)
- Enables comparison of the proportion of reads mapped to a gene across samples
- Considered a more accurate measure of relative RNA molar concentration [18] [19]
Table 1: Comparative Analysis of Within-Sample Normalization Methods
| Method | Normalization Factors | Primary Application | Key Advantage | Key Limitation |
|---|---|---|---|---|
| CPM | Sequencing depth only | Within-sample comparisons when gene length is uniform | Simple calculation | Fails to account for gene length bias [17] |
| RPKM/FPKM | Sequencing depth + Gene length | Gene expression comparisons within a single sample | Accounts for both technical variables | Sum varies between samples; problematic for cross-sample comparison [18] [1] |
| TPM | Gene length + Sequencing depth | Gene expression comparisons within and across samples | Constant sum across samples; better for proportions | Still sensitive to RNA population composition differences [18] [19] |
Table 2: Mathematical Formulae for Normalization Methods
| Method | Formula | Component Definitions |
|---|---|---|
| CPM | ( CPM = \frac{\text{Reads mapped to gene}}{\text{Total mapped reads}} \times 10^6 ) [17] | Total mapped reads: Sum of all reads aligned to the reference |
| RPKM/FPKM | ( RPKM = \frac{\text{Reads mapped to gene}}{\text{Gene length (kb)} \times \frac{\text{Total mapped reads}}{10^6}} ) [18] | Gene length: Total length of exons in kilobases |
| TPM | ( TPM = \frac{\frac{\text{Reads mapped to gene}}{\text{Gene length (kb)}}}{\sum(\frac{\text{All mapped reads}}{\text{Respective gene lengths (kb)}})} \times 10^6 ) [18] | Gene length: Total length of exons in kilobases |
Computational Workflows and Protocols
TPM Normalization Protocol
The following workflow illustrates the complete TPM calculation process for within-sample gene expression analysis:
Step-by-Step Protocol:
Input Raw Read Counts: Begin with a count matrix containing raw read counts mapped to each gene for a single sample [18].
Calculate RPK Values: For each gene, divide the raw read count by the gene length in kilobases: RPK = Read count / Gene length (kb) [18]
Sum RPK Values: Calculate the sum of all RPK values for the sample.
Compute Scaling Factor: Divide the RPK sum by 1,000,000 to generate the sample-specific scaling factor [18].
Calculate TPM Values: For each gene, divide the RPK value by the scaling factor to obtain the final TPM value.
Quality Assessment: Verify that the sum of all TPM values in the sample equals approximately 1,000,000 [18].
Implementation in Python:
RPKM/FPKM Normalization Protocol
Step-by-Step Protocol:
Input Raw Read Counts: Start with raw read counts for each gene in a single sample.
Calculate RPM: Divide the read count for each gene by the total mapped reads in the sample, then multiply by 1,000,000: RPM = (Read count / Total mapped reads) × 10^6 [18]
Normalize for Gene Length: Divide the RPM values by the gene length in kilobases to obtain RPKM/FPKM values [18].
Verification: Unlike TPM, the sum of RPKM/FPKM values will vary between samples, which is expected behavior for this method.
Implementation in Python:
CPM Normalization Protocol
Step-by-Step Protocol:
Input Raw Read Counts: Begin with raw read counts for each gene.
Calculate Scaling Factor: Divide the total mapped reads by 1,000,000.
Compute CPM Values: Divide each gene's read count by the scaling factor [17].
Application: Use CPM values for within-sample comparisons when gene length bias is not a concern.
Implementation in Python:
Experimental Considerations and Best Practices
Method Selection Guidelines
Choosing the appropriate normalization method depends on the experimental design and analytical goals:
Use CPM when analyzing sequencing protocols where read count is independent of gene length, or when making within-sample comparisons where relative differences in expression are more important than absolute quantification [17].
Use RPKM/FPKM for traditional within-sample gene expression comparisons where both sequencing depth and gene length normalization are required. This method remains appropriate for comparing expression levels of different genes within the same sample [1] [16].
Use TPM when performing both within-sample and between-sample comparisons, or when the relative proportion of transcripts is biologically meaningful. TPM is particularly valuable when pooling data from multiple samples for integrated analysis [18] [20].
Technical Considerations and Limitations
Despite their utility, within-sample normalization methods have important limitations:
RNA Population Composition: RPKM, FPKM, and TPM values represent relative abundance within the sequenced RNA population, which can vary significantly depending on sample preparation protocols (e.g., poly(A)+ selection vs. rRNA depletion) [19]. Comparing normalized values across studies using different protocols can be problematic.
Cross-Sample Comparisons: While TPM improves comparability between samples, none of these within-sample methods adequately address biological variability or batch effects between samples [1]. For rigorous differential expression analysis, additional between-sample normalization methods such as TMM (Trimmed Mean of M-values) or DESeq2's median ratio method are recommended [20] [12].
Low Expression Genes: All within-sample normalization methods can be sensitive to technical noise for lowly expressed genes, particularly when gene length corrections are applied [20].
Table 3: Troubleshooting Common Normalization Issues
| Problem | Potential Cause | Solution |
|---|---|---|
| Extreme variation in normalized values between samples | Different RNA population composition | Verify consistent sample preparation protocols; avoid comparing across different RNA enrichment methods [19] |
| Poor clustering in exploratory analysis | Inadequate normalization for experimental design | Apply between-sample normalization (TMM, DESeq2) after within-sample normalization [20] [12] |
| Inconsistent results for low-abundance transcripts | Technical noise amplified by normalization | Apply expression filters; use statistical methods designed for low-count genes [20] |
| Discrepancies between paired-end and single-end data | Use of RPKM for paired-end data | Use FPKM for paired-end data to account for fragment-based counting [18] [16] |
The Scientist's Toolkit
Research Reagent Solutions
Table 4: Essential Computational Tools for Normalization Analysis
| Tool/Resource | Function | Application Context |
|---|---|---|
| bioinfokit (Python) | CPM, RPKM, TPM normalization | Accessible normalization implementation with example datasets [17] |
| DESeq2 (R/Bioconductor) | Between-sample normalization using median ratio method | Differential expression analysis following within-sample normalization [12] |
| edgeR (R/Bioconductor) | TMM normalization for between-sample comparisons | RNA-seq analysis when composition bias is a concern [1] [12] |
| Salmon/Kallisto | Alignment-free transcript quantification | Rapid TPM calculation without generating BAM files [20] [19] |
| Scater/Scanpy | Single-cell RNA-seq normalization | Specialized methods for single-cell data (CP10K, deconvolution) [21] [22] |
Quality Control Metrics
Library Size: Total mapped reads should be consistent across samples; significant variations may require additional normalization [12].
Gene Length Distribution: Ensure consistent gene length annotations across all samples to prevent normalization artifacts.
TPM Sum Verification: Confirm that TPM values sum to approximately 1,000,000 per sample as a quality check [18].
Sequence Protocol Consistency: Validate that all samples were prepared using compatible RNA selection methods (e.g., all polyA+ selected or all rRNA-depleted) [19].
Within-sample normalization using CPM, RPKM/FPKM, and TPM provides the foundation for accurate gene expression analysis in RNA-seq experiments. While each method offers distinct advantages, TPM has emerged as the preferred approach for many applications due to its consistent sum across samples and more intuitive interpretation as a proportion of the total transcriptome [18] [20]. However, researchers must recognize that these within-sample methods represent only the first step in comprehensive RNA-seq data normalization, and should be complemented with appropriate between-sample normalization approaches when conducting comparative analyses. By implementing these protocols with attention to technical considerations and potential pitfalls, researchers can generate more reliable and biologically meaningful results from their transcriptomic studies.
In RNA-Seq differential expression analysis, normalization is a critical preprocessing step that ensures accurate comparison of gene expression levels between samples. Technical variations, particularly in sequencing depth and RNA composition, can introduce systematic biases that obscure true biological differences. Without proper normalization, these technical artifacts can lead to both false positives and false negatives in downstream differential expression testing. Between-sample normalization methods specifically address these issues by adjusting counts to make them comparable across different libraries. Among the various strategies developed, the Trimmed Mean of M-values (TMM) method implemented in the edgeR package and the Relative Log Expression (RLE) method used by DESeq2 have emerged as two of the most widely adopted and robust approaches [23] [24]. These methods operate on the fundamental assumption that in most RNA-Seq experiments, the majority of genes are not differentially expressed, allowing them to estimate technical biases from the data itself [25] [26]. This protocol provides detailed methodologies for implementing both TMM and RLE normalization, along with comparative analysis to guide researchers in selecting the appropriate method for their experimental context.
Theoretical Foundations
The Normalization Necessity: Accounting for Technical Biases
RNA-Seq count data is influenced by several technical factors that must be accounted for before meaningful biological comparisons can be made. Sequencing depth (library size) varies between samples, where samples with greater depth naturally yield higher counts for most genes regardless of true expression levels. Perhaps more subtly, RNA composition effects occur when a few highly expressed genes in one condition consume a substantial portion of the sequencing resources, thereby proportionally reducing the counts observed for all other genes in that sample [23] [26]. This composition effect can create the false appearance of differential expression for genes that are not truly differentially expressed. As highlighted by Robinson and Oshlack, without proper normalization, "if a large number of genes are unique to, or highly expressed in, one experimental condition, the sequencing 'real estate' available for the remaining genes in that sample is decreased" [26]. This fundamental understanding drives the need for sophisticated normalization methods that go beyond simple library size scaling.
TMM (Trimmed Mean of M-values) Method Theory
The TMM normalization method, implemented in the edgeR package, is based on the principle of relative scaling between samples. For each pair of samples, TMM calculates gene-wise log-fold-changes (M-values) and absolute expression levels (A-values), then computes a weighted trimmed mean of the M-values [27] [26]. The trimming process excludes the most extreme M-values (default: 30% from each end, 5% from the top) and the genes with very high or low expression levels, making the method robust to differentially expressed genes. The key biological assumption underlying TMM is that the majority of genes are not differentially expressed between samples [25]. Mathematically, TMM estimates the relative RNA production efficiency between samples, producing a normalization factor that converts observed library sizes into effective library sizes that account for RNA composition biases [28] [27]. These effective library sizes are then used to compute normalized counts, typically expressed as counts per million (CPM) [28].
RLE (Relative Log Expression) Method Theory
The RLE normalization method, used by DESeq2, employs a median-of-ratios approach that similarly assumes most genes are not differentially expressed [23]. The method operates through a multi-step process: first, it creates a pseudo-reference sample by calculating the geometric mean across all samples for each gene; second, it computes the ratio of each sample to this pseudo-reference; third, it takes the median of these ratios for each sample to derive the size factor (normalization factor) [23]. The RLE method is particularly robust to imbalances in up-/down-regulation and large numbers of differentially expressed genes, as the median ratio is less influenced by extreme values [23]. Unlike TMM, which typically compares samples to a single reference, RLE considers all samples simultaneously when creating the pseudo-reference, making it particularly suited for complex experimental designs with multiple conditions.
Table 1: Theoretical Comparison of TMM and RLE Normalization Methods
| Feature | TMM (edgeR) | RLE (DESeq2) |
|---|---|---|
| Full Name | Trimmed Mean of M-values | Relative Log Expression |
| Key Assumption | Most genes are not DE | Most genes are not DE |
| Statistical Approach | Weighted trimmed mean of log expression ratios | Median of ratios to pseudo-reference sample |
| Primary Adjustment | Effective library size | Count scaling factors |
| Robustness Features | Trimming of extreme values, weighting by precision | Median-based central tendency |
| Implementation | Pairwise sample comparison | Global sample comparison |
Methodology and Protocols
TMM Normalization Protocol with edgeR
The TMM normalization protocol using edgeR follows a structured workflow that begins with data input and proceeds through normalization factor calculation to normalized count generation:
Step 1: Create DGEList Object
Step 2: Calculate TMM Normalization Factors
Step 3: Generate Normalized Expression Values
The calcNormFactors function performs the core TMM calculation, determining normalization factors that reflect compositional biases. These factors are incorporated into the effective library sizes (original library size × normalization factor), which are then used by the cpm function to generate normalized counts [28] [27]. It is important to note that edgeR does not store "TMM-normalized counts" internally, but rather uses the normalization factors during statistical testing for differential expression [28].
RLE Normalization Protocol with DESeq2
The RLE normalization protocol using DESeq2 follows a similarly structured approach but with different function calls and object types:
Step 1: Create DESeqDataSet Object
Step 2: Perform RLE Normalization
Step 3: Extract Normalized Counts
The estimateSizeFactors function implements the RLE method, calculating size factors for each sample by taking the median of ratios to the pseudo-reference sample [23]. These size factors are then used to normalize the raw counts, producing normalized count values where the influence of technical biases has been reduced. DESeq2 automatically uses these size factors in all subsequent differential expression analyses.
Workflow Diagram
Diagram Title: TMM and RLE Normalization Workflows
Comparative Performance Analysis
Quantitative Method Comparison
Table 2: Performance Characteristics of TMM and RLE Normalization Methods
| Performance Metric | TMM (edgeR) | RLE (DESeq2) |
|---|---|---|
| Handling of Extreme Values | Excellent (through trimming) | Good (through median) |
| Performance with High % DE | Robust up to moderate levels | Robust up to moderate levels |
| Library Size Correlation | Lower correlation | Higher correlation [29] |
| Computational Efficiency | Fast | Moderately fast |
| Zero-Inflation Robustness | Good (TMMwsp variant for high zeros) | Moderate |
| Dependence on Filtering | Sensitive to filtering strategy [30] | Less sensitive to filtering |
Case Study: Normalization Impact on Differential Expression
A comparative study using real RNA-Seq data from tomato fruit set (34,675 genes × 9 samples) demonstrated that while TMM and RLE generally provide similar results, there are important nuanced differences [29]. The study found that TMM normalization factors do not show strong correlation with library sizes, whereas RLE factors exhibit a positive correlation with library size [29]. This fundamental difference in behavior can lead to divergent results in differential expression analysis, particularly in experiments with large variations in library sizes between samples. Another large-scale evaluation using 726 individual Drosophila melanogaster transcriptomes found that both TMM and RLE (DESeq) methods properly aligned data distributions across samples and accounted for the dynamic range of the data [30]. However, the study noted that TMM was more sensitive to the filtering strategy used for low-expressed genes compared to the DESeq method [30].
Practical Recommendations for Method Selection
Based on empirical comparisons and methodological considerations, specific recommendations can be made for selecting between TMM and RLE normalization:
For simple two-condition designs, both methods perform comparably well, and choice may depend on which differential expression pipeline (edgeR or DESeq2) will be used for subsequent analysis [29].
For experiments with large variations in library sizes, RLE may be preferable due to its correlation with library size, which better accounts for depth variations [29].
For data with substantial numbers of differentially expressed genes or asymmetric expression changes, TMM's trimming approach may provide more robust performance [26].
When using the full differential expression pipeline, it is generally recommended to use the normalization method native to the DE tool (TMM for edgeR, RLE for DESeq2) as these methods are optimized to work with their respective statistical frameworks for differential expression testing.
The Scientist's Toolkit
Essential Research Reagents and Computational Tools
Table 3: Key Research Reagents and Computational Resources for RNA-Seq Normalization
| Resource Name | Type | Function/Purpose |
|---|---|---|
| edgeR Package | Software/Bioconductor | Implements TMM normalization and differential expression analysis |
| DESeq2 Package | Software/Bioconductor | Implements RLE normalization and differential expression analysis |
| Reference Genome | Genomic Resource | Provides coordinate system for read alignment and counting |
| Annotation File (GTF/GFF) | Genomic Resource | Defines gene models for read counting |
| Alignment Software | Software Tool | Maps sequencing reads to reference genome (e.g., STAR, HISAT2) |
| Counting Tools | Software Tool | Generates count matrices from aligned reads (e.g., featureCounts, HTSeq) |
| ERCC Spike-in Controls | Experimental Reagent | External controls for normalization quality assessment |
Implementation Considerations and Troubleshooting
Critical Parameter Optimization
Successful implementation of TMM and RLE normalization requires attention to several key parameters. For TMM normalization, the default trimming proportion (30% from each tail, 5% from the top) generally works well, but may be adjusted in specialized scenarios where the assumption of non-DE genes is violated. The calcNormFactors function in edgeR provides alternative methods including "TMMwsp" (TMM with singleton pairing) for data with high proportions of zeros, and "RLE" which implements the DESeq-style normalization within edgeR [27]. For RLE normalization in DESeq2, the estimateSizeFactors function includes parameters for controlling which genes are used as the reference set, though the default median-based approach typically provides robust performance. It is critical that both methods are applied to raw count data rather than pre-normalized values, as their statistical models depend on the properties of raw counts for accurate estimation of measurement precision [31].
Quality Control and Validation
After applying either normalization method, specific quality control measures should be implemented to validate normalization effectiveness:
MA Plots: Examine gene-wise log-fold-changes (M) versus average expression (A) before and after normalization. Properly normalized data should show symmetry around M=0 for most genes [26].
Boxplots of Distribution: Compare the distributions of log-counts across samples before and after normalization. Effective normalization should align the distributions across samples.
PCA Plots: Perform principal component analysis on normalized data to check if technical biases (e.g., batch effects, library size differences) have been reduced while biological signals are maintained.
Housekeeping Gene Validation: When available, examine expression patterns of known housekeeping genes or spike-in controls to verify they show consistent expression across samples after normalization.
Systematic comparison studies have shown that normalization method choice can significantly impact differential expression results, with different methods identifying only partially overlapping sets of significant genes [25] [30]. Therefore, researchers should select their normalization approach carefully based on their specific experimental context and validate results through complementary approaches when possible.
Within exploratory research, the initial interpretation of RNA-sequencing (RNA-Seq) data is paramount, and the choice of normalization method forms the critical foundation for all subsequent biological insights. Normalization corrects for technical variations in data, such as differences in sequencing depth and library composition, allowing for meaningful biological comparison [32]. Selecting an inappropriate method can introduce significant bias, leading to both false discoveries and a failure to detect genuine biological signals [9] [3]. This application note provides a structured, head-to-head comparison of prevalent RNA-seq normalization methods, offering researchers and drug development professionals a clear framework for selecting the optimal technique for exploratory analysis.
Normalization Methods at a Glance
The following table provides a comparative overview of the most widely used RNA-seq normalization methods, detailing their core principles, underlying assumptions, and recommended applications to guide method selection.
Table 1: Comparative overview of RNA-seq normalization methods, their assumptions, and best-use cases.
| Normalization Method | Core Principle | Key Assumptions | Best-Use Cases | Considerations for Exploratory Analysis |
|---|---|---|---|---|
| CPM (Counts Per Million) [9] [32] | Scales counts by the total library size (sequencing depth) multiplied by one million. | All genes contribute equally to total library size; suitable for sample-level comparisons but not for within-sample gene comparison. | - Checking sequencing depth across samples.- Normalizing counts for already length-normalized data. | - Does not correct for gene length or RNA composition [32].- Highly sensitive to a few highly expressed genes, which can skew the entire dataset [9]. |
| TPM (Transcripts Per Million) [9] [32] | First normalizes for gene length (per kilobase), then for sequencing depth (per million). The sum of all TPMs is consistent across samples. | Accurate gene length estimates are available; the total transcript pool is comparable between samples. | - Comparing expression levels of different genes within a single sample [32].- Cross-sample comparison when investigating relative transcript abundances. | - More accurate than RPKM/FPKM for between-sample comparison due to consistent sum [32].- Can be affected by highly expressed genes and depends on accurate read mapping [32]. |
| FPKM/RPKM (Fragments/Reads Per Kilobase of transcript per Million mapped reads) [32] | Similar to TPM but normalizes for sequencing depth first, then for gene length. | The same as TPM, but the order of operations differs. It is a within-sample normalization. | - Historically common but now largely superseded by TPM [32].- Comparing gene expression within a single sample. | - Not directly comparable across samples due to varying total sums [32].- Assumes total reads are the same across samples, which is often inaccurate [32]. |
| TMM (Trimmed Mean of M-values) [9] [3] [32] | Uses a weighted trimmed mean of log expression ratios (M-values) between samples to calculate scaling factors. Robust to highly expressed genes and RNA composition bias. | The majority of genes are not differentially expressed [3] [32]. | - Differential expression analysis between conditions or tissues [32].- Datasets with different RNA compositions or a few highly expressed genes [32]. | - Implemented in the edgeR package [3].- Benchmarking shows it produces models with low variability and accurate capture of disease-associated genes when mapped on metabolic networks [3]. |
| RLE (Relative Log Expression) [9] [3] | Calculates a scaling factor for each sample as the median of the ratios of its counts to the geometric mean across all samples. | Similar to TMM, it assumes that most genes are not differentially expressed [3]. | - Differential expression analysis [9].- Standard method for the DESeq2 package [3]. |
- Implemented in the DESeq2 package as the median-of-ratios method [9] [3].- Benchmarking shows performance comparable to TMM, generating reliable condition-specific models with low false positives [3]. |
Experimental Protocols for Normalization
This section outlines detailed protocols for implementing key normalization methods, from a standard bioinformatics workflow to specific scripts for RLE and TMM normalization.
Standard RNA-Seq Preprocessing and Normalization Workflow
A robust RNA-seq analysis begins with raw sequencing reads and proceeds through a series of quality control and processing steps before normalization. The following workflow diagram illustrates this multi-stage process.
Protocol 1: RLE Normalization with DESeq2
The Relative Log Expression (RLE) method is integral to the DESeq2 package and is well-suited for differential expression analysis [9] [3].
Methodology:
- Create a DESeqDataSet object: Import the raw count matrix and sample information into
DESeq2. The count matrix is structured with genes as rows and samples as columns. - Estimate size factors: The
estimateSizeFactorsfunction computes a scaling factor for each sample. For each gene, the geometric mean of counts across all samples is calculated. The ratio of each sample's count to this geometric mean is then determined for all genes. The median of these ratios, for each sample, is used as the size factor [9] [3]. - Apply normalization: Raw counts for each sample are divided by the calculated size factor to generate normalized expression values. This step corrects for differences in sequencing depth and RNA composition [9].
Sample Code:
Protocol 2: TMM Normalization with edgeR
The Trimmed Mean of M-values (TMM) method is implemented in the edgeR package and is also designed for robust differential expression analysis [3] [32].
Methodology:
- Create a DGEList object: Load the raw count data into
edgeRusing theDGEListfunction. - Calculate normalization factors: The
calcNormFactorsfunction performs TMM normalization. It selects a reference sample and then, for each other sample, calculates the log-fold changes (M-values) and absolute expression levels (A-values) for each gene. The mean of M-values is computed after trimming a portion (default 30%) of the extreme M-values and A-values. This trimmed mean is used as the scaling factor (norm.factors) to adjust for library composition [32]. - Apply normalization: The raw counts are scaled using the product of the original library size and the calculated normalization factor.
Sample Code:
The Scientist's Toolkit: Essential Research Reagents & Computational Tools
Successful RNA-seq analysis relies on a suite of specialized computational tools and reagents. The following table details key components of the analytical pipeline.
Table 2: Key Research Reagent Solutions for RNA-seq Data Analysis.
| Item Name | Function/Application | Specific Example(s) |
|---|---|---|
| Reference Genome | Provides the nucleotide sequence of the species' chromosomes for aligning sequencing reads. | - Homosapiens.GRCh38.dna.primaryassembly.fa from Ensembl [33].- hg38.fa from UCSC [33]. |
| Gene Annotation File | Describes the structures and coordinates of known genes and transcripts on the reference genome. | - Homo_sapiens.GRCh38.100.gtf from Ensembl [33].- GTF file from UCSC Table Browser [33]. |
| Alignment Software | Maps high-throughput sequencing reads to a reference genome or transcriptome. | - STAR [9] [33].- HISAT2 [9] [33]. |
| Pseudoalignment/Quantification Tool | Rapidly estimates transcript abundances without generating base-by-base alignments. | - Kallisto [9] [33].- Salmon [9] [33]. |
| Differential Expression Package | Statistical toolkit for identifying genes expressed differentially between conditions. | - DESeq2 (uses RLE normalization) [9] [3].- edgeR (uses TMM normalization) [3] [32].- limma-voom [33]. |
| Quality Control Tool | Assesses the quality of raw sequencing reads and aligned data. | - FastQC/Falco [34].- MultiQC (aggregates multiple reports) [34].- Qualimap (post-alignment QC) [9]. |
Logical Decision Framework for Method Selection
Choosing the correct normalization method depends on the analytical goal. The following decision diagram maps the logical pathway from the researcher's primary question to the recommended method.
In exploratory research, the path to biologically meaningful conclusions from RNA-seq data is paved by rigorous preprocessing and informed methodological choices. As demonstrated, normalization is not a one-size-fits-all procedure. Between-sample methods like RLE (DESeq2) and TMM (edgeR) are indispensable for robust differential expression analysis, reducing variability and false positives in downstream models [3]. In contrast, within-sample methods like TPM are optimal for profiling relative transcript abundances within a single sample. By adhering to the structured protocols, toolkits, and decision framework outlined in this application note, researchers can confidently select and apply the most appropriate normalization strategy, thereby ensuring the integrity and reliability of their exploratory transcriptomic analyses.
RNA sequencing (RNA-Seq) has revolutionized transcriptomics by enabling genome-wide quantification of RNA abundance with high resolution and accuracy [9]. A critical yet often underappreciated aspect of RNA-Seq analysis is normalization, which adjusts raw read counts to account for technical variations, thereby allowing meaningful biological comparisons [24]. This process is particularly crucial in pharmaceutical research, where accurate identification of differentially expressed genes (DEGs) can illuminate a drug's mechanism of action (MoA) and uncover potential biomarkers for patient stratification and treatment response [35].
The fundamental challenge normalization addresses stems from the fact that raw read counts are influenced not only by true gene expression levels but also by technical factors such as sequencing depth and library composition [9] [24]. Without proper normalization, these technical artifacts can obscure true biological signals, leading to flawed interpretations that may misdirect drug development efforts. This application note demonstrates through a practical case study how judicious selection of normalization methods enables robust MoA elucidation and biomarker discovery from RNA-Seq data.
Background: RNA-Seq Normalization Methods
The Necessity of Normalization
In RNA-Seq experiments, the number of reads mapped to a gene depends not only on its true expression level but also on the total number of reads sequenced for that sample (sequencing depth) [9]. Samples with greater sequencing depth will naturally yield higher counts, even for genes expressed at identical levels across conditions. Furthermore, if a few genes are exceptionally highly expressed in one sample, they consume a larger fraction of the sequencing resources, consequently reducing the reads available for other genes—a phenomenon known as library composition effect [24]. Normalization mathematically adjusts these counts to remove such technical biases, ensuring that expression differences reflect true biological variation rather than technical artifacts [9].
Multiple normalization strategies have been developed, each with distinct underlying assumptions and corrective approaches:
Within-sample methods like CPM (Counts Per Million), FPKM (Fragments Per Kilobase of Transcript per Million mapped reads), and TPM (Transcripts Per Million) primarily correct for sequencing depth and gene length [36] [3]. TPM is often preferred over FPKM as it ensures the sum of all TPM values is consistent across samples, making comparisons more straightforward [3].
Between-sample methods, including TMM (Trimmed Mean of M-values) and RLE (Relative Log Expression), implemented in the popular differential expression tools edgeR and DESeq2 respectively, additionally account for library composition effects [9] [3]. These methods operate on the key assumption that most genes are not differentially expressed across conditions [24] [3].
Table 1: Comparison of Common RNA-Seq Normalization Methods
| Method | Sequencing Depth Correction | Gene Length Correction | Library Composition Correction | Primary Use Case |
|---|---|---|---|---|
| CPM | Yes | No | No | Simple scaling, not recommended for DE analysis |
| FPKM | Yes | Yes | No | Single-sample comparisons, legacy use |
| TPM | Yes | Yes | Partial | Cross-sample comparison, visualization |
| TMM | Yes | No | Yes | Differential expression analysis (edgeR) |
| RLE | Yes | No | Yes | Differential expression analysis (DESeq2) |
Case Study: Normalization in Drug MoA Elucidation
Experimental Design and Workflow
To illustrate the critical role of normalization, we examine a simulated study investigating a novel oncology therapeutic compound, "TheraBIO-127." The experiment compared transcriptomic profiles of cancer cell lines treated with TheraBIO-127 versus vehicle control (DMSO), with the goal of identifying the drug's MoA through DEG analysis.
The analytical workflow encompassed standard RNA-Seq processing steps: (1) quality control of raw reads using FastQC and MultiQC; (2) adapter trimming and quality filtering with Trimmomatic or fastp; (3) splice-aware alignment to the reference genome using HISAT2 or STAR; (4) read quantification with featureCounts; and (5) differential expression analysis applying different normalization methods [9] [36] [15].
Diagram 1: RNA-Seq Data Analysis Workflow. Normalization represents a critical step preceding formal differential expression testing.
Impact of Normalization on DEG Detection
When different normalization methods were applied to the same TheraBIO-127 dataset, substantial disparities emerged in the number and identity of called DEGs. Methods that only account for sequencing depth (CPM) or sequencing depth and gene length (FPKM, TPM) produced markedly different results compared to between-sample methods (TMM, RLE) designed to handle library composition effects.
Table 2: Differential Expression Results for TheraBIO-127 Using Different Normalization Methods (FDR < 0.05)
| Normalization Method | Total DEGs | Upregulated | Downregulated | Key Pathway Enriched |
|---|---|---|---|---|
| CPM | 1,842 | 1,105 | 737 | Cell Cycle |
| FPKM | 1,756 | 983 | 773 | Apoptosis |
| TPM | 1,693 | 945 | 748 | Apoptosis |
| TMM | 1,245 | 712 | 533 | DNA Damage Response |
| RLE | 1,189 | 681 | 508 | DNA Damage Response |
Notably, TMM and RLE normalization converged on DNA Damage Response as the most significantly enriched pathway, a finding consistent with the known biology of TheraBIO-127's target class. In contrast, methods lacking library composition correction highlighted different pathways, potentially leading to misinterpretation of the drug's primary mechanism. This case underscores that normalization choice can dramatically alter biological conclusions in MoA studies.
Advanced Consideration: Batch Effect Correction
In real-world research, particularly when integrating datasets from different studies or sequencing batches, batch effects—systematic technical variations introduced by different processing conditions—can profoundly confound results. These effects can be on a similar scale as, or even larger than, the biological differences of interest, significantly reducing statistical power to detect true DEGs [37].
Advanced correction methods like ComBat-seq and its refinement ComBat-ref employ statistical models to adjust for batch effects while preserving biological signals [37]. ComBat-ref builds upon ComBat-seq by incorporating a negative binomial model specifically for RNA-Seq count data and innovates by selecting the batch with the smallest dispersion as a reference, then adjusting other batches toward this reference [37]. This approach has demonstrated superior performance in maintaining statistical power for DEG detection compared to earlier methods, especially when using false discovery rate (FDR) correction [37].
Diagram 2: ComBat-ref Batch Effect Correction Workflow. The method selects a low-dispersion reference batch to guide adjustment of other batches.
Application in Biomarker Discovery
The transition from RNA-Seq data to clinically actionable biomarkers presents unique challenges. Traditional biomarker discovery approaches developed for microarray data often assume normally distributed data and perform poorly on RNA-Seq count data, which typically follows a negative binomial distribution [35]. Furthermore, RNA-Seq datasets often have limited sample sizes relative to the number of genes measured, complicating robust statistical analysis.
The SEQ-Marker algorithm represents a specialized approach for biomarker discovery from RNA-Seq data [35]. Unlike conventional methods that rely solely on P-value ranking of individual genes, SEQ-Marker incorporates a network-based strategy that identifies biomarkers from inferred network markers. This approach considers gene-gene interactions and their potential functional impact, potentially revealing biomarkers that might be missed by univariate methods [35].
When applying biomarker discovery pipelines, normalization choice remains pivotal. Studies have shown that between-sample normalization methods (TMM, RLE) tend to reduce false positive predictions in downstream analyses at the potential expense of missing some true positives, resulting in more specific and potentially more reliable biomarker signatures [3].
Experimental Protocols
Protocol 1: Differential Expression Analysis with DESeq2 (RLE Normalization)
This protocol details the standard workflow for differential expression analysis using the DESeq2 package in R, which incorporates RLE normalization.
Install and load required packages:
Create a DESeqDataSet object: Construct the object from the count matrix, sample information, and design formula. The design formula should reflect the experimental design (e.g.,
~ condition).Perform differential expression analysis: The
DESeqfunction runs a default analysis that includes estimation of size factors (RLE normalization), dispersion estimation, and hypothesis testing using a negative binomial generalized linear model.Extract results: Obtain the table of results, including log2 fold changes, p-values, and adjusted p-values.
Summarize results: Identify significantly differentially expressed genes based on a chosen false discovery rate (FDR) threshold.
Protocol 2: Batch Correction Using ComBat-ref
This protocol outlines the steps for applying the ComBat-ref method to correct for batch effects in RNA-Seq count data, preserving the integer nature of counts for downstream DEG analysis.
Install and load the necessary package: Ensure the appropriate package containing ComBat-ref is installed and loaded. (Note: ComBat-ref is used here as a conceptual example; researchers should verify the specific implementation.)
Prepare the input data: Required inputs include a raw count matrix (genes as rows, samples as columns), a batch indicator vector, and a biological condition vector.
Run ComBat-ref correction: Execute the core correction function.
Verify correction efficacy: Use Principal Component Analysis (PCA) to visualize data before and after correction. Effective correction is indicated by the clustering of samples by biological condition rather than batch in the PCA plot.
Proceed with differential expression analysis: Use the batch-corrected count matrix as input for standard differential expression tools like DESeq2 or edgeR.
The Scientist's Toolkit
Table 3: Essential Research Reagents and Computational Tools for RNA-Seq Analysis
| Category | Tool/Reagent | Primary Function | Application Notes |
|---|---|---|---|
| Quality Control | FastQC | Assesses raw read quality | Generates HTML reports; "failed" status requires careful interpretation [36]. |
| MultiQC | Aggregates multiple QC reports | Summarizes metrics across all samples for efficient review [36]. | |
| Read Trimming | Trimmomatic | Removes adapters and low-quality bases | Handles both single-end and paired-end data [36] [38]. |
| fastp | Performs fast all-in-one preprocessing | Integrated adapter trimming, quality filtering, and QC reporting [15]. | |
| Alignment | HISAT2 | Splice-aware alignment to reference genome | Recommended for human data; requires genome indexing [36]. |
| STAR | Ultra-fast splice-aware aligner | Accurate but memory-intensive; suitable for various organisms [9]. | |
| Quantification | featureCounts | Assigns reads to genomic features | Generates the raw count matrix for downstream analysis [9]. |
| Salmon/Kallisto | Alignment-free transcript quantification | Faster than alignment-based methods; uses pseudo-alignment [9]. | |
| Normalization & DE | DESeq2 (RLE) | Differential expression analysis | Uses median-of-ratios normalization; robust for experiments with limited replicates [9] [3]. |
| edgeR (TMM) | Differential expression analysis | Uses trimmed mean of M-values normalization; powerful for complex designs [9] [3]. | |
| Batch Correction | ComBat-seq/ComBat-ref | Corrects for batch effects in count data | Preserves integer counts; ComBat-ref offers improved power by selecting a low-dispersion reference batch [37]. |
| Biomarker Discovery | SEQ-Marker | Identifies biomarkers from RNA-Seq data | Employs a network-based approach, overcoming limitations of P-value-only methods [35]. |
This application note demonstrates that normalization is not merely a technical preprocessing step but a fundamental analytical decision that directly influences biological interpretation in drug discovery. The case study of TheraBIO-127 illustrates how method selection can alter the identified DEGs and subsequent pathway analysis, potentially leading to different hypotheses regarding a drug's mechanism of action.
For MoA elucidation and biomarker discovery, between-sample normalization methods (TMM, RLE) implemented in established tools like edgeR and DESeq2 generally provide more reliable results by effectively addressing library composition effects [9] [3]. In studies involving multiple sequencing batches, batch correction methods like ComBat-ref are essential to mitigate technical confounding [37]. Furthermore, specialized approaches like SEQ-Marker offer advanced strategies for biomarker identification that leverage network topology beyond conventional differential expression analysis [35].
By carefully considering normalization strategies within their experimental context, researchers can maximize the biological insights gained from RNA-Seq data, thereby enhancing the efficiency and success of drug development programs.
Beyond the Basics: Troubleshooting Assumptions and Optimizing for Complex Data
In RNA-sequencing (RNA-Seq) analysis, normalization is a critical preprocessing step that removes non-biological technical variations to enable meaningful comparison of gene expression across samples [39]. Most conventional normalization methods rely on core assumptions: that the majority of genes are not differentially expressed between conditions, and that any differential expression is balanced in both directions (up- and down-regulation) [40]. However, these assumptions are violated in numerous biologically relevant scenarios, leading to substantial errors in downstream analysis and interpretation.
Global expression shifts occur when a substantial fraction of genes change expression predominantly in one direction, creating unbalanced transcriptome data. Such violations are common when comparing tissues with different mRNA content, developmental stages, healthy versus diseased tissues (particularly in cancer), or samples from different species [40]. When standard normalization methods are applied to these datasets, they can introduce significant biases, potentially obscuring genuine biological signals and generating false positives in differential expression analysis [39].
This application note provides experimental protocols and analytical strategies specifically designed for identifying and addressing global expression shifts in RNA-Seq data, framed within a broader thesis on normalization methods for exploratory analysis.
Identifying Global Expression Shifts: Diagnostic Protocols
Preliminary Diagnostic Workflow
Before selecting a normalization strategy, researchers must assess whether their dataset exhibits characteristics of global shifts. The following diagnostic protocol leverages multiple quality control metrics.
Diagram 1: A diagnostic workflow for detecting global expression shifts in RNA-Seq data.
Diagnostic Metrics and Interpretation
Table 1: Key diagnostic metrics for identifying global expression shifts
| Diagnostic Metric | Normal Pattern | Global Shift Indicator | Recommended Action |
|---|---|---|---|
| Library Size Distribution | Similar total counts across samples | Large disparities (>2-fold) between conditions | Consider between-sample normalization methods [9] |
| Expression Density Plots | Overlapping distributions across samples | Clear separation of distribution curves by condition | Apply data-driven reference selection [40] |
| PCA/MDS Visualization | Clustering by technical factors | Clear separation by biological condition in PC1 | Use condition-aware normalization [41] |
| Housekeeping Gene Stability | Stable expression across all samples | Systematic differences between conditions | Implement spike-in controls in future experiments [39] |
Experimental Validation Protocol
To confirm suspected global shifts, perform the following experimental validation:
Select Reference Genes: Identify 10-20 stable housekeeping genes using established databases or previous literature. Suitable candidates include ACTB, GAPDH, HPRT1, and TBP [40].
Calculate Stability Metrics: Use algorithms such as NormFinder or geNorm to quantitatively assess reference gene stability across sample groups.
Spike-in Controls: If available, analyze spike-in control RNAs that should remain constant across conditions. Significant variation in these controls confirms technical artifacts.
Condition-Specific Marker Check: Examine expression of known condition-specific markers to validate biological expectations.
Normalization Methods for Global Shifts
Method Classification and Selection
When global shifts are detected, standard within-sample normalization methods (e.g., TPM, FPKM) typically perform poorly. Between-sample methods or specialized approaches that account for data imbalance are required [3].
Table 2: Normalization methods for datasets with global expression shifts
| Method Category | Examples | Underlying Principle | Best For | Limitations |
|---|---|---|---|---|
| Data-Driven Reference | GRSN [40], Xcorr [40] | Identifies invariant gene sets from the data itself | Studies without controls; heterogeneous tissues | May fail with extreme shifts |
| Between-Sample Normalization | TMM [3], RLE/DESeq2 [9] [3] | Assumes most genes are not DE; trims extreme values | General purpose; moderate shifts | Sensitive to composition effects |
| Condition-Aware Pipeline | YARN [41] | Preprocessing for multi-group studies; tissue-aware | Large cohorts; multiple tissues | Requires substantial sample size |
| Hybrid Approaches | GeTMM [3] | Combines gene-length correction with TMM | Comparisons across studies | Less established methodology |
Implementation Protocol: RLE Normalization for Global Shifts
The Relative Log Expression (RLE) method implemented in DESeq2 is particularly effective for handling global shifts. Below is a detailed protocol for implementation:
Input Requirements: Raw count matrix (genes × samples), sample metadata table
Validation Steps:
- Compare coefficient of variation in library sizes before and after normalization
- Check if batch effects remain after processing
- Verify that known biological signals are preserved
- Ensure housekeeping genes show improved stability
Specialized Protocol: YARN for Heterogeneous Tissues
For complex datasets with multiple tissue types or extreme heterogeneity, the YARN pipeline provides specialized handling:
Diagram 2: The YARN pipeline for heterogeneous RNA-Seq data.
Implementation Steps:
Quality Control and Misannotation Check:
Merge Similar Tissues:
Condition-Aware Filtering:
Tissue-Aware Normalization:
Benchmarking and Validation Framework
Performance Metrics for Method Evaluation
When comparing normalization methods for datasets with global shifts, both technical and biological validation metrics should be employed:
Table 3: Performance evaluation metrics for normalization methods
| Metric Category | Specific Metrics | Assessment Method | Interpretation |
|---|---|---|---|
| Technical Performance | Coefficient of variation, PCA clustering, Mean-variance relationship | Compare pre- and post-normalization | Better methods reduce technical variation while preserving biological signals |
| Biological Accuracy | Recovery of known biological truths, Pathway enrichment consistency | Benchmark against validated gene sets | Methods preserving expected signals are preferred |
| Statistical Properties | False discovery rates, P-value distributions, Effect size estimates | Evaluate downstream analysis results | Ideal methods minimize false positives while maximizing true positives |
| Method Robustness | Sensitivity to parameter choices, Consistency across subsets | Bootstrap or resampling approaches | Robust methods show minimal variation across analyses |
Case Study: Alzheimer's Disease Data Analysis
A recent benchmark study evaluated normalization methods using Alzheimer's disease (AD) transcriptome data [3]. The study compared five normalization methods (TPM, FPKM, TMM, GeTMM, and RLE) when mapping expression data to genome-scale metabolic models (GEMs).
Key Findings:
- Between-sample methods (TMM, RLE, GeTMM) produced metabolic models with lower variability in active reactions compared to within-sample methods (TPM, FPKM)
- RLE, TMM, and GeTMM enabled more accurate capture of disease-associated genes (average accuracy ~0.80 for AD)
- Covariate adjustment (for age, gender, post-mortem interval) further improved accuracy across all methods
- Within-sample methods identified more differentially active reactions but with higher false positive rates
The Researcher's Toolkit
Essential Research Reagents and Computational Tools
Table 4: Key reagents and tools for handling global expression shifts
| Resource Type | Specific Examples | Purpose | Implementation |
|---|---|---|---|
| Spike-in Controls | ERCC RNA Spike-In Mix (Thermo Fisher) | External reference for normalization | Add to samples during library preparation |
| Housekeeping Gene Panels | HKgenes package, RefGenes | Data-driven reference selection | Identify stable genes from data |
| Normalization Software | DESeq2 (RLE), edgeR (TMM), YARN | Specialized normalization | R/Bioconductor packages |
| Quality Control Tools | FastQC, MultiQC, Qualimap | Initial data assessment | Standalone or pipeline integration |
| Benchmarking Frameworks | CONE, RNA-Seq workflow comparisons | Method evaluation | Custom implementation |
Experimental Design Recommendations
To minimize the impact of global shifts in future studies:
Incorporate Spike-in Controls: Add known quantities of exogenous RNA sequences to enable direct normalization against expected values [39]
Balance Sample Groups: Ensure comparable numbers of samples across conditions to improve statistical power
Include Technical Replicates: Assess technical variation independently from biological variation
Plan for Covariate Collection: Document potential confounding factors (age, sex, batch effects) for subsequent adjustment
Consider Sequential Processing: Process samples from different conditions interleaved rather than in large batches
Global expression shifts present significant challenges for RNA-Seq normalization, potentially leading to biased results and incorrect biological conclusions. By implementing the diagnostic protocols and specialized normalization methods outlined in this application note, researchers can appropriately handle these violated assumptions.
The evidence suggests that between-sample normalization methods (particularly RLE and TMM) generally outperform within-sample methods for datasets with global shifts, with condition-aware pipelines like YARN offering advantages for highly heterogeneous data. As transcriptomic studies continue to increase in scale and complexity, proper handling of these challenging datasets will remain essential for generating biologically meaningful results.
The Impact of High-Throughput and Single-Cell RNA-seq on Normalization
Normalization of RNA-sequencing data is an essential bioinformatic step to adjust raw transcriptomic data for technical variables that can mask true biological effects, enabling fair comparisons of gene expression both within and between samples [1]. The transition from microarray technology to high-throughput and single-cell RNA-seq has introduced unique normalization challenges, as the discrete count data generated by next-generation sequencing suffers from technical biases including gene length, library size, and sequencing run differences that must be corrected before meaningful biological interpretation can occur [3] [42]. The choice of normalization method significantly impacts downstream analyses, including differential expression testing, metabolic model reconstruction, and exploratory multivariate analysis, making method selection a critical consideration for researchers, scientists, and drug development professionals [3] [43].
The evolution of sequencing technologies has expanded normalization requirements beyond traditional bulk RNA-seq to address the unique characteristics of high-throughput single-cell applications. While early RNA-seq promised to capture transcriptional dynamics without sophisticated normalization, widespread adoption revealed significant issues with technical variation, bias, and reproducibility that necessitate rigorous normalization approaches [42]. This application note examines how high-throughput and single-cell RNA-seq have impacted normalization practices within the broader context of exploratory analysis research, providing structured protocols and quantitative comparisons to guide methodological selection.
Normalization Framework and Classification
The Three Stages of RNA-seq Normalization
RNA-seq normalization occurs at three distinct stages, each addressing different technical variables and enabling specific types of biological comparisons [1]:
Within-sample normalization enables comparison of gene expression within an individual sample by adjusting for two primary technical variables: transcript length and sequencing depth. Longer genes naturally produce more mapped reads than shorter genes at identical expression levels, while varying sequencing depths across samples requires correction for meaningful comparisons. Methods include CPM, FPKM/RPKM, and TPM [1].
Between-sample normalization (within-dataset) addresses technical variations when comparing multiple samples sequenced together. RNA-seq provides a relative rather than absolute measure of transcript abundance, meaning the entire transcript population affects relative levels of individual transcripts, creating comparison biases. Methods include TMM, RLE, and GeTMM [3] [1].
Cross-dataset normalization corrects for batch effects when integrating data from independent studies sequenced at different times, locations, or with varying methods. Batch effects often constitute the greatest source of differential expression in combined datasets and can mask true biological differences. Methods include ComBat and Limma with surrogate variable analysis [1].
Table 1: Classification of Common RNA-seq Normalization Methods
| Normalization Method | Stage | Key Features | Primary Use Cases |
|---|---|---|---|
| TPM | Within-sample | Corrects for sequencing depth and transcript length; sum of all TPMs constant across samples | Within-sample gene expression comparisons [1] |
| FPKM/RPKM | Within-sample | Corrects for library size and gene length; values depend on relative transcript abundance | Within-sample comparisons; single-end (RPKM) vs paired-end (FPKM) [1] |
| TMM | Between-sample | Assumes most genes not differentially expressed; uses trimmed mean of M-values relative to reference | Differential expression analysis; reduces between-sample variability [3] [1] |
| RLE | Between-sample | Applies median-based correction factor directly to read counts; similar assumption to TMM | Differential expression analysis; reduces false positives in metabolic modeling [3] |
| GeTMM | Between-sample | Combines gene-length correction with TMM normalization; reconciles within- and between-sample approaches | Comprehensive normalization addressing multiple technical factors [3] |
| Quantile | Between-sample | Makes expression distributions identical across samples; assumes global distribution differences are technical | Preparing data for downstream statistical analysis [1] |
| ComBat/Limma | Cross-dataset | Empirical Bayes methods correcting for known and unknown batch effects | Multi-study integrations; meta-analyses [1] |
Impact on Exploratory Data Analysis
Normalization method selection profoundly affects exploratory analysis outcomes, particularly for multivariate approaches like Principal Component Analysis (PCA). Studies evaluating twelve different normalization methods found that while PCA score plots often appear similar regardless of normalization, the biological interpretation of these models depends heavily on the method applied [43] [44]. Normalization alters correlation patterns in the data, impacting model complexity, sample clustering quality, and gene ranking in the model fit to normalized data, ultimately influencing pathway enrichment results and biological conclusions [43].
The following diagram illustrates the conceptual relationships between normalization stages and their impacts on downstream analysis:
Normalization Methods in High-Throughput Applications
Benchmarking Normalization for Metabolic Modeling
High-throughput RNA-seq applications particularly benefit from careful normalization method selection, as demonstrated in benchmark studies evaluating performance for metabolic modeling. Research comparing five normalization methods (TPM, FPKM, TMM, GeTMM, and RLE) for mapping transcriptome data onto human genome-scale metabolic models (GEMs) revealed significant differences in model quality and predictive accuracy [3].
When using popular algorithms like iMAT (Integrative Metabolic Analysis Tool) and INIT (Integrative Network Inference for Tissues) to create condition-specific GEMs, between-sample normalization methods (RLE, TMM, GeTMM) produced models with considerably lower variability in active reaction numbers compared to within-sample methods (FPKM, TPM) [3]. This reduced variability translated to improved accuracy in capturing disease-associated genes, with between-sample methods achieving approximately 80% accuracy for Alzheimer's disease and 67% for lung adenocarcinoma, demonstrating their superior performance for metabolic network reconstruction [3].
Table 2: Performance Comparison of Normalization Methods in Metabolic Modeling
| Normalization Method | Type | Model Variability | AD Gene Accuracy | LUAD Gene Accuracy | Key Findings |
|---|---|---|---|---|---|
| RLE | Between-sample | Low | ~0.80 | ~0.67 | Low false positive predictions; some true positives missed [3] |
| TMM | Between-sample | Low | ~0.80 | ~0.67 | Consistent with RLE and GeTMM; reduced variability [3] |
| GeTMM | Between-sample | Low | ~0.80 | ~0.67 | Combines length correction with between-sample approach [3] |
| TPM | Within-sample | High | <0.80 | <0.67 | High model variability; more affected by covariates [3] |
| FPKM | Within-sample | High | <0.80 | <0.67 | Similar to TPM; identifies highest number of affected reactions [3] |
Covariate Adjustment in Normalization
The presence of covariates such as age, gender, and post-mortem interval (particularly relevant for neurodegenerative diseases) significantly impacts normalization effectiveness and subsequent model performance. Research demonstrates that covariate adjustment applied to normalized data increases accuracy for all normalization methods when mapping to metabolic models [3]. For Alzheimer's disease studies, where age, gender, and post-mortem interval significantly influence data structure, covariate adjustment reduced variability in personalized metabolic models created with within-sample normalization methods, making them more comparable to between-sample approaches [3].
The following workflow diagram illustrates the integration of normalization and covariate adjustment in creating condition-specific metabolic models:
Single-Cell RNA-seq Normalization Considerations
Platform-Specific Technical Variations
Single-cell RNA-seq technologies introduce additional normalization challenges due to unique technical variations across platforms. scRNA-seq methods differ significantly in cell isolation techniques, transcript coverage, throughput, strand specificity, multiplexing capability, and UMI incorporation, all of which impact normalization strategy selection [45]. The two main platform types—droplet-based (10x Genomics Chromium, Drop-seq, inDrop) and plate-based (Smart-seq2, CEL-seq2, MARS-seq)—exhibit systematic differences in performance metrics including gene sensitivity, mitochondrial content, reproducibility, and ambient RNA contamination that must be addressed during normalization [46].
Performance comparisons between droplet-based and plate-based platforms reveal meaningful differences that affect normalization needs. Droplet-based methods like 10x Genomics Chromium and BD Rhapsody demonstrate similar gene sensitivity but differ in mitochondrial content and cell type detection biases [46]. BD Rhapsody typically shows higher mitochondrial content, while both platforms exhibit cell type detection biases—BD Rhapsody captures lower proportions of endothelial and myofibroblast cells, while 10x Chromium has reduced gene sensitivity in granulocytes [46]. These platform-specific characteristics necessitate normalization approaches that can correct for systematic technical biases while preserving biological signals.
Performance Metrics Across scRNA-seq Platforms
Systematic benchmarking of high-throughput scRNA-seq methods for immune cell profiling reveals substantial differences in key performance metrics that directly impact normalization requirements. Studies comparing seven high-throughput methods using defined mixtures of human and murine lymphocyte cell lines found that 10x Genomics 5' v1 and 3' v3 methods demonstrated the highest mRNA detection sensitivity, with the 3' v3 kit detecting a median of 28,006 UMIs and 4,776 genes per cell [47]. Higher sensitivity methods exhibited fewer dropout events, facilitating identification of differentially expressed genes and improving concordance with bulk RNA-seq signatures [47].
Cell capture rates varied dramatically across platforms, with 10x Genomics methods recovering approximately 30-80% of input cells compared to less than 2% for ddSEQ and Drop-seq methods [47]. The fraction of sequence reads assignable to individual cells also differed significantly, affecting normalization efficiency—ICELL8 experiments demonstrated >90% cell-assignable reads, 10x experiments showed 50-75%, while ddSEQ and Drop-seq had less than 25% [47]. These platform-specific performance characteristics underscore the importance of selecting normalization methods appropriate for the specific technical properties of each scRNA-seq platform.
Table 3: Single-Cell RNA-seq Platform Comparison and Normalization Implications
| Platform/Method | Cell Recovery Rate | Cell-Assignable Reads | Genes Detected per Cell | Key Normalization Considerations |
|---|---|---|---|---|
| 10x 3' v3 | ~30-80% | ~50-75% | 4,000-7,000 | High detection sensitivity; fewer dropout events [47] |
| 10x 5' v1 | ~30-80% | ~50-75% | 4,000-7,000 | Similar to 3' v3; good for immune cells [47] |
| BD Rhapsody | Similar to 10x | Similar to 10x | 4,000-7,000 | Higher mitochondrial content; cell type biases [46] |
| Drop-seq | <2% | <25% | 2,000-6,000 | Low efficiency; high ambient RNA [47] |
| ddSEQ | <2% | <25% | 2,000-5,000 | Lowest efficiency; high intergenic mapping [47] |
| ICELL8 | Variable | >90% | 3,000-7,000 | High cell-assignable reads; protocol-dependent UMI reliability [47] |
| Smart-seq2 | Low-throughput | NA | 6,500-10,000 | Full-length transcripts; plate-based biases [45] |
Experimental Protocols and Applications
Protocol for Normalization Method Benchmarking
Objective: Systematically evaluate RNA-seq normalization methods for creating condition-specific metabolic models using iMAT and INIT algorithms.
Input Requirements:
- Raw RNA-seq count data from at least two biological conditions (e.g., disease vs. control)
- Minimum three biological replicates per condition [48]
- 20-30 million reads per sample for mammalian transcriptomes [48]
- Covariate data (age, gender, disease-specific factors)
Methodology:
Data Preprocessing:
- Quality control using FastQC or similar tools
- Read alignment to reference genome using STAR aligner [48]
- Gene quantification using HTseq or featureCounts
Normalization Application:
- Apply five normalization methods (TPM, FPKM, TMM, RLE, GeTMM) to raw count data
- Implement covariate adjustment using linear models for relevant sample metadata
- Generate normalized expression matrices for each method
Metabolic Model Reconstruction:
- Map normalized expression data to human genome-scale metabolic model (GEM)
- Create condition-specific models using iMAT algorithm [3]
- Generate personalized models for each sample in the dataset
Performance Evaluation:
- Calculate number of active reactions in each model
- Assess variability in model size across samples
- Determine accuracy in capturing known disease-associated genes
- Identify significantly affected metabolic pathways
Expected Outcomes: Between-sample normalization methods (TMM, RLE, GeTMM) will produce models with lower variability and higher accuracy for capturing disease-associated metabolic alterations compared to within-sample methods (TPM, FPKM) [3].
Protocol for Single-Cell RNA-seq Normalization Benchmarking
Objective: Compare normalization performance across different scRNA-seq platforms in complex tissues.
Input Requirements:
- Defined cell mixture (e.g., immune cell lines or complex tissue samples)
- Multiple scRNA-seq platforms (e.g., 10x Chromium, BD Rhapsody, Smart-seq2)
- Both fresh and artificially damaged samples from same source [46]
Methodology:
Library Preparation:
- Process identical samples across multiple scRNA-seq platforms
- Include both fresh and damaged samples to assess robustness
- Sequence to sufficient depth (50,000 reads per cell recommended) [47]
Quality Assessment:
- Calculate cell recovery rates using knee/inflection points in count distributions
- Determine multiplet rates using species-mixing experiments [47]
- Assess fraction of cell-assignable reads versus ambient RNA
Normalization Application:
- Apply platform-appropriate normalization methods
- Compare gene detection sensitivity across cell types
- Evaluate cell type representation biases
Performance Metrics:
- Gene sensitivity (genes detected per cell type)
- Mitochondrial content variation
- Reproducibility between technical replicates
- Cluster resolution and cell type identification
- Ambient RNA contamination levels [46]
Expected Outcomes: Platform-specific performance differences will be identified, enabling selection of optimal normalization strategies for particular experimental designs and cell types of interest.
Table 4: Key Research Reagent Solutions for RNA-seq Normalization Studies
| Resource Category | Specific Tools/Platforms | Function in Normalization Research |
|---|---|---|
| Alignment Tools | STAR, HISAT2, TopHat2 | Map sequencing reads to reference genome; generate count data for normalization [48] |
| Quantification Tools | HTseq, featureCounts, kallisto | Generate raw counts or transcript abundances for normalization input [48] |
| Bulk RNA-seq Normalization | edgeR (TMM), DESeq2 (RLE), Limma | Implement between-sample normalization methods; correct for library size differences [3] [1] |
| Single-Cell Normalization | Seurat, SCANPY, Scran | Platform-specific normalization for scRNA-seq data; address technical noise and dropout events |
| Batch Effect Correction | ComBat, Limma removeBatchEffect | Correct for technical variation across datasets and sequencing batches [1] |
| Quality Control Tools | FastQC, Picard, Qualimap2 | Assess RNA-seq data quality before and after normalization [48] |
| Metabolic Modeling | iMAT, INIT algorithms | Create condition-specific metabolic models from normalized expression data [3] |
| Visualization Platforms | Omics Playground, IGV | Explore normalized data through PCA, clustering, and pathway analysis [1] |
The evolution of high-throughput and single-cell RNA-seq technologies has significantly impacted normalization practices, necessitating method selection tailored to specific experimental designs and analytical goals. Between-sample normalization methods (TMM, RLE, GeTMM) generally outperform within-sample approaches for differential expression analysis and metabolic modeling, producing more consistent results with reduced false positive predictions, albeit at the potential cost of missing some true positives [3]. The growing importance of covariate adjustment further enhances normalization effectiveness, particularly for complex diseases where factors like age, gender, and technical variables significantly influence transcriptomic measurements.
Future methodological development will likely address emerging challenges in single-cell RNA-seq normalization, particularly for multi-omics integration and complex tissue applications. As single-cell technologies continue evolving toward higher throughput and lower costs, with emerging methods capable of sequencing up to 2.6 million cells at 62% reduced cost, normalization approaches must adapt to maintain analytical accuracy at unprecedented scales [49]. The integration of RNA-seq data with other omics modalities will require novel normalization strategies that preserve cross-platform biological signals while removing technical artifacts, ultimately enabling more comprehensive systems biology approaches to understanding complex biological systems and disease processes.
In clinical RNA-sequencing studies, a primary challenge is the distinction between biological signals of interest and unwanted technical or demographic variations. Covariates such as patient age and gender represent biological variables that can significantly influence gene expression patterns but are often not the primary focus of investigation [3]. For instance, research on Alzheimer's disease and lung adenocarcinoma has demonstrated that age and gender can have prominent effects on transcriptomic data, potentially confounding disease-related findings if not properly accounted for [3]. Simultaneously, batch effects—technical variations introduced by differences in sequencing runs, reagents, personnel, or instrumentation—represent another critical source of unwanted variability that can obscure true biological signals and lead to false discoveries [50] [51].
The integration of data from multiple patients, sequencing batches, and potentially different studies necessitates rigorous adjustment strategies to ensure robust and reproducible results. As high-throughput technologies advance and datasets grow in complexity, proper management of these confounding factors becomes increasingly critical for meaningful biological interpretation [51]. This protocol provides comprehensive guidance on detecting, assessing, and correcting for these confounding factors in clinical RNA-seq datasets, with particular emphasis on practical implementation for researchers and drug development professionals.
Table 1: Common Sources of Variation in Clinical RNA-seq Studies
| Variation Type | Examples | Impact on Data |
|---|---|---|
| Biological Covariates | Age, Gender, Genetic Background | Biological signals that may confound primary analysis |
| Technical Batch Effects | Sequencing runs, Reagent lots, Personnel | Non-biological technical artifacts |
| Environmental Factors | Sample collection time, Processing delays | Introduction of unwanted systematic variation |
| Sample Quality Metrics | RNA integrity, Post-mortem interval (for tissue) | Quality-associated expression changes |
Understanding Normalization Methods and Their Assumptions
Between-Sample Normalization Fundamentals
Between-sample normalization is a prerequisite for any comparative RNA-seq analysis, ensuring that expression measures are comparable across different specimens. This step is particularly crucial in clinical settings where samples may be processed across multiple batches or timepoints. The core assumption underlying most normalization methods is that the majority of genes are not differentially expressed between conditions, allowing for global adjustment factors to be calculated [24]. Violations of this assumption, such as in experiments with global transcriptional shifts, can lead to normalization artifacts and incorrect biological interpretations.
The choice of normalization method should be guided by both the experimental design and the underlying biological question. For analyses focused on absolute expression differences per cell, methods that account for transcriptome size variations are essential. Conversely, for studies examining changes in transcriptional composition, proportion-based normalization approaches may be more appropriate [24]. Understanding these distinctions is fundamental to selecting an appropriate normalization strategy for clinical research applications.
Comparative Performance of Normalization Methods
Benchmarking studies have systematically evaluated how different normalization methods perform when mapping RNA-seq data to genome-scale metabolic models (GEMs). In studies of Alzheimer's disease and lung adenocarcinoma, between-sample normalization methods including RLE, TMM, and GeTMM produced condition-specific metabolic models with significantly lower variability compared to within-sample methods like FPKM and TPM [3]. These methods demonstrated superior performance in capturing disease-associated genes, with average accuracy of approximately 0.80 for Alzheimer's disease and 0.67 for lung adenocarcinoma [3].
Notably, covariate adjustment consistently improved accuracy across all normalization methods in these benchmarking studies. The performance improvement highlights the critical importance of explicitly modeling biological and technical covariates even after appropriate normalization. The RLE method, implemented in DESeq2, uses a correction factor applied to read counts based on the median of ratios across all genes, while TMM from edgeR calculates scaling factors based on a trimmed mean of log expression ratios [3].
Table 2: RNA-seq Normalization Methods and Their Applications
| Method | Package | Approach | Best Use Cases |
|---|---|---|---|
| TMM | edgeR | Trimmed Mean of M-values | Between-sample comparisons; general DE analysis |
| RLE | DESeq2 | Relative Log Expression | Between-sample comparisons; count-based models |
| GeTMM | - | Gene length corrected TMM | Combining within- and between-sample needs |
| TPM | - | Transcripts Per Million | Within-sample comparisons; proteomics integration |
| FPKM/RPKM | - | Fragments per kilobase million | Within-sample comparisons; single-sample analysis |
Detection and Visualization of Batch Effects
Exploratory Data Analysis for Batch Effect Assessment
Prior to any formal correction, comprehensive exploratory analysis is essential to identify potential batch effects and their magnitude. Principal Component Analysis serves as a powerful initial tool for visualizing systematic variations in the data [50] [52]. When samples cluster primarily by technical factors such as sequencing batch or processing date rather than biological conditions, this indicates significant batch effects that require correction [50]. The following workflow illustrates the systematic approach to batch effect detection:
In addition to PCA, more specialized metrics have been developed for quantifying batch effect severity. The k-nearest neighbor batch effect test provides a quantitative measure of how well batches are mixed at the local level, offering a more objective assessment than visual inspection alone [51]. For large-scale studies, metrics such as the average silhouette width can help determine whether batch effects are substantial enough to warrant correction, as over-correction can potentially remove biological signal along with technical noise [51].
Practical Implementation of Batch Effect Visualization
The following R code demonstrates how to perform PCA visualization to assess batch effects in RNA-seq data, an essential step before proceeding with formal correction methods:
This visualization approach allows researchers to quickly assess whether samples cluster by technical factors rather than biological conditions. In datasets with significant batch effects, samples from the same batch typically form distinct clusters regardless of their biological group membership. This visual assessment should be complemented with quantitative metrics to inform the decision about whether and how to correct for observed batch effects.
Batch Effect Correction Strategies and Methodologies
Empirical Bayes Methods for Batch Correction
ComBat-seq represents a specialized adaptation of the empirical Bayes framework designed specifically for RNA-seq count data [50]. This method effectively adjusts for batch effects while preserving biological signals of interest by borrowing information across genes within each batch. The empirical Bayes approach is particularly valuable for clinical studies with small sample sizes, as it provides more stable estimates by partially pooling variance estimates across genes [50] [1].
The ComBat-seq methodology operates by estimating batch-specific parameters and then applying empirical Bayes shrinkage to adjust for these systematic differences. The implementation requires careful specification of the batch variable and can optionally incorporate biological groups to prevent over-correction of biological signals. The following code demonstrates the practical application of ComBat-seq:
After applying ComBat-seq, the PCA plot should show reduced clustering by batch, with samples primarily grouping by biological conditions rather than technical factors. It is essential to verify that the correction has not inadvertently removed biological signal, particularly when batch effects are confounded with experimental conditions.
Covariate Adjustment in Differential Expression Analysis
Rather than pre-correcting the entire dataset, a statistically rigorous alternative incorporates batch and covariate information directly into the differential expression model. This approach maintains the integrity of the count data distribution while accounting for unwanted variation. Popular differential expression frameworks including DESeq2, edgeR, and limma-voom support the inclusion of covariates in their model design matrices [50] [10].
For the limma-voom pipeline, which is particularly effective for complex designs, the workflow involves:
This model-based approach simultaneously estimates the effects of biological conditions while adjusting for batch and other covariates, providing a robust framework for identifying truly differentially expressed genes. The method preserves the statistical properties of count data while effectively controlling for technical confounding factors.
Advanced Modeling Approaches for Complex Designs
Mixed linear models offer sophisticated solutions for experimental designs with multiple random effects or hierarchical structures [50]. These models are particularly valuable when batch effects have a nested structure or when dealing with repeated measurements from the same patients across multiple timepoints. The lme4 package in R provides implementation of mixed linear models suitable for RNA-seq data after appropriate transformation:
This approach explicitly models batch as a random effect, recognizing that the specific batches in the study represent a sample from a larger population of possible batches. The method provides flexibility for complex clinical designs, including those with multiple random effects such as patient ID, batch, and processing date.
Integrated Workflow for Comprehensive Covariate Adjustment
The following diagram illustrates a complete analytical pipeline for addressing covariates and batch effects in clinical RNA-seq studies, integrating the methods discussed in previous sections:
This comprehensive workflow emphasizes the iterative nature of covariate adjustment in clinical RNA-seq analysis. The decision points reflect the importance of selecting methods appropriate for both the data structure and the specific analytical goals. For differential expression analysis, incorporating covariates directly into the statistical model is generally preferred as it preserves the statistical properties of count data. For exploratory analyses or visualization, direct correction methods may be more appropriate.
Successful implementation of covariate adjustment strategies requires both computational tools and appropriate experimental design. The following table summarizes key resources referenced in this protocol:
Table 3: Essential Research Reagents and Computational Tools for Covariate Adjustment
| Resource | Type | Function | Implementation |
|---|---|---|---|
| edgeR | Bioconductor Package | TMM normalization; DE with covariate adjustment | R/Bioconductor |
| DESeq2 | Bioconductor Package | RLE normalization; DE with complex designs | R/Bioconductor |
| limma | Bioconductor Package | removeBatchEffect; voom transformation | R/Bioconductor |
| sva | Bioconductor Package | ComBat-seq; surrogate variable analysis | R/Bioconductor |
| lme4 | R Package | Mixed linear models for complex random effects | R/CRAN |
| Reference Samples | Experimental Control | Batch monitoring and normalization | Laboratory Protocol |
| GEOquery | Bioconductor Package | Access to public data for method validation | R/Bioconductor |
In addition to these computational tools, thoughtful experimental design remains the most powerful approach to managing batch effects. When possible, randomizing samples across processing batches and balancing biological conditions within batches can significantly reduce confounding. For large-scale clinical studies, incorporating reference samples processed in each batch provides valuable metrics for assessing and correcting batch effects [53] [51].
For studies integrating multiple datasets or expecting significant technical variation, surrogate variable analysis provides a data-driven approach to identifying and adjusting for unknown sources of technical variation [50] [1]. This method is particularly valuable when complete batch information is unavailable or when unexpected technical artifacts are present in the data.
Effective management of covariates and batch effects is fundamental to robust clinical RNA-seq analysis. The strategies outlined in this protocol provide a comprehensive framework for addressing these challenges across diverse research contexts. Based on current benchmarking studies and methodological developments, the following best practices are recommended:
First, always begin with appropriate between-sample normalization such as TMM or RLE to establish comparable expression measures across specimens. Second, conduct thorough exploratory analysis to visualize and quantify batch effects before proceeding with formal correction. Third, select correction strategies aligned with analytical goals—preferring model inclusion for hypothesis testing and direct correction for exploratory analyses. Finally, document all processing steps thoroughly to ensure reproducibility and facilitate meta-analytic approaches.
As RNA-seq technologies continue to evolve and clinical applications expand, the principles of rigorous covariate adjustment remain essential for extracting biologically meaningful insights from complex transcriptomic data. By implementing the protocols outlined in this document, researchers can enhance the reliability, reproducibility, and translational impact of their clinical RNA-seq studies.
In cancer genomics, accurate transcriptomic profiling from RNA sequencing (RNA-seq) is fundamental for understanding tumor biology, identifying therapeutic targets, and developing personalized treatment strategies. A critical yet often overlooked challenge in analyzing cancer RNA-seq data is the confounding effect of somatic copy number aberrations (SCNAs). SCNAs are a hallmark of cancer, involving large-scale genomic alterations that drive tumorigenesis by affecting gene dosage and altering the expression of oncogenes and tumor suppressor genes [54]. These alterations directly impact RNA transcript numbers by changing DNA template availability, thereby introducing biological noise that can obscure true regulatory changes in gene expression [55].
Traditional RNA-seq normalization methods, including TPM, FPKM, TMM, and RLE, operate under the assumption of diploid genome coverage [55] [3]. While appropriate for normal tissues, this assumption fails in cancer genomes characterized by widespread aneuploidy and focal SCNAs. Consequently, genes within amplified regions may show artificially elevated expression, while those in deleted regions may appear suppressed, leading to misinterpretation in differential expression analysis and biomarker discovery [55].
This Application Note outlines integrated bioinformatics approaches and experimental protocols that systematically incorporate DNA copy number information to improve RNA-seq data normalization specifically for cancer research. By correcting for SCNA-induced biases, these methods enable more accurate detection of biologically relevant expression signatures, enhance discovery of therapeutic targets, and improve prognostic model development.
Background
The Interplay Between DNA Copy Number and Gene Expression in Cancer
The relationship between DNA copy number and gene expression is particularly pronounced in cancer. DNA copy number alterations can directly alter gene expression levels by changing the number of DNA templates available for transcription [55]. Studies have revealed that approximately 15% of the variations in gene expression can be explained by copy number alterations [55]. This relationship is mechanistically straightforward: amplified genomic regions provide more templates for transcription, potentially increasing mRNA output, while deleted regions reduce template availability, potentially decreasing expression.
This direct relationship presents a unique normalization challenge in cancer transcriptomics. As noted in foundational research: "For the samples with CNAs, choosing reference values is not straightforward in DNA data normalization. In fact, it is equally challenging in RNA data normalization – we will demonstrate this by showing the existence of CNA-oriented correlation between DNA copy number and gene expression" [55]. This biological reality fundamentally undermines the core assumption of most conventional normalization methods that the majority of genes are not differentially expressed or that global expression distributions should be similar across samples.
Limitations of Conventional Normalization Methods
Traditional RNA-seq normalization methods fall into two main categories: within-sample methods (e.g., TPM, FPKM) that account for sequencing depth and gene length, and between-sample methods (e.g., TMM, RLE) that scale samples based on reference sets [3]. While effective for normal tissues, these approaches have significant limitations in cancer genomics:
- TPM and FPKM exhibit high variability in cancer samples due to their sensitivity to extreme expression values from amplified genes [3]
- Between-sample methods like TMM and RLE assume most genes are not differentially expressed, which is violated in cancers with extensive SCNAs [55]
- All conventional methods fail to distinguish expression changes driven by transcriptional regulation from those caused by underlying DNA copy number changes
The consequences of these limitations are practical and significant. Studies have shown that normalization method choice substantially impacts downstream analyses, including differential expression detection, metabolic network mapping, and prognostic model development [3]. When analyzing cancer RNA-seq data without copy number correction, researchers risk identifying false positive biomarkers located in amplified regions or missing true regulatory changes in deleted regions.
Integrated Normalization Methodology
Foundations of Copy Number-Aware Normalization
The integrated normalization approach fundamentally differs from conventional methods by explicitly modeling and removing the variation in gene expression attributable to underlying DNA copy number changes. The core principle is to estimate and correct for the systematic bias introduced by SCNAs, thereby revealing the true transcriptional landscape independent of genomic alterations.
The mathematical foundation of one such approach involves defining specific ratios that incorporate both DNA and RNA read counts [55]. For a given gene i in sample j under condition C1, the RNA ratio (r^C1~ij~) and DNA ratio (d^C1~ij~) are defined as:
- r^C1~ij~ = (x^C1~ij~ + u~1~)/(N^C1~ij~ + u~1~ + u~2~)
- d^C1~ij~ = (y^C1~ij~ + u~5~)/(M^C1~ij~ + u~5~ + u~6~)
Where x^C1~ij~ and y^C1~ij~ represent RNA-seq and DNA-seq read counts respectively, N^C1~ij~ and M^C1~ij~ represent the sums of read counts from tumor and matched normal samples, and u~k~ terms are smoothing parameters to handle low counts [55].
This approach enables the decomposition of expression variation into copy-number-driven and regulation-driven components, providing a more biologically accurate normalization specifically tailored to cancer genomics.
Advanced Computational Framework: RCANE
For researchers without matched DNA-seq data, the RCANE (RNA-seq to Copy Number Aberration Neural Network) framework represents a cutting-edge deep learning approach that predicts genome-wide SCNAs directly from RNA-seq data [54]. This method is particularly valuable in scenarios where only transcriptomic data are available.
RCANE employs a sophisticated architecture that combines sequence models with graph neural networks [54]. The framework includes several biologically informed components:
- Multi-layer perceptron (MLP) processes normalized gene expression values adjusted by cancer-type embeddings
- Chromosome-specific Long Short-Term Memory (LSTM) networks capture both short- and long-range dependencies in gene expression within chromosomes
- Graph Attention (GAttn) layers incorporate predefined positive and negative correlation graphs to capture cross-chromosomal SCNA patterns
- Univariate layers perform final fine-tuning of predictions
Ablation studies have demonstrated that each component contributes significantly to model performance, with removal of LSTM or GAttn layers reducing Matthews correlation coefficient (MCC) by 7-14% across datasets [54]. The model is trained using data from The Cancer Genome Atlas (TCGA) and further fine-tuned on DepMap cancer cell line data, enabling robust predictions across diverse cancer types.
Table 1: Performance Comparison of SCNA Detection Methods Across Cancer Types
| Method | Average Sensitivity | Average Specificity | Average MCC | Key Advantages |
|---|---|---|---|---|
| RCANE | 0.80 | 0.97 | 0.79 | Whole-genome prediction, cancer-type specific patterns |
| CNAPE | 0.37 | 0.94 | 0.37 | Gene-level predictions |
| CNVkit | 0.35 | 0.89 | 0.35 | Originally designed for DNA-seq |
| CopyKAT | N/A | N/A | Poor performance | Designed for single-cell data |
Experimental Protocols
Protocol 1: Integrated Normalization Using Matched DNA-seq Data
This protocol details the complete workflow for normalizing cancer RNA-seq data when matched DNA sequencing data are available.
Sample Requirements and Preparation
- Input Requirements:
- Tumor RNA-seq data (raw read counts)
- Matched tumor DNA-seq data (whole genome or whole exome)
- Matched normal DNA-seq data (optional but recommended)
- Quality Control:
- RNA Integrity Number (RIN) > 7.0 for RNA-seq samples
- Minimum coverage of 30X for DNA-seq samples
- Verify absence of significant batch effects between DNA and RNA preparations
Step-by-Step Procedure
Data Preprocessing
- Process RNA-seq data through standard alignment (STAR, HISAT2) and quantification (featureCounts, HTSeq) pipelines
- Process DNA-seq data through copy number calling pipeline (GAT4, Control-FREEC)
- Align genomic coordinates between RNA and DNA datasets
Calculate Expression and Copy Number Ratios
- For each gene, compute RNA ratio (r~ij~) using normalized read counts
- For each gene, compute DNA ratio (d~ij~) using segmented copy number values
- Apply smoothing parameters to handle low-count genes
Normalization Model Fitting
- Fit linear regression model: log(r~ij~) = β~0~ + β~1~log(d~ij~) + ε~ij~
- Extract residuals (ε~ij~) as copy-number-corrected expression values
- Validate model assumptions through residual diagnostics
Quality Assessment
- Compare correlation structure before and after correction
- Verify reduction in copy number-associated expression bias
- Assess improvement in biological signal detection
The entire workflow typically requires 24-48 hours of computation time for a standard cohort of 100 samples, with memory requirements dependent on genome build and number of features.
Protocol 2: RCANE-Mediated Normalization Without DNA-seq Data
This protocol applies when only RNA-seq data are available, using the RCANE framework to infer copy number effects.
Prerequisites and Installation
- Software Requirements:
- Python 3.8+ with PyTorch
- RCANE package (available from GitHub repository)
- Pre-trained models for relevant cancer types
- Input Data:
- RNA-seq count matrix (genes × samples)
- Sample cancer type annotations
- Gene genomic coordinates (GRCh38)
Implementation Steps
Data Preprocessing
- Normalize raw counts using TPM transformation
- Filter lowly expressed genes (TPM < 1 in >90% of samples)
- Order genes by genomic position
- Group adjacent genes into segments assuming shared copy number
RCANE Model Application
- Load cancer-type specific pre-trained model
- Run inference to predict SCNA intensity values
- Generate whole-genome copy number profiles
Expression Normalization
- Use predicted SCNAs to correct expression values
- Apply segment-level correction factors
- Output normalized expression matrix
Validation and Interpretation
- Assess predicted SCNAs against known patterns for cancer type
- Compare normalized expression distributions with expected patterns
- Perform differential expression analysis to verify biological relevance
Table 2: Research Reagent Solutions for Integrated Normalization Approaches
| Reagent/Resource | Function | Example Sources |
|---|---|---|
| RNA-seq Library Prep Kits | Generate sequencing libraries from tumor RNA | Illumina Stranded mRNA Prep |
| Whole Genome DNA-seq Kits | Generate matched DNA sequencing libraries | Illumina DNA PCR-Free Prep |
| Reference Genomes | Alignment and coordinate reference | GRCh38 from GENCODE |
| Cell Line Resources | Model systems for validation | DepMap Cancer Cell Lines |
| Reference Datasets | Training and benchmarking | TCGA, CPTAC, GEO |
Applications and Case Studies
Enhanced Differential Expression Analysis
Integrating copy number information significantly improves differential expression analysis in cancer studies by reducing false positives driven by SCNAs. In a comparative analysis, the integrated approach demonstrated:
- 25-40% reduction in false positive differentially expressed genes located in amplified regions
- Improved detection of true regulatory changes in deleted regions
- More biologically coherent pathway enrichment results
A case study applying integrated normalization to TCGA colorectal cancer data identified several key driver genes that were missed by conventional methods, including tumor suppressors in regions commonly affected by copy number loss [56]. These findings were subsequently validated in independent cohorts, demonstrating the robustness of the approach.
Improved Prognostic Model Development
Copy-number-aware normalization enhances the development and performance of transcriptional prognostic models in oncology. Models built using integrated normalization demonstrate:
- Higher reproducibility across independent datasets
- Reduced overfitting to cancer-type specific SCNA patterns
- Improved biological interpretability of prognostic signatures
In hepatocellular carcinoma, researchers integrated single-cell and bulk RNA-seq data to develop prognostic models based on plasma cell-related genes [57]. After copy number correction, the resulting 8-gene signature showed significantly improved prognostic accuracy with independently validated area under the curve (AUC) values of 0.71 for 5-year survival prediction [57].
Multi-Omic Driver Gene Identification
Integrated approaches enable more comprehensive identification of cancer driver genes by synthesizing information across multiple molecular layers. A systematic framework analyzing ~7,500 tumors from TCGA integrated mutation, copy number, and gene expression data to identify candidate driver genes of recurrent chromosome-arm losses [58]. This approach:
- Identified 322 candidate drivers associated with 159 recurring aneuploidy events
- Rediscovered known aneuploidy drivers (TP53, PTEN) while revealing novel candidates
- Linked candidate drivers to tumor transcriptional shifts through integrated pathway analysis
The resulting catalog provides a comprehensive resource for investigating aneuploidy drivers across 20 cancer types [58].
Implementation Considerations
Computational Requirements and Scalability
Implementing integrated normalization approaches requires careful consideration of computational resources:
- Memory requirements: 8-16 GB RAM for standard cohorts
- Processing time: 2-48 hours depending on cohort size and method
- Storage: Additional 20-40% for intermediate files
For large-scale analyses (n > 1000), distributed computing implementations are recommended. Cloud-based solutions offer scalable alternatives for resource-intensive applications.
Method Selection Guidelines
Choosing the appropriate integrated normalization strategy depends on available data and research objectives:
- With matched DNA-seq: Direct integrated normalization provides the most accurate correction
- RNA-seq only: RCANE offers robust SCNA inference and correction
- Single-cell studies: CopyKAT provides effective CNV inference for scRNA-seq data
- Cross-study integration: Between-sample methods (TMM, RLE) with post-hoc SCNA correction
Quality Control and Validation
Rigorous quality assessment is essential for successful implementation:
- Pre-normalization: Assess SCNA impact through correlation analysis
- Post-normalization: Verify reduction in copy number-associated expression variance
- Biological validation: Confirm expected expression patterns in known cancer genes
- Technical validation: Compare results with orthogonal methods when available
To illustrate the conceptual framework and experimental workflow for integrated normalization approaches, the following diagrams provide visual representations of the key processes and methodological decisions.
Diagram 1: Integrated Normalization Workflow. This diagram outlines the decision process and methodological paths for implementing copy-number-aware RNA-seq normalization, depending on the availability of matched DNA-seq data.
Diagram 2: RCANE Deep Learning Architecture. This diagram illustrates the neural network architecture of the RCANE framework, showing how it processes RNA-seq data through multiple specialized components to predict copy number alterations and generate corrected expression values.
Integrating DNA copy number information into RNA-seq normalization represents a significant advancement in cancer transcriptomics, addressing a fundamental biological confounding factor that has traditionally been overlooked. The approaches outlined in this Application Note – from direct integration of matched DNA-seq data to sophisticated deep learning methods like RCANE – provide researchers with powerful tools to extract more accurate and biologically meaningful information from cancer transcriptomic data.
The benefits of these integrated approaches extend across multiple research applications, including improved differential expression analysis, enhanced prognostic model development, and more comprehensive multi-omic driver gene identification. As cancer genomics continues to evolve toward more integrative analyses, copy-number-aware normalization methods will play an increasingly crucial role in ensuring the validity and reproducibility of transcriptomic findings.
Implementation requires careful consideration of available data resources and computational requirements, but the resulting improvements in data quality and biological insight justify the additional complexity. By adopting these integrated approaches, researchers can overcome a significant limitation of conventional RNA-seq analysis and advance our understanding of cancer biology through more accurate interpretation of transcriptional regulation in genomically unstable tumors.
Ensuring Rigor: Benchmarking, Validation, and AI-Driven Future Directions
Integrating transcriptomic data with genome-scale metabolic models (GEMs) represents a powerful approach for constructing condition-specific metabolic models that simulate metabolic phenotypes in health and disease. The choice of RNA-seq normalization method significantly influences the content and predictive accuracy of metabolic models generated by algorithms such as the Integrative Metabolic Analysis Tool (iMAT) and Integrative Network Inference for Tissues (INIT). This application note synthesizes recent benchmarking evidence demonstrating that between-sample normalization methods—Relative Log Expression (RLE), Trimmed Mean of M-values (TMM), and its gene-length corrected version (GeTMM)—produce metabolic models with lower variability and higher functional accuracy compared to within-sample methods (TPM, FPKM). We provide detailed protocols for implementing these normalization techniques and integrating them with metabolic mapping algorithms, along with visual workflows and reagent solutions to facilitate robust, reproducible research in computational metabolism.
The reconstruction of condition-specific genome-scale metabolic models (GEMs) from transcriptomic data enables researchers to simulate metabolic phenotypes under different physiological and pathological conditions. RNA-seq data normalization serves as a critical preprocessing step that corrects for technical variations including gene length, library size, and sequencing run differences, thereby directly impacting the quality of downstream metabolic models [3]. Despite the critical importance of normalization selection, a comprehensive benchmark of how different RNA-seq normalization methods affect metabolic model prediction has been lacking until recently.
This application note, framed within a broader thesis on RNA-seq normalization for exploratory analysis, details how normalization choice systematically influences metabolic model properties including reaction activity, pathway identification, and gene essentiality predictions. We present quantitative comparisons, standardized protocols, and visualization tools to guide researchers and drug development professionals in selecting appropriate normalization strategies for metabolic modeling applications, with particular emphasis on neurodegenerative diseases and cancer.
Key Findings: Normalization Methods Show Distinct Performance Profiles
Quantitative Comparison of Normalization Methods
Table 1: Performance characteristics of RNA-seq normalization methods for metabolic model reconstruction
| Normalization Method | Category | Variability in Active Reactions | Number of Significantly Affected Reactions | Accuracy in Capturing Disease Genes | Key Characteristics |
|---|---|---|---|---|---|
| RLE | Between-sample | Low | Moderate | ~0.80 (AD), ~0.67 (LUAD) | Applies correction factor to read counts; assumes most genes not differentially expressed |
| TMM | Between-sample | Low | Moderate | ~0.80 (AD), ~0.67 (LUAD) | Applies correction factor to library size; robust to highly differentially expressed genes |
| GeTMM | Between-sample | Low | Moderate | ~0.80 (AD), ~0.67 (LUAD) | Combines gene-length correction with TMM normalization |
| TPM | Within-sample | High | High | Lower than between-sample methods | Corrects for gene length first, then sequencing depth |
| FPKM | Within-sample | High | High | Lower than between-sample methods | Corrects for sequencing depth first, then gene length |
Impact of Covariate Adjustment
The performance of normalization methods can be further refined through covariate adjustment. Studies on Alzheimer's disease (AD) and lung adenocarcinoma (LUAD) have demonstrated that adjusting for covariates such as age, gender, and post-mortem interval (for brain tissues) reduces variability in personalized metabolic models, particularly for within-sample normalization methods [3]. After covariate adjustment:
- TPM and FPKM show reduced variability in the number of active reactions across samples
- All methods demonstrate improved accuracy in capturing disease-associated genes
- Between-sample normalization methods (RLE, TMM, GeTMM) maintain their advantage in producing more consistent model sizes
Figure 1: Workflow for benchmarking normalization effects on metabolic models. The pathway illustrates how raw RNA-seq data undergoes different normalization methods, optional covariate adjustment, and metabolic mapping algorithms to generate personalized GEMs for downstream analysis.
Experimental Protocols
Protocol 1: RNA-seq Data Normalization Implementation
Purpose: To implement and compare five major RNA-seq normalization methods for downstream metabolic modeling applications.
Materials:
- Raw RNA-seq count data (FASTQ or count matrix format)
- High-performance computing environment with R/Bioconductor
- Reference genome appropriate to sample species
Procedure:
Data Preparation
- Load raw count data into R using tximport or similar package
- Filter low-expression genes (recommended: retain genes with >10 counts in at least 30% of samples)
- Create DGEList object for TMM implementation or DESeqDataSet for RLE implementation
Between-Sample Normalization Methods
TMM Implementation:
RLE Implementation:
GeTMM Implementation:
Within-Sample Normalization Methods
TPM Implementation:
FPKM Implementation:
Quality Assessment
- Evaluate normalization effectiveness using PCA plots pre- and post-normalization
- Assess sample clustering by known biological groups and technical batches
- Check for reduction in sample-specific biases through density plots
Troubleshooting Tips:
- If normalization produces extreme outliers, verify count matrix integrity and recalculate normalization factors
- For datasets with strong batch effects, consider incorporating combat or other batch correction methods after normalization
- When gene length information is unavailable for GeTMM, TPM, or FPKM, use available annotation databases (Ensembl, GENCODE) to obtain transcript lengths
Protocol 2: Metabolic Model Reconstruction with iMAT
Purpose: To reconstruct condition-specific metabolic models using normalized expression data through the iMAT algorithm.
Materials:
- Normalized gene expression data (from Protocol 1)
- Generic human GEM (such as Recon3D or HMR2)
- MATLAB environment with COBRA Toolbox and iMAT implementation
- Sufficient computational resources (recommended: 16GB RAM for human-scale models)
Procedure:
Model Preparation
- Load generic human GEM using COBRA Toolbox
- Map gene expression data to model genes
- Define high and low expression thresholds (typically: upper and lower 25th percentiles)
iMAT Implementation
- Set algorithm parameters:
- Run iMAT integration:
- Extract list of active reactions from context_model.rxns
Model Validation
- Check model functionality through flux balance analysis
- Verify biomass production capability (for cellular models)
- Ensure model can perform core metabolic functions
Differential Analysis
- Compare reaction activity between conditions using statistical tests (Fisher's exact test for binary activity, t-test for continuous measures)
- Perform pathway enrichment analysis on significantly affected reactions
- Adjust for multiple testing using Benjamini-Hochberg procedure
Validation Metrics:
- Model functionality: Ensure >90% of context-specific models can perform core metabolic functions
- Reaction consistency: Assess variability in reaction counts across biological replicates
- Biological relevance: Verify that identified differential reactions align with known disease mechanisms
Table 2: Key research reagents and computational tools for normalization and metabolic modeling
| Category | Resource/Tool | Specific Application | Access Information |
|---|---|---|---|
| Normalization Software | edgeR (Bioconductor) | TMM normalization | https://bioconductor.org/packages/edgeR |
| DESeq2 (Bioconductor) | RLE normalization | https://bioconductor.org/packages/DESeq2 | |
| Metabolic Modeling Platforms | COBRA Toolbox | iMAT/INIT implementation | https://opencobra.github.io/cobratoolbox |
| RAVEN Toolbox | Alternative GEM reconstruction | https://github.com/SysBioChalmers/RAVEN | |
| Reference Metabolic Models | Recon3D | Generic human GEM | https://www.vmh.life |
| HMR2 | Human metabolic reconstruction | https://www.metabolicatlas.org | |
| Icon Repositories | Bioicons | Biology/laboratory icons | https://bioicons.com |
| Reactome | Scientific pictograms | https://reactome.org/icon-lib | |
| Servier Medical Art | Medical drawings | https://smart.servier.com |
Visualization and Data Interpretation Guidelines
Effective visualization of normalization effects and metabolic modeling results requires adherence to established design principles [59] [60]. The following guidelines ensure clear communication of complex benchmarking results:
Data Visualization Principles
- Maximize data-ink ratio: Remove non-essential chart elements such as redundant legends, excessive gridlines, and decorative backgrounds [59]
- Direct labeling: Label key elements directly on visualizations rather than relying on legends to minimize cognitive load
- Meaningful baselines: Ensure axes start at appropriate baselines (e.g., bar charts should typically start at zero to avoid visual distortion)
- Accessible color palettes: Use color combinations with sufficient contrast and consider colorblind-friendly schemes, verifying with tools like WebAIM's Contrast Checker [61]
Visualizing Normalization Effects on Metabolic Pathways
Figure 2: Normalization method impacts on metabolic model properties. Between-sample methods produce more consistent model sizes and higher pathway identification accuracy compared to within-sample methods.
Application Notes for Specific Disease Contexts
Neurodegenerative Disease Studies (Alzheimer's Disease)
When analyzing neurodegenerative diseases such as Alzheimer's, specific considerations enhance model reliability:
- Essential covariates: Include age, gender, and post-mortem interval (PMI) as covariates during normalization to account for their significant effects on brain transcriptomics [3]
- Tissue-specificity: Consider using brain-specific GEMs or assigning tissue-specific weights when using generic human models
- Pathway focus: Pay particular attention to neurotransmitter metabolism, oxidative phosphorylation, and lipid metabolism pathways known to be disrupted in AD
Cancer Metabolism Studies (Lung Adenocarcinoma)
For cancer applications such as LUAD, these adjustments improve model biological relevance:
- Covariate adjustment: Include age, gender, and tumor stage in normalization to account for clinical confounding factors
- Proliferation emphasis: Ensure biomass objective function appropriately reflects cancer cell proliferation requirements
- Metabolic vulnerabilities: Focus on reactions essential to cancer cell survival that may represent therapeutic targets
Benchmarking studies demonstrate that between-sample RNA-seq normalization methods—particularly RLE, TMM, and GeTMM—consistently outperform within-sample methods for metabolic model reconstruction. These methods generate models with lower variability in reaction content and higher accuracy in identifying disease-relevant metabolic pathways. The integration of covariate adjustment further refines model quality, especially for diseases with strong demographic risk factors such as Alzheimer's disease and lung adenocarcinoma.
The protocols and guidelines presented herein provide researchers with standardized methodologies for evaluating normalization effects on metabolic models, enabling more reproducible and biologically meaningful integration of transcriptomic data with metabolic networks. As personalized medicine advances, these approaches will become increasingly vital for identifying metabolic vulnerabilities and developing targeted therapeutic interventions.
Within the framework of a broader thesis on RNA-seq normalization methods for exploratory research, this application note provides two foundational experimental protocols. These protocols are designed to systematically evaluate whether normalization procedures successfully preserve underlying biological signals and maintain the intrinsic linear relationships between samples. Such validation is crucial for researchers and drug development professionals who rely on accurate transcriptomic data for downstream analysis and interpretation, as the choice of normalization method can significantly impact biological conclusions [62] [24]. The following sections detail the experimental workflows, necessary reagents, and analytical tools required to perform these critical assessments.
Experimental Protocol 1: Global Assessment of Biological Signal Preservation
Principle and Objective
This protocol quantifies the proportion of total data variance attributable to biological sources versus technical artifacts. A superior normalization method maximizes the explained biological variability while minimizing unexplained residual error, thereby ensuring that downstream analyses are grounded in biological truth rather than experimental noise [62].
Materials and Reagents
Table 1: Key Research Reagent Solutions for Protocol 1
| Reagent/Resource | Function in Protocol |
|---|---|
| Large-scale standardized RNA-seq dataset (e.g., SEQC consortium data) | Provides a benchmark dataset with known biological and technical variance components for systematic evaluation [62]. |
| Reference Genome and Annotation File | Enables accurate read alignment and gene quantification for downstream variance analysis. |
| High-Performance Computing (HPC) Cluster | Facilitates the computational workload of processing large datasets and running multiple normalization methods. |
R/Bioconductor Environment with edgeR, DESeq2 |
Implements various normalization algorithms (TMM, RLE, etc.) and statistical analysis [3]. |
Step-by-Step Procedure
- Data Acquisition and Preprocessing: Obtain a large-scale, standardized RNA-seq dataset designed for evaluation purposes (e.g., the Sequencing Quality Control (SEQC) consortium data). Ensure the dataset includes samples from different biological conditions and technical replicates from multiple sequencing sites [62].
- Application of Normalization Methods: Process the raw read counts using a panel of common normalization methods, including but not limited to:
- Transcripts per Million (TPM)
- Trimmed Mean of M-values (TMM)
- DESeq's Relative Log Expression (RLE)
- Quantile Normalization
- RPKM/FPKM
- Simple log2 transformation
- Variance Decomposition Analysis: For each normalized dataset and each gene, perform a two-way Analysis of Variance (ANOVA). Use a model where gene expression is the dependent variable, and the independent variables are
sample(representing biological condition) andsite(representing batch or technical effect). - Quantification of Variance Components: For each gene, calculate the proportion of total variance explained by:
- Biological differences (
samplefactor) - Technical batch effects (
sitefactor) - Unexplained residual variance
- Biological differences (
- Comparative Evaluation: Aggregate the results across all genes. The optimal normalization method is the one that, compared to the raw data, increases the proportion of variance attributable to biological differences and reduces the residual variance.
Expected Outcomes and Interpretation
The analysis will yield a quantitative breakdown of variance sources for each normalization method. The table below summarizes expected outcomes based on a benchmark study [62].
Table 2: Expected Outcomes from Global Signal Preservation Analysis
| Normalization Method | % Genes with Significant Biological Variance | % Genes with Significant Technical Variance | Proportion of Residual Variance | Performance Interpretation |
|---|---|---|---|---|
| Raw Counts | 37% | 95% | 17% | Baseline, high technical and residual noise. |
| TPM | 49% | 90% | 12% | Best performer; increases biological signal and reduces residual error [62]. |
| TMM | 27% | 95% | ~17%* | Reduces biological signal; retains technical variance. |
| RLE (DESeq) | 35% | 94% | ~17%* | Similar to raw data for biological signal. |
| Quantile | 34% | 92% | ~17%* | Slightly reduces biological and technical variance. |
| Log2 | 69% | 100% | ~13%* | Artificially inflates significance; destroys true biological signal [62]. |
Note: Exact values for residual variance for these methods were not explicitly provided in [62], but the study noted TPM, Quantile, and Log2 as the only methods that reduced it.
The following diagram illustrates the complete workflow for this protocol:
Workflow for Global Signal Assessment
Experimental Protocol 2: Evaluation of Linearity Using Mixture Models
Principle and Objective
This protocol assesses whether a normalization method preserves the known linear relationship between biological samples in a mixture experiment. It tests for the internal consistency of the data by analyzing individual genes and verifies that normalization does not impose artificial, non-linear structures that distort true expression relationships [62].
Materials and Reagents
Table 3: Key Research Reagent Solutions for Protocol 2
| Reagent/Resource | Function in Protocol |
|---|---|
| RNA samples A and B (e.g., from different cell lines or tissues) | Source material for creating defined linear mixture models. |
| In-vitro Mixing of RNA (75% A + 25% B; 25% A + 75% B) | Creates samples C and D with a mathematically defined linear relationship to A and B [62]. |
| Single-Source Sequencing Facility | Eliminates inter-site batch effects, isolating the effect of normalization on linearity. |
| Candidate Housekeeping Genes (e.g., POLR2A) | Serves as potential positive controls; traditional controls like GAPDH are discouraged due to variable expression [62] [63]. |
Step-by-Step Procedure
- Sample Preparation and Sequencing:
- Prepare two distinct RNA samples (A and B).
- Create two mixture samples: C (75% A + 25% B) and D (25% A + 75% B).
- Process and sequence all four samples (A, B, C, D) in the same facility and batch to minimize technical confounding factors.
- Data Normalization: Generate normalized expression values for all samples using the methods under investigation (TPM, TMM, Quantile, etc.).
- Linearity Analysis per Gene:
- Select a set of individual, biologically relevant genes (e.g., TP53, CD59, POLR2A).
- For each gene and each normalization method, plot the normalized expression values of samples C and D against the values of samples A and B.
- Validation of Linearity:
- The expression values of mixture samples C and D should fall on a straight line between samples A and B.
- A method that fails this test (e.g., by causing points C and D to deviate significantly from the linear fit) is considered to have introduced distortion.
- Assessment of Artifact Reduction: Examine the normalized data for persistent batch effects or library preparation artifacts. A good normalization method should reduce the clustering of data points by library prep rather than by biological sample.
Expected Outcomes and Interpretation
- Optimal Result: Normalized expression values for mixtures C and D lie perfectly on the linear fit between A and B. Methods like TPM and total read count have been shown to perform well in this test, effectively reducing technical noise without breaking linearity [62].
- Suboptimal Result: Significant deviation from linearity. Quantile normalization, for instance, has been demonstrated to repeatedly fail this linearity test by imposing new structure on the data [62].
- Control Gene Warning: The gene GAPDH often shows inconsistent expression between samples and is not recommended as a control for this validation [62].
The logical flow of the mixture experiment and its validation is depicted below:
Logic of the Mixture Model Linearity Test
The two protocols presented here provide a robust, data-driven framework for validating RNA-seq normalization methods. By quantitatively assessing biological signal preservation and testing for adherence to expected linear relationships, researchers can move beyond heuristic choices and select normalization strategies that ensure the integrity and biological validity of their data. Integrating these validation protocols into standard RNA-seq analysis workflows is highly recommended for exploratory research and drug development projects where accurate biological interpretation is paramount.
The Role of AI and Machine Learning in Automating and Enhancing Normalization
Normalization is a critical, non-negotiable step in RNA-Sequencing (RNA-Seq) data analysis that adjusts raw transcriptomic data to account for technical variability, thereby enabling meaningful biological comparisons. The core challenge stems from multiple technical factors—including sequencing depth, transcript length, gene-specific attributes like GC-content, and batch effects—that can mask true biological signals and lead to erroneous conclusions if not properly corrected [1]. The core objective is to transform raw read counts into comparable measures of gene expression, ensuring that observed differences reflect biology rather than technical artifacts [24]. Traditionally, this process has relied on statistical methods that operate under specific assumptions, such as that most genes are not differentially expressed [24] [1].
The emergence of Artificial Intelligence (AI) and Machine Learning (ML) is fundamentally reshaping this landscape. AI/ML approaches offer powerful, data-driven alternatives that can learn complex patterns from the data itself, potentially overcoming the limitations of assumption-heavy traditional methods. The integration of ML is part of a broader shift in transcriptomics, where the data acquisition bottleneck has been replaced by the challenge of analyzing large, complex datasets [64]. This document provides a detailed exploration of how AI and ML are being leveraged to automate and enhance normalization processes, complete with application notes and practical protocols for the research community.
The AI/ML Paradigm Shift in Normalization
Moving Beyond Traditional Assumptions
Traditional RNA-Seq normalization methods, while foundational, are constrained by their underlying statistical assumptions. Methods like TMM (Trimmed Mean of M-values) and RLE (Relative Log Expression) rely on the assumption that the majority of genes in an experiment are not differentially expressed [24] [3]. However, in biological scenarios featuring pervasive transcriptional shifts—such as in many disease states—this core assumption is violated, leading to normalization failures and inaccurate differential expression results [24]. Furthermore, these methods typically apply a single, global scaling factor to all genes in a sample, which may not be suitable for the complex, non-uniform technical biases present in real-world data.
AI and ML models introduce a more flexible, data-adaptive approach. They can learn the specific technical and biological sources of variation directly from the dataset, without relying on rigid, pre-defined assumptions. For instance, ML models can identify and adjust for non-linear relationships and gene-specific biases that are poorly captured by global scaling factors. This capability is particularly valuable for novel sequencing technologies and complex experimental designs where the statistical properties of the noise are not yet fully characterized. The transition to a data-centric AI paradigm in biomedical research underscores that high-quality, well-curated data is the cornerstone of effective models, shifting the focus from solely building better algorithms to also ensuring superior data quality [65] [66].
Enhancing Data Quality for AI-Driven Analysis
The performance of any AI/ML model is inextricably linked to the quality of the input data. In the context of normalization, this often involves preparing a "gold-standard" set of known non-differentially expressed genes, or using spike-in controls, to train models that can distinguish technical noise from biological signal. However, biomedical data is often messy, heterogeneous, and stored in fragmented formats, creating a significant bottleneck for AI adoption [66].
Large Language Models (LLMs) like ChatGPT are emerging as powerful tools to address this fundamental data quality challenge, particularly in tasks such as Medical Concept Normalization (MCN). The application of LLMs for data augmentation can systematically enhance the correctness and comprehensiveness of training datasets. Research has demonstrated that strategies like few-shot learning, which provides the LLM with context and a small set of representative examples from the original data, are highly effective for generating high-quality, augmented data. This process improves the performance of downstream models by increasing the diversity and volume of training instances while maintaining semantic accuracy [65]. The following workflow outlines a protocol for LLM-assisted data quality enhancement.
Figure 1: A workflow for using Large Language Models (LLMs) to enhance data quality for tasks like Medical Concept Normalization (MCN). The process involves iterative evaluation and augmentation, leveraging both zero-shot and few-shot prompting strategies to generate high-quality training data.
Machine Learning Applications in Normalization and Beyond
Feature Selection and Classification for Improved DEG Detection
ML-based approaches can significantly augment traditional differential expression analysis by identifying genes that might be missed by standard statistical tests. One powerful application uses feature selection algorithms to identify the most informative variables—or features—that can predict whether a gene is differentially expressed. These features can extend beyond raw count data to include epigenetic markers (e.g., histone modification data from ChIP-seq), sequence attributes, and characteristics of transcriptional segments [67].
A study in Arabidopsis demonstrated this approach by extracting 468 features from histone acetylation ChIP-seq data. By evaluating different combinations of feature selection and classification algorithms, the researchers identified a top-performing model based on InfoGain feature selection and Logistic Regression classification. This model used 23 key features to successfully predict ethylene-regulated genes that had been overlooked by a conventional RNA-seq analysis pipeline. The ML-predicted genes were subsequently validated by qRT-PCR, confirming that the integration of ML greatly improved the sensitivity of differentially expressed gene (DEG) identification [67]. This protocol demonstrates that ML can leverage ancillary data to rescue biologically relevant signals lost during standard normalization and testing.
Benchmarking Normalization Methods with AI-Derived Metrics
The choice of normalization method has a profound impact on all downstream analyses and biological conclusions. AI and ML techniques provide robust, data-driven frameworks for benchmarking and selecting the optimal normalization method for a specific research context. Rather than relying on a single universal metric, this approach uses multiple performance indicators derived from the data itself to evaluate how well a normalization technique has removed unwanted variation while preserving biological signal.
In studies integrating transcriptomic data with Genome-Scale Metabolic Models (GEMs), the normalization method directly influenced the content and predictive accuracy of the resulting condition-specific models. Benchmarking analyses have shown that between-sample methods like TMM, RLE, and GeTMM produce more consistent and accurate metabolic models for diseases like Alzheimer's and lung adenocarcinoma compared to within-sample methods like TPM and FPKM [3]. The following table summarizes key metrics used in such benchmarks.
Table 1: Data-Driven Metrics for Evaluating Normalization Method Performance
| Metric Category | Specific Metric | Description | Application Context |
|---|---|---|---|
| Unsupervised Distribution Analysis | Principal Component Analysis (PCA) | Visualizes the largest sources of variation; used to check if batch effects are removed and biological groups are distinct. | Exploratory data analysis, quality control [68]. |
| Cluster Validation | Silhouette Width | Measures how similar an object is to its own cluster compared to other clusters. Higher values indicate better-defined clusters. | Evaluating cell type identification in scRNA-seq, sample grouping in bulk RNA-seq [69]. |
| Batch Effect Correction | K-Nearest Neighbor Batch-effect Test (K-BET) | Tests whether cells/samples from different batches are well-mixed in the neighborhood of a randomly chosen cell. | Assessing the effectiveness of batch correction algorithms [69]. |
| Gene Selection | Highly Variable Genes (HVGs) | Identifies genes with higher biological variability than expected from technical noise. A good normalization method should enrich for true biological HVGs. | Pre-processing for dimensionality reduction and trajectory inference in scRNA-seq [69]. |
| Downstream Accuracy | Classification Accuracy | Measures how well a classifier (e.g., ML model) can predict sample condition or cell type using the normalized data. | Benchmarking normalization impact on predictive tasks [3] [67]. |
Practical Protocols for AI-Enhanced Normalization
Protocol 1: ML-Augmented Differential Expression Analysis
This protocol outlines the steps to employ a machine learning classifier to identify additional differentially expressed genes that may be missed by standard tools like DESeq2 or edgeR.
1. Feature Compilation:
- Inputs: Begin with a normalized count matrix (e.g., from DESeq2 or edgeR).
- Feature Engineering: For each gene, compile a comprehensive set of features. These should include:
- Statistical features: P-value, adjusted p-value (FDR), and log2 fold change from the standard differential expression analysis.
- Expression characteristics: Mean expression level, variance, and dispersion.
- Epigenetic features: If available, integrate data from assays like ChIP-seq (e.g., histone modifications, transcription factor binding) in relevant segments (promoters, enhancers, gene bodies).
- Genomic features: Gene length, GC content, exon count.
- Output: A feature matrix where rows are genes and columns are the compiled features.
2. Training Set Definition:
- Positive Set: Genes confidently identified as differentially expressed by the standard analysis (e.g., FDR < 0.05 and |log2FC| > 1).
- Negative Set: Genes confidently identified as non-differentially expressed (e.g., FDR > 0.5 and |log2FC| < 0.1).
- The quality of this labeled set is critical for model performance [67].
3. Model Training and Validation:
- Feature Selection: Apply a feature selection algorithm (e.g., InfoGain) to the training set to identify the most informative features for predicting DEG status.
- Classifier Training: Train a supervised classification model (e.g., Logistic Regression, Random Forest) using the selected features on the training set.
- Performance Validation: Assess the model's performance on a held-out test set or via cross-validation, using metrics like AUC-ROC.
4. Prediction and Experimental Validation:
- Application: Use the trained model to predict DEG probability for all genes, particularly those in the "uncharacterized" set not caught by the standard analysis.
- Candidate Selection: Generate a list of high-probability ML-predicted DEGs that were not in the original positive set.
- Validation: Confirm the expression changes of top candidates using an orthogonal method such as qRT-PCR [67].
Protocol 2: Benchmarking Normalization Methods for a Specific Application
This protocol provides a framework for empirically determining the best normalization method for a specific downstream task, such as integrating data with metabolic models.
1. Data Preparation and Normalization:
- Input: Raw count matrix from an RNA-seq experiment.
- Application: Apply a range of normalization methods to the raw data. Essential methods to include are:
- Between-sample methods: TMM (from edgeR), RLE (from DESeq2), GeTMM.
- Within-sample methods: TPM, FPKM.
- Output: Multiple normalized expression matrices, one for each method tested [3] [1].
2. Integration with Downstream Analysis Platform:
- Task Selection: Choose the relevant downstream analysis. For example, if building metabolic models, use an algorithm like iMAT or INIT.
- Execution: Apply the chosen downstream analysis to each normalized dataset independently.
- Output: A set of results for each normalization method (e.g., a personalized metabolic model for each sample) [3].
3. Quantitative Evaluation:
- Define Metrics: Select quantitative metrics relevant to the biological question. For metabolic models, this could include:
- Variability: The range in the number of active reactions across samples (lower is better for technical variability).
- Biological Accuracy: The accuracy in capturing known disease-associated genes, compared to a gold-standard dataset.
- Predictive Power: The concordance of predicted altered metabolites with independent metabolome data [3].
- Assessment: Calculate these metrics for the results derived from each normalization method.
4. Selection and Implementation:
- Comparative Analysis: Compare the evaluation metrics across all normalization methods.
- Decision: Select the normalization method that yields the best performance on the metrics most critical to your study.
- Final Workflow: Use the selected normalization method for the definitive analysis in your research.
The following diagram illustrates the competitive benchmarking process, culminating in the selection of the best-performing method.
Figure 2: A workflow for benchmarking RNA-seq normalization methods. Multiple methods are applied to the same raw data, evaluated on task-specific quantitative metrics, and the best-performing one is selected for the final analysis.
The Scientist's Toolkit: Research Reagent Solutions
Table 2: Essential Tools and Algorithms for AI-Enhanced RNA-Seq Normalization
| Tool/Reagent | Type | Primary Function in Normalization/Analysis | Key Reference/Resource |
|---|---|---|---|
| DESeq2 | R Package | Performs differential expression analysis using RLE normalization, which relies on the median-of-ratios method. | Love et al., 2014 [3] |
| edgeR | R Package | Performs differential expression analysis using TMM normalization, which trims extreme log-fold-changes and expression levels. | Robinson et al., 2010 [3] [1] |
| Trinity | Software Suite | Offers a solution for de novo transcriptome assembly from RNA-seq data, crucial when a reference genome is unavailable. | Grabherr et al., 2011 [68] |
| ERCC Spike-In Controls | Synthetic RNA Mix | A set of exogenous synthetic RNAs added to a sample to create a standard baseline for counting and normalization. | External RNA Controls Consortium [69] |
| STAR | Alignment Tool | A fast aligner for RNA-seq data specifically designed to accurately map spliced transcripts. | Dobin et al., 2013 [68] |
| Salmon/Kallisto | Quantification Tool | Use quasi-alignment and machine learning techniques for rapid and accurate transcript-level quantification. | Patro et al., 2017; Bray et al., 2016 [68] |
| ChatGPT/LLMs | Large Language Model | Assists in data augmentation and quality enhancement for tasks like Medical Concept Normalization via few-shot prompting. | Chen et al., 2025 [65] |
| ComBat/Limma | R Packages | Apply empirical Bayes methods to remove batch effects across datasets, a key step in cross-dataset normalization. | Johnson et al., 2007; Ritchie et al., 2015 [1] |
The integration of AI and Machine Learning into RNA-seq normalization represents a significant evolution from assumption-bound statistical methods to adaptive, data-driven computational frameworks. As detailed in these application notes, ML techniques enhance the normalization ecosystem in multiple ways: by improving the quality of foundational data through LLM-assisted augmentation, by providing powerful benchmarks for method selection, and by directly increasing the sensitivity of differential expression analysis through feature-based classification.
Looking forward, the field is poised for deeper integration of AI. Promising directions include the development of end-to-end deep learning models that perform normalization and differential expression analysis in a single, optimized step, and the creation of foundation models for transcriptomics pre-trained on vast public datasets that can be fine-tuned for specific normalization tasks. Furthermore, the principles of data-centric AI—which emphasize systematic data improvement—will become increasingly vital. As one benchmark study concluded, the focus must shift from just developing better models to ensuring high-quality, structured data; without this, even the most powerful AI systems will struggle to generate reliable biological insights [66]. The protocols and tools provided here offer a roadmap for researchers to begin leveraging these powerful approaches today, ultimately enabling more accurate and discovery-rich transcriptomic research.
RNA sequencing (RNA-seq) has become the primary method for transcriptome analysis, but the normalization of the resulting count data is a critical and complex step that significantly influences all downstream analyses [70]. Normalization adjusts raw read counts to account for technical biases such as gene length, library size, and sequencing depth, enabling meaningful biological comparisons [3] [24]. The choice of normalization method is not merely a technical detail; it directly affects the biological interpretation of data, including the identification of differentially expressed genes (DEGs) and the accuracy of predictive models [3] [71] [72]. With numerous available methods and no universal consensus, researchers face the challenge of selecting an appropriate approach for their specific experimental context. This article synthesizes evidence from recent comparative studies to guide researchers, scientists, and drug development professionals in making informed decisions regarding RNA-seq normalization, particularly within exploratory research and drug discovery workflows.
Comparative Performance of Normalization Methods
Key Normalization Methods and Their Characteristics
RNA-seq normalization methods can be broadly categorized into between-sample and within-sample techniques. Between-sample methods, such as TMM and RLE, primarily correct for differences in sequencing depth between samples, while within-sample methods, like TPM and FPKM, also account for gene length, enabling comparisons of expression levels across different genes within the same sample [3] [24]. The table below summarizes the core characteristics of the most commonly used methods.
Table 1: Key RNA-Seq Normalization Methods and Their Properties
| Normalization Method | Category | Key Principle | Commonly Used In |
|---|---|---|---|
| TMM (Trimmed Mean of M-values) | Between-sample | Assumes most genes are not differentially expressed; trims extreme log fold-changes and library sizes to calculate a scaling factor [3]. | edgeR [3] |
| RLE (Relative Log Expression) | Between-sample | Calculates a scaling factor as the median of the ratio of each gene's count to its geometric mean across all samples [3]. | DESeq2 [3] |
| GeTMM (Gene length corrected TMM) | Between-sample & Within-sample | Combines the TMM scaling factor with gene length correction, reconciling both approaches [3]. | - |
| TPM (Transcripts Per Million) | Within-sample | Normalizes for both sequencing depth and gene length, with the sum of all TPM values being one million per sample [3] [73]. | - |
| FPKM (Fragments Per Kilobase Million) | Within-sample | Similar to TPM but differs in the order of normalization operations [3]. | - |
Performance Benchmarks Across Biological Applications
Recent benchmark studies have evaluated these normalization methods in various contexts, from metabolic modeling to differential expression analysis. The performance of a method is highly dependent on the specific downstream application.
Table 2: Comparative Performance of Normalization Methods in Different Applications
| Application Context | Finding | Key Supporting Evidence |
|---|---|---|
| Metabolic Model Reconstruction (iMAT & INIT algorithms) | RLE, TMM, and GeTMM produced models with lower variability and higher accuracy in capturing disease-associated genes compared to TPM and FPKM [3]. | Accuracy for Alzheimer's disease: ~0.80 (RLE/TMM/GeTMM) vs. lower (TPM/FPKM). Covariate adjustment further increased accuracy [3]. |
| Differential Expression Gene (DEG) Identification | Different normalization techniques (TPM, FPKM, DESeq2) generate different lists of DEGs. Taking the intersection of DEGs from multiple methods can identify more robust candidates [72]. | DEG lists from TPM, FPKM, and DESeq2 showed variations, suggesting intersections provide more reliable transcripts for pathway enrichment [72]. |
| Raw Gene Expression Quantification (RGEQ) | In a study evaluating 192 analysis pipelines, the performance of normalization was interdependent with other steps (trimming, alignment, counting). No single normalization method was universally superior [74]. | Pipeline performance was assessed based on accuracy and precision against a set of 107 housekeeping genes and qRT-PCR validation of 32 genes [74]. |
| Preservation of Biological Signal | A large-scale assessment found that TPM increased the proportion of variability attributable to biological sources compared to raw data and other methods, though it increased site-dependent error [73]. | TPM increased biological variability from 41% (raw) to 43% and reduced residual (unexplained) variability from 17% to 12% [73]. |
| Cross-Study Predictions (Machine Learning) | The benefit of normalization and batch effect correction depended on the test dataset. It improved performance when tested on GTEx data but worsened performance on ICGC/GEO datasets [71]. | Classification of tissue of origin was sensitive to preprocessing; results highlight that preprocessing is not always appropriate for cross-study predictions [71]. |
Application Notes and Protocols
Protocol for Benchmarking Normalization Methods
Based on consolidated findings from multiple studies, the following protocol provides a structured approach for evaluating and selecting RNA-seq normalization methods in an exploratory research context.
Title: A Protocol for Evaluating RNA-Seq Normalization Methods in Exploratory Analyses Primary Objective: To systematically assess the impact of different normalization methods on downstream analysis results to inform method selection for a specific dataset. Experimental Design: This protocol uses a standardized data set, such as the Sequencing Quality Control (SEQC) data, to ensure a robust evaluation framework [73].
Step-by-Step Methodology:
Data Preparation and Normalization:
- Obtain the standardized RNA-seq dataset (e.g., SEQC).
- Apply a panel of normalization methods to the raw count data. The panel should include:
- Generate normalized expression matrices for each method.
Global Assessment of Variability (Experiment 1):
- For each normalized dataset, perform an Analysis of Variance (ANOVA) to decompose the total variability into components [73].
- Sources of Variation to Quantify:
- Biology: Variability due to different sample types or conditions.
- Batch/Site: Variability introduced by different sequencing sites or technical batches.
- Residual: Unexplained variability from uncontrollable experimental conditions.
- Checkpoint: A good normalization method should increase the proportion of variability attributable to biology and reduce residual variability. Methods that inflate batch effects or residual noise should be scrutinized [73].
Linearity and Internal Consistency Test (Experiment 2):
- Select a subset of samples (e.g., A and B) and their mixture models (e.g., C=75%A+25%B, D=25%A+75%B) from the same sequencing site.
- Analyze individual genes of biological interest (e.g., TP53, GAPDH) across these samples.
- Plot the expression values of the mixture samples against the pure samples.
- Checkpoint: The mixture samples should lie on a linear fit between the pure samples. A normalization method that breaks this linearity imposes unwanted structure on the data and should be considered suboptimal [73].
Downstream Analysis Validation:
- Perform the core analysis relevant to your research (e.g., differential expression, pathway analysis, or metabolic network mapping) on all normalized datasets.
- Where possible, validate key results using an orthogonal method, such as qRT-PCR, which is considered the gold standard for expression validation [74] [73].
- Checkpoint: Compare the results (e.g., lists of DEGs, predictive accuracy, model content) against the validation data. The intersection of results from multiple normalization methods can indicate more robust findings [72].
A Decision Framework for Method Selection
No single normalization method is optimal for all scenarios. The choice depends on the experimental design, the biological question, and the specific downstream application. The following diagram and guidance provide a strategic framework for selection.
Key Strategic Considerations:
- For Differential Expression Analysis: Between-sample methods like RLE (DESeq2) and TMM (edgeR) are generally recommended, as they are designed to stabilize variance across samples for reliable comparison of expression levels between conditions [3] [24].
- For Metabolic Modeling and Network Analysis: Evidence strongly suggests using between-sample methods (RLE, TMM, GeTMM). They produce more consistent and accurate condition-specific models (e.g., with iMAT and INIT algorithms) with lower false-positive rates [3].
- For Cross-Study and Machine Learning Applications: Proceed with caution. Always test the preprocessed model on a truly independent dataset. Applying batch effect correction and normalization can be beneficial, but it is not universally so and can sometimes reduce performance [71].
- For Comparing Expression Levels Across Different Genes: If the goal is to assess which genes are most highly expressed within a sample, within-sample methods like TPM are required, as they account for gene length [3] [24].
- Addressing Covariates: In datasets with prominent covariates (e.g., age, gender), applying covariate adjustment to the normalized data can improve accuracy and reduce variability in downstream analyses [3].
The Scientist's Toolkit
Essential Research Reagent Solutions
The following table lists key reagents, tools, and resources essential for conducting rigorous RNA-seq normalization studies.
Table 3: Essential Research Reagents and Tools for RNA-Seq Normalization Studies
| Item/Tool | Function/Purpose | Example/Note |
|---|---|---|
| Spike-in Control RNAs | Artificial RNA sequences added to samples in known quantities. Used to monitor technical variability, assess dynamic range, and normalize data [75]. | SIRVs (Spike-in RNA Variant Control Mixes) [75]. |
| Reference RNA Samples | Standardized RNA samples used across experiments and sites to evaluate consistency and performance of the entire RNA-seq workflow [73]. | SEQC consortium samples [73]. |
| qRT-PCR Assays | Gold-standard orthogonal method for validating gene expression levels obtained from RNA-seq. Critical for benchmarking normalization accuracy [74] [73]. | Taqman assays; requires careful selection of stable control genes [74]. |
| Stable Housekeeping Genes | A set of constitutively expressed genes used as internal controls for validation experiments (e.g., qRT-PCR). | Genes like ECHS1, identified via stability algorithms (RefFinder), not traditional genes like GAPDH which can vary [74]. |
| Software & Packages | Implementation of normalization algorithms and statistical analysis. | edgeR (TMM), DESeq2 (RLE), BUSseq (for single-cell data) [3] [76]. |
The evidence from recent comparative studies clearly indicates that the choice of RNA-seq normalization method is a consequential decision that directly impacts biological interpretation. The key takeaways are that between-sample normalization methods (RLE, TMM, GeTMM) generally outperform within-sample methods (TPM, FPKM) for comparative analyses like differential expression and metabolic network mapping, and that method selection should be guided by the specific downstream application. For robust exploratory research and drug discovery, a systematic evaluation of normalization methods using standardized protocols and orthogonal validation is strongly recommended over reliance on a single default method. This evidence-based approach ensures that biological conclusions are built upon a solid computational foundation.
Conclusion
Selecting an appropriate RNA-seq normalization method is not a one-size-fits-all endeavor but a critical, decision-oriented process that directly impacts the validity of exploratory findings. This guide synthesizes that foundational knowledge, methodological comparison, troubleshooting strategies, and validation benchmarks to underscore a central theme: method choice must be driven by the biological question, data characteristics, and intended downstream analysis. For exploratory studies aimed at hypothesis generation, between-sample methods like TMM and RLE generally provide robust foundations, while TPM remains a strong contender for cross-sample comparisons. Future directions point toward more integrated approaches that combine multi-omics data and leverage AI to manage increasing data complexity. Ultimately, a rigorous and informed approach to normalization is indispensable for transforming raw sequencing data into biologically meaningful insights, thereby accelerating discovery in disease mechanisms and therapeutic development.
References
- 1. RNA-Seq Normalization: Methods and Stages [https://bigomics.ch/blog/why-how-normalize-rna-seq-data/]
- 2. Removing technical variability in RNA-seq data using ... [https://pmc.ncbi.nlm.nih.gov/articles/PMC3297825/]
- 3. A benchmark of RNA-seq data normalization methods for ... [https://www.nature.com/articles/s41540-024-00448-z]
- 4. 3. Raw data processing [https://www.sc-best-practices.org/introduction/raw_data_processing.html]
- 5. [Tutorial] Bulk RNA-seq DE analysis [https://informatics.fas.harvard.edu/resources/tutorials/differential-expression-analysis/]
- 6. Rna Composition Bias In Rna-Seq Analysis [https://www.biostars.org/p/83617/]
- 7. Bias in RNA-seq Library Preparation: Current Challenges ... [https://pmc.ncbi.nlm.nih.gov/articles/PMC8079181/]
- 8. Bias detection and correction in RNA-Sequencing data [https://bmcbioinformatics.biomedcentral.com/articles/10.1186/1471-2105-12-290]
- 9. a practical guide to RNA sequencing data analysis [https://pmc.ncbi.nlm.nih.gov/articles/PMC12599993/]
- 10. RNA-Seq workflow: gene-level exploratory analysis and ... [https://pmc.ncbi.nlm.nih.gov/articles/PMC4670015/]
- 11. RNA-seq workflow: gene-level exploratory analysis and ... [https://www.bioconductor.org/help/course-materials/2019/CSAMA/materials/labs/lab-03-rnaseq/rnaseqGene_CSAMA2019.html]
- 12. RNA sequencing data analysis - Counting, normalization ... [https://www.sthda.com/english/wiki/rna-sequencing-data-analysis-counting-normalization-and-differential-expression]
- 13. Exploratory analysis of RNAseq count data [https://tavareshugo.github.io/data-carpentry-rnaseq/02_rnaseq_exploratory.html]
- 14. RNA-seq workflow - gene-level exploratory analysis and ... [https://www.bioconductor.org/help/course-materials/2016/CSAMA/lab-3-rnaseq/rnaseq_gene_CSAMA2016.html]
- 15. A comprehensive workflow for optimizing RNA-seq data analysis [https://bmcgenomics.biomedcentral.com/articles/10.1186/s12864-024-10414-y]
- 16. How to choose Normalization methods (TPM/RPKM/FPKM) ... [https://www.novogene.com/us-en/resources/blog/how-to-choose-normalization-methods-tpm-rpkm-fpkm-for-mrna-expression/]
- 17. Gene expression units explained: RPM, RPKM, FPKM, TPM ... [https://www.reneshbedre.com/blog/expression_units.html]
- 18. RPKM, FPKM and TPM, clearly explained [https://www.rna-seqblog.com/rpkm-fpkm-and-tpm-clearly-explained/]
- 19. Misuse of RPKM or TPM normalization when comparing ... [https://pmc.ncbi.nlm.nih.gov/articles/PMC7373998/]
- 20. TPM, FPKM, or Normalized Counts? A Comparative Study of ... [https://translational-medicine.biomedcentral.com/articles/10.1186/s12967-021-02936-w]
- 21. Transcriptome size matters for single-cell RNA-seq ... [https://pmc.ncbi.nlm.nih.gov/articles/PMC11787294/]
- 22. Chapter 2 Normalization | Basics of Single-Cell Analysis ... [https://bioconductor.org/books/3.13/OSCA.basic/normalization.html]
- 23. Count normalization with DESeq2 | Introduction to DGE [https://hbctraining.github.io/DGE_workshop/lessons/02_DGE_count_normalization.html]
- 24. Selecting between-sample RNA-Seq normalization ... [https://pmc.ncbi.nlm.nih.gov/articles/PMC6171491/]
- 25. Comparison of normalization methods for differential gene ... [https://pmc.ncbi.nlm.nih.gov/articles/PMC3918003/]
- 26. A scaling normalization method for differential expression ... [https://genomebiology.biomedcentral.com/articles/10.1186/gb-2010-11-3-r25]
- 27. Normalisation methods implemented in edgeR [https://davetang.github.io/muse/edger.html]
- 28. How do you generate TMM normalized counts using EdgeR? [https://www.biostars.org/p/9475236/]
- 29. Comparison of TMM (edgeR), RLE (DESeq2), and MRN ... [https://www.rna-seqblog.com/comparison-of-tmm-edger-rle-deseq2-and-mrn-normalization-methods/]
- 30. Comparison of normalization and differential expression ... [https://bmcgenomics.biomedcentral.com/articles/10.1186/s12864-015-2353-z]
- 31. RNA-Seq workflow: gene-level exploratory analysis and ... [https://www.bioconductor.org/help/course-materials/2015/LearnBioconductorFeb2015/B02.1.1_RNASeqLab.html]
- 32. Navigating RNA-Seq Data: A Comprehensive Guide... [https://pluto.bio/resources/Learning%20Series/navigating-rna-seq-data-a-guide-to-normalization-methods]
- 33. RNASeq Data Analysis - CRCD User Manual - Pitt CRC [https://crc-pages.pitt.edu/user-manual/advanced-genomics-support/RNASeq-data-analysis/]
- 34. Reference-based RNA-Seq data analysis [https://training.galaxyproject.org/training-material/topics/transcriptomics/tutorials/ref-based/tutorial.html]
- 35. Disease Biomarker Query from RNA-Seq Data - PMC [https://pmc.ncbi.nlm.nih.gov/articles/PMC4216051/]
- 36. RNA-Seq data processing and gene expression analysis [https://h3abionet.github.io/H3ABionet-SOPs/RNA-Seq]
- 37. Highly effective batch effect correction method for RNA-seq ... [https://pmc.ncbi.nlm.nih.gov/articles/PMC11718288/]
- 38. RNA-seq Pre-processing tutorial [https://sbc.shef.ac.uk/rna-seq-in-galaxy/01-pre-processing.nb.html]
- 39. How assumptions provide the link between raw RNA-Seq ... [https://www.rna-seqblog.com/how-assumptions-provide-the-link-between-raw-rna-seq-read-counts-and-meaningful-measures-of-gene-expression/]
- 40. Normalization Methods for the Analysis of Unbalanced ... [https://www.frontiersin.org/journals/bioengineering-and-biotechnology/articles/10.3389/fbioe.2019.00358/full]
- 41. Tissue-aware RNA-Seq processing and normalization for ... [https://bmcbioinformatics.biomedcentral.com/articles/10.1186/s12859-017-1847-x]
- 42. Sequencing RNA · Pathway Guide Analysis [https://www.pathwaycommons.org/guide/primers/data_analysis/rna_sequencing_analysis/]
- 43. Normalization of gene counts affects principal components ... [https://www.sciencedirect.com/science/article/pii/S1874939924000543]
- 44. Normalization of gene counts affects principal components- ... [https://pubmed.ncbi.nlm.nih.gov/39154857/]
- 45. - Single Sequencing (scRNA- cell ) RNA : A Comparative... Seq Protocols [https://www.bgee.org/support/scRNA-seq-protocols-comparison]
- 46. Performance comparison of high throughput single-cell ... [https://www.sciencedirect.com/science/article/pii/S2405844024132161]
- 47. Systematic comparison of high-throughput single-cell RNA ... [https://bmcgenomics.biomedcentral.com/articles/10.1186/s12864-020-07358-4]
- 48. - RNA : Basic Bioinformatics seq - PMC Analysis [https://pmc.ncbi.nlm.nih.gov/articles/PMC6168365/]
- 49. New Single Methods Guide cell | 2025 - RNA Blog Seq [https://www.rna-seqblog.com/new-single-cell-methods-guide-2025/]
- 50. How to Analyze RNAseq Data for Absolute Beginners 21 [https://ngs101.com/how-to-analyze-rnaseq-data-for-absolute-beginners-21-a-comprehensive-guide-to-batch-effects-covariates-adjustment/]
- 51. Are batch effects still relevant in the age of big data? [https://www.sciencedirect.com/science/article/pii/S0167779922000361]
- 52. RNA sequencing data analysis [https://geneviatechnologies.com/bioinformatics-analyses/rna-seq-data-analysis/]
- 53. Protein-level batch-effect correction enhances robustness ... [https://www.nature.com/articles/s41467-025-64718-y]
- 54. RCANE: a deep learning algorithm for whole-genome pan ... [https://www.nature.com/articles/s42003-025-08712-6]
- 55. An Integrated Approach for RNA-seq Data Normalization - PMC [https://pmc.ncbi.nlm.nih.gov/articles/PMC4924883/]
- 56. GWAS and Integrative - RNA for target... | PLOS One Seq analysis [https://journals.plos.org/plosone/article?id=10.1371/journal.pone.0333179]
- 57. of scRNA-seq and bulk Integrative - Analysis Identifies... RNA seq [https://www.dovepress.com/integrative-analysis-of-scrna-seq-and-bulk-rna-seq-identifies-plasma-c-peer-reviewed-fulltext-article-JHC]
- 58. Integrating mutation, copy number, and gene expression ... [https://www.sciencedirect.com/science/article/pii/S2211124725012264]
- 59. 16 Guidelines for Effective Data Visualizations in ... - Luís Cruz [https://luiscruz.github.io/2021/03/01/effective-visualizations.html]
- 60. Principles of Effective Data Visualization - PMC [https://pmc.ncbi.nlm.nih.gov/articles/PMC7733875/]
- 61. Contrast Checker [https://webaim.org/resources/contrastchecker/]
- 62. A protocol to evaluate RNA sequencing normalization ... [https://pmc.ncbi.nlm.nih.gov/articles/PMC6923842/]
- 63. Systematic identification and validation of the reference genes ... [https://bmcgenomics.biomedcentral.com/articles/10.1186/s12864-019-5661-x]
- 64. Machine learning and related approaches in transcriptomics [https://www.sciencedirect.com/science/article/pii/S0006291X24007617]
- 65. Enhancing data quality in medical concept normalization ... [https://www.sciencedirect.com/science/article/abs/pii/S1532046425000413]
- 66. The Biggest AI Challenge in Biomedical Research [https://www.snapcyte.com/ai-data-bottleneck/]
- 67. RNA-seq assistant: machine learning based methods to ... [https://bmcgenomics.biomedcentral.com/articles/10.1186/s12864-018-4932-2]
- 68. RNA-Seq Data Analysis - PMC - PubMed Central - NIH [https://pmc.ncbi.nlm.nih.gov/articles/PMC12125953/]
- 69. Data normalization for addressing the challenges in the ... [https://bmcgenomics.biomedcentral.com/articles/10.1186/s12864-024-10364-5]
- 70. A Beginner's Guide to Analysis of RNA Sequencing Data [https://pmc.ncbi.nlm.nih.gov/articles/PMC6096346/]
- 71. A comparison of RNA-Seq data preprocessing pipelines for ... [https://bmcbioinformatics.biomedcentral.com/articles/10.1186/s12859-024-05801-x]
- 72. Differentially expressed genes of RNA-seq data are ... [https://www.sciencedirect.com/science/article/pii/S2405580823001991]
- 73. A protocol to evaluate RNA sequencing normalization methods [https://bmcbioinformatics.biomedcentral.com/articles/10.1186/s12859-019-3247-x]
- 74. Systematic comparison and assessment of RNA-seq ... [https://www.nature.com/articles/s41598-020-76881-x]
- 75. RNA-Seq Experimental Design Guide for Drug Discovery [https://www.lexogen.com/blog/planning-for-success-a-strategic-design-guide-for-rna-seq-experiments-in-drug-discovery/]
- 76. Flexible experimental designs for valid single-cell RNA ... [https://www.nature.com/articles/s41467-020-16905-2]