Solving Low RNA-seq Mapping Rates: A Complete Guide for Biomedical Researchers
Low mapping rates in RNA-seq data represent a critical bottleneck that compromises gene expression analysis, biomarker discovery, and therapeutic development.
Solving Low RNA-seq Mapping Rates: A Complete Guide for Biomedical Researchers
Abstract
Low mapping rates in RNA-seq data represent a critical bottleneck that compromises gene expression analysis, biomarker discovery, and therapeutic development. This comprehensive guide addresses the four primary needs of researchers confronting this challenge: understanding fundamental causes, implementing robust methodologies, executing systematic troubleshooting, and validating solutions through comparative analysis. Drawing on current evidence and best practices, we provide actionable strategies for diagnosing and resolving mapping rate issues across diverse sample types and experimental designs, empowering scientists to extract maximum biological insight from their transcriptomic data while maintaining rigorous standards for reproducibility in preclinical and clinical research.
Understanding the Root Causes: Why RNA-seq Mapping Fails
Frequently Asked Questions
Why does ribosomal RNA cause such significant problems in RNA-seq? Ribosomal RNA (rRNA) typically constitutes 80-98% of total RNA in a cell [1]. Even with enrichment techniques, some rRNA persists and sequesters sequencing reads. Furthermore, rRNA genes exist in multiple, nearly identical copies across the genome, causing reads derived from them to map to many locations simultaneously. Most aligners, like STAR with its default settings, will discard reads that map to more than 10 genomic loci, categorizing them as unmapped and leading to low overall mapping rates [2].
My RNA-seq mapping rate is only 40-50%. Is this normal? While mapping rates can vary, 40-50% is considered low and often indicates a specific issue. For a well-annotated model organism, mapping rates should typically be ≥70% and ideally ≥90% [1]. A rate of 40-50% strongly suggests potential problems like high rRNA contamination, RNA degradation, or reference genome issues [3] [1].
How can I tell if my low mapping rate is due to rRNA contamination? You can directly check the aligner's log files for the number of multi-mapping reads [2]. Alternatively, take a subset of your unmapped reads and align them to a dedicated rRNA sequence database (like SILVA) [1]. If a large proportion aligns, rRNA is likely the culprit. Some quantification tools also provide a summary of the percentage of reads classified as rRNA [1].
Troubleshooting Guide: Low Mapping Rates
Problem: High Multi-mapping Due to rRNA Repetitive Nature
- Description: rRNA reads map to dozens of nearly identical genomic locations and are discarded by aligners.
- Solution: Optimize your alignment parameters and analysis strategy.
- Protocol:
- Adjust Aligner Settings: Increase the allowed number of multiple alignments. For example, in STAR, use the
--outFilterMultimapNmaxparameter to raise the limit above the default of 10 [2]. - Utilize Specialized References: If using a transcriptome-based quantifier like Salmon, ensure your reference transcriptome includes rRNA sequences. Otherwise, these reads have nowhere to map [2].
- Post-Mapping Filtering: Align reads to a combined reference of the genome and an rRNA sequence database. Then, use the genome alignment for downstream analysis, having accounted for the rRNA.
- Adjust Aligner Settings: Increase the allowed number of multiple alignments. For example, in STAR, use the
Problem: Inefficient rRNA Depletion
- Description: The wet-lab depletion step failed to remove a sufficient amount of rRNA from the sample.
- Solution: Select and optimize an rRNA depletion method suitable for your organism and sample type.
- Protocol: The following table compares the performance of various commercial depletion kits, as benchmarked in a 2022 study [4].
Table 1: Comparison of Commercial rRNA Depletion Kits for Bacterial mRNA Sequencing
| Kit Name | Depletion Mechanism | Targets | Reported Efficiency |
|---|---|---|---|
| riboPOOLs (RP) | Hybridization & magnetic bead capture | 16S, 23S, 5S rRNA | Similar to former RiboZero; very efficient [4] |
| Self-made Biotinylated Probes (BP) | Hybridization & magnetic bead capture | 16S, 23S, 5S rRNA | Similar to former RiboZero; very efficient; customizable [4] |
| RiboMinus (RM) | Hybridization & magnetic bead capture | 16S, 23S rRNA | Less efficient than RP/BP [4] |
| MICROBExpress (ME) | Hybridization & poly-dT bead capture | 16S, 23S rRNA | Least efficient among tested kits [4] |
| Former RiboZero (RZ) | Hybridization & magnetic bead capture | 16S, 23S, 5S rRNA | Benchmark for high efficiency (discontinued) [4] |
Problem: RNA Degradation
- Description: Degraded RNA produces short fragments that are difficult or impossible to map uniquely to the reference, as they can match many locations. This is often revealed by a high number of reads flagged as "too short" by the aligner [2].
- Solution: Rigorous RNA quality control is essential.
- Protocol:
- Quality Assessment: Always check RNA quality using an instrument like a Bioanalyzer and ensure the RNA Integrity Number (RIN) is high (e.g., >8.0 for sensitive applications) [5].
- Proper Sample Handling: Flash-freeze tissue samples immediately after collection in liquid nitrogen and store at -80°C. Avoid repeated freeze-thaw cycles.
- Read Distribution QC: For whole transcriptome data, use tools like RSeQC to check read distribution across genomic features. A high concentration of reads at the 3' end of transcripts is a clear indicator of degradation [1].
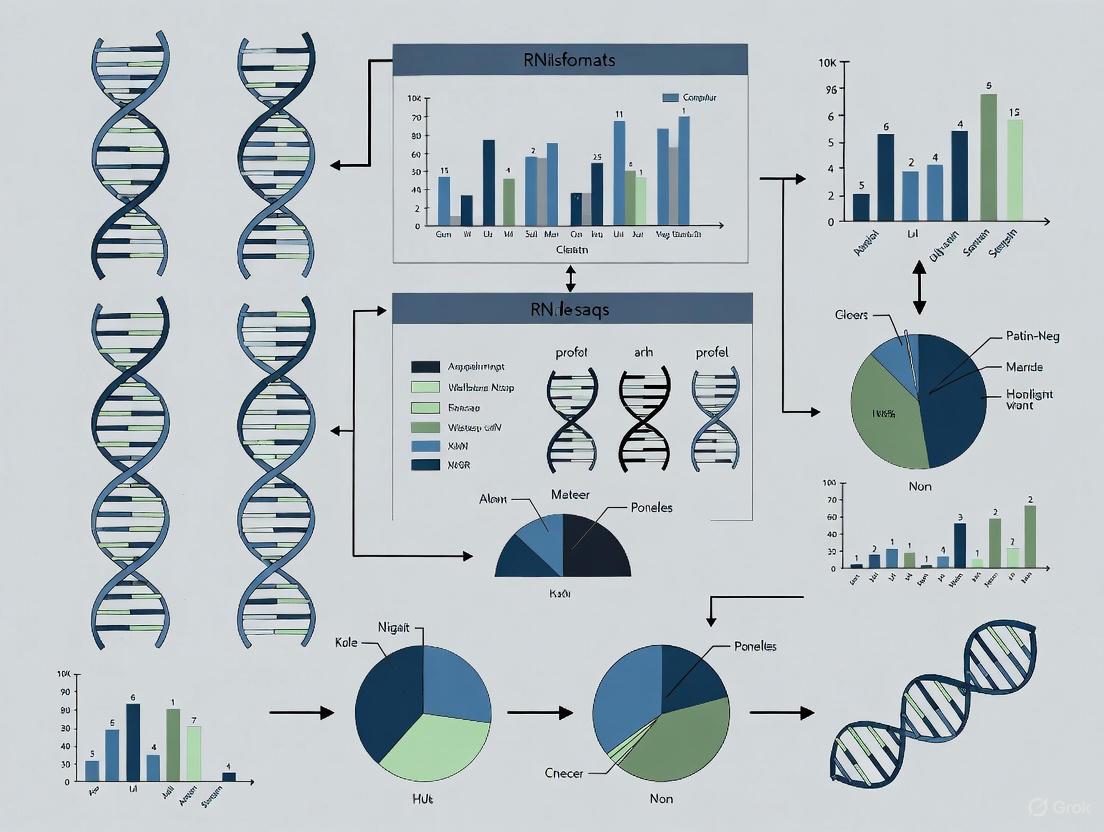
Workflow and Visualization
The following diagram illustrates the central problem of rRNA multimapping and the two main solution pathways.
The Scientist's Toolkit: Key Research Reagents
Table 2: Essential Reagents and Tools for Addressing the rRNA Challenge
| Item Name | Type | Primary Function |
|---|---|---|
| riboPOOLs | Depletion Kit | Species-specific hybridization probes for highly efficient rRNA removal [4]. |
| RiboMinus Kit | Depletion Kit | Pan-prokaryotic probes to deplete rRNA from bacterial samples [4]. |
| SILVA Database | Reference Database | A high-quality, curated database of rRNA sequences used to identify rRNA contamination [1]. |
| ERCC Spike-In Controls | Quality Control | Synthetic RNA transcripts added to the sample to monitor technical variability and quantification accuracy [1]. |
| RSeQC | Software | A Python package to comprehensively evaluate RNA-seq data quality, including read distribution patterns [1]. |
Within the context of RNA-seq research, achieving a high mapping rate—the percentage of sequencing reads that successfully align to the reference genome or transcriptome—is a critical indicator of data quality. Low mapping rates can obscure biological signals and compromise the validity of downstream analyses. A primary source of low mapping rates stems from artifacts introduced during library preparation. This guide addresses common preparation issues, namely adapter contamination, PCR duplicates, and general quality failures, providing researchers with clear troubleshooting pathways to enhance their data quality.
Frequently Asked Questions (FAQs)
1. Why does my total RNA-seq data have a low mapping rate, unlike my poly(A)-enriched data?
Total RNA-seq captures all RNA species, including abundant ribosomal RNA (rRNA). rRNAs have multiple identical copies across the genome, causing many reads to map to several locations (multi-mapping). Standard aligners often discard these multi-mapping reads, drastically reducing the reported mapping rate [2]. In contrast, poly(A) enrichment selects for mRNA, which is less repetitive and therefore results in a higher proportion of uniquely mapping reads.
2. What are adapter dimers, and why are they a problem?
Adapter dimers are short, artifactual sequences formed during library preparation when the 5' and 3' adapters ligate to each other with no insert RNA in between [6]. Due to their small size, they amplify very efficiently during PCR. When sequenced, they produce reads that do not correspond to any biological sample, wasting sequencing capacity and can lead to false negatives for lowly expressed genes [6]. A prominent Bioanalyzer peak around 127 bp often indicates adapter dimer contamination [7].
3. Should I remove duplicate reads from my RNA-seq data?
Yes, with consideration. Duplicate reads, which can arise from PCR over-amplification, may not represent true biological abundance and can bias expression estimates [8]. Their removal has been shown to improve the strength of biological signals in downstream analyses [8]. However, for RNA-seq, it is important to use tools that can differentiate between PCR duplicates (artifacts) and duplicates originating from highly expressed transcripts (biological truth), which is often done based on their unique molecular identifiers (UMIs) or mapping coordinates.
Troubleshooting Guides
Problem 1: Adapter Contamination and Dimers
Observed Symptoms:
- Low mapping rate and high proportion of unmapped reads.
- A sharp peak at ~127 bp (or lower) on a Bioanalyzer or TapeStation trace [7] [9].
- FastQC report shows high levels of adapter sequences.
Root Causes & Solutions:
| Possible Cause | Effect | Suggested Solution |
|---|---|---|
| Low input RNA or degraded RNA [6]. | Insufficient starting material promotes adapter-adapter ligation. | Re-assess RNA quality (RIN > 8) and quantity. Use fluorometric quantification for accuracy [9]. |
| Inefficient ligation or excess of undiluted adapter [7]. | Adapters are more likely to ligate to each other. | Titrate and use a 10-fold dilution of the adapter before the ligation reaction [7]. |
| Inefficient size selection or clean-up after ligation [6]. | Adapter dimers are not removed before PCR. | Perform a double-size selection or a second clean-up with a optimized bead-to-sample ratio (e.g., 0.9X) to remove short fragments [7]. |
Experimental Protocol for Adapter Dimer Cleanup:
- Pre-Sequence Validation: Always run the final library on a Bioanalyzer or similar system to visualize the library profile.
- Post-Ligation Cleanup: If a dimer peak is visible, perform a second round of purification using solid-phase reversible immobilization (SPRI) beads.
- Ratio Optimization: Use a bead-to-sample ratio of 0.9X to 1.0X. This ratio preferentially binds longer fragments, allowing short adapter dimers to be discarded in the supernatant.
- Re-quantify: Re-quantify the library after the additional cleanup to ensure sufficient concentration for sequencing.
Problem 2: High Duplication Rates
Observed Symptoms:
- High percentage of duplicate reads flagged by tools like Picard MarkDuplicates.
- Reduced library complexity, leading to skewed gene expression estimates.
Root Causes & Solutions:
| Possible Cause | Effect | Suggested Solution |
|---|---|---|
| Too many PCR cycles during library amplification [10] [9]. | Preferentially amplifies a subset of fragments, creating artificial duplicates. | Reduce the number of PCR cycles. Use a high-fidelity polymerase suitable for your GC-content [10]. |
| Low input material or degenerated RNA [10]. | Starting with few RNA molecules forces amplification of the same fragments. | Increase RNA input if possible. For very low input, use protocols incorporating UMIs to distinguish technical duplicates from biological duplicates. |
| Insufficient fragmentation [7]. | Longer RNA fragments can reduce library complexity. | Optimize RNA fragmentation time to achieve the desired insert size distribution [7]. |
Diagram: Impact of Data Processing on Biological Signal
Problem 3: General Library Quality Failures
Observed Symptoms:
- Low overall library yield.
- Broad or unexpected fragment size distribution on the Bioanalyzer.
- High rate of reads classified as "too short" by the aligner [2].
Root Causes & Solutions:
| Possible Cause | Effect | Suggested Solution |
|---|---|---|
| Poor input RNA quality (degradation, contaminants) [10] [9]. | Inhibits enzymatic reactions in library prep. | Re-purify RNA. Check 260/230 and 260/280 ratios for purity. Use high-quality RNA extraction kits [10]. |
| Inefficient fragmentation (over or under) [7]. | Leads to incorrect insert sizes and biases. | Calibrate fragmentation conditions (time, temperature) for your sample type. |
| Aggressive purification or size selection [9]. | Significant loss of library molecules. | Optimize bead-based clean-up ratios to avoid over-drying and ensure proper elution. |
Diagram: Library Preparation Quality Control Workflow
The Scientist's Toolkit: Key Research Reagents & Materials
| Reagent / Tool | Function | Example & Notes |
|---|---|---|
| SPRI/AMPure Beads | Purification and size selection of nucleic acids. | Used to remove adapter dimers and select for desired fragment sizes. Critical for clean-up post-ligation and post-PCR [7]. |
| High-Fidelity Polymerase | Amplifies the library during PCR. | Kapa HiFi is noted to perform better than some alternatives for reducing GC-bias [10]. |
| Ribo-depletion Reagents | Removes ribosomal RNA from total RNA. | Crucial for total RNA-seq to deplete abundant rRNA and increase informative mRNA reads. |
| UMIs (Unique Molecular Identifiers) | Tags individual RNA molecules before amplification. | Allows for accurate computational removal of PCR duplicates, preserving true biological variation [8]. |
| Trimming Tools (e.g., Trimmomatic) | Removes adapter sequences and low-quality bases. | Adapter trimming has been shown to directly improve the strength of biological signals in RNA-seq data [8]. |
| Low-Complexity Filter (e.g., RepeatSoaker) | Removes reads from repetitive genomic regions. | Filtering these reads reduces multi-mapping and improves the reliability of downstream enrichment analyses [8]. |
Frequently Asked Questions (FAQs)
What are the main types of sequences missing from the human reference genome?
The missing sequences fall into several key categories, which are summarized in the table below.
| Category of Missing Sequence | Description | Impact on RNA-seq Analysis |
|---|---|---|
| Unclosed Genomic Gaps [11] | Hundreds of unresolved gaps (annotated with 'N's) exist in GRCh38, particularly in complex regions. | Reads originating from these regions cannot map, leading to unmapped reads and potential misassembly. |
| Non-Reference Sequences (NRS) [12] | Sequences present in individual genomes but not in the standard reference, including novel insertions and highly divergent "alternate alleles." | Can cause persistent mapping failures for individuals carrying these sequences, interpreted as low mapping rates. |
| Centromeric and Telomeric Regions [13] | Highly repetitive satellite DNA sequences that were unassembled in GRCh38. The T2T-CHM13 genome has now filled these. | Historically, reads from these regions were unmappable, contributing to low overall mapping rates. |
| Segmental Duplications [13] | Long, nearly identical stretches of DNA that are duplicated. The complete T2T genome has corrected many structural errors in these areas. | Cause high rates of multi-mapping reads, which are often discarded by aligners, lowering unique mapping rates. |
How do incomplete reference genomes directly cause low mapping rates in RNA-seq?
The incompleteness of the reference genome leads to low mapping rates through two primary mechanisms:
- Complete Mapping Failure: RNA-seq reads that originate from genomic sequences completely absent from the reference genome have nowhere to align. These reads are classified as "unmapped," directly reducing the overall mapping rate [11] [12]. One study that identified sequences filling 132 gaps in GRCh38 added 2.2 Mb of novel sequence, illustrating the scale of sequence that was previously missing [11].
- Multi-Mapping and Ambiguity: Complex regions, such as those with segmental duplications or families of highly similar genes (e.g., ribosomal RNA genes), create ambiguity. When a read aligns equally well to multiple locations, aligners like STAR (with default settings) may discard it [2]. This results in a high number of "multi-mapping" reads that do not contribute to the uniquely mapped count, thereby lowering the reported mapping rate.
What is the difference between an updated genome build (like T2T-CHM13) and improved gene annotations (like GENCODE)?
Both are critical for accurate analysis, but they address different layers of the problem.
| Feature | Genome Build (Reference Sequence) | Gene Annotation |
|---|---|---|
| What it is | The actual DNA sequence of the reference genome (e.g., GRCh38, T2T-CHM13). | A set of notes on the genome build that define the coordinates of genes, transcripts, exons, and other functional elements [14]. |
| Primary Function | Serves as the map to which sequencing reads are aligned. | Provides the context for interpreting aligned reads, quantifying expression, and identifying splicing events. |
| Impact of Improvement | Adding missing sequences and correcting errors in the DNA map allows more reads to find their true, unique home [13]. | Providing more precise and complete transcript models improves the accuracy of abundance estimation and reduces mapping ambiguity between overlapping or similar genes [14]. |
| Example | The T2T-CHM13 genome added ~200 million new base pairs, closed all gaps, and corrected thousands of structural errors [13]. | GENCODE releases continually add novel long non-coding RNAs (lncRNAs) and alternative transcripts. Release 31 added 17,858 novel lncRNA transcripts [14]. |
My RNA-seq data has a low mapping rate even after basic QC. What should I investigate next?
If standard quality control (e.g., adapter trimming, quality filtering) does not resolve the issue, you should systematically investigate the following:
- Check for Ribosomal RNA (rRNA) Contamination: Total RNA-seq libraries can contain a high fraction of rRNA reads. These reads map to multiple genomic locations (ribosomal DNA clusters) and are often discarded by aligners, drastically reducing mapping rates [2]. Check your aligner's log for a high number of multi-mapping reads.
- Validate Your Reference Genome and Annotation: Ensure you are using the most recent version of both the genome and gene annotation. For human data, migrating from GRCh38 to the T2T-CHM13 build can resolve mapping issues for reads in previously unresolved regions [15] [13].
- Analyze the Unmapped Reads: A deep dive into the unmapped reads can be highly informative. Try aligning them directly to a database of ribosomal RNA sequences to confirm contamination [2]. Alternatively, assembling them de novo might reveal if they originate from non-reference sequences specific to your study population [12].
- Inspect Alignment Parameters: Review the parameters of your aligner. Tools like STAR have a default threshold for the maximum number of loci a read can map to (
--outFilterMultimapNmax, default is 10). Reads exceeding this are considered unmapped. Adjusting this parameter and using dedicated methods for quantifying multi-mapped reads can provide a more complete picture [2].
Troubleshooting Guide: Low Mapping Rates
Problem: High Number of Unmapped Reads
This issue occurs when a significant portion of RNA-seq reads fails to align to the reference genome.
Step-by-Step Diagnostic Protocol:
Confirm Data Quality:
- Tool: FastQC, MultiQC [16].
- Action: Run FastQC on raw FASTQ files. Examine the "Per base sequence quality" and "Adapter Content" reports. Perform appropriate trimming of adapters and low-quality bases using tools like Trimmomatic or Cutadapt [16]. Re-run FastQC on the trimmed data to confirm improvement.
Quantify Ribosomal RNA Contamination:
- Tool: SortMeRNA, Bowtie2 against an rRNA sequence database.
- Action: Align a subset of your unmapped reads directly to a curated rRNA database. A high percentage of alignment (>5-10%) indicates significant rRNA contamination, suggesting issues with the ribo-depletion step during library preparation [2].
Investigate Non-Reference Sequences:
- Tool: De novo assembler (e.g., SPAdes), BLAST.
- Action: Assemble the unmapped reads into longer contigs. BLAST these contigs against the NT database. If they align to the human genome but not your reference build, they may be Non-Reference Sequences (NRS) or alternate alleles missing from the reference [12].
Upgrade Your Genome Build (The Nuclear Option):
- Action: If the above steps indicate that reads are failing to map due to missing reference sequence, consider re-aligning your data to a more complete genome build. For human studies, the T2T-CHM13 reference is now available and closes the gaps present in GRCh38 [13]. A 2024 study showed that ~39% of genes are impacted in some way by the choice of genome build (hg19, hg38, or CHM13), affecting their quantification [15].
Problem: High Number of Multi-Mapping Reads
This issue arises when reads align to multiple genomic locations with similar quality, causing aligners to discard them.
Step-by-Step Diagnostic Protocol:
Identify the Source of Multi-Mapping:
- Tool: Aligner's log file (e.g., STAR
Log.final.out). - Action: Check the "% of reads mapped to too many loci" in the alignment log. A high percentage points to reads originating from repetitive regions, pseudogenes, or gene families [2].
- Tool: Aligner's log file (e.g., STAR
Evaluate Gene Annotation Complexity:
- Concept: "Mappability" is a metric that calculates the fraction of reads from a transcript that will map uniquely back to it. Complex annotations with many overlapping or highly similar genes have low mappability [14].
- Action: Consider using a filtered gene annotation set that excludes low-mappability transcripts (e.g., pseudogenes) if your research question allows. Studies have shown that reducing annotation complexity improves the performance of differential expression analysis [14].
Adjust Alignment Strategy (With Caution):
- Action: You can increase the aligner's threshold for multi-mapping reads (e.g., STAR's
--outFilterMultimapNmax). However, this does not solve the quantification ambiguity. For more accurate results, use a quantification tool likeSalmonorRSEMthat is designed to probabilistically assign multi-mapping reads to transcripts, rather than simply discarding them [14] [17].
- Action: You can increase the aligner's threshold for multi-mapping reads (e.g., STAR's
The Scientist's Toolkit: Research Reagent Solutions
| Resource Type | Specific Tool / Database | Function in Addressing Reference Limitations |
|---|---|---|
| Reference Genome [15] [13] | GRCh38 (GCF_000001405.26) | Current standard human reference from GRC. Use the "primary assembly" and include alternative haplotypes where relevant. |
| Reference Genome [15] [13] | T2T-CHM13 (GCF_009914755.1) | First complete, gapless human genome. Crucial for mapping in previously unresolved regions like centromeres and segmental duplications. |
| Gene Annotation [14] | GENCODE | Comprehensive gene annotation that includes protein-coding genes, long non-coding RNAs (lncRNAs), pseudogenes, and alternative transcripts. |
| Gene Annotation [14] | RefSeq (Curated Subset) | NCBI's well-annotated reference sequence database. Using a curated subset can reduce complexity and improve mappability. |
| Quality Control Tool [16] | FastQC / MultiQC | Provides initial quality metrics for raw sequencing data (per-base quality, adapter content, GC distribution) across multiple samples. |
| Quality Control Tool [14] [16] | RSeQC / Qualimap | Provides RNA-seq specific metrics after alignment, such as gene body coverage, read distribution, and junction saturation. |
| Alignment & Quantification [14] [15] | STAR + RSEM | A standard, splice-aware aligner (STAR) coupled with a quantification tool (RSEM) that can effectively handle multi-mapping reads. |
| Alignment & Quantification [17] | Salmon | An alignment-free quantification tool that is fast and directly addresses multi-mapping uncertainty using a selective alignment approach. |
Frequently Asked Questions
Q1: What are the primary biological factors that cause low mapping rates in RNA-seq? The main biological factors contributing to low mapping rates are RNA degradation and high transcriptional complexity. RNA degradation occurs when samples are improperly handled or stored, leading to fragmented RNA. Transcriptional complexity includes high proportions of ribosomal RNA (rRNA), multi-mapping reads from repetitive regions, paralogous genes, and complex splice variants that complicate alignment [2] [3] [1].
Q2: How does RNA degradation specifically impact my mapping rates and data quality? Degraded RNA produces short fragments that are difficult to map uniquely to the reference genome. As RNA Integrity Number (RIN) decreases, the percentage of unmappable short reads increases significantly. Furthermore, degradation is often non-uniform, causing uneven transcript coverage and biases in gene expression quantification, which can lead to false conclusions in differential expression analysis [5] [18] [1].
Q3: My RNA samples have low RIN values. Can I still use them for sequencing, and how will this affect my analysis? Samples with RIN values as low as 4.4 can be sequenced, but expect notable impacts. One study found that even slight degradation (RIN ~6.7) caused significant differences in long non-coding RNA (lncRNA) expression profiles. While protein-coding genes showed relative stability, it is recommended to include RIN as a covariate in differential expression analysis to account for degradation-induced bias [5] [18].
Q4: Why does total RNA-seq often have a lower mapping rate compared to poly-A selected RNA-seq? Total RNA contains a high fraction (80-98%) of ribosomal RNA (rRNA). Most RNA-seq protocols use rRNA depletion or poly-A selection to enrich for mRNA. If this enrichment is inefficient, a large proportion of your reads will be ribosomal. rRNA genes are often multi-copy and highly conserved, leading to a massive number of multi-mapping reads that aligners discard by default, drastically reducing reported mapping rates [2] [3] [1].
Troubleshooting Guides
Problem: Low Mapping Rate Due to RNA Degradation
Step 1: Diagnose the Problem
- Assess RNA Integrity: Check the RNA Integrity Number (RIN) using a Bioanalyzer or TapeStation. A RIN value above 8 is typically considered good. Values below 7 indicate significant degradation [5] [18].
- Analyze Read Distribution: Use QC tools like RSeQC or Picard to check the distribution of reads across transcript features. A sharp bias towards the 3' end of transcripts is a classic signature of degradation [16] [1].
Step 2: Wet-Lab Protocol Adjustments
- Optimize Sample Handling: Immediately post-collection, flash-freeze tissue in liquid nitrogen or preserve in RNAlater. Keep samples at temperatures below 4°C if processing within 24 hours [18].
- Use Degradation-Robust Kits: For degraded samples (e.g., FFPE tissues), consider using library preparation kits specifically designed for fragmented RNA, such as those employing random priming for cDNA synthesis [18].
Step 3: Bioinformatics Compensation
- Adjust Alignment Parameters: For slightly degraded data, you may increase the number of allowed multi-mapping reads (
--outFilterMultimapNmaxin STAR) cautiously, as some degraded fragments may map to multiple locations [2]. - Incorporate RIN in Statistical Models: When performing differential expression analysis with degraded samples, include the RIN value as a covariate in your statistical model (e.g., in DESeq2 or edgeR) to correct for systematic bias introduced by degradation [5] [18].
Problem: Low Mapping Rate Due to Transcriptional Complexity
Step 1: Identify the Source of Complexity
- Check rRNA Content: Map your reads to an rRNA database (e.g., SILVA). rRNA content above 5-10% in a poly-A-selected library indicates inefficient depletion [1].
- Check for Multi-mappers: Examine your aligner's log file for the percentage of reads mapped to multiple locations. A high percentage suggests issues with repetitive elements, rRNA, or paralogous genes [2] [3].
Step 2: Address High rRNA Content
- Improve Depletion: Ensure optimal performance of rRNA depletion protocols (e.g., RiboCop) by using recommended input RNA amounts and strictly adhering to incubation times and temperatures [1].
Step 3: Manage Multi-mapping Reads
- Use a Comprehensive Reference: Ensure your reference genome includes all sequence elements, such as ribosomal DNA regions that are sometimes placed on separate contigs. Mapping to a transcriptome instead of a genome can also miss unannotated non-coding RNAs [2] [3].
- Employ Pseudoalignment: For quantification, consider using fast pseudoalignment tools like Salmon or Kallisto. These methods use a transcriptome reference and can account for multi-mapping reads in a statistically rigorous way, often yielding more accurate abundance estimates than simple genome alignment [19].
Table 1: Impact of RNA Degradation on Sequencing Metrics
This table summarizes key findings from controlled studies on RNA degradation, providing a benchmark for evaluating your own data [5] [18].
| RNA Integrity Number (RIN) | Degradation Level | Key Observations and Effects |
|---|---|---|
| ~9.8 | None (Intact) | Ideal sample. High mapping rates, uniform transcript coverage. |
| ~6.7 | Slight | Significant differences in lncRNA expression similarity. Protein-coding genes more stable. |
| ~4.4 | Middle | Increased number of differentially expressed genes. |
| ~2.5 | High | Widespread changes in gene expression profiles. Mapping rates can drop substantially. |
Table 2: Post-Alignment QC Metrics for Troubleshooting
Use this table to diagnose potential issues after read alignment [16] [1].
| QC Metric | Acceptable Range | Cause for Concern & Potential Cause |
|---|---|---|
| Overall Mapping Rate | ≥ 70% - 90% | < 70%: Possible degradation, contamination, or poor reference. |
| rRNA Mapping Rate | < 1% - 5% | > 5%: Inefficient rRNA depletion in total RNA-seq. |
| Exonic Mapping Rate | ~60-80% (varies by prep) | Low rate: High genomic DNA contamination or poor annotation. |
| Reads Mapped to Multiple Loci | Varies by organism | Very high: Abundant repetitive RNA (e.g., rRNA) or poor genome. |
| 3' Bias | Low for WTS | High: Indicator of RNA degradation. |
Experimental Workflow: Studying RNA Degradation
The following diagram illustrates a controlled experimental design used to systematically analyze the effects of RNA degradation on sequencing outcomes, as described in the search results.
Research Reagent Solutions
Table 3: Essential Reagents for RNA Integrity and Mapping Research
| Reagent / Kit | Function in Research | Key Consideration |
|---|---|---|
| RNeasy Fibrous Tissue Mini Kit (Qiagen) | RNA extraction from tough tissues. | Includes DNase treatment to prevent gDNA contamination [18]. |
| SMARTer Stranded Total RNA-Seq Kit v3 (Takara Bio) | Library prep from total RNA, includes rRNA depletion. | Designed for low input (10 ng), suitable for degraded samples [18]. |
| Bioanalyzer RNA 6000 Pico Assay (Agilent) | Microfluidic analysis for RIN and DV200 calculation. | Critical for objectively quantifying RNA integrity before library prep [18]. |
| ERCC & SIRV Spike-In Controls | Artificial RNA mixes added to sample. | Provides a ground-truth for benchmarking quantification accuracy and detecting biases [1] [20]. |
| RiboCop rRNA Depletion Kit | Efficient removal of ribosomal RNA. | Higher specificity reduces sequencing waste on rRNA, improving mapping rates to features of interest [1]. |
Ambiguous reads present a significant challenge in RNA-seq data analysis, often leading to low mapping rates and potentially misleading biological interpretations. These reads, which can map to multiple genomic locations, frequently originate from genes with high sequence similarity, such as pseudogenes and ribosomal RNAs. In the context of a thesis focused on addressing low mapping rates, understanding how different alignment tools manage this ambiguity is fundamental to improving data quality and reproducibility in genomic research.
Frequently Asked Questions (FAQs)
Q1: What are ambiguous reads in RNA-seq alignment? Ambiguous reads are sequencing reads that have multiple, equally likely mapping locations in the reference genome. These often arise from genes with complex structures or high sequence similarity, such as pseudogenes, which can be difficult for aligners to distinguish from their functional gene counterparts [21].
Q2: Why does total RNA-seq typically yield lower mapping rates compared to poly(A)-enriched RNA-seq? Total RNA-seq contains a high fraction of reads from ribosomal RNAs (rRNAs), which are present in multiple copies across the genome. Many reads therefore map to multiple genomic locations and get discarded by the aligner [2]. For example, the STAR aligner with default parameters considers a read unmapped if it maps to more than 10 genomic loci [2]. Poly(A)-enriched RNA-seq, by selectively capturing messenger RNA, reduces this ribosomal RNA burden and thus improves unique mapping rates.
Q3: Which aligners are better at handling multi-mapping reads?
Aligners differ in their strategies. While STAR and HISAT2 have configurable parameters for multi-mapping reads, some studies suggest HISAT2 can sometimes misalign reads to pseudogenes due to their high sequence similarity to functional genes [21]. Tools like RNASequel have been developed as post-processors to systematically correct common alignment artifacts, including those related to ambiguous mappings, by using a more error-tolerant realignment approach [22].
Q4: Can low mapping rates indicate a problem with my reference genome? Yes. If the reference genome assembly is incomplete and missing certain repetitive regions or multiple copies of rRNA genes, reads originating from these sequences will fail to map, resulting in a lower overall mapping rate [2]. It is crucial to map against the whole genome, not just the primary chromosomes.
Troubleshooting Guide: Low Mapping Rates
Problem: High Proportion of Ambiguous/Multi-Mapping Reads
Symptoms: Low unique mapping rate, high percentage of reads marked as "multimapped" in aligner log files. Solutions:
- Adjust Aligner Parameters: Increase the number of allowed multi-mappings (e.g., use the
--outFilterMultimapNmaxoption in STAR) to prevent valid reads from being discarded outright [2]. - Utilize Two-Pass Alignment: Implement a two-pass method where novel splice junctions discovered in a first alignment pass are fed into a second pass. This improves the alignment of reads with low exonic overlaps and can reduce ambiguity [22].
- Employ Specialized Tools: Use software like
RNASequelfor post-alignment processing. It uses an empirically determined fragment size distribution and de novo splice junctions to better resolve ambiguous read pairs [22].
Problem: High Proportion of "Too Short" or Unmapped Reads
Symptoms: A large number of reads are classified as "too short" by the aligner (e.g., in STAR logs) or fail to map entirely [23] [2]. Solutions:
- Perform Adapter Trimming: Sequencer adapters not removed before alignment can cause the aligner to soft-clip the read ends, resulting in segments too short for confident mapping. Always use a quality-trimming and adapter-removal tool prior to alignment [2].
- Check RNA Quality: degraded RNA samples are saturated with short fragments. Verify RNA Integrity Number (RIN) values to ensure sample quality is not the root cause [2].
- Verify Reference Genome: Ensure you are using a comprehensive reference that includes all sequence scaffolds, not just the primary chromosomes, to account for all possible genomic sequences [2].
Experimental Protocols for Improving Alignment
Protocol 1: Two-Pass Alignment with STAR for Novel Junction Discovery
This protocol enhances the detection of spliced alignments, which can help resolve reads that are ambiguous in single-pass modes.
- Genome Indexing: Generate a genome index for STAR using the standard reference genome and annotation file (GTF).
- First Pass Alignment: Run STAR in the first pass mode, which outputs the discovered splice junctions.
- Second Pass Alignment: Run STAR again, incorporating the novel junctions from the first pass (
--sjdbFileChrStartEnd pass1_SJ.out.tab).
Protocol 2: Post-Alignment Realignment with RNASequel
This protocol uses RNASequel to correct alignment artifacts, improving the accuracy of ambiguous read placement [22].
- Initial Alignment: Generate a BAM file using your preferred aligner (e.g., STAR or Tophat2).
- Splice Junction Database Creation:
RNASequelcombines reference annotations and high-confidence novel junctions from the initial aligner to build a comprehensive splice junction index. - Error-Tolerant Realignment: Execute
RNASequelusing the initial BAM file and the splice junction database. It performs a more tolerant realignment, using a scoring system that penalizes gaps, mismatches, and different types of splice junctions to find the most biologically plausible mapping for each read [22].
Table 1: Impact of Difficult Genes (DGs) Across Datasets
This table summarizes the prevalence of difficult-to-map genes, often ambiguous, in various RNA-seq studies [21].
| Dataset ID | Total Genes | Differentially Expressed Genes (DEGs) | DGs as % of All Genes | DGs as % of DEGs |
|---|---|---|---|---|
| GSE41364 | ~20,000 | ~2,500 | ~10% | ~20-25% |
| GSE50760 | ~20,000 | ~2,800 | ~10% | ~20-25% |
| GSE87340 | ~20,000 | ~3,100 | ~10% | ~20-25% |
| GSE22260 | ~15,000 | ~1,200 | ~5-7% | ~20-25% |
| GSE42146 | ~18,000 | ~900 | <5% | ~40% |
Table 2: Key Alignment Parameters for Handling Ambiguity
A comparison of critical parameters in common aligners that influence how ambiguous reads are processed.
| Aligner / Tool | Key Parameter for Ambiguity | Function | Suggested Value |
|---|---|---|---|
| STAR | --outFilterMultimapNmax |
Max number of loci a read can map to. | Increase from default 10 [2] |
| STAR | --winAnchorMultimapNmax |
Max number of multi-mapping loci for one window. | Increase for complex regions |
| RNASequel | Score Difference Threshold | Max score difference for a mapping to be considered. | Default 12 (adjust for sensitivity) [22] |
| HISAT2 | -k |
Number of primary alignments to report. | >1 for multi-mapping analysis |
Workflow Visualization
Diagram 1: Two-Pass Alignment and Realignment Workflow
Diagram 2: How Aligners Classify and Handle Reads
The Scientist's Toolkit: Research Reagent Solutions
Table 3: Essential Computational Tools for Managing Ambiguous Reads
| Item | Function in Analysis | Relevance to Ambiguous Reads |
|---|---|---|
| STAR Aligner | Spliced alignment of RNA-seq reads. | Configurable multi-mapping tolerance helps retain ambiguous reads for further analysis [2]. |
| RNASequel | Post-alignment realignment tool. | Systematically corrects artifacts and uses empirical fragment distribution to resolve ambiguous pairs [22]. |
| BWA-mem | Contiguous read alignment algorithm. | Used within RNASequel for mapping to the reference genome and splice junction indexes [22]. |
| Splice Junction Database | A collection of known and novel splice sites. | Critical for accurate alignment of spliced reads, reducing false ambiguity [22]. |
| Ribosomal RNA (rRNA) Database | A reference sequence of rRNA genes. | Allows pre-filtering of rRNA reads in total RNA-seq, reducing multi-mapping burden [2]. |
Proven Solutions: Optimized Wet-Lab and Computational Workflows
Frequently Asked Questions (FAQs)
What are the primary causes of low mapping rates in RNA-seq experiments?
Low mapping rates, where a high percentage of sequenced reads do not align to the reference genome, are frequently caused by high levels of ribosomal RNA (rRNA) in your sequencing library [2] [24]. Total RNA can consist of 80-98% rRNA [1]. If rRNA is not effectively depleted prior to sequencing, these reads will dominate your data. Since rRNA genes often exist in multiple copies across the genome, many rRNA-derived reads are classified as multi-mapping reads and are discarded by aligners, leading to low unique mapping rates [2] [25]. Other causes include the use of degraded RNA, which produces short fragments that are difficult to map, or contamination with foreign RNA species [1].
How can I confirm that rRNA contamination is causing my low mapping rate?
- Check Aligner Logs: Inspect the output logs from your aligner (e.g., STAR). A very high percentage of reads mapped to multiple loci often points to rRNA [2] [25].
- Align to rRNA Sequences: Directly map your unmapped reads to a database of rRNA sequences (e.g., SILVA) [24] [1]. A high percentage of matches confirms the issue.
- Use Screening Tools: Tools like FastQScreen can determine the composition of your reads across multiple genomes, revealing rRNA contamination [24].
- Analyze Feature Counts: Using a tool like
featureCountswith rRNA annotations can quantify the proportion of your data originating from rRNA [25].
What is the difference between rRNA depletion and poly(A) selection?
These are two principal methods for enriching the informative, non-ribosomal part of the transcriptome.
Poly(A) Selection uses oligo(dT) beads to capture RNA molecules with poly-A tails, which is a feature of mature messenger RNA (mRNA) [26] [1]. This method effectively isolates mRNA but systematically excludes non-coding RNAs (ncRNAs) and pre-mRNA that lack poly-A tails. It is also less suitable for degraded RNA samples because the poly-A tail may be lost [26].
rRNA Depletion uses complementary DNA or RNA probes that hybridize specifically to rRNA molecules. The probe-rRNA hybrids are then removed from the sample enzymatically or via magnetic beads [4] [27]. This method retains all non-ribosomal RNAs, including ncRNAs, and generally performs better with degraded RNA [26].
Are rRNA depletion kits species-specific?
Yes, specificity is critical for high efficiency. rRNA sequences are conserved, but key differences exist across species, phyla, and kingdoms [27]. Using a kit designed for human/mouse/rat on a distantly related species like Drosophila or bacteria will result in poor depletion efficiency [4] [27]. For example, the 28S rRNA in insects is fragmented, requiring specially designed probes for effective removal [27]. Always choose a kit validated for your organism of study.
Troubleshooting Guide: Low Mapping Rates
Step 1: Diagnose the Problem
- Run Quality Control: Use FastQC on your raw FASTQ files. Look for "overrepresented sequences," which may be rRNA [24].
- Check Alignment Statistics: After mapping with STAR or HISAT2, examine the log file. Note the percentages for "Uniquely Mapped," "% of reads mapped to multiple loci," and "% of reads unmapped: too short" [2] [25].
- Quantify rRNA Content: Align your reads to an rRNA sequence database. A well-prepared RNA-seq library should typically have less than 5% rRNA-derived reads [1]. Libraries with significantly higher percentages are considered low-complexity.
Step 2: Address the Issue
If you have not yet sequenced your libraries:
- Choose the Right Depletion Method: Select an rRNA depletion kit specifically designed for your organism. Refer to the comparison table below for guidance.
- Follow Best Practices for RNA Quality: Use high-quality, non-degraded RNA. The RNA Integrity Number (RIN) should be high [1].
If you already have sequenced data with a low mapping rate:
- Bioinformatic Removal: You can identify and filter out reads that align to rRNA sequences from your BAM files before proceeding to quantification. While this doesn't recover the lost sequencing depth, it can clean your data for more accurate downstream analysis [25].
- Re-sequence with Better Prep: If the data is unusable, the most robust solution is to prepare new libraries with a more effective, species-appropriate rRNA depletion method.
Comparison of Commercial rRNA Depletion Kits
The following table summarizes key characteristics of several commercially available rRNA depletion kits, based on independent evaluations and manufacturer information.
| Kit Name | Principle | Recommended Species | Key Features & Performance Notes |
|---|---|---|---|
| Illumina Ribo-Zero Plus [28] | Enzymatic Depletion | Human, Mouse, Rat, Bacteria (Gram- & Gram+) | Depletes cytoplasmic & mitochondrial rRNA and human globin mRNA. A replacement for the discontinued Ribo-Zero Gold. |
| riboPOOLs [4] [27] | Probe Hybridization & Bead Capture | Species-specific & pan-prokaryotic options available | Highly efficient; found to be comparable to the former Ribo-Zero Gold and a valid replacement [4]. Also available for degraded RNA and challenging species like Drosophila [27]. |
| QIAseq FastSelect-rRNA [27] | Probe-based (inhibits rRNA cDNA synthesis) | Fly (Drosophila), and other specific kits | Designed for specific organisms. Works by inhibiting reverse transcription of rRNA. |
| RiboMinus [4] | Probe Hybridization & Bead Capture | Pan-prokaryotic (Bacteria) | Targets 16S and 23S rRNA but not 5S rRNA. Efficiency was lower than riboPOOLs and self-made methods in one study [4]. |
| MICROBExpress [4] | Probe Hybridization & Bead Capture | Pan-prokaryotic (Bacteria) | Targets 16S and 23S rRNA; lower depletion efficiency compared to other kits in a comparative study [4]. |
| In-house Biotinylated Probes [4] [27] | Probe Hybridization & Bead Capture | Fully customizable for any species | Following the principle of the original RiboZero patent, this method allows for highly specific, cost-effective depletion of rRNA and even tRNA. Performance is comparable to top commercial kits [4]. |
Experimental Protocol: Evaluating rRNA Depletion Efficiency
This protocol outlines how to compare the performance of different rRNA depletion methods for a bacterial sample, as described in a published comparative study [4].
RNA Extraction and Quality Control
- Isolate Total RNA: Using a standard Trizol-based protocol or a commercial kit, isolate total RNA from your bacterial culture (e.g., harvested at OD₆₀₀ = 0.6) [4].
- DNA Digestion: Treat the RNA with Turbo DNase to remove genomic DNA contamination. Verify complete DNA removal via PCR using primers for a housekeeping gene [4].
- Quality Assessment: Check RNA integrity and concentration using an Agilent Bioanalyzer and a fluorometer (e.g., Qubit) [4].
rRNA Depletion
- Divide the high-quality total RNA into aliquots for each depletion method you are testing (e.g., riboPOOLs, RiboMinus, in-house probes).
- Perform the depletion procedure exactly as described in each kit's protocol.
- For a self-made method, design biotinylated DNA oligonucleotides that are antisense to the full-length 5S, 16S, and 23S rRNAs of your target species. Hybridize these to the total RNA and capture the hybrids with streptavidin-coated magnetic beads for removal [4].
Library Preparation and Sequencing
- Convert the rRNA-depleted RNA into sequencing libraries using a stranded RNA library preparation kit.
- Sequence the libraries on an Illumina platform to a sufficient depth (e.g., 20 million reads per library) to allow for robust statistical comparison.
Data Analysis for Depletion Efficiency
- Map Reads to Reference Genome: Align the sequenced reads to the host organism's reference genome using a splice-aware aligner like STAR [29].
- Calculate Mapping Statistics: Determine the percentage of reads that uniquely map to the genome.
- Quantify rRNA Reads: Use
featureCountsor a similar tool with a GTF file containing rRNA annotations to calculate the percentage of total reads that map to rRNA genes [25]. The formula for depletion efficiency is: ( \text{rRNA percentage} = \frac{\text{Number of reads mapping to rRNA}}{\text{Total number of mapped reads}} \times 100 ) A lower rRNA percentage indicates higher depletion efficiency.
Workflow: Troubleshooting Low Mapping Rates in RNA-seq
Research Reagent Solutions
| Item | Function in rRNA Depletion |
|---|---|
| Biotinylated DNA Oligos | Single-stranded DNA probes complementary to species-specific rRNA sequences. Hybridize to target rRNA for capture and removal [4] [27]. |
| Streptavidin Magnetic Beads | Bind with high affinity to biotinylated oligo-rRNA hybrids. Enable physical separation of rRNA from the desired RNA pool [4] [27]. |
| RNase H | An enzyme that specifically degrades the RNA strand in an RNA-DNA hybrid. Used in enzymatic depletion methods to destroy rRNA after hybridization with DNA probes [27]. |
| rRNA Depletion Kits | Commercial packages containing optimized probes, enzymes, and beads for specific organisms. Provide standardized protocols for consistent results [4] [28]. |
| Spike-in RNA Controls (e.g., SIRVs, ERCC) | Artificial RNA sequences added to the sample in known quantities. Used to benchmark the accuracy and sensitivity of the entire RNA-seq workflow, including depletion [1]. |
Inefficient library preparation is a primary source of biases that directly compromise the quality of RNA-seq data, often manifesting as low mapping rates. A low mapping rate indicates that a large portion of your sequenced reads could not be aligned to the reference genome, reducing the effective depth of your experiment and potentially introducing inaccuracies in gene expression quantification. This guide details common pitfalls in library prep, explains their impact on your data, and provides actionable solutions to mitigate them, ensuring you get the most out of your sequencing effort.
FAQs and Troubleshooting Guides
Biases can be introduced at nearly every stage of library preparation, from sample preservation to PCR amplification. The table below summarizes the primary sources and their effects on data quality [10].
| Bias Source | Description | Impact on Data |
|---|---|---|
| RNA Degradation | Fragmentation of RNA in poorly preserved samples (e.g., FFPE tissues) [10]. | Leads to an overabundance of short fragments, many of which are unmappable, reducing mapping rates [2]. |
| rRNA Contamination | Inefficient removal of abundant ribosomal RNA (rRNA). | The majority of sequences are ribosomal, starving other transcripts of sequencing depth and lowering the mapping rate to the target transcriptome [2] [30]. |
| Primer Bias | Non-random binding of random hexamers during reverse transcription [10]. | Results in uneven coverage across transcripts, skewing expression measurements. |
| GC Bias | Under-representation of transcripts with very high or very low GC content [31]. | Creates gaps in transcriptome coverage and affects expression quantification for GC-rich/poor genes. |
| PCR Amplification Bias | Preferential amplification of certain cDNA fragments during library amplification [10] [31]. | Leads to over-representation of some transcripts, inaccurate expression levels, and high duplicate read rates. |
| Adapter Ligation Bias | Substrate preference of ligase enzymes for certain sequences [10]. | Can cause certain fragments to be under-represented in the final library. |
Why is my mapping rate low, and how can I improve it?
A low mapping rate is a common symptom of issues originating in library prep. Here is a troubleshooting guide to diagnose and fix the problem.
| Symptom | Possible Cause | Solution |
|---|---|---|
| High percentage of reads unmapped | Ribosomal RNA Contamination: rRNA was not sufficiently depleted. | For non-polyA targets (e.g., bacterial RNA, lncRNA), use rRNA depletion (e.g., RiboGone, Ribo-Zero) instead of poly-A selection [32] [30]. Verify depletion efficiency with a Bioanalyzer. |
| High percentage of reads unmapped | DNA Contamination: Genomic DNA is present in the RNA sample. | Treat RNA samples with DNase I during purification [30]. |
| High percentage of reads unmapped | Sample Degradation: Input RNA is fragmented (low RIN). | Use a random-primed library prep kit (e.g., SMARTer Stranded RNA-Seq Kit) designed for degraded samples like those from FFPE [10] [30]. Increase RNA input if possible [10]. |
| Many "too short" alignments | Highly Degraded RNA: RNA has fragmented into very short pieces. | Use a library protocol validated for low-quality RNA (RIN 2-3) and ensure input RNA size distribution peaks around 200nt [30]. |
| High duplication rates | PCR Amplification Bias: A few molecules were over-amplified. | Reduce PCR cycles. Incorporate Unique Molecular Identifiers (UMIs) to bioinformatically distinguish technical duplicates from biological duplicates [32] [31]. For sufficient input, use PCR-free library workflows [31]. |
| Uneven gene body coverage | Primer Bias from Random Hexamers: Non-uniform reverse transcription. | For new methods, consider protocols that ligate adapters directly to RNA, bypassing hexamer priming [10]. Bioinformatic tools can partially correct this post-sequencing [10]. |
| Low coverage in GC-extreme regions | GC Bias: Poor amplification of GC-rich or AT-rich transcripts. | Use a high-fidelity PCR polymerase (e.g., Kapa HiFi) that performs better with extreme GC content. Add PCR additives like betaine (TMAC) to equalize amplification [10]. |
How do I handle low-input or single-cell RNA-seq samples without introducing bias?
Low-input protocols are inherently more sensitive to bias due to the need for significant amplification.
- Use Template-Switching Protocols: Kits like the SMART-Seq v4 Ultra Low Input RNA Kit use template-switching technology to more faithfully amplify full-length cDNA from minute amounts of RNA, improving coverage of GC-rich transcripts and increasing the number of detected genes compared to earlier methods [30].
- Always Incorporate UMIs: When working with low inputs or aiming for deep sequencing (>50 million reads/sample), UMIs are essential. They allow for accurate deduplication, correcting for both PCR bias and amplification noise, leading to more precise transcript counts [32].
The Scientist's Toolkit: Research Reagent Solutions
Selecting the right reagents is critical for success. The following table lists key solutions for mitigating bias.
| Item | Function | Application Note |
|---|---|---|
| RiboGone Kit | Depletes ribosomal RNA from mammalian total RNA samples. | Recommended for 10–100 ng samples of mammalian total RNA prior to random-primed library prep [30]. |
| SMART-Seq v4 Ultra Low Input RNA Kit | Provides full-length cDNA synthesis and amplification from ultra-low input (1-1,000 cells) or high-quality total RNA (RIN ≥8) using oligo(dT) priming and template-switching [30]. | Delivers improved data for GC-rich transcripts and higher gene detection compared to previous generations [30]. |
| SMARTer Stranded Total RNA Sample Prep Kit | Performs rRNA depletion and strand-specific library construction in a single kit for high-input (100 ng–1 µg) mammalian RNA. | Ideal for maintaining strand information and working with both high- and low-quality total RNA samples [30]. |
| DNase I (RNase-free) | Degrades contaminating genomic DNA during RNA purification. | A critical step in RNA cleanup to prevent non-target sequencing and improve mapping rates [30]. |
| ERCC Spike-In Mix | A set of 92 synthetic RNA controls of known concentration. | Added to samples before library prep to help standardize RNA quantification, determine the sensitivity, and assess the technical performance of the experiment [32]. |
| Unique Molecular Identifiers (UMIs) | Short random barcodes added to each original cDNA molecule before amplification. | Allows for bioinformatic correction of PCR duplication bias and is strongly recommended for low-input and deep-sequencing projects [32] [31]. |
| High-Fidelity PCR Polymerase | Enzymes like Kapa HiFi reduce amplification bias. | Preferable over standard polymerases for more uniform coverage across fragments with varying GC content [10] [31]. |
Workflow and Strategy Diagrams
Diagram 1: Strategic Path to High Mapping Rates
This workflow outlines the key decision points during sample and library preparation to minimize bias and ensure high mapping rates.
Diagram 2: Library Prep Bias and Mitigation Pathways
This diagram maps the relationship between common library preparation steps, the biases they introduce, and the corresponding solutions.
Frequently Asked Questions (FAQs)
What does a "low mapping rate" mean and why should I be concerned?
A low mapping rate indicates that a large percentage of your RNA-seq reads could not be successfully aligned to the reference genome or transcriptome. While rates can vary by experiment, mapping rates consistently below 70-80% for polyA-selected libraries often signal underlying issues that can compromise your downstream analysis [3]. This represents a significant loss of data and can introduce biases in gene expression quantification, potentially leading to inaccurate biological conclusions.
I'm getting mapping rates of 40-60% with Salmon. Is this normal?
Mapping rates of 40-60% with Salmon are not typical for high-quality polyA-enriched RNA-seq data and warrant investigation [23]. One user reported a 40.8% mapping rate with Salmon where over 116 million mappings were discarded due to alignment score issues [23]. Another study observed rates between 50-65% with similar alignment score discards [17]. While pseudoaligners like Salmon may sometimes report lower mapping rates than traditional aligners, rates below 60% often indicate technical issues that should be addressed.
Why does my total RNA-seq data have lower mapping rates than polyA-selected data?
Total RNA-seq typically contains a high fraction of ribosomal RNA (rRNA) reads, which often map to multiple genomic locations and may be discarded by aligners [2]. One study noted that if ribo-depletion is inefficient, rRNA can account for a substantial portion of your data [2]. Additionally, the reference genome may not include all rRNA sequences (e.g., Rn45s in mouse), or these sequences may be present in multiple copies, causing reads to map to too many locations and be filtered out [2].
How do I know if my low mapping rate is caused by contamination or technical issues?
Check your alignment logs for clues. Most tools provide detailed statistics. In Salmon, look for entries like "Number of mappings discarded because of alignment score" or "Number of fragments discarded because they have only dovetail mappings" [17] [23]. High numbers in these categories suggest potential contamination or library preparation issues. You can also align a subset of unmapped reads to contaminant databases (rRNA, mitochondrial DNA, E. coli, etc.) to identify specific contamination sources.
Troubleshooting Low Mapping Rates
Systematic Diagnostic Approach
Follow this logical workflow to identify and address the causes of low mapping rates in your RNA-seq data:
Common Causes and Solutions
rRNA Contamination
Problem: Ribosomal RNA can constitute 30-70% of total RNA-seq data, consuming mapping bandwidth and reducing reported rates [2].
Solutions:
- For future experiments: Use ribodepletion kits instead of or in addition to polyA selection
- For existing data: Identify rRNA content by aligning unmapped reads to rRNA databases
- Consider computational removal of rRNA reads if contamination is moderate
Library Preparation and Quality Issues
Problem: Library construction artifacts including adapter contamination, PCR duplicates, or degraded RNA can significantly impact mappability.
Solutions:
- Use quality trimming tools (Trimmomatic, Cutadapt) to remove adapter sequences
- Check RNA integrity numbers (RIN) before library prep - values <8 may indicate degradation
- Verify library type specification in your aligner (e.g., ISR vs IU in Salmon) [17]
Reference Genome/Transcriptome Issues
Problem: Incomplete or poorly annotated references missing transcripts, isoforms, or genetic variants present in your samples.
Solutions:
- Ensure you're using the most current genome assembly and annotation for your species
- For Salmon, consider using a decoy-aware index that includes both transcriptome and genome [33]
- For genetically diverse samples, consider building a sample-specific reference
Suboptimal Alignment Parameters
Problem: Default parameters may be too stringent for your data type or quality.
Solutions:
- For STAR: Increase
--outFilterMultimapNmaxto allow more multi-mapping reads [2] - For Salmon: Adjust
--minScoreFraction(default 0.65) or--consensusSlack(default 0.35) when using--validateMappings[23] - For HISAT2: Use
--pen-noncansplicefor better novel splice junction detection
Tool Comparison and Selection Guide
Performance Characteristics Across Tools
Table 1: Comparison of RNA-seq Alignment and Quantification Tools
| Tool | Algorithm Type | Best Application | Mapping Rate | Speed/Memory | Key Strengths |
|---|---|---|---|---|---|
| STAR | Spliced aligner [34] | Variant detection, novel isoform discovery [34] | 92.4-99.5% [35] | High memory usage [34] | Base-level precision, splice junction detection [34] |
| HISAT2 | Graph-based aligner [35] | Standard gene expression, polymorphism-rich samples [35] | High (comparable to STAR) [35] | Moderate resource usage [36] | Efficient handling of genetic variants [35] |
| Salmon | Quasi-mapping/selective alignment [34] | Transcript quantification, large-scale studies [34] | Variable (40-90%) [17] [23] | Fast, low memory [34] | Speed, transcript-level quantification [34] |
| Kallisto | Pseudoalignment [34] | Transcript quantification, quick analysis [34] | High [35] | Very fast, low memory [34] | Extreme speed, simple workflow [34] |
Tool Selection Guidelines
Choose your alignment strategy based on your research goals:
For comprehensive transcriptome characterization (including novel isoforms, splice junctions, or genetic variants): Use STAR or HISAT2 for alignment followed by quantification with featureCounts or HTSeq [36] [37].
For differential expression analysis of known genes with maximum speed and efficiency: Use Salmon or Kallisto for direct quantification [34].
For data with high genetic diversity or when working with non-model organisms: HISAT2's graph-based approach may handle variations better [35].
When computational resources are limited: Salmon and Kallisto provide excellent performance on standard workstations [34].
Experimental Protocol for Mapping Rate Optimization
Step-by-Step Diagnostic Protocol
When facing low mapping rates, this comprehensive protocol will help identify and resolve the issue:
Initial Quality Assessment
- Run FastQC on raw reads to assess per-base quality, adapter contamination, and sequence bias
- Check for unusual nucleotide distributions in the first 12-15 bases (common with random primers) [17]
Contamination Screening
- Align a subset of reads (10,000-50,000) to rRNA sequences:
bowtie2 -x rRNA_index -U sample.fq --un clean.fq - Calculate percentage of rRNA reads: >10% suggests significant contamination
- Align a subset of reads (10,000-50,000) to rRNA sequences:
Reference Preparation
- For genome aligners: Download current genome assembly and GTF annotation
- For transcriptome aligners: Prepare comprehensive transcriptome including all isoforms
- For Salmon: Consider creating a decoy-aware index [33]
Parameter Optimization
- Start with default parameters for your aligner
- If mapping rate is low, adjust key parameters (see Table 2)
- Iteratively refine based on results
Key Parameters for Mapping Rate Optimization
Table 2: Critical Parameters for Improving Mapping Rates
| Tool | Parameter | Default | Optimization Suggestion | Trade-offs |
|---|---|---|---|---|
| STAR | --outFilterMultimapNmax |
10 | Increase to 50-100 for complex genomes [2] | Increased multi-mapping reads |
| STAR | --outFilterScoreMinOverLread |
0.66 | Reduce to 0.5 for lower quality data | Potential false alignments |
| Salmon | --minScoreFraction |
0.65 (with validateMappings) | Reduce to 0.5-0.6 [23] | Less stringent alignment filtering |
| Salmon | --consensusSlack |
0.35 (with validateMappings) | Increase to 0.5 [23] | More liberal consensus finding |
| HISAT2 | --pen-noncansplice |
0 (disabled) | Set to 12 for better novel splice detection | Increased computational time |
| All | Read trimming | None | Trim adapters, low-quality bases | Data loss but improved specificity |
Research Reagent Solutions
Table 3: Essential Reagents and Resources for RNA-seq Quality Control
| Reagent/Resource | Function | Usage Notes |
|---|---|---|
| Ribo-depletion kits | Deplete ribosomal RNA from total RNA | Critical for total RNA-seq; more effective than polyA alone for degraded samples |
| RNA Integrity Number (RIN) | Measure RNA quality | Require RIN >8 for optimal results; values <7 problematic |
| ERCC RNA Spike-In Mixes | Technical controls for quantification | Add to samples before library prep to monitor technical performance [38] |
| Adapter Trimming Tools (Trimmomatic, Cutadapt) | Remove adapter sequences | Essential for short inserts and degraded RNA |
| rRNA Sequence Databases (Silva, Rfam) | Identify rRNA contamination | Use to quantify and remove ribosomal reads |
| Decoy Sequences | Improve quantification accuracy | Include with transcriptome for Salmon to "capture" non-transcriptomic reads [33] |
Why is my RNA-seq mapping rate low, and how can reference preparation help?
A low mapping rate, where a surprisingly small percentage of your RNA-seq reads successfully align to the reference, is a common but solvable problem. The root cause often lies in a mismatch between your sequencing library and the reference you are using. Proper preparation of your reference file, including the strategic use of decoy sequences, is a critical step to mitigate this issue.
The table below outlines the primary culprits of low mapping rates and how reference preparation addresses them.
| Cause of Low Mapping Rate | Description | How Reference Preparation Helps |
|---|---|---|
| Ribosomal RNA (rRNA) Contamination [2] [25] | Total RNA-seq libraries can contain a high fraction of ribosomal RNAs. If the reference does not contain all rRNA sequences, these reads will remain unmapped. | Ensure the reference includes comprehensive rRNA sequences, often found in contigs not placed on primary chromosomes [2]. |
| Sequence Ambiguity [2] | Abundant RNAs like rRNAs and tRNAs have multiple copies across the genome. Reads from these regions map to many locations and are often discarded by aligners. | A decoy database allows these multi-mapping reads to be assigned correctly, improving quantification accuracy. |
| Incomplete Reference [2] | If the reference genome or transcriptome is missing sequences (e.g., unplaced scaffolds, novel transcripts), reads from these regions cannot map. | Use the most comprehensive genome assembly available, including all scaffolds, not just primary chromosomes [2]. |
| Presence of Contaminants [39] | The sample or library may be contaminated with DNA or RNA from other organisms (e.g., bacteria, vectors). | Include common contaminant sequences (e.g., from the GPM CRP database) in your reference to identify and filter these reads [40]. |
What is a decoy sequence, and why is it mandatory for accurate RNA-seq quantification?
In RNA-seq, many reads originate from repetitive regions, such as ribosomal RNA genes. Standard aligners often discard reads that map to multiple locations because they cannot uniquely assign them. A decoy sequence is a separate set of sequences (like the entire genome) added to your transcriptome reference. Its purpose is to "catch" these multi-mapping reads.
The decoy provides a more realistic set of potential origins for a read. During quantification, tools like Salmon can use this information to probabilistically assign multi-mapping reads to the most likely transcript of origin, rather than discarding them entirely. This process significantly increases the effective mapping rate and improves the accuracy of expression estimates [2] [40].
How do I build a comprehensive reference transcriptome with decoys?
The following protocol describes a standard method for creating a decoy-aware reference for an organism with a sequenced genome.
Detailed Protocol: Constructing a Decoy-Aware Reference
Step 1: Gather Target Transcriptome and Genome Sequences
- Download the canonical transcript sequences for your organism in FASTA format from a source like Ensembl or RefSeq. This is your "target" transcriptome.
- Download the corresponding primary genome assembly in FASTA format. This will be used to build the decoy.
Step 2: Generate the Decoy Database
- Use a specialized tool to process the genome into a decoy. The
DecoyDatabasetool from OpenMS is one such option [40]. - Command Example:
-in: Your genome FASTA file.-out: The output decoy FASTA file.-decoy_string: A string prefixed or appended to decoy sequence identifiers (e.g.,DECOY_).-method: Typicallyreverse(reversing the sequence) orshuffle.
Step 3: Combine Target and Decoy Sequences
- Concatenate the target transcriptome and the decoy genome into a single FASTA file to create the final reference.
- Command Example:
This workflow creates the combined reference file needed for accurate quantification with tools like Salmon or HISAT2.
What annotations are critical for a reference, and how do I add them?
A reference sequence alone is not enough. Annotation files (GTF or GFF) provide the genomic coordinates of features like genes, exons, transcripts, and their strand information. This is essential for aligning reads across splice junctions and for accurate read counting.
Detailed Protocol: Adding Annotations to Your Analysis
Step 1: Obtain an Annotation File
- Download a comprehensive annotation file (GTF format) from the same source as your genome (e.g., Ensembl, GENCODE). Ensure the version matches your genome assembly.
Step 2: Integrate Annotations with Your Reference
- The method depends on your alignment and quantification tools.
- For Pseudoaligners (Salmon): The annotation is used to generate the transcriptome FASTA file. You can create a TxDb object from the GTF file using R/Bioconductor to easily extract transcript sequences [41].
- R Code Example:
- For Splice-Aware Aligners (STAR): The annotation is used during the genome indexing step to inform the aligner about known splice junctions.
- STAR Command Example:
How do I diagnose the cause of a low mapping rate?
When faced with a low mapping rate, follow this troubleshooting workflow to identify the cause. The diagram below outlines a logical diagnostic path.
Research Reagent Solutions
The following table lists essential materials and tools for preparing a high-quality reference for RNA-seq analysis.
| Item | Function | Example or Source |
|---|---|---|
| Genome Assembly FASTA | The core reference sequence for the organism. | ENSEMBL, RefSeq, UCSC Genome Browser |
| Annotation File (GTF/GFF) | Provides gene model coordinates, crucial for splice-aware alignment. | ENSEMBL, GENCODE (for human/mouse) |
| Decoy Database | A sequence set to correctly assign multi-mapping reads, improving quantification. | Generated from genome using DecoyDatabase [40] or salmon index |
| Contaminant Database | A FASTA file of common contaminants (e.g., rRNA, vectors, lab organisms) to identify and filter non-target reads. | The GPM CRP Database [40] |
| Alignment & Quantification Software | Tools that utilize the decoy-aware reference for accurate mapping and expression estimation. | Salmon, STAR, HISAT2 |
| Quality Control Tools | Software to assess raw read quality and mapping results. | FastQC, Falco, MultiQC, RSeQC [42] [43] |
In RNA-seq research, the reliability of biological conclusions is directly dependent on the quality of the underlying data. Quality control (QC) is not merely a technical formality but a foundational process that ensures the accuracy of biological interpretations [16]. Within this framework, a low mapping rate—the percentage of sequencing reads that successfully align to a reference genome or transcriptome—serves as a critical red flag. It indicates potential issues that can compromise all downstream analyses, from differential expression to biomarker discovery [16] [1]. This guide provides a multi-level validation strategy to troubleshoot and resolve the root causes of low mapping rates, ensuring the integrity of your RNA-seq research.
Understanding and Diagnosing a Low Mapping Rate
What is a Low Mapping Rate?
The mapping rate is a key QC metric reported by alignment tools like STAR. It represents the proportion of sequenced reads that find a unique, confident location in the reference genome. While acceptable rates can vary by organism and protocol, for a well-annotated model organism, an alignment rate below 70-80% is often a cause for concern, and rates below 70% strongly indicate poor quality [16] [1].
A Structured Diagnostic Workflow
Use the following logical workflow to systematically investigate the cause of a low mapping rate in your data. The diagram below outlines the key questions to ask and the potential culprits they reveal.
Interpreting Alignment Logs and Key QC Metrics
The first step in diagnosis is to examine the output log from your aligner. The following table summarizes critical metrics to check, based on the diagnostic workflow above.
Table: Key Alignment Metrics for Diagnosing Low Mapping Rates
| Metric | What It Indicates | Common Thresholds for Concern | Potential Root Cause |
|---|---|---|---|
| % Uniquely Mapped Reads | Success of alignment | < 70% [16] [1] | Various (see below) |
| % Mapped to Multiple Loci | Reads with multiple genomic matches | Significantly > 10-20% [2] [25] | Ribosomal RNA contamination; repetitive genomic regions [2] [25]. |
| % Unmapped: Too Short | Reads too short for confident alignment | > 1-2% | RNA degradation or over-trimming during preprocessing [2]. |
| % Unmapped: Other | Other alignment failures | > 1% | Incorrect reference genome, contamination from other species, or poor sequence quality [1]. |
| % rRNA Reads | Level of ribosomal RNA | > 5% for poly(A)-enriched; > single digits for rRNA-depleted [1] | Inefficient rRNA depletion or low input RNA leading to low library complexity [44] [1]. |
Troubleshooting Guide: FAQs and Solutions
FAQ 1: Why do I have a very high percentage of reads mapped to multiple loci?
- Problem: This is a classic signature of ribosomal RNA (rRNA) contamination [2] [25]. Ribosomal RNAs are present in multiple copies across the genome, so reads derived from them map to many locations and are often discarded by the aligner as multi-mapping.
- Solution:
- Confirm rRNA Levels: Use tools like
featureCountsorRSeQCto quantify the percentage of reads mapping to rRNA genes. In one reported case, this was as high as 90% [25]. - Wet-Lab Optimization: Ensure your RNA extraction and library preparation protocols are optimized. For low-input samples, use purification methods that maximize yield and integrity [45] [46]. If using poly(A) selection, verify its efficiency. For total RNA-seq, ensure rRNA depletion is effective.
- In-Silico Filtration: As a last resort for salvaging data, you can bioinformatically remove reads that map to rRNA sequences before re-running the alignment and quantification. Be aware this reduces your total read count.
- Confirm rRNA Levels: Use tools like
FAQ 2: Why are many of my reads being classified as "too short" to map?
- Problem: This typically points to one of two issues: fragmented, degraded RNA or overly aggressive adapter trimming [2].
- Solution:
- Check RNA Integrity: The gold-standard method is to check the RNA Integrity Number (RIN) using an Agilent Bioanalyzer or similar instrument before sequencing. A low RIN (< 7-8) indicates degradation [44]. To prevent degradation, use RNase-free techniques, stabilize samples immediately after collection (e.g., snap-freezing or lysis buffers), and avoid repeated freeze-thaw cycles [45] [46].
- Optimize Trimming: Re-run your QC and trimming steps with a tool like
fastporTrimmomatic. Apply trimming cautiously to remove adapters and low-quality bases without losing an excessive amount of sequence length and true biological signal [16] [47].
FAQ 3: My mapping rate is low, but I don't have high multi-mapping or short reads. What's wrong?
- Problem: This can indicate a mismatch between your data and the reference or sample contamination.
- Solution:
- Verify Reference Genome: Ensure you are using the correct and comprehensive reference genome for your species. Some genome assemblies do not include all ribosomal DNA sequences or unplaced scaffolds, which can lead to unmapped reads [2]. For non-model organisms, low mapping rates are expected due to poor or incomplete annotations [1].
- Check for Contamination: A quick and effective method is to BLAST a subset of the unmapped reads against a general nucleotide database (like NT). This can reveal contamination from other species (e.g., bacteria, fungi) or other sources [1].
FAQ 4: Is a lower mapping rate normal for total RNA-seq compared to poly(A)-enriched data?
- Answer: Yes, it can be. Total RNA-seq captures all RNA species, including a high fraction of rRNA and other non-coding RNAs. As discussed, these can lead to multi-mapping and lower overall unique mapping rates. The key is to quantify the rRNA level and compare it to the expected baseline for your specific library preparation kit and sample type [1].
Table: Key Research Reagent Solutions for RNA-seq QC
| Reagent / Tool | Function | Considerations for Use |
|---|---|---|
| RNase Inhibitors | Prevents RNA degradation during extraction and library prep [46]. | Essential for working with sensitive or low-abundance transcripts. Include in lysis buffers. |
| ERCC or SIRV Spike-in Controls | Synthetic RNA added to the sample to monitor technical variation and quantification accuracy [1] [38]. | Allows for normalization based on "ground truth" and helps pinpoint workflow issues. |
| Ribosomal RNA Depletion Kits | Removes abundant rRNA to increase sequencing depth of informative transcripts [1]. | Critical for total RNA-seq. Efficiency should be verified; high residual rRNA indicates a problem. |
| Poly(A) Selection Beads | Enriches for polyadenylated mRNA [1]. | Standard for mRNA-seq. Inefficient selection can lead to high rRNA background. |
| RNA Stabilization Reagents | Preserves RNA integrity at sample collection (e.g., RNAlater) [46]. | Vital for clinical or field samples where immediate freezing is not possible. |
Best Practices for a Robust QC Pipeline
To proactively prevent low mapping rates, implement these best practices across your RNA-seq workflow.
- Start with High-Quality RNA: The foundation of a good RNA-seq dataset is intact RNA. Always assess RNA quality using the RNA Integrity Number (RIN) or similar metrics before proceeding to sequencing [44] [46].
- Implement Multi-Stage QC: QC is not a single step. Perform it at multiple stages [16]:
- Raw Data (FASTQ): Use
FastQCto assess per-base sequence quality, adapter contamination, and GC content [16] [44]. - Post-Alignment (BAM): Use
RSeQC,Qualimap, orPicardto evaluate mapping rates, rRNA content, duplication rates, and gene body coverage uniformity [16] [44] [1]. - Reporting: Use
MultiQCto aggregate all QC results into a single, comprehensive report for easy visualization and comparison across samples [16].
- Raw Data (FASTQ): Use
- Control for Batch Effects: Technical variability from library preparation dates, sequencing lanes, or different operators can introduce bias. Use biological replicates and randomize samples across batches to mitigate this [16] [38].
- Validate with Spike-ins: For critical applications, especially when detecting subtle differential expression, use spike-in controls like ERCC or SIRVs. They provide an objective "ground truth" to benchmark the performance of your entire workflow [1] [38].
Addressing a low mapping rate requires a systematic, multi-level validation approach that spans experimental design, wet-lab techniques, and bioinformatic scrutiny. By leveraging the diagnostic workflows, troubleshooting guides, and best practices outlined here, researchers can transform a perplexing QC failure into a solvable technical challenge. A rigorous QC pipeline is not an obstacle but a powerful enabler, ensuring that the conclusions drawn from RNA-seq data are built upon a solid and reliable foundation.
Systematic Diagnosis: A Step-by-Step Troubleshooting Framework
Diagnostic Questions and Solutions
Is your raw sequence data of low quality?
Raw data quality is foundational. Low-quality scores, adapter contamination, or an unbalanced nucleotide composition can prevent reads from mapping to the reference.
Recommended Action: Run a quality control (QC) and adapter trimming tool.
- fastp is recommended for its rapid analysis, simplicity, and effectiveness in significantly enhancing the proportion of high-quality bases (Q20 and Q30) in the data [48].
- Alternative: Trim Galore can be used as it integrates Cutadapt and FastQC for a comprehensive workflow, though it may sometimes lead to an unbalanced base distribution in the tail of reads [48].
Was an inappropriate RNA-seq technique selected for your experiment?
The choice of RNA-seq assay dictates which RNA species are captured. Selecting the wrong one can mean your target transcripts are absent from your data, leading to low mapping rates.
Recommended Action: Verify that your library preparation method matches your experimental goals. The table below summarizes common techniques [49].
| Assay Type | Target RNA | RNA Selection Method | Best For |
|---|---|---|---|
| mRNA-Seq | mRNA | Poly(A) selection | Standard coding transcriptome analysis in eukaryotes. |
| Total RNA-Seq | mRNA + lncRNA | rRNA depletion | Comprehensive analysis, including non-polyA transcripts. |
| Strand-Specific RNA-Seq | mRNA and/or lncRNA | Poly(A) selection or rRNA depletion | Determining the orientation of transcripts. |
| Small RNA-Seq | miRNA, siRNA, piRNA | Size fractionation | Studying small non-coding RNA species. |
| Single-Cell RNA-Seq | mRNA | Poly(A) selection after cell fractionation | Profiling transcriptomes of individual cells. |
Are high sequencing errors confounding the aligner?
Sequencing errors can introduce mismatches that prevent reads from aligning correctly, especially in applications like SNP detection or de novo assembly [50].
Recommended Action: Apply a sequencing error correction tool before alignment. The following table compares the performance of three tools based on a study using ERCC spike-in controls as a ground truth [50].
| Tool | Algorithm Type | Reduction in Mismatch Rate | Increase in Reads Aligned | Note |
|---|---|---|---|---|
| SEECER | Hidden Markov Model | Highest | Significant (Hg38) | Consistently achieved the lowest mismatch rates [50]. |
| Musket | k-mer spectrum | High | Significant (ERCC) | A robust, well-performing tool [50]. |
| Coral | Multiple sequence alignment | Moderate | Slight | Corrected fewer errors with default settings [50]. |
Protocol: Error Correction with SEECER/Musket/Coral
- Input: Raw FASTQ files from the sequencer.
- Process: Run the error-correction tool on the raw reads. The study used default parameters, but performance may be improved with optimization [50].
- Output: Corrected FASTQ files.
- Alignment: Use the corrected FASTQ files as input for your aligner (e.g., TopHat, HISAT2, STAR) [50].
Does your reference genome or annotation lack specificity for your species?
Using a generic or low-quality reference is a major cause of low mapping rates. The suitability of alignment and analysis tools can vary significantly across different species (e.g., humans, plants, fungi) [48].
Recommended Action: Critically evaluate your reference files.
- For established models: Ensure you are using the most recent and comprehensive genome assembly and annotation (GTF/GFF) files from a authoritative database.
- For non-model organisms:
- If a reference is available but poorly annotated, consider supplementing with de novo transcriptome assembly or RNA-seq guided annotation.
- If no reference exists, a de novo transcriptome assembly may be necessary, for which error correction is particularly critical [50].
Are you using a suboptimal alignment tool or parameters?
Alignment tools have different strengths, and their performance can be species-dependent. Using default parameters designed for one species (e.g., human) may not work well for another (e.g., a plant pathogenic fungus) [48].
Recommended Action: Research and select an aligner proven to work well for your specific species.
- Methodology: A comprehensive study established a superior pipeline by testing 288 different analysis pipelines on fungal RNA-seq datasets. The key is systematic evaluation rather than relying on a one-size-fits-all tool [48].
- Parameter Tuning: The experimental results demonstrated that tuned software parameter configurations provide more accurate biological insights than default settings. Always check the literature for recommended parameters for your organism [48].
The Scientist's Toolkit: Research Reagent Solutions
| Item | Function |
|---|---|
| ERCC Spike-In Controls | Artificially synthesized RNAs with known sequences. They serve as a ground truth for evaluating sequencing accuracy, dynamic range, and the performance of error-correction tools [50]. |
| Universal Human Reference RNA (UHRR) | A standardized RNA sample from a pool of multiple human cell lines. Used as a benchmark in consortium projects like SEQC to assess the accuracy and reproducibility of RNA-seq data across labs [50]. |
| Oligo(dT) Beads/Columns | Used for poly(A) selection to enrich for messenger RNA (mRNA) from total RNA by binding to the polyadenylated tails. Essential for mRNA-Seq [49]. |
| rRNA Depletion Probes | Oligos complementary to ribosomal RNA (rRNA) sequences are used to capture and remove rRNA, enabling comprehensive analysis of the transcriptome, including long non-coding RNAs [49]. |
| Strand-Specific Library Prep Kits | Kits that incorporate methods like dUTP second-strand marking to preserve the original orientation of transcripts during cDNA library construction. Vital for correct gene annotation [49]. |
| Single-Cell Barcoding Beads | Oligonucleotide-tagged beads used in microfluidic devices to add a unique cellular barcode to all transcripts from a single cell, enabling pooled sequencing and digital gene expression counting [49]. |
Diagnostic Workflow Diagram
The following diagram provides a logical workflow for diagnosing low mapping rate issues.
For researchers, scientists, and drug development professionals, a low mapping rate in an RNA-seq experiment is more than a technical nuisance; it is a critical data quality issue that can compromise the integrity of downstream analyses and biological conclusions. Effectively interpreting alignment logs is the first and most crucial step in diagnosing the root cause. This guide provides a structured, troubleshooting-focused approach to understanding key metrics and implementing solutions, directly supporting the broader thesis that robust RNA-seq research hinges on proactive mapping rate optimization.
FAQ: Interpreting Alignment Logs and Troubleshooting Low Mapping Rates
What key metrics should I look for in my alignment log?
Alignment logs from tools like Salmon or STAR contain specific metrics that pinpoint where reads are being lost. You should systematically check the following values [17] [2]:
- Overall Mapping Rate: This is the primary indicator of success. While expectations vary by sample type and organism, rates below 70-80% for high-quality eukaryotic samples often warrant investigation [2].
- Reads Mapped to Multiple Loci (Multi-mappers): A high number of multi-mapping reads often suggests contamination with repetitive sequences (like rRNAs) or reads originating from gene families with high sequence similarity [2].
- Reads Discarded Due to Alignment Score: A high count here indicates that many reads could not be aligned with sufficient confidence, potentially due to poor read quality, adapter contamination, or excessive mismatches [17].
- Reads Categorized as "Too Short": This can indicate that the reads were severely trimmed or are derived from highly degraded RNA, leaving fragments too small for unique alignment [2].
- Reads Mapping to Decoys: If you used a decoy sequence (e.g., for rRNA), this metric shows the level of specific contamination.
The table below summarizes these key metrics and their interpretations:
Table 1: Key Alignment Metrics and Their Interpretations
| Metric | Typical Warning Sign | Potential Underlying Cause |
|---|---|---|
| Overall Mapping Rate | < 70-80% | rRNA/tDNA contamination, degraded RNA, adapter contamination, incorrect reference [17] [2]. |
| Reads Mapped to Multiple Loci | > 10-20% | Ribosomal RNA (rRNA) contamination, transfer RNA (tRNA) contamination, paralogous gene families [2]. |
| Reads Discarded Due to Alignment Score | Significantly high | Incomplete adapter trimming, low base quality, high divergence from reference genome [17]. |
| Fragments "Too Short" | Significantly high | RNA degradation, overly aggressive quality trimming [2]. |
| Reads Mapping to Decoys | > 5-10% | Confirms specific contamination (e.g., ribosomal RNA) if a decoy was provided. |
I have a high number of mappings discarded because of alignment score. What does this mean?
This is a common issue, as highlighted in a Salmon log where over 57 million mappings were discarded for this reason [17]. It directly indicates that the aligner's internal threshold for a confident alignment was not met for a large proportion of your reads. The primary causes are:
- Adapter and Quality Trimming Issues: If adapter sequences or low-quality bases are not adequately removed, they prevent the read from aligning cleanly to the reference. This is a frequent culprit [17].
- Biased Sequence Content: Fluctuations in per-base sequence content, especially at the start of reads (often due to random primer bias), can interfere with alignment algorithms [17].
- High Polymorphism or Errors: A high number of mismatches between your reads and the reference genome, whether due to biological variation or sequencing errors, will lower alignment scores.
Why does total RNA-seq often yield a lower mapping rate compared to poly(A)-enriched RNA-seq?
The difference lies in the composition of the sequenced RNA. Total RNA is dominated by ribosomal RNA (rRNA), which can constitute over 80% of the material. While the reference genome contains rRNA genes, they are often highly repetitive and present in multiple copies [2]. When reads from these rRNAs are sequenced, they map to numerous genomic locations. Most aligners, by default, will discard reads that map to an excessive number of loci (e.g., more than 10 locations in STAR), classifying them as unmapped [2]. In contrast, poly(A) enrichment selectively captures messenger RNA (mRNA), drastically reducing the fraction of multi-mapping ribosomal reads and thus increasing the unique mapping rate.
My mapping rate is low, but my reads are high quality. What could be wrong?
High base quality does not guarantee a high mapping rate. Other critical factors include:
- RNA Integrity: Degraded RNA results in short fragments. Even with high-quality bases, these short reads may be deemed "too short" for unique alignment or may not contain enough information to map unambiguously [2].
- Incorrect Library Type Specification: If a stranded library is incorrectly specified as unstranded (or vice-versa), it can halve the number of plausible alignments, leading the aligner to discard many valid reads [17].
- Reference Genome Issues: Using an incomplete genome (e.g., one missing unplaced scaffolds or haplotype sequences) can mean there is no location for a read to map. This is particularly relevant for repetitive regions and some rRNA genes that may not be placed on primary chromosomes [2].
- Presence of Pseudogenes: Reads from functional genes can be misaligned to pseudogenes due to high sequence similarity, and vice versa, leading to inaccurate quantification and potential discarding of reads [21].
Troubleshooting Protocol: A Step-by-Step Diagnostic Workflow
Follow this structured workflow to diagnose and address the root causes of a low mapping rate. The accompanying diagram visualizes the logical decision process.
Diagram 1: A logical workflow for diagnosing low mapping rates in RNA-seq data.
Step 1: Comprehensive Quality Control (QC) of Raw Reads
- Methodology: Use tools like
fastp[47] orTrim Galore/FastQC[47] on your raw FASTQ files.FastQCprovides visual reports on per-base sequence quality, adapter content, and sequence duplication levels.fastpis noted for significantly enhancing data quality by effectively trimming adapters and low-quality bases [47]. - What to Look For:
- A drop in quality scores at the ends of reads.
- Overrepresented sequences, which often indicate adapter contamination or a specific highly abundant RNA type (like rRNA).
- "Per base sequence content" warnings, which can indicate priming bias.
Step 2: Execute Trimming and Filtering
- Methodology: Based on the QC report, perform trimming. Use
fastporTrim Galore(which wrapsCutadapt) to remove adapter sequences and trim low-quality bases from the 3' end (and 5' end if necessary) [47]. The goal is to remove technical sequences while preserving as much biological sequence as possible. - Protocol Note: The parameter for the number of bases to trim can be set based on the quality report, for instance, by trimming from the first base where quality drops (
FOC) or through a more aggressive approach (TES) [47].
Step 3: Interrogate the Alignment Log
- Methodology: Re-run your alignment (e.g., with
STARorSalmon) on the trimmed reads and carefully examine the output log. Use the metrics from Table 1 to guide your analysis. - Diagnosis:
- If "Reads Mapped to Multiple Loci" is high, this strongly points to rRNA or other repetitive element contamination [2]. Proceed to Step 4.
- If "Reads Discarded Due to Alignment Score" remains high after trimming, verify the integrity of your RNA (e.g., via RNA Integrity Number) and consider if the organism's genome is highly divergent from your reference.
- If other metrics are unremarkable, confirm your library preparation method and verify the library type (e.g., stranded vs. unstranded) specified in the aligner command is correct [17].
Step 4: Address Contamination and Multi-Mapping Reads
- For Future Experiments: If rRNA contamination is confirmed, consider modifying your wet-lab protocol. For total RNA-seq, use ribosomal RNA depletion kits (Ribo-zero) instead of poly(A) selection. For blood samples, additional globin RNA depletion is recommended [32].
- In Silico Solutions:
- Use a Decoy Sequence: Provide a concatenated reference that includes sequences for common contaminants (e.g., rRNAs, tRNAs, mitochondrial DNA) as "decoys." This allows the aligner to assign these reads properly rather than discarding them as multi-mappers.
- Adjust Aligner Parameters: You can increase the limit for multi-mapping reads (e.g.,
--outFilterMultimapNmaxinSTAR) [2]. However, use this with caution, as it can introduce noise. These multi-mapping reads can then be handled during quantification by tools likeSalmonthat probabilistically assign them.
The Scientist's Toolkit: Essential Research Reagents and Materials
The following table lists key reagents and computational resources critical for successful RNA-seq experiments and analysis.
Table 2: Key Research Reagents and Computational Tools for RNA-seq
| Item Name | Function / Explanation |
|---|---|
| Ribosomal RNA Depletion Kits | Chemically removes abundant ribosomal RNA from total RNA samples, dramatically increasing the fraction of informative (e.g., mRNA, lncRNA) reads and improving mapping rates in total RNA-seq [32]. |
| Poly(A) mRNA Magnetic Isolation Kits | Selectively enriches for poly-adenylated messenger RNA (mRNA) from total RNA. This is the standard for eukaryotic mRNA sequencing and avoids the rRNA contamination problem [51]. |
| ERCC Spike-In Mix | A set of synthetic RNA transcripts of known concentration added to the sample. Used to evaluate the sensitivity, accuracy, and dynamic range of the entire RNA-seq workflow, including alignment efficacy [32]. |
| UMIs (Unique Molecular Identifiers) | Short random nucleotide sequences added to each molecule during library prep. They allow for bioinformatic correction of PCR duplication biases, which is crucial for accurate quantification, especially in low-input protocols [32]. |
| Splice-Aware Aligner (STAR) | A widely used aligner that is specifically designed to handle RNA-seq reads that span intron-exon junctions, which is essential for accurate mapping to a genomic reference [52]. |
| Pseudoaligner (Salmon) | A highly efficient tool that uses a lightweight alignment method to quickly and accurately quantify transcript abundance, often in conjunction with alignment-based QC [52]. |
Understanding and Troubleshooting Low Mapping Rates in RNA-seq
A low mapping rate, where a surprisingly small percentage of your sequencing reads successfully align to the reference genome or transcriptome, is a common but solvable problem in RNA-seq analysis. This guide provides a structured approach to diagnosing and fixing the underlying causes.
Q1: What is considered an acceptable mapping rate, and when should I be concerned?
While the ideal mapping rate is dependent on your organism and experimental design, the following benchmarks provide general guidance.
| Mapping Rate | Assessment & Typical Causes |
|---|---|
| ≥ 90% | Ideal. Indicates high-quality data and a well-matched reference [1]. |
| ~70% - 89% | Often acceptable. Common with lower-quality RNA or less complete genome annotations [1]. |
| < 70% | Concerning. Suggests potential issues requiring investigation [1]. |
If you encounter mapping rates as low as 40-60%, as reported by some users of tools like Salmon, it indicates a significant problem that must be addressed for a successful analysis [23].
Q2: What are the primary causes of a low mapping rate?
The root causes often fall into three categories: sample and library preparation issues, problems with the reference, or suboptimal analysis parameters.
- High Ribosomal RNA (rRNA) Content: Total RNA is composed of 80-98% rRNA. If ribosomal depletion is inefficient, a massive fraction of your reads will be ribosomal. Since rRNA genes often have multiple copies across the genome, these reads can map to many locations and be discarded by the aligner as multi-mappers, drastically lowering the reported mapping rate [2] [1].
- Sample Degradation: Using degraded RNA results in short RNA fragments. During sequencing, this produces short reads that may be too brief for the aligner to map with confidence, often classified as "too short" and discarded [2] [1].
- Reference Mismatch or Contamination: If you are mapping to an incomplete reference (e.g., one missing rRNA sequences or unplaced scaffolds) or to the wrong species, reads will not find a match. Contamination of your sample with foreign RNA or genomic DNA will also produce reads that cannot map to the target reference [2] [1].
- Suboptimal Alignment Parameters: Strict default settings in aligners can unnecessarily discard valid reads. For example, the STAR aligner by default considers a read unmapped if it aligns to more than 10 genomic loci (
--outFilterMultimapNmax). For total RNA-seq with high rRNA, increasing this value can recover some of these multi-mapping reads [2].
The following workflow provides a systematic method for diagnosing the cause of a low mapping rate.
Q3: What is a step-by-step protocol to optimize mapping rates?
Follow this detailed experimental plan to identify and correct the issue.
Protocol: Diagnostic and Optimization Workflow
Step 1: Initial Quality Assessment
- Check Aligner Logs: Begin by thoroughly examining the log files from your aligner (e.g., STAR, Salmon). Note the specific categories of unmapped reads, such as "too short" or "too many loci."
- Investigate Unmapped Reads: Extract a subset of unmapped reads and use a tool like
BLASTto identify their biological origin [1]. This can quickly reveal if they are dominated by rRNA, microbial sequences (contamination), or other entities.
Step 2: Address Sample and Library Issues
- Combat rRNA:
- For future experiments, ensure rigorous ribosomal RNA depletion using proven kits.
- If analyzing existing data with high rRNA, mapping the reads separately to an rRNA database (e.g., SILVA) can quantify the problem but is not a complete fix [1].
- Prevent Degradation:
- Use high-quality, intact RNA (e.g., RIN > 8) for library preparation.
- Always perform adapter trimming on your raw reads before alignment to remove technical sequences that can interfere with mapping.
- Remove Contamination:
- Treat samples with DNase to remove genomic DNA contamination [53].
- If
BLASTreveals microbial contamination, you may need to remove those reads or account for them in your reference.
Step 3: Optimize Reference and Alignment Parameters
- Validate Your Reference:
- Tune Alignment Parameters:
- For aligners like STAR, if you have a high rate of multi-mapping reads, consider increasing the
--outFilterMultimapNmaxparameter from its default of 10 [2]. - For quantification with pseudo-aligners like Salmon, using the
--validateMappingsflag can improve accuracy by discarding poor-quality mappings [23].
- For aligners like STAR, if you have a high rate of multi-mapping reads, consider increasing the
Research Reagent Solutions
The following table lists key reagents and tools essential for optimizing your RNA-seq mapping performance.
| Reagent / Tool | Function in Troubleshooting |
|---|---|
| Ribosomal Depletion Kits | Critical for reducing the vast proportion of ribosomal RNA in total RNA samples, freeing up sequencing capacity for informative mRNAs and non-coding RNAs [32]. |
| DNase I | Digests and removes genomic DNA contamination from RNA samples prior to library preparation, preventing DNA reads from masquerading as RNA signals [53]. |
| ERCC Spike-In Controls | Synthetic RNA controls of known concentration spiked into samples. They help standardize RNA quantification and assess the technical performance, sensitivity, and dynamic range of the entire RNA-seq workflow [54] [32]. |
| UMIs (Unique Molecular Identifiers) | Short random nucleotide sequences added to each molecule during library prep. They allow for accurate digital counting and correction of PCR amplification bias and errors, especially important in low-input or deep-sequencing projects [32]. |
| SILVA rRNA Database | A curated database of rRNA sequences. Used to map a subset of unmapped reads to accurately quantify the fraction of residual ribosomal RNA in your library [1]. |
Troubleshooting Guides and FAQs
Sample Quality and Preparation
Q: My FFPE RNA is highly degraded. Is it still usable for RNA-seq, and how can I improve results?
Yes, heavily degraded FFPE RNA can often still be used, but it requires specific quality assessment and library preparation techniques. Traditional RNA Integrity Number (RIN) is not sufficient; instead, use the DV200 metric (percentage of RNA fragments >200 nucleotides). Samples with DV200 values as low as 30% can be successful [55]. For small RNA studies, inspect the 20–40 nt region on a bioanalyzer trace; even a blunted peak indicates the presence of usable small RNAs [56]. Implement a robust rRNA removal method like QIAseq FastSelect, which effectively removes >95% of rRNA in a single step even with fragmented RNA [57]. Consider library prep chemistries specifically designed for degraded material that employ continuous synthesis enzymes capable of converting RNA to cDNA and adding adapters in a single step [58].
Q: What are the key considerations when working with ultra-low-input RNA (≤1 ng)?
Success with ultra-low-input RNA requires minimizing sample loss throughout the workflow. Choose library prep kits specifically validated for low inputs, such as the QIAseq UPXome RNA Library Kit (works with 500 pg RNA) or Lexogen's proprietary technologies (handle inputs as low as 10 pg) [57] [59]. Adopt a streamlined workflow with fewer pipetting and bead cleanup steps to prevent loss of material [57]. When available, utilize automation to increase standardization and reduce handling errors [57]. For the smallest inputs (e.g., corresponding to 1-100 cells), be aware that extra PCR cycles may be needed to generate sufficient library concentration, though this must be balanced against the risk of increased duplication rates [59] [56].
Library Preparation and Sequencing
Q: How does library preparation choice impact the ability to detect different RNA biotypes from challenging samples?
The choice of library prep kit significantly impacts which RNA species you will capture. Many standard protocols focus only on long RNAs unless specifically designed for small RNAs [58]. Kits that use a continuous synthesis chemistry with proprietary retrotransposon enzymes can capture both long and short RNA biotypes (including miRNA, tRNA, snRNA, and snoRNA) from a single library, providing a more comprehensive transcriptome view [58]. One study comparing different workflows found that over 500 unique small RNAs were detected using such a chemistry, compared to only seven small RNAs with an alternative method [58]. Additionally, performing rRNA depletion after library construction rather than before can help preserve small RNA species that might otherwise be lost during sample handling steps [58].
Q: My RNA-seq data has a high percentage of ribosomal RNA reads. How can I reduce this in future experiments?
High rRNA contamination reduces on-target reads and increases sequencing costs. Improve this by implementing a more effective rRNA removal method. The QIAseq FastSelect technology removes >95% of rRNA/globin mRNA in a single 14-minute step [57]. For specialized applications, consider post-library prep ribodepletion approaches, which have been shown to maintain data quality even when pools of libraries are depleted en masse, offering substantial cost savings for high-throughput applications [58]. If using small RNA-seq approaches, a hierarchical alignment strategy that first maps to miRBase, then to tRNAs and Y-RNAs, can help accurately classify reads and identify the source of contamination [56].
Data Analysis and Computational Approaches
Q: My mapping rates are low, especially with degraded FFPE samples. What are the main causes and solutions?
Low mapping rates with challenging samples can stem from several issues. For severely degraded samples where RNA fragments are shorter than 16 nt, standard seed-based aligners (Bowtie, BWA) may discard these reads [56]. Consider using cleanup kits to remove fragments <16 nt before library preparation or using PAGE gel purification to isolate intact small RNAs [56]. If working with older SOLiD sequencing data in colorspace format, note that direct colorspace mapping is required as conversion to nucleotide space can cause significant information loss [60]. High multimapping can also result from rRNA contamination; excluding reads mapped to rRNA genes can substantially improve mapping statistics [60]. For computational correction of FFPE artifacts, tools like FFPErase use machine learning frameworks to filter artifactual SNVs and indels, significantly improving data quality [61].
Q: Are there specialized computational methods for analyzing FFPE RNA-seq data given its high noise and dropout rates?
Yes, specialized computational tools are essential for robust analysis of FFPE-derived RNA-seq (fRNA-seq) data. The PREFFECT (PaRaffin Embedded Formalin-FixEd Cleaning Tool) framework uses generative modeling to fit negative binomial distributions to observed expression counts while adjusting for technical and biological variables [62]. This approach effectively imputes missing values and corrects for batch effects, which is particularly valuable given the high rate of transcript dropout in fRNA-seq data [62]. PREFFECT can leverage sample-sample adjacency networks and matched tissue profiles to stabilize expression profiles, enhancing sample clustering and downstream analysis [62]. Traditional bulk RNA-seq pipelines are suboptimal for fRNA-seq data, making fRNA-seq-specific normalization and denoising methods critical for reliable results [62].
Table 1: Performance Comparison of RNA-seq Library Preparation Kits for FFPE Samples
| Metric | TaKaRa SMARTer Kit (Kit A) | Illumina Stranded Total RNA Prep (Kit B) |
|---|---|---|
| Minimum RNA Input | 20-fold less than Kit B [55] | Standard input requirements [55] |
| rRNA Content | 17.45% [55] | 0.1% [55] |
| Duplication Rate | 28.48% [55] | 10.73% [55] |
| Reads Mapping to Exons | 8.73% [55] | 8.98% [55] |
| Reads Mapping to Introns | 35.18% [55] | 61.65% [55] |
| Gene Overlap in DEG Analysis | 83.6-91.7% [55] | 83.6-91.7% [55] |
Table 2: Impact of FFPE Processing on Variant Calling Accuracy in WGS
| Variant Type | Fold-Enrichment in FFPE vs. FF | Precision with Consensus Calling | Artifact Reduction with Computational Methods |
|---|---|---|---|
| SNVs | 2.0x median increase [61] | 50% [61] | Effectively filtered by FFPErase [61] |
| Indels | 2.4x median increase [61] | 62% [61] | Effectively filtered by FFPErase [61] |
| Structural Variants | 0.76x median change [61] | 80% [61] | 98% reduction with consensus calling [61] |
| Genome-wide TMB | Elevated in FFPE [61] | Improved with consensus calling [61] | Mitigated by computational filtering [61] |
Experimental Workflows
Comprehensive FFPE RNA-seq Workflow
Computational Processing of FFPE RNA-seq Data
Research Reagent Solutions
Table 3: Essential Reagents and Kits for Challenging RNA-seq Samples
| Product Category | Example Products | Key Features | Optimal Use Cases |
|---|---|---|---|
| rRNA Removal Kits | QIAseq FastSelect [57], SEQuoia RiboDepletion Kit [58] | >95% rRNA removal, single-step protocol (14 min), works with fragmented RNA [57] [58] | FFPE samples, low-input applications, degraded RNA |
| Low-Input Library Prep | QIAseq UPXome RNA Library Kit [57], TaKaRa SMARTer Stranded Total RNA-Seq [55] | Works with 500 pg - 1 ng RNA, streamlined workflow, minimal hands-on time [57] [55] | Ultra-low input samples, rare cell populations, limited clinical material |
| Specialized FFPE Chemistry | SEQuoia Complete Stranded RNA Library Prep [58], Lexogen FFPE RNA Sequencing [63] | Continuous synthesis chemistry, captures long and short RNAs, tolerant of crosslinks [58] [63] | Archived FFPE samples, degraded clinical specimens, total transcriptome analysis |
| Computational Tools | PREFFECT [62], FFPErase [61] | Generative modeling, artifact filtering, improves clustering accuracy [62] [61] | Noisy fRNA-seq data, artifact reduction, biomarker discovery |
Frequently Asked Questions (FAQs)
Q1: I am getting a mapping rate of around 40-60% with Salmon on my human RNA-seq data. My FastQC report looks good. Should I be concerned?
A mapping rate of 40-60% is generally considered low and warrants investigation. For high-quality data, mapping rates should typically be well above 70-80% [16] [2]. The log from an analysis with a 40.8% mapping rate showed that a large number of reads were discarded due to low alignment scores, indicating a potential issue [23].
Q2: Why does total RNA-seq often yield a lower mapping rate compared to poly(A)-enriched RNA-seq?
The primary reason is the high fraction of ribosomal RNAs (rRNA) in total RNA-seq samples [2]. Although rRNAs are part of the genome, they are present in multiple copies, causing many reads to map to numerous genomic locations. By default, aligners often discard these "multi-mapping" reads. Furthermore, if the library preparation did not include efficient rRNA depletion, these sequences can dominate your sequencing library, wasting capacity [16] [2].
Q3: What are the most common causes of a low mapping rate?
The common causes can be categorized as follows:
| Category | Specific Issue |
|---|---|
| Sample & Library | RNA degradation; Inadequate rRNA depletion; Contamination (gDNA, protein, salt); High duplication rate from low input or excessive PCR [45] [16]. |
| Reference Genome | Using an incomplete reference (e.g., missing haplotype or rDNA sequences) [2]. |
| Data Analysis | Incorrect reference selection; Not trimming adapter sequences; Using overly strict alignment parameters [16] [2]. |
Q4: My data has a high number of reads classified as "too short" by the aligner. What does this mean?
Reads that are "too short" are often fragments that are too small for the aligner to map with confidence [2]. This can be caused by RNA degradation, or by sequencing small RNA fragments without proper size selection during library preparation [2]. Ensure you perform adapter trimming before alignment, as the presence of adapter sequences can also result in short, unmappable sequences after trimming [16] [2].
Troubleshooting Guide: Diagnosing Low Mapping Rates
Follow the diagnostic workflow below to systematically identify the cause of your low mapping rate.
Solutions and Best Practices
Based on the diagnosis, implement the solutions in the workflow below to improve your mapping rate.
Experimental Protocols and Data Presentation
Detailed Methodology for RNA-seq Quality Control
Adhere to this protocol at key stages of your RNA-seq analysis [16]:
- Raw Data QC (FASTQ files): Use
FastQCto assess Per-base sequence quality (Q30+ is ideal), adapter contamination, GC content distribution, and overrepresented sequences. Summarize multiple samples withMultiQC. - Preprocessing: Trim adapter sequences and low-quality bases using tools like
TrimmomaticorCutadapt. Avoid excessive trimming that leads to significant data loss. - Alignment/Quantification: Use an aligner (
STAR,HISAT2) or quasi-mapper (Salmon) with appropriate parameters. For total RNA-seq, consider increasing the limit for multi-mapping reads (e.g.,--outFilterMultimapNmaxin STAR) to account for repetitive rRNA and tRNA genes [2]. - Post-Alignment QC: Assess the mapping rate, duplication levels (using
Picard), and coverage uniformity across genes (usingRSeQCorQualimap). Check for 5' or 3' bias.
Summary of Key QC Metrics and Thresholds
Monitor the following metrics to gauge data quality [16]:
| QC Metric | Ideal Threshold | Tool for Assessment | Implications of Deviation |
|---|---|---|---|
| Base Quality (Q-score) | > Q30 | FastQC | High error rate, lower mapping accuracy [16]. |
| Adapter Contamination | < 1% | FastQC, MultiQC | Lowers mapping efficiency; trimming required [16]. |
| Mapping Rate | > 70-80% | STAR, Salmon, Qualimap | Potential contamination, degradation, or incorrect reference [16] [2]. |
| rRNA Content | < 5% | RSeQC, FastQ-Screen | Inefficient rRNA depletion in total RNA-seq [16]. |
| Duplication Rate | Context-dependent | Picard, MultiQC | Low input material or PCR over-amplification [16]. |
The Scientist's Toolkit: Research Reagent Solutions
This table lists essential materials and their functions for preparing high-quality RNA-seq libraries.
| Research Reagent | Function in RNA-seq Workflow |
|---|---|
| RNase Inhibitors | Protects RNA integrity from degradation by RNases during extraction and library preparation [45]. |
| rRNA Depletion Kits | Selectively removes abundant ribosomal RNA from total RNA, enriching for mRNA and other RNAs, drastically improving mapping rate in total RNA-seq [16] [2]. |
| Poly(A) Selection Beads | Enriches for messenger RNA (mRNA) by capturing the poly-adenylated tail, standard for mRNA-seq [2]. |
| DNA Removal Kits/Enzymes | Eliminates genomic DNA contamination from RNA samples, preventing false mappings and misinterpretation of expression data [45]. |
| Strand-Specific Library Prep Kits | Preserves the original strand information of the RNA transcript, allowing for more accurate annotation and quantification [23]. |
Measuring Success: Validation Benchmarks and Impact Assessment
In RNA sequencing (RNA-seq) analysis, the mapping rate—the percentage of sequencing reads that successfully align to a reference genome or transcriptome—serves as a primary indicator of data quality. A low mapping rate can signal underlying issues with the sample, library preparation, or analysis pipeline, ultimately compromising the reliability of downstream results such as differential expression analysis. This guide establishes field-specific standards and troubleshooting methodologies to help researchers diagnose, address, and prevent low mapping rates, ensuring the production of high-quality, biologically meaningful data.
Defining Quality Thresholds: What is an Acceptable Mapping Rate?
A clear understanding of standard mapping rate benchmarks is essential for quality control. The table below summarizes the generally accepted thresholds in the field.
Table 1: Standard Quality Thresholds for RNA-seq Mapping Rates
| Mapping Rate | Quality Assessment | Recommended Action |
|---|---|---|
| ≥ 90% | Ideal | Proceed with downstream analysis. |
| ~70% - 89% | Acceptable | Investigate potential minor issues; may be acceptable depending on the sample type and reference quality. [1] |
| < 70% | Low / Concerning | Requires systematic troubleshooting to identify the root cause. [23] [1] |
It is critical to note that these benchmarks assume the use of a well-annotated model organism. For non-model organisms with incomplete or poor-quality reference genomes, lower mapping rates are frequently encountered and are often attributable to the reference itself rather than sample quality. [1]
Troubleshooting Guide: Diagnosing Low Mapping Rates
The following diagnostic workflow provides a systematic approach to identifying the cause of a low mapping rate. Start with the initial assessment and follow the path based on your findings.
Diagram 1: Diagnostic workflow for low mapping rates.
Investigating "Too Short" Reads
If the aligner log indicates a high number of reads classified as "too short," this typically points to issues with the input RNA or the preprocessing steps. [2]
- Root Cause: Highly degraded RNA is a common source of short fragments. During library preparation, these fragments are further shortened, resulting in reads that are too short (e.g., < ~14 bases) to be uniquely mapped to the reference. [2]
- Experimental Protocol: Verification of RNA Integrity
- Assess RNA Quality: Use an instrument such as a Bioanalyzer or TapeStation to determine the RNA Integrity Number (RIN). A high RIN (e.g., >8) is generally desirable for standard RNA-seq.
- Inspect FastQC Reports: Prior to alignment, run FastQC on your raw FASTQ files. Look for signs of degradation, such as a sharp drop in per-base sequence quality at the 3' end.
- Review Trimming: If adapter trimming was performed, ensure that the parameters were not overly aggressive. Re-inspect the FastQC report generated after trimming to confirm that read lengths remain sufficient for mapping.
Investigating Multi-Mapping Reads
A high number of reads that map to multiple genomic locations is a hallmark of specific types of biological contamination.
- Root Cause: Total RNA consists of up to 80-98% ribosomal RNA (rRNA). [1] If rRNA depletion is inefficient, your library will be dominated by rRNA-derived reads. Because ribosomal RNA genes are present in multiple copies across the genome, reads originating from them often map to numerous locations and are frequently discarded by aligners with default settings (e.g., STAR discards reads mapping to >10 loci by default), leading to a low reported mapping rate. [2]
- Experimental Protocol: Confirming rRNA Contamination
- Direct Alignment to rRNA: Extract a subset of your unmapped reads. Align these reads to a dedicated rRNA sequence database, such as SILVA. A high alignment rate to this database confirms significant rRNA contamination. [2] [1]
- Check Depletion Efficiency: For rRNA-depleted libraries (e.g., RiboCop), the expected rRNA mapping percentage is typically <1%. For poly(A)-enriched libraries, expect slightly higher levels (~3-5%) due to mitochondrial rRNA with poly(A) tails. [1]
Investigating Completely Unmapped Reads
When a large proportion of reads fail to map entirely, the issue may lie with the reference or the sample's biological origin.
- Root Cause:
- Reference Genome Mismatch: The reference used does not fully represent the sequenced species, which is common in non-model organisms. [1]
- Sample Contamination: The sample is contaminated with foreign DNA/RNA (e.g., microbial, fungal). [1]
- Missing rRNA Genes: Some reference genomes do not include all copies of repetitive rRNA genes, preventing these reads from mapping. [2]
- Experimental Protocol: Identifying Origin of Unmapped Reads
- BLAST a Subset: Randomly select a few hundred unmapped reads and use BLAST to identify their likely biological origin. This can reveal contamination or confirm that reads belong to your species but are missing from the reference. [1]
- Verify Reference Completeness: Ensure you are using the most comprehensive reference available (e.g., including all genomic scaffolds, not just primary chromosomes). [2]
FAQ: Addressing Common Questions
Q1: Why does my total RNA-seq data have a lower mapping rate compared to poly(A)-selected data? A1: This is a common observation. Total RNA-seq captures all RNA types, including the highly abundant ribosomal RNA (rRNA). rRNA reads often multi-map to their numerous genomic copies and are filtered out, lowering the reported mapping rate. In contrast, poly(A)-selection enriches for mRNA, which is less repetitive and therefore yields a higher mapping rate. [2]
Q2: My data is from a model organism, my RNA quality is good, and I don't see major rRNA contamination. What else could be wrong?
A2: In this case, investigate your alignment parameters. For total RNA-seq, consider increasing the aligner's threshold for multi-mapping reads (e.g., STAR's --outFilterMultimapNmax). This allows more rRNA-derived reads to be retained, which can increase your overall mapping rate. However, be aware that this introduces ambiguity in read assignment for downstream quantification. [2]
Q3: What are the key items I need to have in place before starting my RNA-seq analysis? A3: The table below lists essential reagents and resources for a successful RNA-seq experiment.
Table 2: Research Reagent and Resource Solutions
| Item | Function / Purpose | Considerations |
|---|---|---|
| High-Quality RNA | Starting material for library prep. | Check RNA Integrity Number (RIN); avoid degraded samples. |
| rRNA Depletion or Poly(A) Selection Kits | Enriches for mRNA by removing abundant rRNA or selecting polyadenylated transcripts. | Choice depends on research goal (e.g., poly(A) selection misses non-polyadenylated RNAs). |
| Spike-in Controls (e.g., ERCC, SIRVs) | Act as a ground-truth for benchmarking quantification accuracy and detection limits. | Added during library prep to monitor technical performance. [1] |
| Quality Control Software (e.g., FastQC, multiQC) | Generates quality reports on raw sequence data, per-base quality, adapter content, etc. | Critical for initial assessment before alignment. [19] [47] |
| Comprehensive Reference Genome & Annotation | The target for aligning sequencing reads and assigning them to genes. | Must match the species; includes all scaffolds and chromosomes where possible. [2] |
| rRNA Sequence Database (e.g., SILVA) | A dedicated database to quantify rRNA contamination. | Used to align a subset of reads to confirm depletion efficiency. [1] |
FAQs and Troubleshooting Guides
FAQ 1: What are the primary factors causing low mapping rates in my RNA-seq data, and how can I address them?
Low mapping rates, where a high percentage of sequenced reads fail to align to the reference genome, can stem from issues at multiple stages of your experiment. A systematic approach to identifying and correcting these factors is crucial for data quality.
- Problem: High levels of non-informative RNA, like ribosomal (rRNA) or globin RNA, are consuming your sequencing reads.
- Solution: Ensure effective ribosomal RNA depletion. Our validation shows that using the Watchmaker RNA library prep with Polaris Depletion consistently reduced rRNA reads compared to standard RNA capture methods, freeing up sequencing capacity for informative transcripts [64]. Select an appropriate rRNA removal protocol (e.g., poly(A) selection for high-quality mRNA or ribosomal depletion for degraded samples like FFPE or bacterial RNA) [42].
- Problem: Poor read quality or adapter contamination.
- Solution: Implement rigorous quality control (QC) and adapter trimming. Use tools like fastp or Trim_Galore to remove low-quality bases and adapter sequences. One study found that fastp significantly enhanced processed data quality and improved the alignment rate in subsequent steps [47].
- Problem: High PCR duplication rates, where the same original molecule is sequenced multiple times, wasting alignment resources.
- Solution: Optimize library preparation to minimize PCR over-amplification. The Watchmaker workflow demonstrated a significant reduction in PCR duplication rates, leading to a higher fraction of uniquely mapped reads and cleaner data [64].
- Problem: Incorrect or suboptimal alignment parameters for your specific species or study design.
- Solution: Customize your analysis pipeline. Research indicates that using similar parameters across different species without consideration for species-specific differences can compromise accuracy. For instance, a study on plant-pathogenic fungi established that optimized, species-specific pipelines provide more accurate biological insights compared to default configurations [47].
FAQ 2: How can I quantitatively assess the improvement gains after optimizing my RNA-seq workflow?
Improvements can be quantified by comparing key quality metrics before and after protocol optimization. The table below summarizes expected gains based on a controlled study comparing a standard RNA capture method against the optimized Watchmaker Genomics workflow [64].
Table 1: Quantitative Improvement Gains from Workflow Optimization
| Performance Measure | Standard Method | Optimized Watchmaker Workflow | Quantitative Gain |
|---|---|---|---|
| Library Preparation Time | 16 hours | 4 hours | 75% reduction (12 hours saved) [64] |
| PCR Duplication Rate | Higher | Significantly Reduced | Cleaner data, more efficient sequencing resource use [64] |
| Uniquely Mapped Reads | Lower | Significantly Increased | More informative data for analysis [64] |
| rRNA & Globin Reads | Higher | Consistently Reduced | More reads map to the biologically informative transcriptome [64] |
| Number of Detected Genes | Baseline | 30% more across sample types | Richer datasets and stronger biomarker discovery potential [64] |
FAQ 3: Which experimental design choices are critical for maximizing mapping rates and data quality from the start?
A well-planned experiment is a prerequisite for high-quality data. Key considerations include:
- Library Type: Choose between poly(A) selection and rRNA depletion based on your RNA sample integrity. Use strand-specific protocols to retain information on the direction of transcription, which simplifies the analysis of antisense transcripts [42].
- Sequencing Depth: The optimal number of sequenced reads depends on your goals. While five million mapped reads may suffice for medium-to-highly expressed genes, dozens of millions are needed for precise quantification of low-expression genes or complex applications [42].
- Biological Replicates: Include a sufficient number of replicates to account for biological variability and ensure statistical power. The number needed depends on the variability of your system and the effect size you wish to detect [42].
- Batch Effects: Minimize technical biases by processing samples in a randomized manner, isolating RNA on the same day, and sequencing experimental conditions and controls on the same run whenever possible [51].
Experimental Protocols
Detailed Methodology: Validation of an Optimized RNA-seq Workflow
This protocol is based on the validation study that generated the quantitative data in Table 1 [64].
- Sample Preparation:
- Obtain Universal Human Reference RNA (UHRR), whole blood (WB), Horizon Discovery reference sample (HD200), and Formalin-Fixed Paraffin-Embedded (FFPE) samples.
- Process samples for total RNA extraction using a standardized kit (e.g., PicoPure RNA Isolation Kit). Assess RNA quality using an instrument like the Agilent 4200 TapeStation, accepting samples with an RNA Integrity Number (RIN) >7.0 [51].
- Library Preparation:
- Test Group: Use the Watchmaker RNA library prep with Polaris Depletion kit according to the manufacturer's instructions.
- Control Group: Use a standard RNA capture method for comparison.
- Fragment RNA, convert to cDNA, and ligate adapters with indexes for multiplexing.
- Sequencing:
- Pool the libraries and sequence on a high-throughput platform (e.g., Illumina NextSeq 500). Aim for a minimum of 8 million aligned reads per library [51].
- Data Analysis:
- Demultiplexing: Generate fastq files using
bcl2fastq[51]. - Quality Control: Use FastQC to analyze sequence quality, GC content, and adapter contamination. Trim low-quality bases and adapters with fastp or Trim_Galore [47] [42].
- Alignment: Map reads to the appropriate reference genome (e.g., human hg38) using a splice-aware aligner like TopHat2 [51].
- Quantification: Generate a raw counts table for genes using a tool like HTSeq [51].
- Metric Calculation: Calculate key performance metrics, including:
- Mapping Rate: Percentage of reads that successfully align to the genome.
- Duplication Rate: Percentage of PCR duplicate reads.
- rRNA/Globin Read Percentage: Percentage of reads mapping to rRNA or globin genes.
- Gene Detection Count: Number of genes detected above a specific threshold (e.g., TPM > 0.5).
- Demultiplexing: Generate fastq files using
Workflow and Relationship Diagrams
RNA-seq Optimization Workflow
Quality Control Decision Logic
The Scientist's Toolkit
Table 2: Key Research Reagent Solutions for RNA-seq Optimization
| Item | Function | Example/Note |
|---|---|---|
| Polaris Depletion Kit | Effectively removes ribosomal (rRNA) and globin RNA, increasing the proportion of informative reads that map to the coding transcriptome [64]. | Watchmaker Genomics |
| fastp | A fast, all-in-one tool for quality control and adapter trimming of sequencing data. Improves data quality and subsequent alignment rates [47]. | - |
| Trim Galore | A wrapper tool that integrates Cutadapt and FastQC, providing comprehensive quality control and adapter trimming in a single step [47]. | - |
| Stranded Library Prep Kit | Preserves the directionality of transcription during cDNA library construction, crucial for accurately quantifying antisense or overlapping transcripts [42]. | e.g., dUTP-based methods |
| Universal Human Reference RNA (UHRR) | A well-characterized control RNA sample used to benchmark library preparation protocols and assess technical performance across experiments [64]. | Horizon Discovery |
| TopHat2 / HISAT2 | Splice-aware alignment tools designed to accurately map RNA-seq reads across exon-exon junctions to a reference genome [51]. | - |
Frequently Asked Questions
Q1: How does a low mapping rate directly affect my differential expression analysis? A low mapping rate means a significant portion of your sequencing data cannot be used, which reduces the statistical power of your analysis. This leads to a higher rate of false negatives (missing truly differentially expressed genes) and can compromise the accuracy of expression quantification for all genes [1]. If the unmapped reads are from a specific biological origin (like a particular gene type), the results can also become biased.
Q2: My mapping rate is only 65%. Should I proceed with differential expression testing? Proceeding is risky. While mapping rates as low as 70% can sometimes be acceptable depending on the sample and reference genome, rates below this threshold often indicate serious issues that will likely distort your conclusions [1]. It is highly recommended to investigate and remedy the cause of the low mapping rate before starting a differential expression analysis.
Q3: What are the most common causes of low mapping rates in RNA-seq experiments? The primary causes include [2] [1]:
- High ribosomal RNA (rRNA) content: This is a dominant cause in total RNA-seq. rRNA genes are present in multiple genomic copies, causing many reads to map to multiple locations and be discarded.
- Poor genome annotation or quality: This is especially problematic for non-model organisms.
- RNA degradation: Using highly degraded RNA results in short fragments that are too brief to map uniquely.
- Sample contamination: Contamination from other species (e.g., bacterial) can consume sequencing reads.
- Over-trimming of reads during quality control.
Q4: Can I use spike-in controls to assess the impact on quantification? Yes. The use of spike-in controls, such as ERCC or SIRVs, provides a known ground-truth dataset. By benchmarking your pipeline's accuracy in quantifying these controls, you can assess whether the issues causing a low mapping rate have also compromised your quantification accuracy [1].
Troubleshooting Guide: Diagnosing Low Mapping Rates
Follow this structured approach to identify the root cause of low mapping rates in your data.
Table 1: Key Alignment Metrics and Their Implications
| Metric | Acceptable Range | Problematic Value | Potential Cause |
|---|---|---|---|
| Overall Mapping Rate [1] | ≥ 90% (Ideal), ~70% (Minimal) | < 70% | rRNA, degradation, contamination, poor reference. |
| Ribosomal RNA Content [1] | < 5% (polyA-enriched), <1% (rRNA-depleted) | > 10% | Inefficient rRNA depletion or poly(A) selection. |
| Read Distribution (WTS) [1] | Majority in exonic regions | High intronic/intergenic | Genomic DNA contamination; expected in rRNA-depleted. |
| Read Distribution (3' mRNA-Seq) [1] | Concentrated at 3' UTR | Even across transcript | RNA degradation. |
| Multi-mapping Reads [2] | Low percentage | High percentage | Reads from repetitive regions (e.g., rRNA). |
Step 1: Interrogate the Aligner's Log File
Your alignment software (e.g., STAR) generates a detailed log file. Check this file for the following [2] [29]:
- Percentage of reads mapped: The overall mapping rate.
- Percentage of multi-mapping reads: A high number suggests issues with repetitive sequences.
- Percentage of "too short" reads: A high number suggests degraded RNA or over-trimming.
Step 2: Analyze Read Distribution Across Genomic Features
Use tools like RSeQC or Picard Tools to classify where your mapped reads are landing [1]. This can distinguish between different problems:
- High intronic/intergenic reads in a poly(A)-selected library suggests genomic DNA contamination.
- A lack of 3' bias in a 3'-Seq library suggests RNA degradation.
Step 3: Identify the Origin of Unmapped Reads
To proactively investigate unmapped reads, you can:
- BLAST a subset: Randomly select thousands of unmapped reads and BLAST them to identify their biological origin, which can reveal contamination or missing sequences in your reference [1].
- Map to a contaminant database: Map your reads to an rRNA-only database (like Silva) or a database of common contaminants to quantify the proportion of reads coming from these sources [1].
Experimental Protocols for Mitigation
Protocol 1: Optimizing STAR Alignment for Spliced Reads
This protocol is based on the STAR Basic Protocol for mapping RNA-seq reads to a reference genome [29].
Necessary Resources:
- Hardware: A computer with Unix/Linux/OS X. For the human genome, ≥30 GB RAM (32 GB recommended) and >100 GB free disk space.
- Software: STAR software (latest release recommended).
- Input Files:
- Reference genome indices (pre-built or generated by the user).
- Annotation file in GTF format (e.g., from Ensembl).
- RNA-seq reads in FASTQ format (gzipped or uncompressed).
Methodology:
- Create and enter a run directory:
- Execute the STAR mapping command. The following example is for paired-end, gzipped FASTQ files:
- Monitor the run: Status messages will appear on the screen, and detailed progress statistics are updated in the
Log.progress.outfile [29].
Protocol 2: Two-Pass Mapping for Novel Junction Discovery
For experiments where novel splice junctions are expected, or when a high-quality annotation is not available, use the 2-pass mapping strategy [29].
- First Pass: Run STAR as in the Basic Protocol but add the
--twopassMode Basicoption. This initial run identifies novel junctions from your data. - Second Pass: STAR automatically uses the junctions discovered in the first pass to create an improved genome index and remaps all reads, resulting in a more sensitive alignment.
Protocol 3: Validating with Spike-In Controls
Spike-in controls are synthetic RNA sequences added to your sample in known quantities before library preparation [1].
- Spike-in Addition: Spike a known amount of control RNA (e.g., ERCC, SIRVs) into your sample RNA.
- Proceed with Library Prep and Sequencing: Continue with your standard RNA-seq workflow.
- Assessment: After sequencing and quantification, check if the measured expression levels of the spike-ins correlate with their known concentrations. A strong correlation indicates that your workflow, from library prep to data analysis, is providing accurate quantification [1].
The following diagram illustrates the logical workflow for diagnosing and resolving low mapping rates, integrating the key steps and protocols outlined in this guide.
Diagram: Troubleshooting Workflow for Low Mapping Rates
The Scientist's Toolkit: Key Research Reagents & Materials
Table 2: Essential Reagents and Computational Tools for RNA-seq QC
| Item Name | Function / Purpose | Specification / Notes |
|---|---|---|
| RiboCop rRNA Depletion Kit [1] | Efficiently removes ribosomal RNA from total RNA samples, increasing useful sequencing reads. | Recommended for whole transcriptome sequencing to achieve <1% rRNA content. |
| ERCC Spike-In Mix [1] | A set of synthetic RNA controls used to benchmark quantification accuracy and workflow performance. | Added at a known concentration before library prep; serves as a ground-truth. |
| SIRVs (Spike-In RNA Variants) [1] | Synthetic isoform mixture to benchmark analysis for complex transcriptomes and isoform detection. | Helps fine-tune data analysis tools and parameters. |
| STAR Aligner [29] | Ultra-fast and accurate RNA-seq read aligner that can detect canonical and novel splice junctions. | Requires 30GB RAM for human genome. Use --twopassMode for novel junctions. |
| RSeQC Software [1] | A computational tool to comprehensively evaluate RNA-seq data quality, including read distribution. | Generates metrics on CDS, 5'/3' UTR, intronic, and intergenic reads. |
| Picard Tools [1] | A set of Java command-line tools for manipulating high-throughput sequencing data. | Can be used to collect RNA-seq metrics similar to RSeQC. |
| Silva Database [1] | A comprehensive database of aligned ribosomal RNA sequence data. | Used to accurately estimate rRNA content in a sample, independent of genome annotation. |
CRISPR Validation Methods: FAQs and Troubleshooting
Q1: What are the primary methods to validate a CRISPR-Cas9 edit in my experiment?
Several established methods exist to confirm successful genome editing, each with different advantages in terms of speed, cost, and information depth.
- Enzymatic Mismatch Cleavage Assays: These are quick and inexpensive methods to detect indels (insertions or deletions). They work by using enzymes that recognize and cleave mismatched DNA in heteroduplexes formed by re-annealing PCR products from a mixed population of edited and unedited sequences.
- Sequencing-Based Methods: These provide the most detailed view of the exact mutations introduced.
- Sanger Sequencing: A cost-effective method for targeted validation. The resulting chromatograms can be analyzed by software like TIDE (Tracking of Indels by Decomposition) to quantify editing efficiency and determine the spectrum of mutations [65].
- Next-Generation Sequencing (NGS): This high-throughput method offers both qualitative and quantitative analysis. It can accurately genotype edited cells, screen large numbers of clones, and is powerful for assessing potential off-target effects across the genome. PCR-free NGS library prep is recommended to avoid PCR bias [66] [65].
- Phenotypic Validation: After confirming the genetic edit, it is crucial to validate the functional consequence.
- Western Blotting: Used to confirm the knockout or modulation of the target protein [65].
- Functional Assays: These are custom-designed based on the expected biological function of the targeted gene (e.g., proliferation assays, differentiation assays, or high-content imaging for morphological changes) [65].
Q2: My validation control failed. What are the essential controls for a CRISPR experiment?
Proper controls are fundamental to interpreting your results and troubleshooting failures. The key controls are:
- Positive Control: A gRNA with known high efficiency, often targeting a well-characterized locus (like HPRT), should be included to verify that your entire workflow—from transfection to analysis—is functioning correctly [65].
- Negative Control: A "scrambled" or non-targeting gRNA that does not align to any genomic sequence should be used. This controls for any non-specific effects caused by the transfection procedure or the mere presence of the CRISPR machinery in the cell [65] [67].
- Transfection/Delivery Control: This is critical for confirming that the CRISPR components successfully entered the cells. This can be achieved by using a fluorophore reporter (e.g., OFP or GFP) expressed from the same vector as your gRNA or via co-transfection. Alternatively, antibiotic selection can be used to enrich for transfected cells [65].
Q3: I've confirmed the edit, but I'm worried about off-target effects. How can I check for these?
Assessing off-target activity is a critical step in validating your CRISPR experiment, especially for clinical applications.
- In Silico Prediction: Begin by using bioinformatics tools to predict potential off-target sites in the genome that have high sequence similarity to your gRNA.
- Targeted Sequencing: Once potential off-target sites are identified, you can perform deep sequencing of those specific genomic loci to check for unintended edits [65].
- Genome-Wide Methods: For a more comprehensive and unbiased screen, techniques like TEG-seq have been developed. TEG-seq is an in-cell method specifically designed to measure off-target cleavage events generated during gene editing [65].
Clinical Applications of CRISPR: From Trials to Diagnostics
Q4: What are some key clinical trials demonstrating the therapeutic potential of CRISPR?
CRISPR-based therapies have moved from concept to clinical reality, with several landmark trials showing promising results. The table below summarizes notable examples.
Table 1: Selected CRISPR Clinical Trials and Applications
| Disease Target | Therapeutic Approach | Key Findings / Status | Delivery Method | Citation |
|---|---|---|---|---|
| Sickle Cell Disease / β-Thalassemia | Ex vivo editing of hematopoietic stem cells (HSCs) to boost fetal hemoglobin. | First approved CRISPR-based medicine (Casgevy). Shows high efficacy in eliminating transfusion dependence. | Electroporation (ex vivo) | [68] [69] |
| Hereditary Transthyretin Amyloidosis (hATTR) | In vivo editing to reduce production of disease-causing TTR protein in the liver. | Phase I results show ~90% reduction in TTR protein levels, sustained for over 2 years. | Lipid Nanoparticles (LNP) - Systemic IV | [68] [69] |
| Hereditary Angioedema (HAE) | In vivo editing to reduce kallikrein B1 protein production in the liver. | Phase I/II shows 86% kallikrein reduction; majority of high-dose participants were attack-free. | Lipid Nanoparticles (LNP) - Systemic IV | [68] [69] |
| Leber Congenital Amaurosis (LCA) | In vivo editing to correct a mutation in the CEP290 gene causing blindness. | Ongoing Phase I/II trial to assess safety and vision improvement. | Adeno-associated virus (AAV5) | [68] |
| COVID-19 (Diagnostic) | CRISPR/Cas12a-based detection (ENHANCEv2) of SARS-CoV-2 viral RNA. | Clinical validation showed 96.7% agreement with RT-qPCR; results in 20 minutes (3 mins for lyophilized version). | Lyophilized reagent mix | [70] |
Q5: What are the main delivery methods used in these clinical applications, and why does it matter?
Delivery is one of the most significant challenges in CRISPR medicine. The choice of method depends on whether the editing is done ex vivo or in vivo.
- Ex Vivo Delivery: Cells are edited outside the body and then transplanted back into the patient. This is common for blood disorders.
- In Vivo Delivery: CRISPR components are delivered directly into the patient's body.
- Viral Vectors: Adeno-associated viruses (AAVs) are widely used due to their low immunogenicity and long-term expression. However, they have limited packaging capacity and can elicit immune responses [68].
- Non-Viral Vectors: Lipid Nanoparticles (LNPs) have emerged as a highly promising vehicle, especially for liver-targeted therapies. LNPs can encapsulate CRISPR mRNA and gRNA, and their use allows for the possibility of redosing, which is typically not safe with viral vectors [68] [69].
Q6: How is CRISPR being applied in diagnostics, as demonstrated during the COVID-19 pandemic?
CRISPR diagnostics leverage the collateral cleavage activity of certain Cas proteins (like Cas12a and Cas13) upon target recognition. This activity can be linked to a reporter molecule to generate a detectable signal.
- The ENHANCEv2 System: This is an engineered CRISPR/Cas12a system designed for SARS-CoV-2 detection. It uses a chimeric guide RNA and a modified LbCas12a enzyme for improved sensitivity and speed [70].
- Workflow:
- Sample Isothermal Amplification: Viral RNA from a nasopharyngeal swab is first amplified using RT-LAMP (Loop-Mediated Isothermal Amplification), which works at a constant temperature without the need for a thermal cycler.
- CRISPR Detection: The amplified product is added to the ENHANCEv2 reaction. If the viral target is present, Cas12a is activated and cleaves its target, followed by collateral cleavage of a reporter molecule.
- Readout: The result can be read via a fluorescence reader or a simple lateral flow paper strip, making it suitable for point-of-care settings [70].
- Advantages: This method is rapid (as quick as 20 minutes, or 3 minutes in a lyophilized format), sensitive (detecting down to a few copies of the virus), and portable, addressing many limitations of traditional RT-qPCR [70].
CRISPR-based Diagnostic Workflow
Connecting CRISPR to RNA-Seq: Addressing Low Mapping Rates
Q7: How could my CRISPR sample preparation impact RNA-Seq mapping rates?
While your core CRISPR experiment may be successful, the sample preparation steps can introduce specific challenges for subsequent RNA-Seq analysis. A common problem is a low mapping rate, where a large percentage of sequencing reads fail to align to the reference genome. In the context of samples treated with CRISPR (e.g., transfected or electroporated cells), several factors can contribute to this:
- Ribosomal RNA (rRNA) Contamination: This is a primary cause. In total RNA-Seq protocols without ribosomal RNA depletion, over 90% of your sequences can be rRNA. While rRNA genes are in the genome, reads often map to multiple locations and are discarded by aligners as multi-mapping reads, lowering the reported mapping rate [2].
- Sample Degradation: CRISPR procedures like electroporation can be stressful to cells, potentially leading to RNA degradation. Sequencing of degraded RNA yields short fragments that may be too short to map uniquely to the genome, and they are often classified as "too short" by aligners like STAR [2].
- Library Preparation Choice: The choice between poly-A selection and rRNA depletion is critical.
- Poly-A Selection: Enriches for messenger RNA (mRNA) by capturing polyadenylated tails. It is highly efficient but will miss non-polyadenylated RNAs.
- rRNA Depletion: Probes are used to remove ribosomal RNAs, preserving other RNA species like long non-coding RNAs (lncRNAs). This is necessary for prokaryotes or for FFPE samples where RNA is fragmented [32].
Table 2: Troubleshooting Low Mapping Rates in RNA-Seq from CRISPR Experiments
| Problem | Possible Cause | Solutions & Recommendations |
|---|---|---|
| High multi-mapping reads | Abundant ribosomal RNA (rRNA) sequences mapping to multiple genomic loci. | Use rRNA depletion instead of poly-A selection for total RNA-seq. Check if your reference genome contains all rRNA repeat regions [2]. |
| Many reads 'too short' | RNA degradation due to stressful transfection/electroporation or inefficient size selection. | Check RNA Integrity Number (RIN) before library prep. Perform adapter trimming before alignment. Optimize cell handling post-transfection [2]. |
| Low overall alignment | Using poly-A selection on non-polyadenylated RNA or on degraded samples (e.g., FFPE). | For low-quality RNA or bacterial samples, use rRNA depletion. For blood samples, consider adding globin depletion to improve detection of other transcripts [32]. |
| Strandedness confusion | Incorrectly specified library type during alignment, leading to mis-mapped reads. | Use tools like infer_experiment.py to determine strandness if metadata is lost. Specify the correct strandedness parameter in your aligner (e.g., STAR) [53]. |
Troubleshooting Low Mapping Rates
The Scientist's Toolkit: Key Reagents for CRISPR Validation
Table 3: Essential Reagents for CRISPR Experiment Validation
| Reagent / Kit | Primary Function | Application Context |
|---|---|---|
| T7 Endonuclease I / GeneArt GCD Kit | Enzymatic detection of indels by cleaving DNA heteroduplexes. | Rapid, cost-effective initial validation of editing efficiency [66] [65]. |
| Authenticase | A refined enzyme mixture for superior mismatch detection. | Detecting a broader range of CRISPR-induced mutations compared to T7E1 [66]. |
| Sanger Sequencing & TIDE Analysis | Precisely quantify editing efficiency and identify specific indels from sequence traces. | Detailed characterization of the editing spectrum in a mixed cell population [65]. |
| NEBNext Ultra II DNA Library Prep Kits | Prepare sequencing libraries for Next-Generation Sequencing (NGS). | Comprehensive genotyping and off-target assessment by amplicon or whole-genome sequencing [66]. |
| Anti-Cas9 Antibodies | Detect the presence and localization of Cas9 protein in cells via immunocytochemistry. | Confirm successful delivery and expression of CRISPR components [65]. |
| Fluorophore Reporters (e.g., OFP/GFP) | Visualize and quantify transfection/transduction efficiency via fluorescence. | Rapidly determine the percentage of cells that have received the CRISPR machinery [65]. |
Frequently Asked Questions (FAQs)
What is considered a "good" mapping rate for an RNA-seq experiment? For an ideal RNA-seq library from a well-annotated model organism, the percentage of reads mapped to the reference genome should typically be greater than or equal to 90%. Alignment rates close to 70% may still be acceptable depending on RNA quality and the reference genome used, but lower rates often indicate serious issues with the dataset [1].
Why does my total RNA-seq data have a lower mapping rate than a poly(A)-enriched dataset? Total RNA is composed of 80-98% ribosomal RNA (rRNA) [1]. Ribosomal RNAs are present in multiple copies across the genome, causing many reads to map to numerous genomic locations. These "multi-mapping" reads are often discarded by aligners, significantly reducing the reported uniquely mapped read percentage [2].
I have a high number of reads categorized as "too short" by my aligner. What does this mean? Reads classified as "too short" are those the aligner cannot map with high confidence. This is often because the initial read (after trimming) is so short it could match the reference virtually anywhere, providing low confidence in its correct origin. This situation arises when using highly degraded RNA, poor-quality libraries, or when reads have been trimmed too aggressively [2] [1].
Troubleshooting Guide: Diagnosing Low Mapping Rates
Low mapping rates can stem from issues at various stages of your experiment. The following diagnostic workflow helps systematically identify the root cause.
Common Causes and Solutions
The table below details the common issues identified in the diagnostic workflow and the recommended actions to resolve them.
| Root Cause | Underlying Issue | Recommended Solutions |
|---|---|---|
| Poor Reference Genome [1] | Incomplete genome assembly or poor annotation for non-model organisms. | Use the latest, unmasked reference genome. Align to chromosomes, contigs, and "decoy" sequences for a fuller picture [71]. |
| Inadequate Read Preprocessing [47] | Adapter contamination or low-quality bases interfere with alignment. | Use tools like FastQC for QC and Trimmomatic or fastp for adapter removal and quality trimming [19] [71]. |
| RNA Degradation / Short Reads [2] [72] | Highly degraded RNA results in fragments too short for confident alignment. | Check RNA Integrity Number (RIN); aim for RIN 7-10. Avoid over-trimming during preprocessing [71]. |
| High Ribosomal RNA Content [2] [1] | rRNA constitutes most of total RNA. Its reads map to multiple genomic locations and are discarded. | For total RNA-seq, ensure efficient rRNA depletion (e.g., with RiboCop). For mRNA focus, use poly(A) selection [71] [1]. |
| High Multi-Mapping Reads [2] [72] | Reads from repetitive regions (rRNA, pseudogenes) align equally well to multiple loci. | Consider increasing the aligner's multimapping limit (e.g., STAR's --outFilterMultimapNmax). BLAST unmapped reads to identify origin [2] [72]. |
| Tool or Reagent | Primary Function | Role in Improving Mapping Rates |
|---|---|---|
| RiboCop rRNA Depletion Kit | Efficiently removes ribosomal RNA from total RNA samples. | Directly reduces the proportion of rRNA-derived reads, which are a major source of multi-mapping and low unique alignment rates [71]. |
| Spike-In RNA Variants (SIRVs) | External RNA controls with known sequences and abundances. | Provides a ground-truth dataset to benchmark the entire workflow, including quantification accuracy and alignment performance [1]. |
| Agilent TapeStation | Assesses RNA integrity (RIN) from sample extracts. | Identifies degraded RNA samples before library prep, preventing issues with short, un-mappable fragments [71]. |
| Trimmomatic / fastp | Removes adapter sequences and low-quality bases from raw sequencing reads. | Prevents adapter contamination and low-quality bases from interfering with the alignment process, thereby improving mappability [19] [47]. |
| STAR Aligner | Splice-aware aligner for mapping RNA-seq reads to a reference genome. | Accurately aligns reads across exon-intron boundaries. Its parameters can be tuned to handle multimapping reads more effectively [2] [71]. |
| Qualimap / RSeQC | Performs post-alignment quality control and analysis. | Evaluates read distribution across genomic features, helping diagnose issues like rRNA contamination or genomic DNA contamination [19] [1]. |
Conclusion
Addressing low RNA-seq mapping rates requires an integrated approach spanning experimental design, library preparation, computational analysis, and rigorous validation. The most effective strategies combine robust rRNA depletion, optimized alignment parameters tailored to specific biological contexts, and systematic quality control. As RNA-seq applications expand into clinical diagnostics and therapeutic development, maintaining high mapping rates becomes increasingly critical for generating reliable biological insights. Future directions should focus on developing more intelligent alignment algorithms, standardized benchmarking datasets, and integrated workflows that automatically diagnose and correct common mapping issues. By implementing the comprehensive framework outlined here, researchers can significantly improve data quality, enhance reproducibility, and accelerate discoveries in biomedical research and drug development.
References
- 1. Tertiary Data Analysis of RNA-Seq data | RNA Lexicon [https://www.lexogen.com/blog/rna-lexicon-data-analysis-and-quality-control-tertiary-analysis/]
- 2. Why total RNA-seq usually yields low mapping rate? [https://bioinformatics.stackexchange.com/questions/2897/why-total-rna-seq-usually-yields-low-mapping-rate]
- 3. why low mapping rates for RNAseq? [https://www.seqanswers.com/forum/applications-forums/rna-sequencing/1193-why-low-mapping-rates-for-rnaseq]
- 4. Comparison of rRNA depletion methods for efficient ... [https://www.nature.com/articles/s41598-022-09710-y]
- 5. Impact of RNA degradation on next-generation sequencing ... [https://www.sciencedirect.com/science/article/pii/S0888754322001744]
- 6. Adapter dimer contamination in sRNA‐sequencing ... [https://pmc.ncbi.nlm.nih.gov/articles/PMC11080836/]
- 7. NEBNext® RNA Library Prep Kit Troubleshooting Guide ... [https://www.neb.com/en-us/tools-and-resources/troubleshooting-guides/nebnext-ultratm-directional-rna-kit-troubleshooting-guide?srsltid=AfmBOopH0egNXEiivVq23VPa5L88GSZW00LadMmAtVLs0pJfFSRQezHE]
- 8. Detrimental effects of duplicate reads and low complexity ... [https://bmcbioinformatics.biomedcentral.com/articles/10.1186/1471-2105-16-S13-S10]
- 9. How to Troubleshoot Sequencing Preparation Errors (NGS ... [https://www.cd-genomics.com/resource-sequencing-preparation-troubleshooting.html]
- 10. Bias in RNA-seq Library Preparation: Current Challenges ... [https://pmc.ncbi.nlm.nih.gov/articles/PMC8079181/]
- 11. Closing Human Reference Genome Gaps: Identifying and ... [https://pmc.ncbi.nlm.nih.gov/articles/PMC7407462/]
- 12. Recovery of non-reference sequences missing from the ... [https://bmcgenomics.biomedcentral.com/articles/10.1186/s12864-019-6107-1]
- 13. First complete, gapless sequence of a human genome ... [https://news.ucsc.edu/2022/03/t2t-genome/]
- 14. Impact of human gene annotations on RNA-seq differential ... [https://bmcgenomics.biomedcentral.com/articles/10.1186/s12864-021-08038-7]
- 15. Impact of genome build on RNA-seq interpretation and ... [https://pmc.ncbi.nlm.nih.gov/articles/PMC11267525/]
- 16. The Importance of Quality Control in RNA-Seq Analysis [https://ngscloud.com/the-importance-of-quality-control-in-rna-seq-analysis/]
- 17. Questions about low mapping rates · Issue #533 [https://github.com/COMBINE-lab/salmon/issues/533]
- 18. RNA degradation patterns in cardiac tissues kept at different ... [https://journals.plos.org/plosone/article?id=10.1371/journal.pone.0323786]
- 19. a practical guide to RNA sequencing data analysis [https://pmc.ncbi.nlm.nih.gov/articles/PMC12599993/]
- 20. A systematic benchmark of Nanopore long-read RNA ... [https://www.nature.com/articles/s41592-025-02623-4]
- 21. Ambiguous genes due to aligners and their impact on RNA ... [https://www.nature.com/articles/s41598-023-41085-6]
- 22. accurate and repeat tolerant realignment of RNA-seq reads [https://pmc.ncbi.nlm.nih.gov/articles/PMC4605292/]
- 23. Troubleshooting a low mapping rate on SALMON (40-60% ... [https://github.com/COMBINE-lab/salmon/issues/571]
- 24. Low mapping rate due to rRNA [https://www.biostars.org/p/9526056/]
- 25. Low mapping rate in RNA-seq · Issue #844 · alexdobin/STAR [https://github.com/alexdobin/STAR/issues/844]
- 26. Comparison of RNA-Sequencing Methods for Degraded RNA [https://www.mdpi.com/1422-0067/25/11/6143]
- 27. EFFICIENT RIBOSOMAL RNA DEPLETION FROM ... [https://pmc.ncbi.nlm.nih.gov/articles/PMC12123297/]
- 28. Illumina Ribo-Zero Plus rRNA Depletion Kit [https://www.illumina.com/products/by-type/molecular-biology-reagents/ribo-zero-plus-rrna-depletion.html]
- 29. Mapping RNA-seq Reads with STAR - PMC [https://pmc.ncbi.nlm.nih.gov/articles/PMC4631051/]
- 30. RNA-seq FAQs [https://www.takarabio.com/learning-centers/next-generation-sequencing/rna-seq/rna-seq-faqs?srsltid=AfmBOopE6YhqE708zv84n08Lm67Tt8uF4_yEcEHGlHagIonDq1Z9lfbR]
- 31. Reducing GC & PCR Bias in Whole-Genome Sequencing [https://www.revvity.com/blog/understanding-impact-gc-and-pcr-biases-whole-genome-sequencing]
- 32. RNA-Seq Frequently Asked Questions [https://web.genewiz.com/faqs/rna-seq]
- 33. Differences in mapping rates w/ SAF mode · Issue #479 [https://github.com/COMBINE-lab/salmon/issues/479]
- 34. Could you explain the difference between STAR, ... [https://www.biostars.org/p/400121/]
- 35. Evaluation of Seven Different RNA-Seq Alignment Tools ... [https://pmc.ncbi.nlm.nih.gov/articles/PMC7084517/]
- 36. A comparison of transcriptome analysis methods with ... [https://bmcgenomics.biomedcentral.com/articles/10.1186/s12864-022-08465-0]
- 37. The importance of data transformation in RNA-Seq ... [https://pmc.ncbi.nlm.nih.gov/articles/PMC11812149/]
- 38. A real-world multi-center RNA-seq benchmarking study ... [https://www.nature.com/articles/s41467-024-50420-y]
- 39. RNA-seq mapping rate [https://www.biostars.org/p/351505/]
- 40. DecoyDatabase [https://openms.de/documentation/TOPP_DecoyDatabase.html]
- 41. Differential expression, manipulation, and visualization of ... [https://www.bioconductor.org/help/course-materials/2015/BioC2015/bioc2015rnaseq.html]
- 42. A survey of best practices for RNA-seq data analysis [https://genomebiology.biomedcentral.com/articles/10.1186/s13059-016-0881-8]
- 43. Reference-based RNA-Seq data analysis [https://training.galaxyproject.org/training-material/topics/transcriptomics/tutorials/ref-based/tutorial.html]
- 44. Integration of Bulk RNA-seq Pipeline Metrics for Assessing ... [https://pmc.ncbi.nlm.nih.gov/articles/PMC12236924/]
- 45. Troubleshooting Guide: RNA Extraction for Sequencing [https://rna.cd-genomics.com/resource/troubleshooting-rna-extraction.html]
- 46. Best practices for RNA-seq success, part I: Optimizing ... [https://www.takarabio.com/about/bioview-blog/tips-and-troubleshooting/best-practices-for-rna-seq-optimizing-sample-prep?srsltid=AfmBOoqV6AA6NFC_S5GlIq9jP6CxQ8RGp9GHdxGgOOWmeURyTBg3tXR_]
- 47. A comprehensive workflow for optimizing RNA-seq data analysis [https://bmcgenomics.biomedcentral.com/articles/10.1186/s12864-024-10414-y]
- 48. A comprehensive workflow for optimizing RNA-seq data analysis [https://pmc.ncbi.nlm.nih.gov/articles/PMC11197194/]
- 49. RNA-Seq Selection Guide: How to Start Designing Your ... [https://blog.genewiz.com/rna-seq-selection-guide-how-to-start-designing-your-project]
- 50. Evaluating the impact of sequencing error correction for ... [https://pmc.ncbi.nlm.nih.gov/articles/PMC4983418/]
- 51. A Beginner's Guide to Analysis of RNA Sequencing Data [https://pmc.ncbi.nlm.nih.gov/articles/PMC6096346/]
- 52. [Tutorial] Bulk RNA-seq DE analysis [https://informatics.fas.harvard.edu/resources/tutorials/differential-expression-analysis/]
- 53. FAQs / Reference-based RNA-Seq data analysis ... [https://training.galaxyproject.org/training-material/topics/transcriptomics/tutorials/ref-based/faqs/]
- 54. A comprehensive assessment of RNA-seq accuracy ... [https://pmc.ncbi.nlm.nih.gov/articles/PMC4321899/]
- 55. Comparative analysis of library preparation approaches for ... [https://www.nature.com/articles/s41598-025-12992-7]
- 56. Small RNA-seq best practices for challenging samples. [https://www.revvity.com/blog/small-rna-seq-best-practices-challenging-samples]
- 57. Top 3 tips for low-input RNA-seq success [https://www.qiagen.com/us/knowledge-and-support/knowledge-hub/science-matters/genomics/top-3-tips-for-low-input-rna-seq-success]
- 58. 6 Key Considerations for FFPE Sample RNA-Seq [https://www.bioradiations.com/6-key-considerations-for-ffpe-sample-rna-seq-223/]
- 59. Ultra-Low Input RNA Sequencing | Lexogen NGS Services [https://www.lexogen.com/services/ultra-low-input-rna/]
- 60. RNAseq mapping issues - usegalaxy.eu support [https://help.galaxyproject.org/t/rnaseq-mapping-issues/15574]
- 61. Enabling whole genome sequencing analysis from FFPE ... [https://www.nature.com/articles/s41467-025-65654-7]
- 62. Generative and integrative modeling for transcriptomics with ... [https://pmc.ncbi.nlm.nih.gov/articles/PMC12486589/]
- 63. FFPE RNA Sequencing [https://www.lexogen.com/services/ffpe-rna-seq/]
- 64. Improving RNA-Seq Library Preparation for Accuracy [https://cellcarta.com/science-hub/rna-seq-library-preparation-watchmaker-workflow/]
- 65. TALEN and CRISPR Validation Tools [https://www.thermofisher.com/us/en/home/life-science/genome-editing/crispr-validation.html]
- 66. Validation of CRISPR-based Gene Editing [https://www.neb.com/en-us/products/crispr-cas-gene-editing/crispr-validation?srsltid=AfmBOoogg6ZR2KzoSDcPnFIiCn575qRvYZ843yRD1VaFuxN0Bg6eRxPi]
- 67. How To Analyze CRISPR Screen Data For Complete Beginners [https://ngs101.com/how-to-analyze-crispr-screen-data-for-complete-beginners-from-fastq-files-to-biological-insights/]
- 68. Clinical applications of the CRISPR/Cas9 genome-editing ... [https://pmc.ncbi.nlm.nih.gov/articles/PMC10425811/]
- 69. CRISPR Clinical Trials: A 2025 Update [https://innovativegenomics.org/news/crispr-clinical-trials-2025/]
- 70. Clinical validation of engineered CRISPR/Cas12a for rapid ... [https://www.nature.com/articles/s43856-021-00066-4]
- 71. 10 Best Practices for Effective RNA-Seq Data Analysis - Focal [https://www.getfocal.co/post/10-best-practices-for-effective-rna-seq-data-analysis]
- 72. Low percent of RNA-seq reads mapping [https://www.biostars.org/p/417907/]