Validating Histone Modification ChIP-seq with qPCR: A Strategic Guide for Robust Epigenetic Analysis
This article provides a comprehensive framework for researchers and drug development professionals to validate genome-wide histone modification ChIP-seq data using targeted ChIP-qPCR.
Validating Histone Modification ChIP-seq with qPCR: A Strategic Guide for Robust Epigenetic Analysis
Abstract
This article provides a comprehensive framework for researchers and drug development professionals to validate genome-wide histone modification ChIP-seq data using targeted ChIP-qPCR. It covers the foundational principles of both techniques, outlines a step-by-step methodological workflow for cross-validation, addresses common troubleshooting and optimization challenges, and presents a comparative analysis of validation strategies. By synthesizing these core intents, the guide empowers scientists to enhance the reliability and reproducibility of their epigenetic findings, which is crucial for advancing biomedical research and clinical applications.
Understanding the Pillars: ChIP-seq and ChIP-qPCR in Epigenetic Research
The Core Principle of Chromatin Immunoprecipitation for Histone Modifications
Chromatin Immunoprecipitation (ChIP) has emerged as a cornerstone technique in epigenetic research, enabling scientists to investigate in vivo interactions between proteins and DNA across the entire genome. When applied to histone modifications, this powerful method allows researchers to decipher the "histone code"—a complex language of post-translational modifications that regulates gene expression without altering the underlying DNA sequence [1] [2]. Histone modifications, including methylation, acetylation, and phosphorylation, play critical roles in fundamental biological processes such as gene activation and silencing, DNA repair, and cell cycle control [2]. The core principle of ChIP revolves around selectively enriching specific chromatin fragments using antibodies that recognize particular histone modifications, thereby creating a snapshot of the epigenomic landscape at a given cellular state [3] [1]. This technique has become indispensable for understanding how epigenetic mechanisms contribute to development, disease progression, and cellular identity, with applications spanning from basic research to drug discovery [2] [4].
Core Principle and Methodological Variations
The fundamental workflow of ChIP for histone modifications involves a series of methodical steps designed to capture and identify genomic regions associated with specific histone marks. The process begins with stabilizing protein-DNA interactions, typically using formaldehyde crosslinking, though native protocols without crosslinking are also employed for certain histone modifications [3] [5]. Chromatin is then fragmented into manageable sizes, either through sonication or enzymatic digestion with micrococcal nuclease (MNase), with the choice of method significantly impacting resolution and outcomes [3] [6]. The critical step involves immunoprecipitation—using highly specific antibodies to selectively enrich for chromatin fragments bearing the histone modification of interest [7]. Following immunoprecipitation, crosslinks are reversed, and the associated DNA is purified for downstream analysis [1]. The final analytical phase utilizes various technologies to identify the enriched DNA fragments, with quantitative PCR (qPCR) for targeted validation and next-generation sequencing (ChIP-seq) for genome-wide discovery representing the most common approaches [8] [4].
Comparative Analysis of ChIP Methodologies
Researchers have developed several ChIP-derived methodologies tailored to different research goals and resources. The selection of an appropriate method represents a critical decision point that balances resolution, genomic coverage, technical requirements, and cost [9].
Table 1: Comparison of Key ChIP-based Technologies for Histone Modification Analysis
| Technology | Principle | Genomic Coverage | Resolution | Primary Applications |
|---|---|---|---|---|
| ChIP-qPCR | Amplifies enriched DNA via qPCR | Specific known gene regions | Lower, constrained by primer design | Targeted validation of known regions [8] |
| ChIP-chip | Hybridization of enriched DNA to microarrays | Pre-determined genomic regions on array | Lower, dependent on probe density | Analysis of protein binding in specific genomic regions [2] [9] |
| ChIP-seq | High-throughput sequencing of enriched DNA | Genome-wide | Extremely high, precise binding site localization | Genome-wide discovery of histone modification patterns [4] [9] |
The selection between these methodologies depends heavily on the research objective. For hypothesis-driven research focusing on specific genomic regions, ChIP-qPCR provides a cost-effective and efficient solution [8]. When investigating histone modifications across defined genomic regions such as promoter arrays, ChIP-chip offers a balanced approach [2] [9]. For discovery-driven research aiming to map histone modifications across the entire genome without prior assumptions, ChIP-seq delivers comprehensive coverage and superior resolution [4] [9].
Experimental Design and Protocol Optimization
Critical Reagents and Experimental Components
Successful ChIP experiments require careful selection and optimization of multiple experimental components, each contributing significantly to the quality and reliability of the final results [3] [5].
Table 2: Essential Research Reagent Solutions for Histone Modification ChIP
| Reagent/Category | Function | Key Considerations |
|---|---|---|
| Antibodies | Recognize specific histone modifications | Specificity validation crucial; batch-to-batch variability possible [6] [7] |
| Crosslinking Agents | Stabilize protein-DNA interactions | Formaldehyde concentration and time require optimization [5] |
| Chromatin Fragmentation | Shear chromatin to appropriate sizes | Sonication (crosslinked ChIP) vs. MNase digestion (native ChIP) [3] [6] |
| Magnetic Beads | Capture antibody-bound complexes | Protein A/G bead capacity and non-specific binding should be tested [1] |
| Protease Inhibitors | Prevent protein degradation during processing | Essential for preserving chromatin integrity [3] |
| DNA Purification | Isolate DNA after crosslink reversal | Phenol-chloroform extraction or column-based methods [3] |
Methodological Variations: X-ChIP versus N-ChIP
Two primary ChIP methodological frameworks have been developed, each with distinct advantages for particular applications:
Cross-linked Chromatin Immunoprecipitation (X-ChIP) utilizes formaldehyde to covalently link proteins to DNA, preserving transient interactions [5]. This approach typically employs sonication for chromatin fragmentation and is considered the more versatile method as it can be applied to various chromatin-associated proteins [5]. However, formaldehyde crosslinking can introduce technical artifacts, including epitope masking and uneven shearing efficiency between open and closed chromatin regions [6].
Native Chromatin Immunoprecipitation (N-ChIP) bypasses crosslinking and uses micrococcal nuclease (MNase) to digest linker DNA between nucleosomes [3]. This approach is particularly well-suited for histone modifications as it preserves native chromatin structure and produces mononucleosome-sized fragments that yield higher resolution data [3]. Studies comparing both methods in challenging tissues like strawberry fruits, which contain high polysaccharide content, demonstrated that N-ChIP provided superior signal-to-noise ratios for both active (H3K36me3) and repressive (H3K9me2) histone marks [3].
The decision between X-ChIP and N-ChIP should be guided by the specific research goals and the nature of the histone modification being studied. For transcription factors or co-regulatory proteins, X-ChIP is often necessary, while for core histone modifications, N-ChIP frequently yields superior results [3] [5].
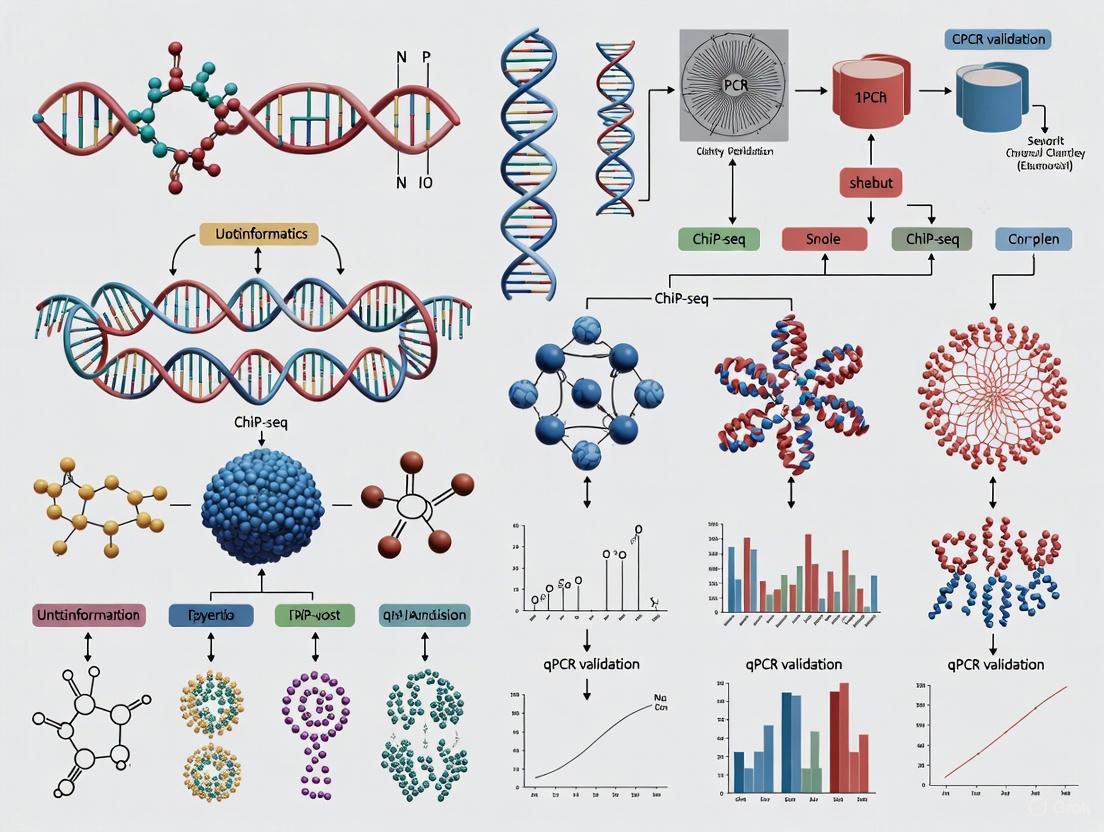
Workflow Visualization
The following diagram illustrates the core workflow for ChIP analysis of histone modifications, highlighting the parallel paths for different detection methods:
Validation and Data Analysis Approaches
ChIP-qPCR: The Gold Standard for Validation
Quantitative PCR represents the most widely employed method for targeted validation of ChIP experiments, providing a sensitive and quantitative measure of histone modification enrichment at specific genomic loci [5] [8]. The approach offers several advantages, including technical accessibility, cost-effectiveness for analyzing limited numbers of loci, and rapid turnaround time [8]. Successful implementation requires careful optimization of multiple parameters, with primer design and reaction efficiency being particularly critical [8].
Two primary detection chemistries are employed in ChIP-qPCR:
SYBR Green is a cost-effective intercalating dye that fluoresces when bound to double-stranded DNA, but requires rigorous validation of primer specificity to avoid false positives from primer dimers or non-specific amplification [8].
TaqMan Probe systems utilize sequence-specific probes with reporter and quencher dyes, providing enhanced specificity through an additional hybridization step, though at increased cost and design complexity [8].
For both detection methods, proper qPCR optimization is essential. Reactions should demonstrate efficiency between 95-105%, as calculated from standard curves generated using serial dilutions of input DNA [8]. Amplification of appropriate control regions is crucial for data interpretation, including positive control regions known to carry the modification and negative control regions lacking the modification [5] [8].
Data Normalization Strategies
Appropriate data normalization is critical for accurate interpretation of ChIP-qPCR results. Two primary normalization approaches are commonly employed:
The Percent Input Method calculates enrichment as a percentage of the total chromatin used in the immunoprecipitation, using the formula: %Input = 2^(-ΔCt[normalized ChIP]), where ΔCt = Ct[ChIP] - Ct[Input] [8]. This approach directly measures recovery efficiency but requires careful quantification of input DNA.
The Fold Enrichment Method compares enrichment at target regions to control regions lacking the histone modification, using the formula: Fold enrichment = 2^(ΔΔCt), where ΔΔCt = ΔCt[negative control] - ΔCt[positive target] [8]. This approach highlights specific enrichment but depends on appropriate control region selection.
ChIP-seq Analysis Workflow
For genome-wide studies, ChIP-seq data analysis follows a multi-step process that transforms raw sequencing reads into biologically interpretable information [4]. The standard workflow includes:
Quality Control and Read Preprocessing involving assessment of sequence quality, adapter trimming, and filtering of low-quality reads [4].
Read Alignment to a reference genome using specialized tools optimized for handling ChIP-seq data characteristics [4].
Peak Calling to identify genomic regions with statistically significant enrichment over background, employing algorithms tailored to different histone modification types (point-source, broad-source, or mixed-source) [7] [10].
Differential Analysis comparing enrichment between experimental conditions using tools like histoneHMM, which is specifically designed for modifications with broad domains such as H3K27me3 and H3K9me3 [10].
Biological Interpretation through integration with complementary datasets (e.g., gene expression, chromatin accessibility) and functional annotation of enriched regions [4].
Advanced Applications and Integrative Analysis
Chromatin State Annotation
Advanced ChIP-seq applications enable systems-level understanding of epigenetic regulation. Chromatin state annotation integrates multiple histone modification datasets to segment the genome into functionally distinct elements, providing insights into regulatory elements and their activity states [4]. This approach has revealed conserved principles of chromatin organization and cell-type-specific regulatory landscapes that define cellular identity [4].
Single-Cell Epigenomics
Recent methodological advances have extended ChIP to the single-cell level, addressing cellular heterogeneity within complex tissues and cancer ecosystems [4]. Single-cell ChIP-seq methodologies, while still technically challenging, offer unprecedented resolution to examine epigenetic variation between individual cells, potentially revealing rare cell populations and lineage relationships [4].
Multi-Omics Integration
The most powerful modern approaches integrate ChIP-seq data with other genomic technologies to build comprehensive regulatory models. For example, combining histone modification data with RNA-seq expression profiles allows researchers to link epigenetic states to transcriptional outputs [10]. Studies comparing H3K27me3 patterns between rat strains identified differentially modified regions that showed significant overlap with differentially expressed genes, highlighting the functional impact of epigenetic variation [10].
Chromatin Immunoprecipitation provides a powerful experimental framework for investigating histone modifications and their functional roles in gene regulation. The core principle of selective immunoenrichment remains constant across technological implementations, but methodological details significantly impact data quality and biological insights. As a cornerstone technique in modern epigenetics, ChIP continues to evolve with improvements in antibody specificity, sequencing technologies, and computational分析方法. When properly validated with qPCR and integrated with complementary genomic approaches, ChIP-based methods offer unprecedented insights into the epigenetic mechanisms underlying development, disease, and cellular function, making them indispensable tools for biomedical researchers and drug development professionals.
Chromatin Immunoprecipitation followed by sequencing (ChIP-seq) has revolutionized our ability to map the epigenomic landscape with unprecedented resolution. This powerful methodology enables researchers to precisely localize histone modifications and DNA-associated proteins across the entire genome, providing critical insights into gene regulatory mechanisms. While early chromatin studies relied on locus-specific methods like ChIP-qPCR for validation, the advent of high-throughput sequencing has transformed our capacity to investigate epigenetic phenomena at a systems level. The transition from targeted validation to global analysis represents a paradigm shift in epigenetics research, allowing scientists to connect specific histone marks with transcriptional outcomes across diverse biological contexts—from development and differentiation to disease pathogenesis [11] [12].
A foundational principle underlying ChIP-seq applications is that distinct histone modifications correlate with specific chromatin states and functions. For instance, H3K4me3 marks active promoters, H3K27ac identifies active enhancers, H3K36me3 is associated with transcriptional elongation, while H3K27me3 and H3K9me3 designate repressive chromatin domains [12]. Understanding this "histone code" enables researchers to interpret ChIP-seq data within a functional framework, connecting epigenetic patterns to gene regulatory outcomes in various biological systems.
Antibody Performance: The Critical Determinant of ChIP-seq Success
Comparative Antibody Performance Standards
The quality of ChIP-seq results depends fundamentally on antibody specificity and sensitivity. Antibodies must recognize their intended targets with high affinity while minimizing non-specific binding. Recombinant rabbit monoclonal antibodies have emerged as superior reagents due to their greater lot-to-lot reproducibility compared to polyclonal alternatives [13]. When evaluating antibodies for histone mark ChIP-seq, researchers should consider several validation criteria:
- Specificity Verification: Antibodies should be validated for target specificity across multiple applications, providing reduced non-specific binding and high signal-to-noise ratio in ChIP-seq [13]
- Application-Specific Testing: Antibodies demonstrating good performance in ChIP-qPCR do not necessarily perform well for ChIP-seq, which requires more extensive capture of the target protein across numerous gene loci [13]
- Cross-Platform Compatibility: Ideal antibodies function robustly across various ChIP protocols, including commercial kits and customized laboratory workflows [13]
Table 1: Key Antibody Validation Criteria for Histone Mark ChIP-seq
| Validation Parameter | Importance for ChIP-seq | Quality Indicators |
|---|---|---|
| Specificity | Reduces false-positive peaks | Minimal non-specific binding; clean background in controls |
| Sensitivity | Detects genuine binding events | High signal-to-noise ratio; robust enrichment over input |
| Reproducibility | Ensures experimental consistency | Low lot-to-lot variability; consistent performance across replicates |
| Application Validation | Guarantees protocol compatibility | Explicit testing for ChIP-seq, not just ChIP-qPCR |
Experimental Data on Antibody Performance
Comparative studies have demonstrated significant performance variability among antibodies targeting the same histone modifications. For example, Cell Signaling Technology reports side-by-side comparisons of their ChIP-seq validated antibodies against competitors, providing empirical data on sensitivity and specificity [13]. These comparisons typically evaluate:
- Peak enrichment at known genomic loci
- Signal-to-noise ratios across the genome
- Reproducibility between technical and biological replicates
- Consistency with established epigenetic patterns
The ENCODE consortium has established rigorous antibody characterization standards, requiring thorough validation according to consortium guidelines before use in official projects [14]. These standards help ensure that published ChIP-seq data meets minimum quality thresholds and is suitable for comparative analyses.
Methodological Innovations: From Standard ChIP-seq to Advanced Applications
Standard Histone Mark ChIP-seq Protocol
The fundamental ChIP-seq protocol involves crosslinking proteins to DNA in living cells, chromatin fragmentation, immunoprecipitation with specific antibodies, followed by library preparation and high-throughput sequencing [12]. Key methodological considerations include:
- Crosslinking: Typically using formaldehyde to preserve protein-DNA interactions
- Chromatin Fragmentation: Employing either sonication or enzymatic digestion (e.g., micrococcal nuclease)
- Immunoprecipitation: Using validated antibodies against specific histone modifications
- Library Preparation: Adapting DNA for high-throughput sequencing platforms
- Sequencing: Typically using Illumina platforms for short-read sequencing [12]
Table 2: Critical Experimental Parameters for Histone Mark ChIP-seq
| Experimental Step | Key Considerations | Quality Control Checkpoints |
|---|---|---|
| Cell Fixation | Formaldehyde concentration and incubation time | Crosslinking efficiency tests |
| Chromatin Preparation | Cell lysis efficiency; nuclear integrity | Microscopic examination; DNA quantification |
| Chromatin Shearing | Optimization of sonication or MNase digestion | Fragment size analysis (200-600 bp ideal) |
| Immunoprecipitation | Antibody titration; incubation conditions | Post-IP DNA quantification |
| Library Preparation | Adapter ligation; PCR amplification | Library size distribution; quantification |
Advanced Methodological Extensions
Recent technological advances have expanded ChIP-seq applications beyond standard mapping of histone modifications. Micro-C-ChIP, introduced in 2025, combines Micro-C with chromatin immunoprecipitation to map 3D genome organization at nucleosome resolution for defined histone modifications [15]. This method enables researchers to:
- Profile histone mark-specific 3D genome architecture in various cell types
- Identify extensive promoter-promoter contact networks
- Resolve distinct 3D architecture of bivalent promoters in embryonic stem cells
- Map chromatin interactions at nucleosome resolution with reduced sequencing costs compared to Hi-C [15]
This integration of chromatin conformation capture with immunoprecipitation represents a significant advancement for studying the spatial organization of specific chromatin states.
Computational Analysis of Histone Mark ChIP-seq Data
Standard Analytical Workflow
Computational analysis of histone mark ChIP-seq data involves multiple processing steps, each with specific quality control checkpoints:
- Read Mapping: Short sequencing reads are aligned to a reference genome using tools like Bowtie, BWA, or SOAP2 [11]
- Peak Calling: Regions of significant enrichment are identified using algorithms such as MACS2, SICER2 (for broad domains), or JAMM [11] [16]
- Quality Assessment: Metrics include library complexity (NRF>0.9), sequencing depth, and FRiP scores [14]
- Differential Binding: Tools specifically designed for histone marks detect changes between conditions [16]
The ENCODE consortium has established standardized pipelines for histone ChIP-seq analysis, with specific requirements for different types of histone modifications [14]. For example, broad histone marks like H3K27me3 require 45 million usable fragments per replicate, while narrow marks like H3K4me3 require 20 million usable fragments per replicate [14].
Differential Analysis Tools and Performance
A comprehensive assessment published in 2022 evaluated 33 computational tools for differential ChIP-seq analysis, revealing that performance is strongly dependent on peak size and shape as well as the biological regulation scenario [16]. Key findings include:
- bdgdiff (MACS2), MEDIPS, and PePr showed the highest median performance across various scenarios
- Tool performance varies significantly between transcription factor peaks (sharp, narrow), sharp histone marks (H3K4me3, H3K27ac), and broad histone marks (H3K27me3, H3K36me3)
- Biological scenario affects performance, with different tools optimal for balanced changes (50:50 ratio of increasing/decreasing peaks) versus global changes (100:0 ratio) [16]
Table 3: Recommended Differential Analysis Tools for Histone Marks
| Histone Mark Type | Representative Marks | Recommended Tools | Performance Considerations |
|---|---|---|---|
| Sharp/Narrow Marks | H3K4me3, H3K27ac, H3K9ac | bdgdiff, MEDIPS, PePr | Superior performance with clear, focal peaks |
| Broad Marks | H3K27me3, H3K36me3, H3K9me3 | SICER2-based approaches | Better detection of diffuse domains |
| Mixed Patterns | H3K9me3 (repetitive regions) | Custom parameter optimization | Requires special handling for repetitive regions |
Normalization Strategies: Accounting for Global Changes in Histone Modification
Spike-in Normalization for Global Changes
A significant challenge in comparative ChIP-seq analysis is proper normalization, particularly when global changes in histone modification levels occur between conditions. Spike-in normalization has emerged as a powerful approach to address this limitation [17]. This method involves:
- Adding exogenous chromatin from another species (e.g., Drosophila) to each sample prior to immunoprecipitation
- Using the consistent spike-in signal as an internal control to normalize for technical variation
- Accounting for global changes in histone mark abundance that would confound standard read-depth normalization [17]
Properly implemented spike-in normalization can accurately quantify changes in histone modification levels across different conditions, as demonstrated in titration experiments with H3K79me2 and H3K9ac [17].
Implementation Considerations and Pitfalls
While powerful, spike-in normalization requires careful implementation to avoid erroneous results. Common pitfalls include:
- Inappropriate alignment strategies that separately map reads to spike-in and target genomes
- Large variability in spike-in to sample chromatin ratios between replicates
- Deviation from original method recommendations without proper validation
- Insufficient read depth for spike-in chromatin, leading to inaccurate normalization factors [17]
Successful implementation requires maintaining consistent spike-in to sample ratios, using appropriate alignment strategies that account for evolutionary conservation, and including sufficient biological replicates to detect unexpected variation.
The Scientist's Toolkit: Essential Research Reagent Solutions
Table 4: Key Research Reagents for Histone Mark ChIP-seq
| Reagent Category | Specific Examples | Function & Importance |
|---|---|---|
| Validated Antibodies | Anti-H3K4me3 (CST #9751S), Anti-H3K27me3 (CST #9733S), Anti-H3K9me3 (CST #9754S) [12] | Target-specific immunoprecipitation; critical for specificity |
| Chromatin Preparation Kits | SimpleChIP Enzymatic Chromatin IP Kit (CST) [13] | Standardized chromatin fragmentation and IP protocols |
| Spike-in Controls | Drosophila chromatin, SNAP-ChIP spike-in nucleosomes [17] | Normalization for global changes in histone modifications |
| Library Prep Kits | Illumina ChIP-seq Library Prep Kits | Preparation of sequencing libraries from low-input DNA |
| Quality Control Assays | Bioanalyzer/TapeStation reagents | Assessment of DNA fragment size distribution and library quality |
ChIP-seq technology has fundamentally transformed our ability to map the epigenomic landscape, providing unprecedented insights into the genomic distribution of histone modifications and their relationship to gene regulatory mechanisms. As methodological refinements continue to emerge—from improved antibody reagents to advanced computational tools—the resolution and accuracy of histone mark mapping will further increase. The successful application of ChIP-seq, however, remains dependent on rigorous experimental design, appropriate controls, and thoughtful data interpretation within relevant biological contexts. By integrating these methodological advances with biological insight, researchers can continue to decipher the complex language of histone modifications and their role in development, disease, and therapeutic intervention.
In the era of high-throughput genomics, chromatin immunoprecipitation followed by sequencing (ChIP-seq) has become the standard for generating genome-wide maps of histone modifications and transcription factor binding. However, this powerful hypothesis-generating approach creates a critical need for targeted validation to confirm findings at specific loci. Chromatin Immunoprecipitation coupled with quantitative PCR (ChIP-qPCR) remains the gold-standard method for providing this essential verification, offering unparalleled sensitivity, quantitative precision, and cost-effectiveness for focused studies [18] [19]. While next-generation sequencing approaches address the "where" of protein-DNA interactions across the entire genome, ChIP-qPCR answers the "how much" at specific genomic locations of interest with greater quantitative accuracy and lower resource requirements [19].
This technical comparison guide examines ChIP-qPCR's role in validating histone modification ChIP-seq data, objectively assessing its performance against alternative technologies. We provide detailed experimental protocols, quantitative performance comparisons, and practical guidance to empower researchers in making informed methodological choices for their chromatin validation workflows.
Methodological Foundations: ChIP-qPCR Workflow and Analysis
Core Experimental Protocol
The fundamental ChIP-qPCR protocol involves specific, optimized steps to preserve biological relevance while ensuring robust, interpretable results:
Crosslinking: Cells or tissues are treated with formaldehyde to covalently cross-link proteins to DNA, preserving in vivo protein-DNA interactions. Typical concentrations range from 1% with incubation times of 10-15 minutes [20] [19].
Chromatin Fragmentation: Crosslinked chromatin is sheared to fragments of 200-500 bp using either sonication or micrococcal nuclease (MNase) digestion. This step provides sufficient resolution for site-specific analysis while maintaining fragment integrity [20] [19].
Immunoprecipitation: Validated, ChIP-grade antibodies selectively enrich for protein-DNA complexes of interest. Magnetic beads pre-coated with protein A/G are commonly used for efficient capture. Critical controls include input DNA (2-5% of starting chromatin), IgG controls for non-specific background, and positive control antibodies for known histone modifications [20] [21].
Reverse Crosslinking & DNA Purification: Crosslinks are reversed using heat, often with proteinase K treatment, followed by DNA purification to recover clean DNA fragments for downstream analysis [22] [19].
Quantitative PCR: Target-specific primers amplify regions of interest, with fluorescence-based detection translating enrichment into precise cycle threshold (Ct) values. Optimal amplicons are typically 65-150 base pairs to accommodate fragmented chromatin [22] [18].
Data Analysis and Normalization Methods
ChIP-qPCR data requires careful normalization to account for technical variability. Two complementary approaches are widely used:
Percent Input Method: This approach calculates enrichment relative to the total starting chromatin, providing a straightforward measure that accounts for background and input chromatin variation. The calculation is:
%Input = 100 × 2^(Adjusted Input Ct - IP Ct)where "Adjusted Input Ct" accounts for the dilution factor of the input sample [21].Fold Enrichment Method: Also called 'signal over background,' this method normalizes ChIP signals to a no-antibody control (IgG) or non-enriched genomic region, expressing results as fold-increase over background:
Fold Enrichment = 2^(ΔΔCt)where ΔΔCt represents the normalized difference between test and control samples [21].
Table 1: Comparison of ChIP-qPCR Data Analysis Methods
| Method | Calculation | Advantages | Limitations |
|---|---|---|---|
| Percent Input | %Input = 100 × 2^(Adjusted Input Ct - IP Ct) |
Accounts for background and input chromatin; intuitive interpretation | Requires careful input sample preparation |
| Fold Enrichment | Fold Enrichment = 2^(ΔΔCt) |
Highlights specific signal over background; familiar to qPCR users | Assumes consistent background across samples/primers |
Technical Comparison: ChIP-qPCR Versus Emerging Alternatives
Performance Benchmarking Against CUT&Tag
While ChIP-qPCR remains the validation standard, emerging techniques like CUT&Tag (Cleavage Under Targets and Tagmentation) offer potential advantages for genome-wide profiling. Recent benchmarking against ENCODE ChIP-seq standards reveals important performance differences:
For histone modifications including H3K27ac and H3K27me3, CUT&Tag recovers approximately 54% of known ENCODE ChIP-seq peaks when optimal parameters are used, suggesting good but incomplete coverage of known binding sites. CUT&Tag demonstrates particular strength in detecting the strongest ENCODE peaks, with these recovered peaks showing similar functional and biological enrichments as their ChIP-seq counterparts [23].
However, this partial recovery rate highlights the continued importance of ChIP-qPCR for targeted validation, as reliance solely on CUT&Tag may miss nearly half of biologically relevant sites. The same benchmarking study employed qPCR using primers designed against ENCODE peaks as a crucial validation step, underscoring the complementary relationship between these technologies [23].
Comparison with CUT&RUN-qPCR
Another emerging alternative, CUT&RUN-qPCR, has demonstrated potentially superior sensitivity compared to traditional ChIP-qPCR in specific applications. A modified CUT&RUN-seq technique adapted for qPCR analysis showed greater sensitivity and spatial resolution than ChIP-qPCR when studying protein recruitment at site-specific replication fork barriers and DNA double-strand breaks [24].
Table 2: Performance Comparison of Chromatin Profiling Methods
| Method | Sensitivity/Signal Resolution | Genomic Coverage | Input Requirements | Best Applications |
|---|---|---|---|---|
| ChIP-qPCR | High for targeted loci; proven reliability | Targeted (specific primers) | ~10⁷ cells recommended [19] | Validation of specific loci; focused studies |
| ChIP-seq | Established benchmark; broad dynamic range | Genome-wide | 1-10 million cells [23] | Discovery; genome-wide mapping |
| CUT&Tag | High signal-to-noise; ~54% ENCODE peak recovery [23] | Genome-wide | ~200-fold reduced vs ChIP-seq [23] | Genome-wide profiling with low input |
| CUT&RUN-qPCR | Potentially superior to ChIP-qPCR at barriers [24] | Targeted (specific primers) | Lower than ChIP-qPCR | Targeted studies requiring high resolution |
Experimental Design: Critical Success Factors
Antibody Selection and Validation
Antibody quality represents the most critical factor in successful ChIP experiments. The ENCODE consortium has established rigorous guidelines for antibody characterization:
Primary Characterization: For histone modification antibodies, immunoblot analysis should show the primary reactive band containing at least 50% of the total signal, ideally corresponding to the expected size. Alternative characterization methods include immunofluorescence demonstrating expected nuclear staining patterns [7].
Secondary Validation: Antibody performance should be verified through independent validation experiments, such as peptide competition assays, use in genetically modified systems (e.g., histone mutant strains), or correlation with orthogonal methods [20] [7].
Control Considerations: Always include species-matched IgG controls to assess non-specific background, and when possible, positive control antibodies for well-characterized histone modifications to confirm overall protocol success [21].
Primer Design Strategy
Designing effective primers for ChIP-qPCR presents unique challenges compared to standard qPCR applications:
Amplicon Considerations: Target 80-140 bp amplicons to accommodate fragmented chromatin while maintaining amplification efficiency. Test primer specificity using dissociation curves—a single peak indicates homogeneous PCR products, while multiple peaks suggest non-specific amplification [24].
Genomic Considerations: Unlike mRNA expression analysis, ChIP-qPCR cannot utilize intron-spanning primers to exclude genomic DNA amplification. Carefully avoid repetitive regions and verify amplification efficiency (95-105%) using serial dilutions of input DNA [22] [18].
Database Resources: Public repositories like ChIPprimersDB provide validated ChIP-qPCR primers that have demonstrated ≥5-fold enrichment over controls, significantly reducing optimization time [18].
The Scientist's Toolkit: Essential Research Reagents
Table 3: Essential Research Reagents for ChIP-qPCR Experiments
| Reagent Category | Specific Examples | Function & Importance |
|---|---|---|
| Crosslinking Agents | Formaldehyde (1% final concentration) [20] | Presves in vivo protein-DNA interactions; critical for capturing transient binding events |
| Chromatin Fragmentation | Micrococcal nuclease (MNase) [20] or sonication | Shears chromatin to 200-500 bp fragments; enables antibody access and locus-specific resolution |
| Immunoprecipitation | Protein A/G magnetic beads [20]; ChIP-validated antibodies | Selective enrichment of target protein-DNA complexes; antibody specificity is paramount |
| DNA Purification | Phenol:chloroform extraction; PCR purification kits [24] | Removes proteins and reagents after reverse crosslinking; clean template for qPCR |
| qPCR Components | SYBR Green or TaqMan probes [22]; optimized primers | Detection and quantification of enriched DNA; SYBR Green is cost-effective for optimization |
Decision Pathways and Workflow Integration
Experimental Workflow Integration
The following diagram illustrates how ChIP-qPCR integrates with broader chromatin analysis workflows, particularly in validating histone modification ChIP-seq findings:
Method Selection Pathway
This decision pathway guides researchers in selecting the appropriate method based on their specific research goals and experimental constraints:
ChIP-qPCR maintains its essential position in the chromatin analysis toolkit, particularly for targeted quantification of histone modifications at specific genomic loci. While emerging technologies like CUT&Tag offer advantages for genome-wide discovery with lower input requirements, they demonstrate incomplete recovery of known binding sites (approximately 54% of ENCODE peaks), reinforcing the need for orthogonal validation [23].
For researchers validating histone modification ChIP-seq data, ChIP-qPCR provides unmatched quantitative precision at specific genomic regions of interest, making it ideally suited for confirming putative binding sites identified through sequencing approaches. Its cost-effectiveness, technical accessibility, and well-established analysis frameworks ensure it will remain a cornerstone technique for focused epigenetic investigations and rigorous validation of high-throughput datasets.
The most robust chromatin studies strategically integrate both discovery-based and validation approaches—using ChIP-seq or CUT&Tag for unbiased genome-wide mapping, followed by ChIP-qPCR for precise quantification at candidate loci. This integrated approach leverages the respective strengths of each method to generate findings that are both comprehensive and rigorously verified.
In the study of epigenetics, Chromatin Immunoprecipitation followed by sequencing (ChIP-seq) has revolutionized our ability to map histone modifications and protein-DNA interactions across the entire genome. However, this powerful technique generates massive datasets that require rigorous validation to ensure biological relevance and technical accuracy. Among the available validation methods, quantitative PCR (qPCR) stands as an indispensable tool for confirming ChIP-seq findings. This article explores the complementary relationship between these techniques and demonstrates why a combined approach is essential for producing reliable epigenetic data, particularly in the context of histone modification research.
The Complementary Nature of ChIP-seq and qPCR
ChIP-seq and qPCR represent complementary rather than competing approaches in epigenetic research. While ChIP-seq provides an unbiased, genome-wide survey of potential binding sites or modification regions, qPCR delivers targeted, quantitative confirmation of specific findings with well-established sensitivity and specificity.
Table 1: Fundamental Differences Between ChIP-seq and qPCR in ChIP Applications
| Parameter | ChIP-seq | ChIP-qPCR |
|---|---|---|
| Genomic Coverage | Genome-wide, discovery-oriented | Targeted, hypothesis-driven |
| Resolution | High (exact base pair positioning) | Limited to amplified region |
| Throughput | High (entire genome) | Low (specific primer sets) |
| Quantification | Relative enrichment based on read counts | Absolute quantification via standard curves |
| Cost per Sample | Higher | Significantly lower |
| Technical Validation | Requires confirmation | Serves as validation standard |
| Best Application | Novel binding site identification | Confirmation of specific targets |
The integration of these methods creates a powerful workflow where ChIP-seq identifies potential regions of interest across the entire genome, and qPCR provides rigorous, quantitative validation of these findings at specific loci [9]. This combined approach is particularly crucial for histone modifications with broad genomic footprints such as H3K27me3 and H3K9me3, which present unique analytical challenges for sequencing-based methods alone [10].
Experimental Evidence: Case Studies in Validation
Case Study 1: Differential H3K27me3 Enrichment in Rat Models
A compelling example of the necessity for qPCR validation comes from a study analyzing differential H3K27me3 enrichment between Spontaneously Hypertensive Rats (SHR/Ola) and Brown Norway (BN-Lx/Cub) strains. When researchers performed qPCR validation on 11 regions identified as differentially modified by ChIP-seq analysis, they discovered that 4 of these regions showed no amplification signal in the SHR strain. Further investigation revealed these regions overlapped with genomic deletions in SHR, meaning they were not genuine differentially modified regions but technical artifacts of the sequencing approach [10].
This case highlights how qPCR validation can identify false positive calls that might otherwise lead to incorrect biological interpretations. The remaining 7 regions were successfully validated by qPCR, confirming the ChIP-seq findings and providing confidence in the legitimate differential modifications [10].
Case Study 2: Antibody Specificity Challenges in Histone Modification Studies
Antibody quality represents one of the most significant variables in ChIP experiments. Not all commercial antibodies designated as ChIP-grade perform adequately in practice, with issues ranging from poor reactivity against the intended target to cross-reactivity with similar epigenetic marks [6] [25].
For example, distinguishing between H3K9me2 (generally repressive) and H3K9me1 (generally activating) is crucial for correct biological interpretation. ELISA validation has demonstrated that specific antibodies can differentiate between these similar marks, but without such validation, researchers risk misinterpreting their ChIP-seq data [25]. qPCR serves as an essential secondary check on antibody performance by confirming enrichment at expected genomic regions.
Table 2: Key Antibody Validation Criteria for Reliable ChIP Experiments
| Validation Parameter | Acceptance Criteria | Impact on Data Quality |
|---|---|---|
| Fold Enrichment | ≥5-fold enrichment at positive vs. negative control regions [6] | Directly affects signal-to-noise ratio |
| Signal-to-Noise Ratio | Minimum predetermined ratio of target locus enrichment over isotype control [26] | Reduces false positive calls |
| Antibody Titration | Optimal concentration determined through systematic testing [26] | Prevents both under- and over-enrichment |
| Lot-to-Lot Reproducibility | Consistent performance across different antibody batches [26] | Ensures experimental consistency |
| Specificity Testing | Verification using knockout/knockdown models or peptide competitions [6] | Confirms target specificity |
Technical Considerations for Robust Experimental Design
Optimal Experimental Workflow
A well-designed ChIP-seq experiment with proper qPCR validation follows a systematic workflow that incorporates quality checks at multiple stages. The diagram below illustrates this integrated approach:
qPCR Validation Methodology
Proper qPCR validation of ChIP-seq findings requires careful experimental execution:
Primer Design: Design primers targeting specific regions identified in ChIP-seq analysis, including:
- Positive regions (significant enrichment in ChIP-seq)
- Negative regions (no enrichment in ChIP-seq)
- Known control regions (established binding sites)
Standard Curve Generation: Create serial dilutions of input DNA to generate a standard curve for absolute quantification, ensuring amplification efficiency between 90-110% [27].
qPCR Reaction Setup: Utilize optimized master mixes specifically designed for ChIP applications, such as the SimpleChIP Universal qPCR Master Mix, which provides increased sensitivity and linearity compared to conventional mixes [27].
Data Analysis: Calculate percent input or fold enrichment values using the ΔΔCt method, comparing immunoprecipitated samples to appropriate controls.
Critical Control Elements
The ENCODE and modENCODE consortia have established rigorous guidelines for controls in ChIP experiments [7]:
- Input DNA: Sheared chromatin prior to immunoprecipitation, controlling for biases in chromatin fragmentation and sequencing efficiency.
- Isotype Controls: Non-specific antibodies (e.g., normal rabbit IgG) to account for non-specific binding.
- Biological Replicates: At least two independent experiments to ensure reproducibility.
- Antibody Validation: Demonstration of specificity through immunoblotting, immunofluorescence, or knockout controls.
Essential Research Reagent Solutions
Successful ChIP experiments depend on high-quality reagents specifically validated for epigenetic applications. The following table outlines key solutions and their functions:
Table 3: Essential Research Reagents for ChIP and Validation Workflows
| Reagent Category | Specific Examples | Function & Importance |
|---|---|---|
| Validated Antibodies | Tri-Methyl-Histone H3 (Lys4) Rabbit mAb #9751 [27] | Target-specific immunoprecipitation with minimal cross-reactivity |
| ChIP Kits | SimpleChIP Plus Enzymatic Chromatin IP Kit [27] | Comprehensive reagent systems for consistent chromatin processing |
| qPCR Master Mixes | SimpleChIP Universal qPCR Master Mix [27] | Sensitive detection and quantitation of target DNA sequences |
| Library Prep Kits | DNA Library Prep Kit for Illumina (ChIP-seq, CUT&RUN) [27] | Preparation of sequencing libraries from limited ChIP DNA |
| Quantification Kits | Droplet digital PCR (ddPCR) platforms [28] | Absolute quantification of library molecules without amplification bias |
| Chromatin Shearing Reagents | Micrococcal Nuclease (MNase) [25] | Enzymatic fragmentation for reproducible chromatin digestion |
Analytical Frameworks for Data Interpretation
The relationship between ChIP-seq discovery and qPCR validation represents a critical analytical pathway in epigenetic research. The following diagram illustrates this conceptual framework:
For histone modifications with broad genomic footprints like H3K27me3, specialized analytical tools such as histoneHMM have been developed specifically to address the limitations of peak-based calling algorithms [10]. This bivariate Hidden Markov Model aggregates short-reads over larger regions and provides probabilistic classifications of genomic regions as being either modified in both samples, unmodified in both samples, or differentially modified between samples.
The integration of ChIP-seq and qPCR represents a cornerstone of rigorous epigenetic research. While ChIP-seq provides unprecedented capability for genome-wide discovery, qPCR validation remains non-negotiable for confirming biological relevance, controlling for technical artifacts, and ensuring the reliability of conclusions about histone modifications. Through systematic experimental design, appropriate control selection, and careful implementation of both technologies, researchers can generate robust, reproducible data that advances our understanding of epigenetic mechanisms in health and disease. The complementary strengths of these methods—when properly implemented—create a validation framework that is essential for producing credible findings in the complex landscape of chromatin biology.
Antibody Specificity as the Cornerstone of Reliable ChIP Data
In chromatin immunoprecipitation followed by sequencing (ChIP-seq), antibody specificity fundamentally determines the reliability and biological relevance of the generated data. The critical importance of antibody validation stems from the technique's dependence on specific antibodies to recognize and enrich for target protein-DNA complexes, thereby capturing binding sites between particular proteins and DNA across the genome [29]. For histone modification studies, which form a cornerstone of epigenetic research, this specificity becomes paramount as researchers investigate how chemical modifications of histones alter chromatin conformation and regulate gene expression [29]. The challenge emerges from the fact that antibody performance in targeted ChIP-qPCR assays does not necessarily predict efficacy in genome-wide ChIP-seq applications, as the latter requires more extensive capture of the target protein across a large number of gene loci [30] [31].
The scientific community has recognized substantial concerns regarding current antibody validation strategies, particularly because assessment of antibody performances in ChIP-sequencing assays remains challenging due to the historical absence of robust quantitative approaches for qualifying ChIP-seq data [32]. This methodological gap has significant implications for data interpretation, as non-specific antibodies can generate false positive signals or fail to capture genuine binding events, potentially leading to erroneous biological conclusions. Within this context, this guide objectively compares validation standards and performance metrics for ChIP-seq antibodies, providing researchers with a framework for selecting reagents that will yield reliable, reproducible data in their epigenetic studies.
Comparative Analysis of ChIP-seq Antibody Validation Standards
Established Validation Frameworks
Table 1: Comprehensive Comparison of ChIP-seq Antibody Validation Standards
| Validation Criteria | CST Approach [30] | Academic QC System [32] | Titration Method [33] |
|---|---|---|---|
| Primary Validation | ChIP-qPCR first, then ChIP-seq | Quantitative quality control indicator (QCi) | Antibody titration with chromatin quantification |
| Specificity Assessment | Multiple antibodies against distinct epitopes; motif analysis for TFs | Comparison to public databases (ENCODE) | Locus-specific fold enrichment via ChIP-qPCR |
| Sensitivity Metrics | Signal:noise ratio across genome; minimum peak number | Robustness of enrichment patterns to read subsampling | ChIP yield vs. specificity balance |
| Reproducibility | Recombinant rabbit monoclonals for lot-to-lot consistency | Biological replicate analysis | Normalized antibody:chromatin ratios across experiments |
| Quality Scoring | Pass/Fail based on predefined thresholds | AAA-DDD grading system based on database of >28,000 datasets | Optimal titer determination (T1) |
Leading commercial providers and academic consortia have established rigorous validation frameworks to address the critical need for specific ChIP-seq antibodies. Cell Signaling Technology (CST) employs a multi-layered validation approach that begins with traditional ChIP-qPCR confirmation before progressing to full ChIP-seq assessment [30]. Their specificity determination includes motif analysis for transcription factors and comparative analysis using multiple antibodies against distinct target protein epitopes [30]. Furthermore, they confirm specificity using antibodies against different subunits of multiprotein complexes and comparison to published ChIP-seq data from resources like ENCODE [30]. This comprehensive methodology ensures that antibodies recognize their intended targets across diverse genomic contexts.
Academic research groups have developed complementary quantitative systems for antibody certification. Researchers have established a certification system comprising a standardized ChIP procedure and attribution of a numerical quality control indicator (QCi) to biological replicate experiments [32]. This Q computation quantifies the global deviation of randomly sampled subsets of ChIP-seq datasets from the original genome-aligned sequence reads, with comparison to a QCi database for over 28,000 ChIP-seq assays used to attribute quality grades ranging from 'AAA' to 'DDD' [32]. This system provides a universal quality assessment that quantifies the robustness of enrichment patterns, offering an intuitive grading system for antibodies labeled as "ChIP-seq grade."
Table 2: Antibody Performance Analysis Across Commercial Vendors
| Histone Mark | Vendor | Number of Antibody IDs | Reported Performance | Key Characteristics |
|---|---|---|---|---|
| H3K27me3 | Millipore | 6 | High quality grades in multiple studies | Broad genomic footprints |
| H3K27me3 | Cell Signaling | 3 | Consistent performance | Recombinant rabbit monoclonal |
| H3K27me3 | Active Motif | 6 | AAA-BBC grades | Multiple validation stages |
| H3K4me3 | Abcam | 3 | Variable performance | Polyclonal with batch variation |
| H3K4me3 | Millipore | 8 | Extensive validation | Wide application range |
| H3K27ac | Active Motif | 4 | High specificity | Enhancer mark specialization |
Independent analyses of commercial antibody sources reveal significant variation in performance characteristics. The NGS-QC database, which encompasses quality scores for thousands of publicly available datasets, enables comparative assessment of antibodies from different vendors for specific histone marks [32]. For example, antibodies against H3K27me3—a mark with broad genomic footprints that presents particular challenges for detection—show variable performance across vendors, with Millipore, Cell Signaling, and Active Motif all demonstrating consistent results across multiple antibody identifiers [32]. Similarly, for H3K4me3, a mark with more defined peak-like features, Millipore shows the largest number of validated antibody IDs (8), suggesting extensive validation across multiple targets [32].
The fundamental technological advantage of recombinant rabbit monoclonal antibodies, as utilized by CST, lies in their superior lot-to-lot reproducibility compared to traditional polyclonal antibodies [31]. This consistency is crucial for long-term studies and multi-institutional collaborations where reagent stability directly impacts data comparability. Furthermore, antibodies validated across multiple applications provide reduced non-specific binding and high signal-to-noise ratio in ChIP-seq, making them particularly valuable for challenging targets like transcription factors [31].
Experimental Protocols for Antibody Validation
Standardized ChIP-seq Validation Workflow
The validation of antibodies for ChIP-seq applications requires standardized methodologies to ensure consistent and reproducible results. The certification procedure established by academic researchers involves specific experimental conditions that can be replicated across laboratories [32]. For cell culture, HeLa cells are grown in DMEM with 1g/L glucose, 5% Fetal Calf Serum, and 40μg Gentamicin to a density of 15-20 million cells per 15cm plates [32]. Cells are fixed for 30 minutes with paraformaldehyde (1% in PBS), after which fixation is quenched with 0.2M glycine in PBS. Following three washes with PBS, cells are collected and stored at -80°C until use.
For chromatin immunoprecipitation, 40 million cells are sonicated in 500μL of Lysis Buffer (1% Na-deoxycholate, 50mM TrisHCl pH8, 140mM NaCl, 1mM EDTA, 1% Triton X-100) containing 5-times diluted Protease Inhibitor Cocktail [32]. Sonication is performed with a standardized instrument using 40 cycles of 30 seconds ON and 59 seconds OFF at 38% power. Chromatin fragmentation is then evaluated by agarose gel electrophoresis to ensure appropriate fragment sizes of 200-600 bp, which are ideal for subsequent sequencing steps [32]. For chromatin immunoprecipitation itself, 25μL of ChIP-IT Protein G Magnetic Beads are incubated with the antibody-chromatin complex to enrich for target-bound fragments [32].
Diagram 1: ChIP-seq Antibody Validation Workflow. This diagram illustrates the standardized process for validating antibodies for ChIP-seq applications, from cell culture through to quality assessment.
Titration-Based Normalization for Antibody Optimization
Recent methodological advances have demonstrated that titration-based normalization of antibody amount significantly improves consistency in ChIP-seq experiments [33]. This approach addresses the fundamental challenge of variable chromatin input amounts and undefined antibody titers, which are common sources of experimental variability. The protocol involves a quick and direct DNA-based measurement of soluble chromatin that provides reliable quantitative measures of chromatin input, highly comparable with the amount of chromatin determined by purified DNA [33].
The process begins with measuring DNA content of the chromatin input (DNAchrom) directly from 0.2% of total input using the Qubit assay, a high-sensitivity method specific to double-stranded DNA [33]. This measurement demonstrates strong linear correlation (R² = 0.99) with purified DNA amounts and enables researchers to quickly quantify chromatin input immediately after preparation [33]. For determining optimal antibody titer, 10μg of DNAchrom is used in individual ChIP reactions with antibody amounts ranging from 0.05 to 10.0μg. The ChIP yield (DNA amount after ChIP divided by DNA amount of total chromatin input) and fold enrichment (% enrichment of a positive genomic locus versus local input divided by enrichment of a negative locus) are then measured to assess the specificity of individual reactions [33].
Research findings demonstrate that ChIP yield gradually increases with increasing amounts of antibody, while fold enrichment dramatically decreases with antibody excess, resulting in an inverse linear correlation between ChIP yield and locus-specific enrichment (R² = 0.86) [33]. The optimal range of antibody titer is typically 0.25μg to 1μg per 10μg of DNAchrom, yielding at least 1ng of purified ChIP DNA and a 5-200-fold enrichment in multiple positive over negative loci [33]. This titration-based normalization approach ensures that the antibody:chromatin ratio remains consistent across samples and experiments, significantly improving data quality and reproducibility.
Advanced Computational Methods for Differential Analysis
Addressing Challenges in Broad Histone Marks
The computational analysis of ChIP-seq data presents particular challenges for histone modifications with broad genomic footprints, such as heterochromatin-associated H3K27me3 and H3K9me3 [10]. Most conventional ChIP-seq algorithms are designed to detect well-defined peak-like features and perform suboptimally when analyzing these broad domains that can span several thousands of basepairs [10]. To address this limitation, specialized computational tools have been developed, including histoneHMM, a powerful bivariate Hidden Markov Model specifically designed for differential analysis of histone modifications with broad genomic footprints [10].
The histoneHMM algorithm aggregates short-reads over larger regions and takes the resulting bivariate read counts as inputs for an unsupervised classification procedure, requiring no additional tuning parameters [10]. It outputs probabilistic classifications of genomic regions as being either modified in both samples, unmodified in both samples, or differentially modified between samples. When applied to H3K27me3 data from rat heart tissue comparing spontaneously hypertensive rats to Brown Norway strains, histoneHMM detected 24.96 Mb (0.9% of the rat genome) as differentially modified [10]. Comparative analyses demonstrated that histoneHMM outperformed competing methods like Diffreps, Chipdiff, Pepr, and Rseg in calling functionally relevant differentially modified regions, as validated through qPCR and RNA-seq integration [10].
Correction for Technical and Biological Biases
In cancer epigenetics, additional computational challenges emerge due to copy number variations innate to cancer cells, which can distort ChIP-seq histone modification data [34]. The HMCan-diff method was specifically developed to address this issue by explicitly correcting for copy number bias when analyzing ChIP-seq data to detect changes in histone modifications between cancer samples or between cancer and normal controls [34]. The method employs a multifaceted normalization approach that includes correction for copy number alterations, GC-content bias, library size, mappability, and noise level [34].
The HMCan-diff workflow begins with construction of normalized ChIP-seq density profiles, followed by inter-conditional normalization [34]. For copy number correction, HMCan-diff utilizes the Control-FREEC algorithm to learn the copy number profile from input DNA data, partitioning chromosomes into large genomic windows (typically 100 kb) and fitting a polynomial function to model the relationship between read count per window and GC-content values [34]. After segmenting the normalized copy number profile, HMCan-diff divides density values by median values of corresponding segments, effectively normalizing both ChIP and input densities for copy number alterations [34]. This comprehensive approach significantly improves prediction accuracy compared to methods that do not consider such corrections, as demonstrated through both simulated data and experimental datasets characterizing various histone marks [34].
Research Reagent Solutions for ChIP-seq
Table 3: Essential Research Reagents for ChIP-seq Experiments
| Reagent Category | Specific Examples | Function & Importance | Optimization Tips |
|---|---|---|---|
| Validated Antibodies | CST ChIP-seq Validated, Active Motif Certified | Specific target enrichment with minimal background | Check lot numbers; verify application-specific validation |
| Chromatin Preparation Kits | SimpleChIP Enzymatic Sonication IP Kit | Standardized chromatin fragmentation | Adjust enzymatic digestion or sonication cycles per cell type |
| Magnetic Beads | ChIP-IT Protein G Magnetic Beads | Efficient antibody-chromatin complex pulldown | Pre-clear beads with sheared chromatin to reduce non-specific binding |
| Library Prep Kits | NEBNext Ultra II DNA Library Prep | Sequencing library construction from low-input DNA | Incorporate dual index barcodes for sample multiplexing |
| Quality Control Assays | Qubit dsDNA HS Assay | Accurate quantification of chromatin input and immunoprecipitated DNA | Use same quantification method consistently across experiments |
| Positive Control Primers | H3K27ac-positive locus (PABPC1 TSS), Negative locus (MYT1 TSS) | Assessment of enrichment efficiency and specificity | Establish lab-specific control loci for frequently studied cell types |
The selection of appropriate research reagents is crucial for successful ChIP-seq experiments. Beyond antibodies themselves, multiple reagent categories contribute to data quality and reproducibility. Chromatin preparation kits using enzymatic fragmentation approaches, such as the SimpleChIP Enzymatic Chromatin IP Kit, provide standardized chromatin fragmentation that minimizes variability compared to sonication-based methods [30] [31]. These kits are particularly valuable for maintaining consistent fragment sizes across samples, which is essential for comparative analyses.
For quality control, the Qubit dsDNA HS Assay enables rapid and accurate quantification of chromatin input directly from prepared samples without requiring crosslink reversal and DNA purification [33]. This methodology provides reliable measurement of DNAchrom that shows strong linear correlation with purified DNA amounts (R² = 0.74 across 666 different chromatin inputs), allowing researchers to normalize antibody amounts to the optimal titer for individual samples [33]. Incorporating positive and negative control primers for ChIP-qPCR validation, such as those targeting the H3K27ac-positive PABPC1 transcription start site and H3K27ac-negative MYT1-TSS locus, provides essential assessment of enrichment efficiency and specificity during protocol optimization [33].
Antibody specificity remains the foundational element determining success in ChIP-seq experiments, particularly for studying histone modifications that govern gene regulation patterns. The integration of comprehensive validation approaches—including vendor verification, independent quality grading systems, and titration-based normalization—provides a multi-layered strategy for ensuring antibody reliability. Furthermore, selecting appropriate computational methods matched to the specific characteristics of the histone mark being studied, whether broad domains or sharp peaks, is essential for accurate biological interpretation.
As the field advances toward increasingly sensitive techniques like CUT&RUN and CUT&Tag, which require even higher antibody specificity due to their in situ cleavage approaches [29], the validation standards established for ChIP-seq will provide a valuable framework for ensuring epigenetic data quality. By adopting the rigorous validation methodologies and reagent selection criteria outlined in this guide, researchers can significantly enhance the reproducibility and biological relevance of their chromatin studies, ultimately advancing our understanding of epigenetic mechanisms in health and disease.
From Theory to Practice: A Step-by-Step Protocol for ChIP-seq and qPCR Validation
Optimized Cross-linking and Chromatin Shearing for Histone Modifications
In epigenetic research, protein-DNA interactions, particularly histone modifications, are central to understanding the regulation of gene expression. Mammalian tissues represent complex structures with diverse cell types where spatial organization contributes to tissue function through the regulation of gene expression landscape [35]. Unlike analyses on homogeneous cell populations, examining chromatin structure in a tissue context provides invaluable insights into how gene regulation is shaped by tissue organization and highlights particular regulatory mechanisms that might be concealed in cell line models [35]. This understanding is especially crucial in disease contexts such as colorectal cancer, where chromatin dynamics play a significant role in disease progression and manifestation.
Chromatin immunoprecipitation followed by sequencing (ChIP-seq) has emerged as a powerful method for interrogating protein-chromatin interactions and mapping chromatin modifications across the genome [35]. However, performing ChIP-seq in tissues presents considerable technical challenges, including complexities related to cell heterogeneity and matrix density, low input material, limited resolution, low reproducibility, and challenging data interpretation [35]. These challenges are particularly pronounced when studying histone modifications, which require precise cross-linking and chromatin shearing to preserve biologically relevant information while generating high-quality sequencing data.
Comparative Analysis of Chromatin Profiling Technologies
Technical Specifications Across Epigenomic Profiling Methods
Table 1: Comprehensive comparison of chromatin profiling technologies for histone modification studies
| Category | ChIP-qPCR | ChIP-seq | CUT&RUN | CUT&Tag |
|---|---|---|---|---|
| Starting Material | High (typically 10⁴–10⁶ cells) | Very high (millions of cells) | Low (10³–10⁵ cells) | Extremely low (10³–10⁴ cells; single-cell possible) |
| Peak Resolution | Medium (depends on chromatin fragmentation, usually several hundred bp) | High (tens to over a hundred bp) | Very high (precise MNase cleavage, down to single-digit bp) | Very high (precise Tn5 insertion, down to single-digit bp) |
| Operational Complexity | High (requires crosslinking, shearing, IP; takes several days) | Very high (~1 week; includes multiple steps) | Moderate (no crosslinking; ~1–2 days) | Low (simplified in situ protocol; ~2 days) |
| Background Noise | Relatively high (requires antibody and elution optimization) | Relatively high (many non-specific bindings) | Very low (in situ cleavage minimizes background) | Extremely low (adaptors inserted directly at target sites) |
| Library Construction | No full library; qPCR of specific loci | Traditional library prep (end repair, adaptor ligation, PCR) | End repair + adaptor ligation + PCR | One-tube PCR using Tn5-inserted adaptors |
Performance Benchmarking in Histone Modification Profiling
Recent benchmarking studies have provided crucial insights into the performance characteristics of these technologies. When comparing CUT&Tag against established ENCODE ChIP-seq standards for histone modifications H3K27ac and H3K27me3 in K562 cells, CUT&Tag demonstrated an average recall of 54% of known ENCODE peaks for both histone modifications [23]. This indicates that while CUT&Tag captures the strongest ENCODE peaks and shows the same functional and biological enrichments as ChIP-seq, traditional ChIP-seq still identifies a substantial portion of peaks that may be missed by newer techniques [23].
The performance comparison reveals a critical trade-off: while CUT&Tag offers superior sensitivity with extremely low input requirements and reduced background noise, optimized ChIP-seq protocols continue to provide comprehensive peak detection, particularly for large-scale genomic mapping studies where complete coverage is essential. For histone modification studies specifically, ChIP-seq maintains advantages in established validation frameworks and consistent performance across diverse biological contexts.
Advanced Cross-linking Strategies for Enhanced Histone Modification Capture
Double-Crosslinking Methodology (dxChIP-seq)
Double-crosslinking ChIP-seq (dxChIP-seq) represents a significant advancement in cross-linking strategies that improve mapping of chromatin factors, including those that do not bind DNA directly, while enhancing signal-to-noise ratio [36]. This protocol employs a dual-crosslinking approach that captures proteins directly and indirectly bound to DNA, making it particularly valuable for studying complex histone modification patterns and chromatin-associated complexes that may have both direct and indirect DNA interactions.
The dxChIP-seq method involves initial cross-linking with a reversible protein-protein cross-linker followed by formaldehyde-mediated protein-DNA cross-linking. This sequential approach stabilizes larger chromatin complexes before fixing the direct DNA contacts, resulting in improved preservation of native chromatin architecture and more comprehensive capture of histone modification contexts [36]. The protocol has demonstrated enhanced performance in mapping challenging chromatin targets, including those with weak or transient interactions, which are common in histone modification landscapes.
Tissue-Optimized Cross-linking Protocols
For solid tissues, particularly in disease contexts like colorectal cancer, specialized cross-linking protocols have been developed to address tissue-specific challenges [35]. These protocols emphasize:
Controlled Formaldehyde Concentration and Timing: Optimized to penetrate dense tissue matrices without over-crosslinking, which can mask epitopes and reduce antibody efficiency.
Temperature-Controlled Reactions: Maintaining consistent低温 conditions throughout cross-linking to prevent histone degradation and preserve modification states.
Rapid Termination and Quenching: Using precise glycine concentrations and timing to ensure consistent cross-linking efficiency across samples.
The integration of these advanced cross-linking strategies with optimized chromatin shearing techniques has demonstrated significant improvements in histone modification mapping, particularly in complex tissue environments where chromatin accessibility varies considerably across cell types and regions.
Chromatin Shearing Optimization for Tissue Samples
Tissue Preparation and Homogenization Techniques
Proper tissue preparation is foundational to successful chromatin shearing and subsequent histone modification analysis. The refined frozen tissue preparation protocol includes systematic steps for mincing and homogenization under cold conditions to preserve chromatin integrity [35]. Two homogenization alternatives have been optimized for different laboratory settings:
Semi-automated Method: Using a gentleMACS Dissociator with predefined programs (e.g., "htumor03.01") specifically optimized for tissue homogenization. This approach provides consistency across samples and is particularly valuable for processing multiple tissue specimens in parallel [35].
Manual Dounce Homogenization: Using a sterile Dounce tissue grinder with pestle A, applying even strokes (8-10 times) under constant cold conditions. This method offers greater control for delicate samples but requires more technical skill to maintain consistency [35].
Both methods emphasize maintaining samples at 4°C throughout processing and using phosphate-buffered saline (PBS) supplemented with protease inhibitors to prevent histone degradation and preserve modification states during extraction.
Focused Ultrasonication for Chromatin Fragmentation
Optimized chromatin shearing parameters represent a critical advancement in tissue ChIP-seq protocols. The refined approach incorporates focused ultrasonication with specific adjustments for tissue density and composition [35]. Key optimization parameters include:
Amplitude and Duty Cycle Adjustments: Tailored to tissue density, with higher settings for fibrous tissues and lower settings for more delicate architectures.
Multiple Short Cycles: Implementing brief sonication pulses with extended cooling intervals to prevent local heating and histone degradation.
Buffer Composition Optimization: Including specific detergent concentrations and ionic strength adjustments to maintain chromatin stability while allowing efficient fragmentation.
For double-crosslinked samples (dxChIP-seq), ultrasonication parameters are further refined to address the additional cross-links, typically requiring increased energy input but balanced against potential DNA damage and histone complex disruption [36].
Diagram 1: Optimized workflow for tissue ChIP-seq showing critical decision points in cross-linking and chromatin shearing methods. The workflow highlights key optimization points that significantly impact histone modification recovery and data quality.
Experimental Protocol: Integrated Cross-linking and Shearing for Tissue Histone Modifications
Tissue Preparation and Cross-linking Procedure
Basic Protocol 1: Frozen Tissue Preparation [35]
Taste Retrieval and Preparation:
- Transfer frozen tissue samples (-80°C) directly to ice
- Perform all subsequent steps in a biosafety cabinet (BSC) with sterile equipment
- Place Petri dish in center of ice bucket and position tissue sample securely
Tissue Mincing:
- Mince tissue sample with two sterile scalpel blades on Petri dish (on ice) until finely diced
- Collect minced tissue using both scalpels and transfer to homogenization equipment
Tissue Homogenization (choose one method):
- Dounce Homogenization: Transfer minced tissue to 7-ml Dounce grinder on ice. Add 1 ml cold PBS with protease inhibitors. Shear tissue with even strokes of pestle A (8-10 times). Add 2-3 ml cold PBS and transfer contents to 50-ml conical tube.
- gentleMACS Dissociator: Transfer minced tissue to C-tube on ice. Add 1 ml cold PBS with protease inhibitors. Tap upside-down C-tube on bench. Run "htumor03.01" predefined program. Add 2-3 ml cold PBS and transfer to 50-ml conical tube.
Double-Crosslinking Protocol (dxChIP-seq) [36]
Primary Cross-linking:
- Prepare protein-protein cross-linker solution (typically DSG or DSS) in appropriate buffer
- Incubate homogenized tissue with cross-linker for 30-45 minutes at room temperature with gentle rotation
- Quench reaction with Tris-HCl (pH 7.5) to final concentration 100 mM for 15 minutes
Secondary Formaldehyde Cross-linking:
- Add formaldehyde to 1% final concentration
- Incubate for 10-15 minutes at room temperature with gentle rotation
- Quench with glycine to 125 mM final concentration for 5 minutes at room temperature
Washing and Storage:
- Pellet cells by centrifugation at 800×g for 5 minutes at 4°C
- Wash twice with cold PBS with protease inhibitors
- Flash-freeze pellets in liquid nitrogen or proceed immediately to chromatin extraction
Chromatin Extraction and Shearing Optimization
Basic Protocol 2: Chromatin Extraction and Shearing [35]
Nuclear Lysis and Chromatin Extraction:
- Resuspend cross-linked cell pellets in lysis buffer (1% SDS, 10 mM EDTA, 50 mM Tris-HCl pH 8.1) with protease inhibitors
- Incubate on ice for 10 minutes
- Centrifuge at 16,000×g for 10 minutes at 4°C to pellet insoluble material
- Transfer supernatant containing solubilized chromatin to new tube
Optimized Chromatin Shearing:
- Dilute chromatin extract to 0.1% SDS final concentration using dilution buffer
- Aliquot into appropriate sonication tubes (avoiding foam formation)
- Perform focused ultrasonication with optimized parameters:
- Amplitude: 30-40% (depending on tissue density)
- Duty cycle: 50% with 30-second pulses
- Cooling: 60-second intervals between pulses on ice
- Total processing time: 8-15 minutes (varies by tissue type)
Shearing Efficiency Validation:
- Reverse cross-links for a 100μl aliquot (65°C for 4 hours with 200 mM NaCl)
- Purify DNA using RNAse A/proteinase K treatment and column purification
- Analyze fragment size distribution using Bioanalyzer/TapeStation
- Target range: 200-600 bp with peak around 300 bp
Research Reagent Solutions for Histone Modification ChIP-seq
Table 2: Essential research reagents for optimized histone modification ChIP-seq
| Reagent Category | Specific Products/Formulations | Function and Optimization Notes |
|---|---|---|
| Antibodies | ChIP-seq validated antibodies (Cell Signaling Technology) [37] | Critical for specific histone modification recognition; must be validated for ChIP-seq not just ChIP-qPCR [37] |
| Cross-linking Reagents | Formaldehyde (37%), DSG (Disuccinimidyl glutarate), DSS (Disuccinimidyl suberate) | Double-crosslinking improves capture of indirectly bound factors; concentration and timing must be optimized per tissue type [36] |
| Protease Inhibitors | Complete Mini EDTA-free tablets, PMSF, Aprotinin, Leupeptin | Essential for preserving histone modifications during extraction; must be added fresh to all buffers [35] |
| Homogenization Systems | gentleMACS Dissociator with C-tubes, Dounce tissue grinders | Tissue-specific programs optimize cell recovery while maintaining chromatin integrity [35] |
| Chromatin Shearing Systems | Focused ultrasonicator (Covaris), Bioruptor (Diagenode) | Parameter optimization critical for tissue chromatin; affects fragment distribution and IP efficiency [35] |
| Library Preparation | MGI-specific adaptors, End-repair and A-tailing modules | Platform-specific optimization reduces bias and improves sequencing quality [35] |
Validation Framework: Integrating ChIP-seq with qPCR Analysis
The validation of histone modification ChIP-seq data through qPCR represents a critical quality control step that confirms target specificity and provides quantitative assessment of enrichment. ChIP-qPCR serves as an essential validation method by offering high sensitivity, good signal-to-noise ratio, and the ability to quantitatively compare binding intensities at specific sites under different conditions [38].
For comprehensive validation, a strategic approach integrating both methods should include:
Positive and Negative Control Loci: Selection of genomic regions with known histone modification status based on existing databases (e.g., ENCODE) or preliminary experiments. Positive controls target regions with expected enrichment, while negative controls target known unmodified regions [23].
Antibody Validation: Confirmation that antibodies show specific enrichment at positive control loci without significant signal at negative controls. ChIP-seq validated antibodies must demonstrate acceptable minimum number of defined enrichment peaks and meet minimum signal:noise thresholds compared to input chromatin [37].
Quantitative Correlation Assessment: Comparison between qPCR fold-enrichment values and sequencing read density at corresponding loci to ensure methodological consistency.
Motif Analysis Validation: For sequence-specific factors, performing motif analysis of enriched chromatin fragments to confirm biological relevance of identified peaks [37].
This integrated validation framework is particularly crucial when implementing optimized cross-linking and shearing protocols, as it confirms that technical improvements translate to biologically relevant enhancements in histone modification detection.
The optimization of cross-linking and chromatin shearing protocols for histone modification studies represents a significant advancement in epigenetic research, particularly for complex tissue environments. The integration of double-crosslinking strategies with tissue-specific homogenization and shearing parameters has demonstrated measurable improvements in signal-to-noise ratio, peak detection sensitivity, and biological relevance of resulting data.
While emerging technologies like CUT&Tag offer advantages for low-input applications, optimized ChIP-seq protocols maintain crucial importance for comprehensive histone modification mapping, especially in tissue contexts where complete chromatin architecture preservation is essential. The strategic selection of cross-linking methods, coupled with validated shearing protocols and rigorous qPCR validation, provides researchers with a robust framework for generating high-quality histone modification data that accurately reflects in vivo chromatin states.
These technical advances, combined with appropriate controls and validation standards, enable more precise characterization of epigenetic mechanisms in development, disease, and therapeutic intervention contexts. The continued refinement of these protocols promises to further enhance our understanding of how histone modifications regulate gene expression in complex tissue environments.
Within the framework of validating histone modification ChIP-seq with qPCR research, the reliability of your data hinges on two foundational pillars: the specificity of the immunoprecipitation (IP) step and the purity of the final DNA. This guide objectively compares the performance of established and emerging techniques against the traditional Chromatin Immunoprecipitation (ChIP) method, providing supporting experimental data and detailed protocols to inform method selection for drug development and basic research.
Technical Comparison of Immunoprecipitation Methods
The landscape of techniques for studying protein-DNA interactions has evolved significantly. The table below provides a quantitative comparison of four key methods, highlighting critical performance differentiators.
Table 1: Performance Comparison of Key Immunoprecipitation Techniques
| Category | ChIP-qPCR | ChIP-seq | CUT&RUN | CUT&Tag |
|---|---|---|---|---|
| Starting Material | High (10⁴–10⁶ cells) [39] | Very high (Millions of cells) [39] | Low (10³–10⁵ cells) [39] | Extremely low (10³–10⁴ cells; single-cell possible) [39] |
| Peak Resolution | Medium (several hundred bp) [39] | High (tens to over a hundred bp) [39] | Very high (down to single-digit bp) [39] | Very high (down to single-digit bp) [39] |
| Operational Complexity | High (several days) [39] | Very high (~1 week) [39] | Moderate (1–2 days) [39] | Low (~2 days) [39] |
| Background Noise | Relatively high [39] | Relatively high [39] | Very low [39] | Extremely low [39] |
| Library Construction | qPCR on specific loci [39] | Traditional library prep [39] | End repair + adapter ligation + PCR [39] | One-tube PCR using Tn5-inserted adapters [39] |
Key Workflow Differences
The techniques differ fundamentally in their approach to capturing protein-DNA interactions, which directly impacts their performance characteristics.
Detailed Experimental Protocols
Protocol 1: Exogenous Spike-in Control for ChIP Normalization
Spike-in controls are crucial for normalizing technical variations in ChIP efficiency, especially for low-abundance targets [40].
Procedure:
- Prepare Spike-in Chromatin: Use S. cerevisiae strain expressing a tagged protein (e.g., SIR3-3XFLAG) as an exogenous chromatin source [40].
- Cell Growth and Crosslinking:
- Cell Pellet Preparation:
- Spike-in Addition: Add a fixed amount of the prepared spike-in chromatin to your experimental S. pombe or other model organism chromatin before the IP step [40].
- Data Normalization: After sequencing, use primers specific to the S. cerevisiae genome regions to quantify the spike-in DNA. Normalize the experimental ChIP signals to the spike-in recovery [40].
Protocol 2: Internal Standard Calibrated ChIP (ICeChIP)
ICeChIP uses recombinant nucleosomes as an internal standard to measure absolute histone modification density [41].
Procedure:
- Prepare Internal Standard: Reconstitute nucleosomes from recombinant and semisynthetic histones carrying the modification of interest, using barcoded DNA [41].
- Spike-in Before IP: Add a known quantity of these barcoded nucleosomes to the native chromatin sample prior to the immunoprecipitation step [41].
- Proceed with ChIP: Perform the standard Chromatin Immunoprecipitation protocol.
- Sequencing and Calibration: After sequencing, the barcoded DNA from the internal standard allows for precise calibration of the IP efficiency. This measures local histone modification densities on a biologically meaningful scale, enabling unbiased comparisons across experiments [41].
The Scientist's Toolkit: Essential Research Reagents
The following table details key reagents and their critical functions in ensuring successful and validated immunoprecipitation experiments.
Table 2: Essential Research Reagent Solutions for Immunoprecipitation
| Reagent / Solution | Critical Function |
|---|---|
| Validated Antibodies | The cornerstone of IP specificity. Antibodies must be rigorously validated for the specific application (ChIP, CUT&RUN) and species. Key players include Thermo Fisher Scientific, Abcam, and Cell Signaling Technology [42] [43] [44]. |
| Magnetic Beads (Protein A/G) | Used to capture and isolate antibody-target complexes. Magnetic bead-based kits are widely used for their ease of use and efficiency [45] [43]. |
| Chromatin Shearing Reagents | For ChIP, reagents are used in conjunction with sonication to fragment chromatin to an optimal size (200-600 bp), balancing resolution and yield [39]. |
| pA-MNase Fusion Protein | The core enzyme in CUT&RUN. It binds to the antibody and cleaves DNA in situ, eliminating the need for sonication and crosslinking [39]. |
| pA-Tn5 Transposase | The core enzyme in CUT&Tag. It is pre-loaded with sequencing adapters and simultaneously cleaves DNA and inserts adapters at the target site, streamlining library prep [39]. |
| Spike-in Chromatin | Exogenous chromatin (e.g., from S. cerevisiae) or synthetic nucleosomes (e.g., for ICeChIP) added to samples for data normalization, critical for quantitative comparisons [40] [41]. |
| DNA Purification Kits | Essential for the final step of cleaning up and concentrating DNA after reverse crosslinking (ChIP) or enzymatic release (CUT&RUN/Tag), ensuring pure material for downstream qPCR or sequencing [42]. |
The choice of immunoprecipitation technique involves a direct trade-off between material requirements, resolution, and operational complexity. Traditional ChIP-seq remains a robust, well-understood method for genome-wide mapping but demands large cell inputs and suffers from higher background. The newer CUT&RUN and CUT&Tag techniques offer superior resolution and signal-to-noise ratios with dramatically lower cell inputs, making them ideal for precious clinical samples or high-throughput studies. Incorporating spike-in controls like exogenous chromatin or recombinant nucleosomes is no longer an optional optimization but a critical step for generating quantitative, reproducible, and comparable data in histone modification research, thereby strengthening the validation bridge between ChIP-seq and qPCR.
Designing Effective qPCR Primers for Known Enriched and Control Regions
Chromatin Immunoprecipitation followed by quantitative PCR (ChIP-qPCR) remains an indispensable tool for validating histone modification patterns initially identified through ChIP-seq. While next-generation sequencing provides genome-wide coverage, qPCR delivers precise, cost-effective verification of specific genomic regions. The transition from ChIP-seq discovery to rigorous qPCR validation hinges on one critical factor: the design of effective primers for both enriched and control regions. This guide objectively compares available tools and methodologies for this specialized primer design process, providing researchers with data-driven recommendations for obtaining reliable validation data.
The Unique Challenges of ChIP-qPCR Primer Design
Designing primers for ChIP-qPCR presents distinct challenges beyond conventional qPCR applications. The template DNA derived from ChIP experiments is typically fragmented (200–500 bp), chemically crosslinked, and available in limited quantities (<5 ng) [18]. Unlike gene expression analysis where intron-spanning primers can eliminate genomic DNA contamination, ChIP-qPCR targets genomic DNA directly, necessitating different specificity controls. Furthermore, primers must distinguish closely spaced histone modification peaks, requiring exquisite genomic specificity [18].
The gold standard for ChIP-qPCR validation requires demonstrating significant enrichment (typically ≥5-fold) over appropriate control regions, which include both input DNA and non-enriched genomic regions [18]. Without comparison to non-enriched regions, high "% input" values alone are insufficient due to variability in nonspecific DNA pulldown across different antibodies.
Comparative Analysis of qPCR Primer Design Tools and Methodologies
Table 1: Publicly Available Resources for ChIP-qPCR Primer Design
| Resource Name | Type | Key Features | Advantages | Limitations |
|---|---|---|---|---|
| ChIPprimersDB | Curated database | Manually verified primers with ≥5-fold enrichment; linked to original publications [18] | Includes experimental conditions (antibody, cell line, tissue); validated performance | Limited to previously studied regions; manual curation limits coverage |
| PrimerQuest (IDT) | Design tool | Incorporates nearest-neighbor Tm calculations; BLAST analysis integration [46] | Customizable parameters for specific experimental needs; comprehensive analysis | Requires optimization for ChIP-specific challenges |
| NCBI Primer BLAST | Design tool | Combines primer design with specificity verification | Built-in specificity checking against database sequences | Does not account for ChIP DNA quality issues |
| OligoAnalyzer (IDT) | Analysis tool | Evaluates secondary structures, dimers, and hairpins [46] [47] | Assesses practical concerns like hairpin formation and self-dimers | Only analyzes pre-designed sequences |
Technical Specifications for Effective Primer Design
Table 2: Optimal Primer and Probe Parameters for ChIP-qPCR
| Parameter | Standard qPCR Recommendations | ChIP-qPCR Considerations | Rationale |
|---|---|---|---|
| Primer Length | 18–30 bases [46] | 18–30 bases | Balances specificity and binding efficiency |
| Amplicon Size | 70–150 bp [46] | 70–150 bp (up to 400 bp acceptable) [48] | Compatible with fragmented ChIP DNA; maximizes amplification efficiency |
| Tm Range | 60–64°C (ideal 62°C) [46] | 58–65°C [48] | Must work with crosslinked, fragmented DNA |
| Primer Pair Tm Difference | ≤2°C [46] | ≤2°C | Ensures balanced amplification from both primers |
| GC Content | 35–65% (ideal 50%) [46] | 40–60% [48] | Reduces secondary structure formation in GC-rich promoter regions |
| Annealing Temperature (Ta) | 5°C below primer Tm [46] | Optimized via gradient PCR | Critical for specificity with complex chromatin templates |
Experimental Protocols for Primer Validation
In Silico Validation Workflow
Before synthesizing primers, comprehensive computational validation ensures specificity and optimal binding characteristics:
Target Identification: Extract 200-400 bp sequences surrounding ChIP-seq peaks using genome browsers. For control regions, select areas showing no enrichment in ChIP-seq data [18].
Specificity Verification: Perform BLAST analysis against the appropriate genome to ensure primers are unique to the target region. This is particularly crucial for histone modifications that may occur across gene families [46] [48].
Secondary Structure Analysis: Use tools like OligoAnalyzer to evaluate hairpin formation and self-dimerization potential. The ΔG value of any secondary structures should be weaker (more positive) than -9.0 kcal/mol [46] [47].
Cross-Dimerization Check: Analyze potential interactions between forward and reverse primers using Multiple Primer Analyzer tools, especially when designing multiple primer sets for the same experiment [48].
Experimental Validation Protocol
After in silico design, wet-lab validation confirms primer performance:
Template Preparation: Use input DNA (pre-IP sonicated chromatin) diluted to equivalent concentrations as ChIP samples [18].
Annealing Temperature Optimization: Perform gradient PCR with temperatures ranging 5°C above and below the calculated Tm. Identify the temperature producing the lowest Cq without non-specific amplification [49] [46].
Efficiency Calculation: Serially dilute input DNA (1:10, 1:100, 1:1000) and amplify with candidate primers. Calculate efficiency from the slope of the standard curve (E = 10^(-1/slope) - 1). Ideal efficiency ranges from 90–110% [49].
Specificity Verification: Analyze PCR products by melt curve analysis and/or agarose gel electrophoresis to confirm a single product of expected size [49].
Enrichment Validation: Test primers with ChIP DNA versus control IgG IP DNA. Primers for enriched regions should show ≥5-fold enrichment compared to non-enriched control regions [18].
Special Considerations for Histone Modification Studies
Histone modifications present unique challenges for primer design, particularly when targeting promoter regions that are often GC-rich. These regions can form stable secondary structures that impede polymerase progression [50]. Several strategies address these challenges:
Polymerase Selection: Specialty polymerases such as Q5 High-Fidelity DNA Polymerase or OneTaq DNA Polymerase with GC Enhancer significantly improve amplification of GC-rich templates (up to 80% GC content) [50].
Additive Optimization: DMSO, glycerol, and betaine can reduce secondary structure formation. Commercial GC enhancers often contain optimized mixtures of these additives [50].
Magnesium Concentration Adjustment: Increasing MgCl₂ concentration (testing 1.0–4.0 mM in 0.5 mM increments) can enhance polymerase processivity in GC-rich regions [50].
Table 3: Key Research Reagent Solutions for ChIP-qPCR
| Reagent Category | Specific Examples | Function | Application Context |
|---|---|---|---|
| Polymerases for GC-Rich Templates | OneTaq DNA Polymerase with GC Buffer, Q5 High-Fidelity DNA Polymerase with GC Enhancer [50] | Amplify challenging templates | GC-rich promoter regions common in histone modification studies |
| Commercial Master Mixes | OneTaq Hot Start 2X Master Mix with GC Buffer [50] | Convenient, optimized formulations | High-throughput validation studies |
| Enhancement Additives | DMSO, betaine, formamide [50] | Reduce secondary structures | Troubleshooting difficult amplifications |
| Design Tools | IDT PrimerQuest, OligoAnalyzer, NCBI Primer BLAST [46] [48] | In silico primer design and analysis | Initial design phase |
| Verification Databases | ChIPprimersDB [18] | Access to previously verified primers | Preliminary research and design validation |
Effective qPCR primer design for ChIP validation requires a multifaceted approach that combines computational design with empirical optimization. While standard qPCR principles provide a foundation, the specialized nature of ChIP templates demands additional considerations including verification against non-enriched genomic regions and accommodation of crosslinked, fragmented DNA. The most successful implementations utilize a combination of curated databases like ChIPprimersDB for preliminary research, sophisticated design tools like PrimerQuest for custom designs, and systematic experimental validation to confirm specificity and efficiency. By adopting this comprehensive approach, researchers can generate qPCR data that provides statistically rigorous validation of ChIP-seq findings, strengthening conclusions about histone modification patterns and their functional consequences.
Chromatin Immunoprecipitation followed by quantitative PCR (ChIP-qPCR) is a fundamental technique in epigenetic research for investigating in vivo protein-DNA interactions, such as those involving histone modifications. The accuracy of this technique is highly dependent on appropriate data normalization to account for technical variability including chromatin input amount, immunoprecipitation efficiency, and DNA recovery. Within the broader context of validating histone modification ChIP-seq findings, qPCR provides a targeted, quantitative, and cost-effective method for confirming modifications at specific genomic regions of interest. Two predominant methods have emerged for normalizing ChIP-qPCR data: Percent Input and Fold Enrichment, each with distinct advantages, limitations, and appropriate applications [51] [21].
Normalization Methodologies: A Comparative Analysis
Core Principles and Mathematical Foundations
The Percent Input method directly quantifies the proportion of immunoprecipitated target sequence relative to the total amount present in the starting chromatin material. This approach normalizes against both background signals and the input chromatin used in the immunoprecipitation reaction. In contrast, the Fold Enrichment method calculates a signal-to-noise ratio by comparing the amount of target sequence in the specific antibody immunoprecipitate to that in a negative control, typically a no-antibody control or isotype control [51] [21].
Mathematical Formulations:
Percent Input Calculation:
- Traditional Formula: % Input = 2^[(Cq(IN) - Log₂(DF)) - Cq(IP)] × 100
- Simplified Practical Calculation: % Input = 100 × 2^(Adjusted Input - Ct(IP))
- Input Adjustment: Adjusted Input = Ct Input - Log₂(Dilution Factor)
- Dilution Factor (DF): DF = Initial Volume IP / Initial Volume IN [51]
Fold Enrichment Calculation:
- Fold Enrichment = 2^[Cq(Negative Control) - Cq(IP)] [51]
Table 1: Key Parameters for ChIP-qPCR Normalization Calculations
| Parameter | Description | Measurement | Impact on Calculation |
|---|---|---|---|
| Cq(IP) | Quantification cycle for immunoprecipitated sample | qPCR cycle number | Inverse relationship with target abundance |
| Cq(IN) | Quantification cycle for input sample | qPCR cycle number | Represents total target sequence available |
| Cq(Negative Control) | Quantification cycle for negative control (e.g., IgG) | qPCR cycle number | Determines background signal level |
| Dilution Factor | Ratio of lysate volumes between IP and Input paths | Unitless ratio | Critical for accurate % Input calculation |
| PCR Efficiency | Amplification efficiency of qPCR reaction | Percentage or fold | Affects accuracy of both calculations if not 100% |
Experimental Protocol for Method Implementation
Sample Processing Workflow:
- Chromatin Preparation: Shear cross-linked chromatin to appropriate fragment size (200-500 bp)
- Pathway Division: Split each sample lysate into Input and Immunoprecipitation pathways
- Immunoprecipitation: Incubate IP pathway with target-specific antibody and Protein A/G beads
- DNA Isolation: Reverse cross-links and purify DNA from both Input and IP samples
- qPCR Analysis: Amplify target regions using sequence-specific primers [51]
Critical Pipetting Considerations: Precise pipetting is essential at three key stages: (1) addition of lysate into IN or IP paths, (2) volume of elution buffer for final IN and IP isolates, and (3) volume of isolate added to each qPCR reaction. The Input path typically receives 5-100 times less lysate than the IP path, which must be accounted for with accurate dilution factor calculation [51].
Figure 1: ChIP-qPCR Experimental Workflow for Normalization Analysis
Comparative Performance Analysis
Method Advantages and Limitations
Table 2: Direct Comparison of Percent Input vs. Fold Enrichment Methods
| Characteristic | Percent Input | Fold Enrichment |
|---|---|---|
| Normalization Basis | Total input chromatin | Negative control background |
| Reproducibility | High | Variable |
| Background Accounting | Built into calculation | Dependent on control quality |
| Negative Control Requirement | Optional | Mandatory |
| Susceptibility to Artifacts | Low | High (varies with background) |
| Quantitative Interpretation | Direct percentage of total | Relative to background |
| Recommended Application | Quantitative comparisons | Signal-to-noise estimation |
The Percent Input method provides a more direct biological interpretation by expressing results as the percentage of total target sequences bound by the protein of interest. This enables more straightforward comparisons between samples and experimental conditions. The Fold Enrichment method's primary limitation lies in its dependence on the quality and consistency of negative controls, which can vary between antibody batches, bead types, and experimental replicates [51] [21].
Experimental Validation and Data Quality Assessment
Robust ChIP-qPCR experiments should incorporate several quality control measures:
- Replication: Both technical and biological replicates are essential
- Controls: Include both isotype controls and no-antibody controls
- Primer Validation: Ensure specific amplification of target regions
- Data Visualization: Utilize methods like "dots in boxes" plots that represent calculated efficiency against delta Cq with quality scores based on curve characteristics [52]
Advanced analysis tools such as histoneHMM, a bivariate Hidden Markov Model designed for differential analysis of histone modifications with broad genomic footprints, can complement qPCR validation by identifying functionally relevant differentially modified regions from ChIP-seq data [10].
Figure 2: Decision Pathway for Selection of Appropriate Normalization Method
The Scientist's Toolkit: Essential Research Reagents and Materials
Table 3: Key Research Reagent Solutions for ChIP-qPCR Normalization
| Reagent/Material | Function | Considerations for Normalization |
|---|---|---|
| Target-specific Antibody | Immunoprecipitation of histone-DNA complexes | Specificity critical for minimizing background; validation essential |
| Protein A/G Magnetic Beads | Antibody binding and complex pull-down | Lot-to-lot variability affects background in Fold Enrichment |
| qPCR Master Mix | Amplification and detection of target sequences | Efficiency impacts both % Input and Fold Enrichment calculations |
| Sequence-specific Primers | Amplification of target genomic regions | Specificity and efficiency must be validated for accurate Cq values |
| Chromatin Shearing Reagents | Fragment DNA to appropriate size | Efficiency affects antibody accessibility and IP yield |
| DNA Purification Kit | Isolation of DNA after immunoprecipitation | Recovery impacts absolute values in % Input method |
| Negative Control Antibody | Determination of non-specific background | Critical for Fold Enrichment method; isotype-matched recommended |
Advanced Applications in Histone Modification Validation
In validating histone modification ChIP-seq data with qPCR, normalization choice becomes particularly important for modifications with broad genomic footprints such as H3K27me3 and H3K9me3. These heterochromatin-associated marks form large domains spanning thousands of basepairs, presenting normalization challenges that differ from sharp, peak-like modifications [10].
The Constant Amount % Input method represents a novel advancement that addresses a common experimental error where researchers accidentally run qPCR with a constant amount of isolate (in nanograms of DNA) rather than constant volume. This method normalizes such data to provide the same reproducible Percent Input values as the traditional method, increasing the number of possible data points per sample while maintaining consistent results [51].
For studies comparing histone modification states between experimental conditions, Percent Input normalization provides more reliable quantitative data, as demonstrated in validation studies where it correctly identified differentially modified regions that were functionally confirmed with RNA-seq expression analysis [10].
In the study of epigenetic mechanisms, Chromatin Immunoprecipitation followed by sequencing (ChIP-seq) has become the predominant method for genome-wide mapping of histone modifications and transcription factor binding sites. However, the transition from genome-wide discovery to targeted validation remains a critical juncture in epigenetic research. Chromatin Immunoprecipitation followed by quantitative PCR (ChIP-qPCR) persists as the indispensable benchmark for confirming protein-DNA interactions at specific genomic regions identified through ChIP-seq screening [19]. This methodological synergy enables researchers to move from broad epigenetic landscapes to precise, quantifiable regulatory events, forming the foundation for mechanistic studies in gene regulation, development, and disease.
The integration of these techniques is particularly crucial for histone modification studies, where the biological interpretation of chromatin states depends on robust, reproducible enrichment measurements. While ChIP-seq provides unprecedented breadth in identifying potential regulatory regions across the genome, ChIP-qPCR delivers the quantitative precision and statistical confidence required for rigorous hypothesis testing [19]. This comparison guide examines the technical performance, experimental requirements, and analytical considerations of both platforms to establish a framework for effective cross-platform validation in epigenetic research.
Technical Comparison: Platform Capabilities and Performance Metrics
Core Characteristics and Applications
Table 1: Fundamental characteristics of ChIP-seq and ChIP-qPCR
| Feature | ChIP-seq | ChIP-qPCR |
|---|---|---|
| Throughput | Genome-wide discovery | Targeted validation (typically 5-20 loci) |
| Resolution | 100-300 bp (depends on fragmentation size) [6] | Single nucleosome resolution (amplicon size ≤150 bp) [19] |
| Primary Application | Unbiased mapping of binding sites/epigenetic marks | Confirmation of candidate regions with quantitative precision |
| Sample Requirements | 1-10 million cells (depending on protein abundance) [6] | ~10 million cells recommended per assay [19] |
| Key Strengths | Comprehensive coverage, novel discovery, motif analysis | High sensitivity, precise quantification, low equipment cost |
| Limitations | Higher cost, computational complexity, background noise | Limited to predefined regions, antibody consumption |
Performance and Validation Metrics
Table 2: Performance metrics and validation standards
| Parameter | ChIP-seq | ChIP-qPCR |
|---|---|---|
| Sensitivity | Detects 70-95% of known sites (varies by factor) [7] | Can detect enrichment as low as 2-fold over background |
| Specificity Controls | Input DNA, IgG, knockout models [6] [7] | Input DNA, IgG, non-binding genomic regions [19] |
| Quantification Method | Read enrichment, FRiP scores, peak statistics [53] | % Input or ΔΔCt method for fold enrichment [19] |
| Reproducibility | Biological replicates with IDR analysis recommended [7] | Technical replicates with standard deviation/error |
| Validation Standard | qPCR confirmation at selected peaks | Independent ChIP followed by qPCR |
Experimental Design for Cross-Platform Correlation
Strategic Experimental Framework
Figure 1: Integrated experimental workflow for ChIP-seq and qPCR correlation
Antibody Validation and Quality Control
The foundation of any successful ChIP experiment lies in antibody specificity and performance. For both platforms, rigorous antibody validation is essential. The ENCODE consortium guidelines recommend a tiered validation approach including immunoblot analysis to confirm that the primary reactive band contains at least 50% of the signal observed on the blot, ideally corresponding to the expected size of the target protein [7]. Additional validation through immunofluorescence demonstrating expected nuclear staining patterns or using knockout controls provides further confidence in antibody specificity [7].
For histone modification studies, it is particularly important to note that antibodies sufficient for locus-specific detection via ChIP-qPCR may not always perform adequately for genome-wide ChIP-seq studies. As a general guideline, antibodies showing ≥5-fold enrichment in ChIP-qPCR assays at several positive-control regions compared to negative control regions typically work well for ChIP-seq [6]. This performance threshold makes ChIP-qPCR not only a validation tool but also an essential upfront quality control measure for ChIP-seq experiments.
Sample Preparation and Chromatin Optimization
Table 3: Sample preparation requirements across platforms
| Parameter | ChIP-seq | ChIP-qPCR | Correlation Consideration |
|---|---|---|---|
| Cell Number | 1-10 million cells [6] | ~10 million cells per assay [19] | Use matched cell numbers when comparing |
| Crosslinking | 1% formaldehyde, 10-15 minutes | 1% formaldehyde, 10-15 minutes | Identical conditions essential |
| Chromatin Fragmentation | Sonication to 200-300 bp [6] | Sonication to 200-500 bp [19] | Match fragment sizes (200-300 bp ideal) |
| Quality Assessment | Fragment analyzer, qPCR at positive/negative loci | Fragment analyzer, qPCR at positive/negative loci | Identical quality thresholds |
Chromatin fragmentation represents a critical parameter influencing data correlation between platforms. For histone modifications, micrococcal nuclease (MNase) digestion of native chromatin may be preferred because it generates high-resolution data for nucleosome modifications and eliminates artifactual signals caused by cross-linking [6]. However, the fragmentation method must be consistent between the ChIP-seq and validation qPCR experiments to ensure comparable enrichment measurements.
Analytical Approaches for Data Integration
ChIP-seq Analysis and Peak Prioritization
The selection of appropriate genomic regions for qPCR validation requires thoughtful bioinformatic analysis of ChIP-seq data. For histone modifications, which may exhibit broad enrichment domains rather than sharp peaks, specialized analysis approaches are necessary. The MACS2 algorithm provides robust peak calling for both point-source and broad-source factors through its dynamic fragment size estimation and local bias correction capabilities [54].
A key consideration for histone modification studies is that enrichment estimation methods incorporating spatial distribution across entire gene bodies provide superior performance compared to tag-counting methods focused only on promoter regions [55]. For example, H3K36me3 shows greater enrichment in gene bodies rather than promoter regions, and 5'-biased estimation methods would underestimate its correlation with transcriptional elongation [55].
When prioritizing regions for qPCR validation, consider:
- Peak strength: Prioritize regions with high statistical significance (q-value < 0.01) and strong enrichment
- Genomic context: Include peaks in promoters, gene bodies, and intergenic regions
- Background regions: Include negative control regions lacking enrichment
- Positive controls: Include well-characterized positive control regions when available
qPCR Validation and Normalization Strategies
Figure 2: qPCR data analysis workflow for ChIP validation
ChIP-qPCR data analysis employs two complementary normalization approaches that provide different perspectives on enrichment:
% Input Method: Calculates the percentage of the input DNA recovered in the immunoprecipitated fraction, providing a straightforward measure of absolute recovery [19].
ΔΔCt Method: Normalizes ChIP sample Ct values first to input DNA, then to negative controls (IgG or non-binding regions), generating fold-enrichment values that account for both technical variation and non-specific background [19].
Both methods require appropriate control regions including:
- Input DNA: Represents the total chromatin before immunoprecipitation
- IgG controls: Measure non-specific antibody background
- Non-binding genomic regions: Establish baseline enrichment in genomic regions lacking the target modification
- Positive control regions: Provide benchmark for successful immunoprecipitation
Correlation Methodology and Interpretation
Quantitative Correlation Framework
Establishing a robust correlation between ChIP-seq and qPCR data requires both quantitative and qualitative assessment. The following approach ensures comprehensive evaluation:
Selection of diverse genomic regions: Include 10-20 regions representing a spectrum of enrichment levels from strong peaks to background regions
Direct quantitative comparison: Calculate Pearson correlation between ChIP-seq read density (normalized reads per million) and qPCR fold-enrichment values
Categorical agreement assessment: Classify regions as positive or negative based on statistical thresholds and calculate concordance
Sensitivity and specificity calculation:
- Sensitivity = True Positives / (True Positives + False Negatives)
- Specificity = True Negatives / (True Negatives + False Positives)
For histone modifications with broad domains, such as H3K9me3 or H3K36me3, correlation should be assessed across the entire domain rather than at single points, potentially requiring multiple qPCR amplicons across the region of interest [55].
Troubleshooting Discordant Results
Discordant results between ChIP-seq and qPCR validation can arise from several technical factors:
- Chromatin fragmentation differences: Ensure consistent fragmentation between experiments
- Input DNA variability: INPUT-seq profiles show significant variation that can impact peak calling [56]
- Peak calling parameters: Overly stringent or lenient parameters can generate false negatives or false positives
- qPCR amplification efficiency: Primer pairs with suboptimal efficiency (outside 90-110%) generate inaccurate quantification
- Genomic context effects: Repetitive regions or areas with poor mappability can artificially inflate or suppress ChIP-seq signals [57]
When discordance occurs, independent verification through replicate ChIP experiments using different biological samples provides the most definitive resolution.
Research Reagent Solutions
Table 4: Essential reagents and resources for correlated ChIP studies
| Reagent Type | Function | Quality Considerations |
|---|---|---|
| Specific Antibodies | Target immunoprecipitation | ChIP-grade validation; ≥5-fold enrichment in qPCR [6] |
| Control IgG | Non-specific background measurement | Species-matched, non-immune serum |
| qPCR Primers | Target amplification | Amplicon size ≤150 bp; efficiency 90-110% [19] |
| Chromatin Shearing Reagents | DNA fragmentation | Consistent fragment size 200-300 bp [6] |
| Library Preparation Kits | Sequencing library construction | Low bias, high complexity libraries |
| qPCR Master Mix | Quantitative amplification | High efficiency, robust signal detection |
The integration of ChIP-seq discovery with ChIP-qPCR validation represents a methodological imperative in modern epigenetic research. While ChIP-seq provides the breadth for genome-wide hypothesis generation, ChIP-qPCR delivers the quantitative precision required for rigorous validation. Through strategic experimental design, standardized normalization practices, and systematic correlation analysis, researchers can leverage the complementary strengths of both platforms to build robust, reproducible models of chromatin-mediated regulation. This integrated approach is particularly crucial for histone modification studies, where the biological interpretation of chromatin states directly informs mechanistic understanding of gene regulation in development, physiology, and disease.
Solving Common Pitfalls: Troubleshooting Your ChIP-seq and qPCR Experiments
In the study of epigenetics, chromatin immunoprecipitation followed by sequencing (ChIP-seq) has become an indispensable technique for mapping genome-wide distributions of histone modifications. However, the reliability of these datasets is fundamentally dependent on the quality and consistency of the antibodies used for immunoprecipitation. Antibody-related challenges, specifically cross-reactivity and lot-to-lot variability, present significant obstacles to experimental reproducibility and data integrity in histone modification research. These issues are particularly problematic when seeking to validate ChIP-seq findings with quantitative PCR (qPCR), as antibody imperfections can lead to false positive or false negative results, ultimately compromising biological interpretations. This guide examines the core challenges associated with research antibodies and provides objective comparisons of solutions, with a specific focus on applications in histone modification studies where validation against qPCR gold standards is essential.
Understanding the Core Challenges
Cross-reactivity in Immunoassays
Cross-reactivity occurs when an antibody directed against one specific antigen demonstrates affinity toward a different antigen that shares similar structural regions. In ChIP-seq experiments for histone modifications, this can manifest as antibody recognition of unrelated proteins or different histone modifications with similar epitopes, leading to enriched regions that do not represent true binding sites for the target of interest.
The structural basis for cross-reactivity lies in the Fab region of the antibody, which determines antigen affinity. When two antigens share similar structural motifs, the same antibody may bind both, though potentially with different affinities. The risk of cross-reactivity is significantly higher with polyclonal antibodies, as they contain a heterogeneous mixture of antibodies recognizing multiple epitopes along the immunogen sequence. In contrast, monoclonal antibodies represent a homogeneous population targeting a single epitope, generally offering superior specificity [58].
For histone modification studies, assessing potential cross-reactivity begins with evaluating the sequence homology between the target immunogen and potential off-target proteins. According to manufacturer guidelines, approximately 75% homology with the immunogen sequence predicts almost guaranteed cross-reactivity, while anything exceeding 60% has a strong likelihood of cross-reacting, though this requires experimental verification in an assay-specific manner [58].
Lot-to-Lot Variability
Lot-to-lot variance (LTLV) refers to performance fluctuations between different batches or lots of the same antibody product. This variability represents a critical reproducibility challenge in research, particularly for long-term studies requiring consistent antibody performance across multiple experimental cycles.
The primary sources of LTLV stem from two key areas: raw material quality fluctuations (accounting for approximately 70% of immunoassay performance) and deviations in manufacturing processes (accounting for the remaining 30%) [59]. Key biological reagents including antigens, antibodies, and enzymes are inherently variable due to their complex production processes. For instance, antibodies sourced from hybridoma cells may exhibit aggregation, fragmentation, or variations in post-translational modifications across different production runs [59].
This variability is particularly problematic for polyclonal antibodies, where different bleeds from the same animal can demonstrate dramatic variations in immunoreactivity and specificity profiles, as evidenced by western blot analyses showing differing band intensities and cross-reactive patterns across sequential bleeds [60]. These inconsistencies can substantially impact ChIP-seq data quality and subsequent qPCR validation efforts.
Comparative Analysis of Solutions
The table below summarizes the advantages and disadvantages of different antibody types in the context of cross-reactivity and lot-to-lot variability:
Table 1: Comparison of Antibody Types for Histone Modification Studies
| Antibody Type | Cross-Reactivity Risk | Lot-to-Lot Variability | Best Use Cases in Histone Research |
|---|---|---|---|
| Polyclonal | High (recognizes multiple epitopes) | High (without pooling strategies) | Detecting linear histone epitopes; when cross-reactivity with homologs is desired |
| Monoclonal | Low (single epitope specificity) | Low (consistent hybridoma source) | Discriminating between specific histone modification states (e.g., me1 vs me3) |
| Recombinant | Low (sequence-defined) | Very Low (recombinant production) | Long-term studies requiring maximum reproducibility; multiplexed experiments |
| Cross-Adsorbed Secondaries | Very Low (removed via adsorption) | Moderate (depends on purification) | Multiplexing experiments; reducing background in complex samples |
Addressing Cross-reactivity
Multiple strategies exist to mitigate antibody cross-reactivity in histone modification studies:
Epitope Characterization: Antibodies raised against well-defined, modification-specific epitopes (e.g., trimethylated H3K4 peptides) generally demonstrate superior specificity compared to those targeting full-length histone proteins [6].
Species-Specific Validation: For antibodies used in non-human model systems, NCBI-BLAST analysis of immunogen sequence against the target species proteome can predict potential cross-reactivity. Homology exceeding 60% suggests high likelihood of reactivity [58].
Knockout/Knockdown Controls: The most rigorous approach for verifying antibody specificity involves performing ChIP in cell lines where the target histone modification has been genetically eliminated or enzymatically erased. Any remaining signal represents non-specific binding [6] [61].
Alternative Clonality: Switching from polyclonal to monoclonal antibodies can resolve issues with non-specific binding, particularly when the monoclonal antibody targets a unique epitope not shared by related proteins [58].
Managing Lot-to-Lot Variability
Several approaches can minimize the impact of lot-to-lot variability:
Serum Pooling: For polyclonal antibodies, pooling serum from multiple animals or bleeds before purification creates a more consistent starting material, dramatically reducing variability between lots [60].
Recombinant Antibodies: Recombinant antibodies offer superior lot-to-lot consistency as they are produced from defined nucleic acid sequences rather than biological systems like hybridomas [59].
Rigorous Quality Control: Implementation of standardized quality control measures during production, including assessments of purity, stability, aggregation, and activity, helps maintain consistency [59].
Comprehensive Documentation: Suppliers should provide batch-specific validation data rather than generic product information, enabling researchers to make informed decisions about antibody suitability [62].
Experimental Protocols for Validation
Validating Antibody Specificity for Histone Modifications
Proper validation of antibody specificity is essential for generating reliable ChIP-seq data. The following protocol outlines key steps for characterizing antibodies for histone modification studies:
Pre-Validation Bioinformatics Assessment
- Perform NCBI-BLAST analysis of the immunogen sequence against the proteome of your experimental species
- Check for homology >60% with non-target proteins that might cause cross-reactivity
- Utilize resources like the ENCODE Consortium guidelines for antibody validation [61]
Western Blot Specificity Testing
- Extract histones from your cell type of interest using acid extraction
- Resolve extracts on 15% SDS-PAGE gels and transfer to membranes
- Probe with your antibody at multiple concentrations
- The antibody should produce a single strong band at the expected molecular weight (e.g., ~15 kDa for core histones)
- Multiple bands suggest potential cross-reactivity with non-target proteins [62]
Peptide Competition Assay
- Incubate antibody with excess target peptide (e.g., H3K4me3) or non-target control peptide (e.g., unmodified H3)
- Perform western blot or dot blot with pre-incubated antibodies
- Specific binding should be abolished only by the target peptide, not control peptides
- This validates epitope specificity rather than general histone recognition [6]
Immunofluorescence Validation
- Fix cells and perform immunofluorescence with the antibody
- The staining pattern should match expected nuclear localization
- Compare pattern to published results for the same modification
- Treat cells with inhibitors of modifying enzymes (e.g., methyltransferase inhibitors) to demonstrate signal reduction [58]
ChIP-qPCR Correlation
- Perform ChIP with the antibody followed by qPCR at known positive and negative control regions
- Enrichment should be observed only at positive control loci
- Include biological replicates to assess technical variability
- A good antibody should show ≥5-fold enrichment at positive versus negative control regions [6]
Assessing Lot-to-Lot Consistency
When evaluating new lots of established antibodies, the following comparative protocol ensures consistent performance:
Parallel Testing Setup
- Process the previous validated lot and new test lot simultaneously
- Use identical cell numbers, fixation conditions, and sonication parameters
- Include reference samples that have been characterized with the previous lot
QC Benchmarking Assays
- Perform western blots with both lots on identical membrane splits
- Conduct pilot ChIP-qPCR experiments with 3-5 positive control loci and 2-3 negative control regions
- Calculate fold-enrichment ratios for each lot and compare
- Acceptable lots should show <20% deviation in enrichment ratios [59]
Cross-Lot Normalization
- If slight variability exists, establish normalization factors based on control region signals
- Apply these factors to subsequent experiments with the new lot
- Document any normalization procedures in method sections
The diagram below illustrates the decision-making workflow for antibody validation in histone modification studies:
The Scientist's Toolkit: Essential Research Reagent Solutions
The table below outlines key reagents and materials essential for addressing antibody challenges in histone modification research:
Table 2: Research Reagent Solutions for Histone Modification Studies
| Reagent/Material | Function | Considerations for Histone Research |
|---|---|---|
| Modification-Specific Antibodies | Immunoprecipitation of target histone marks | Select antibodies with published ChIP-seq data; verify clonality |
| Control Peptides | Specificity validation via competition | Should include both modified and unmodified versions |
| Histone Extraction Kits | Acid-based histone purification | Maintains post-translational modifications; compatible with western blot |
| Cross-linking Reagents | Protein-DNA fixation for ChIP | Formaldehyde concentration and time affect epitope accessibility |
| Chromatin Shearing Reagents | DNA fragmentation to 200-300bp | Sonication efficiency varies by cell type; optimize for each system |
| Magnetic Protein A/G Beads | Antibody-chromatin complex isolation | Binding capacity varies; consistent bead lots improve reproducibility |
| qPCR Master Mixes | Quantification of enriched DNA | SYBR Green chemistry sufficient for most validation experiments |
| Spike-in Controls | Normalization between samples | Use chromatin from distant species (e.g., Drosophila for human studies) |
| Reference Genomic DNA | Input control for ChIP experiments | Sequence deeper than ChIP samples for better background modeling |
Addressing antibody cross-reactivity and lot-to-lot variability is fundamental to generating robust, reproducible ChIP-seq data for histone modification studies. Through systematic validation protocols, careful reagent selection, and implementation of appropriate controls, researchers can significantly enhance the reliability of their epigenetic findings. As the field moves toward recombinant antibodies and more standardized validation practices, the community stands to benefit from increased experimental reproducibility. By adopting the comparative approaches and experimental frameworks outlined in this guide, scientists and drug development professionals can navigate the complex landscape of research antibodies with greater confidence, ultimately strengthening the foundation of epigenetic discovery.
Chromatin shearing is a critical step in chromatin immunoprecipitation followed by sequencing (ChIP-seq), directly impacting the resolution, specificity, and overall quality of epigenetic data. Achieving ideal fragment sizes—typically 200–500 base pairs for histone modifications—is essential for generating high-quality genome-wide binding profiles. This process presents significant technical challenges, particularly when working with complex solid tissues, where cellular heterogeneity and dense matrices can impede efficient and reproducible fragmentation. The optimization of shearing methodologies ensures not only the effective liberation of chromatin fragments but also the preservation of protein–DNA interactions, enabling accurate mapping of histone modifications and transcription factor binding sites in their physiological context [35] [63].
This guide objectively compares the performance of mechanical and enzymatic chromatin shearing techniques, providing supporting experimental data to help researchers select the most appropriate method for validating histone modification ChIP-seq with qPCR.
Shearing Methodologies: A Technical Comparison
Chromatin fragmentation strategies primarily fall into two categories: mechanical shearing using acoustic energy and enzymatic digestion using micrococcal nuclease (MNase) or tagmentase. The choice between these methods significantly influences coverage uniformity, fragment size distribution, and experimental outcomes.
Table 1: Comparative Analysis of Chromatin Shearing Methods
| Feature | Mechanical Shearing (AFA) | Enzymatic Shearing (MNase) | Enzymatic Shearing (Tagmentation) |
|---|---|---|---|
| Principle | Adaptive Focused Acoustics [64] | Micrococcal Nuclease digestion [63] | Transposase-based tagmentation [65] |
| Typical Input | Versatile (cells & tissues) [35] [64] | Often lower cell number requirements [65] | Low-input suitable [65] |
| Fragment Size Control | Highly controllable and reproducible [64] | Bias towards mononucleosomes [63] | Sequence-dependent bias [66] |
| GC-Bias | More uniform coverage across GC regions [66] | Not explicitly covered | Preferential cleavage in low-GC regions [66] |
| Epitope Integrity | Isothermal processing preserves integrity [64] | Preserves native interactions without crosslinking [63] | Not explicitly covered |
| Best For | Standardized, reproducible shearing; complex tissues [35] [64] | Mapping nucleosome positions; native ChIP (N-ChIP) [63] | Low-input projects; techniques like CUT&Tag [65] |
Detailed Experimental Protocols for Chromatin Shearing
Protocol 1: Mechanical Shearing of Solid Tissues with AFA
This protocol, optimized for solid tissues like colorectal cancer, ensures reproducible chromatin extraction from dense and heterogeneous matrices [35].
Materials:
- Frozen tissue samples
- 1× phosphate-buffered saline (PBS) supplemented with protease inhibitors
- Covaris truChIP Chromatin Shearing Tissue Kit [64]
- AFA-focused ultrasonicator (e.g., Covaris E220)
- Dounce tissue grinder or gentleMACS Dissociator
Procedure:
- Tissue Preparation and Homogenization:
- Retrieve frozen tissue on ice and mince it finely with scalpel blades in a Petri dish on ice.
- Transfer the minced tissue to a Dounce grinder or gentleMACS C-tube.
- For Dounce homogenization, add 1 ml of cold PBS with protease inhibitors and apply 8–10 even strokes with the pestle. Rinse the grinder and combine washes in a 50-ml tube.
- For gentleMACS homogenization, add PBS and run the preconfigured "htumor03.01" program.
Cross-linking and Chromatin Extraction:
Acoustic Shearing:
- Transfer the lysate to a microTUBE and shear using the Covaris ultrasonicator.
- Standard parameters for achieving 200–500 bp fragments often include Peak Incident Power (PIP): 140–150, Duty Factor: 5%, Cycles per Burst: 200, Treatment Time: 60–180 seconds [64].
- The process is isothermal, maintaining epitope integrity and preventing crosslink reversal [64].
Protocol 2: Enzymatic Fragmentation via Micrococcal Nuclease
This approach is fundamental to Native ChIP (N-ChIP) and is suitable for low-input studies [63] [65].
Materials:
- Micrococcal Nuclease (MNase)
- Hyperactive Universal CUT&Tag Assay Kit [65]
- pA-Tn5 transposase (for CUT&Tag)
- Dig-wash buffer
- DNA clean beads
Procedure for N-ChIP [63]:
- Chromatin Preparation: Isolate chromatin from nuclei under gentle conditions without crosslinking.
- MNase Digestion: Digest chromatin with MNase to yield predominantly mononucleosomal fragments (∼147 bp). The digestion time and enzyme concentration must be optimized.
- Immunoprecipitation: Proceed directly to immunoprecipitation with specific antibodies.
Procedure for CUT&Tag [65]:
- Cell Permeabilization: Bind permeabilized cells to ConA beads.
- Antibody Incubation: Incubate with a primary antibody against the target histone modification (e.g., H3K27me3) overnight at 4°C.
- Tagmentation: Add a pA-Tn5 transposase complex, which is targeted to the protein-of-interest binding sites. The transposase simultaneously fragments and adds sequencing adapters to the surrounding DNA.
- DNA Purification: Extract and purify the DNA fragments for subsequent amplification and sequencing.
Performance and Validation Data
A systematic benchmark study comparing ChIP-seq, CUT&Tag, and CUT&RUN provides critical quantitative data on method performance. The study, analyzing histone modifications like H3K27me3 and H3K4me3, revealed that while all three methods reliably detect enrichment, CUT&Tag stands out for its comparatively higher signal-to-noise ratio [65].
Detailed peak comparison showed both overlapping and unique enrichment regions among the techniques. Furthermore, CUT&Tag was able to identify novel CTCF peaks missed by the other methods. The study also found a strong correlation between CUT&Tag signal intensity and chromatin accessibility, highlighting its ability to generate high-resolution signals in accessible genomic regions [65].
Regarding coverage uniformity—a critical factor for confident variant detection in clinical genes—mechanical fragmentation demonstrates superior performance. Research comparing PCR-free whole genome sequencing workflows showed that mechanical fragmentation yields a more uniform coverage profile across different sample types (blood, saliva, FFPE) and across the GC spectrum. In contrast, enzymatic workflows demonstrated more pronounced coverage imbalances, particularly in high-GC regions, which can affect the sensitivity of variant detection [66].
Essential Research Reagent Solutions
The following reagents and kits are fundamental to implementing the described chromatin shearing protocols.
Table 2: Key Reagents for Chromatin Shearing Workflows
| Item | Function | Example Product |
|---|---|---|
| AFA-Focused Ultrasonicator | Provides controlled, reproducible mechanical shearing via focused acoustic energy. | Covaris E220 [64] |
| truChIP Chromatin Shearing Kits | Optimized reagent systems for efficient shearing from cells or tissues. | truChIP Chromatin Shearing Tissue Kit [64] |
| Micrococcal Nuclease (MNase) | Digests linker DNA between nucleosomes for native ChIP protocols. | Various suppliers [63] |
| pA-Tn5 Transposase | Engineered protein for antibody-directed tagmentation in CUT&Tag. | Hyperactive Universal CUT&Tag Assay Kit [65] |
| Protease Inhibitor Cocktails | Prevents protein degradation during tissue homogenization and chromatin preparation. | Supplement in PBS [35] |
| MGI/Illumina Library Prep Kits | Facilitates library construction for sequencing after shearing. | Compatible with DNBSEQ-G99RS or NovaSeq platforms [35] [65] |
Shearing Workflow Visualization
Diagram 1: Chromatin shearing workflow for ChIP-seq. The diagram illustrates the key decision points for choosing between mechanical (green) and enzymatic (red) shearing paths, which lead to crosslinked ChIP (X-ChIP) or native ChIP/CUT&Tag protocols, respectively.
Diagram 2: Mechanical shearing protocol for solid tissues. This detailed workflow, optimized for challenging samples like colorectal cancer, highlights critical steps such as mincing on ice and the option for manual or semi-automated homogenization to preserve chromatin integrity [35].
Selecting an optimal chromatin shearing strategy is a fundamental decision in designing robust ChIP-seq experiments for histone modification studies. Mechanical shearing with AFA technology provides a standardized, reproducible, and versatile solution, especially effective for complex solid tissues and when uniform genomic coverage is paramount [35] [66] [64]. In contrast, enzymatic methods like MNase digestion and tagmentation offer advantages for low-input projects, native ChIP applications, and integration with modern techniques like CUT&Tag, which provides a high signal-to-noise ratio [63] [65].
The choice between these methods should be guided by the specific research context, including sample type, target epitope, and the desired balance between resolution and quantitative accuracy. By implementing the optimized protocols and considering the performance data outlined in this guide, researchers can achieve ideal chromatin fragment sizes, thereby ensuring the validity and reliability of their downstream histone modification ChIP-seq and qPCR analyses.
Selecting Robust Positive and Negative Control Loci for qPCR
Chromatin Immunoprecipitation followed by sequencing (ChIP-seq) has revolutionized our ability to map histone modifications across the genome. However, validating these genome-wide findings with quantitative PCR (qPCR) remains an essential step for confirming key results and ensuring technical accuracy. The selection of appropriate positive and negative control loci is not merely a technical formality but a fundamental determinant of experimental reliability in epigenetic research. Without properly validated controls, researchers cannot distinguish true biological signals from technical artifacts, potentially compromising data interpretation and subsequent conclusions in drug development pipelines.
Robust control loci serve as critical internal standards that verify the success of the ChIP procedure itself. They confirm that the immunoprecipitation step has efficiently enriched for histone modifications while demonstrating specificity through lack of amplification in appropriate negative regions. This practice is especially crucial when investigating chromatin states in response to therapeutic compounds or during disease progression, where accurate measurement of epigenetic changes can inform clinical development decisions.
Understanding Histone Modification Patterns for Control Selection
Different histone modifications exhibit predictable genomic distributions based on their established biological functions. This predictable patterning enables researchers to select control loci with confidence that they will consistently carry specific epigenetic marks across various cell types and conditions.
Characteristic Genomic Distributions of Key Histone Modifications
Table 1: Genomic Distribution Patterns of Major Histone Modifications
| Histone Modification | Associated Function | Primary Genomic Location | Expression Correlation |
|---|---|---|---|
| H3K4me3 | Transcriptional activation | Promoters and genic regions [67] | Active transcription [67] |
| H3K36me3 | Transcriptional elongation | Genic regions, especially highly expressed genes [67] | Active transcription [67] |
| H3K27me3 | Transcriptional repression | Genic regions with low transcription [67] | Repressed/Poised states [67] |
| H3K9me2 | Heterochromatic silencing | Pericentromeric heterochromatin and transposable elements [67] | Strong repression [67] |
The information in Table 1 provides the foundational knowledge needed to strategically select control loci. For example, active histone marks like H3K4me3 and H3K36me3 are highly enriched at transcriptionally active genes, making known highly expressed genes excellent candidates for positive controls for these modifications. Conversely, H3K27me3 marks developmentally regulated genes in a repressed state, while H3K9me2 is predominantly found in heterochromatic regions, often coinciding with repetitive elements and transposable elements.
Biological Basis for Control Loci Selection
The establishment of control loci is firmly grounded in the well-characterized biology of histone modifications. In Arabidopsis thaliana, which serves as an important model for epigenetic studies, more than 90% of H3K4me3 modifications are localized to genic regions, including promoters, with H3K4me3 specifically associated with actively transcribed genes [67]. Similarly, H3K36me3 is enriched in genic regions, particularly in highly expressed genes [67]. In contrast, H3K9me2 is predominantly observed in pericentromeric heterochromatin regions, especially in transposable elements, while H3K27me3 is found in genic regions with low levels of transcription and often exhibits tissue-specific patterns [67].
These conserved patterns across species enable researchers to select control loci based on genomic annotation. For instance, actively expressed housekeeping genes typically carry H3K4me3 marks at their promoters, while silenced developmental genes may harbor H3K27me3 domains. The intergenic regions and heterochromatic areas provide reliable negative controls for active marks, while highly transcribed genes serve as negative controls for repressive marks.
Experimental Validation of Control Loci: A Case Study
Theoretical distribution patterns provide guidance, but experimental validation remains essential for confirming the utility of potential control loci. A methodical approach to this validation was demonstrated in Brassica rapa, where researchers developed and verified control primer sets for four different histone modifications [67].
Validation Methodology and Results
Researchers systematically developed positive and negative control primer sets for H3K4me3, H3K9me2, H3K27me3, and H3K36me3 in Brassica rapa, a close relative of Arabidopsis thaliana [67]. The experimental workflow involved:
- Chromatin Immunoprecipitation using specific antibodies for each histone modification [67]
- Whole-genome amplification of immunoprecipitated DNA [67]
- Cloning and sequencing of ChIP fragments [67]
- Mapping sequenced fragments to the reference genome to identify enriched regions [67]
- Designing primer sets for putative positive and negative control regions [67]
- Experimental verification through ChIP-PCR and ChIP-qPCR [67]
This systematic approach allowed the researchers to identify genomic regions that consistently showed enrichment (positive controls) or no enrichment (negative controls) for each histone modification. The validated primer sets were then applied to examine vernalization-mediated chromatin changes in Brassica FLC paralogs, demonstrating their practical utility in a real biological context [67].
After vernalization, expression of all four BrFLC genes was reduced, and accumulation of H3K27me3 was observed in three of them, similar to the vernalization response in Arabidopsis thaliana [67]. The stability of FLC repression correlated with the accumulation of H3K27me3, suggesting that the epigenetic state during vernalization is important for high bolting resistance in B. rapa [67].
Quantitative Comparison of Control Loci Performance
Table 2: Experimentally Validated Control Loci Characteristics from Brassica rapa Study
| Histone Modification | Positive Control Features | Negative Control Features | Validation Method |
|---|---|---|---|
| H3K4me3 | Actively transcribed genes | Intergenic/silent regions | ChIP-qPCR [67] |
| H3K9me2 | Heterochromatic regions | Actively transcribed genes | ChIP-qPCR [67] |
| H3K27me3 | Developmentally repressed genes | Constitutively active genes | ChIP-qPCR [67] |
| H3K36me3 | Highly expressed genes | Inactive genomic regions | ChIP-qPCR [67] |
This experimental approach confirmed that the selected control loci performed consistently across biological replicates and technical repetitions, providing reliable benchmarks for assessing ChIP efficiency [67]. The researchers emphasized that validation of ChIP analysis by PCR or qPCR using positive and negative regions of histone modification is necessary, particularly in species like Brassica rapa where information about histone modifications was previously limited [67].
Technical Implementation and Workflow Integration
Implementing robust control strategies requires careful consideration of experimental design, normalization methods, and data analysis approaches. The following workflow and technical recommendations provide a framework for reliable ChIP-qPCR validation.
Comprehensive ChIP-qPCR Validation Workflow
ChIP-qPCR Control Validation Workflow: This diagram illustrates the systematic process for selecting and validating appropriate control loci for histone modification studies.
Essential Research Reagent Solutions
Table 3: Key Research Reagents for ChIP-qPCR Control Validation
| Reagent Category | Specific Examples | Function in Control Validation |
|---|---|---|
| Histone Modification Antibodies | Anti-H3K4me3 (Millipore, 07-473), Anti-H3K27me3 (Millipore, 04-449) [67] | Specific immunoprecipitation of modified histones |
| Chromatin Fragmentation Reagents | Micrococcal nuclease, Formaldehyde crosslinking reagents [68] | Chromatin preparation for ChIP |
| DNA Amplification & Detection | Whole-genome amplification kits (Sigma, GenomePlex Kit), SYBR Green dye chemistry, TaqMan probes [67] [69] | Amplification and quantification of immunoprecipitated DNA |
| qPCR Reagents | FastStart Essential DNA Green Master (Roche), Quick Taq HS DyeMix (Toyobo) [67] | Quantitative PCR amplification and detection |
| Reference Genes | RPS5, RPL8, HMBS (stable reference genes) [70] | Normalization of qPCR data |
qPCR Normalization Strategies
Appropriate normalization is critical for accurate qPCR data interpretation when using control loci. Several strategies have been systematically evaluated:
- Reference genes: Traditionally used for normalization, but require validation of stability across experimental conditions. In canine gastrointestinal tissues, RPS5, RPL8, and HMBS were identified as suitably stable reference genes [70].
- Global mean method: For studies profiling large gene sets (>55 genes), the global mean of expression of all tested genes can outperform traditional reference genes in reducing technical variability [70].
- Efficiency correction: Pfaffl method incorporates actual PCR efficiency values rather than assuming 100% efficiency, improving quantification accuracy [71].
The coefficient of variation (CV) of gene expression data after normalization provides a metric for evaluating different normalization strategies, with lower values indicating better performance in reducing technical variability [70].
Comparative Analysis of Control Loci Selection Strategies
Different experimental scenarios demand tailored approaches to control selection. The table below summarizes key considerations for various research contexts.
Table 4: Control Loci Strategy Selection Based on Experimental Context
| Experimental Scenario | Recommended Positive Control | Recommended Negative Control | Validation Priority |
|---|---|---|---|
| H3K4me3 Analysis | Promoters of highly expressed housekeeping genes | Intergenic regions or silent heterochromatin | Demonstrate high fold-enrichment over negative control |
| H3K27me3 Analysis | Developmentally repressed genes (e.g., FLC in plants) | Constitutively active genes | Show differential response to physiological cues |
| Drug Treatment Studies | Loci with known modification changes | Stable genomic regions unaffected by treatment | Confirm dose-dependent responses where appropriate |
| Cross-Species Studies | Evolutionarily conserved modified regions | Similarly conserved unmodified regions | Verify antibody cross-reactivity and specificity |
| Clinical Biomarker Development | Established diagnostic marker regions | Regions irrelevant to pathology | Prioritize reproducibility across sample batches |
Selecting robust positive and negative control loci for qPCR validation of histone modification ChIP-seq data requires both biological insight and experimental validation. The most effective control strategies:
- Leverage well-characterized genomic distributions of histone modifications to select candidate loci
- Require experimental validation through systematic ChIP-qPCR analysis
- Employ appropriate normalization strategies to account for technical variability
- Are context-dependent, with optimal controls varying by histone mark, biological system, and experimental question
As the field moves toward standardized validation protocols for clinical research assays [72], the implementation of rigorously validated control loci becomes increasingly important. By applying the principles and methodologies outlined in this guide, researchers can enhance the reliability of their epigenetic studies and contribute to robust, reproducible scientific discoveries in chromatin biology and drug development.
Mitigating Background Noise and Improving Signal-to-Noise Ratio
In epigenetic research, chromatin immunoprecipitation followed by sequencing (ChIP-seq) has become a foundational methodology for generating genome-wide maps of histone modifications. However, the quantitative comparison of ChIP-seq data between experimental conditions remains challenging due to significant background noise and variable signal-to-noise ratios. These technical limitations are particularly problematic when studying subtle epigenetic alterations in disease models or during cellular differentiation, where accurate quantification is essential for valid biological interpretation. The inherent variability of ChIP-seq data, stemming from differences in chromatin preparation, antibody efficiency, and sequencing artifacts, necessitates robust normalization strategies and careful experimental design. This guide objectively compares current methodologies for mitigating background noise in histone modification ChIP-seq, with a specific focus on validation through qPCR, providing researchers with a framework for selecting appropriate strategies based on their experimental goals.
Technical Comparison of Epigenomic Profiling Methods
The choice of experimental methodology significantly influences the background noise and signal-to-noise ratio in histone modification studies. The table below compares four principal techniques used in epigenomic profiling.
Table 1: Comparison of Epigenomic Profiling Techniques
| Category | ChIP-qPCR | ChIP-seq | CUT&RUN | CUT&Tag |
|---|---|---|---|---|
| Starting Material | High (typically 10⁴–10⁶ cells) | Very high (millions of cells) | Low (10³–10⁵ cells) | Extremely low (10³–10⁴ cells; single-cell possible) |
| Peak Resolution | Medium (several hundred bp) | High (tens to over a hundred bp) | Very high (down to single-digit bp) | Very high (down to single-digit bp) |
| Operational Complexity | High (requires crosslinking, shearing, IP; takes several days) | Very high (~1 week; includes multiple steps) | Moderate (no crosslinking; ~1–2 days) | Low (simplified in situ protocol; ~2 days) |
| Background Noise | Relatively high | Relatively high (many non-specific bindings) | Very low (in situ cleavage minimizes background) | Extremely low (adaptors inserted directly at target sites) |
| Primary Application | Validating and quantifying interactions at known loci | Genome-wide profiling of binding sites | High-resolution mapping, especially with low cell input | Profiling histone modifications in rare samples or high-throughput studies [73] |
While ChIP-seq remains a standard tool for genome-wide profiling, its relatively high background noise and substantial input requirements have driven the development of novel techniques like CUT&RUN and CUT&Tag. These newer methods leverage in situ cleavage to minimize non-specific background, offering superior signal-to-noise ratios with significantly lower input requirements [73]. However, ChIP-seq's main advantage lies in its maturity and reliability across a wide range of targets and sample types.
Advanced Normalization and Analysis Strategies for ChIP-seq
For researchers committed to ChIP-seq, several computational and experimental strategies can mitigate background noise and improve quantification.
Normalization Methods for Quantitative Comparison
Proper normalization is critical for comparing independent ChIP-seq datasets, as different antibodies and experimental conditions produce variable distributions of reads [74].
- Signal Extraction Scaling (SES): This robust method improves upon simple Sequencing Depth Scaling (SDS). SES operates on the principle that the IP channel is a mixture of background and immunoprecipitated DNA. It identifies a subset of genomic bins with low tag counts that represent background regions, then normalizes the input density using a scaling factor derived only from these background regions. This prevents the artificial inflation of background noise that can occur with total read count scaling [74].
- Spike-in Normalization: Spike-in controls using chromatin from an orthologous species (e.g., Drosophila chromatin in human samples) enable highly quantitative comparisons across cell states or models. These spike-ins serve as an internal standard for normalization, correcting for technical variability in chromatin preparation and immunoprecipitation efficiency. The PerCell methodology is one such approach that integrates cellular spike-ins with a flexible bioinformatic pipeline for quantitative epigenetic comparisons [75]. However, the utility of spike-ins can be context-dependent; they are most valuable for detecting gross-fold changes in widely distributed marks like H4K20me1, but the nonlinear nature of enrichment may limit their accuracy for all targets [76].
Specialized Algorithms for Broad Histone Modifications
Many histone modifications, such as heterochromatin-associated H3K27me3 and H3K9me3, form broad domains that are poorly detected by algorithms designed for sharp, peak-like features [10]. Specialized tools are required for their analysis.
- histoneHMM: This bivariate Hidden Markov Model (HMM) is designed specifically for differential analysis of histone modifications with broad genomic footprints. It aggregates short-reads over larger regions and uses an unsupervised classification to probabilistically identify genomic regions as modified in both samples, unmodified in both, or differentially modified. histoneHMM has been shown to outperform other methods in detecting functionally relevant differentially modified regions, as validated by qPCR and RNA-seq data [10].
Incorporating Spatial Distribution in Enrichment Estimation
The information content of a histone modification is encoded not just in its presence but in its spatial distribution relative to gene features. Model-based methods that spatially weight enrichment based on average patterns have been shown to provide an improvement over simple tag counting methods. Furthermore, methods that include information across the entire gene body, rather than focusing only on promoter regions, provide superior performance in regression models predicting gene expression. This is particularly important for marks like H3K36me3, which are enriched in gene bodies and would be underestimated by 5'-biased methods [55].
Experimental Protocols for Validation
Protocol: Quantitative ChIP-seq with Spike-in Normalization
This protocol enables more quantitative comparison of histone modification levels across different biological samples [75].
- Sample Preparation and Spike-in: Culture cells for experimental and control conditions. For the experimental sample, mix with a defined ratio of cells from an orthologous species (e.g., Drosophila S2 cells) before crosslinking. The ratio should be determined empirically but a 1:10 (spike-in:sample) ratio is a common starting point.
- Cross-linking and Chromatin Preparation: Crosslink cells with 1% formaldehyde for 10 minutes at room temperature. Quench the reaction with glycine. Lyse cells and isolate nuclei.
- Chromatin Shearing: Shear chromatin to an average fragment size of 200-500 bp using sonication. Optimize sonication conditions to avoid over- or under-shearing.
- Immunoprecipitation: Incubate sheared chromatin with a validated antibody specific to the histone modification of interest. Use Protein A/G magnetic beads to capture the antibody-bound complexes. Include a control sample with non-specific IgG.
- Washing and Elution: Wash beads stringently to reduce non-specific background. Elute protein-DNA complexes from the beads and reverse crosslinks by incubating at 65°C overnight.
- DNA Purification and Library Preparation: Purify the DNA and proceed to sequencing library construction. Sequence the libraries on an appropriate platform to obtain sufficient coverage.
- Bioinformatic Analysis with PerCell Pipeline: Map sequencing reads to a combined reference genome (e.g., hg38 + dm6). Use the PerCell pipeline or similar tools to separate reads originating from the experimental and spike-in genomes. Normalize the experimental sample signals based on the spike-in read counts to enable quantitative cross-comparison [75].
Protocol: qPCR Validation of ChIP-seq Data
qPCR provides an essential orthogonal method to validate findings from ChIP-seq and is crucial for quantifying enrichment at specific loci [73].
- Locus Selection: Select genomic regions identified as enriched (peaks) and non-enriched (background) from the ChIP-seq analysis. Include positive and negative control regions if available.
- DNA Quantification: Use the same purified ChIP and Input DNA that was used for sequencing library preparation, or perform independent ChIP experiments for qPCR validation.
- qPCR Reaction Setup: Prepare qPCR reactions using SYBR Green or TaqMan chemistry. Perform technical replicates for each primer set.
- Data Analysis: Calculate the percent input method for each region: % Input = 2^(Ct[Input] - Ct[ChIP]) * F, where F is the dilution factor of the input sample. Alternatively, fold enrichment can be calculated relative to a negative control region. Significant enrichment in the ChIP sample compared to the IgG control and non-enriched regions validates the ChIP-seq results.
The Scientist's Toolkit: Key Research Reagents and Materials
Table 2: Essential Reagents for Histone Modification Studies
| Item | Function | Considerations |
|---|---|---|
| Validated Antibodies | Specific immunoprecipitation of the target histone modification. | Antibody quality is a major source of variability; use ChIP-grade validated antibodies [76]. |
| Crosslinking Reagent (Formaldehyde) | Reversibly crosslinks proteins to DNA to preserve in vivo interactions. | Standard concentration is 1%; over-crosslinking can mask epitopes and reduce shearing efficiency. |
| Protein A/G Magnetic Beads | Efficient capture of antibody-bound complexes. | Offer lower background compared to sepharose beads and are easier to handle. |
| Micrococcal Nuclease (MNase) | Enzyme used in CUT&RUN for targeted chromatin cleavage. | Provides high-resolution cleavage, preferring nucleosome-free regions [73]. |
| pA-Tn5 Transposase | Fusion protein for CUT&Tag; simultaneously cleaves DNA and inserts sequencing adapters. | Pre-loaded with adapters to streamline library preparation [73]. |
| Spike-in Chromatin | Exogenous chromatin from a different species used for normalization. | Essential for quantitative comparisons across samples with different cellular states [75]. |
| Cell Line or Tissue Samples | The biological material for epigenomic profiling. | Sample availability dictates choice of technique (e.g., CUT&Tag for low inputs) [73]. |
Visualization of Experimental Workflow and Validation Logic
The diagram below illustrates a robust workflow for ChIP-seq analysis and its subsequent validation, highlighting the critical steps for mitigating noise.
Diagram Title: Integrated Workflow for Quantitative ChIP-seq and qPCR Validation
This workflow underscores the importance of integrating spike-in controls or advanced normalization (SES) during the experimental and computational stages to ensure quantitative accuracy. The subsequent qPCR validation on independent samples provides a critical, orthogonal method to confirm the ChIP-seq findings, strengthening the overall conclusion.
Mitigating background noise in histone modification ChIP-seq requires a multifaceted approach combining thoughtful experimental design, robust normalization strategies, and orthogonal validation. While traditional ChIP-seq remains a powerful discovery tool, researchers must be aware of its limitations in quantitative comparisons, especially for subtle changes in enrichment. The emergence of techniques like CUT&RUN and CUT&Tag offers paths to dramatically higher signal-to-noise ratios with lower input, though they may require protocol re-establishment. Critically, the selection of an appropriate normalization strategy—whether spike-in based or computational like SES—is paramount for credible cross-condition comparisons. Ultimately, the rigorous application of qPCR validation on independent samples remains an indispensable final step to confirm key findings, ensuring that conclusions about the functional role of histone modifications in gene regulation, disease, and development are built upon a solid technical foundation.
In chromatin immunoprecipitation followed by sequencing (ChIP-seq), technical and biological variability can significantly impact data interpretation, making appropriate controls not merely optional but fundamentally essential. For researchers investigating histone modifications, the implementation of proper controls separates robust, publishable findings from potentially irreproducible artifacts. Input DNA and no-antibody controls serve distinct yet complementary roles in controlling for technical variations in chromatin preparation and non-specific antibody interactions, respectively. The ENCODE consortium, which sets gold-standard guidelines for epigenomic studies, explicitly mandates that "each ChIP-seq experiment should have a corresponding input control experiment with matching run type, read length, and replicate structure" [14]. Within the context of validating histone modification ChIP-seq with qPCR, these controls provide the foundational evidence that observed signals represent true biological phenomena rather than technical confounders, thereby ensuring that subsequent qPCR validation targets genuine positive hits.
Understanding the Control Types
Input DNA Control
The input DNA control consists of purified genomic DNA that has been cross-linked and fragmented in parallel with the ChIP samples but undergoes no immunoprecipitation. This critical control accounts for biases introduced by variations in chromatin accessibility, DNA sequence-specific effects, and technical artifacts arising from DNA fragmentation and purification. During sequencing data analysis, the input control enables normalization for regions of "open chromatin" that are more susceptible to sonication and sequencing, thereby revealing true antibody-specific enrichment [14]. Without input normalization, regions with naturally high DNA accessibility can be misinterpreted as specifically enriched, leading to false-positive peak calls.
No-Antibody Control (Mock IP)
The no-antibody control, also known as mock IP, undergoes the entire ChIP procedure with one crucial omission: the target-specific antibody is replaced with an inert substance, typically normal immunoglobulin G (IgG) or just the buffer. This control directly measures non-specific background caused by magnetic beads binding chromatin fragments indiscriminately [77]. Cell Signaling Technology recommends that "if the amount of product in the negative control sample is equal to the amount of product in the target-specific sample, then you can conclude that your target-specific antibody is showing non-specific binding or background levels of signal" [77]. This result, when combined with a successful positive control signal, indicates that your chromatin is intact but your target-specific antibody is not working optimally.
Table 1: Essential Experimental Controls for Histone Modification ChIP-seq
| Control Type | Composition | Primary Function | Interpretation Guide | Common Pitfalls |
|---|---|---|---|---|
| Input DNA | Cross-linked, fragmented, purified DNA; no IP | Normalizes for chromatin accessibility, sequence bias, and technical variation | Enrichment over input indicates specific binding; essential for peak calling | Using input from different cell type, fixation, or fragmentation conditions |
| No-Antibody (Mock IP) | Full ChIP procedure with IgG or no antibody | Measures non-specific bead binding and background retention | Specific signal should significantly exceed mock IP background | Insufficient washing (high background) or over-washing (signal loss) |
| Positive Control Antibody | Antibody against ubiquitous histone mark (e.g., total H3) | Verifies overall chromatin quality and procedure success | Should yield strong, genome-wide signal regardless of locus | Using RNA Pol II for inactive genomic regions [77] |
| Negative Control Locus | Genomic region known to lack the histone mark | qPCR validation control for specific locus absence | Confirms antibody specificity at region of interest | Poorly characterized negative region leading to misinterpretation |
Additional Recommended Controls
Beyond the essential input and no-antibody controls, a comprehensive ChIP-seq validation strategy incorporates additional verification measures:
Positive Control Antibody: Antibodies against pan-histone marks, such as total histone H3, provide a universal positive control that should yield strong, genome-wide signal independent of the activation status of specific loci. This is particularly advantageous compared to RNA polymerase II antibodies, which only bind at active transcription sites [77].
Biological Replicates: The ENCODE standards require "two or more biological replicates, isogenic or anisogenic" to ensure findings are reproducible and not specific to a single sample preparation [14].
Target-Specific Standards: ENCODE further specifies sequencing depth requirements based on mark characteristics: "For broad-peak histone experiments, each replicate should have 45 million usable fragments," with H3K9me3 being a noted exception due to its enrichment in repetitive regions [14].
Experimental Protocols for Control Implementation
Input DNA Preparation Protocol
The input DNA control must be prepared in parallel with your ChIP samples to ensure technical consistency:
Cross-linking: Treat cells with 1% formaldehyde for 5-15 minutes at room temperature. Quench with 125 mM glycine for 5 minutes [78] [12]. Critical: Optimize fixation time for your specific tissue; skeletal muscle, for instance, presents fixation challenges that may require specialized relaxation buffers [78].
Cell Lysis: Resuspend cell pellet in ice-cold Lysis Buffer (10 mM Tris-HCl pH 8, 5 mM EDTA pH 8, 85 mM KCl, 0.5% NP-40, plus protease inhibitors). Homogenize with a dounce homogenizer (20 strokes) [78] [12].
Chromatin Shearing: For input preparation, shearing can be performed either by sonication or enzymatic digestion:
Reverse Cross-linking and Purification: Add NaCl to 200 mM final concentration and incubate overnight at 65°C. Follow with RNase A (10 minutes at 45°C) and proteinase K (1 hour at 45°C) treatment. Purify DNA using a commercial kit (e.g., Macherey Nagel NucleoSpin) [78].
Quality Assessment: Verify fragment size distribution (200-700 bp ideal) using bioanalyzer and quantify by fluorometry (Qubit) [78].
No-Antibody Control (Mock IP) Protocol
The mock IP control tracks the entire ChIP procedure alongside experimental samples:
Parallel Processing: Process the same number of cells (typically 2×10⁶ per IP [25]) through cross-linking, quenching, and chromatin shearing identical to experimental samples.
Immunoprecipitation: Replace the target-specific antibody with:
Bead Incubation: Add Protein A/G magnetic beads and incubate for the same duration as experimental IPs (typically 2 hours to overnight).
Washing and Elution: Perform identical wash steps (usually 4-6 washes with IP dilution buffer) and elution conditions as experimental samples.
Cross-link Reversal and DNA Purification: Process identical to experimental samples alongside the input DNA control.
qPCR Validation of Controls
Before proceeding to high-throughput sequencing, validate your ChIP efficiency using quantitative PCR:
Primer Design: Design primers for:
- Positive control loci: Genomic regions with known enrichment for your histone mark (e.g., promoters of actively transcribed genes for H3K4me3)
- Negative control loci: Genomic regions known to lack the mark (e.g., silent heterochromatic regions for H3K4me3) [23]
qPCR Analysis: Compare Ct values between specific IP, mock IP, and input controls:
- % Input Method: Calculate % input = 2^(Ctinput - CtIP) × 100% × dilution factor
- Enrichment over Mock: Calculate fold enrichment = 2^(Ctmock - CtIP)
Success Criteria: Specific IP should show significant enrichment over both input (typically >1%) and mock IP (typically >10-fold) at positive control loci, while showing minimal signal at negative control loci [77] [25].
The following diagram illustrates the complete workflow integrating these essential controls:
Research Reagent Solutions for Control Experiments
Table 2: Essential Reagents for ChIP-seq Control Experiments
| Reagent Category | Specific Examples | Application Purpose | Key Considerations |
|---|---|---|---|
| Control Antibodies | Histone H3 (D2B12) XP Rabbit mAb #4620 (CST) [77] | Universal positive control | Detects all histone H3 variants bound to all genomic DNA |
| Non-Specific IgG | Normal Rabbit IgG | No-antibody (mock IP) control | Matches host species of primary antibody |
| Chromatin Shearing Reagents | Micrococcal Nuclease (MNase) [25], Bioruptor Sonication System (Diagenode) [78] | Chromatin fragmentation | MNase offers reproducibility; sonication provides randomization |
| DNA Purification Kits | QIAquick PCR Purification Kit (QIAGEN) [12], NucleoSpin Gel & PCR Clean-up (Macherey Nagel) [78] | DNA purification after cross-link reversal | Column-based methods preferred for consistency |
| Cross-linking Reagents | Formaldehyde (37%), EGS, DSG [25] | Stabilize protein-DNA interactions | Longer crosslinkers (EGS/DSG) for complex protein assemblies |
| Protease Inhibitors | Complete Protease Inhibitor Cocktail (Roche) [78], PMSF, Aprotinin, Leupeptin [12] | Preserve protein integrity during processing | Essential during cell lysis and chromatin preparation |
Comparative Analysis with Emerging Technologies
While traditional ChIP-seq remains widely used, emerging techniques like CUT&Tag offer alternative approaches with different control requirements:
Table 3: Control Considerations Across Chromatin Profiling Technologies
| Method | Required Input | Control Landscape | Advantages | Limitations |
|---|---|---|---|---|
| ChIP-seq | 1-10 million cells [23] [79] | Input DNA, mock IP, positive control antibody | Well-established, compatible with diverse samples | High background, requires cross-linking optimization |
| CUT&Tag | 10³-10⁴ cells [79] | Background tagmentation control, IgG control | Extremely low background, high signal-to-noise ratio | Less established for some transcription factors [79] |
| CUT&RUN | 10³-10⁵ cells [79] | IgG control, no-antibody control | Low background, high resolution | Native chromatin only, not for direct protein-DNA crosslinks |
Notably, a 2025 benchmarking study demonstrated that CUT&Tag recovers approximately 54% of ENCODE ChIP-seq peaks for H3K27ac and H3K27me3, with the identified peaks representing the strongest ENCODE peaks and showing similar functional enrichments [23]. This suggests that while CUT&Tag may capture a subset of signals, the biological interpretation remains consistent for the detected peaks.
Proper implementation of input DNA and no-antibody controls transforms ChIP-seq from a qualitative visualization tool to a quantitatively reliable method for mapping histone modifications. These controls are particularly crucial when bridging ChIP-seq discovery with qPCR validation, as they ensure that regions selected for validation represent true biological signals rather than technical artifacts. The experimental protocols outlined here, compliant with ENCODE standards, provide a framework for generating controls that account for chromatin preparation biases and non-specific antibody interactions. As new technologies like CUT&Tag emerge with different control requirements, the fundamental principle remains unchanged: rigorous experimental controls are non-negotiable for producing scientifically valid, reproducible epigenomic data that can reliably guide downstream drug development decisions.
Beyond Confirmation: Strategic Validation and Comparative Method Analysis
In the study of histone modifications, chromatin immunoprecipitation followed by sequencing (ChIP-seq) has emerged as a powerful discovery tool for generating genome-wide epigenetic maps. However, the technical complexity and systematic biases inherent in high-throughput methodologies necessitate rigorous validation to ensure biological conclusions are built upon reliable data. Challenges in ChIP-seq include antibody specificity issues, the requirement for large cell numbers, and multiple technically challenging steps that introduce variability and sequencing artifacts [80] [81]. Without proper validation, researchers risk investing significant resources pursuing false leads or, in clinical contexts, potentially arriving at misdiagnoses based on unverified results [82]. This guide establishes a robust framework for validating histone modification ChIP-seq findings through targeted quantitative PCR (qPCR), comparing modern chromatin profiling technologies, and providing actionable protocols for researchers seeking to implement these methods in both basic research and drug development contexts.
The validation workflow bridges discovery-scale sequencing with precise measurement, addressing a critical gap in many epigenetic studies. As noted in consensus guidelines, the "noticeable lack of technical standardization" remains a huge obstacle in translating research findings into clinically applicable knowledge [72]. By establishing a standardized approach from high-throughput screening to targeted verification, researchers can significantly improve the reproducibility and reliability of their epigenetic studies, ultimately accelerating the translation of histone modification research into therapeutic insights.
Technology Landscape: Comparing Modern Chromatin Profiling Methods
The evolution of chromatin profiling technologies has provided researchers with multiple options for studying histone modifications, each with distinct advantages and limitations. The established workflow of ChIP-seq is now complemented by newer techniques including CUT&RUN and CUT&Tag, which offer significant improvements in sensitivity and background reduction [80] [83].
Table 1: Comparison of Chromatin Profiling Technologies for Histone Modification Studies
| Category | ChIP-seq | CUT&RUN | CUT&Tag |
|---|---|---|---|
| Starting Material | Very high (millions of cells) [83] | Low (10³–10⁵ cells) [83] | Extremely low (10³–10⁴ cells; single-cell possible) [83] |
| Peak Resolution | High (tens to over a hundred bp) [83] | Very high (precise MNase cleavage, down to single-digit bp) [83] | Very high (precise Tn5 insertion, down to single-digit bp) [83] |
| Protocol Duration | ~1 week [80] [83] | 1-2 days [83] | ~2 days [83] |
| Background Noise | Relatively high (many non-specific bindings) [83] | Very low (in situ cleavage minimizes background) [83] | Extremely low (adaptors inserted directly at target sites) [83] |
| Key Steps | Cross-linking, chromatin fragmentation, immunoprecipitation [83] | Antibody binding, in situ MNase cleavage [83] | Antibody binding, in situ tagmentation [83] |
| Sequencing Depth | 20-40 million reads per library [80] | 3-8 million reads [80] | Similar to CUT&RUN [80] |
| Ideal Application | Genome-wide profiling with established protocols [83] | Rare samples or limited cell input [83] | Extremely low input or high-throughput applications [83] |
Technology Selection Guidelines
For most histone modification studies, CUT&RUN represents an optimal balance between practical considerations and data quality. It generates high-resolution profiles for diverse targets, including histone post-translational modifications, with minimal optimization required for most targets and cell types [80]. The simplified protocol skips the most challenging parts of ChIP-seq (cross-linking, chromatin fragmentation, and immunoprecipitation), significantly reducing background and technical variability [80].
While CUT&Tag offers even lower input requirements and a streamlined workflow, it is more technically challenging and may be less stable for certain histone modifications [80] [83]. In EpiCypher's experience, CUT&Tag requires more practiced hands to generate robust chromatin profiles and is highly sensitive to errors in assay setup [80]. Traditional ChIP-seq remains valuable when comparing results to existing datasets or when profiling transiently interacting proteins that may require cross-linking, though the heavy fixation strategies required for ChIP-seq should not be applied in CUT&RUN or CUT&Tag [80].
Experimental Design and Protocol Details
ChIP-seq and CUT&RUN Workflows for Histone Modifications
Implementing robust chromatin profiling requires careful attention to protocol specifics. The standard ChIP-seq protocol involves cross-linking proteins to DNA, cell lysis, chromatin shearing, antibody-based immunoprecipitation, reversing cross-links, and purifying DNA for library preparation and sequencing [83]. For histone modifications, specific considerations include antibody validation and appropriate sequencing depth, with broad marks like H3K27me3 requiring different analysis approaches than sharp marks like H3K4me3 [16] [81].
The CUT&RUN protocol for histone modifications proceeds as follows: first, cells or nuclei are immobilized onto magnetic beads. A primary antibody specific to the histone modification of interest is added and allowed to bind. Subsequently, Protein A/G-micrococcal nuclease (pA-MNase) fusion protein is added, which binds to the antibody. Calcium is added to activate MNase cleavage, releasing DNA fragments from antibody-bound regions. Finally, the released fragments are purified and prepared for sequencing [83]. This entire process occurs under native conditions without cross-linking, eliminating one of the major sources of artifact in ChIP-seq.
Critical Success Factors
Antibody validation represents perhaps the most critical factor in successful histone modification studies. Studies have found that over 70% of antibodies to histone lysine methylation and acylation post-translational modifications display unacceptable cross-reactivity and/or target efficiency, including highly cited antibodies for H3K4me3, H3K9me3, H3K27ac, and H3K27me3 [80]. Recommendations include primary characterization using immunoblot analysis and secondary characterization using peptide binding tests, mass spectrometry, or immunoreactivity analysis in cell lines containing knockdowns of relevant histone modification enzymes [81].
Sequencing depth and quality control metrics vary by technology. For ChIP-seq, the ENCODE consortium recommends 20 million uniquely mapped reads for point source signals and 40 million for broad source signals in human samples [81]. The fraction of reads in peaks (FRiP) should be greater than 1%, and libraries should demonstrate high complexity with at least 80% of 10 million or more reads mapping to distinct genomic locations [81]. For CUT&RUN, only 3-8 million sequencing reads are typically required for high-quality histone modification profiles [80].
Diagram 1: Comparative workflows for ChIP-seq (blue) and CUT&RUN (green) technologies highlight the streamlined nature of the CUT&RUN approach, which eliminates cross-linking and sonication steps that introduce variability in traditional ChIP-seq.
Quantitative Comparison of ChIP-seq Datasets
Differential Analysis Tools and Performance
Following data generation, robust quantitative comparison of histone modification datasets requires specialized computational tools. A comprehensive 2022 benchmark study evaluated 33 computational tools for differential ChIP-seq analysis, finding that performance was strongly dependent on peak characteristics and biological context [16]. For histone modifications, performance varied significantly between sharp marks (like H3K4me3) and broad marks (like H3K27me3), emphasizing the need for tool selection tailored to the specific biological application [16].
The study revealed that no single tool performed optimally across all scenarios, but specific tools excelled in particular contexts. For transcription factor-like sharp peaks, bdgdiff (from MACS2), MEDIPS, and PePr showed strong performance [16]. For broad histone marks, tools including diffReps and MAnorm demonstrated good results in specific scenarios [16]. Importantly, the benchmark found that default parameters typically provided the most stable performance across diverse datasets, suggesting researchers should begin with default settings before exploring parameter optimization [16].
Normalization Strategies for Histone Modification Data
Normalization presents particular challenges in differential histone modification analysis due to varying signal-to-noise ratios between experiments. MAnorm addresses this by using common peaks between datasets as a reference to build a rescaling model, effectively normalizing data based on the assumption that true intensities of most common peaks are the same between samples [84]. This approach has shown strong correlation between normalized differential binding values and changes in expression of target genes, providing biological validation of the method [84].
For complex experimental designs with multiple factors, ChIPComp provides a comprehensive statistical framework that accounts for genomic background measured by control data, signal-to-noise ratios in different experiments, biological variations from replicates, and multiple-factor experimental designs [85]. It models read counts from IP experiments at candidate regions using Poisson distribution, with underlying Poisson rates modeled as an experiment-specific function of artifacts and biological signals [85].
Targeted Verification with Quantitative PCR
qPCR Assay Design and Validation
Targeted verification of ChIP-seq results via quantitative PCR requires meticulous assay design and validation to ensure data reliability. The Minimum Information for Publication of Quantitative Real-Time PCR Experiments (MIQE) guidelines provide a foundational framework for establishing assay quality [82] [72]. Key validation parameters include inclusivity (detecting all intended targets), exclusivity (avoiding cross-reactivity with non-targets), linear dynamic range, limit of detection, and limit of quantification [82].
For histone modification studies, qPCR validation should target both enriched and non-enriched genomic regions to confirm specific immunoprecipitation. The linear dynamic range should be established using a seven 10-fold dilution series of DNA standard in triplicate, with linearity (R²) values of ≥0.980 considered acceptable [82]. Primer efficiency should fall between 90% and 110%, and the threshold cycle (Ct) values for experimental samples should fall within the established linear range of the assay for quantitative results [82].
Clinical Research Validation Standards
For translational studies, more stringent validation following clinical research (CR) assay standards is recommended. These guidelines fill the gap between research use only (RUO) and in vitro diagnostics (IVD), incorporating rigorous evaluation of analytical precision, analytical sensitivity, analytical specificity, and analytical trueness [72]. The validation process should be fit-for-purpose, with the level of validation rigor sufficient to support the specific context of use [72].
Table 2: Key Validation Parameters for qPCR Assays in Histone Modification Studies
| Validation Parameter | Definition | Target Performance |
|---|---|---|
| Inclusivity | Ability to detect all target variants/strains | Detection of all intended histone modification variants [82] |
| Exclusivity | Ability to avoid cross-reactivity with non-targets | No amplification of unrelated histone modifications [82] |
| Linear Dynamic Range | Range where signal is proportional to template concentration | 6-8 orders of magnitude with R² ≥ 0.980 [82] |
| Amplification Efficiency | Rate of PCR amplification per cycle | 90-110% [82] |
| Analytical Sensitivity (LOD) | Lowest concentration reliably detected | Dependent on target abundance and application [72] |
| Analytical Precision | Closeness of repeated measurements | <5% coefficient of variation for replicate measurements [72] |
Integrated Validation Workflow and Reagent Solutions
End-to-End Validation Pipeline
A robust validation workflow integrates high-throughput discovery with targeted verification through a systematic process. The pipeline begins with experimental design and sample preparation, progressing through sequencing, bioinformatic analysis, and culminating in qPCR verification. At each stage, quality control checkpoints ensure data reliability before progression to the next phase.
For histone modification studies, the ENCODE consortium recommends a minimum of two biological replicates per experiment, defined as independent cell culture, embryo pool, or tissue samples [81]. For two replicates, either 80% of the top 40% of identified targets in one replicate must be among targets in the second replicate, or 75% of target lists must be in common between both replicates [81]. These stringent reproducibility standards help ensure that only high-confidence findings advance to verification.
Diagram 2: Integrated validation workflow from high-throughput sequencing to targeted verification, highlighting critical quality control checkpoints at each stage to ensure data reliability throughout the process.
Research Reagent Solutions
Successful implementation of chromatin profiling and validation workflows depends on critical research reagents with specific quality attributes:
Validated Antibodies: The most crucial reagent, requiring demonstration of specificity for the target histone modification. Recommendations include using antibodies with performance validation in the specific application (ChIP-seq, CUT&RUN, or CUT&Tag) and verification via immunoblot, peptide binding tests, or genetic knockouts of histone modifying enzymes [80] [81].
pA-MNase Fusion Protein: Essential for CUT&RUN workflows, this recombinant protein combines Protein A with micrococcal nuclease for targeted chromatin cleavage. Critical quality attributes include minimal non-specific nuclease activity and efficient binding to antibody Fc regions [83].
pA-Tn5 Transposase: The core enzyme for CUT&Tag applications, pre-loaded with sequencing adapters for simultaneous fragmentation and tagmentation. Quality considerations include transposition efficiency and specificity [83].
qPCR Reagents: Including validated primer sets for histone modification targets, DNA binding dyes or probes, and standards for quantification. Primers should demonstrate high efficiency (90-110%) and specificity for target regions [82].
Control Reagents: Non-specific IgG antibodies for negative control experiments, and primers for non-enriched genomic regions to establish background signal levels [86].
Establishing a robust validation workflow from high-throughput sequencing to targeted verification represents a critical foundation for reliable histone modification research. By understanding the comparative advantages of chromatin profiling technologies, implementing appropriate computational analysis methods, and adhering to rigorous qPCR validation standards, researchers can significantly enhance the reproducibility and translational potential of their epigenetic studies. The integrated framework presented in this guide provides a actionable pathway for researchers to bridge discovery-scale sequencing with precise measurement, ultimately supporting more confident biological conclusions and accelerating the translation of epigenetic research into clinical applications.
As the field continues to evolve, emerging technologies and analysis methods will further enhance our ability to study histone modifications with increasing precision and efficiency. However, the fundamental principle of coupling discovery with validation will remain essential for building a reliable knowledge base in epigenetics and translating these findings into improved human health outcomes.
Validating Chromatin Immunoprecipitation followed by sequencing (ChIP-seq) data with quantitative PCR (ChIP-qPCR) represents a critical step in ensuring the reliability and biological relevance of epigenomic studies, particularly in the context of histone modifications. This correlation is not merely a procedural formality but a fundamental requirement for establishing that the genome-wide binding profiles generated through high-throughput sequencing accurately reflect true biological signals. For researchers and drug development professionals working with histone modifications, a robust validation framework guards against technical artifacts arising from antibody cross-reactivity, sequencing biases, and computational peak-calling inconsistencies. The ENCODE and modENCODE consortia, through their extensive experience with thousands of ChIP-seq experiments, have developed rigorous working standards that emphasize the importance of such validation practices [7]. This guide establishes clear, experimentally-grounded criteria for determining successful correlation between these complementary methodologies, enabling researchers to proceed with confidence in their downstream analyses and therapeutic targeting strategies.
Establishing the Validation Framework: Controls and Experimental Design
The Essential Role of Control Genomic Regions
Successful validation of ChIP-seq data through qPCR hinges on the strategic selection of control genomic regions that provide meaningful reference points for interpretation. These controls must be established prior to sequencing and selected based on prior knowledge or preliminary experiments.
Positive control regions should be genomic loci with well-documented enrichment for the specific histone modification being studied. For example, H3K4me3 is strongly enriched at active promoters, while H3K27me3 marks developmentally repressed genes [87]. These positive controls serve to verify that the immunoprecipitation worked effectively and that the histone modification can be detected above background levels.
Negative control regions are equally crucial and should represent genomic areas where the histone modification is known to be absent. For repressive marks like H3K27me3, constitutively active gene promoters often serve as ideal negative controls, while for active marks like H3K27ac, heterochromatic regions may be appropriate [25]. The inclusion of both types of controls creates a reference framework for interpreting enrichment levels at target test regions.
Additionally, internal normalization controls such as input DNA (non-immunoprecipitated genomic DNA) are essential for accounting for variations in primer amplification efficiency and DNA quantity [5]. Some researchers also include regions known to be modified by a different histone mark to test antibody specificity, particularly when working with modifications that share similar amino acid contexts.
Experimental Replication and Statistical Considerations
The ENCODE guidelines emphasize that biological replication provides a more reliable assessment of technical and biological variability than technical replication alone [7]. For robust validation, experiments should include at least two biological replicates (independent chromatin preparations from separate cell cultures or tissue samples) to ensure that observed enrichment patterns are reproducible.
Statistical validation requires establishing significance thresholds prior to experimentation. For qPCR data, this typically involves setting a minimum fold-enrichment threshold (often 2-10 fold over negative controls or input DNA) that must be achieved across replicates with acceptable variance (commonly p<0.05 by t-test or comparable non-parametric tests) [5]. The specific threshold should be determined based on the historical performance of the antibody and the biological system under investigation.
Quantitative Correlation Criteria: From qPCR to Sequencing
Establishing Minimum Enrichment Thresholds
The transition from qualitative confirmation to quantitative correlation requires establishing clear thresholds that define successful validation. The table below summarizes evidence-based criteria for interpreting validation success across different histone modification types:
Table 1: Validation Criteria for Histone Modification ChIP-seq by qPCR
| Histone Modification Type | Minimum Fold-Enrichment over Input | Minimum Fold-Enrichment over Negative Control | Replicate Concordance | Recommended Positive Control Loci |
|---|---|---|---|---|
| Promoter-associated marks (H3K4me3, H3K9ac) | 5-10× | 8-15× | R² > 0.9 | Active gene promoters (e.g., GAPDH, ACTB) |
| Enhancer-associated marks (H3K4me1, H3K27ac) | 3-8× | 5-10× | R² > 0.85 | Known enhancer regions |
| Repressive broad domains (H3K27me3, H3K9me3) | 2-5× | 3-7× | R² > 0.8 | Developmentally repressed genes |
| Gene body marks (H3K36me3, H3K79me2) | 4-8× | 6-12× | R² > 0.85 | Transcribed regions of active genes |
These thresholds are derived from empirical observations across multiple studies and should be adjusted based on antibody performance and cell type-specific considerations [7] [87]. The lower enrichment requirements for repressive broad domains reflect their more diffuse genomic distribution compared to sharp promoter-associated peaks.
Correlation with Sequencing Data
Beyond the absolute enrichment values in qPCR, successful validation requires demonstrating correlation between qPCR enrichment and sequencing read density. For this purpose, researchers should select 5-10 target test regions representing a range of expected enrichment levels (from strong to weak binding sites) identified in preliminary sequencing data or from similar published studies.
The correlation is typically considered successful when:
Strong positive correlation exists between qPCR fold-enrichment and normalized ChIP-seq read counts (Pearson correlation >0.7 or Spearman rank correlation >0.65) across the test regions [88].
Differential enrichment is preserved, where regions with higher qPCR enrichment correspond to regions with higher sequencing read density.
Reproducibility is maintained, with correlation patterns consistent across biological replicates.
Statistical measures such as the Reproducibility Optimization Test Statistic (ROTS) have been developed specifically for assessing reproducibility in ChIP-seq data and can be adapted for qPCR validation metrics [88].
Methodological Protocols for Validation Experiments
ChIP-qPCR Experimental Workflow
The validation process begins with a standardized ChIP procedure followed by targeted qPCR analysis. The diagram below illustrates the complete workflow:
Chromatin Immunoprecipitation Protocol
The ChIP procedure must be optimized for the specific histone modification and cell type under investigation:
Crosslinking: For most histone modifications, crosslink cells with 1% formaldehyde for 8-12 minutes at room temperature. Quench with 125 mM glycine [25] [5]. For stable histone-DNA interactions, native ChIP without crosslinking may be appropriate and can provide higher resolution [78] [89].
Cell Lysis and Chromatin Preparation: Lyse cells using detergent-based lysis buffers supplemented with protease inhibitors. Isulate nuclei to reduce background [25].
Chromatin Shearing: Shear chromatin to 200-500 bp fragments using sonication (8-15 cycles of 30-second pulses) or enzymatic digestion with micrococcal nuclease [25] [5]. Verify fragment size by agarose gel electrophoresis.
Immunoprecipitation: Incubate sheared chromatin with 1-5 μg of validated, modification-specific antibody overnight at 4°C with rotation [7] [25]. Include a no-antibody control for each sample.
Recovery and Washing: Capture antibody-chromatin complexes using Protein A/G magnetic beads, followed by sequential washes with low salt, high salt, and LiCl wash buffers [25].
Elution and Reverse Crosslinking: Elute complexes in elution buffer (1% SDS, 100 mM NaHCO3) and reverse crosslinks by incubation at 65°C for 4-6 hours [5].
DNA Purification: Purify DNA using phenol-chloroform extraction or commercial purification kits. Quantify DNA yield fluorometrically [78].
qPCR Validation Protocol
Primer Design: Design primers amplifying 80-150 bp products within candidate regions. Verify specificity by melt curve analysis and ensure amplification efficiency between 90-110% [5].
qPCR Reaction Setup: Perform reactions in technical triplicates using SYBR Green chemistry on 1-10 ng of ChIP DNA per reaction [5].
Standard Curve Generation: Include serial dilutions of input DNA to generate standard curves for absolute quantification when possible.
Data Acquisition: Run qPCR with appropriate cycling conditions (typically 40 cycles of 95°C denaturation, 60°C annealing/extension).
Analysis: Calculate fold enrichment using the ΔΔCt method relative to input DNA or percent input methods [5].
The Scientist's Toolkit: Essential Reagents and Materials
Table 2: Essential Research Reagents for ChIP-qPCR Validation
| Reagent/Material | Function | Selection Criteria | Example Specifications |
|---|---|---|---|
| Validated Antibodies | Specific recognition of histone modifications | Demonstrate >50% specificity for target in immunoblots; minimal cross-reactivity with similar modifications [7] [25] | Lot-specific validation data; ChIP-grade certification |
| Crosslinking Reagents | Stabilize protein-DNA interactions | Reversible crosslinking; appropriate length for protein-DNA complexes | Ultrapure formaldehyde; EGS for larger complexes |
| Chromatin Shearing Reagents | Fragment chromatin to optimal size | Consistency in fragment size distribution; minimal heat generation | Validated sonication protocols; titrated MNase |
| qPCR Reagents | Quantitative amplification of target regions | High efficiency; minimal primer-dimer formation | SYBR Green master mixes with ROX reference dye |
| Magnetic Beads | Antibody-chromatin complex recovery | Low non-specific binding; high binding capacity | Protein A/G magnetic beads with consistent size |
| DNA Purification Kits | Isolation of pure ChIP DNA | High recovery of small DNA fragments; removal of contaminants | Column-based systems with >80% recovery |
| Control Primers | Amplification of positive/negative control regions | Established enrichment patterns; robust amplification | Validated primer sets for housekeeping genes |
Troubleshooting Common Validation Challenges
Addressing Discordant Results
When qPCR and ChIP-seq data show poor correlation, systematic troubleshooting should address these common issues:
Antibody Specificity Problems: If the antibody recognizes multiple similar modifications, both qPCR and sequencing will reflect this lack of specificity. Validate antibodies using peptide competition assays or epitope tagging when possible [7] [25].
Chromatin Preparation Artifacts: Inefficient crosslinking or over-sonication can differentially affect qPCR and sequencing results. Optimize crosslinking time and sonication conditions for each cell type [5].
Primer Design Issues: Primers amplifying regions near but not within true binding sites will yield misleading qPCR data. Verify primer locations relative to peak summits identified in sequencing.
Sequencing Depth Insufficiency: Shallow sequencing may miss valid binding sites detected by qPCR. Ensure adequate sequencing depth (typically 10-20 million reads for histone modifications) [7].
Peak Calling Parameter Inconsistencies: Different algorithms and parameters can significantly impact identified peaks. Use reproducibility-optimized approaches like ROTS to select optimal parameters [88].
Alternative Validation Approaches
When standard validation approaches prove insufficient, consider these alternatives:
Orthogonal Biochemical Methods: Utilize histone modification detection by mass spectrometry to confirm modification presence independent of antibody-based methods [89].
Cross-linking Optimization: For challenging tissues like skeletal muscle, consider native ChIP approaches that avoid crosslinking difficulties [78].
Advanced Sequencing Techniques: Newer methods like CUT&Tag may provide complementary data with lower background, particularly for low-abundance modifications [90].
Successful correlation between ChIP-qPCR and ChIP-seq data represents a critical checkpoint in epigenomic research, ensuring that genome-wide maps of histone modifications accurately reflect biological reality rather than technical artifacts. The validation criteria established here—incorporating appropriate controls, quantitative enrichment thresholds, and statistical correlation metrics—provide a framework for researchers to standardize their validation approaches across experiments and laboratories. As new technologies like CUT&Tag and computational prediction methods such as DeepHistone emerge [91] [90], the fundamental need for rigorous validation remains constant. By adhering to these evidence-based criteria, researchers can advance our understanding of epigenetic regulation with greater confidence, ultimately supporting more reliable drug discovery and therapeutic development in the epigenetics domain.
The study of protein-DNA interactions, such as histone modifications, is fundamental to understanding epigenetic regulation of gene expression. Chromatin immunoprecipitation (ChIP) has emerged as a cornerstone technique for investigating these interactions, with two principal methodologies dominating the field: ChIP-quantitative polymerase chain reaction (ChIP-qPCR) and ChIP-sequencing (ChIP-seq). These techniques enable researchers to map histone modifications and transcription factor binding sites, providing crucial insights into gene regulatory mechanisms. While both methods share initial wet-lab procedures involving chromatin immunoprecipitation, they diverge significantly in their detection and analysis approaches, leading to distinct applications, advantages, and limitations. This comparative analysis examines the technical specifications, performance parameters, and optimal use cases for each method within the context of histone modification research, providing a framework for researchers to select the most appropriate methodology for their specific experimental objectives.
Fundamental Principles and Workflows
Core Methodology of ChIP-qPCR and ChIP-seq
Both ChIP-qPCR and ChIP-seq begin with identical initial steps: formaldehyde cross-linking of proteins to DNA in vivo, chromatin fragmentation (typically via sonication to 200-600 bp fragments), antibody-based immunoprecipitation of protein-DNA complexes, and reversal of cross-links to purify DNA fragments [92] [93]. The methodologies diverge at the analysis stage. ChIP-qPCR utilizes sequence-specific primers to amplify and quantify known genomic regions of interest through quantitative PCR, providing targeted measurement of histone enrichment at predetermined loci [92]. In contrast, ChIP-seq incorporates high-throughput sequencing of all immunoprecipitated DNA fragments, which are then aligned to a reference genome to generate genome-wide binding maps without prior knowledge of target regions [94] [93].
Visual Workflow Comparison
The following diagram illustrates the parallel workflows and key divergence points between ChIP-qPCR and ChIP-seq methodologies:
Technical Comparison and Performance Metrics
Comprehensive Technical Specification Table
The selection between ChIP-qPCR and ChIP-seq involves careful consideration of multiple technical parameters, including input requirements, resolution, and operational complexity. The following table provides a detailed comparison of these critical specifications:
| Parameter | ChIP-qPCR | ChIP-seq |
|---|---|---|
| Starting Material | 10⁴–10⁶ cells [92] | 10⁶–10⁷ cells (millions) [92] |
| Genomic Coverage | Specific known gene regions [9] | Genome-wide [9] |
| Resolution | Medium (depends on chromatin fragmentation, usually several hundred bp) [92] | High (tens to over a hundred bp) [92] |
| Detection Capability | Only known, predetermined sites [92] | Novel and unknown binding sites [94] |
| Operational Complexity | High (requires crosslinking, shearing, IP; takes several days) [92] | Very high (~1 week; includes multiple steps) [92] |
| Background Noise | Relatively high (requires antibody and elution optimization) [92] | Relatively high (many non-specific bindings) [92] |
| Data Output | Quantitative enrichment values for specific loci | Genome-wide binding profiles and sequence information |
| Multiplexing Capability | Limited (typically 1-3 targets per reaction) | Virtually unlimited (all targets captured simultaneously) |
Performance Characteristics Table
Different experimental objectives require careful consideration of performance characteristics. The table below compares key performance metrics between ChIP-qPCR and ChIP-seq:
| Performance Metric | ChIP-qPCR | ChIP-seq |
|---|---|---|
| Sensitivity | High for known targets [92] | Genome-wide high sensitivity [95] |
| Specificity | Dependent on primer design | Dependent on antibody quality and bioinformatics [6] |
| Quantitative Accuracy | Excellent (direct quantification via PCR) [96] | Relative quantification (requires spike-in controls for absolute comparison) [75] |
| Dynamic Range | >8 logs (inherent to qPCR technology) | Limited by sequencing depth and library complexity [95] |
| Reproducibility | High for technical replicates | Variable; requires biological replicates [6] |
| Cost Per Sample | Low [9] | High (sequencing and bioinformatics costs) [95] |
Experimental Design and Protocols
Key Experimental Considerations
Successful ChIP experiments require meticulous attention to several critical factors. Antibody quality represents perhaps the most crucial determinant of success, as it directly impacts specificity and signal-to-noise ratio [6]. Antibodies must demonstrate ≥5-fold enrichment in ChIP-qPCR assays at known positive-control regions compared to negative controls to be considered suitable for chromatin studies [6] [96]. For histone modifications, specificity should be further validated using peptide arrays or knockout cell lines to ensure recognition of the specific epigenetic mark without cross-reactivity [96].
Cell number requirements vary significantly between techniques and targets. ChIP-qPCR typically requires 10⁴–10⁶ cells, while ChIP-seq generally needs 1-10 million cells for transcription factors and abundant histone marks like H3K4me3 [92] [6]. Less abundant histone modifications may require higher input amounts. Chromatin fragmentation represents another critical parameter, with sonication being preferred for cross-linked samples and micrococcal nuclease (MNase) digestion sometimes employed for native chromatin studies of nucleosome positioning [6].
Proper control experiments are essential for data interpretation. Input DNA (chromatin before immunoprecipitation) serves as the preferred control for normalization and background estimation [6]. For antibody specificity controls, IgG controls help assess non-specific binding, while knockout or knockdown validation provides the most rigorous specificity demonstration [6].
Research Reagent Solutions
The following table outlines essential reagents and their functions for successful ChIP experiments:
| Reagent Category | Specific Examples | Function and Importance |
|---|---|---|
| Crosslinking Agents | Formaldehyde | Stabilizes protein-DNA interactions in vivo [93] |
| Chromatin Fragmentation Methods | Sonication, MNase enzyme | Generates appropriately sized DNA fragments (200-600 bp) [6] |
| Validated Antibodies | Histone modification-specific antibodies (e.g., H3K4me3, H3K27ac) | Specifically immunoprecipitates target protein-DNA complexes [96] |
| Immunoprecipitation Beads | Protein A/G magnetic beads | Efficiently captures antibody-bound complexes [92] |
| Library Preparation Kits | Illumina sequencing kits | Prepares immunoprecipitated DNA for high-throughput sequencing [93] |
| qPCR Reagents | SYBR Green master mix, sequence-specific primers | Enables quantitative amplification of target regions [92] |
| Quality Control Tools | Bioanalyzer, qPCR validation primers | Assesses DNA fragment size and library quality [6] |
Data Analysis and Interpretation
Analytical Approaches for Each Method
ChIP-qPCR data analysis employs the ΔΔCt method to calculate fold enrichment of target regions relative to control regions [96]. This approach normalizes the immunoprecipitated sample to input DNA and compares target loci to negative control regions, typically generating quantitative data with clear statistical significance through technical replicates. The analysis is relatively straightforward, requiring standard qPCR instrumentation and software, with results expressed as fold-enrichment over control antibodies or non-enriched genomic regions [96].
In contrast, ChIP-seq data analysis involves a complex bioinformatics pipeline including read alignment, peak calling, and annotation [94] [93]. Sequencing reads are first aligned to a reference genome, followed by identification of significantly enriched regions (peaks) using specialized algorithms such as MACS2. The process continues with peak annotation to genomic features (promoters, enhancers, etc.), motif discovery for transcription factor studies, and comparative analysis between conditions [94]. This workflow demands substantial computational resources and bioinformatics expertise, with interpretation requiring integration with other genomic datasets for comprehensive biological insights.
Data Output Comparison Visualization
The following diagram illustrates the fundamental differences in data output and analysis between ChIP-qPCR and ChIP-seq:
Applications in Histone Modification Research
Optimal Use Cases and Integration Strategies
ChIP-qPCR excels in targeted validation studies where researchers need to quantitatively compare histone modification levels at specific genomic loci under different experimental conditions [92]. Its precision and quantitative nature make it ideal for time-course experiments, dose-response studies, and validation of candidate regions identified through genome-wide approaches. The technique is particularly valuable for clinical biomarker assessment and pharmacodynamic studies in drug development, where specific histone modification changes at defined loci serve as indicators of treatment efficacy [96].
ChIP-seq demonstrates superior utility in exploratory research aimed at generating comprehensive epigenomic maps [94] [93]. Its ability to identify novel regulatory elements makes it indispensable for characterizing epigenetic landscapes in disease states, developmental processes, and cellular differentiation. In drug development, ChIP-seq facilitates mechanism of action studies for epigenetic therapies by revealing global changes in histone modification patterns in response to treatment [93].
The most powerful approach often involves integrating both methodologies, using ChIP-seq for initial discovery followed by ChIP-qPCR for validation and precise quantification of key findings across multiple samples and conditions [92]. This combined strategy leverages the strengths of both techniques while mitigating their individual limitations, providing both breadth and depth in histone modification analysis.
ChIP-qPCR and ChIP-seq represent complementary rather than competing technologies in the epigenetics toolkit. ChIP-qPCR offers superior quantification, lower cost, and faster turnaround for focused studies of known genomic regions, making it ideal for validation and targeted hypothesis testing. Conversely, ChIP-seq provides unparalleled comprehensive coverage for discovery-based research, enabling genome-wide mapping of histone modifications and identification of novel regulatory elements. The choice between these methodologies should be guided by specific research objectives, sample availability, and computational resources. For complete characterization of histone modifications, an integrated approach utilizing both techniques often yields the most robust and biologically relevant insights, combining the discovery power of ChIP-seq with the quantitative precision of ChIP-qPCR. As sequencing costs decrease and analytical methods improve, both techniques will continue to evolve, further enhancing our ability to decipher the complex epigenetic mechanisms governing gene expression in health and disease.
In the study of epigenetics, chromatin immunoprecipitation followed by sequencing (ChIP-seq) has long been the established method for mapping histone modifications genome-wide. Its validation, often performed using ChIP-quantitative polymerase chain reaction (ChIP-qPCR), is a critical step in confirming findings. However, the limitations of ChIP-based methods—including high cellular input requirements, substantial background noise, and complex workflows—have prompted the development of innovative alternatives. Cleavage Under Targets and Release Using Nuclease (CUT&RUN) and Cleavage Under Targets and Tagmentation (CUT&Tag) are two such techniques that are redefining validation strategies in epigenomic research. This guide provides an objective comparison of these methods, detailing their performance relative to ChIP-seq and outlining their practical application in validating histone modification studies.
Understanding the fundamental differences in how these techniques operate is key to selecting the appropriate validation tool.
- ChIP-seq: This traditional method involves cross-linking proteins to DNA, fragmenting the chromatin via sonication, immunoprecipitating the target protein-DNA complexes, and then sequencing the purified DNA. Its major drawbacks include a high background signal, need for millions of cells, and lengthy protocol [97] [98] [99].
- CUT&RUN: This method uses a Protein A/G-Micrococcal Nuclease (pA/G-MNase) fusion protein. In permeabilized cells or nuclei, a primary antibody binds the target. The pA/G-MNase is then recruited and, upon calcium activation, cleaves DNA at the antibody-bound sites, releasing specific fragments for sequencing [100] [98].
- CUT&Tag: This approach utilizes a Protein A-Tn5 transposase (pA-Tn5) pre-loaded with sequencing adapters. Similar to CUT&RUN, it is recruited to an antibody-targeted site. Upon magnesium activation, Tn5 simultaneously cleaves the DNA and inserts the adapters ("tagmentation") in a one-step reaction inside the nucleus [101] [98].
The diagrams below illustrate the core workflows for CUT&RUN and CUT&Tag, highlighting their in situ nature.
CUT&RUN Workflow: A step-wise antibody and enzyme-driven process.
CUT&Tag Workflow: An integrated process combining fragmentation and adapter ligation.
Performance Benchmarking and Comparative Analysis
When validating ChIP-seq data, the performance characteristics of the alternative method are paramount. The following tables summarize key quantitative metrics and qualitative factors for ChIP-seq, CUT&RUN, and CUT&Tag.
Table 1: Quantitative Performance Comparison for Histone Modification Profiling
| Performance Metric | ChIP-seq | CUT&RUN | CUT&Tag |
|---|---|---|---|
| Typical Cell Input | 1-10 million [23] [98] | 100,000 cells (validated down to 5,000-20,000) [100] [98] | 100,000 cells (robust down to 10,000; single-cell possible) [102] [98] |
| Recommended Sequencing Depth | 30+ million reads [102] [97] | 3-5 million reads [100] [97] | 3-10 million reads [102] [97] |
| Background Noise | High (10-30% of reads in IgG) [97] | Very Low (3-8% of reads in IgG) [97] | Extremely Low (<2% of reads in IgG) [97] |
| Recall of ENCODE ChIP-seq Peaks | Benchmark | Information Missing | ~54% (represents strongest peaks) [23] |
| Protocol Duration | 4-7 days [98] | 1-2 days [100] [98] | 1-2 days [98] |
Table 2: Qualitative and Application-Based Comparison
| Characteristic | ChIP-seq | CUT&RUN | CUT&Tag |
|---|---|---|---|
| Best Applications | Mature targets with large historical data; targets requiring strong crosslinking [97] | Robust choice for histone modifications, transcription factors (TFs), and chromatin proteins [102] [97] | Ideal for histone marks; superior for low-input and single-cell studies [102] [103] |
| Signal-to-Noise Ratio | Low to Moderate [97] [104] | High [97] [104] | Very High [97] [104] |
| Workflow Complexity | Very High (crosslinking, sonication, IP) [97] [98] | Moderate (no crosslinking) [97] [98] | Low (simplified, in-situ tagmentation) [97] [98] |
| Key Limitations | High background, low sensitivity, crosslinking artifacts [23] [97] | Less suited for single-cell applications; requires DNA end-repair [101] | Less reliable for some chromatin-associated proteins/TFs; bias toward open chromatin [102] [104] |
A 2025 benchmarking study underscores the reliability of these newer methods, finding that both CUT&RUN and CUT&Tag reliably detect histone modifications, with CUT&Tag standing out for its higher signal-to-noise ratio [104]. Another 2025 study specifically benchmarked CUT&Tag for H3K27ac and H3K27me3 against ENCODE ChIP-seq data, finding that it recovers approximately 54% of known peaks, which represent the strongest and most biologically relevant ENCODE peaks, and shows the same functional enrichments [23].
Experimental Protocols for Validation
Integrating CUT&RUN or CUT&Tag into a validation workflow requires a standardized experimental approach. Below is a generalized protocol applicable to both techniques, with key divergences noted.
General Workflow for CUT&RUN and CUT&Tag
- Cell Preparation: Harvest and permeabilize cells using digitonin. CUT&Tag often requires intact nuclei to minimize mitochondrial DNA contamination [102].
- Antibody Binding: Incubate permeabilized cells with a primary antibody specific to the histone modification of interest (e.g., H3K27ac, H3K27me3). A recommended positive control is an antibody against H3K4me3 or H3K27me3, while a Rabbit IgG serves as a negative control [102] [100].
- Enzyme Binding:
- Targeted Cleavage/Tagmentation:
- CUT&RUN: Initiate cleavage by adding calcium chloride (CaCl₂). The reaction is stopped by adding EDTA, and released DNA fragments are purified from the supernatant [100] [98].
- CUT&Tag: Initiate tagmentation by adding magnesium chloride (MgCl₂). The reaction is stopped, and DNA is released via digestion with Proteinase K [98].
- Library Preparation:
- Sequencing and Analysis: Pooled libraries are sequenced at the recommended depth. Data analysis involves alignment, quality control, and peak calling using tools like SEACR or MACS2 [23].
The Scientist's Toolkit: Essential Research Reagents
Successful execution of CUT&RUN and CUT&Tag assays depends on high-quality, specific reagents.
Table 3: Key Reagent Solutions for CUT&RUN and CUT&Tag
| Reagent | Function | Considerations |
|---|---|---|
| Primary Antibodies | Binds specifically to the target histone modification (e.g., H3K27ac). | Quality and specificity are the most critical factors. Use ChIP-seq-validated antibodies for best results [23] [100]. |
| pA/G-MNase (CUT&RUN) | Enzyme fusion that cleaves DNA at antibody-bound sites. | The core enzyme for CUT&RUN; source from reliable commercial kits or labs [100] [98]. |
| pA-Tn5 (CUT&Tag) | Transposase fusion that cleaves DNA and inserts sequencing adapters. | The core enzyme for CUT&Tag; often pre-loaded with adapters in commercial kits [98]. |
| Magnetic Beads (Concanavalin A-coated) | Immobilizes cells to simplify handling and minimize loss during washes. | Essential for efficient reagent exchanges and low cell loss [100]. |
| Digitonin | A detergent that permeabilizes the nuclear membrane. | Allows antibodies and enzymes to enter the nucleus; concentration must be optimized [100]. |
| Spike-in DNA Controls | Synthetic DNA added to samples before sequencing. | Helps normalize signals between different samples, improving reproducibility [100]. |
CUT&RUN and CUT&Tag represent a significant evolution in epigenomic validation technologies. By offering high-resolution data with minimal background noise and dramatically lower cell input requirements, they address the core limitations of traditional ChIP-seq. While ChIP-seq retains its value for targets requiring strong crosslinking and for comparison with vast existing datasets, CUT&RUN has established itself as a robust and versatile alternative for profiling histone modifications and transcription factors. CUT&Tag, with its ultra-low background and streamlined, single-tube workflow, is particularly powerful for validating histone marks in scarce samples and is the undisputed leader for single-cell epigenomic applications. The choice between them for validation should be guided by the specific biological target, sample availability, and the required balance between robustness and procedural efficiency.
Best Practices for Reporting Validated ChIP-seq Data in Publications
Chromatin Immunoprecipitation followed by sequencing (ChIP-seq) has become the cornerstone methodology for mapping in vivo protein-DNA interactions, particularly for transcription factors and histone modifications. The reliability of conclusions drawn from ChIP-seq data, however, is fundamentally dependent on both experimental rigor and comprehensive reporting that allows for critical evaluation of data quality. Within the context of validating histone modification ChIP-seq with qPCR research, standardized reporting practices are not merely administrative but scientifically essential. They enable the scientific community to assess data validity, facilitate meta-analyses, and ensure proper interpretation of biological mechanisms in drug development and basic research.
The ENCODE and modENCODE consortia have pioneered standardized guidelines for ChIP-seq experiments, establishing frameworks that define quality thresholds and mandatory reporting elements [7]. These guidelines address critical parameters including antibody validation, experimental replication, sequencing depth, and data quality assessment—all of which directly impact the interpretability and reproducibility of published findings. This guide synthesizes these established standards with recent methodological advances to provide researchers with a comprehensive framework for reporting validated ChIP-seq data, with particular emphasis on comparative performance of analysis methodologies and their supporting experimental data.
Computational Method Comparison: Assessing Reproducibility in Multi-Replicate Studies
A critical yet often underreported aspect of ChIP-seq validation involves the computational assessment of reproducibility across biological replicates. Recent systematic evaluation of G-quadruplex (G4) ChIP-seq data reveals considerable heterogeneity in peak calls across replicates, with only a minority of peaks (0.5%-21%) shared across all replicates in typical datasets [105]. This highlights the necessity of robust computational methods to distinguish consistent biological signals from technical artifacts. Three primary algorithms have emerged for this purpose, each with distinct methodological approaches and performance characteristics as detailed in Table 1.
Table 1: Performance Comparison of Computational Methods for ChIP-seq Reproducibility Assessment
| Method | Algorithmic Approach | Strengths | Limitations | Optimal Use Case |
|---|---|---|---|---|
| IDR (Irreproducible Discovery Rate) | Measures consistency of peak rankings between replicate pairs [105] | Standard in ENCODE TF pipeline; provides quantitative reproducibility measure [106] | Designed for pairwise comparisons; performance decreases with inconsistent replicates [105] | Transcription factor ChIP-seq with two high-quality replicates |
| MSPC (Multiple Sample Peak Calling) | Integrates evidence from multiple replicates by combining p-values [105] | Superior recovery of consistent peaks; robust to noisy data; optimal for G4 data [105] | May retain some false positives without proper thresholding | Studies with 3+ replicates or high inter-replicate variability |
| ChIP-R | Employs rank-product test to evaluate reproducibility across numerous replicates [105] | Designed specifically for multiple replicate scenarios | Amplifies impact of peak variability; lower sensitivity in heterogeneous data [105] | Experiments with many replicates (>4) and consistent signal |
Recent evidence demonstrates that MSPC outperforms both IDR and ChIP-R in balancing precision and recall for noisy in vivo data, achieving higher area under the precision-recall curve (AUC) across multiple datasets [105]. This performance advantage stems from MSPC's ability to rescue weak but consistent signals across replicates—a valuable characteristic when studying dynamic chromatin structures like histone modifications. When reporting computational reproducibility assessments, authors should specify the software tools used, parameter settings, and quantitative performance metrics (e.g., precision, recall, F1 scores) relative to appropriate benchmark sets.
Experimental Design and Validation Protocols
Antibody Validation and Immunoprecipitation Specificity
The foundation of any ChIP-seq experiment rests on antibody specificity, yet this critical parameter is frequently under-documented in publications. The ENCODE consortium has established rigorous validation workflows that should be referenced or followed in publications reporting ChIP-seq data [7].
Primary Characterization Methods:
- Immunoblot Analysis: Protein lysates from whole-cell extracts, nuclear extracts, or chromatin preparations are analyzed via Western blot. A primary reactive band should contain at least 50% of the signal observed on the blot, ideally corresponding to the expected size of the target protein [7].
- Immunofluorescence: For antibodies unsuitable for immunoblotting, immunofluorescence provides complementary validation through subcellular localization assessment. Staining should demonstrate the expected pattern (e.g., nuclear for transcription factors) [7].
Secondary Validation for Histone Modifications:
- Mass Spectrometry: Immunoprecipitated material can be analyzed by mass spectrometry to verify enrichment of the specific histone modification without cross-reacting modifications.
- Peptide Competition: Specific histone modification antibodies should show significantly reduced binding in competitive assays with the target peptide versus non-target peptides.
Cell Signaling Technology additionally validates ChIP-seq antibodies by demonstrating sufficient enrichment across a large number of gene loci compared to input controls and performing motif analysis for transcription factors [107]. Publications should explicitly state the validation approach used and provide citation to validation data if performed by the manufacturer.
Sequencing Depth and Replicate Design
Insufficient sequencing depth and inadequate replication represent two common limitations that undermine ChIP-seq data quality. Current standards have evolved from earlier recommendations based on systematic assessments of data quality metrics.
Table 2: Experimental Design Standards for ChIP-seq Studies
| Parameter | ENCODE Transcription Factor Standard | ENCODE Histone Modification Standard | Recent Evidence from G4 Studies |
|---|---|---|---|
| Biological Replicates | Minimum of two biological replicates [106] | Minimum of two biological replicates [7] | Three replicates significantly improve detection accuracy; four replicates sufficient for reproducible outcomes [105] |
| Sequencing Depth | 20 million usable fragments per replicate (optimal) [106] | 20-60 million reads depending on mark breadth [108] | 10 million mapped reads minimum; 15+ million preferable [105] |
| Control Experiments | Input DNA with matching run type and replicate structure [106] | Input DNA or histone H3 pull-down [109] | Not addressed in recent G4 studies |
| Replicate Concordance | IDR rescue and self-consistency ratios <2 [106] | Not specifically defined for broad marks | MSPC-based consistency assessment recommended [105] |
Recent evidence challenges the conventional two-replicate design, demonstrating that three replicates significantly improve detection accuracy compared to two-replicate designs, with four replicates proving sufficient to achieve reproducible outcomes with diminishing returns beyond this number [105]. This has particular relevance for histone modification studies where signal can be more diffuse than transcription factor binding.
Sequencing depth requirements vary significantly by target type. While transcription factors typically require 20 million usable fragments [106], histone modifications with broader domains may require up to 60 million reads for mammalian genomes [108]. Importantly, control samples should be sequenced significantly deeper than ChIP samples in transcription factor experiments to ensure sufficient coverage of background regions [108]. Saturation analysis should be performed to verify adequacy of sequencing depth—where peak calls remain consistent when increasing numbers of reads are analyzed [108].
Quality Control Metrics and Thresholds
Comprehensive reporting of quality control metrics enables readers to assess data reliability independently. The ENCODE consortium has established quantitative thresholds for several key metrics.
Library Complexity Metrics:
- Non-Redundant Fraction (NRF): >0.9 (preferred) [106]
- PCR Bottlenecking Coefficients: PBC1 >0.9, PBC2 >10 (preferred) [106]
Enrichment Metrics:
- FRiP (Fraction of Reads in Peaks): >0.01 for point-source factors like most transcription factors, >0.1-0.3 for broad factors including many histone marks [106]
- Strand Cross-Correlation: NSC (Normalized Strand Coefficient) >1.05, RSC (Relative Strand Correlation) >0.8 [110]
Signal-to-Noise Assessment: Tools like CHANCE provide IP enrichment estimation [108], while strand cross-correlation analysis detects insufficient immunoprecipitation enrichment or poor fragment-size selection [108]. The phantompeakqualtools package calculates cross-correlation metrics including estFragLen (predominant fragment length) and QualityTag based on thresholded RSC values [110].
Visual Workflows for ChIP-seq Experimental and Computational Processes
Comprehensive ChIP-seq Experimental Workflow
ChIP-seq Experimental and Computational Workflow: This diagram illustrates the key stages in a complete ChIP-seq workflow, highlighting critical quality control points that must be reported in publications.
Computational Analysis Pipeline for Transcription Factor ChIP-seq
Transcription Factor ChIP-seq Computational Pipeline: The ENCODE-recommended analysis workflow for transcription factor ChIP-seq data, featuring IDR analysis for assessing replicate concordance.
Essential Research Reagent Solutions for ChIP-seq Studies
Successful ChIP-seq experiments require carefully selected reagents and computational tools at each stage of the experimental and analytical process. Table 3 catalogues key solutions that should be documented in methods sections.
Table 3: Essential Research Reagents and Tools for ChIP-seq Studies
| Category | Specific Solution | Function/Purpose | Performance Considerations |
|---|---|---|---|
| Antibodies | ChIP-seq validated antibodies [107] | Target-specific immunoprecipitation | Must demonstrate specificity via immunoblot (>50% signal in primary band) and appropriate ChIP enrichment [7] |
| Control Samples | Whole Cell Extract (Input) [109] | Control for background signal distribution | Most common control; should match IP sample in processing [106] |
| Histone H3 Pull-down [109] | Alternative control for histone modifications | Accounts for nucleosome positioning; may better mimic background in histone ChIP [109] | |
| Library Prep Kits | TruSeq DNA Sample Prep Kit [109] | Sequencing library construction | Compatibility with sequencing platform and input DNA quantity should be specified |
| Mapping Tools | Bowtie2 [110] | Read alignment to reference genome | Supports gapped alignment; typically >70% uniquely mapped reads expected [108] |
| Peak Callers | MACS2 [110] | Identification of enriched regions | Standard for transcription factors; handles control normalization [106] |
| Reproducibility Assessment | IDR [106] | Measure replicate consistency | ENCODE standard for TFs; requires pairwise comparisons [105] |
| MSPC [105] | Multiple replicate consistency | Superior for noisy data; integrates evidence across replicates [105] | |
| Quality Metrics | phantompeakqualtools [110] | Strand cross-correlation analysis | Calculates NSC/RSC scores; identifies predominant fragment length [108] |
| preseq [108] | Library complexity estimation | Predicts complexity curve; identifies over-amplified libraries [108] |
Comprehensive reporting of validated ChIP-seq data requires meticulous documentation across multiple domains: experimental design, reagent validation, computational analysis, and quality metrics. The practices outlined here, drawn from consortia standards and recent methodological research, provide a framework for producing publications that enable proper evaluation of data quality and biological conclusions. As the field evolves toward more complex analyses of chromatin dynamics, standardized reporting becomes increasingly critical for building cumulative knowledge—particularly in translational research contexts where drug development decisions may rely on these fundamental data. By adopting these best practices, researchers contribute to enhancing reproducibility and reliability in epigenomics research, ultimately accelerating scientific discovery and therapeutic development.
Conclusion
The synergistic use of ChIP-seq and ChIP-qPCR establishes a robust pipeline for validating epigenetic discoveries, with qPCR serving as an essential, accessible method to confirm the reliability of genome-wide data. Mastering the technical nuances—from antibody selection to data interpretation—is fundamental for generating reproducible results that can withstand scientific scrutiny. As epigenetic research increasingly informs our understanding of disease mechanisms and drug discovery, rigorous validation practices will be paramount. Future directions will likely involve the integration of emerging techniques like CUT&Tag for higher-resolution analyses and the development of standardized, automated validation workflows to accelerate the translation of epigenetic insights into clinical applications.
References
- 1. Chromatin Immunoprecipitation (ChIP) of Histone ... [https://www.jove.com/t/57080/chromatin-immunoprecipitation-chip-histone-modifications-from]
- 2. Genome‑wide analysis of histone modifications by ChIP ... [https://www.spandidos-publications.com/10.3892/or.2015.3824]
- 3. A native chromatin immunoprecipitation (ChIP) protocol for ... [https://plantmethods.biomedcentral.com/articles/10.1186/s13007-020-0556-z]
- 4. Methods for ChIP-seq analysis: A practical workflow and ... [https://www.sciencedirect.com/science/article/pii/S1046202320300591]
- 5. Chromatin immunoprecipitation: optimization, quantitative ... [https://pmc.ncbi.nlm.nih.gov/articles/PMC2077865/]
- 6. ChIP-Seq: Technical Considerations for Obtaining High ... [https://pmc.ncbi.nlm.nih.gov/articles/PMC3541830/]
- 7. ChIP-seq guidelines and practices of the ENCODE and ... [https://pmc.ncbi.nlm.nih.gov/articles/PMC3431496/]
- 8. ChIP-qPCR Data Analysis [https://www.sigmaaldrich.com/US/en/technical-documents/protocol/genomics/qpcr/chip-qpcr-data-analysis?srsltid=AfmBOorAXY1pefVX2aaRDN81I8hMlLsJS_T8wDZtHw4M9yoCCzThJ2h_]
- 9. Introduction, Workflow, and Differences from Other ChIP- ... [https://www.cd-genomics.com/resource-chip-on-chip-introduction-workflow-differences.html]
- 10. histoneHMM: Differential analysis of histone modifications with ... [https://bmcbioinformatics.biomedcentral.com/articles/10.1186/s12859-015-0491-6]
- 11. Computational methodology for ChIP-seq analysis - PMC [https://pmc.ncbi.nlm.nih.gov/articles/PMC4346130/]
- 12. Using ChIP-Seq Technology to Generate High-Resolution ... [https://pmc.ncbi.nlm.nih.gov/articles/PMC4151291/]
- 13. ChIP-seq Ab Performance Comparison [https://www.cellsignal.com/applications/chip-and-chip-seq/chip-seq-kit-performance-comparison?srsltid=AfmBOoqOcpqws6Srk3tfXp2kX1tU-ve5GTUhvzIX2gP_PAOwt_aVOrLL]
- 14. Histone ChIP-seq Data Standards and Processing Pipeline [https://www.encodeproject.org/chip-seq/histone/]
- 15. Deciphering histone mark-specific fine-scale chromatin ... [https://www.nature.com/articles/s41467-025-64350-w]
- 16. Comprehensive assessment of differential ChIP-seq tools ... [https://genomebiology.biomedcentral.com/articles/10.1186/s13059-022-02686-y]
- 17. The Wild West of Spike-in Normalization - PMC [https://pmc.ncbi.nlm.nih.gov/articles/PMC12266361/]
- 18. a public repository of verified qPCR primers for chromatin ... [https://pmc.ncbi.nlm.nih.gov/articles/PMC6323922/]
- 19. ChIP-qPCR Service | Reliable Protein-DNA Validation [https://www.cd-genomics.com/epigenetics/chip-qpcr-service.html]
- 20. Chromatin Immunoprecipitation (ChIP) of Histone ... [https://pmc.ncbi.nlm.nih.gov/articles/PMC5908393/]
- 21. ChIP Analysis | Thermo Fisher Scientific - US [https://www.thermofisher.com/us/en/home/life-science/epigenetics-noncoding-rna-research/chromatin-remodeling/chromatin-immunoprecipitation-chip/chip-analysis.html]
- 22. ChIP-qPCR Data Analysis [https://www.sigmaaldrich.com/US/en/technical-documents/protocol/genomics/qpcr/chip-qpcr-data-analysis?srsltid=AfmBOopo6b85utyiB_kr0D9i31osKTHGDmPv8iKp30oOpI_4zob7hlYP]
- 23. CUT&Tag recovers up to half of ENCODE ChIP-seq ... [https://www.nature.com/articles/s41467-025-58137-2]
- 24. A modified CUT&RUN-seq technique for qPCR analysis ... [https://pmc.ncbi.nlm.nih.gov/articles/PMC9344018/]
- 25. A Step-by-Step Guide to Successful Chromatin ... [https://www.thermofisher.com/us/en/home/life-science/antibodies/antibodies-learning-center/antibodies-resource-library/antibody-application-notes/step-by-step-guide-successful-chip-assays.html]
- 26. ChIP–qPCR Validated Antibodies [https://www.cellsignal.com/applications/chip-and-chip-seq/chip-qpcr-validated-antibodies?srsltid=AfmBOopIR5JkFlMtE08Nwt0a6dV6VZi_V8CqEbDyDhfIL5LmBhHd_9HM]
- 27. Chromatin Immunoprecipitation Workflow Solutions for ... [https://www.cellsignal.com/applications/chip-and-chip-seq/chip-workflow-solutions?srsltid=AfmBOoo7OyysDafKq6MxEHg0oXIgxw7EjYFs3DmnJWWs7gXhetBbSiIk]
- 28. Comparison of DNA Quantification Methods for Next ... [https://www.nature.com/articles/srep24067]
- 29. ChIP-qPCR, ChIP-seq, CUT&RUN, CUT&Tag, and More [https://www.bosterbio.com/blog/post/a-comprehensive-guide-to-epigenomic-profiling-chip-qpcr-chip-seq-cut-and-run-cut-and-tag-and-more?srsltid=AfmBOorgVuzqBwVL14WpyFwdaR3VBAZ6zl4fK1sb4KWSBdLF-JqSpJ24]
- 30. ChIP-seq Validated Antibodies [https://www.cellsignal.com/applications/chip-and-chip-seq/chip-seq-antibodies?srsltid=AfmBOoq7P6n7rCW846CacjT6w682WO866bW4TZJkqCFtj6r10NcQ35D6]
- 31. ChIP-seq Ab Performance Comparison [https://www.cellsignal.com/applications/chip-and-chip-seq/chip-seq-kit-performance-comparison?srsltid=AfmBOooZyqwZlCctXNKdj6EH79Hd3BUa2LqqJ2S7_r11OQOwfxi2Efs9]
- 32. Antibody performance in ChIP-sequencing assays [https://pmc.ncbi.nlm.nih.gov/articles/PMC4893979/]
- 33. Titration-based normalization of antibody amount improves ... [https://bmcgenomics.biomedcentral.com/articles/10.1186/s12864-023-09253-0]
- 34. HMCan-diff: a method to detect changes in histone ... [https://pmc.ncbi.nlm.nih.gov/articles/PMC5416852/]
- 35. Refined ChIP‐Seq Protocol for High‐Quality Chromatin ... [https://pmc.ncbi.nlm.nih.gov/articles/PMC12628287/]
- 36. Protocol for double-crosslinking ChIP-seq to improve data ... [https://www.sciencedirect.com/science/article/pii/S2666166725005775]
- 37. ChIP-seq Validated Antibodies [https://www.cellsignal.com/applications/chip-and-chip-seq/chip-seq-antibodies?srsltid=AfmBOooG6QzBSz2hUkKIhJyB4tuOeyHTDLeE4n81C09R1Pndggpi7keo]
- 38. ChIP-qPCR, ChIP-seq, CUT&RUN, CUT&Tag, and More [https://www.bosterbio.com/blog/post/a-comprehensive-guide-to-epigenomic-profiling-chip-qpcr-chip-seq-cut-and-run-cut-and-tag-and-more?srsltid=AfmBOorCTISrTe9Dh3nUpp0_U-a9DL_ke39TPyMGAOCoSNeKswj5r3ip]
- 39. ChIP-qPCR, ChIP-seq, CUT&RUN, CUT&Tag, and More [https://www.bosterbio.com/blog/post/a-comprehensive-guide-to-epigenomic-profiling-chip-qpcr-chip-seq-cut-and-run-cut-and-tag-and-more?srsltid=AfmBOoqLEsQUyNe1QaYY_JDgrYWFJZfa1I4AusIV7yPRxYq5xV24Qfiw]
- 40. Protocol for development and use of spike-in control ... [https://pmc.ncbi.nlm.nih.gov/articles/PMC12337170/]
- 41. Calibrating ChIP-Seq with Nucleosomal Internal Standards ... [https://www.sciencedirect.com/science/article/pii/S1097276515003044]
- 42. Immunoprecipitation Kit Market Report 2025 (Global Edition) [https://www.cognitivemarketresearch.com/immunoprecipitation-kit-market-report]
- 43. Immunoprecipitation Market Size, Trends, Growth Report ... [https://www.marketresearchfuture.com/reports/immunoprecipitation-market-7816]
- 44. Global Protein Immunoprecipitation Kits Market By Type, ... [https://www.marketsizeandtrends.com/report/protein-immunoprecipitation-kits-market/]
- 45. Immunoprecipitation Market - Forecast(2025 - 2031) [https://www.industryarc.com/PressRelease/4088/Immunoprecipitation-Market]
- 46. Rules and Tips for PCR & qPCR Primer Design | IDT [https://www.idtdna.com/page/support-and-education/decoded-plus/how-to-design-primers-and-probes-for-pcr-and-qpcr/]
- 47. A Definitive, Practical Guide to Designing Primers for PCR ... [https://medium.com/@zweyehtut/a-definitive-practical-guide-to-designing-primers-for-pcr-qpcr-88d7bf6e2d93]
- 48. In Silico Design of Quantitative Polymerase Chain ... [https://pmc.ncbi.nlm.nih.gov/articles/PMC12025841/]
- 49. qPCR primer design revisited - PMC - PubMed Central - NIH [https://pmc.ncbi.nlm.nih.gov/articles/PMC5702850/]
- 50. Four tips for PCR amplification of GC-rich sequences [https://www.neb.com/en-us/nebinspired-blog/four-tips-for-pcr-amplification-of-gc-rich-sequences?srsltid=AfmBOoocsFL8C3v0s12Cl2v__JjTWAe183BqDhoyf14gKPH5o7CdtUmv]
- 51. A novel method for the normalization of ChIP-qPCR data [https://pmc.ncbi.nlm.nih.gov/articles/PMC8563474/]
- 52. Dots in Boxes: Visualization of qPCR Data [https://www.neb.com/en-us/tools-and-resources/video-library/dots-in-boxes-visualization-of-qpcr-data?srsltid=AfmBOoogZzdm2DX52-4G-ZjvwVp8t2ZE_EUX_eu7MH9vBBu1rbn8S5oQ]
- 53. Guidelines to Analyze ChIP-Seq Data: Journey Through ... [https://pubmed.ncbi.nlm.nih.gov/39745614/]
- 54. How To Analyze ChIP-seq Data For Absolute Beginners Part 4 [https://ngs101.com/how-to-analyze-chip-seq-data-for-absolute-beginners-part-4-from-fastq-to-peaks-with-macs2/]
- 55. Quantification of histone modification ChIP-seq enrichment for ... [https://pmc.ncbi.nlm.nih.gov/articles/PMC3170335/]
- 56. ChIP-chip versus ChIP-seq: Lessons for experimental design ... [https://bmcgenomics.biomedcentral.com/articles/10.1186/1471-2164-12-134]
- 57. PeakSeq: Systematic Scoring of ChIP-Seq Experiments ... [https://pmc.ncbi.nlm.nih.gov/articles/PMC2924752/]
- 58. How do I know if the antibody will cross-react? [https://www.ptglab.com/news/blog/how-do-i-know-if-the-antibody-will-cross-react/?srsltid=AfmBOoqHWKxEf180xJFcog0Rg5vyc3HD1C5kRLxaF5iG-LTXtqvRqK3Z]
- 59. Lot-to-Lot Variance in Immunoassays—Causes, ... [https://pmc.ncbi.nlm.nih.gov/articles/PMC10252387/]
- 60. Antibody Variability | PhosphoSolutions [https://www.antibodiesinc.com/blogs/news/antibody-variability?srsltid=AfmBOooYJIG4KNeq4BJzNHwJKVr99Dkoz_jnuSFoZd4ETPfRITemPhqL]
- 61. 9.3 Factors that affect ChIP-seq experiment and analysis quality [https://compgenomr.github.io/book/factors-that-affect-chip-seq-experiment-and-analysis-quality.html]
- 62. The challenges with the validation of research antibodies [https://pmc.ncbi.nlm.nih.gov/articles/PMC5333605/]
- 63. Chromatin immunoprecipitation: Techniques, advances, ... [https://www.abcam.com/en-us/knowledge-center/epigenetics/chromatin-immunoprecipitation-techniques-advances-and-insights]
- 64. Chromatin Shearing Workflow [https://www.covaris.com/chromatin/]
- 65. Benchmark of chromatin–protein interaction methods in ... [https://www.frontiersin.org/journals/cell-and-developmental-biology/articles/10.3389/fcell.2025.1572405/full]
- 66. Optimization of DNA Fragmentation Techniques to ... [https://www.mdpi.com/2075-4418/15/18/2294]
- 67. Development of primer sets that can verify the enrichment of histone ... [https://www.jstage.jst.go.jp/article/ggs/91/1/91_15-00058/_html/-char/en]
- 68. Overview of Chromatin Immunoprecipitation ( ChIP ) [https://www.cellsignal.com/applications/chip-and-chip-seq/regulation-expression-in-cell-and-tissue]
- 69. Introduction to Quantitative PCR (qPCR) Gene Expression ... [https://www.thermofisher.com/us/en/home/life-science/pcr/real-time-pcr/real-time-pcr-learning-center/gene-expression-analysis-real-time-pcr-information/introduction-gene-expression.html]
- 70. Evaluation of normalisation strategies for qPCR data ... [https://www.nature.com/articles/s41598-025-06657-8]
- 71. PCR/qPCR Data Analysis [https://www.sigmaaldrich.com/US/en/technical-documents/technical-article/genomics/qpcr/data-analysis?srsltid=AfmBOoocMqu2JhrbNFKLn__M0ABy_CqILQqcbpgSnxoAb93UoJjouCYe]
- 72. Consensus guidelines for the validation of qRT-PCR ... [https://pmc.ncbi.nlm.nih.gov/articles/PMC8792405/]
- 73. ChIP-qPCR, ChIP-seq, CUT&RUN, CUT&Tag, and More [https://www.bosterbio.com/blog/post/a-comprehensive-guide-to-epigenomic-profiling-chip-qpcr-chip-seq-cut-and-run-cut-and-tag-and-more?srsltid=AfmBOooaElewM-tcO9RuSRJ-a-iejycLbPWfyMnqrgbtelv0KT892cf9]
- 74. Normalization, bias correction, and peak calling for ChIP-seq [https://pmc.ncbi.nlm.nih.gov/articles/PMC3342857/]
- 75. Highly quantitative measurement of differential protein ... [https://www.sciencedirect.com/science/article/pii/S2667237525000888]
- 76. ErcanLab - Quantifying ChIP-seq [https://sites.google.com/site/ercanlab/protocols/quantifying-chip-seq]
- 77. How to Use Positive & Negative Controls for Better ChIP Results [https://blog.cellsignal.com/4-steps-to-better-chip-results-step-1-take-control]
- 78. An Assessment of Fixed and Native Chromatin Preparation Methods to... [https://biologicalproceduresonline.biomedcentral.com/articles/10.1186/s12575-017-0059-0]
- 79. ChIP-qPCR, ChIP-seq, CUT&RUN, CUT&Tag, and More [https://www.bosterbio.com/blog/post/a-comprehensive-guide-to-epigenomic-profiling-chip-qpcr-chip-seq-cut-and-run-cut-and-tag-and-more?srsltid=AfmBOoqw-5xeCFFTsmZi6P8hoydBDzIKUhJoBMYRe5G-8Nim4Y9eLExw]
- 80. ChIP-seq vs. CUT&RUN vs. CUT&Tag: Which should you ... [https://www.epicypher.com/resources/blog/chip-seq-vs-cutrun-vs-cuttag-which-should-you-use/]
- 81. ChIP-seq and Beyond: new and improved methodologies ... [https://pmc.ncbi.nlm.nih.gov/articles/PMC3591838/]
- 82. Quantitative PCR validation for research scientists: Part 1 of 2 [https://virologyresearchservices.com/2023/01/13/quantitative-pcr-validation-part-1-of-2/]
- 83. ChIP-qPCR, ChIP-seq, CUT&RUN, CUT&Tag, and More [https://www.bosterbio.com/blog/post/a-comprehensive-guide-to-epigenomic-profiling-chip-qpcr-chip-seq-cut-and-run-cut-and-tag-and-more?srsltid=AfmBOoq85-27maGtxFpkdW1mo3rMsiEkd5DIyo-MVBbVhLkhSp8utyo-]
- 84. a robust model for quantitative comparison of ChIP-Seq data ... [https://pmc.ncbi.nlm.nih.gov/articles/PMC3439967/]
- 85. A novel statistical method for quantitative comparison of ... [https://pmc.ncbi.nlm.nih.gov/articles/PMC4542775/]
- 86. Picking ChIP-seq peak detectors for analyzing chromatin ... [https://pmc.ncbi.nlm.nih.gov/articles/PMC3351193/]
- 87. Histone modifications [https://www.abcam.com/en-us/technical-resources/guides/epigenetics-guide/histone-modifications]
- 88. Optimized detection of transcription factor-binding sites in ChIP - seq ... [https://pmc.ncbi.nlm.nih.gov/articles/PMC3245948/]
- 89. An Overview of Histone Modification Detection [https://www.cusabio.com/histones/histone-modification-detection.html?srsltid=AfmBOorGBrm5xXBiP2Ps8iBdZ_Qo2Ll3VPruU1SSp6M-nUyQcQU-QO0g]
- 90. ChIP-qPCR, ChIP-seq, CUT&RUN, CUT&Tag, and More [https://www.bosterbio.com/blog/post/a-comprehensive-guide-to-epigenomic-profiling-chip-qpcr-chip-seq-cut-and-run-cut-and-tag-and-more?srsltid=AfmBOoqCiL1BqwHgscL8EVGPPc4Xpj1VAysQ0ZWOsJkRhcGzNO312sjE]
- 91. DeepHistone: a deep learning approach to predicting histone ... [https://bmcgenomics.biomedcentral.com/articles/10.1186/s12864-019-5489-4]
- 92. ChIP-qPCR, ChIP-seq, CUT&RUN, CUT&Tag, and More [https://www.bosterbio.com/blog/post/a-comprehensive-guide-to-epigenomic-profiling-chip-qpcr-chip-seq-cut-and-run-cut-and-tag-and-more?srsltid=AfmBOopqeN7HPI587m6UMas-U9k5dIs4Jd72F1H9efGpwo_kAq36iYQq]
- 93. Introduction of ChIP-Seq: Principle, Process,Advantages [https://www.cd-genomics.com/epigenetics/resource-introduction-of-chip-seq.html]
- 94. ChIP-Seq: advantages and challenges of a maturing ... [https://pmc.ncbi.nlm.nih.gov/articles/PMC3191340/]
- 95. ChIP-seq Advantages and Limitations [https://www.news-medical.net/life-sciences/ChIP-seq-Advantages-and-Limitations.aspx]
- 96. ChIP–qPCR Validated Antibodies [https://www.cellsignal.com/applications/chip-and-chip-seq/chip-qpcr-validated-antibodies?srsltid=AfmBOoq5GVAL_qXcheZtf26h9llT9-2YKLlNRSGukfy_2t0fWq6P51rV]
- 97. CUT&RUN vs. CUT&Tag vs. ChIP-seq [https://www.cd-genomics.com/epigenetics/resource-cut-run-cut-tag-chip-seq-comparison.html]
- 98. ChIP-qPCR, ChIP-seq, CUT&RUN, CUT&Tag, and More [https://www.bosterbio.com/blog/post/a-comprehensive-guide-to-epigenomic-profiling-chip-qpcr-chip-seq-cut-and-run-cut-and-tag-and-more?srsltid=AfmBOop0mdmPVX3IQOFvJtBsUcJ4zBP76I6z9rUBKwfuntmIl7eh1dgh]
- 99. How CUT&RUN and CUT&Tag Are Changing the Game [https://www.epigentek.com/catalog/enhancing-resolution-and-reducing-noise-how-cutrun-and-cuttag-are-changing-the-game-n-70.html?srsltid=AfmBOoo33kkk0ilPaTmTv3MScmeP1MlRMf79wPcOiqqKharhxvXjG1f8]
- 100. CUT&RUN Overview [https://www.cellsignal.com/applications/cut-and-run-overview?srsltid=AfmBOoqVdgGHzOdoTaD6LOJgSJHr6PN3bKztVU4idDT7N5K-9rgcgVQI]
- 101. Chapter 19 CUT&RUN and CUT&Tag [https://hutchdatascience.org/Choosing_Genomics_Tools/cutrun-and-cuttag.html]
- 102. CUT&RUN vs. CUT&Tag : Which One is Right for You? [https://www.epicypher.com/resources/blog/cutrun-vs-cuttag-which-one-is-right-for-you/]
- 103. Single-cell CUT&Tag profiles histone modifications and ... [https://pmc.ncbi.nlm.nih.gov/articles/PMC7611252/]
- 104. Benchmark of chromatin–protein interaction methods in ... [https://pmc.ncbi.nlm.nih.gov/articles/PMC12106302/]
- 105. Evaluating Reproducibility and Best Practices for Replicate ... [https://pmc.ncbi.nlm.nih.gov/articles/PMC12524710/]
- 106. Transcription Factor ChIP-seq Data Standards and ... [https://www.encodeproject.org/chip-seq/transcription_factor/]
- 107. - ChIP Antibodies | Cell Signaling Technology seq Validated [https://www.cellsignal.com/applications/chip-and-chip-seq/chip-seq-antibodies]
- 108. Practical Guidelines for the Comprehensive Analysis of ChIP ... [https://journals.plos.org/ploscompbiol/article?id=10.1371/journal.pcbi.1003326]
- 109. A comparison of control samples for ChIP-seq of histone ... [https://pmc.ncbi.nlm.nih.gov/articles/PMC4174756/]
- 110. ChIP-seq data processing tutorial [https://nbis-workshop-epigenomics.readthedocs.io/en/latest/content/tutorials/chipseqProc/lab-chipseq-processing.html]